distributed by - dtic. · pdf filethe role of passive film growth kinetics and properties in...
TRANSCRIPT
AD-AO19 648
THE ROLE OF PASSIVE FILM GROWTH KINETICS AND PROPERTIES
IN STRESS CORROSION AND CREVICE CORROSION SUSCEPTIBILITY
J. Kruger, et al
National Bureau of Standards
Prepared for:
Office of Naval Research
October 1975
DISTRIBUTED BY:
Namal TEchnical IF SOMEU. S. DEPARTMnENT OF C;OMMuERCE

027 /07'~
NBSIR 75-916
SThe Role of Passive Film Growth~OKinetics and Properties in
Stress Corrosion and CrevicecCorrossion Susceptibility
J. Kruger, J. R. Ambrose, and T. Kodama
Corrosion and Electrodeposition SectionMetallurgy DivisionInstitute for Materials ResearchNational Bureau of Standards
October 1975
Technical Summary Report Number 6
Prepared for t90u.Ab
NATIONAL TECHNICALOffice of Naval Research INFORMATION SERVICEDepartment of the Navy US"''fl V !A 2o21
Arlington, Va. 22217
NSS41|4A torY. "-s
U.S. OPT. OF COMM. i 1Iw tltL A'IhN OR RF§WI sW'I NO. 2. (..w's A.'t 'h5i4if 3. R'cipi.'%N Ac %..,s, N..SBLIOGRAPHIC DATA 7 1..SHEET NBSIR 75-916
4. TITLE AND SIITITI.E . Piuhli-atit, I)a.
The Role of Passive Film Growth Kinetics and Properties in Stress October 1975Corrosion and Crevice Corrosion Susceptibility O Perffrmig (rgafti5i,,, (."k.
7. AUTHOR(S) . Performing Organ. Report No.J. Kruger, J. R. Ambrose, and T. Kodanm9. PERFORMING ORGANIZATION NAME ANI) ADDRESS I1. Projst/Tatk/Wk Unit No.
NATIONAL BUREAU OF STANDARDS 312O448DEPARTMENT OF COMMERCE 11. CoMfact/Grat No.
WASHINGTON. D.C. 20234 M 1 mRO36-082
12. Spoasoring Organizstion N~me and Complete Address (Street, City, State. ZIP) 13. Type of Report & Period
Office of Naval Research Covered InterimDepartment of the Navy 9/74-10/75Arlington, VA 22217 14. Sponsoring Agency Code
I. SUPPI.EMENTARY NOTES
16. ABSTRACT (A 200.word or less factual smagary of moat asigiflcant information. If document includes a sinilficanthibllodraphy or literature survey. mention it here.)
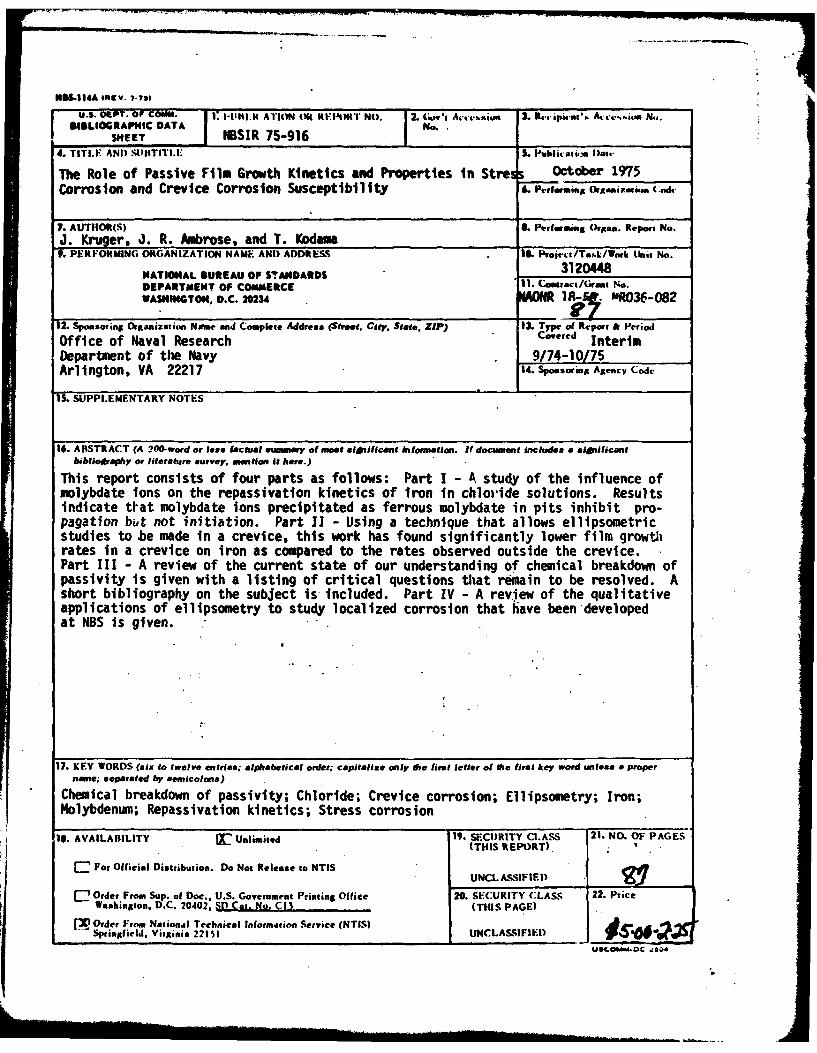
This report consists of four parts as follows: Part I - A study of the influence ofmolybdate ions on the repassivation kinetics of iron in chloride solutions. Resultsindicate tiat molybdate ions precipitated as ferrous molybdate in pits inhibit pro-pagation bit not initiation. Part 11 - Using a technique that allows ellipsometricstudies to be made in a crevice, this work has found significantly lower film growthrates in a crevice on iron as compared to the rates observed outside the crevice.Part III - A review of the current state of our understanding of chemical breakdown ofpassivity is given with a listing of critical questions that remain to be resolved. Ashort bibliography on the subject is included. Part IV - A review of the qualitativeapplications of ellipsometry to study localized corrosion that have been developedat NBS is given.
17. KEY WORDS (six go twelve entries; alphabetical order; capitalize only Alto first letter of fle first key word unless a propername; *eparated by semicolons)
Chemical breakdown of passivity; Chloride; Crevice corrosion; Ellipsometry; Iron;Molybdenum; Repassivatlon kinetics; Stress corrosion
11. AVAILABILITY Unlimited 19. SECURITY CI.ASS 21. NO. OF PAGES(THIS REPORT)
C For Official Distribuion. Do Not Release to NTISUNCL ASSIF IEI)
C7 Order From Sup. of Doe.. U.S. Goerenment Printing Office 20. SECURITY C:LASS 22. PriceWashington, D.C. 20402, SD Cat. No. C13 (THIS PAGE)Order Fw National Technical Information Servie (NTIS)Springfield, Virginia 22151 UNCI.ASSIFIEI)
UKtO~MM-DC ,l O4

NBSIR 75-916
THE ROLE OF PASSIVE FILM GROWTHKINETICS AND PROPERTIES INSTRESS CORROSION AND CREVICECORROSION SUSCEPTIBIUTY
q
J. Kruger, J. R. Ambrose, and T. Kodama
Corrosion and Electrodeposition SectionMetallurgy DivisionInstitute for Materials ResearchNational Bureau of Standards
October 1975
Technical Summary Report Number 6
DISTRIBUTION OF THIS DOCUMENT IS UNLIMITED
Prepared forOffice of Naval ResearchDepartment of the NavyArlington, Va. 22217 7
/
/
/
JmN A. Bekl, Ill. Undw SwnayDr. 111"y Alu-Juhws. AsnluaM ScWaty fr Salome and T0e@*M/WY
NATIONAL UMAU OF STANDAWS. Ernest Ambler. Acting Dimwt
PART I
(To be submitted to J. Electrochemical Society)
Effect of riolybdate Ion on the Repassivation Kineticsof Iron in Solutions :ontaining Chloride Ions
T. Kodamaand J. R. AmbroseInstitute for Materials ResearchNational Bureau of Standards
Washington, 0. C. 20234
It has been well established that molybdenum additions improve theresistance of stainless steels to localized corrosion (especially pitting) inchloride environments (1-7). Several investigations, however, have givenseemingly contradictory results concerning the role of molybdenum on thisenhanced corrosion resistance.
Rhodinusing microchemical analysis, found that molybdenum content wasincreased in the passive film on 316 stainless steel immersed in a 5% HNO3 -0.5% K2Cr207 solution (8).
An Auger electron spectrosconic (AES) study by Barnes et al showedsurface segregation of molybdenum in 316 and 304 stainless steels (9). Theyused mill-finished materials without passivation pretreatment.
Another AES study by Lumsden et al showed that molybdenum was depletedin the passive film of 316 stainless steel exposed potentlostatically to a pH7 solution at 442 mV NHE (10). They found relative chromium enrichment in thepassive film of the molybdenum-bearing steels. The depletion in molybdenumseems to be reasonable when we compare Lumsden's anodization conditions withthe polarization data of pure molybdenum (11-14); molybdenum is readilysoluble in its hexavalent ion state at the potential and pH that they used forthe anodization.
In all likelihood, then, the presence of molybdenum oxide in the passivefilm should not be a prerequisite for the enhanced resistance to pitting. Infact, it may be that the beneficial effect of alloyed molybdenum on localizedcorrosion resistance may be related to the fact that soluble and insolublemolybdates are known to act as corrosion inhibitors for steels (15-19).
The work described here is aimed at examining whether molybdenum exertsits beneficial effect on diminishing usceptibility to localized corrosion viaits dissolved, hexavalent state (MoO ). 4oreover, since recent work fromthis laboratory found that molybdenug in ferrous alloys enhanced the rate ofrepassivation (20) and rate of repassivation has been proposed as having animportant bearing on localized corrosion, we have studied the effect ofdissolved molybdate ion on repassivation kinetics of iron. Anodic currentchanges following oxide removal by abrasion were measured using a devicedeveloped for tribo-ellipsometry.
*Guest worker at NbS Nov. 1974 to Oct. 1975 from National Research Institute
for Metals, Tokyo, Japan.
Ii
EXPERIMENTAL
To measure the anodic current transient following oxide film removal byabrasion, a device which was extensively applied in tribo-ellipsometricmeasurement was used. The surface of a potentiostatically controlled ironspecimen was abraded with SiC paper mounted on a rotating wheel. An abruptcurrent increase caused by the retraction of the abrasion wheel from the metalsurface triggered an oscilloscope. Details of the device have been describedin previous papers (21-22). Anodic currents during longer time intervals (>500ins) were measured with a strip chart recorder.
Specimens used were prepared from a Ferrovac iron rod and mounted inlucite. Specimens were mechanically polished with SiC papers, followed zyrotary polishing with 6u diamond paste.
A borate buffer solution (pil 8.4) was used as a supporting electrolyte.The solution containing 14.30 g Na B 0 1 10 H 0 and 9.26 g H3BO per literwas prepared from ACS grade chemic(lf ind distlled water (7 x 16-1 ohm-1
an-I).
For measuring the effect of chloride or molybdate ion, small amounts ofNaCl or Na214oO 4 were added to the supporting electrolyte. No attempt atdeaeration was made in these experiments.
RESULTS AND DISCUSSION
Anodic current transients, recorded by oscilloscope and strip chartrecorder were potted on a log-log scale, and are shown in Figs. 1, 3, and 4.Although in an experiment the oscilloscope was triggered by the abrupt currentincrease accompanied by the retraction of the abrasion wheel, there was anuncertainty of time interval between the trigger pulse and the starting offilm growth. Conventionally, we used the time of the current maximum appear-ing in tWe oscilloscope picture as the start of film-growth initiation (t=O).The current maximum was not reproducible since it was dependent on theeffective metal surface abraded and the roughness of an abrasive paper.Attention was, therefore, placed only on the relative change of anodiccurrent.
a) Repassivation in the absence of chloride
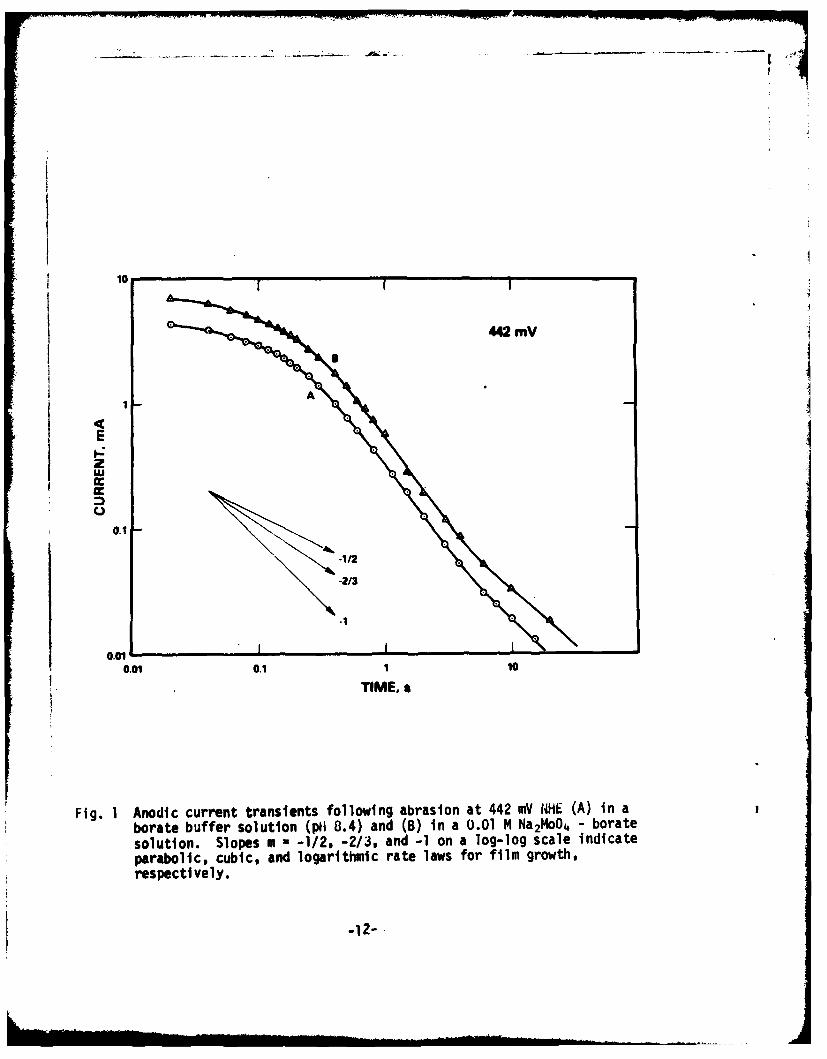
Fig. 1 shows the anodic current transients of iron in a plain boratebuffer solution (curve A) and in a borate buffer solution with 0.01 M NailoOAadded (curve B), both at 442 mV NHE. Since the buffer solution was used assupporting electrolyte, the pH shift resulting from Ila2 MoO4 addition was veryslight; pH for borate buffer - 0.01 ft Na2 moO4 solution was 8.43, while theborate solution alone showed pH 8.40.
Both curves A and B represent typical current decays accompanyingvirtually complete or "perfect" passivation. Assuming the anodic currentefficiency for film formation alone to be unity, we obtain the followingrelationship between the film-growth rate law and the slope on the log i-log tplot (m):
-2-
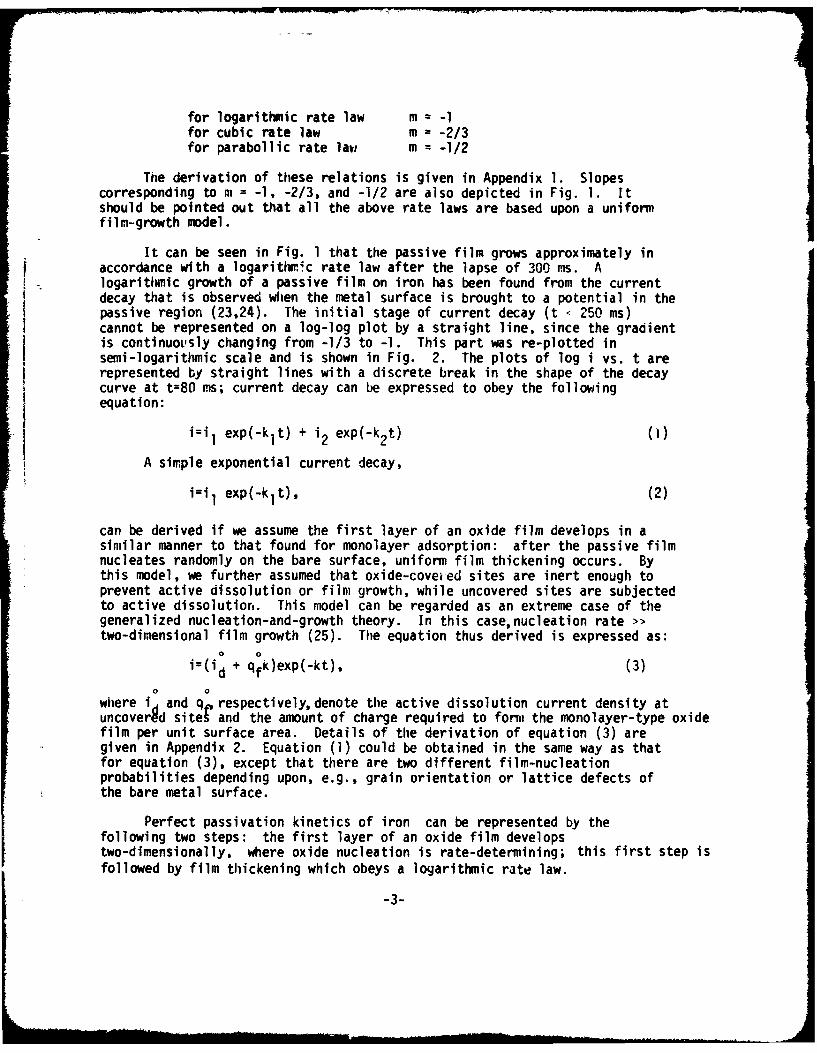
for logarithmic rate law M = -lfor cubic rate law m = -2/3for parabollic rate law m = -1/2
The derivation of these relations is given in Appendix 1. Slopescorresponding to m = -1, -2/3, and -1/2 are also depicted in Fig. 1. Itshould be pointed out that all the above rate laws are based upon a uniformfilm-growth model.
It can be seen in Fig. 1 that the passive film grows approximately inaccordance with a logarithmic rate law after the lapse of 300 ms. Alogarithmic growth of a passive film on iron has been found from the currentdecay that is observed when the metal surface is brought to a potential in thepassive region (23,24). The initial stage of current decay (t - 250 ms)cannot be represented on a log-log plot by a straight line, since the gradientis continuously changing from -1/3 to -1. This part was re-plotted insemi-logarithmic scale and is shown in Fig. 2. The plots of log i vs. t arerepresented by straight lines with a discrete break in the shape of the decaycurve at t=80 ms; current decay can be expressed to obey the followingequation:
i=iI exp(-k 1 t) + i2 exp(-k 2t) (i)
A simple exponential current decay,
i=i1 exp(-kIt), (2)
can be derived if we assume the first layer of an oxide film develops in asimilar manner to that found for monolayer adsorption: after the passive filmnucleates randomly on the bare surface, uniform film thickening occurs. Bythis model, we further assumed that oxide-coveied sites are inert enough toprevent active dissolution or film growth, while uncovered sites are subjectedto active dissolution. This model can be regarded as an extreme case of thegeneralized nucleation-and-growth theory. In this case,nucleation rate >>two-dimensional film growth (25). The equation thus derived is expressed as:
i=(id + qfk)exp(-kt), (3)
0 0
where id and q, respectively,denote the active dissolution current density atuncovered site' and the amount of charge required to form the monolayer-type oxidefilm per unit surface area. Details of the derivation of equation (3) aregiven in Appendix 2. Equation (1) could be obtained in the same way as thatfor equation (3), except that there are two different film-nucleationprobabilities depending upon, e.g., grain orientation or lattice defects ofthe bare metal surface.
Perfect passivation kinetics of iron can be represented by thefollowing two steps: the first layer of an oxide film developstwo-dimensionally, where oxide nucleation is rate-determining; this first step isfollowed by film thickening which obeys a logarithmic rate law.
-3-
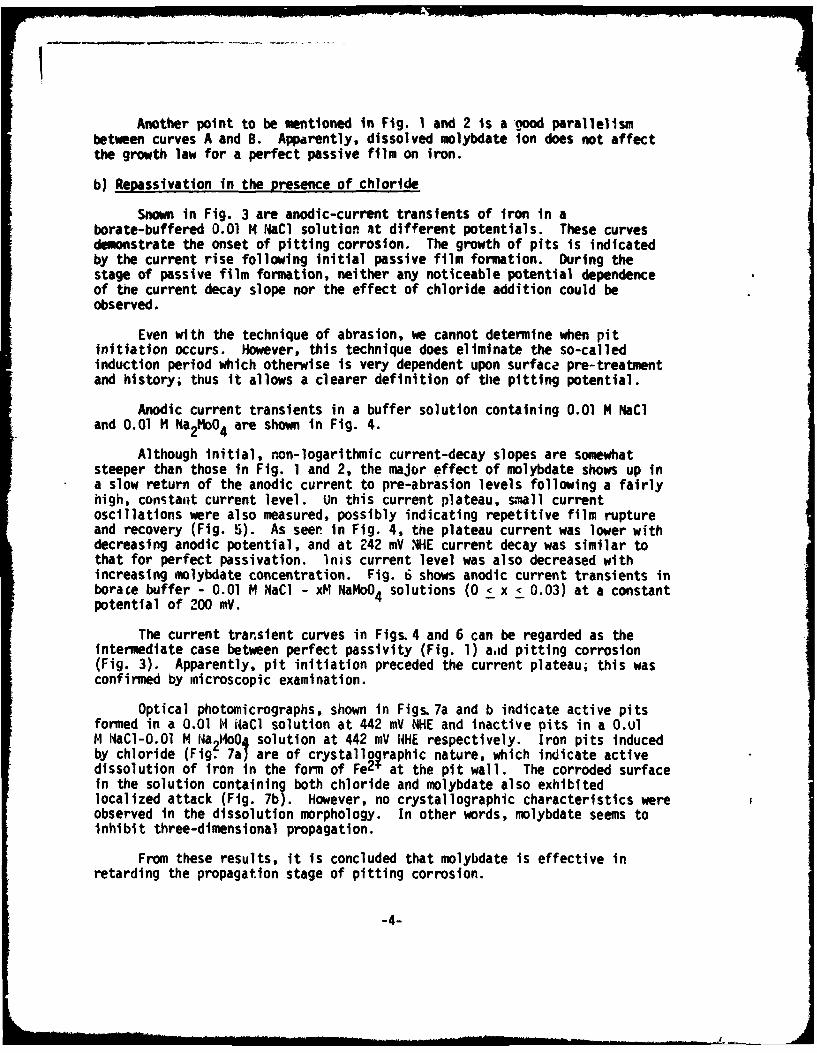
Another point to be mentioned in Fig. 1 and 2 is a good parallelismbetween curves A and B. Apparently, dissolved molybdate ion does not affectthe growth law for a perfect passive film on iron.
b) Repassivation in the presence of chloride
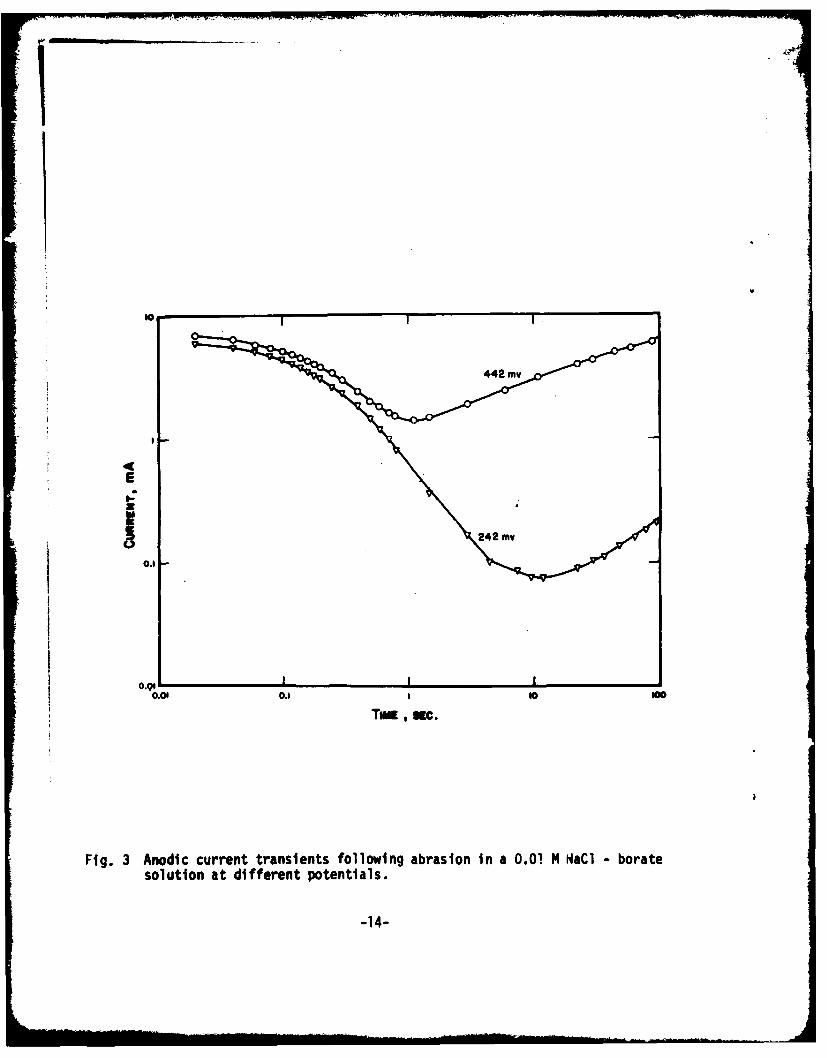
Snown in Fig. 3 are anodic-current transients of iron in aborate-buffered 0.01 H Nadl solution ,it different potentials. These curvesdemonstrate the onset of pitting corrosion. The growth of pits is indicatedby the current rise following initial passive film formation. During thestage of passive film formation, neither any noticeable potential dependenceof the current decay slope nor the effect of chloride addition could beobserved.
Even with the technique of abrasion, we cannot determine when pitinitiation occurs. However, this technique does eliminate the so-calledinduction period which otherwise is very dependent upon surface pre-treatmentand history; thus it allows a clearer definition of the pitting potential.
Anodic current transients in a buffer solution containing 0.01 M NaCland 0.01 1 Na2moO 4 are shown in Fig. 4.
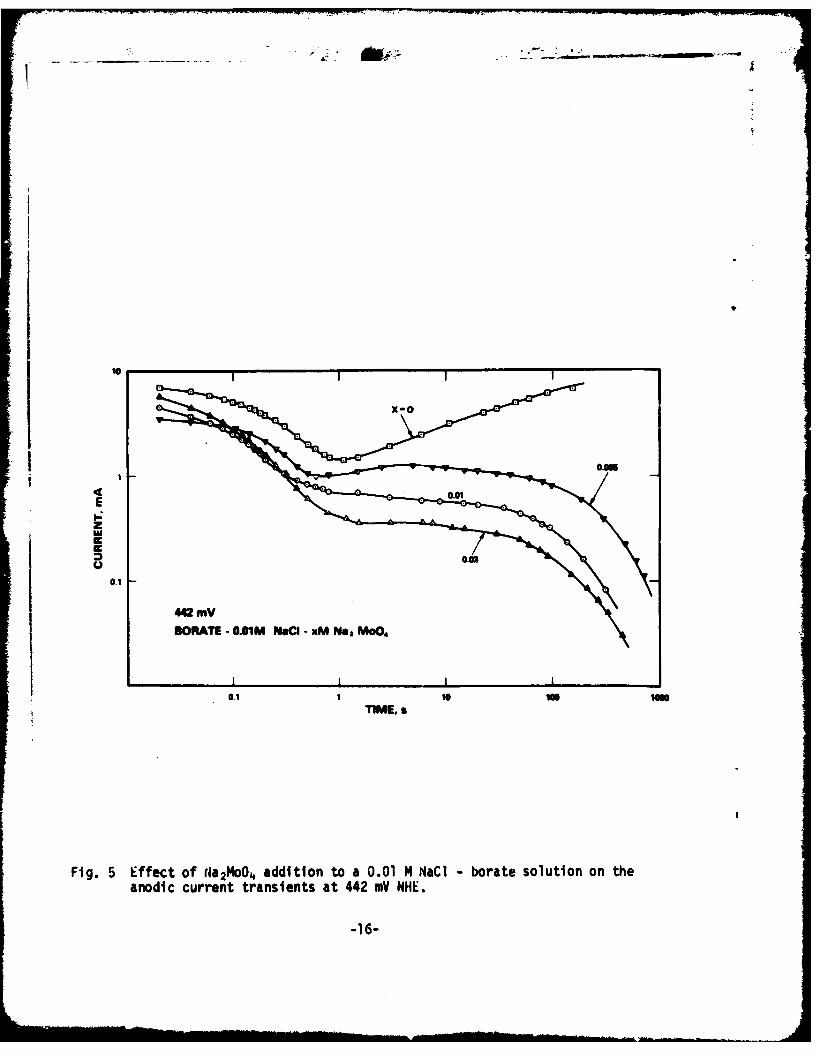
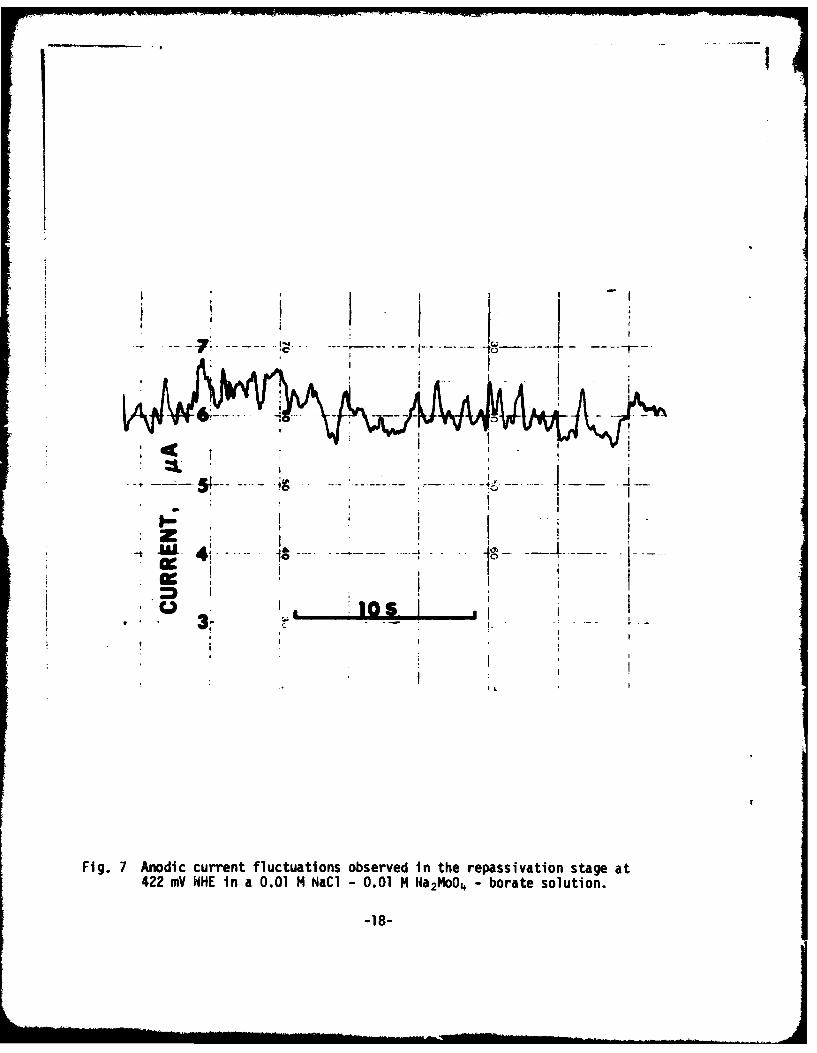
Although initial, non-logarithmic current-decay slopes are somewhatsteeper than those in Fig. 1 and 2, the major effect of molybdate shows up ina slow return of the anodic current to pre-abrasion levels following a fairlyhigh, constant current level. on this current plateau, small currentoscillations were also measured, possibly indicating repetitive film ruptureand recovery (Fig. 5). As seer in Fig. 4, the plateau current was lower withdecreasing anodic potential, and at 242 mV NHE current decay was similar tothat for perfect passivation. Inis current level was also decreased withincreasing molybdate concentration. Fig. 6 shows anodic current transients inborace buffer - 0.01 M NaCl - xM NaMoO4 solutions (0 < x < 0.03) at a constantpotential of 200 mY.
The current transient curves in Figs. 4 and 6 can be regarded as theintermediate case between perfect passivity (Fig. 1) aad pitting corrosion(Fig. 3). Apparently, pit initiation preceded the current plateau; this wasconfirmed by microscopic examination.
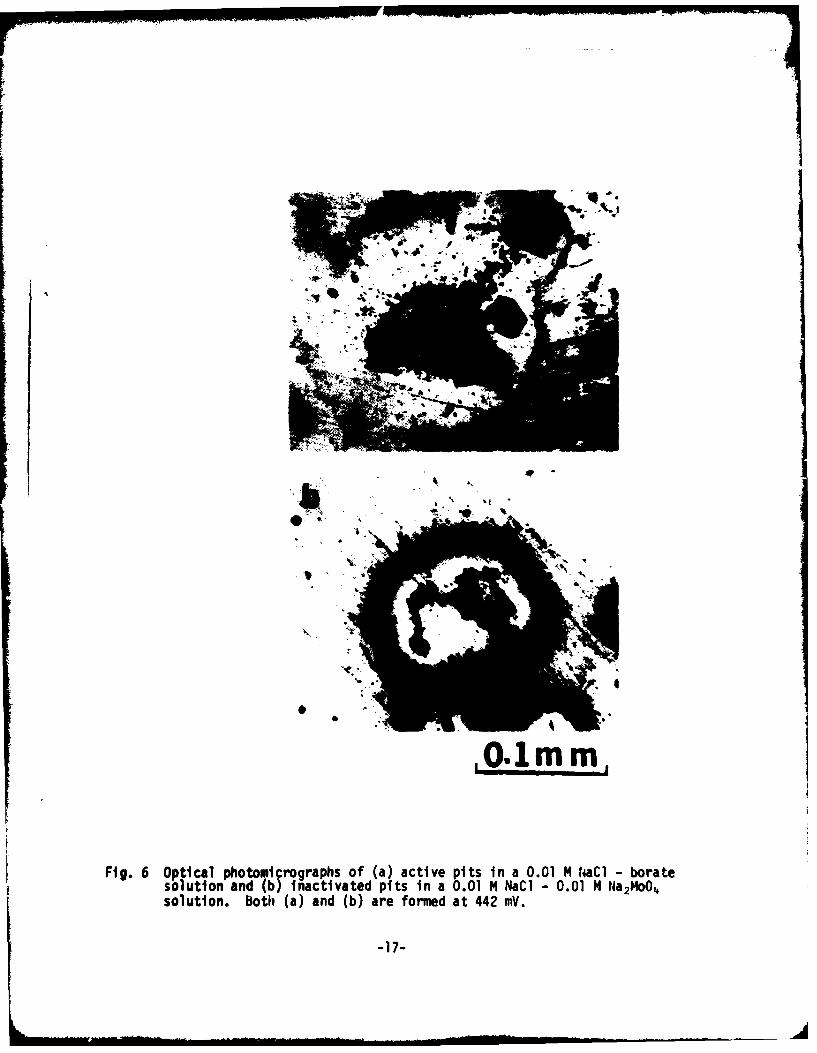
Optical photomicrographs, shown in Figs. 7a and b indicate active pitsformed in a 0.01 14 aCI solution at 442 mV NHE and inactive pits in a O.ulH IaC-O.0l M Na214oO4 solution at 442 mV NHE respectively. Iron pits inducedby chloride (Fig. 7a are of crystallographic nature, which indicate activedissolution of iron in the form of Fe2 at the pit wall. The corroded surfacein the solution containing both chloride and molybdate also exhibitedlocalized attack (Fig. 7b). However, no crystallographic characteristics wereobserved in the dissolution morphology. In other words, molybdate seems toinhibit three-dimensional propagation.
From these results, it is concluded that molybdate is effective inretarding the propagation stage of pitting corrosion.
-4-
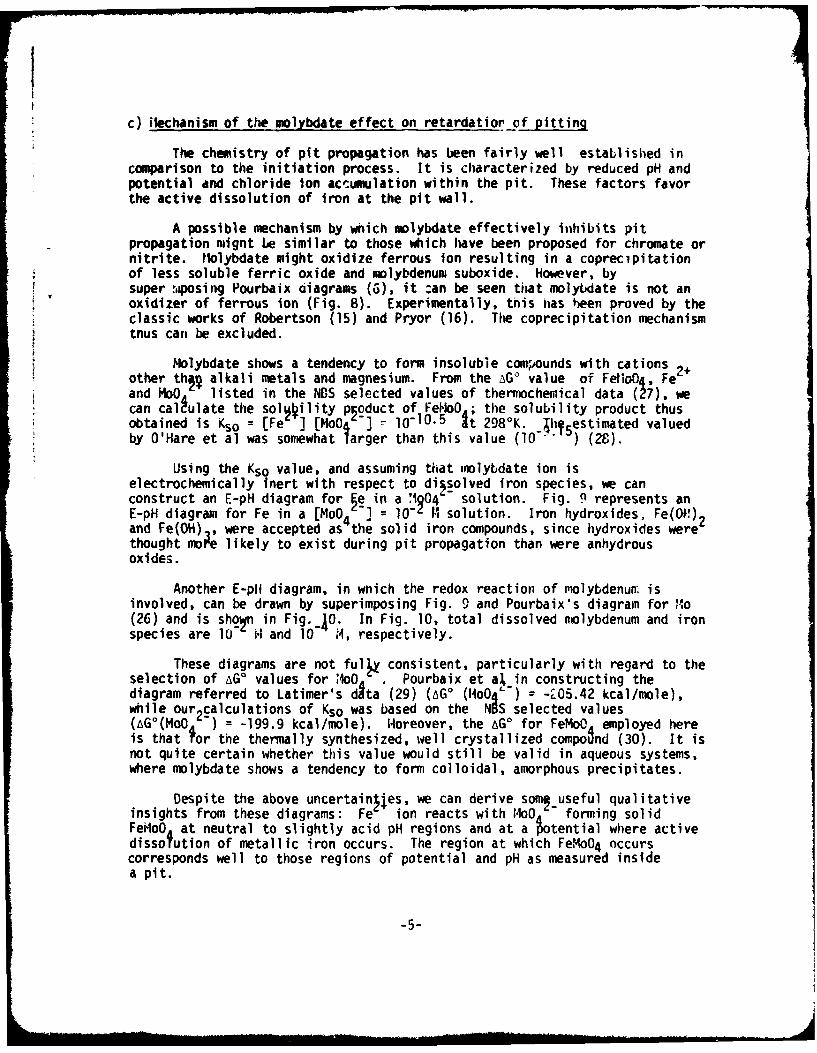
c) ilechanism of the molybdate effect on retardatior of pitting
The chemistry of pit propagation has been fairly well established incomparison to the initiation process. It is characterized by reduced pH andpotential and chloride ion accumulation within the pit. These factors favorthe active dissolution of iron at the pit wall.
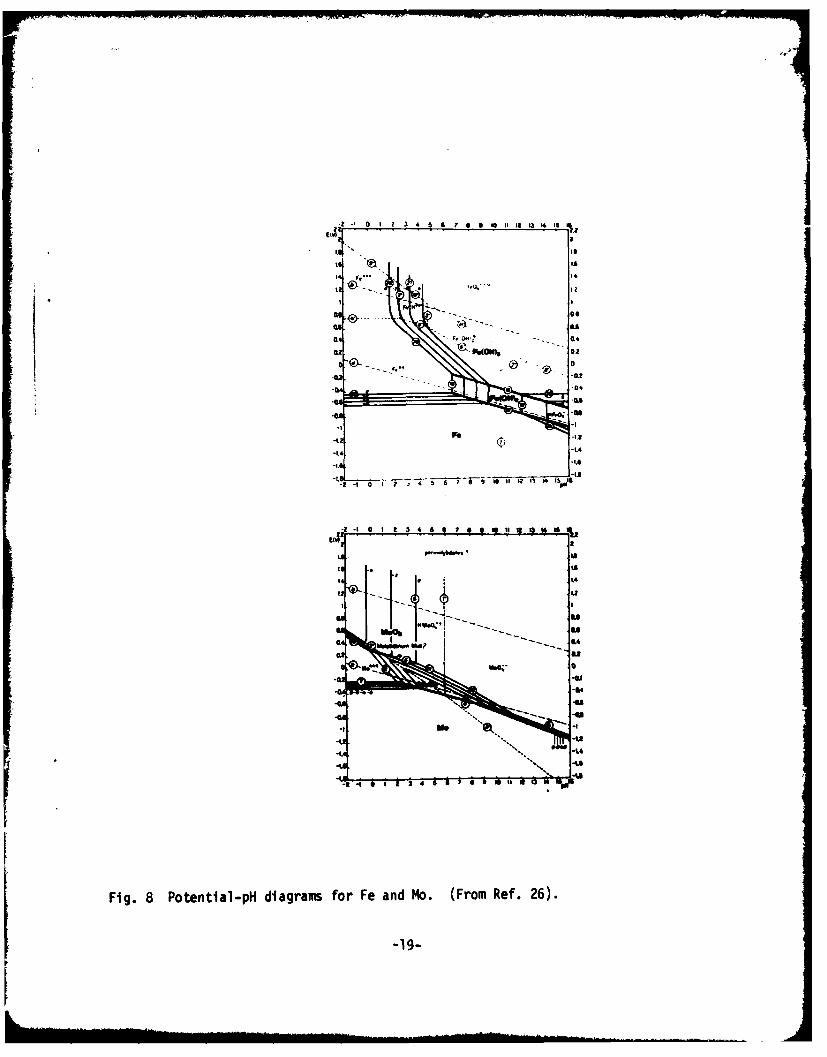
A possible mechanism by which molybdate effectively inhibits pitpropagation might be similar to those which have been proposed for chromate ornitrite. Molybdate might oxidize ferrous ion resulting in a coprecipitationof less soluble ferric oxide and molybdenum suboxide. However, bysuper ,qiosing Pourbaix diagrams (6), it :an be seen that molybdate is not anoxidizer of ferrous ion (Fig. 8). Experimentally, tnis has been proved by theclassic works of Robertson (15) and Pryor (16). The coprecipitation mechanismtnus can be excluded.
Holybdate shows a tendency to form insoluble comprounds with cationsother th alkali metals and magnesium. From the AG° value of FeIloO4 , Fe
2 -
and ioO listed in the NBS selected values of therochemical data (17), wecan calulate the sol Oility pgoduct of FeMoO the solubility product thusobtained is Kso = [Fe ] [MoO4 - I0 - . t 298°K. li5 estimated valuedby O'Hare et al was somewhat larger than this value (10- ) (28).
Using the Kso value, and assuming that miolybdate ion iselectrochemically inert with respect to di~solved iron species, we canconstruct an E-pH diagram for e in a '104 solution. Fig. 9 represents anE-pH diagram for Fe in a [MoO4 ] = 10- M solution. Iron hydroxides, Fe(OV1)2and Fe(OH) , were accepted as the solid iron compounds, since hydroxides werethought moe likely to exist during pit propagation than were anhydrousoxides.
Another E-pli diagram, in wnich the redox reaction of molybdenunm isinvolved, can be drawn by superimposing Fig. 9 and Pourbaix's diagram for I1o(26) and is shor in Fig. 40. In Fig. 10, total dissolved molybdenum and ironspecies are 10" . and 10 M4, respectively.
These diagrams are not ful consistent, particularly with regard to theselection of AGO values for 4O . Pourbaix et a, in constructing thediagram referred to Latimer's dita (29) (AGO (04oO ') = -LO5.42 kcal/mole),while our 2calculations of Kso was based on the NS selected values(AG°(MoO -) = -199.9 kcal/mole). Moreover, the AGO for FeMoC employed hereis that for the thermally synthesized, well crystallized compo~nd (30). It isnot quite certain whether this value would still be valid in aqueous systems,where molybdate shows a tendency to form colloidal, amorphous precipitates.
Despite the above uncertain es, we can derive soml useful qualitativeinsights from these diagrams: Fe ion reacts with MoO - forming solidFeMoO at neutral to slightly acid pH regions and at a potential where activedissotution of metallic iron occurs. The region at which FeMo04 occurscorresponds well to those regions of potential and pH as measured insidea pit.
-5-
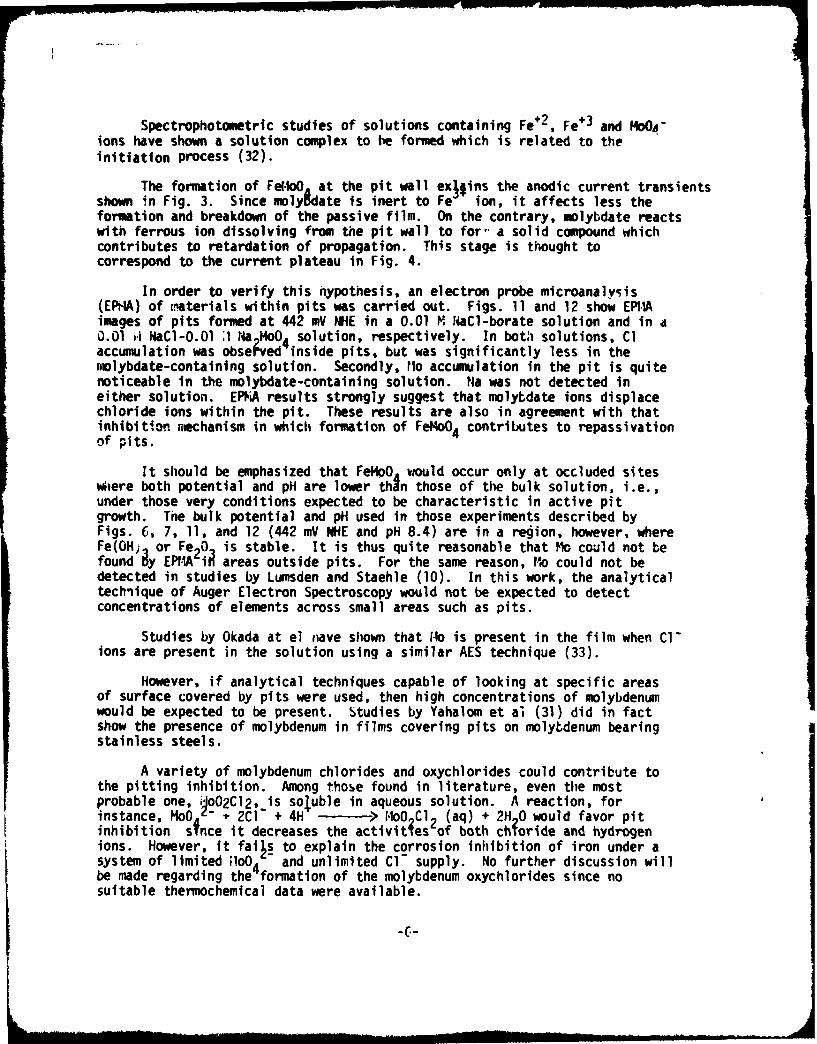
Spectrophotometric studies of solutions containing Fe+2, Fe+3 and MoOj-ions have shown a solution complex to he formed which is related to theinitiation process (32).
The formation of Fel-oO at the pit wall exitins the anodic current transientsshown in Fig. 3. Since moly~date is inert to Fe ion, it affects less theformation and breakdown of the passive film. On the contrary, molybdate reactswith ferrous ion dissolving from the pit wall to for' a solid compound whichcontributes to retardation of propagation. This stage is thought tocorrespond to the current plateau in Fig. 4.
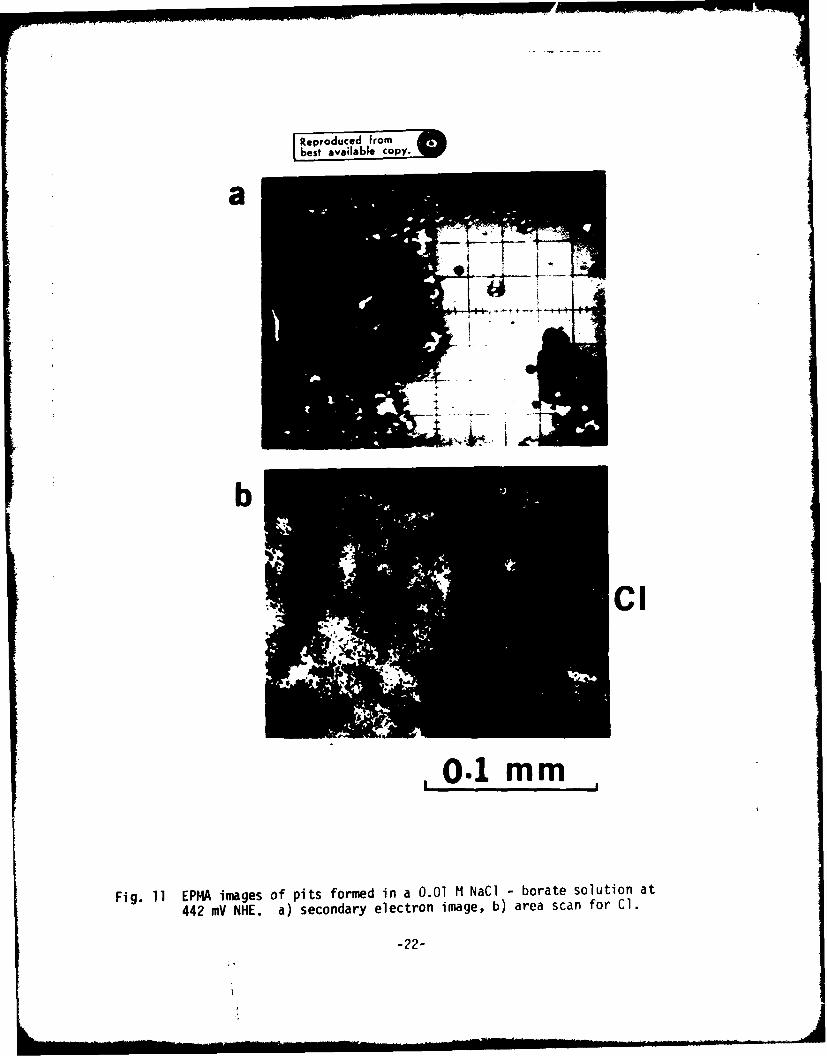
In order to verify this hypothesis, an electron probe microanalysis(EPHA) of materials within pits was carried out. Figs. 11 and 12 show EPI.Aimages of pits formed at 442 mV NHE in a 0.01 M NaCl-borate solution and in d0.01 .i NaCl-O.O1 ;I Na HoO4 solution, respectively. In both solutions, Claccumulation was obse'ved inside pits, but was significantly less in themolybdate-containing solution. Secondly, 1o accumulation in the pit is quitenoticeable in the molybdate-contalning solution. Na was not detected ineither solution. EPFLA results strongly suggest that molybdate ions displacechloride ions within the pit. These results are also in agreement with thatinhibition aechanism in which formation of FeMoO4 contributes to repassivationof pits.
It should be emphasized that Fe4oO would occur only at occluded siteswhiere both potential and pH are lower thin those of the bulk solution, i.e.,under those very conditions expected to be characteristic in active pitgrowth. The bulk potential and pH used in those experiments described byFigs. 6, 7, 11, and 12 (442 mV NE and pH 8.4) are in a region, however, whereFe(OHj or Fe20, is stable. It is thus quite reasonable that Mo could not befound gy EPIIA i areas outside pits. For the same reason, Vlo could not bedetected in studies by Lumsden and Staehle (10). In this work, the analyticaltechnique of Auger Electron Spectroscopy would not be expected to detectconcentrations of elements across small areas such as pits.
Studies by Okada at el nave shown that ilo is present in the film when Cl"ions are present in the solution using a similar AES technique (33).
However, if analytical techniques capable of looking at specific areasof surface covered by pits were used, then high concentrations of molybdenumwould be expected to be present. Studies by Yahalom et ai (31) did in factshow the presence of molybdenum in films covering pits on molybdenum bearingstainless steels.
A variety of molybdenum chlorides and oxychlorides could contribute tothe pitting inhibition. Among those found in literature, even the mostprobable one, 1Jo02C12, is soluble in aqueous solution. A reaction, forinstance, MoO4- t 2C0- + 4H > M1oOCl2 (aq) + 2H 0 would favor pitinhibition sfnce it decreases the activities of both choride and hydrogenions. However, it fails to explain the corrosion inhibition of iron under asystem of limited 1o0 4 and unlimited Cl" supply. No further discussion willbe made regarding the formation of the molybdenum oxychlorides since nosuitable thermochemical data were available.
-C-
The results of this investigation clearly demonstrated that dissolvedmolybdate ion is effective in repassivating iron undergoing pitting corrosion.The mechanism proposed in the present werk can hopefully be extended toelucidate the mechanism for enhanced corrosion resistance of Mo-bearingstainless steels in neutral chloride media. However, it should be noted thatthe present mechanism gives only one aspect of the complex chemistry ofalloyed !1o. As has been reported in our previous study (20), therepassivation rate for times less than 100 ms following initiation ofrepassivatlon is increased with increasing Mo content in steels, while thepresent study has shown that dissolved molybdate does not affect therepassivation rate of iron. Also Mo-bearing stainless steels are reported toexhibit excellent corrosion resistance in acid environments (1-7) where FeMoO4is not stable. As is expected from Figs.8 to 10, molybdenum trioxide, MoObecomes less soluble with increasing acidity, suggesting direct tnvolvemen? ofNo in the passivation or Mo enrichment in the film to occur: this is inagreement with the microanalytical work of Rhodin (8), who used an acidsolution for passivation treatment. The chemistry of Mo is, however, far morecomplex especially in acid regions than is shown in Pourbaix's diagram becauseof the variety of polymolybdates and valence states. Further work usingvarious environments is needed to eluciite the role of 11o on the increasedcorrosion resistance of 'lo-bearing alloys.
AC KNOWLEDGEMENT
We are grateful to Dr. J. Kruger ior discussions and encouragementconcerning this work, to the Office of Naval Research who supported thiswork under Contract No. NAONR 18-69, NR 036-082, and to the Japanese Scienceand Technology Agency who sponsorod one of the authors' (T. Kodama) visitto the National Bureau of Standards.
-7-

APPLI dI XLS
Appendix 1
In electrochemical oxidation, thc. amount of charge for oxide film forma-cion (Qf) is proportional to the weight gain (Akw. if the anodic currentefficiency for film formation is unity.
AW - Qf
Parabolic, cubic, and logarithmic rate laws for film formation are respectivelyexpressed as follows as a Function of time:
AW - Qf = At 1/2 (4)
Qf = At 1/3 (5)
Qf = AInt + 8 (6)
where A and 6 are constants.
Since the derivative of Qf gives anodic current, eqs. (4) to (U) give eqs.
(7) to (9), respectively.
if dQf = I At" I/2
d t 2 (7)
= dQf = 1 At2/3
.i .dQfAt-1f T-
(9)
Tne exponent of t gives the slope (m) in the log i - log t plot. Thus one canobtain the following results:
for parabolic m = -712
for cubic m = -2/3
for aogarithmic m = -l
- MU-
Appendix 2-1
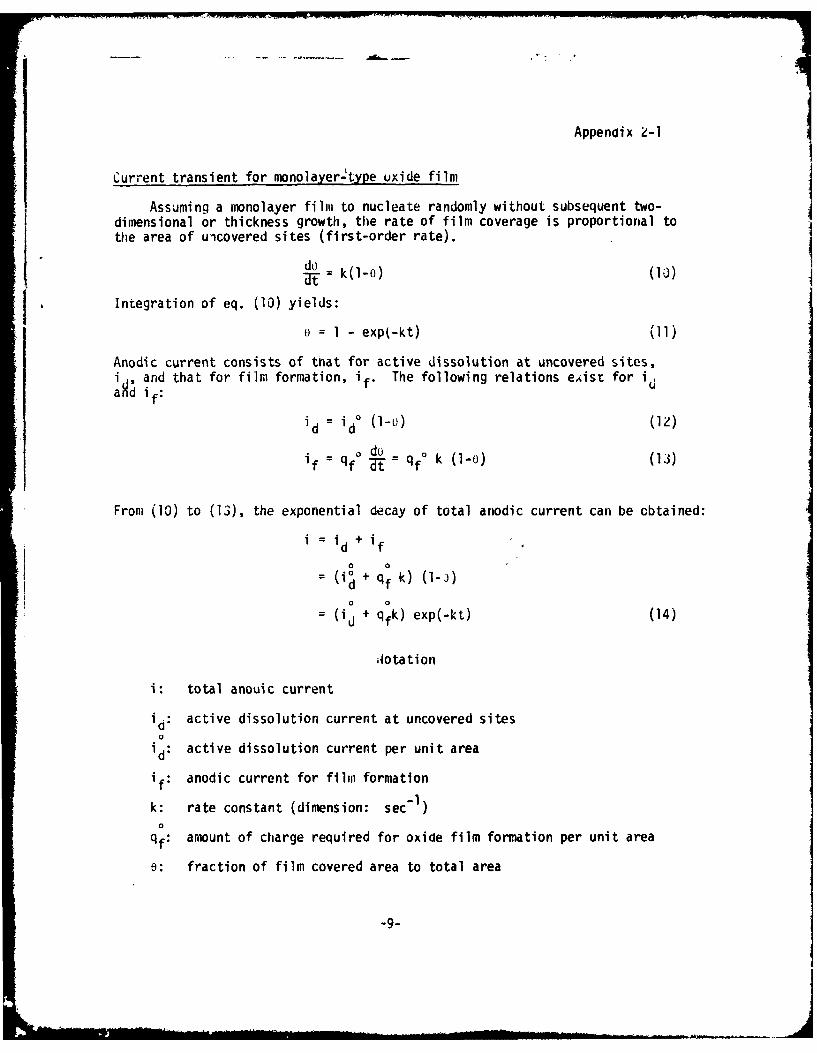
Current transient for monolayer-'type uxide film
Assuming a monolayer film to nucleate randomly without subsequent two-dimensional or thickness growth, the rate of film coverage is proportional tothe area of uicovered sites (first-order rate).
dod - -k(l-o) (1 )
Integration of eq. (10) yields:
o = 1 - exp(-kt) (l1)
Anodic current consists of tnat for active dissolution at uncovered sites,i and that for film formation, if. The following relations exist for idagd if:
i d = id° I' )( Zda
if = qf° U = qf° k (1-o) (13)
From (10) to (13), the exponential decay of total anodic current can be obtained:
d f
(io + qf k) (1-j)
(i + qfk) exp(-kt) (14)
Jotation
i: total anouic current
id: active dissolution current at uncovered sites
id: active dissolution current per unit area
if: anodic current for film formation
k: rate constant (dimension: secJ)
0
qf: amount of charge required for oxide film formation per unit area
e: fraction of film covered area to total area
-9-
REFERENCES
1) fl. Prazak and V. Cihal, Corr. Sci., 2, 71 (1962).
2) E. A. Lizlov, Corrosion, 22, 297 (1966).
3) E. A. Lizlov and A. P. Bond, J. Electrochem Soc., 118, 22 (1971).
4) E. A. Lizlov and A. P. Bond, J. Electrochem Soc., 122, 719 (1975).
5) R.J. Brigham, Corrosion, 28, 177 (1972).
6) k. J. Brigham and E. W. Tozer, Corrosion, 29, 33 (1973).
7) 14. B. Rockel, Corrosion, 29, 393 (1973).
8) T. W. Rnodin, Corrosion, 12, 123t and 465t (1956).
9) G. J. Barnes, A. W. Aldey and R. C. Jerner, J. Electrochem. Soc., 119,684 (1972).
10) J. B. Lumsden and R. W. Staehle, Scr. Het., 6, 1205 (1972).
11) J. Desson and G. Drautzburg,, Electrochim. Acta, 3, 158 (1960).
12) A. A. Pozdeeva, E. I. Antonovskaya and A. H. Sukhotin, Corr. Sci., 6, 149(1966).
13) L. L. Wikstrom and K. Nobe, J. Electrochem. Soc., 116, 525 (1969).
14) J. W. Johnson, C. H. Chi, C. K. Chen and W. J. James, Corrosion, 26,238 (1970).
15) W. D. Robertson, J. Electrochem. Soc., 98, 94 (1951).
16) 14. J. Pryor and M. Cohen, J. Electrochem. Soc., 100, 203 (1953).
17) G. H. Cartledge and R. F. Sympson, J. Phys. Chem., 61, 973 (1957).
18) E. A. Lizloves, J. Electrochem. Soc., 114, 1015 (1967).
19) A. Weisstuch and C. E. Schell, Corrosion, 28, 299 (1972).
20) J. Kruger and J. R. Ambrose, National Bureau of Standards Report No. NBSIR74-583, Technical Summary Report No. 5, Contract NAONR 18-69, NR 036-082,1974.
21) J. R. Ambrose and J. Kruger, Corrosion, 28, 30 (1972).
22) J. R. Ambrose and J. Kruger, J. Electrociiem. Soc., 121, 599 (1974).
-10-
23) 14. Nagayama and M. Cohen, J. Electrochem. Soc., 109, 781 (1962).
24) N. Sato and M. Cohen, J. Electrochem. Soc., 111, 512 (1964).
25) M. Flelschmann and H. R. Thirsk, Advances in Electrochemistry andElectrochemical Engineering, Vol. 3, ed., P. Delahay, p. 123, Interscience,New York.
26) M. Pourbaix, Atlas of Electrochemical Equilibria at 250C, pp. 275 and 313,1966, Pergamon Press.
27) D. D. Wagman et al., National Bureau of Standards Technical Note, 270-4(1969).
28) P.A.G. O'Hare, K. J. Jensen and H. R. Hoekstra, J. Chem. Thermodynamics
6, 681 (1974).
29) W. 14. Latimer, Oxidation Potentiai, 2nd ed., Prentice Hall, New York, 1952.
30) W. W. Weller, U. S. Bur. Mines Rep. Invest., No. 6787 (1966).
31) J. Yahalom, L. K. Ives, arid J. Kruger, J. Electrochem. Soc., 120, 384 (1973).
32) G. H. Cartledge, Corrosion, 24, 223 (1968).
33) H. Okada, H. Ogana, I. Hoh, and H. Omata, Auger Electron SpectroscopicAnalysis of the Passive Film of Stainless Steels, presented at theJoint Japan-USA Seminar on Passivity, Honolulu, 1975.
-11-
10
4a MV
E
0.1
-12
0.010.01 0.1 1 10
TIME a
Fig. 1 Anodic current transients following abrasion at 442 mV I*$E (A) in aborate buffer solution (phi 8.4) and (B) in a 0.01 M NatON - boratesolution. Slopes m - -1/2, -2/3, and -1 on a log-log scale indicateparabolic, cubic, and logarithmic rate laws for film growth,respectively.

7
4
3
2
0 010.2
TIME. 9
Fig. 2 Semillogarithmic plots of anodic transients for times less than 250 mus
following abrasion at 442 mV dAH (A) in a borate buffer solution
(pli 8.4), and (B) in a 0.01 M IMAN~ - borate solution.
-13-
444m
E
I0.1
O.QI I0.0 0.1 1 10 I00
Fig. 3 Anodic current transients following abrasion in a 0.01 N H'aCl -borate
solution at different potentials.
-14-

E
0.0110.01 0.1 Ti ma 10 100 mm0
Fig. 4 Anodic current transients following abrasion in a 0.01 MN raCl
0.01 M Na2MoO,, - borate, solution at different potentials.
-15-
<--
OAN
IC04
BORATE - OMiM Naa - xM Na, MoO4
0.1 11 UU
TIME. a
Fig. 5 Effect of (400M04 addition to a 0.01 M NaCi - borate solution on the
anodic current transients at 442 .V NHE.
-16-
lop
Fig. 6 Optical photomicrographs of (a) active pits in a 0.01 M M~CI boratesolution and (b) inactivated pits in a 0.01 M NaCi - 0.01 N Na2MoO4solution, both (a) and (b) are formed at 442 WV.
-17-
'~os i iILI
Fi. 7 A
42 m
-t1 1' I I I
0 iO!I ',3 I I
. I IL I
Fig. 7 Anodlc current fluctuations observed in the repassivation stage at422 mV NHE In a 0.01 1M NaCI - 0.01 M 1Na2M40 - borate solution.
-18-
-z -1 0 1 Z 3 SO II Ii' 4 IIs
_C142*0
OOS
1
-IA.'
II

4 -2
12 pa HMO.-
MOO.
0 -**O
FeG
-1.2I
-1.30 3 6 9 12 15
pH
Fig. 9 Potential-pH diagram for Fe in molybdate solutions. (Total molybdateconcentration - 10-2 M) at 298 K. Molybdate ion is assumed to beelectrochemical ly inert.
-20-
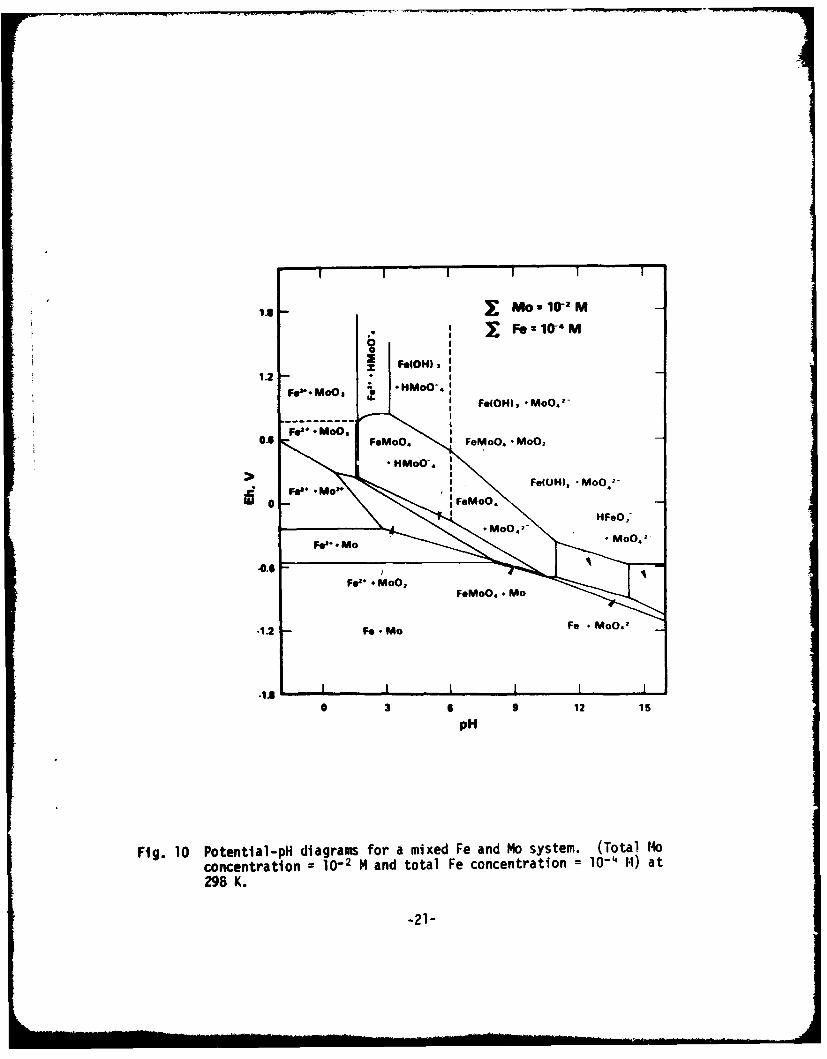
X~ F=1O'M
1.2WMoOS *HMoO.
- ' FefOH). -MOO.'-
0.6 F.MoO. I FeMoO. -Moo,
*HoO-.
IeoO WOW Moo.
-1. -IO I0 3 6 9 12 15
conenraio = * 10 MnotlFcoenrin Fe Mo.1)a
298 K.
-21-
Reproduced frombest available copy.
a
C1
.0.1 mm.-
Fig. 11 EPI4A images of Pits formed in a 0.01 M NaCi borate solution at
442 mV NHE. a) secondary electron image, b) area scan for Cl.
-22-

Reproduced frOm
a
b.
-CI1
C
Mo
0.1 MM
Fig. 12 EPMA images of pits forr~ied in a 0.01 M Nadl - 0.01 M Na2MoO4 -
borate solution at 442 mV NHE. a) secondary electron image, b)area scan for 01, c) area scan for Mo.
-23-
PART II
(To be submitted to the Journal of the Electrochemical Society)
The Effect of a Crevice onPassive Film Growth Kinetics for Iron
John R. AmbroseCorrosion and Electrodeposition Section
National Bureau of StandardsWashington, D. C. 20234
There is usually agreement that the underlying cause of crevicecorrosion is related to the fact that within the restricted geometry of acrevice there is contained a solution in which mass transport of certaincritical species is sufficiently limited so as to inhibit continuation of thepassive state normally displayed by a metal (1-3). This agreement continueswhen these critical species are enumerated, although their ranking has beenopen to some discussion. They are, in arbitrary order (4):
1) metal cations2) bulk solution anions (e.g., chloride ion)(3) hydrogen ions(4) dissolved oxygen
Finally, considerable agreement prevails when discussion expands to includethe specific effect that would be manifest when mass transport of thesespecies is restricted. Without the reaction products from oxygen reductionwithin the crevice available to neutralize hydrogen ions produced byhydrolysis of metal ions, the crevice solution eventually deteriorates to apoint where it is difficult to maintain the passive state. Since it isgenerally regarded that this passive state results from the presence of aprotective surface film, then the properties of this film - its ability tosustain, repair or even regenerate itself in those environments consideredaggressive - are critical with respect to evaluating susceptibility to crevicecorrosion attack.
Techniques which provide measurements of overall corrosion rates duringcrevice attack using electrochemical test methods alone cannot be expected toallow measurement of film properties. There are too many diffusion limitedsteps in the process which contribute to overall reaction kinetics to permit afocus on the most important area - the film, itself - unless measures aretaken to look at the film alone. The work described here is based on resultsobtained by observing the film that exists on a metal surface exposed to acrevice. Pure iron exposed to a borate buffer solution to which sodiumchloride could be added was selected since film growth processes within andwithout a crevice could be compared.
Recently a technique was developed in this laboratory that utilizedellipsometry to measure variations in optical properties inside a crevice whilea specimen was potentiostated at a fixed corrosion potential. This approach was shown
-24-

to be useful in measuring relative susceptibility toward crevice corrosion ofa series of ferritic stainless steels as a function of molybdenum content (5).This earlier developed technique is of value in predicting susceptiblity tocrevice attack, but it is difficult to use as a tool for making studiesconcerned with developing an understanding of the mechanism of creviceellipsometric parameters observed during the onset of attack. The work
described here is based on results obtained from a modification of thattechnique. Whereas the former procedure involved measurement of ellipsometerchanges which occurred following exposure of a film covered metal surface to acrevice, in this procedure, a bare metal surface was producedelectrochemically on iron before ellipsometer measurements were begun. Fromthis study, it was hoped that some idea of exactly how the restricted geometryof a crevice affects film growth could be obtained by ellipsometricallymeasuring film growth and reduction during potentiometric and galvanostaticcycles.
EXPERIMENTAL
Material used in this study was ferrovac iron, which was mounted inlucite, then drilled and tapped for electrode assembly. The crevice assemblyshown in Fig. I was the same as that used in previous studies (5). However,for this work, the assembly was positioned as shown in Fig. 2, allowingsolution to be drawn into the crevice by capillary action. Within this particularconfiguration, ellipsometric measurement was facilliated due to easier opticalallignment of the specimen assembly. Experiments performed utilizing the creviceassembly were compared to experiments performed under identical conditionswithout the presence of a crevice. The distance between the quartz plate andthe metal surface (the crevice thickness) was 0.25 mm in each experiment. Thisthickness was assured for each experiment using a teflon shim.
All experiments were performed using soluti ns prepared from reagent gradechemicals and distilled water (7 x 10- ohm-7 cm-'). A buffer solution containing9.3 g H3BO3 and 14.6 g Na2B4 107 - 1OH20 per liter (pH. 8.4) was used as a stocksolution. In order to evaluate contributions from the presence of chloride ion,an aliquot of l.On NaCl solution was added to the stock solution to make anoverall chloride ion concentration of I0-211.
Specimens were polished using SiC metallographic papers, then rotarypolished with 1 um diamond paste. Following polishing, specimens were ultra-sonically cleaned with ethyl alcohol, rinsed with spectro grade methanol,dried in air, then mounted for exposure.
Two experimental techniques were used in this study:
a) Potentiodynamic Scan Technique
Following positioning of the specimen, the specimen potential was fixedat -758 mV SHE until initial ellipsometric measurements were completed. Aramp function was then applied so that the potential was varied at a fixed rateof from 400 to 2000 mV/minute to 1242 mV SHE; at this point the potential wasreturned to -758 mV SHE. Measurements of cell current were recorded. Simultaneousmeasurement of decrease in ellipsometer light intensity (proportional to filmthickness) was made'using the off-null technique (6).
-25-
IL
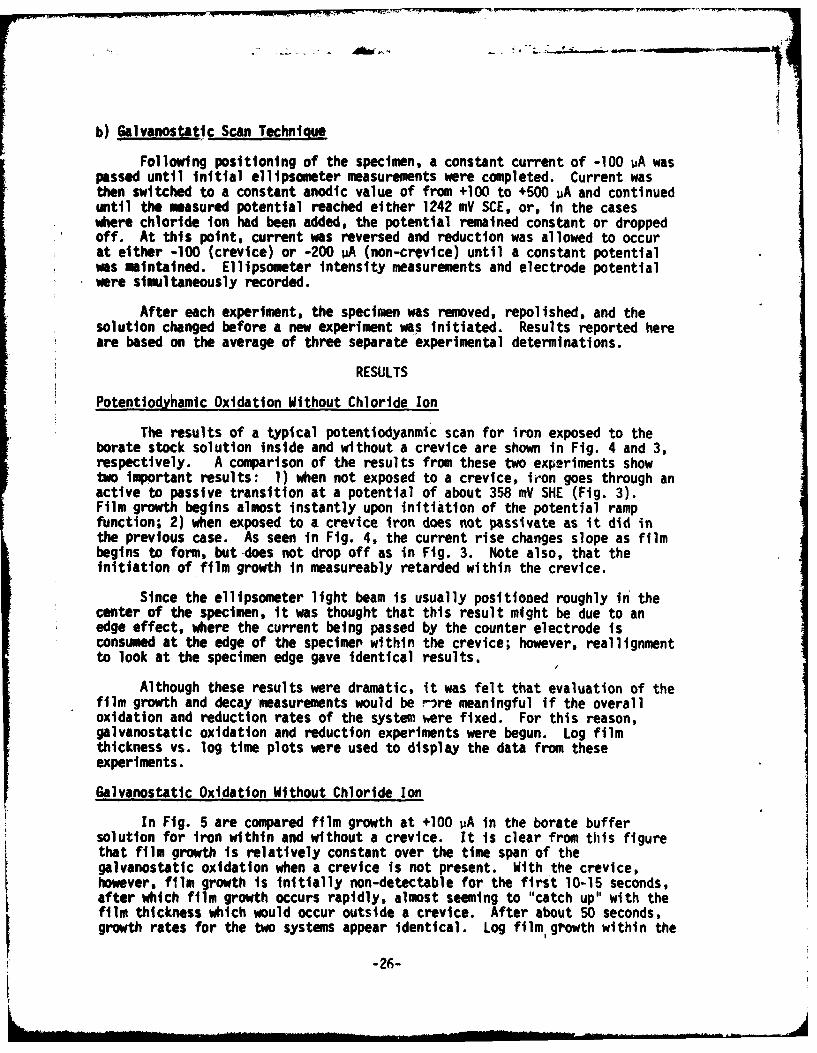
b) Galvanostatic Scan Technique
Following positioning of the specimen, a constant current of -100 vA waspassed until initial ellipsometer measurements were completed. Current wasthen switched to a constant anodic value of from +100 to +500 .A and continueduntil the masured potential reached either 1242 mV SCE, or, in the caseswhere chloride ion had been added, the potential remained constant or droppedoff. At this point, current was reversed and reduction was allowed to occurat either -100 (crevice) or -200 vA (non-crevice) until a constant potentialwas maintained. Ellipsometer intensity measurements and electrode potentialwere simultaneously recorded.
After each experiment, the specimen was removed, repolished, and thesolution changed before a new experiment was initiated. Results reported hereare based on the average of three separate experimental determinations.
RESULTS
Potentiody amic Oxidation Without Chloride Ion
The results of a typical potentodyanmic scan for iron exposed to theborate stock solution inside and without a crevice are shown in Fig. 4 and 3,respectively. A comparison of the results from these two experiments showtwo important results: 1) when not exposed to a crevice, iion goes through anactive to passive transition at a potential of about 358 mV SHE (Fig. 3).Film growth begins almost instantly upon initiation of the potential rampfunction; 2) when exposed to a crevice iron does not passivate as it did inthe previous case. As seen in Fig. 4, the current rise changes slope as filmbegins to form, but does not drop off as in Fig. 3. Note also, that theinitiation of film growth in measureably retarded within the crevice.
Since the ellipsometer light beam is usually positioned roughly in thecenter of the specimen, it was thought that this result might be due to anedge effect, where the current being passed by the counter electrode isconsumed at the edge of the specimen within the crevice; however, reallignmentto look at the specimen edge gave identical results.
Although these results were dramatic, it was felt that evaluation of thefilm growth and decay measurements would be rre meaningful if the overalloxidation and reduction rates of the system were fixed. For this reason,galvanostatic oxidation and reduction experiments were begun. Log filmthickness vs. log time plots were used to display the data from theseexperiments.
Galvanostatic Oxidation Without Chloride Ion
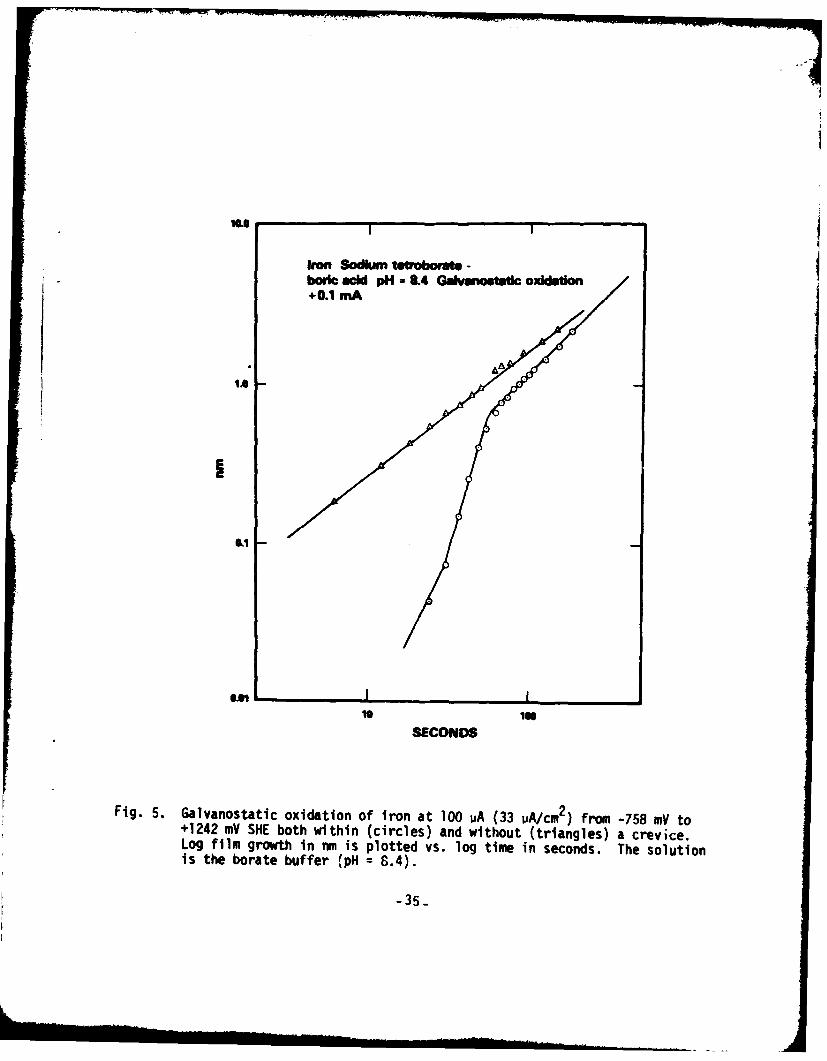
In Fig. 5 are compared film growth at +100 vA in the borate buffersolution for iron within and without a crevice. It is clear from this figurethat film growth is relatively constant over the time span of thegalvanostatic oxidation when a crevice is not present. With the crevice,however, film growth is initially non-detectable for the first 10-15 seconds,after which film growth occurs rapidly, almost seeming to "catch up" with thefilm thickness which would occur outside a crevice. After about 50 seconds,growth rates for the two systems appear identical. Log film, growth within the
-26-
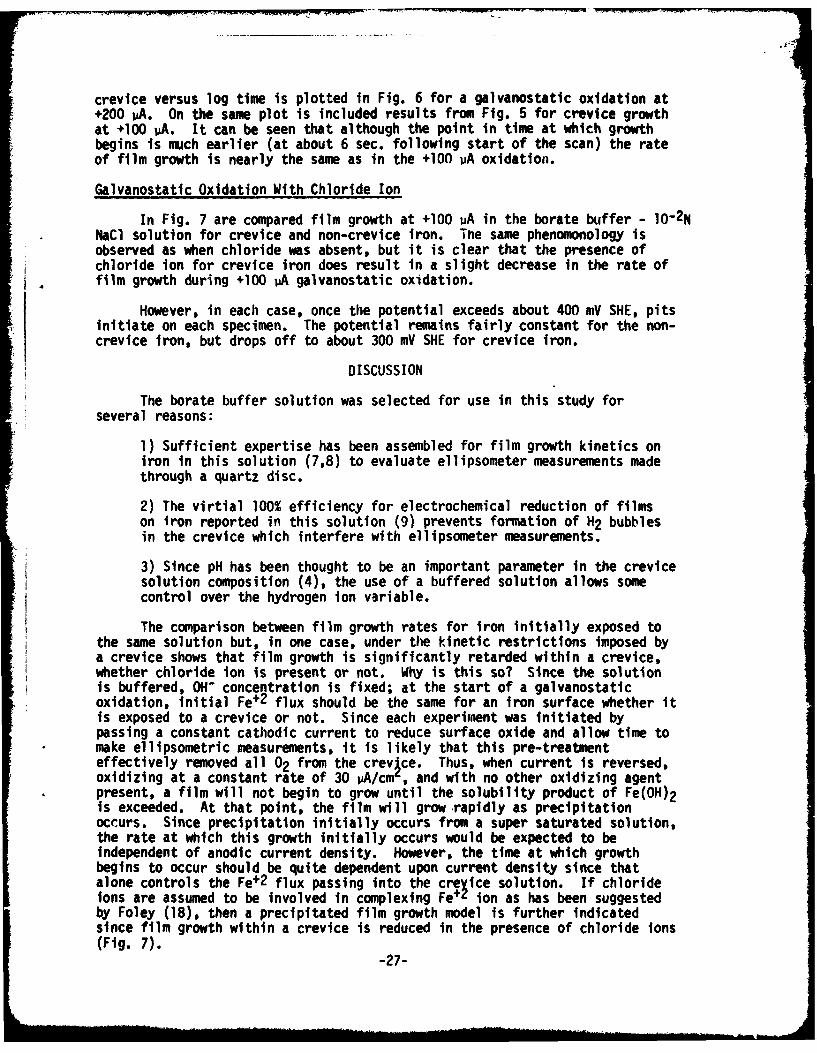
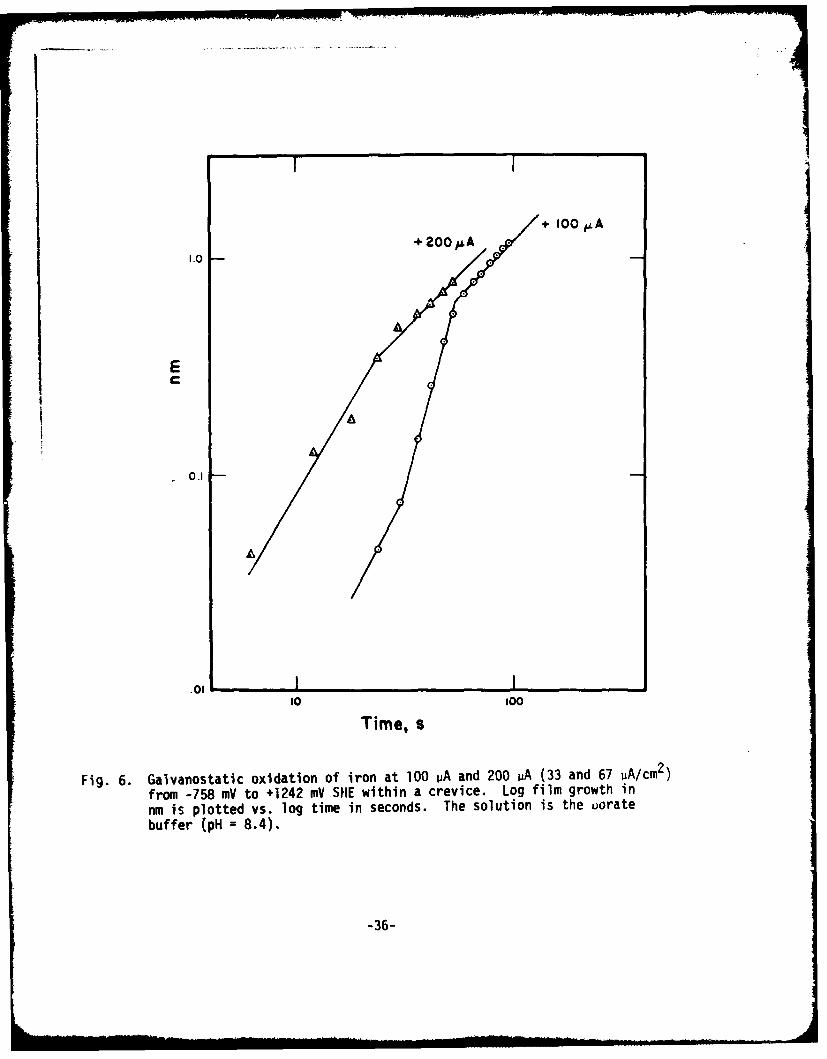
crevice versus log time is plotted in Fig. 6 for a galvanostatic oxidation at+200 uA. On the same plot is included results from Fig. 5 for crevice growthat +100 vA. It can be seen that although the point in time at which growthbegins is much earlier (at about 6 sec. following start of the scan) the rateof film growth is nearly the same as in the +100 uA oxidation.
Galvanostatic Oxidation With Chloride Ion
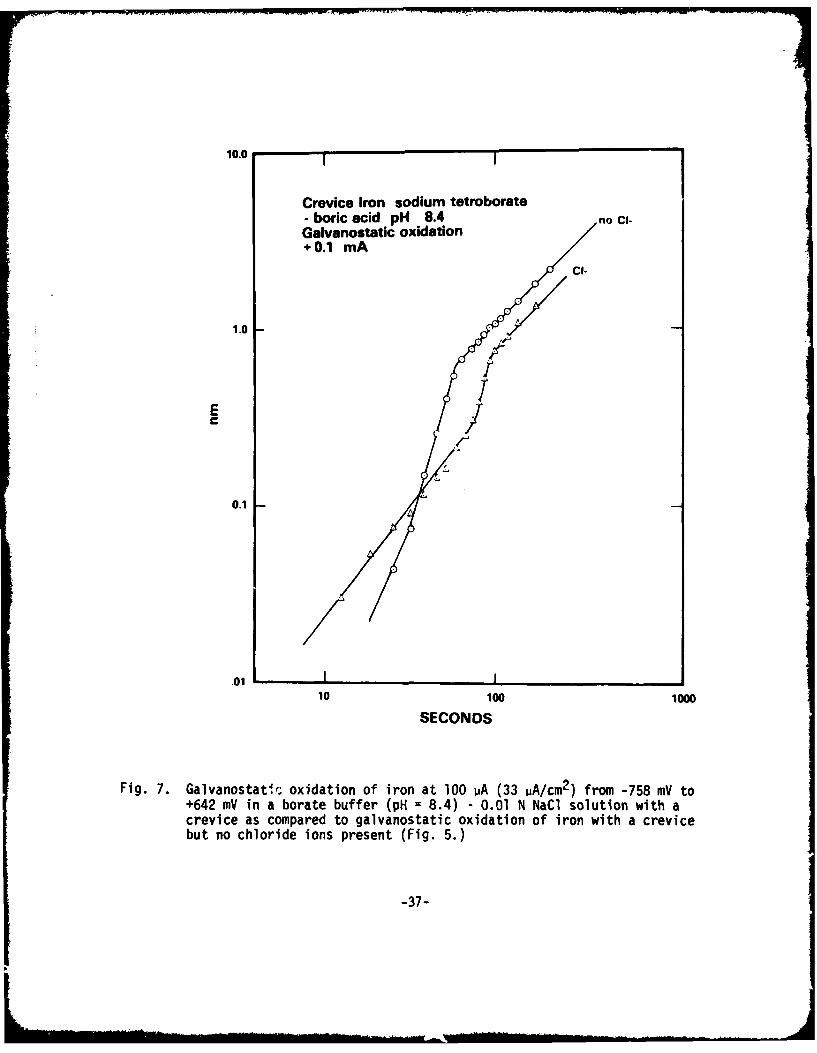
In Fig. 7 are compared film growth at +100 PA in the borate buffer - 10-2NNaCl solution for crevice and non-crevice iron. The same phenomonology isobserved as when chloride was absent, but it is clear that the presence ofchloride ion for crevice iron does result in a slight decrease in the rate offilm growth during +100 uA galvanostatic oxidation.
However, in each case, once the potential exceeds about 400 mV SHE, pitsinitiate on each specimen. The potential remains fairly constant for the non-crevice iron, but drops off to about 300 mV SHE for crevice iron.
DISCUSSION
The borate buffer solution was selected for use in this study forseveral reasons:
1) Sufficient expertise has been assembled for film growth kinetics oniron in this solution (7,8) to evaluate ellipsometer measurements madethrough a quartz disc.
2) The virtial 100% efficiency for electrochemical reduction of filmson iron reported in this solution (9) prevents formation of H2 bubblesin the crevice which interfere with ellipsometer measurements.
3) Since pH has been thought to be an important parameter in the crevicesolution composition (4), the use of a buffered solution allows somecontrol over the hydrogen ion variable.
The comparison between film growth rates for iron initially exposed tothe same solution but, in one case, under the kinetic restrictions imposed bya crevice shows that film growth is significantly retarded within a crevice,whether chloride ion is present or not. Why is this so? Since the solutionis buffered, OH- concentration is fixed; at the start of a galvanostaticoxidation, initial Fe+2 flux should be the same for an iron surface whether itis exposed to a crevice or not. Since each experiment was initiated bypassing a constant cathodic current to reduce surface oxide and allow time tomake ellipsometric measurements, it is likely that this pre-treatmenteffectively removed all 02 from the crevice. Thus, when current is reversed,oxidizing at a constant rate of 30 pA/cm , and with no other oxidizing agentpresent, a film will not begin to grow until the solubility product of Fe(OH) 2is exceeded. At that point, the film will grow rapidly as precipitationoccurs. Since precipitation initially occurs from a super saturated solution,the rate at which this growth initially occurs would be expected to beindependent of anodic current density. However, the time at which growthbegins to occur should be quite dependent upon current density since thatalone controls the Fe+ 2 flux passing into the creXice solution. If chlorideions are assumed to be involved in complexing Fe+4 ion as has been suggestedby Foley (18), then a precipitated film growth model is further indicatedsince film growth within a crevice is reduced in the presence of chloride ions(Fig. 7).
-27-

One other possibility is that because of the crevice, a portion of the
applied current is consumed by the establishment of a significant iR drop in
the snlution and that film will not grow until the actual electrode potential
E -- ;R) exceeds some critical value. Specimens are being redesigned to
afUw measu.ement of potential within a crevice. Whichever explanation is the
correct one, the net result is the same, following creation of a bare metal
site within a crevice, film growth during the repassivation process is
retarded during galvanostatic oxidation.
Once some critical potential is exceeded, however, film growth kinetics
are virtually identical whether growth on the iron occurs within the confines
of a crevice or not. This potential (about 200 mV SHE) happens to coincide
quite well with several other so-called "critical potentials" described in the
literature:
a) Ej, the potential reported by Nagayama and Cohen (9) for iron exposed
to a buffered borate solution (pH=8.4) above which no Fe+2 ion was detectable
in solution. It is about 200 mV SHE.
b) Ec, the criticAl potential for pitting of iron in a borate buffer
solution containing 10-1 N chloride ion (8) and is about 200 mV SHE.
c) Formation potential of y FeOOH, expected to be formed by hydrolysis
and precipitation of Fe(OH)J, at a potential of about 200 my SHE at a pH of B
(10).
d) A potential shown by Ambrose and Kruger to be about 200 mV SHE where
below this potential film growth on iron in a borate solution containing
chloride ion was the same as if chloride was not present (8). Above this
potential, however, chloride markedly affected film growth.
Of course, the fact that these potentials are remarkably similar can be
attributed to coincidence, but there are many good reasons to suppose that
tnis should not be so. One very important condition should be pointed out -
these galvanostatic oxidations were performed in a buffered solution. In
non-buffered solutions, crevice pH change would be expected to be proportional
to the total anodic current density less that partial current density beingconsumed in film growth. All things being equal, for an anodic current
transfer at 100 vA into a crevice volume of 10-1 cm3 , and assuming double
hydrolysis of ferrous ion according to:
Fe(H20)t2 l Fe(H 20)5 (OH)+l 3 Fe(H 20)4 (OH)2 ,k 1 k-2
the rate of build-up of hydrogen ions should be approximately 1 pH unit per
second. By the time film growth could be expected to begin according to
solubilit product, data, the crevice pH would be about 2, the value measured
trrstead,, state crevice corrosion of iron by Bogar and Fujii (11). The
lowering of pH would be expected to retard growth of a precipitated Fe(OH)2film. In fact, studies by Kruger and Calvert (7) for iron in borate solutionsshow this effect (Fig. 8).
-28-
If we now assume that above about 200 mV SHE the film that is formed isan Fe(III) oxide, and that to be protective it must likely be y-Fe 203 , as hasbeen suggested by many researchers (12), then all that remains between baremetal and exposure to the solution within the crevice is a thin layer ofFe(OH)2 , thinner because of retarded growth in low pH solution. This is quiteimportant, because in the presence of chloride ion, protective Fe203 does notappear to be formed, rather a non-protective y-FeOOH compound, probably as aresult of hydrolysis of Fe(OH)j and precipitation of FeOOH from solution (12).
The results thus far obtained point to the fact that in a crevice where02 has been depleted, film growth is retarded whether chloride ion is presentor not. It is during this interval of time that processes occur which, in allprobability, set the stage for propagation of crevice attack. If the rate offormation of film during this period could be accelerated, perhaps byadditions of certain substances known to act as inhibitors, then the expectedconsequence of low film growth rates might be averted. For instance, studiesby (odama and Ambrose (13) have suggested that the beneficial effect of Mo04=additions is related to the formation of an insoluble Fe4oO4 compound.Perhaps impraed resistance to localized corrosion is related to the rate offormation of such salt films. Such a possibility has been suggested by Beckin his studies of pitting on titanium (14). Studies into the effect ofalloying Mo and additions of NaMoO4 to the solution are now being performedusing the technique employed in this work.
All of the considerations just discussed that affect both the onset timeand the rate of film formation .re of importance if there exists spontaneousfilm rupture and repair in a crevice as was suggested in a previous report(5). The experiments performed here show that if film rupture does occur,then the sequence of events as described here will occur once 02 has beendepleted within the crevice. Of course, 02 will be consumed byelectrochemical reduction at a freely corroding surface as a part of theoverall corrosion reaction. Within a crevice, however, mass transportrestriction limit its replacement. Studies by Shiobara and Morioka (15) andIverson (16) point to frequent current oscillations during "incubation"periods prior to actual progation of pitting and crevice attack. Videm showedsimilar breakdown and repair transients for aluminum (17). It is likely then,that chloride ion does promote spontaneous rupture of the protective film oniron, and, that repassivatlon phenomona will be controlled by the state of thesolution when such rupture does occur. However, the important stage is thefirst one, for if film does not form, then the high metal ion concentrationand low pH conditions created here will invariably affect repassivationbehavior in any future spontaneous rupture event. It is towards elucidatingstill further the factors which influence early growth during galvanostaticoxidation that our efforts will be directed.
ACKNOWLEDGEMENT
I am grateful to the Office of Naval Research who supported this workunder Contract No. NAONR 18-69, NR 036-082.
-29-
References
1) I.L. Rosenfeld and I.K. Marshakov, Corrosion, 20, 115t (1964).
2) B.F. Brown, Corrosion, 26, 249 (1970).
3) E. i cCafferty, J. Electrochem. Soc., 121, 1007 (1974).
4) W.D. France, Jr., Crevice Corrosion of Metals, GMC Research publ.GMR-1105 (1971).
5) J. Kruger and J.R. Amrose, National Bureau of Standards Report do.NIBSIR 74-583, Technical Summary Report Number 5, Contract HAOUiR 18-69,NR 036-083 (1974).
6) V. Brusic, M.A. Genshaw, and B.D. Cahan, Appl. Optics, 9, 1634 (1970).
7) J. Kruger and J.P. Calvert, J. Llectrochem. Soc., 114, 43 (1967).
6) J.R. Ambrose and J. Kruger, Proc. Fourth Intl. Cong. on Met. Corr.,A.E. Hamner, Ed., Amsterdam, 1969 (NACL, Houston, 1972), p. 698.
9) M. Nagayama and M. Cohen, J. Electrochem. Soc., 109, 781 (1962).
10) N. Pourbaix, Atlas of Electrochemical Equilibria in Aqueous Solutions,CEHIELCOR (Pergamon, London, 1966), p. 312.
11) F.U. Bogar and C.T. Fujii, Naval Research Laboratory Report 14o. 7690,RR 022-08-44-5513, 1974.
12) C.L. Foley, J. Kruger, and C.J. Bechtoldt, J. Electrochem. Soc. 114,994 (1967).
13) T. Kodama and J.R. Ambrose, National Bureau of Standards Report inprint, Technical Summary Report No. 6, 1975.
14) T.R. Beck, "The Occurrence of Salt Films during Initial Stages ofTitanium Corrosion", presented at Electrochemical Society NationalMeeting, Dallas, October, 1975.
15) K. Shiobara and S. Morioka, J. Jap. Inst. Met., 36, 335 (1972).
16) W.P. Iverson, J. Electrochem. Soc., 115, 617 (1968).
17) K. Videm, The Llectrochemistry of Uniform Corrosion and Pitting ofAluminum, Icjeller Report 1974.
16) R.T. Foley, "The Role of Chloride Ion in Corrosion - Part II", finalreport, OjB, Contract eooo4-66-C-0025, The American University,Washington, J.C. (1969).
-30-
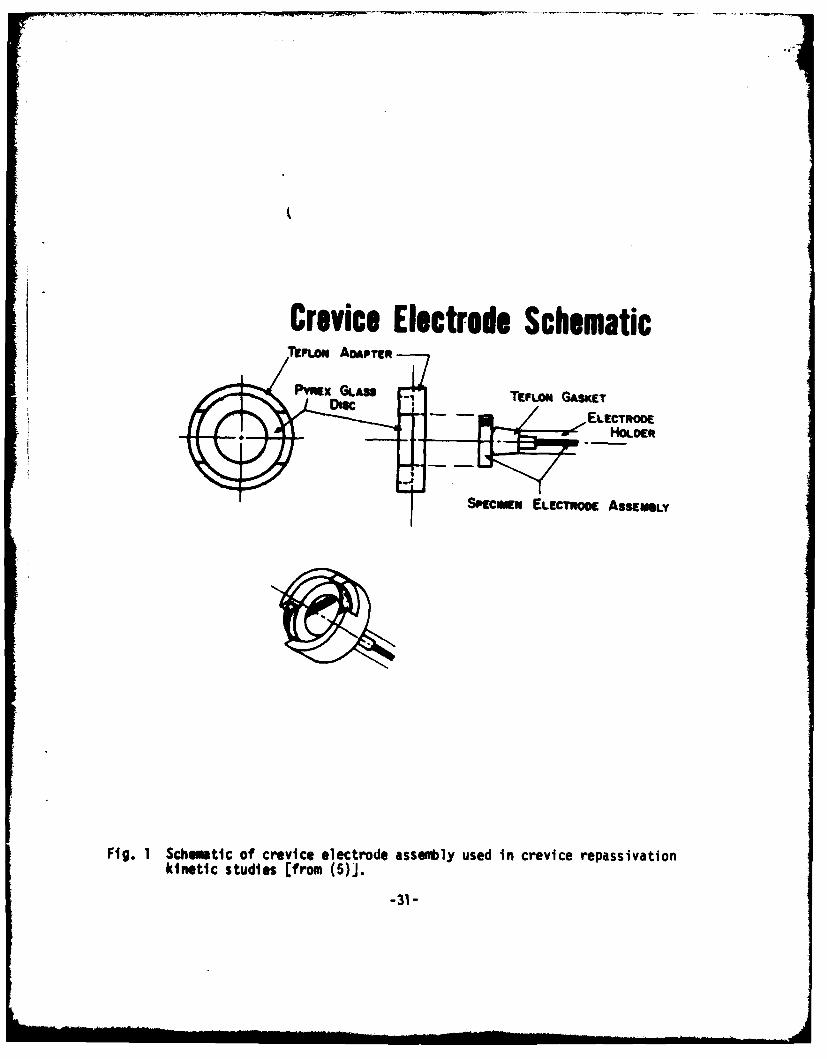
Crevice Electrode SchematicrFLom ADAPTER
S~gcucu ELECTRODE s~i
Fig. 1 Schuwmtic of crevice electrode assembl1y used in crevice repassivationkinetic studies (from (5)].
-31-

Fig. 2 Photograph of crevice electrode assembly positioned for repassivation
measurements.
-32-

r
E
0.2 nm
I minute
Fig. 3 Film growth and anodic current as measured during a potentiodynamicscan. The experiment was performed using iron exposed to boratebuffer solution without a crevice and the potential was driven from-758 mV SHE to 1242 mV SIl at a scan rate of 1000 mV/min.
-33-
L_

0 J 0.2
I I
I minute
Fig. 4 Film growth and anodic current as measured during a potentiodynamicscan. The experiment was performed using iron exposed to boratebuffer solution inside a crevice and the potential was driven from-758 mV SHL to 1242 mV SHE at a scan rate of 1000 mV/min.
-34-
Iron Sodkum tetroborne -bor ic d pH 8.4 pH -nosUtoxidtion+0.1 mA
1
IGOSECONDS
Fig. 5. Galvanostatic oxidation of iron at 100 uA (33 UA/cm2) from -758 mV to+1242 mV SHE both within (circles) and without (triangles) a crevice.Log film growth in nm is plotted vs. log time in seconds. The solutionis the borate buffer (pH = 8.4).
-35-
M illI , . .
I+ 100 ,kA+ 200 pA
1.0
EC
01
10 100
Time, s
Fig. 6. Galvanostatic oxidation of iron at 100 ~Aand 200 jiA (33 and 67 PA/cm2)from -158 mV to +1242 mV SHE within a crevice. Log film growth innm is plotted vs. log time in seconds. The solution is the uoratebuffer (pH = 8.4).
-36-
10.0 I
Crevice Iron sodium tetroborate- boric acid pH 8.4 no ci-Galvanostatic oxidation+ 0.1 mA
C1-
1.0
E/
0.1
.0110 100 1000
SECONDS
Fig. 7. Galvanostati, oxidation of iron at 100 mA (33 pA/cm2 ) from -758 mY to+642 mV in a borate buffer (pH = 8.4) - 0.01 N NaCI solution with acrevice as compared to galvanostatic oxidation of iron with a crevicebut no chloride ions present (Fig. 5.)
-37-
.. . . I -M, w - , -
PART II I'Tc appear in the proceedings of the Japanese-American Symposium on
"Pass vtty 0nd its Breakdown on Iron and Iron Base Alloys" which will bepublished by N.A.C.E. in January 1976).
Chemical Breakdown of Passivity
Jerome KrugerNational Bureau of StandardsWashington, D.C. 20234
"By gnawitig through a dyke even a rat may drown a nation'-E. Burke
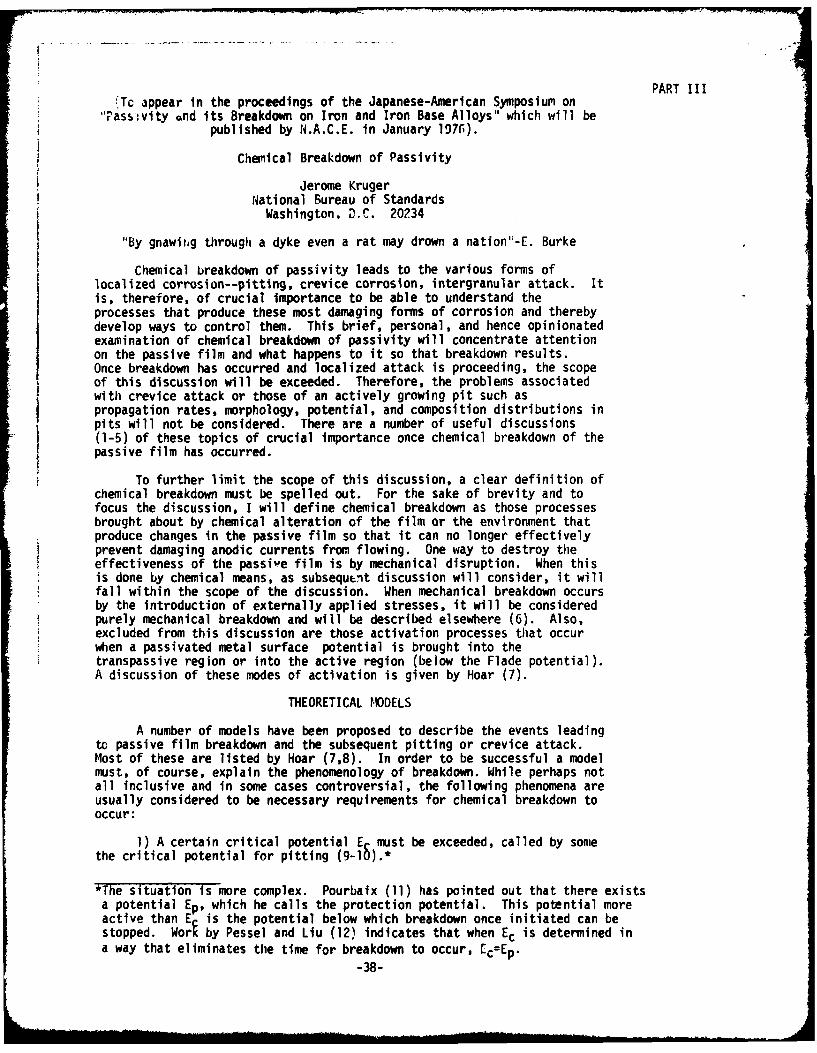
Chemical breakdown of passivity leads to the various forms oflocalized corrosion--pitting, crevice corrosion, intergranular attack. Itis, therefore, of crucial importance to be able to understand theprocesses that produce these most damaging forms of corrosion and therebydevelop ways to control them. This brief, personal, and hence opinionatedexamination of chemical breakdown of passivity will concentrate attentionon the passive film and what happens to it so that breakdown results.Once breakdown has occurred and localized attack is proceeding, the scopeof this discussion will be exceeded. Therefore, the problems associatedwith crevice attack or those of an actively growing pit such aspropagation rates, morphology, potential, and composition distributions inpits will not be considered. There are a number of useful discussions
(1-5) of these topics of crucial importance once chemical breakdown of thepassive film has occurred.
To further limit the scope of this discussion, a clear definition ofchemical breakdown must be spelled out. For the sake of brevity and tofocus the discussion, I will define chemical breakdown as those processesbrought about by chemical alteration of the film or the environment thatproduce changes in the passive film so that it can no longer effectivelyprevent damaging anodic currents from flowing. One way to destroy theeffectiveness of the passive film is by mechanical disruption. When thisis done by chemical means, as subsequtnt discussion will consider, it willfall within the scope of the discussion. When mechanical breakdown occursby the introduction of externally applied stresses, it will be consideredpurely mechanical breakdown and will be described elsewhere (6). Also,excluded from this discussion are those activation processes that occurwhen a passivated metal surface potential is brought into thetranspassive region or into the active region (below the Flade potential).A discussion of these modes of activation is given by Hoar (7).
THEORETICAL MODELS
A number of models have been proposed to describe the events leadingto passive film breakdown and the subsequent pitting or crevice attack.Most of these are listed by Hoar (7,8). In order to be successful a modelmust, of course, explain the phenomenology of breakdown. While perhaps notall inclusive and in some cases controversial, the following phenomena areusually considered to be necessary requirements for chemical breakdown tooccur:
1) A certain critical potential E, must be exceeded, called by somethe critical potential for pitting (9-l).*
*The situation is more complex. Pourbaix (11) has pointed out that there existsa potential Eo , which he calls the protection potential. This potential moreactive than E is the potential below which breakdown once initiated can bestopped. Wore by Pessel and Liu (12) indicates that when Ec is determined ina way that eliminates the time for breakdown to occur, CcEp.
-38-
2) Damaging species (Cl or the higher atomic weight halides) are neededto initiate and propagate breakdown.
3) There exists an induction time separating the initiation of thebreakdown processes by the introduction of conditions conducive to breakdownand the completion of the process when pitting or crevice attack commences.
4) Breakdown occurs at highly localized sites.
The models for breakdown that must satisfy the above requirements can bedivided into three groups: 1) adsorbed ion displacement, 2) ion migration orpenetration, and 3) chemico-mechanical. As Hoar (8) has pointed out there arecommon elements in all of the models, and if a true model for breakdown isever achieved, it probably will contain elements of all three groups. Theindividual groups will be discussed in terms of how well they satisfy thephenomenological requi rements.
1) Adsorbed ion displacement models
Two mechanisms have been suggested under this general model. First,there is the mechanism suggested by Kolotyrkin (13) and Uhlig (14,15). Thismodel considers the passive film to be an adsorbed film (probably a monolayer)of oxygen. Breakdown occurs when a more strongly adsorbing damaging anion (Iwill use tne chloride ion which is highly polarizable and hence capable ofadsorption) displaces the oxygen forming the passive film. Once the Cl ionis adsorbed at the surface, breakdown commences. When other anions arepresent they can compete with the Cl- for sites and inhibit breakdown (14,15).Uirect evidence that this occurs has been provided by Rozenfeld andMaksimchuck (18) using radioactive Cl'. The model explains the criticalpitting potential as that potential above which Cl" adsorbs on the surfaceunder consideration. The effectiveness of ions such as Cl" in promotingbreakdown is explained by their being more readily adsorbed than oxygen in thecompetition for surface sites. The effect of damaging ion concentration oninduction times can perhaps be explained by this mechanism, but such importantinfluences on induction time as thickness of the passive film (16) and heattreatment of the passive film (16,17) can not be readily accounted for by thismodel. Finally, this mechanism is consistent with localized attack sinceadsorbed ion displacement will probably occur at discrete sites, defects,inclusions, etc., where displacement may be more likely.
The second model that can be considered as falling under the generalheading of an adsorbed ion displacement model is that described by Hoar andJacob (8). It has, however, elements in common with the ion migration modelsalso. In this model a small number (3 or 4) of halide ions jointly adsorb onthe surface of the passive film around a lattice cation. The probability offormation of such a high energy complex is small and thus requires a highactivation energy for formation. Once formed, however, the halide ions willreadily remove the cation from the passive film lattice (this model assumes athree dimensional passive film). The film is thus made thinner at the sitewhere the complex first formed and the stronger anodic field at the thinnedsite will rapidly pull another cation through, where it will meet more halideions, complex with them and thereby enter the solution. Thus, once started,the passive film is locally thinned and breakdown proceeds, using Hoar's word"explosively".
-39-
rThis model like the Uhlig one requires a critical potential where
adsorption takes place. It also requires strongly adsorbing anions. Becauseof the difficulty of forming the transitional complex, an induction time isrequired, and in fact it was developed to explain the dependence of theinduction time on CI" concentration, temperature, and potential. Also, it isconsistent with the localized nature of breakdown. This model does not appearto be applicable to all systems because Ambrose and Kruger (17) have shownthat incorporation of Cl in the passive film lattice rather than theformation of a complex on the outside of the film accelerates breakdown forpassivated ion. Hoar (19) has also found that the proper functionaldependence of induction time with temperature found for stainless steel, whichwas the basis for his model, does not hold for iron where he proposes apenetration model.
2).Ion migration or penetration models
The theoretical models that can be grouped under this heading allrequire the penetration of damaging anions through the passive film, thebreakdown process being complete when the anion reaches the metal-filminterface. Host of these models consider the passive film to be threedimensional. The models differ widely, however, in the mode of penetration.
At one extreme is a model that is quite old and was suggested by Evans(20) and co-workers. More recently, Richardson and Wood (21,22) have revisedthe pore mechanism and conclude that breakdown of the passive film does notoccur at all because there always exist pores or defects in the film thatallow instantaneous penetration and hence instant localized corrosion. Oneconsequence of this is that there is no induction time for the breakdownprocesses to take place because there are no breakdown processes. Richardsonand Wood account for incubation by asserting that during the beginning stagesof pitting the currents are so low at the small bare metal sites that itappears the pitting has not been initiated, although it actually has beengoing on from the instant that the surface was exposed to damaging anions. Inthis way it satisfies the phenomenological requirement for the existence of aninduction period. The other phenomena this model must contain are alsosatisfied. Thus, since the pores, bare or "weak spots", are discrete sites,attack will be localized. The critical potential is the potential foradsorption at the bare metal at the base of the pores, and the role of thedamaging anion is the same, and as mysterious, as it is for the other models.
At the other extreme of the types of penetration models are those models
involving migration of the damaging anion through a lattice, via defects, orvia some sort of ion exchange process. The processes which involve ionmigration in a lattice can occur in a variety of ways. Hoar et al (23)suggest anion entry without exchange to produce "contaminated" passive films.The site where this occurs becomes a path of high conductivity where highcation currents and hence the initiation of pitting are possible. Pryor andco-workers (24,25) also propose the production of an anion contaminated filmbut suggest that cation vacancies are created which lower ionic conductivityand promote breakdown. Another ion migration scheme can involve exchange of0- or OH with the damaging anion (16). Eq. 1 shows that such a process can
-40-
also create anion vacancies that will further enhance the migration ofdamaging anions to the film metal interface.
CI solution +0= + 2 OH lattice= Cl lattice + 2 DOH" + 2 OH'solution [l]
The anion lattice migration models have no difficulty in satisfying thephenomenology of breakdown. The critical potential is, as with all themodels, the potential required for adsorption, although in this case it is onthe outer interface of the passive film. The induction time is the timerequired for the migration of the damaging anion through the passive film, andsince this migration may be via discrete defects the localized nature ofbreakdown would be expected. The special role of certain damaging anions isnot accounted for any better than it is by the other models thus farconsidered.
3) Chemico-mechanical models
This group of theoretical models which involves chemically inducedmechanical disruption of the passive film is perhaps the newest. One versionwas briefly described by Hoar (7). He postulated that the adsorption of adamaging anion on the surface of the passive film lowers the interfacialsurface tension (surface free energy) at the solution interface until'peptization" occurs. This "peptization" results from the mutual repulsion ofthe adsorbed anions. When the repulsive forces are sufficient, the passivefilm cracks and damaging anions can attack the metal exposed.
Sato (26) has extended this concept of chemical-mechanical breakdown byproviding a more detailed examination of the model. He has suggested thathigh fields could lead to mechanical rupture of thin films by electrostrictionpressures exceeding the compressive fracture strengths of the film. Theso-called film pressure this generates is given by:
E(E-l)E 2 [2)P'Po = 871 L 2
where p = film pressurePo = atmospheric pressurec = film dielectric constantE - electric fieldy = surface tensionL = film thickness
It is possible that those ions considered to be "aggressive" inpromoting localized corrosion attack increase film pressure by decreasing thesurface tension term in equation [2] through adsorption. Unlike the othertheories we have considered, this theory does not consider the criticalpotential for breakdown to be related primarily to adsorption but instead tobe the "critical potential above which the film pressure exceeds the criticalcompressive stress of film breakdown."(26) Also, this model differs from theother models described in that, although as with the others the special role
-41-
of aggressive anions such as chloride is not clear, this model goes furtherand would appear to rule out any special role at all. This is so because zerocharge potentials are similar on mercury and probably are likewise similar onoxides as well (27). The existence of an induction period is also difficultto explain using the mechanical breakdown model. Finally, the localizednature of attack is consistent with the model if one mode of breakdowninvolves rupture at discrete sites as Sato does suggest.
Sato points out in his description of his mechanical breakdown theorythat whether a pit nucleates or dies depends not only on breakdown but alsoon film reformation. This concept, the interplay between breakdown andrepair, underlies the last model of the chemico- mechanical group to bediscussed. Videm (28) has recently proposed that it is the interplay betweenthe breakdown (although he does not specifically say so, this could bePechanical as Sato has suggested) and repassivation that determines whether apassive film will suffer permanent breakdown that leads to pitting. Videmproposes that the critical pitting potential is determined by the relativerates of breakdown and repassivation. Another very recent variation ofdynamic breakdown-repair and theory is that of Ambrose and Kruger (29). Itdiffers from Videm in that it supplies more details about the breakdownprocess. It proposes that breakdown results from penetration by theaggressive anion to the metal-film interface where localized film rupturecould be affected by promoting formation there of pockets of non-protectivelow density material similar to that produced as a corrosion product duringactive pit growth. As the pockets expand upon contiiuing formation at themetal-oxide interface, further stress is placed on the film directly atop thepockets, eventually resulting in fracture of the film. In iron, for instance,this low density naterial was identified as y-FeOOH (30). The special role ofthe aggressive anions is that they influence the rate of repassivation.Recent direct measurements of repassivation (31,32) have verified this. Thecritical potential can influence a number of factors, adsorption of theaggressive anion as in other mechanisms, the rate of repassivation, and themechanical properties of the film. The mechanism supports the existence of aninduction period because penetration of anions, a time dependent step, isinvolved. Finally, because penetration is part of the model, the attack wouldbe expected to occur at discrete sites.
INITIATION PROCESSES
It is evident from the discussion of the various theoretical models thateven some of the widely different models have elements in common. Forexample, virtually all of them require the existence of an adsorption step.There is, however, a high probability that no one model is applicable to allsystems. Thus, it will be very difficult to match experimental results tomodels in an orderly way. Instead, my approach will be to select only a fewresults described in the literature to emphasize contrasting points of view.It is anticipated that by doing so a clearer definition of the problems willbe achieved and experimental work will be stimulated to provide new insights.
In conformity with the scope described earlier the discussion of thekinetics of the initiation process will confine itself to the induction periodthat leads to breakdown and active pitting. The role of potential will thenbe considered. Finally, a brief discussion of the influence of alloy
-42-
composition, structure and environmental factors as they affect the initiation
process will be given.
Kinetics of Initiation--The Induction Period
The only kinetics that need to be considered in chemical breakdown, asdefined earlier, are the kinetics of the processes occurring during theinduction or incubation period that takes place prior to the significantincrease in current that marks the onset of pitting or crevice attack. Anumber of conflicting ideas, experiments, and explanations of theseexperiments exist to explain this induction period. Three representativegroups will be described. A representative from the group of experiments suchas those of Uhlig (14,15) and Rozenfeld (18) which use the competitiveadsorption model for interpretation is not included because no inductionperiods were reported.
a) Mechano-Chemical Breakdown - A very extensive study of the breakdownon pure Al has been made by Videm (28). His main conclusions were as follows:
1) He found, as Bogar and Foley (33) had also shown for an Al alloy,that above Ec there exists an incubation period before pitting starts, whenCl- is added to solution containing a filmed Al surface. The induction timedecreased exponentially with potential and a ten-fold increase in chlorideconcentration reduced the time to initiate a pit by a similar factor.
2) Because he could not detect Cl by autoradiography, except at siteswhere pitting attack had taken place, and because he could not detectimpedance changes after Cl soaking, lie concluded that theories for initiationof pitting of Al requiring contamination of oxide films [see (25)] by gradualchloride pick-up and subsequent change in conductivity are not valid.
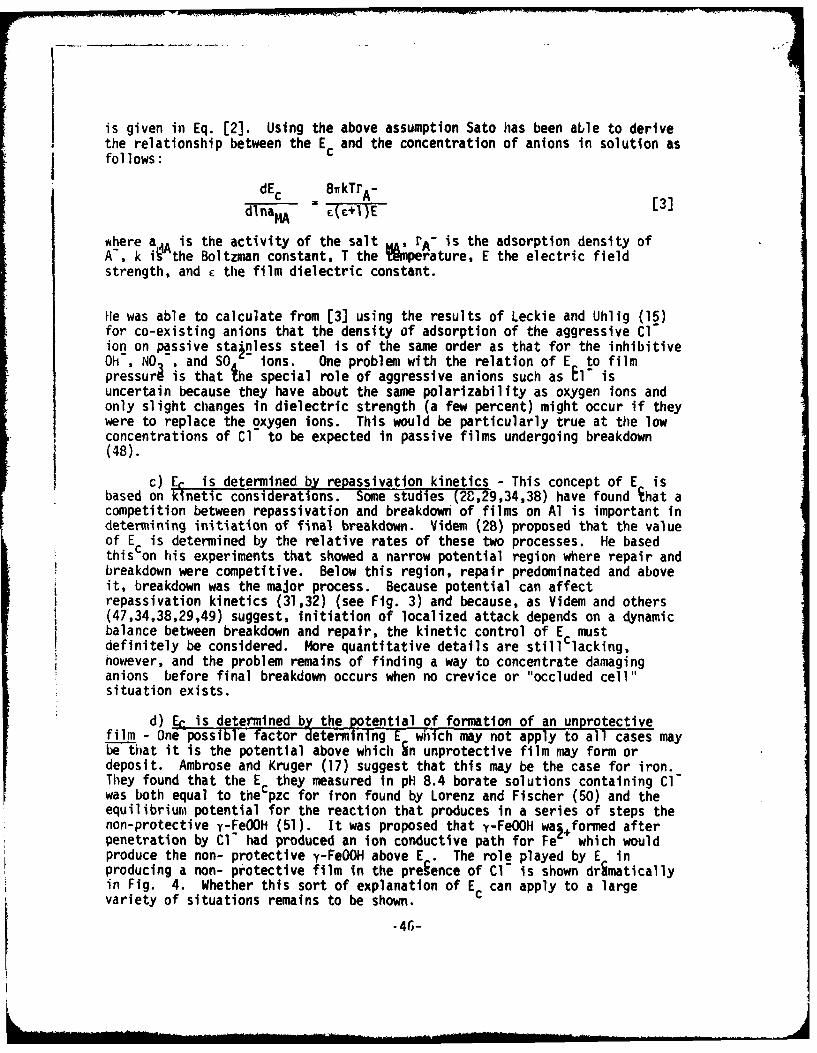
3) He was able to measure regular current pulses during anodicpolarization which he ascribed to the development of local defects isee Fig.1). The pulses were found both with and without the presence of Cl in theexperimental solution, but the nature of the pulses changed markedly andabruptly when pitting was initiated at the end of the induction period. Thisresult led Viden to conclude that the Richardson and Woods (21) suggestionthat there is no pit initiation step because pitting starts immediately atsmall flaws in the passive film is invalid.
4) The role of the chloride is not promoting breakdown per se, but inpreventing repair during a dynamic breakdown-repair type of mechanism.Similar conclusions were reached for Al by Zahavi and Metzger (34).
These results of Videm's thus point to a non-penetration dynamicbreakdown and repair theory. It does not explain, however, how a systempredisposed to pit reaches the stage where there is sufficient chlorideavailable at the initiation sites to stop repassivation effectively. Forcrevice attack where the crevice helps concentrate Cl', his results would beunderstandable.* In the absence of a crevice, however, it is difficult to see
*Wilde's (4) admonition that the kinetics of pitting corrosion and crevicecorrosion are different and that one must disentagle the two to assesssusceptibility to localized attack is pertinent to this point.
-43-
why at some definite time prior to pitting the Cf" ions should suddenly startto prevent repassivation unless they concentrate in the film or somehowlocally in the environment.
b) Transitional complex formation - An experimental representative ofthis group is that of t!o. r and Jacob (8). Their model has been describedearlier. Their experimental data for austenitic stainless steel showed thatli/, where T is the induction period, was an approximate measure of the rateof breakdown. A plot of log T vs. log C - showed that the breakdown rate isproportional to the n-th power of Ce - wil; n having values between 2.5 and4.5. They found an activation energy of 60 k/mole and T to be dependent onpotential. Their interpretation of the values found for n was that 2.5 to 4.5halide ions form a "transitional complex" which once formed (because of thehigh activation energy, a difficult and seldom event) will proceed to breakdown the film in the way described in the section on models. Because of thehigh activation energy and the requirement for 2.5 to 4.5 halide ions to forma complex, Hoar and Jacob rule out an ion migration model for stainless steel.However, for other systems their model may not be valid. For example, Engelland Stolica (36) found a value of 1 for n for mild steel, and the inductiontime potential independent. This could mean a penetration model whereindividual aggressive anions were penetrating independently of each other.Foster and Hoar (19) and also Ambrose and Kruger (17) propose a penetrationmodel for the passive film on iron. Other values of n have, however, beenfound. For Al Bogar and Foley (33) found values of n between 4 and 11 whileVidem found a value of 2. Obviously, one must be careful in using a simpleinterpretation such as Hoar's and Jacob's to explain the meaning of n.
c) Penetration - All of the penetration models explain in a very directway the existence of an induction period. This period is the time requiredfor the damaging anion to travel through the passive film. An experimentdirected at providing a test of this idea was given by IcBee and Kruger(16) who measured the time to breakdown as a function of passive filmthickness. As Fig. 2 shows the thicker the passive film, the longer the timeto breakdown. Unfortunately as Fig. 2 also shows they were not able toestablish a functional relation between thickness and breakdown time, sincethree functional relationships fitted the data equally well. To further showthat penetration is involved in the breakdown of the passive film on iron,Ambrose and Kruger (17) showed that by removing part of the passive film bycathodic reduction and then regrowing the film in the presence of Cf" onecould repassivate, but the time for breakdown was shortened. They interpretedthis as evidence for the penetration model because the regrowth stepincorporated Cl" ions. These ions therefore had a shorter distance topenetrate, and the time for breakdown was shortened. Finally, Ambrose andKruger showed that annealing the passivt. film on iron at 65°C for one hour andthen bringing the system back to room temperature increased the induction timeover 100-fold. Therefore, they reasoned the defects in the film wherebypenetration proceeds were removed by the annealing. Similar results for Tawere found by Vermilyea (37), but opposite results were found for stainlesssteels by Okamoto (38)* (annealing shortened the induction time). These
*If the films on stainless steel are amorphous [see (39)], the annealing couldhave caused crystallization producing more diffusion paths. On the other hand,if the films are crystalline, annealing could destroy diffusion paths by graingrowth and destruction of lattice vacancies.
-44-

results plus others (17,38) which show that longer passive film growth timeslengthen the induction period, do not rule out the transitional complex modelbecause the production or reduction of defects in the film can also beeffected on the film surfaces and thereby affect the adsorption of damaginganions at that surface.
Two main experimental problems exist for the penetration model.First, micro breakdown events (see 28,40) as indicated by small current orpotential pulses (Fig. 1) may continuously exist throughout the inductionperiod. If so why is penetration needed? There exists contradictory evidenceof Cl entry into the film lattice. Ellipsometric spectroscopy (16),impedance measurements (24,41), and autoradiography (42) have indicatedgradual Cl- entry. Other work, however, using autoradiography (28) andimpedance measurements (28,43) show no C1 up-take by the film.
. Critical Potential for Breakdown
There are vast numbers of experiments and discussions in the literatureon the factors or underlying causes of the existence of a critical potentialfor breakdown, E . I will avoid a discussion of its practical significance(see 25,35,11) mithods of measurement (see 44,12) and I will detail brieflyonly those ideas or findings that relate to its role in initiation ofbreakdown. An incomplete listing of different explanations of the origin ofE c follows:
a) Er determined by potential of zero charge - Almost all of the modelsrequire as their first step the adsorption of damaging anions. Roughly, thepotential above which such adsorption takes place is the potential of zerocharge (pzc). Thus, since the adsorbed ion displacement models require thedamaging anion to adsorb and thereby displace the ions forming the passivefilm, such an explanation of E would be reasonable, and the effect of suchvariables as the nature of the kletal, concentration of anions, and temperatureall affect E and pzc (see 45,46). The transition complex model also coulduse the relation of pzc to E , not for a bare metal but for the passivefilm-solution interface. Likewise, for the penetration models, Ambrose andKruger (17) have suggested the relationship of pzc to E . Because it isdifficult to measure the pzc for solid electrodes (45) ispecially whenadsorption may coincide with the initiation of breakdown processes, there havebeen no good experimental verifications that E is related to the pzc.Galvele (47) has pointed out that E and pzc my be related if Ec is thepotential to initiate pitting, but Ehey are not related if Ec is the potentialto maintain pitting.
A major problem with relating pzc to E is that the pzc for many anions,both aggressive and non-aggressive alike, ari similar on mercury and probablyare similar on oxides as well (27).
b) Er determined by film pressure to fracture film - Sato (26) hasidentified E with the critical potential above which the film pressureexceeds the Eritical compressive stress of film mechanical breakdown. Thefilm pressure, p, resulting from both electrostriction and interfacial effects
-45-
is given in Eq. [2]. Using the above assumption Sato has been able to derivethe relationship between the Ec and the concentration of anions in solution asfollows:
dEc 8wkTrA-
dlnar 4 - E [3]
where a is the activity of the salt M, rA" is the adsorption density ofA-, k i the Boltzman constant, T the 'Nmperature, E the electric fieldstrength, and c the film dielectric constant.
fie was able to calculate from [3] using the results of Leckie and Uhlig (15)for co-existing anions that the density of adsorption of the aggressive Clion on passive stainless steel is of the same order as that for the inhibitiveOh ; NO - and SO ions. One problem with the relation of E to filmpressuri is that the special role of aggressive anions such as El isuncertain because they have about the same polarizability as oxygen ions andonly slight changes in dielectric strength (a few percent) might occur if theywere to replace the oxygen ions. This would be particularly true at the lowconcentrations of Cl to be expected in passive films undergoing breakdown(48).
c) E is determined by repassivation kinetics - This concept of E isbased on kinetic considerations. Some studies (2C,29,34,38) have found ihat acompetition between repassivation and breakdown of films on Al is important indetermining initiation of final breakdown. Videm (28) proposed that the valueof Ec is determined by the relative rates of these two processes. He basedthis on his experiments that showed a narrow potential region where repair andbreakdown were competitive. Below this region, repair predominated and aboveit, breakdown was the major process. Because potential can affectrepassivation kinetics (31,32) (see Fig. 3) and because, as Videm and others(47,34,38,29,49) suggest, initiation of localized attack depends on a dynamicbalance between breakdown and repair, the kinetic control of Ec mustdefinitely be considered. More quantitative details are still lacking,however, and the problem remains of finding a way to concentrate damaginganions before final breakdown occurs when no crevice or "occluded cell"situation exists.
d) Ec is determined by the potential of formation of an unprotectivefilm - One possible factor determining E which may not apply to all cases maybethat it is the potential above which in unprotective film may form ordeposit. Ambrose and Kruger (17) suggest that this may be the case for iron.They found that the Ec they measured in pH 8.4 borate solutions containing Clwas both equal to the pzc for iron found by Lorenz and Fischer (50) and theequilibrium potential for the reaction that produces in a series of steps thenon-protective y-FeOOH (51). It was proposed that y-FeOOH wa;.formed afterpenetration by C1" had produced an ion conductive path for Fe' which wouldproduce the non- protective y-FeOOH above E_. The role played by E inproducing a non- protective film in the preience of Cl" is shown drAmaticallyin Fig. 4. Whether this sort of explanation of E can apply to a largevariety of situations remains to be shown.
.46-

Alloy Composition, Structure, and Environmental Factors
It is not possible within a limited space to discuss the many complexand contradictory results concerned with the effect of alloy composition andstructure and environmental factors that influence breakdown initiationprocesses. Two excellent reviews have been given by Smialowska (1,2). Instead,I will describe briefly how some of these factors relate to the theoreticalmodels for breakdown.
1) Alloy composition
Kolotyrkin (3) points out in his review of pitting that the tendencyto breakdown decreases with an increase in the content of N, Ni, Cr, andMo, especially for the latter two. The main effect of these beneficialalloying elements is to shift Ec in a noble direction. This explainsphenomenologically why they are beneficial but does not actually tell ushow they work. One way in which they can retard initiation processes isby producing a passive film that is more difficult to penetrate because itprovides fewer diffusion paths. Hoar (51) has suggested that some ofthese beneficial alloying elements can do this by producing amorphous(glassy) films. McBee and Kruger (39) have found experimental evidencefor this when Cr is added to Fe and also have found reduced rates ofpenetration (52). Another way, however, in which these alloying elementscan affect breakdown is by affecting repassivation kinetics. Thus, Mowhich has not been found in the films on alloys containing it (53), isknown to be beneficial in retarding breakdown. Measurements by Ambroseand Kruger (29) indicate that its addition to an alloy does, however,increase the rate of repassivation, perhaps by its entrance into theenvironment.
2) Alloy structure
Only the surface structure of alloys will be considered here. Threekinds of possible variations in surface structure have been studied.First, Kruger has looked at the role of crystallographic orientation onbreakdown tendency for iron (54.) As Fig. 5 shows, the tendency topit goes up as the surface approaches the {llO} orientation. He alsofound that pitting density varied with crystallographic orientation (55).Another example is the single crystal work by Smialowska and colleagues(56,57) on Fe-16 Cr. They found that nucleation occurred at crystal sub-boundaries as well as at other sites where there were not necessarily anymetal inhomogenieties.
The second surface variation can occur by the introduction ofdefects by abrasion, cold work or other deformation processes.Contradictory results have been found. Thus, Rozenfeld (58) found thatremoving cold work by annealing an 18 Cr-9 Ni-Ti steel increased thenumber of pits while Randak and Trautes (59) found that cold workincreased the number of breakdown sites for an 18 Cr-8 Ni steel.
Finally, surface heterogenieties play a big role in initiatingbreakdown. Smialowska and co-workers (57,60,61) have found extensiveevidence for the nucleation of pits at inclusions such as sulfides or
-47-
...m. .. .-m mm| |m--m==== =

chromium oxide for a number of alloys. Bond and co-workers (62) showedthat very small amounts of segregated metallic impurities in quite purealuminum single crystals could produce breakdown nucleation sites.
The obvious, but sometimes contradictory, effect of surfacestructure or breakdown can be explained by all the theoretical modelsdiscussed because it is reasonable to expect adsorption, penetration,complex formation, or repassivatlon kinetics to be affected by surfaceheterogenieties.
3) Environmental factors
These factors can include solution composition (including pH) andtemperature. There are large numbers of experiments in the literature(see 1,3) and the results are contradictory. Generally, however,breakdown tendency increases with temperature and concentration ofdamaging anions while it is not strongly dependent on pl (63). The natureof the anions in solution play a large role (15) especially if competitiveanion adsorption situations are possible. There is some controversy as towhat consitutes a damaging anion. Thus, Hoar (7) considers the CIO- ionas damaging as C1- whereas Uhlig has fournd it to be inhibitory (15, 8 ).With regard to models, again all models will depend on environmentalconsiderations. A detailed examination of how all the various andcontradictory results in the literature best fit the various models isoutside the scope of this discussion.
CRITICAL QUESTIONS
Based on the foregoing discussion the following non-inclusive list ofcritical questions can be posed:
1) What makes a damaging anion damaging?
2) What happens when a damaging anion reaches an expoded metal surface?
3) Are the values obtained for induction times consistent with any ofthe penetration models?
4) How does the damaging anion concentration build up during thebreakdown of uncovered (non-creviced) surfaces before corrosion productsform?
5) Is the pzc always related to Ec?
6) Does te effect of alloying on breakdown show itself by alteringthe nature of the film, the environment, or the exposed metal surface?
7) What is the role of repassivation in breakdown?
8) Are significant changes in film pressure affected by damaging anions?
-48-

9) Are the pulses observed for some passive surfaces related to
breakdown and repassivatton events?
ACKNOWLEDGEMENT
I am grateful to the Office of Naval Research, which supported thiswork under contract NAONR 18-89 NRO 36-082. I also wish to acknowledgemany stimulating and helpful discussions with Dr. John R. Ambrose, whosework has served as a basis for many of the ideas presented here.
-49-

REFERENCES
1) Z. Szklarska-Smialowska, Corrosion, 27, 223 (1971).
2) Z. Sklarska-Smialowska, "Localized Corrosion," Staehle, Brown,Kruger, and Agrawal, Editors, National Ass. Corr. Eng., Houston,p. 312 (1974).
3) Ya.M. Kolotyrkin, Corrosion, 19 261 (1963).
4) P. Forchhammer and H. J. Engell, Waksoff u. Korr., 20, 1 (1969).
5) W. Schwenk, Corrosion, 20, 1291 (1964).
6) R. W. Staehle - Paper on mechanical breakdown presented at Japanese-American Conference on Passivity, Honolulu (1975).
7) T. P. Hoar, Corrosion Science, 7, 355 (1967).
8) T. P. Hoar and W. R. Jacob, Nature, 216, 1299 (1967).
9) M. Pourbaix, L. Kleinzack-Mathieu Cl. Mertens, J. Meunier, Cl. Vanlengenhaghe,L. de Munck, L. Laureys, L. N. Nellmans, and M. Warzu, Corrosion Science,3, 239 (1963).
10) H. Kaesche, Z. physik Chem., N.F., 34, 87 (1962).
11) M. Pourbaix, Ref. 2, p. 12.
12) N. Pessall and C. Liu, Electrochemica Acta, 16, 1987 (1971).
13) Ya.M. Kolotyrkin, J. Electrochem. Soc., 108, 209 (1961).
14) H. Bohni and H. H. Uhig, J. Electrochem. Soc., 116, 906 (1969).
15) H. P. Leckie and H. H. Uhlig, J. Electrochem. Soc., 113, 1262 (1966).
16) C. L. McBee and J. Kruger, Ref. 2, p. 252.
17) J. R. Ambrose and J. Kruger, Proc. 4th Int. Cong. on Metallic Corrosion,NACE, Houston, p. 698 (1972).
18) I. L. Rozenfeld and V. K. Ilaksimchuk, Z. Physik Chem., 215, 25 (1960).
19) T. P. Hoar and D. J. Foster, quoted in Ref. 2, p. 114.
20) V. R. Evans, L. C. Bannister and S. C. Britton, Proc. Roy. Soc., A131,367 (1931).
21) J. A. Richardson and G. C. Wood, J. Electrochem. Soc., 120, 193 (1973).
-50-

22) J. A. Richardson and G. C. Wood, Corrosion Science, 10, 313 (1970).
23) T. P. Hoar, D. I. Mears, and G. P. Rothwell, Corrosion Science, 5, 279(1965).
24) M. A. leine, D. S. Keir, and M. S. Pryor, J. Electrochem. Soc., 112, 29(1965).
25) M. J. Pryor, Ref. 2, P. 2.
26) N. Sato, Electrochemica Acta, 19, 1683 (1971).
27) P. Delahay, "Double Layer and Electrode Kinetics," Interscience, NewYork, p. 23 (1965).
28) K. Videm, Kieller Report KR-149, Institutt for Atomenergi, KjellerNorway (1974).
29) J. Kruger and J. R. Ambrose, NBS Report NBSIR 74-583, September (1974).
30) C. L. Foley, J. Kruger, and C. J. Bechtoldt, J. Electrochem. Soc., 114,994 (1967).
31) J. R. Ambrose and J. Kruger, Proc. 5th Int. Cong. on Metallic Corr.,NACE, Houston, p. 406.
32) J. R. Ambrose and J. Kruger, J. Electrochem. Soc., 121, 599 (1974).
33) F. D. Bogar and R. T. Foley, J. Electrochem. Soc., 119, 462 (1962).
34) J. Zahavi and M. Metzger, Ref. 2 p. 547.
35) B. E. Wilde, Ref. 2, p. 342.
36) H. Engell and N. Stolica, Z. Physik Chem., N.F., 20, 113 (1959).
37) 0. A. Vermilyea, J. Electrochem. Soc., 104, 485 (1957).
38) G. Okamoto, Corrosion Science, 13, 471 (1973).
39) C. L. Acbee and J. Kruger, Electrochemica Acta, 17, 1337 (1972).
40) W. P. Iverson, J. Electrochem. Soc., 115, 617 (1968).
41) M. J. Pryor, Corrosion Science, 10, 313 (1970).
42) B. Verkerk, Proc. UNESCO Int. Conf. on Radioisotopes in ScientificResearch UNESCO/BS/RIC44.
43) G. C. Wood, Ref. 2, p.10.
44) S. Smialowska and M. Czachor, Ref. 2, p. 353.
45) J. O'M. Bockris and A. K. N. Reddy, "Modern Electrochemistry," Vol. 2,Plenum Press, New York, p. 706 (1970).
-51-
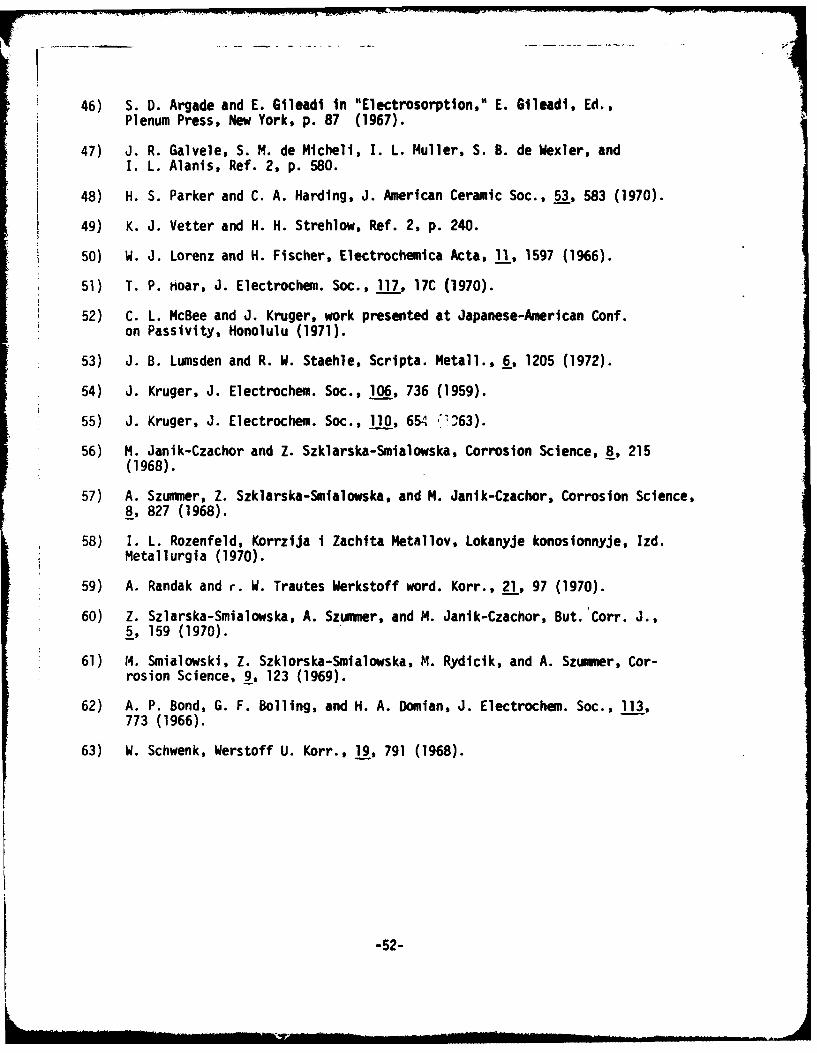
46) S. D. Argade and E. Gileadi in "Electrosorptlon," E. Gileadi, Ed.,Plenum Press, New York, p. 87 (1967).
47) J. R. Galvele, S. M. de Michell, I. L. Muller, S. B. do Wexler, and1. L. Alanis, Ref. 2, p. 580.
*48) H. S. Parker and C. A. Harding, J. American Ceramic Soc., 53, 583 (1970).
49) K. J. Vetter and H. H. Strehiow, Ref. 2, p. 240.
50) W. J. Lorenz and H. Fischer, Electrochemica Acta, 11, 1597 (1966).
51) T. P. Hoar, J. Electrochem. Soc., 117, 17C (1970).
52) C. L. McBee and J. Kruger, work presented at Japanese-American Conf.on Passivity, Honolulu (1971).
53) J. B. Lumsden and R. W. Staehle, Scripta. Metall., 6, 1205 (1972).
54) J. Kruger, J. Electrochem. Soc., 106, 736 (1959).
55) J. Kruger, J. Electrochem. Soc., 110, 651. -'a63).
56) M. Janik-Czachor and Z. Szklarska-Smlalowska, Corrosion Science, 8, 215(1968).
57) A. Szummier, Z. Szklarska-Smlalowska, and M. Janik-Czachor, Corrosion Science,8, 827 (1968).
58) 1. L. Rozenfeld, Korrzlja I Zachita Metallov, Lokanyje konoslonnyje, Izd.Metallurgia (1970).
59) A. Randak and r. W. Trautes Werkstoff word. Korr., 21, 97 (1970).
60) Z. Szlarska-Smialowska, A. Szummer, and M. Janlk-Czachor, But.'Corr. J.,5, 159 (1970).
61) 14. Smialowski, Z. Szklorska-Smialowska, M. Rydicik, and A. Szunumer, Cor-rosion Science, 9, 123 (1969).
62) A. P. Bond, G. F. Boiling, and H. A. Domian, J. Electrochem. Soc., 113,773 (1966).
63) W. Schwenk, Werstoff U. Korr., 19, 791 (1968).
-52-
,~w A:' NN- -
Fig._1 Periodic Potential fluctuations on A--a mild steel surfacein 0.1% NaCi solution and B--after 1% NaNO2 has been addedto the NaCI solution. Note how the inhibitor NaN02 reducesthe pulse intensity. From Iverson (40).
-53-
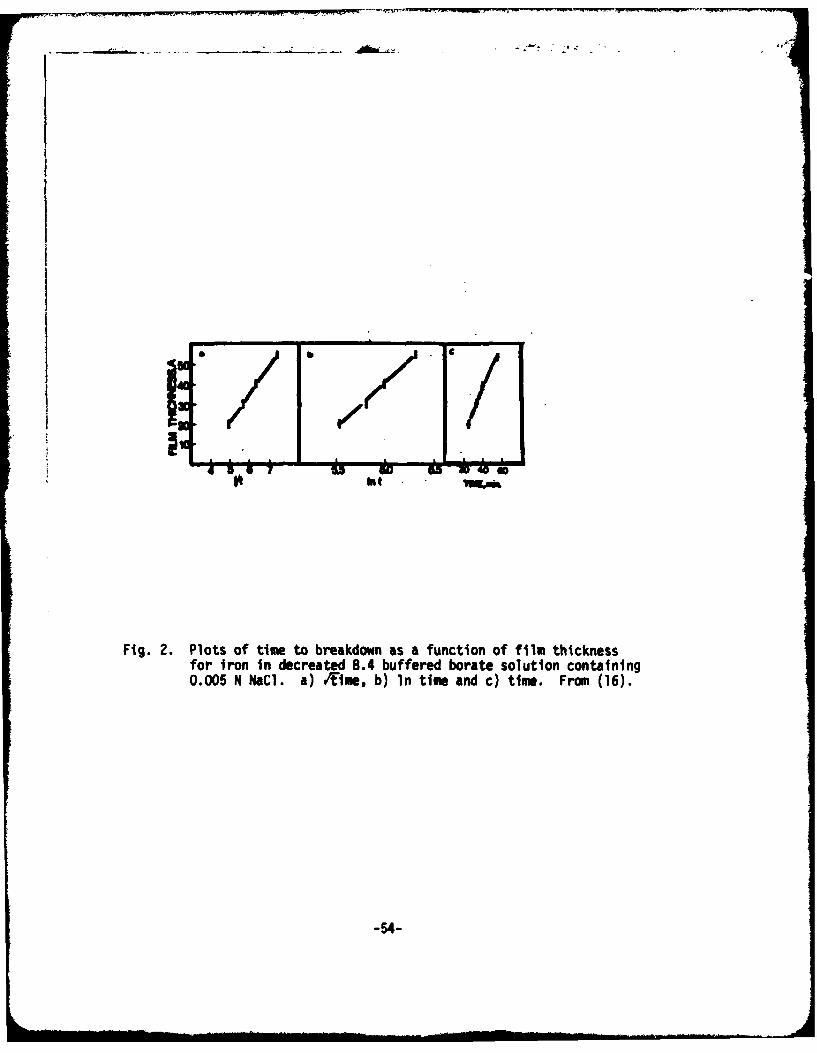
It ht
Fig. 2. Plots of time to breakdown as a function of film thicknessfor iron in decreated 8.4 buffered borate solution containing0.005 N NaCl. a) Rime, b) In time and c) time. From (16).
-54-
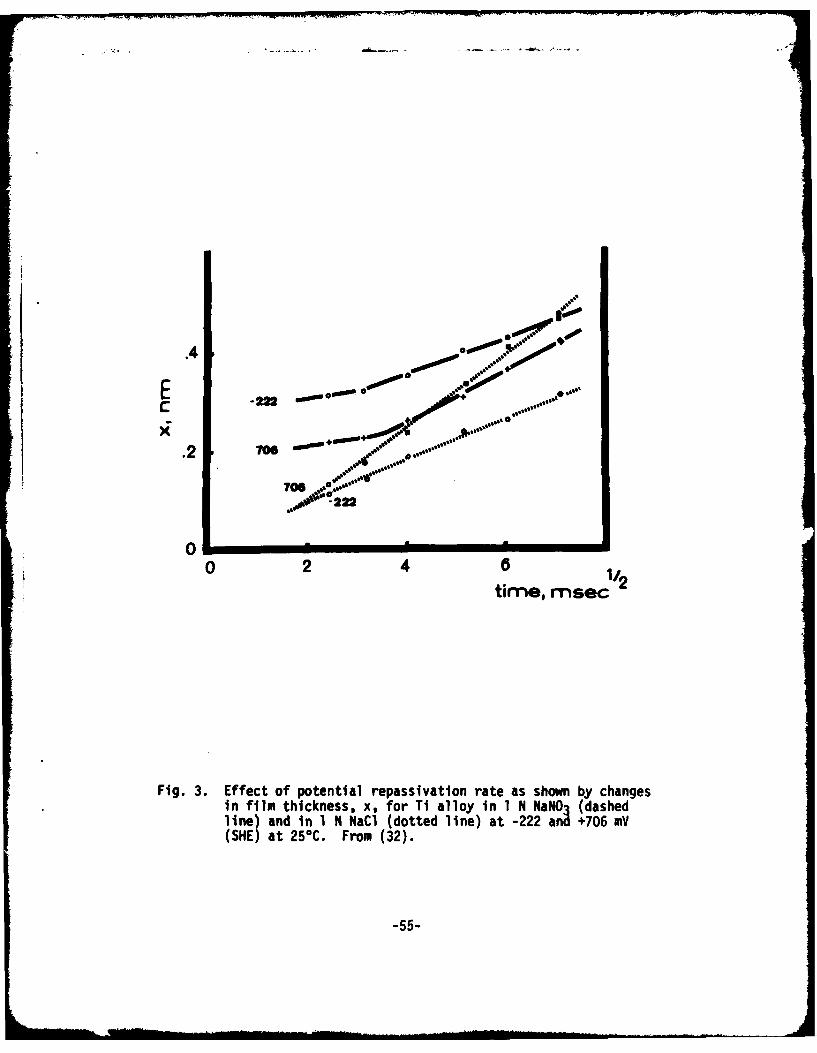
E 222 -
C|
.2 7"
706 -
41/2time, rrsec
Fig. 3. Effect of potential repassivation rate as shown by changesin film thickness, x, for Ti alloy in 1 N NaNO3 (dashedline) and in 1 N NaCi (dotted line) at -222 and +706 mV(SHE) at 250C. From (32).
-55-
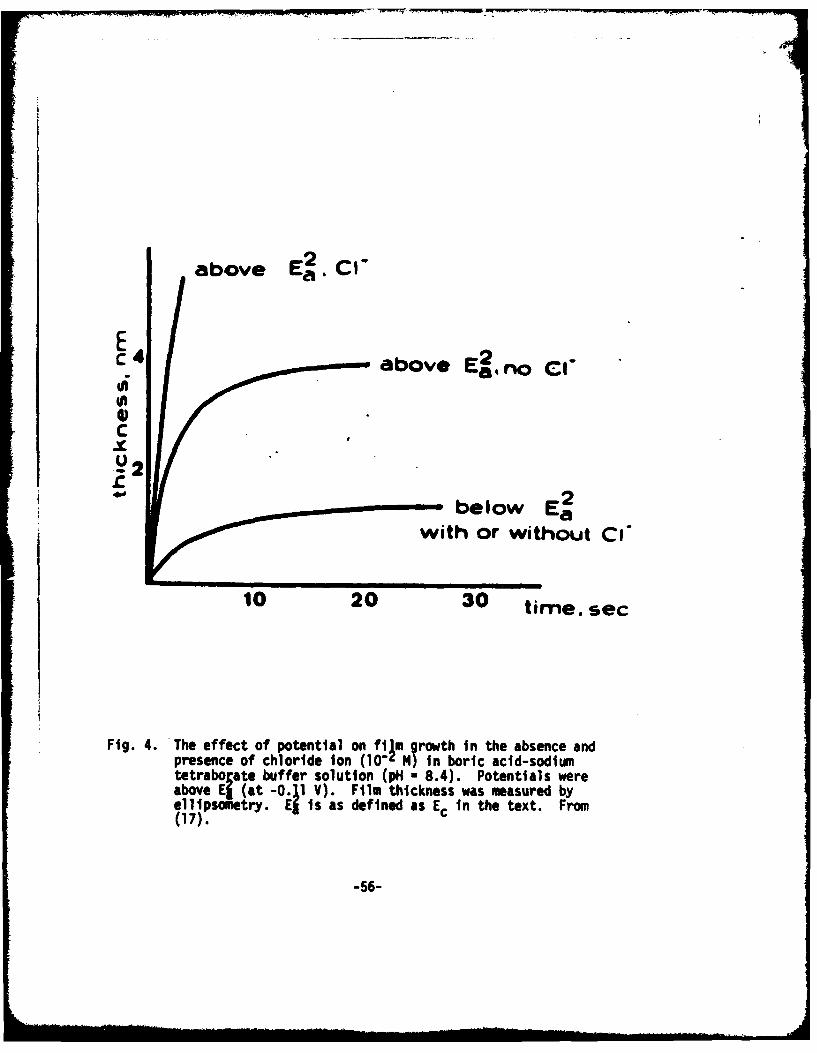
above E2.C
C 4 above E2.no Cl-
0a
CXU2
bel11ow E
with or without C1
10 20 30 time. sec
Fig. 4. The effect of potential on film growth in the absence andpresence of chloride ion (10-' M) in boric acid-sodiumtetraborate buffer solution (pH - 8.4). Potentials wereabove El (at.-0. 11 V). Film thickness was measured byellipsometry. E is as defined as Ec in the text. From(17).
-56-

~ ~ . - -T -6
Non PI TW6 0(100 A-.
r,"
Fig. 5. Stereographic triangle sho ingteefeto renaino
irongrais o tenencyof it. rom 54)
-57
PART IV
(To be published by Surface Science as proceedingsof the 3rd International Conference on Ellipsometry)
Qualitative Use of Ellipsometryto Study Localized Corrosion Processes
J. Kruger and J. R. AmbroseInstitute for Materials Research
National Bureau of StandardsWashington, D. C. 20234
Localized corrosion processes (see [1] for a detailed description) suchas pitting, intergranular corrosion, crevice corrosion, and stress corrosioninvolve many aspects that are not amenable to a quantitative study byellipsometry. For example, a protective film undergoing the breakdown thatleads to pitting probably involves such complications as a continually varyingrefractive index, the possibility of a changing medium, and the formation ofother film on top of the original film present at the inception of pitting.Quantitative characterization of the thicknesses and complex refractiveindices of all the films involved is questionable under the best ofcircumstances, but within the current state of the art is out of the questionfor localized corrosion processes. This paper will describe certainqualitative uses of ellipsometry that can, however, provide valuable insightsinto localized corrosion processes.
By qualitative ellipsometry we mean the use of the ellipsometer in sucha way that we do not determine the optical constants of the film on thesurfaces studied nor do we attempt to determine film thickness wih anyaccuracy, but we do use rough estimates of film thickness. Instead, changesin A ani * can be used in the following ways:
1) T measure the time during the course of a process when significantchanges occur as indicated by abrupt changes in a and * and tocorrelate the a,* changes with others, e.g., electrochemical ones.
2) To observe variations of A and * as a function of wavelength underdifferent environmental conditions in order to detect regions of the spectrumwhere special effects are observed.
3) To determine what rate laws are operative by measuring variationsof thickness (for thin (<5 nm) films, assumed proportional to A) withtime.
We will describe the application of some of these "qualitative" uses ofellipsometry to the study of a) the initiation of pitting, b) the initiationof crevice corrosion, and c) repassivation kinetics as applied to stresscorrosi,)n.
-58-
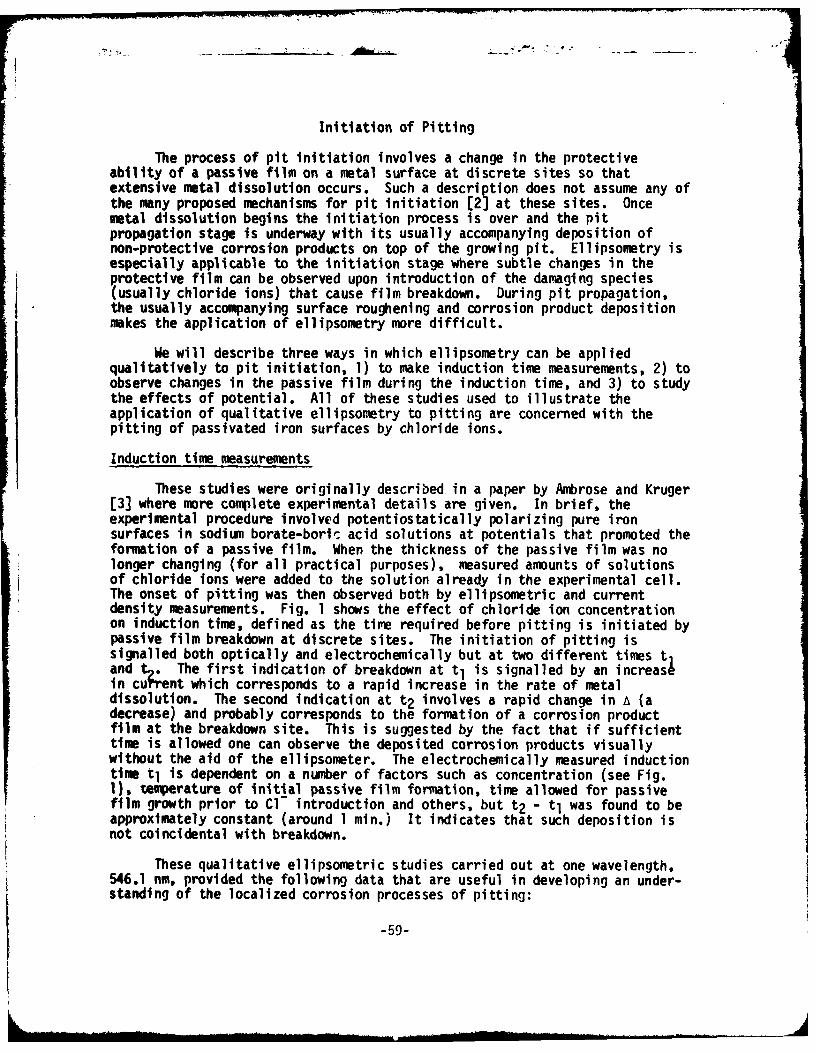
Initiation of Pitting
The process of pit initiation involves a change in the protectiveability of a passive film on a metal surface at discrete sites so thatextensive metal dissolution occurs. Such a description does not assume any ofthe many proposed mechanisms for pit initiation [2] at these sites. Oncemetal dissolution begins the initiation process is over and the pitpropagation stage is underway with its usually accompanying deposition ofnon-protective corrosion products on top of the growing pit. Ellipsometry isespecially applicable to the initiation stage where subtle changes in theprotective film can be observed upon introduction of the damaging species(usually chloride ions) that cause film breakdown. During pit propagation,the usually accompanying surface roughening and corrosion product depositionmakes the application of ellipsometry more difficult.
We will describe three ways in which ellipsometry can be appliedqualitatively to pit initiation, 1) to make induction time measurements, 2) toobserve changes in the passive film during the induction time, and 3) to studythe effects of potential. All of these studies used to illustrate theapplication of qualitative ellipsometry to pitting are concerned with thepitting of passivated iron surfaces by chloride ions.
Induction time measurements
These studies were originally described in a paper by Ambrose and Kruger[3] where more complete experimental details are given. In brief, theexperimental procedure involved potentiostatically polarizing pure ironsurfaces in sodium borate-bori' acid solutions at potentials that promoted theformation of a passive film. When the thickness of the passive film was nolonger changing (for all practical purposes), measured amounts of solutionsof chloride ions were added to the solution already in the experimental cell.The onset of pitting was then observed both by ellipsometric and currentdensity measurements. Fig. 1 shows the effect of chloride ion concentrationon induction time, defined as the time required before pitting is initiated bypassive film breakdown at discrete sites. The initiation of pitting issignalled both optically and electrochemically but at two different times tand t . The first indication of breakdown at tI is signalled by an increaslin cu rent which corresponds to a rapid increase in the rate of metaldissolution. The second indication at t2 involves a rapid change in A (adecrease) and probably corresponds to the formation of a corrosion productfilm at the breakdown site. This is suggested by the fact that if sufficienttime is allowed one can observe the deposited corrosion products visuallywithout the aid of the ellipsometer. The electrochemically measured inductiontime t I is dependent on a number of factors such as concentration (see Fig.1), temperature of initial passive film formation, time allowed for passivefilm growth prior to Cl" introduction and others, but t2 - tj was found to beapproximately constant (around 1 min.) It indicates that such deposition isnot coincidental with breakdown.
These qualitative ellipsometric studies carried out at one wavelength,546.1 nm, provided the following data that are useful in developing an under-standing of the localized corrosion processes of pitting:
-59-
a) No detectible optical changes due to thinning or refractive indexvariations (when using X ; 546.1 nm) occur in the passive film priorto the initiation of pitting.
b) Pit initiation is not simultaneous with corrosion productdeposition but requires its own induction period of around 1 min.
The implications of these useful results revealed by qualitativeellipsometry on the mechanism of pitting are given elsewhere [4).
Changes in the passive film leading to pitting
Probing more deeply into the just described work by Ambrose and Kruger,M4cBee and Kruger [5] sought to determine whether optical chan es could bedetected during the time before breakdown (the induction time)ifellipsometric measurements were made using a light source that permittedmeasurements at a number of wavelengths in the visible region of the spectrum.They found for the same system as that of Ambrose and Kruger that for a fewwavelengths, changes in A and * (more markedly in A) could be detected duringthe induction period. Fig. 2 shows that some of these changes in A weresignificantly outside the range of experimental errors.
Since changes in A and * occur during the induction period at a fewwavelengths, it is possible to follow these changes as a function of time byworking at any one of these wavelengths. Fig. 3 shows that, indeed,continuous variations in a and * occur during the induction period untilpitting is initiated (at the cross-hatched area in Fig. 3). Unambiguousdetermination of the optical constants for the passive film, and the changesin these constants with the addition of the chloride, were not made forreasons given elsewhere [6]. However, calculations were made which show thatthe changes in the film brought about by the chloride addition can alter therefractive index, n, and the absorption coefficient, k, at the affectedwavelengths, while producing no changes at the other wavelengths studied.
Fig. 3 also shows other valuable details about the events occurring inconnection with the induction period. First, it shows that if chloride isremoved from the environment the passive film will eventually recover itsoriginal a and * values. Second, the time to breakdown and the time torecover depend strongly on the thickness of the passive film originallyexpoied to the chloride. Finally, the extent of the optical change,Aassive - Abreakdown, is inversely proportional to the thickness of the
ssive film originally exposed to the chloride.
Thus, these results illustrate how, by just following A and 0 changeswithout attempting to calculate optical constants or thicknesses, one canlearn valuable insight into the subtle processes leading to pitting. Thebearing that these results have on the mechanism of film breakdown is beyondthe scope of this paper but is given by lcBee and Kruger [5].
-60-
Effect of potential
Thus far, we have described studies where the surface observed was heldat a potential above that necessary to initiate pitting, the critical pittingpotential, Ec. Many workers [71 believe that pits will not initiate atpotentials below Ec- Others [8] believe that if one waits long enough pittingwill initiate below E This disagreement may arise because of the use ofdifferent techniques r measuring E . Ellipsometry, however, does revealthat one can distinguish entirely different optical behavior betweenpassivated surfaces exposed to chloride well below and well above Mostcommnly accepted values of Ec.
First, it can be shown (Fig. 4) that passive film growth starting with abare iron surface proceeds in an identical fashion in solutions containingchloride to that observed for solutions without damaging ions when thepotential at which the film is grown is below Ec. When, however, thepotential is above Ec, chloride in the aqueous solution promotes rapidlimiting thickness). This type of growth is similar to that observed at timet 2 and attributed to the deposition of a nonprotective corrosion product filmas described earlier. Therefore, ellipsometry shows that potential has aprofound effect on events occurring after pit initiation occurs.
Secondly, potential can also affect the processes occurring prior tobreakdown when chloride in introduced. Above Ec, as described earlier, theintroduction of chloride produces changes in the ellipsometric parameters,especially a, at only a few wavelengths. Below Ec, however, Fig. 5 shows thatapproximately equal changes in a occur at every wavelength when chlorideions are introduced. This essentially uniform decrease in the overall avalues, except perhaps at 590 nm, accompanied by mainly insignificant changesin the # spectrum indicates an increase in film thickness. An increase infilm thickness can be caused by either the adsorption of chloride on top ofthe film or further growth of the passive film. It is also possible that bothof the above mentioned processes take place concurrently. Calculations showthat the magnitude of the changes in a and ip require a change in filmthickness of at least 1.5 nm. This is too large to be accounted for by onlychloride adsorption. At any rate, for surfaces at potentials below EV,calculations show that the ellipsometric spectra indicate changes in filmthickness (usually by a downward shift in & and insignificant changes in *)rather than changes in the film properties, as would be indicated by irregularmovements in the & and * values at discrete wavelengths.
These ellipsometric studies thus reveal that potential may affect muchmore than the kinetics of pit initiation. They reveal that subtle changes inthe passive film itself are affected by the potential at which it is exposedto chloride, and these changes must be related to the tendency for the film tobreak down when the potential is above Ec.
-61-
Initiation of Crevice Corrosion
Once it starts, crevice corrosion bears some similarities to pittingcorrosion, in that both forms of localized corrosion propagate because ofrestricted mass transport of reactants or reaction products. In the case ofpitting, mass transport is restricted because of corrosion products depositedon top of the pit and, in the case of the crevice, because of the existence ofsome material that restricts mass transport, e.g. gaskets, another piece ofmetal, a deposit of dirt, etc. Ambrose [91 has described how one can applyellipsometry to the study of processes occurring inside a crevice by creatinga crevice with a glass plate on top of the metal surface to be studied (Fig.6). use of such transparent windows for visual observation of a crevice isnot new [10,11], but the results from such studies have been limited todetection of crevice corrosion in its advanced stages. The optical techniqueof ellipsometry, however, not only permits measurement of small changes inthickness and optical properties of surface films on metal substrates, but canperhaps be used to detect changes in composition of aqueous media as well.One can only hope to gain qualitative indications of the changes because thesystem is extremely complicated from an ellipsometric point of view. Besidesthe complications of the bottom surface of the glass plate which can be asurface for the adsorption of films and the changing index of retraction ofthe solution in the crevice, there exist the possibilities of passive filmgrowth or dissolution, the deposition of corrosion products on the glass ormetal and the effects of metal roughening once crevice corrosion hascommenced. We will show, however, that this application of ellipsometry canprovide additional information that helps in the interpretation ofelectrochemical results by being able to detect small changes occurring earlyin the chain of events leading to crevice corrosion and being able todetermine at what time these changes occur.
The device used to simulate a crevice in these studies is shown in Fig.7 and consists of a Teflon adapter which serves to position a circular pyrexglass plate against the surface of a polished metal specimen. The thicknessof the-pyrex disc was such that interference between the beams reflected fromthe metal surface and those reflected from the top of the plate did not occur(Fig. 6). The sides of the Teflon adapter were cut away in order to allowaccess of a bulk solution to the crevice. The lateral surfaces of thespecimen were isolated from the environment by a tightly wound layer of Teflontape in order to prevent crevice attack where it could not be observedoptically. The rear surface of the specimen was similarly protected duringthose experiments where potentiostatic control was applied. Using thisdevice, as well as looking at surfaces without a crevice where solutionconditions are changed to simulate the conditions existing in the solutionwithin a crevice, useful insights can be gained into the processes leading tocrevice corrosion in two areas,
a) the effect of deoxygenation and
b) the effect of the crevice.
-62-

Effect of solution deoxygenation
There appears to be general agreement with the fact that oxygendepletion within the crevice constitutes the initial phase of crevicecorrosion attack [12]. Therefore, ellipsometric measurements can examine theeffect of oxygen depletion on the protective film on the metal in the absenceof a crevice. For a metal with absorbing films such as stainless steel, A ismore sensitive than * to changes in film thickness [13]. Both parameters areaffected by film optical property changes. Results for 304 stainless steelexposed to L.ON NaCl without a crevice, in the open circuit mode, are shown inFig. 8. Oxygen depletion results in the expected shift in corrosion potentialtoward more negative values with the A-values remuing virtually unchangedthroughout the exposure period, increasing by only 0.08* after 1350 minutes.The value of * similarly is constant during the first 100 minutes or so ofexposure, but then increases during a period where the rate of potentialchange appears to increase. Overall, 0 is increased by 0.2600 over theexposure period.
These data indicate that in a deoxygenated solution where thepotential is changing slowly (9.4 mV/minute), the ellipsometric parameters Aand * are rather constant with only very slight thinning or change in thenature of the film on the stainless steel substrate having occurred. Based onthe reaction:
0 2 + 2H20 + 4e" * 4OH" (1)
the overall potential change of -94 mV would correspond to a 6 orders ofmgnitude decrease in oxygen concentration. However, after about 100 minutesthere is an increase in the rate of potential change accompanied by asignificant increase in the values of while A remains essentially constant.This would appear to indicate that a change in the nature of the film hasoccurred, but because A does not change there appears to be no significantthinning. Since micropits were observed at this stage, such behaviorindicates a localized breakdown in passivity.
These ellipsometric studies suggest that, contrary to what has beenproposed in the literature [13], depletion of oxygen alone does not lead to auniform film thinning and loss of passivity over the whole surface-, a behaviorcharacteristic of crevice corrosion attack. Instead oxygen depletion resultsin a discrete change in the nature of the film followed by a localized loss ofpassivity that is more characteristic of pitting.
Effect of the crevice
When a crevice is present not only is there oxygen depletion but also achange in the concentration of uther species in the aqueous solution in thecrevice. Using the apparatus shown in Fig. 6, ellipsometrtc observations ofthe metal surface in a crevice produced results of the sort shown in Fig. 9.With the surface held at the initial immersion corrosion potential (+42 mV), Avalues decreased markedly during the first 20 minutes of exposure (6A =-0.12) before increasing to a maximum value (6A - +.60°), after about 1450minutes. The 0 values fluctuated a great deal but, in general they decreased
-63-
during the first 200 minutes (da = 0.650) then Increased for the remainder ofthe exposure period. Current values slowly increased from +0.66 uA to a finalvalue of 300 UA at the end of the run. The major increase in the current,which indicates an increase in corrosion rate, occurred at about the same timethat the A values started to decrease sharply. It is worth noting that, whilelarge optical changes occur, virtually no electrochemical changes are observeduntil the current increase signals the onset of crevice attack. The opticalchanges are those that presumably lead to the initiation of this attack.
It is obvious from Fig. 9 that optical results completely different fromthose obtained without a crevice (Fig. 8) are obtained when a crevice isintroduced. Although the process of oxygen depletion is probably acceleratedwithin the low volume crevice, the initial direction of change of both A andis opposite to that observed in oxygen depletion where a crevice was notpresent, and apparently processes other than oxygen depletion are playing apredominant role. Other studies [12] indicate that these processes areleading to a marked change in the concentration of hydrogen ions, chlorideions and metal ions in the crevice solution.
* .Before attempting to interpret the ellipsometric observations, it isnecessary to discuss the effect of the glass plate on the ellipsometricobservations. Since the glass plate is a dielectric there will be no phasechange with transmission through the glass plate assuming no adsorption takesplace on theplate and the A measured will not differ from that resulting fromoptical conditions at the metal surface. The value of measured, however,will be changed due to the transmission coefficients at the surfaces of theglass plate. These transmission coefficients will in turn depend upon therefractive index of the solution in the crevice. This latter is generallyunknown and changing during the course of such an experiment.
In order to determine empirically the effect of increase of the solutionrefractive index on A and * outside of a crevice, ellipsometric measurementswere made on a stainless steel surface, with a crevice, in both 1N NaCl and2.5N NaCl solutions, the latter having a higher refractive index. As Table 1shows, the measured value of A with the crevice in place decreased markedly invalue in the more concentrated solution. The value of @ increased slightly.Thus, based on the changes in A shown in Fig. 9, the initial stages of crevicecorrosion are consistent with an increase in crevice solution index ofrefraction, i.e., an increase in the concentration of Cl-and metallic ions.Because * is difficult to interpret in the presence of a crevice for thereasons given above and because of the greater fluctuations in the valuesmeasured, we cannot judge whether the 0 measurements are indicative of crevicesolution concentration during the first part of the chain of events leading tocrevice corrosion.
The substantial increase in A and continued decrease in p following thefirst phase is consistent with an overall decrease in thickness of theprotective surface film. Since oxygen depletion alone has been shown not toproduce such an effect, we can assume that such thinning results from whateverhappened during the first phase of the process, where a was observed todecrease. Finally, the marked decrease in a is in the same direction as waspreviously noted for the non- crevice oxygen depletion studies, and ischaracteristic of surface roughening and/or film growth. Notably, this
-64-
decrease comes at the same time that the current measurements indicate anincreased rate of corrosion where presumably metal roughening and/or corrosionproduct deposition occurs.
The effect of a crevice on the corrosion rate and ellipsometricparameters of a Ti 8Al-lMo-lV alloy was also studied. This alloy, which isnot susceptible to crevice corrosion in a similar environment at roomtemperature, exhibited none of the ellipsometric variations associated withthe onset of crevice corrosion attack on 304 stainless steel when its surfacewas held at the open circuit corrosion potential while exposed to the crevicecreated by the glass plate. In fact, A, p, and i were relatively constantover the entire period of exposure.
Although these mechanistic inferences are consistent with the observedellipsometric variation, they are by no means the only possibleinterpretation. This is so because the ellipsometric measurements reflectaverage overall changes occurring under the glass plate. In other words, oneprocess - i.e., solution concentration - could easily mask out small changesin the film/metal substrate. Much further work is necessary to makeellipsometric observations of crevices more definitive and quantitative.However, the results just described are important qualitatively because theyindicate the times at which changes occur in the crevice in the processesleading to crevice attack. Moreover, a reasonable picture, consistent withthe optical measurements of events initiated during these changes can bedeveloped using measurements in special environments without a crevice. Thesequence of events for the susceptible stainless steel exposed to a crevice ina chloride solution can be described as follows:
1) The initial decrease in A may correspond to the concentrationof metal and chloride ions leading to an increase in the refractiveindex of the solution in the crevice.
2) The subsequent increase in A may correspond to film thinning.
3) The final decrease in A may correspond to both metal rougheningand corrosion product deposition.
In contrast, for the non-susceptible Ti alloy, a constancy ofellipsometric and current measurements over the entire exposure periodindicates that none of the crevice solution concentration effects which weredetected for the susceptible 304 stainless steel had occurred.
Repassivation Kinetics
This last to be described application of ellipsometry seeks to measurethe rate at which a protective film grows on a surface once the previous filmis removed. This phenomenon is of great importance to stress corrosioncracking (SCC) where films are ruptured when a metal is stressed, and the rateat which the surface is repassivated determines the length of time theunprotected metal can be attacked by an environment. To measure thisrepassivation process, Ambrose and Kruger [14] developed a technique called"triboellipsometry". The technique uses a small abrasive polishing wheel in
-65-

the environment to be studied to remove the protective film on a metalsurface. This abrasion step leaves the metal surface in a coldworked state,but, since the tip of a growing stress corrosion crack is continuallyundergoing plastic strain, the growth rate of a film on the abraded surface isprobably closer to that which occurs at the crack tip than the rate for astrain free surface. The polishing wheel is then quickly withdrawn, andellipsometric and electrochemical current transients are recorded on anoscilloscope. The current is a measure of both the film growth and the metaldissolution that occur during repassivation. The ellipsometer measures mainlyfilm regrowth.
While there are other electrochemical techniques [15, 16] for measuringrepassivation kinetics by using current decay measurements, the tribo-ellipsometric technique allows one to determine how much of the current isinvolved in film repair and how much is involved in metal dissolution. Itcannot do this quantitatively because it is difficult to measure the amount ofbare surface produced by abrasion so that the current density is difficult todetermine. Moreover, exact measurements of film thickness by ellipsometry onthe abraded surface are difficult. (One can, however, measure changes in Aand *b and relate these changes to thickness changes that are reasonableestimates even when the optical constants of the film are not well known[17]). To overcome the difficulties of 'nexact current density and filmthickness measurements, a parameter has been defined [18, 19] that allowsone to compare the repassivation behaviors of a given metal in differentenvironments and thus use it as a diagnostic tool for estimating whichenvironment would have the greater likelihood to promote stress corrosion.This parameter, R , has been defined in a manner that is convenient fortriboellipsometriN measurements as the ratio
t
R =0 (2)
where it is the total anodic current which flows for a given time interval, t,to a surface made bare by film removal (through rupture or by other means) andxt is the thickness of the film at time t. Rp can also be expressed as
Rp = QT = K Qd + Qf (3)
where QT is the total charge involved in the anodic process, Qd is the chargeinvolved in metal dissolution, Qf is the charge involved in t e filmformation, and K is a constant which depends on the surface area, and thenature of the film.
-66-

The value of R is a measure of the effectiveness of the repassivationprocess after film regoval. If repassivation is ineffective at first, QTincreases rapidly, resulting in a large value of Rp. On the other hand,effective repassivation, where Qf does not differ greatly from QT, yields asmall value R Since R is measured as a function of time, Ambrose andKruger examined [18] what happens to dRp/dt under different hypotheticalsituations which could exist at a crack tip. A more detailed and rigorousanalysis is given else- where [19].
Case 1 dR /dt = 0. This occurs when Qf= Qd- Here SCC susceptibilityis highly unlikely. From Equation (3), it can be seen that Rp = K and dR p/dt
0 .
Case 2 dR /dt > 0. This reflects the situation when Qd > Qf and R ", K Qd/0 fso that dR/dt is gositive. If Qd " Qf, dR/dt can become a large positivenumber and SCC may be unlikely because the extensive dissolution involved mayresult in considerable blunting of the crack tip.
Case 3 dR dt < 0. This can happen where dx/dt > dQT/dt. Bydifferentiating the expression for R in Equation 2.
dP dQT/dt - QTdx/dt (4)
x xz
it can be seen that, since QT is always greater than Qf, when dx/dt > dQT/dt,dRd/dt will have a negative value. The significance of dR /dt < 0 can not bee~lalned until two other important parameters determined by triboellipsometryare examined; dx/dt, the rate of film growth, and t , the time when dx/dtbecomes small (arbitrarily defined as the point in time where dx/dt < 0.001nm/msec). Using these two parameters, in addition to R, and dR,/dt, theirpossible values in various environments for a given mel known to meetmechanical and metallurgical requirements for SCC can be compared as shown inTable II.
Using the analysis shown in Table II, a highly qualitative but usefulguide for comparing SCC behavior of a metal in an environment wheresusceptibility is known with its behavior in an unknown environment can bedeveloped. Table II also provides insights into the process occurring at acrack tip or during crack initiation. It allows, for example, an estimationof the effectiveness of a protective film from the value of dRp/dt. It alsopoints out that a high rate of film formation is not a sufficient conditionfor nonsusceptibility because the ability of the film to prevent dissolution(its protective quality) is equally important (Condition A). Table II furtherindicates that the formation of a good protective film is not sufficient toprevent SCC if dx/dt is small (Condition B).
-67-
Fig. 10 shows the application of the techniques and analysis justdescribed to the study of the repassivation behavior of a low carbon steel inthree environments: a) 4N NaNO3 solution at 90C where this steel issusceptible to SCC, b) IN NaNO2 at 250C where it is not susceptible to SCC,and c) IN NaCl at 25C where it is not susceptible to SCC but where extensivecorrosion takes place. Table III gives the various repassivation parametersfor the low carbon steel in the above environments.
The three different kinds of behaviors shown in Fig. 10 and in Table IIIprovide examples of three of the conditions described in Table II. Theseexamples were described a number of years ago by Evans quoted in [20] beforetechniques existed that could clearly distinguish them. He proposed that"chemical factors in the liquid mainly decide whether attack at any point will(a) heal up [condition C existing in NaNO9], (b) remin localized developinginto a crack [Condition D existing in NaCT], or (c) spread out [condition Aexisting in NaN03J, leading to general attack." The fact thattriboellipsometry can distinguish these three kinds of behavior during thefirst few tens of milliseconds of a repassivation event points to its greatusefulness in gaining an understanding of phenomena that involverepassivation.
-68-
'Az
References
[1] N. G. Fontana and N. D. Green, "Corrosion Engineering",McGraw-Hill Book Co., New York (1967).
[2] T.P. Hoar, Corrosion Sct., 7, (1967), 341.
[3] J.R. Ambrose and J. Kruger, Proc. 4th International Congresson Metallic Corrosion, 1969, Nat'l. Assn. of Corrosion Eng.,Houston, Texas (1972), p. 698.
[4] J. Kruger, Proceedings of Japanese Amrican Conference on thePassivity and Breakdown of Passivity of Iron Base Alloys, tobe published by Nat'1. Assn. Corrosion Eng., Houston.
[5] C.L. McBee and J. Kruger, "Localized Corrosion", N.A.C.E.-3,Staehle, Brown, Kruger, Agarwal, Editors, Nat. Ass. CorrosionEng., Houston, (1974), p. 252.
[6) C.L. McBee and J. Kruger, Sur. Sc., 16, (1969), 340.
[7] H. Bohni and H.H. Uhllg, J. Electrochemical Soc., 116, (1969),906.
[8] N.J. Pryor, "Localized Corrosion", N.A.C.E.-3, Staehle, Brown,Kruger, Agarwal, Editors, Nat. Ass. Corrosion Eng., Houston,(1974), p. 2.
[9] J.R. Ambrose - to be subitted to the Electrochem. Soc.
[10] R.B. Hears and U.R. Evans, Trans. Faraday Soc. 30 (1934), 417.
[11] U.R. Evans, J. Inst. Metals 30, (1923), 239.
[12] I.L. Rosenfeld and I.K. Marshakov, Corrosion 20 (1964), 115t.
[13] J.F. Bates, Corrosion 29 (1973), 28.
[14] J.R. Ambrose and J. Kruger, Corrosion, 28 (1972), 30.
[15] J.C. Scully and T.P. Hoar, 2ri Int. Congress of Metallic Corro-sion, New York 1963, Nat. Ass. Corrosion Eng., Houston (1966),p. 184.
[16] N.D. Tomashov and L.P. Vershinina, Electrochimica Acta, 15, (1970),501.
[17] J. Kruger, "Advances in Electrochemistry and Electrochemical Engineering",Vol. 9, R.11. uller, E., John Wiley and Sons, New York (1973), pp. 249-250.
69
[18] J.R. Ambrose and J. Kruger, Proc. 5th International Congresson Metallic Corrosion, 1972, Natl. Assoc. of Corrosion Eng.,Houston, Texas, (1974), p. 406.
(19] J.R. Ambrose and J. Kruger, J. Electrochem. Soc. 121 (1974),599.
E20] R.N. Parkins and R. User, 1st Int. Congress on Metallic Corrosion.Butterworths London (1962), p. 289.
USC jU*N.OC70

ITable I -The Variation of a and v' as a Function of Solution ConcentrationMaCI Solution Refractive A6Concentration Index 1.0+2.5 1.0-2.5
1.0m 1.3432 113.86 29.38 -
2.5 1.3567 111.70 29.41 -2.16 .3
71
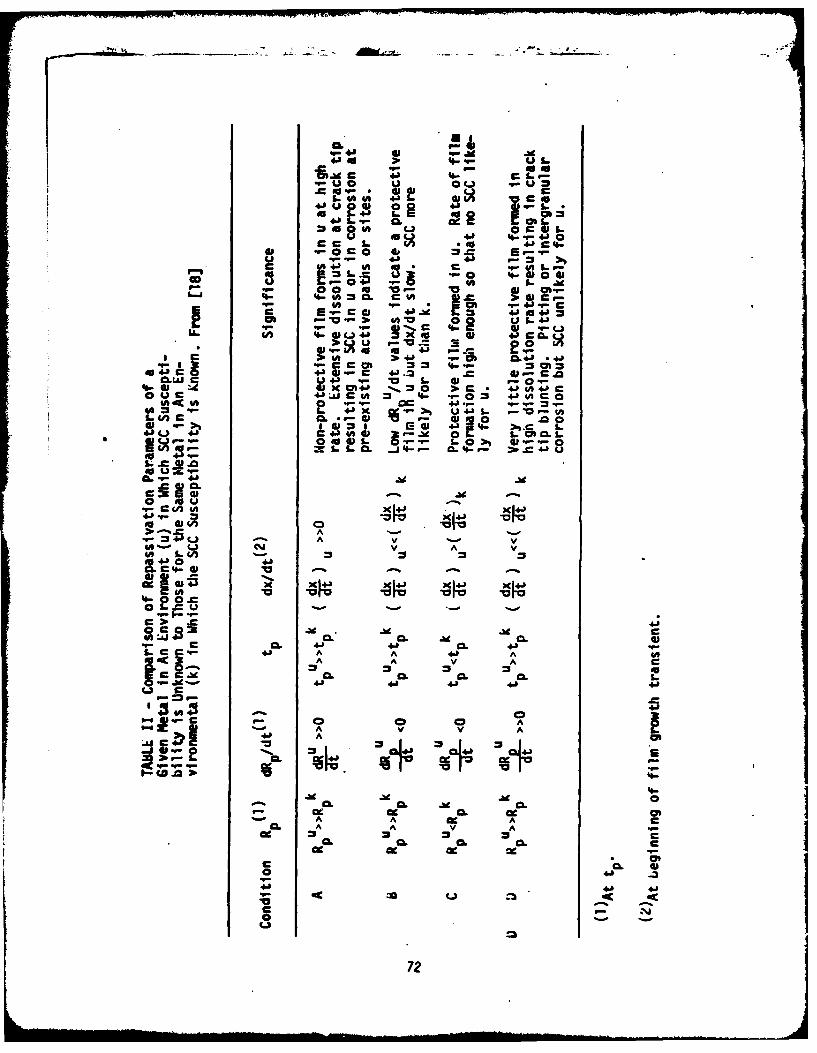
CLO
4 J UE 0~ -g S.o 1., S. al =8200Y 06 O L
w41 I.q. 4 J 0
C 4A 4.) CA go WLr-
5- 0 a0 of.-lift 0 C71 4J "~-C
C r- C CJ 4J. Ad 41 SO412Z
-$ 41 =44 .4J. J 11 C 4J 08 41 *4C.
q- LL -r 0 L. El0OuC 41bWCC 46 -, 0 41(fl4C
0 ~ ~ ~ ~ 0 4. 1uIAC_ 0 -i
U1L 41J C4a l .-. In L 080 L
L C Wl .00 U Z
C ~I A V V
In M. - 22
An 1-l (A11b1(4 (44*0 0 4
C. .C 4D
C 20
AA Aa 4 C.6 A0. 41 4j 06 41
. j A A Vj AC
41& 4a 41A 41
A
.0 2
06 06
A A 09 A
00
41 4 41
72
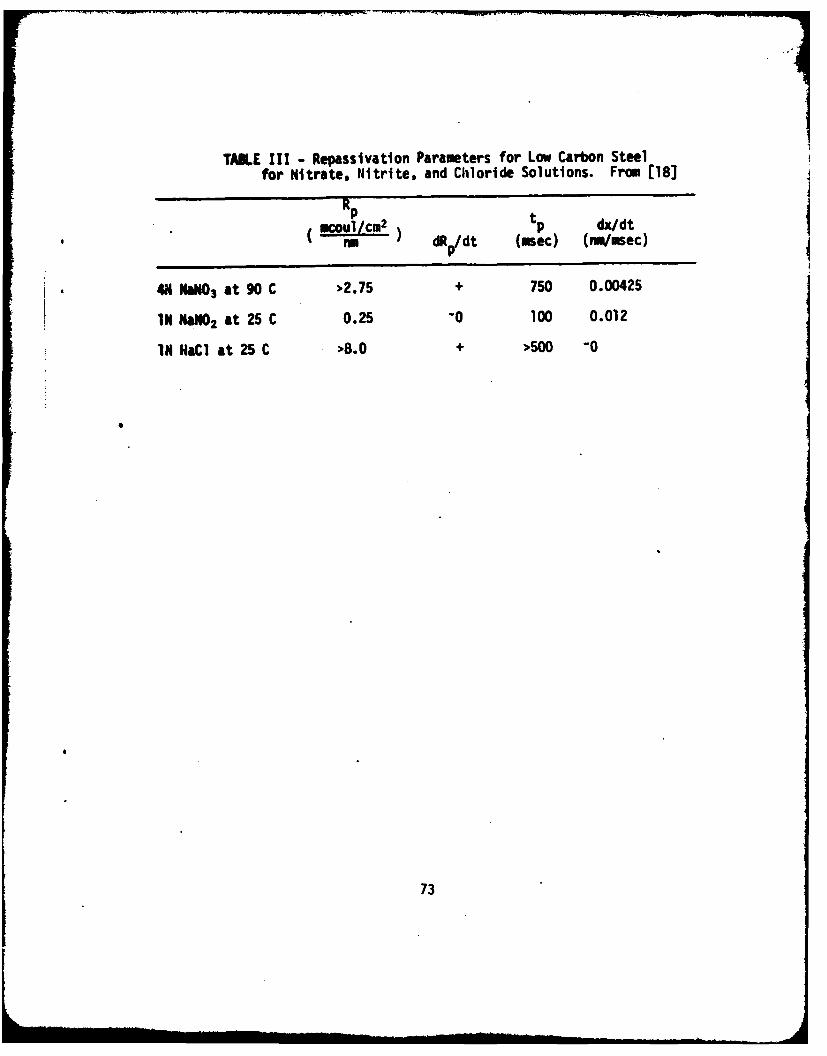
TABLE III - Repassivation Parameters for Low Carbon Steelfor Nitrate. Nitrite, and Chloride Solutions. From [18]
UIC dR~dt tp dx/dt
mdt (mec) (nm/mec) 4
SNaN03 at 90 C 2.75 + 750 0.00425
IN NaN02 at 25 C 0.25 "0 100 0.012
IN IRaCI at 25 C >8.0 + '500 "0
73

M CM
00
eo E
- u CL.-
4.1 uO4- 41
C4 34 E 4N
h. ,
0 0° ,"U ,4 4- ,.0 r-La
"1w L la€/
O= 0 0
.- - 04J
C c
1 1 -
ccC0
-o I u743
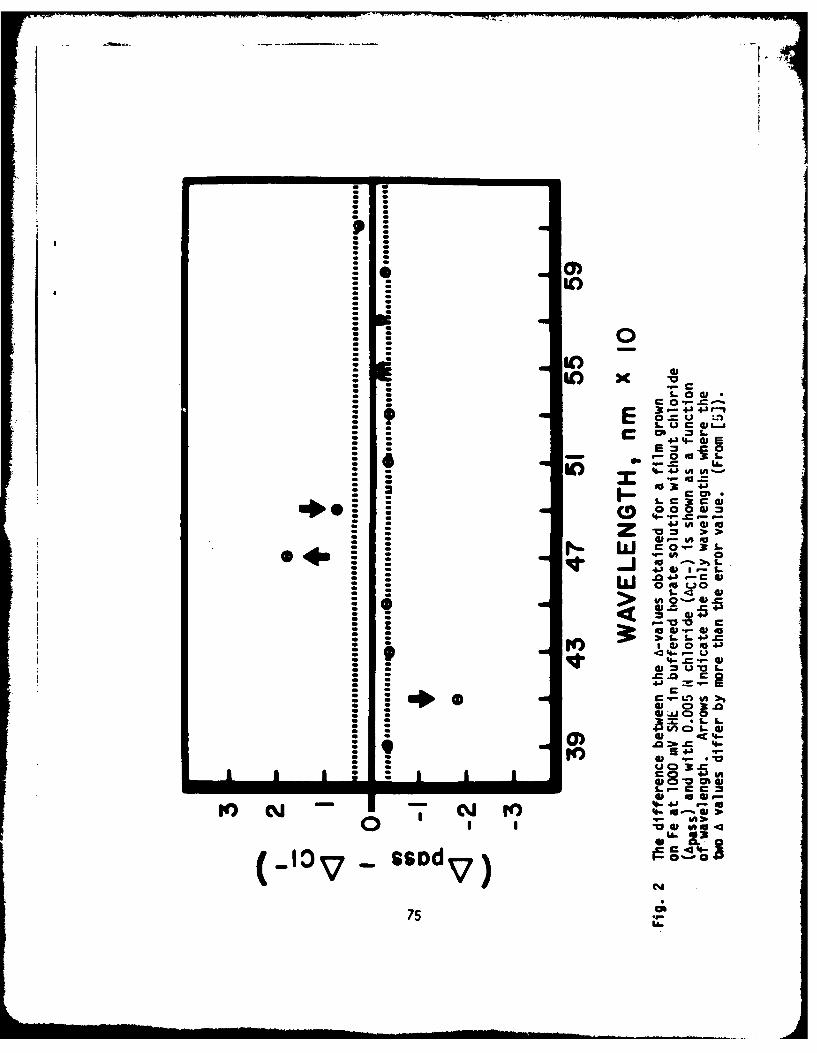
s- 0
4J I+D4
* --
0 sn
*C I
4- * I ID*04 Sr IV
* a .&0 4w
04J~40f
.0
- 4-
5- '0- cm 4
-- 0 a-
75 4rA'

all
Sama
I-3
U
Fig. 3 NDdulatlons in a and * at 410 - for prebreakdown and recoveryprocesses are indicated for films of four thicknesses, 5.5,4.0, 3.0, and 2.0 nm. (From [5]).
76

Ul
r 0:
00
-4 P
0
0Lj
ja do toC4 Il 0 t
77

122
118
114
106
102
98
400 440 480 520 560 600
WAVELENGTH , nm
Fig. 5 Curve A represents the values of A obtained at -100 mV (SHE) for{2211 Fe in borate solution. Curve C shows the changes in thespectrum that occur when chloride is added to the solution. Thestar indicates that the spectra are not similar at 5)0 nrm.(From [5]). 78
LM --

L
C 44C
011
* ~ ai
79 %D
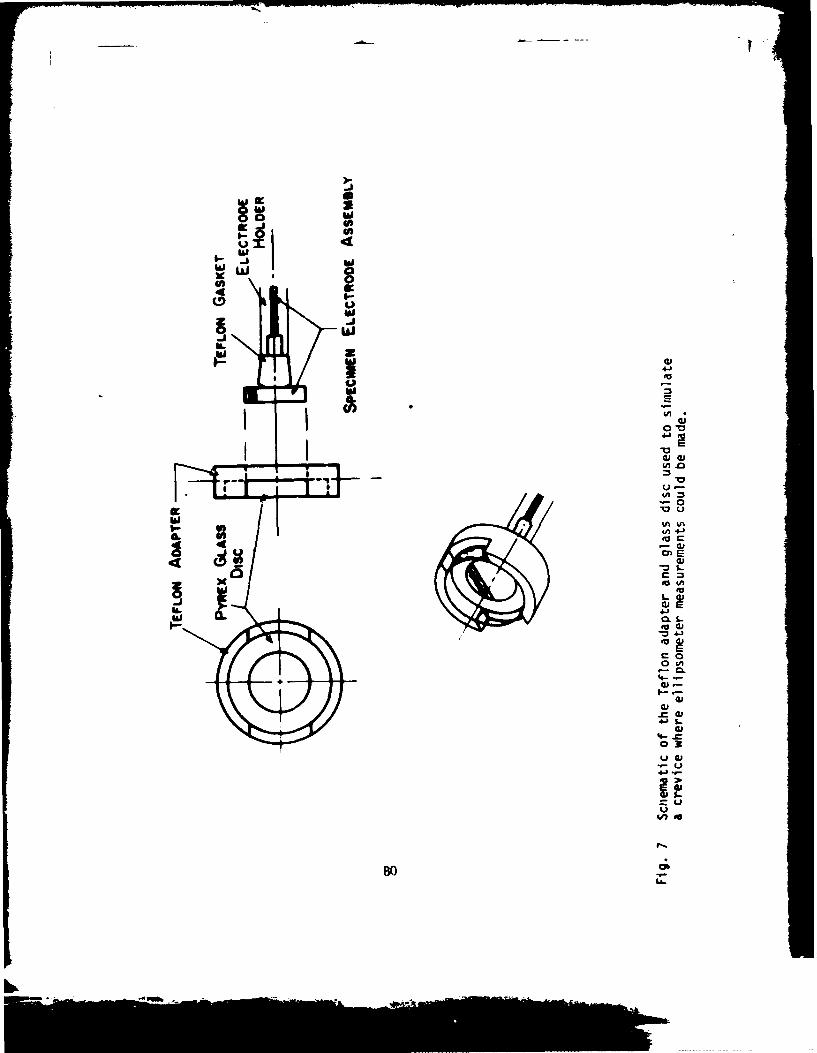
-J
VIA
V$ %
4~ E-
J-
4-h
I4 L.
a,
I i U'o *
I -U
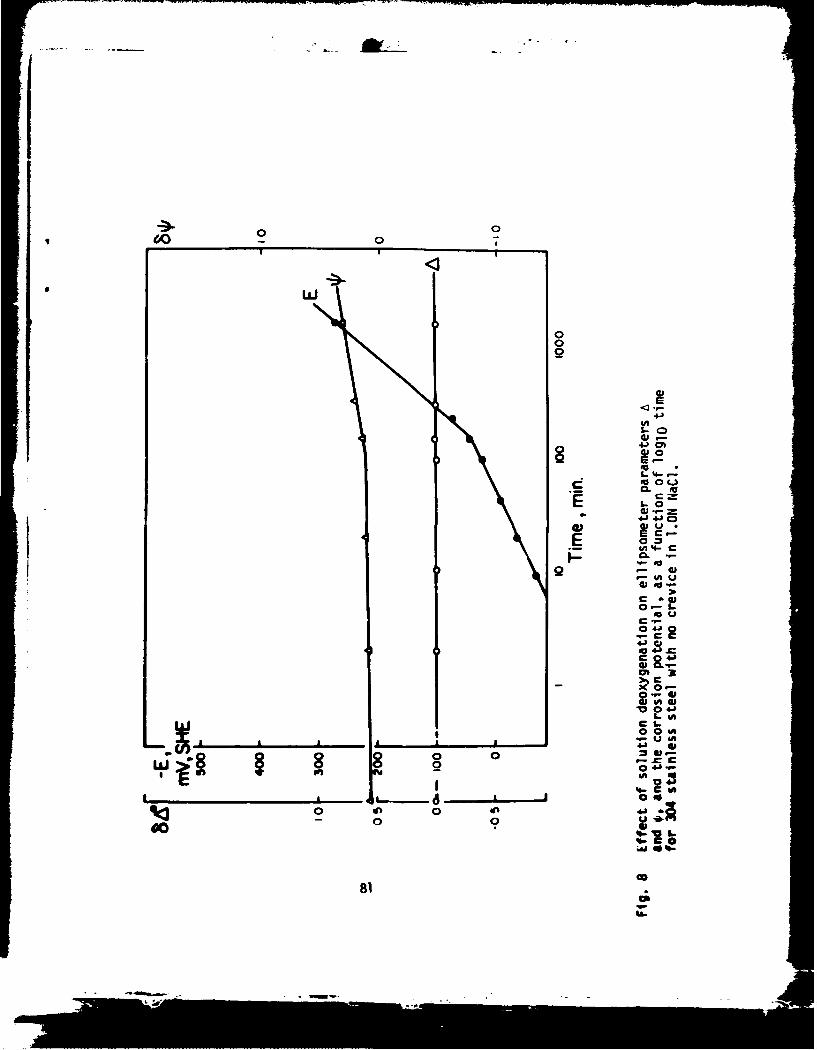
I M
ww
<03
E
L. 4-
4J 4 C
40
5=--
- C
IA u
0-
10
03 o~ ,
4 J 4 J
II
10c 4-0
c ,
- 0 40 o
03'
C 0
Lo
81ill
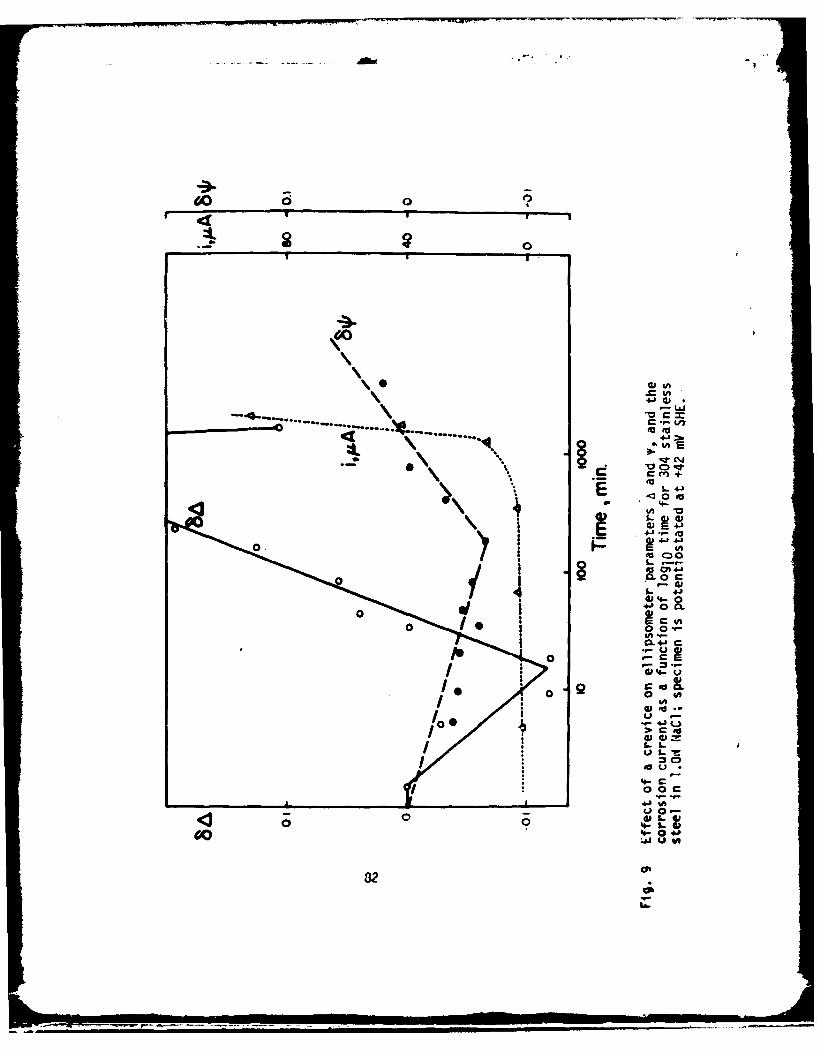
(000
.LJ
ZI W
0 ~4-
in i44
I L 4a#% 0
*a U
I.-
<2f 0 0 GjE
0-
004- .
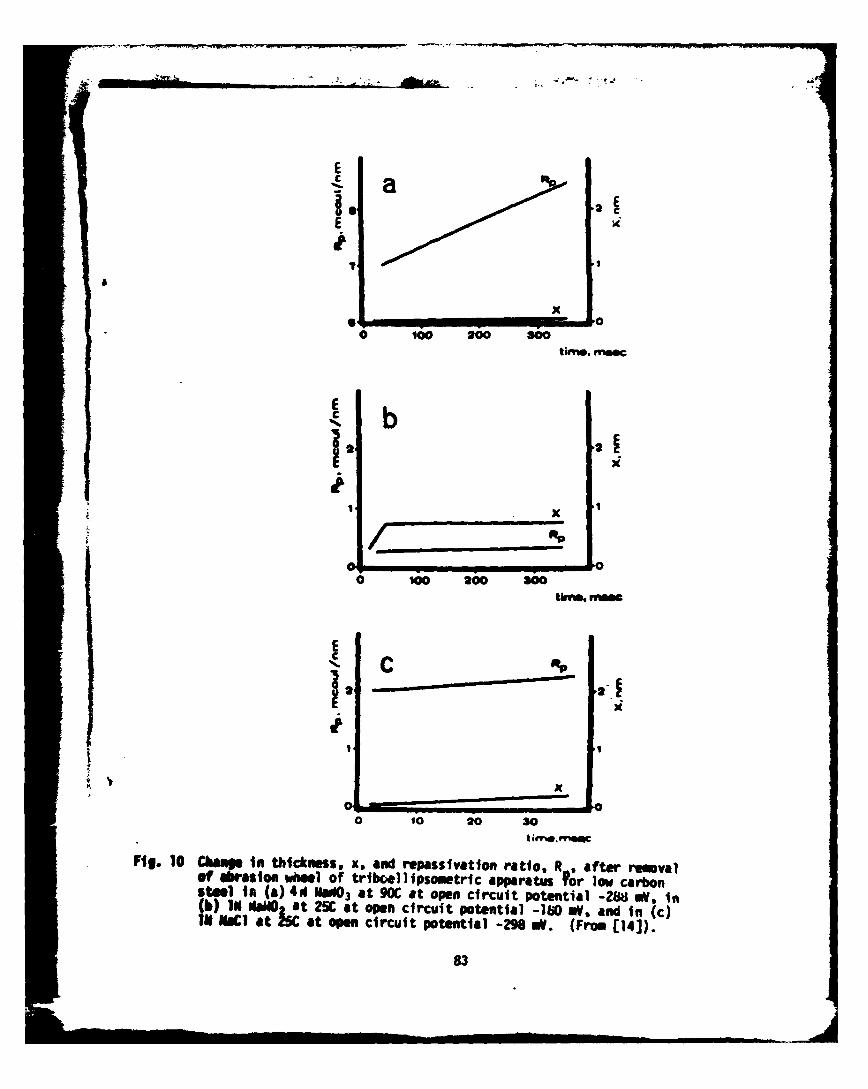
Sm I am
EC m
2E
11, x
La
0 100 200 30
Ec b
is'
010 20 30
xII
I - I I1
o 100 260 30
2o 2'
Fig. 10 Chang in thickness, x, and repassivation ratio, R , after remvalof abrasion whel of tribcel 1ipsometric apparatus or low carbonsteal in (a) 4d NmaO 3 at 90C at open circuit potential -288 mV, in(b) IN alail at 25C at open circuit potential -11 mV, and in (c)I C at C at open circuit potential -298 W. (From [14]).
83