distributed and remote fiber sensing assisted by raman ... · distributed and remote fiber sensing...
TRANSCRIPT
D
Distributed and
Remote Fiber
Sensing Assisted
by Raman Effect
Hugo Fidalgo Martins Física Departamento de Física e Astronomia
2014
Supervisor Orlando José dos Reis Frazão, Invited Assistant Professor of
Departamento de Física e Astronomia da Faculdade de Ciências da
Universidade do Porto and Senior Researcher at INESC Porto
Supervisor Miguel González-Herráez, Associate Professor, Departamento de
Electrónica de la Universidad de Alcalá

DEPARTAMENTO DE FÍSICA E
ASTRONOMIA DA FACULDADE
DE CIÊNCIAS DA
UNIVERSIDADE DO PORTO
DEPARTAMENTO DE
ELECTRÓNICA DE LA
UNIVERSIDAD DE ALCALÁ
DOCTORAL THESIS
DISTRIBUTED AND REMOTE FIBER
SENSING ASSISTED BY RAMAN EFFECT
This thesis was conducted under the supervision of
Prof. Dr. Orlando José dos Reis Frazão
Invited Assistant Professor of Departamento de Física e Astronomia da Faculdade
de Ciências da Universidade do Porto and Senior Researcher at INESC TEC
and
Prof. Dr. Miguel González-Herráez
Associate Professor of Departamento de Electrónica de la Universidad de Alcalá
Hugo Fidalgo Martins
2014


Bolsa de investigação da Fundação para a Ciência e a Tecnologia com a referência
SFRH/BD/76991/2011, financiada pelo POPH – QREN – Tipologia 4.1 – Formação
Avançada, comparticipada pelo Fundo Social Europeu e por fundos nacionais do MCTES.

FCUP Distributed and Remote fibre Sensing Assisted by Raman Effect
vi
FCUP Distributed and Remote fibre Sensing Assisted by Raman Effect
vii
Acknowledgements
I would like to thank to everyone who contributed with work, time and patience to the
realization of this thesis.
Firstly to my Portuguese supervisors Dr. Orlando Frazão and Professor Manuel Joaquim
Marques, for accepting my PhD application and continuing to unconditionally support
my work, after having already supervised my Master thesis. To Dr. Orlando Frazão, for
his support and the help provided in all the stages of the experimental work developed
in Portugal, from the numerous ideas to the scientific discussions, without forgetting his
constant presence around the laboratory. Also for facilitating an initial contact with
Professor Miguel González-Herráez, essential to arrange my research activity at the
University of Alcalá. Special thanks to Professor Manuel Joaquim Marques, not only
for the scientific discussions that were helpful to clarify the theoretical concepts
necessary for a better understanding of optics in fibres and the help in writing the thesis,
but also for assisting me with the process for the agreement of the jointly awarded PhD
between the University of Porto and University of Alcalá and other bureaucratic
procedures, which sometimes proved to be far more time and patience consuming than
anticipated.
To my Spanish supervisor Professor Miguel González-Herráez for receiving me and
providing the necessary arrangements for a most successful stay in the University of
Alcalá. His expertise in distributed sensing provided an insightful understanding of
numerous concepts and valuable help in the work developed in this area.
Especial thanks to Sonia Martin-Lopéz for introducing me to the laboratories and
assisting me in the experimental work, especially at the beginning of my stay in Alcalá.
To Pedro Corredera and Juan Diego for their good mood and the material borrowed
from the “Consejo Superior de Investigaciones Cientificas” (CSIC).
To Professor Luc Thévenaz for receiving me in École Polytechnique Fédérale de
Lausanne (EPFL) to test the possibility to perform distributed birefringence
measurements using ϕOTDR and to Dr. Marcelo Soto and Xin Lu for working with me
FCUP Distributed and Remote fibre Sensing Assisted by Raman Effect
viii
during my stay in EPFL. This collaboration was also possible due to the support
provided by COST Action TD1001 (OFSeSa).
To Dr. Cristiano Cordeiro from Instituto de Física Gleb Wataghin, UNICAMP, for
providing a three core PCF which was used as an intensity curvature sensor.
To Dr. Kay Schuster and Dr. Jens Kobelke from IPHT Jena for providing a double-core
fibre which was used as an in-line MZ interferometer.
To my co-workers and friends from INESC TEC and Alcalá, for their companionship
and good mood necessary to create a positive work environment.
To INESC TEC, the Physics and Astronomy Department of Faculdade de Ciências da
Universidade do Porto and the Universidad of Alcalá for the opportunity and logistical
support which allowed the realization of my PhD degree.
I also would like to acknowledge the PhD scholarship from FCT Fundação para a
Ciência e a Tecnologia (Portuguese Foundation for Science and Technology), SFRH /
BD / 76991 / 2011.
To my family, for their care, trust and comprehension through the years.
And last but not least, to my dearest wife Inês, for her patience and care, and for her
help in the editing corrections of several publications, including this very thesis.

FCUP Distributed and Remote fibre Sensing Assisted by Raman Effect
ix
Abstract
In this thesis, the work developed in the Physics PhD Degree project is presented. The
work was focused on distributed and remote optical fibre sensing assisted by Raman
effect.
Throughout the thesis, an effort has been made to present solid but also academic
analysis of the proposed configurations, which often included both experimental and
theoretical results as well as qualitative and quantitative explanations of the physical
principles of the measurement techniques.
A special emphasis has been given to the use of phase-sensitive optical time domain
reflectometry (ϕOTDR) for distributed vibration sensing, which was extensively
described both experimentally and theoretically using different configurations,
including the use of first and second-order Raman amplification to extend the sensing
range.
The use of ϕOTDR for static measurements was also studied: a technique based on the
correlation of ϕOTDR measurements at two orthogonal states of polarization was
proposed to measure local variations of the phase birefringence along any kind of
optical fibre.
A new configuration for an intensity vibration sensor based on a Raman fibre laser is
proposed for remote point sensing. In this case, the linear cavity of the Raman fibre
laser relied on the combination of a distributed Rayleigh mirror and FBGs (Fibre Bragg
Gratings), which were used as the sensing element and intensity filter.
As a result of parallel projects which were not directly connected to the main theme of
the thesis, it was possible to test microstructured fibres for different applications. An
intensity curvature sensor based on a three core Photonic Crystal fibre and a high-
sensitivity strain and temperature sensor based on a dissimilar-doping dual-core fibre
were proposed.
FCUP Distributed and Remote fibre Sensing Assisted by Raman Effect
x
Resumo
Nesta tese, é apresentado o trabalho desenvolvido durante o projeto de Doutoramento
em Física. O trabalho focou-se em sensores em fibra ótica distribuídos e remotos
assistidos pelo efeito Raman.
Ao longo da tese, foi feito um esforço para apresentar uma análise robusta, mas também
académica, das configurações propostas, que, muitas vezes, incluiu resultados
experimentais e teóricos, bem como explicações qualitativas e quantitativas dos
princípios físicos das técnicas de medição.
Foi dada especial importância ao uso de reflectometria ótica no domínio do tempo
sensível à fase (ϕOTDR) para medição distribuída de vibrações, que foi extensivamente
descrito a nível experimental e teórico, usando diferentes configurações, incluindo o uso
de amplificação de Raman de primeira e segunda ordens para aumentar o alcance de
deteção.
O uso de ϕOTDR para medições estáticas foi também estudado: uma técnica baseada na
correlação de medições de ϕOTDR em dois estados de polarização ortogonais foi
proposta para medir variações locais da birrefringência de fase ao longo de qualquer
tipo de fibras óticas.
Uma nova configuração para um sensor de vibrações interrogado em intensidade
baseada num laser de Raman em fibra foi proposta para um sensor pontual remoto.
Neste caso, a cavidade linear do laser Raman em fibra baseava-se na combinação de um
espelho Rayleigh distribuído e redes de Bragg em fibra, que foram usadas como
elemento sensor e filtro de intensidade.
Como resultado de projetos paralelos, não diretamente relacionados com o tema
principal desta tese, foi possível testar fibras microestruturadas para diferentes
aplicações. Um sensor de curvatura interrogado em intensidade baseado numa fibra de
cristal fotónico com três núcleos e um sensor de elevada sensibilidade de deformação e
temperatura, baseado numa fibra com dois núcleos de dopagem distinta foram
propostos.
FCUP Distributed and Remote fibre Sensing Assisted by Raman Effect
xi
Resumen
En esta memoria se presenta el trabajo realizado en el proyecto de doctorado en física.
El trabajo se centra en el estudio de sensores de fibra óptica distribuidos y remotos
asistidos por efecto Raman.
A lo largo de la tesis se hizo un esfuerzo para presentar, no solo un análisis sólido, sino
también riguroso, de las configuraciones propuestas, que incluyen con frecuencia
resultados experimentales y teóricos, así como explicaciones cualitativas y cuantitativas
de los principios físicos de las técnicas de medición.
Se prestó especial atención a la utilización de la reflectometría óptica en el dominio del
tiempo sensible a la fase (ϕOTDR) para medición distribuida de vibraciones, que se
describe ampliamente desde la punto de vista tanto experimental como teórico, usando
diferentes configuraciones e incluyendo el uso de la amplificación de Raman de primer
y segundo orden para extender el rango de detección.
Se ha estudiado también el uso de ϕOTDR para mediciones estáticas: se propuso una
técnica basada en las medidas de correlación ϕOTDR en dos estados ortogonales de
polarización con el objeto de medir las variaciones locales de la birrefringencia de fase a
lo largo de cualquier tipo de fibra óptica.
Se propuso una nueva configuración de sensor de vibración interrogado en intensidad
basado en un láser Raman en fibra para un sensor puntual remoto. En este caso, la
cavidad lineal del láser Raman en fibra se basa en una combinación de un espejo
Rayleigh distribuido y redes de Bragg en fibra, que se utilizaron como elemento sensor
y filtro de intensidad.
Como resultado de proyectos paralelos, que no están directamente relacionados con el
tema principal de esta tesis, fue posible probar fibras microestruturadas para diferentes
aplicaciones. Se han propuesto un sensor de curvatura interrogado en intensidad basado
en una fibra de cristal fotónico con tres núcleos y un sensor de elevada sensibilidad a la
deformación y la temperatura, basado en una fibra con dos núcleos con dopaje distinto.

FCUP Distributed and Remote fibre Sensing Assisted by Raman Effect
xii
Contents
Acknowledgements ........................................................................................................ vii
Abstract ............................................................................................................................ ix
Resumo ............................................................................................................................. x
Resumen .......................................................................................................................... xi
Contents .......................................................................................................................... xii
List of Figures ................................................................................................................. xv
List of Acronyms ........................................................................................................... xix
1 Introduction .............................................................................................................. 1
1.1 Contextualization of the work ............................................................................ 3
1.2 Motivation and Objectives ................................................................................. 5
1.3 Organization of the Dissertation ........................................................................ 6
1.4 Main Contributions ............................................................................................ 7
1.5 List of Publications ............................................................................................ 8
1.5.1 Articles published in International Scientific Journals (6) ......................... 8 1.5.2 Conference Proceedings (11) ..................................................................... 8
2 Optical effects in fibres........................................................................................... 11
2.1 Introduction ...................................................................................................... 13
2.2 Linear effects ................................................................................................... 13 2.2.1 Optical Losses: absorption and scattering ................................................ 14
2.2.2 Chromatic Dispersion ............................................................................... 16 2.2.3 Polarization-mode dispersion ................................................................... 18
2.3 Nonlinear Propagation ..................................................................................... 20 2.3.1 Parametric nonlinearities .......................................................................... 20
2.3.2 Nonlinear refractive index ........................................................................ 21 2.3.2.1 Modulation Instability (MI) .............................................................. 22
2.4 Scattering ......................................................................................................... 25 2.4.1 Elastic scattering: Rayleigh scattering ...................................................... 26
2.4.1.1 Rayleigh Backscattering .................................................................... 27 2.4.2 Inelastic scattering: Raman Scattering ..................................................... 28
2.4.2.1 Spontaneous Raman scattering.......................................................... 28 2.4.2.2 Stimulated Raman Scattering (SRS) ................................................. 29 2.4.2.3 Raman Gain Spectrum ...................................................................... 31 2.4.2.4 Intensity evolution and threshold for noise amplification ................. 32
3 Phase-sensitive OTDR (ϕOTDR) for distributed vibration sensing ....................... 35
3.1 Introduction ...................................................................................................... 37
3.2 ϕOTDR: Principles, Limitations and State-of-the-art ...................................... 39

FCUP Distributed and Remote fibre Sensing Assisted by Raman Effect
xiii
3.2.1 ϕOTDR principle of operation.................................................................. 39 3.2.2 ϕOTDR Historical Perspective ................................................................. 43
3.2.2.1 Events and vibration detection .......................................................... 44 3.2.3 Detection Schemes and Noise .................................................................. 45
3.2.3.1 Direct detection and noise in ϕOTDR operation ............................... 46 3.2.3.2 Coherent detection............................................................................. 48
3.2.4 Post-processing ......................................................................................... 50 3.2.5 Range increase .......................................................................................... 51
3.2.5.1 ϕOTDR Peak power limitations due to nonlinearities ...................... 52
3.2.5.2 Raman Amplification ........................................................................ 53 3.2.5.3 Brillouin Amplification ..................................................................... 54
3.2.6 Bandwidth increase................................................................................... 55
3.2.7 ϕOTDR for dynamic sensing: Performance overview ............................. 56 3.2.8 Comparison with other DFOS .................................................................. 57
3.2.8.1 Rayleigh based distributed sensing ................................................... 57 3.2.8.2 Raman based distributed sensing ...................................................... 59
3.2.8.3 Brillouin based distributed sensing ................................................... 60
3.3 ϕOTDR for distributed vibration sensing ........................................................ 62
3.3.1 Introduction .............................................................................................. 62 3.3.2 Theoretical Model..................................................................................... 62
3.3.2.1 Signal statistics .................................................................................. 62
3.3.2.2 Signal-to-noise ratio (SNR) ............................................................... 64 3.3.3 Experimental Work................................................................................... 65
3.3.3.1 Setup .................................................................................................. 65
3.3.3.2 ϕOTDR trace characterization........................................................... 67
3.3.3.3 Vibration Measurements ................................................................... 69 3.3.4 Conclusions .............................................................................................. 73
3.4 ϕOTDR Pulse Peak Power limitation: Modulation Instability (MI) ................ 74 3.4.1 Introduction .............................................................................................. 74
3.4.2 Theoretical Model: Pulse propagation affected by MI ............................. 74 3.4.3 Experimental Work................................................................................... 75
3.4.3.1 MI impact on the ϕOTDR trace ........................................................ 76 3.4.3.2 Pulse spectra at the fibre end (in transmission) ................................. 77
3.4.4 Conclusions .............................................................................................. 79
3.5 Extending the sensing range: ϕOTDR assisted by first-order Raman ............. 80
3.5.1 Introduction .............................................................................................. 80
3.5.2 Theoretical Model: ϕOTDR pulse power evolution along the fibre......... 80 3.5.3 Experimental Work................................................................................... 82
3.5.3.1 Setup .................................................................................................. 82 3.5.3.2 Noise Considerations: ASE, RIN transfer and Balanced detection .. 84 3.5.3.3 ϕOTDR Traces .................................................................................. 87
3.5.3.4 Evolution of the ϕOTDR trace for different Raman Pump powers .. 90 3.5.3.5 Vibration Measurements ................................................................... 90
3.5.4 Conclusions .............................................................................................. 94
3.6 Extending the sensing range: ϕOTDR assisted by second-order Raman......... 95 3.6.1 Introduction .............................................................................................. 95
3.6.2 Experimental Setup .................................................................................. 95 3.6.3 RIN noise: Balanced VS Direct detection ................................................ 96 3.6.4 ϕOTDR trace ............................................................................................ 97
FCUP Distributed and Remote fibre Sensing Assisted by Raman Effect
xiv
3.6.5 Vibration measurements ........................................................................... 99 3.6.6 Spatial Resolution ................................................................................... 100 3.6.7 Conclusions ............................................................................................ 101
3.7 ϕOTDR for distributed vibration sensing: Conclusions ................................ 102
4 ϕOTDR for distributed birefringence measurements ........................................... 103
4.1 Introduction .................................................................................................... 105
4.2 State-of-the-Art .............................................................................................. 105
4.3 ϕOTDR for static measurements: Theoretical model .................................... 106 4.3.1 Birefringence measurements .................................................................. 108
4.4 Experimental Work ........................................................................................ 109
4.4.1 Setup ....................................................................................................... 109 4.4.2 Birefringence of PMFs ........................................................................... 110 4.4.3 Birefringence of SMFs ........................................................................... 111
4.5 Conclusions .................................................................................................... 112
5 URFL for remote vibration sensing ...................................................................... 115
5.1 Introduction .................................................................................................... 117
5.2 State-of-the-Art .............................................................................................. 117
5.3 Experimental Work ........................................................................................ 118
5.4 Discussion ...................................................................................................... 123
5.5 Conclusions .................................................................................................... 124
6 Other Contributions .............................................................................................. 125
6.1 Intensity curvature sensor based on a photonic crystal fibre with three coupled
cores 127 6.1.1 Introduction ............................................................................................ 127
6.1.2 Experimental Work................................................................................. 128 6.1.3 Conclusions ............................................................................................ 132
6.2 High sensitivity dispersive Mach-Zehnder interferometer based on a
dissimilar-doping dual-core fibre for sensing applications ...................................... 134 6.2.1 Introduction ............................................................................................ 134
6.2.2 Theoretical Model................................................................................... 135
6.2.3 Experimental Work................................................................................. 138 6.2.4 Conclusions ............................................................................................ 142
7 Final Conclusions and Future Work ..................................................................... 143
7.1 Final Conclusions .......................................................................................... 145
7.2 Future Work ................................................................................................... 146
References .................................................................................................................... 149
FCUP Distributed and Remote fibre Sensing Assisted by Raman Effect
xv
List of Figures
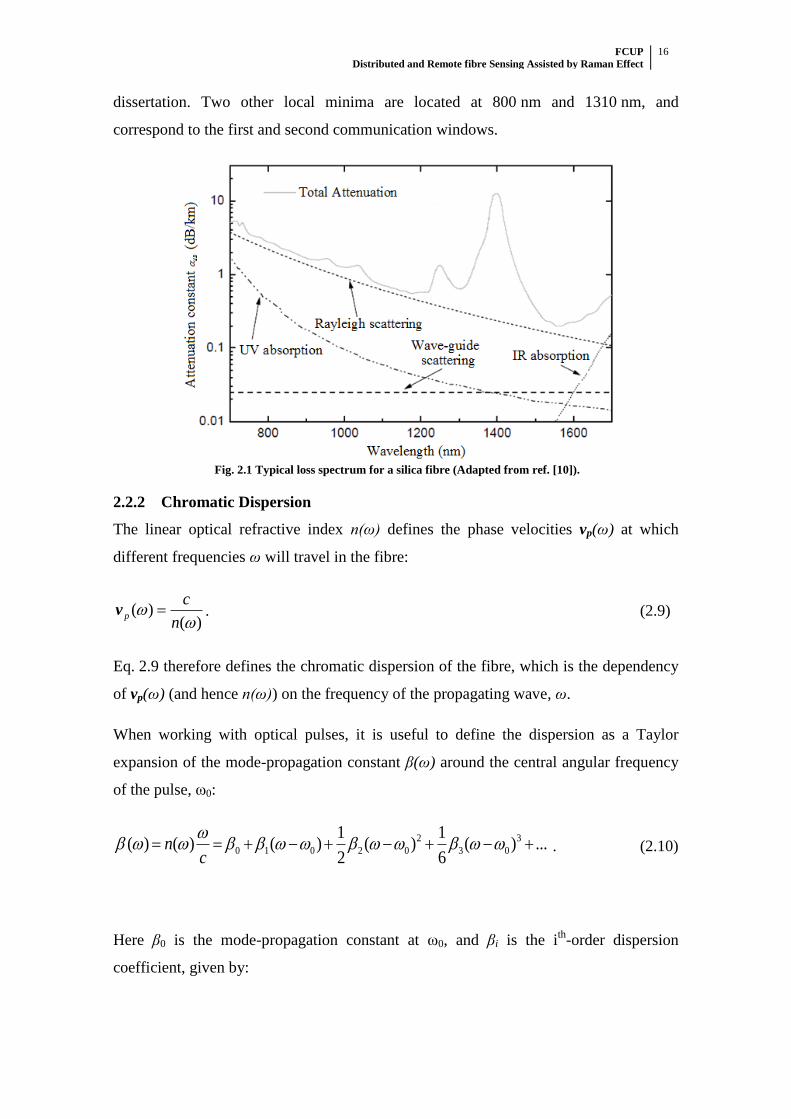
Fig. 2.1 Typical loss spectrum for a silica fibre (Adapted from ref. [10]). .................... 16
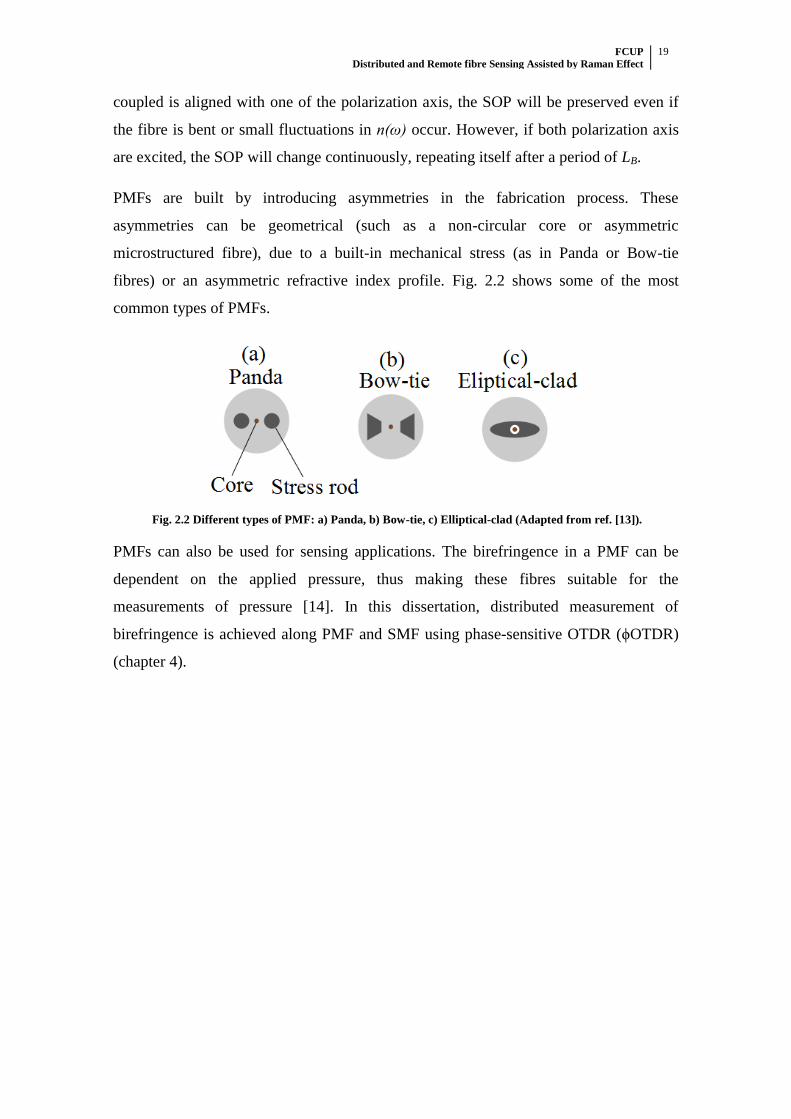
Fig. 2.2 Different types of PMF: a) Panda, b) Bow-tie, c) Elliptical-clad (Adapted from
ref. [13]). ......................................................................................................................... 19
Fig. 2.3 Gain spectrum induced by MI using the parameters of a typical SMF. ............ 24
Fig. 2.4 Energy variations for different types of scattering (Adapted from ref. [18]). ... 26
Fig. 2.5 Rayleigh scattering of light propagating in a dense inhomogeneous medium. . 27
Fig. 2.6 Counter-propagating wave generated by Rayleigh backscattering in fibres. .... 28
Fig. 2.7 Stimulated Raman a) Stokes and b) anti-Stokes scattering. .............................. 30
Fig. 2.8 Raman gain spectrum R
g (Ω) for fused silica (Adapted from ref. [9])............... 31
Fig. 3.1 Setup of an OTDR based system. FUT: fibre under test. .................................. 39
Fig. 3.2 Propagation of an OTDR pulse in the fibre and respective Rayleigh
backscattered signal generated at a time: a) t=T; b) t=T+∆t/2.; c) the backscattered
signals reflected at different times reaching the detector (z=0) at t=2T. ........................ 40
Fig. 3.3 Typical trace of: a) conventional OTDR; b) ϕOTDR. ...................................... 42
Fig. 3.4 ϕOTDR trace before and after a disturbance occurs at a point in the fibre. ...... 42
Fig. 3.5 ϕOTDR setup used for intrusion sensing in fields tests (adapted from ref. [33]).
........................................................................................................................................ 44
Fig. 3.6 Practical setup of a ϕOTDR using coherent detection. ..................................... 48
Fig. 3.7 Power distribution along the fibre for a ϕOTDR pulse with finite ER. ............ 65
Fig. 3.8 Experimental setup of the ϕOTDR used for distributed vibration sensing. ...... 66
Fig. 3.9 Spectrum of a low coherence laser before and after passing through the SOA. 67
Fig. 3.10 ϕOTDR trace for a pulse peak power of ~400 mW (figure inset: losses have
been numerically compensated to improve visualization). The top figure shows the
visibility of the trace. ...................................................................................................... 68
Fig. 3.11 Experimental (5∙106 traces obtained under the same conditions of the one
presented in Fig. 3.10, over ≈10 min) and theoretical optical intensity distribution in the
ϕOTDR trace (figure inset: cumulative probability function). ....................................... 69
Fig. 3.12 ϕOTDR signal at the position corresponding to the metre length inside the
tube (590 m) for an applied vibration of 20 Hz: a) Optical power variation along time
and b) respective FFT. .................................................................................................... 70
FCUP Distributed and Remote fibre Sensing Assisted by Raman Effect
xvi
Fig. 3.13 Normalized sensitivity of the measurement as a function of the normalized
average optical power of the ϕOTDR trace at the measured point (left) and its histogram
(right). ............................................................................................................................. 72
Fig. 3.14 FFT spectra of the optical power variation of the ϕOTDR time signal at a
given position for an applied vibration frequency from 2 kHz to 39.5 kHz................... 73
Fig. 3.15 Simulation of the ϕOTDR pulse spectrum evolution along an SMF for a
ϕOTDR pulse peak power of 1.25 W. ............................................................................ 75
Fig. 3.16 ϕOTDR trace and theoretical fraction of power contained in the central
wavelength along the FUT for a ϕOTDR pulse peak power of ~1.25 W (main figure)
and ~0.35 W (figure inset). The top figure shows the visibility of the ϕOTDR signal of
the main figure. ............................................................................................................... 76
Fig. 3.17 Normalized optical power of the peak and sidebands at the end of the FUT for
different ϕOTDR pulse powers (inset figures: spectrum for ϕOTDR pulse powers of: a)
24.5 dBm, b) 27.8 dBm and c) 28.8 dBm). .................................................................... 78
Fig. 3.18 Experimental setup of ϕOTDR assisted by first-order Raman amplification. 83
Fig. 3.19 Spectra of the ϕOTDR pulses after passing the optical switch in the “on” and
“off” states ...................................................................................................................... 84
Fig. 3.20 Optical spectrum returning from the FUT: a) before the micro-EDFA and b)
after the micro-EDFA (including signals received in the “+” and “-” ports of the
balanced detector (signal channel and adjacent channel)).............................................. 85
Fig. 3.21 Comparison of the RIN for a) Direct b) Balanced detection in a 75 km FUT. 86
Fig. 3.22 RIN noise returned from 125 km FUT for a Raman pump power of 0.6 W
launched on each end of the fibre, without input ϕOTDR pulse, using balanced and
direct detection. .............................................................................................................. 87
Fig. 3.23 ϕOTDR trace for a FUT of a) 110 km and b) 125 km. The Raman pump power
launched on each end of the fibre was 0.6 W and the ϕOTDR pulse power was chosen
as the one ensuring the best performance in both cases. The theoretical modeling of the
Raman pump power and ϕOTDR pulse power along the FUT is also presented. The top
figure shows the visibility of the interference signal. ..................................................... 88
Fig. 3.24 Experimental and theoretical evolution of the trace profile for different Raman
pump powers (total Raman input power), using a FUT of 110 km. The ϕOTDR pulse
power chosen for each Raman pump power was the one ensuring the best performance.
........................................................................................................................................ 90
FCUP Distributed and Remote fibre Sensing Assisted by Raman Effect
xvii
Fig. 3.25 ϕOTDR signal at the fibre point with the minimum amplitude of the trace
oscillations (km 98) of the 110 km FUT, using the same conditions of Fig. 3.23a, for an
applied vibration of 40 Hz: a) Optical power variation along time and b) respective FFT.
........................................................................................................................................ 92
Fig. 3.26 FFT spectra of the optical power variation of the ϕOTDR signal along time in
the fibre point with minimum amplitude of the trace oscillations (after km 98) of the
a) 110 km and b) 125 km FUT for applied frequencies between 10 Hz and a) 300 Hz
and b) 250 Hz, using the same conditions of Fig. 3.23 for each FUT. ........................... 93
Fig. 3.27 Experimental setup of ϕOTDR assisted by second-order Raman amplification.
........................................................................................................................................ 95
Fig. 3.28 Characterization of the noise in the electrical spectrum domain of the signal
returning from the fibre when a Raman pump power of 28.5 dBm is launched on both
ends of the FUT without input ϕOTDR pulse, using balanced and direct detections. ... 97
Fig. 3.29 ϕOTDR trace when the Raman pump power launched on each end of the FUT
was 28.5 dBm. In this case, the ϕOTDR pulse power was chosen as the one ensuring the
best performance. The top figure shows the visibility of the trace................................. 98
Fig. 3.30 FFT spectra of the optical power variation of the ϕOTDR signal along time at
the point of the FUT with minimum signal, for applied frequencies between 20 Hz and
380 Hz, using the same conditions of Fig. 3.29. .......................................................... 100
Fig. 3.31 Normalized energy density of vibrations around 20 Hz along the FUT when a
vibration of 20 Hz was applied to the PVC tube (at ~98.8 km). In the figure inset a
gaussian fit of the points where the vibration was detected is shown, presenting 6 m at
FWHM. ......................................................................................................................... 101
Fig. 4.1 Experimental setup of the ϕOTDR used for distributed birefringence
measurements. .............................................................................................................. 110
Fig. 4.2 Distributed profile of phase birefringence versus distance along a) 80 m Panda
PMF and b) 100 m elliptical-core PMF. ....................................................................... 110
Fig. 4.3 Distributed birefringence measurement in a SMF: a) Measured frequency and
birefringence profile versus distance b) cross-correlation spectrum at 220 m distance.
...................................................................................................................................... 112
Fig. 5.1 Experimental Setup of the Raman FBG laser intensity vibration sensor. ....... 119
Fig. 5.2 Optical power output as a function of the Raman power input of the Raman
FBG laser without the filter FBG (Figure inset: output spectra for the input Raman
pump powers of 600 mW and 800 mW). ..................................................................... 120
FCUP Distributed and Remote fibre Sensing Assisted by Raman Effect
xviii
Fig. 5.3 Optical output spectra for maximum and minimum applied strain to the sensing
head (FigureiInset: reflection spectra of the filter FBG and sensor FBG for maximum
and minimum applied strain to the sensing head). ....................................................... 121
Fig. 5.4 Output optical power variation of the laser in the time domain for applied
vibrations of different frequencies (arbitrary optical power reference level). .............. 121
Fig. 5.5 Central frequency output power (converted electric signal) for applied
vibrations of different frequencies (Figure inset: output power in the frequency domain
for 100 Hz and 260 Hz). ............................................................................................... 122
Fig. 5.6 Amplitude of the vibration as a function of the maximum strain variation
(induced by applying an electrical signal to the PZT). ................................................. 123
Fig. 6.1 Experimental setup of the bending sensor based on a PCF with three coupled
cores. ............................................................................................................................. 128
Fig. 6.2 Cross-section of the PCF with three cores with a magnification of 865x (inset
figure with a magnification of 9000x). ......................................................................... 129
Fig. 6.3 Spectral response for different applied curvatures (reflection setup). ............ 130
Fig. 6.4 Average optical power vs curvature for rotation angles of 0º, 30º and 90º of the
PCF along its axis (Solid lines are a linear fit of the experimental data; for the 30
degrees measurements two regimes are considered: low curvatures (0-1.5 m-1
) and high
curvatures (1.7-2.8 m-1
)). .............................................................................................. 131
Fig. 6.5 Cross-section of the dual-core fibre, showing the germanium and phosphorous
doped cores. .................................................................................................................. 135
Fig. 6.6 Theoretical phase (the lines) of the interferometer as a function of the
wavelength for a fibre at a) Room temperature with no strain, b) temperature applied, c)
strain applied. The experimental peaks are also represented (dots). The values used in
the simulation are presented in the text. ....................................................................... 138
Fig. 6.7 Experimental setup used to characterize the dual-core fibre as a strain and
temperature sensor. ....................................................................................................... 139
Fig. 6.8 Shift of the normalized transmission spectrum of the dispersive interferometer
with increasing applied a) strain and b) temperature. ................................................... 140
Fig. 6.9 Peaks wavelength shift of the dispersive interferometer spectrum as a function
of the applied a) strain and b) temperature. .................................................................. 141
FCUP Distributed and Remote fibre Sensing Assisted by Raman Effect
xix
List of Acronyms
ϕOTDR – Phase-sensitive optical time domain
reflectometry
ASE – Amplified Spontaneous Emission
BOTDA – Brillouin Optical Time Domain
Analysis
BOTDR – Brillouin optical time domain
reflectometry
COTDR – Coherent OTDR
CW – Continuous wave
DBG – Dynamic Brillouin gratings
DC – Direct current
DCF – Dispersion Compensating fibre
DFB – Distributed-Feedback
DFOS – Distributed fibre optic sensors
DFWM – Degenerate Four-wave mixing
DPP – Differential Pulse-Width pair
DTS – Distributed temperature sensing
EDFA – Erbium-Doped fibre Amplifier
EOM – Electro-Optic Modulator
ER – Extinction Ratio
ESA – Electrical Spectrum Analyzer
FBG – fibre Bragg grating
FFT – Fast Fourier Transform
FPU – Fermi-Pasta-Ulam
FUT – fibre Under Test
FWHM – Full-Width at Half-Maximum
FWM – Four-wave Mixing
GDD – Group delay dispersion
GVD – Group Velocity Dispersion
IR – Infrared
IYL – International Year of Light
LD – Laser Diode
LO - Local oscillator
MI – Modulation Instability
MMF – Multimode fibres
MZ – Mach-Zehnder
MZI – Mach-Zehnder interferometer
NLSE – Nonlinear Schrödinger Equation
OFDR – Optical Frequency Domain
Reflectometry
OSA – Optical Spectrum Analyzer
OTDR – Optical time domain reflectometry
PC – Polarization Controller
PCF – Photonic Crystal fibre
PDL – Polarization dependent loss
PMD – Polarization-mode dispersion
PMF – Polarization-maintaining fibre
POTDR – Polarization OTDR
PSw – Polarization Switch
PZT – Piezoelectric element
RFL – Raman fibre Laser
RIN – Relative Intensity Noise
RMS – Root mean square
SBS – Stimulated Brillouin scattering
SFG – Sum-Frequency Generation
SG – Signal Generator
SHG – Second-Harmonic Generation
SMF – Single-mode fibres
SMS – Single-Mode-Multimode-single-mode
SNR – Signal-to-noise ratio
SRS – Stimulated Raman scattering
SOA – Semiconductor Optical Amplifier
SOP – State of polarization
SPM – Self-phase Modulation
TOD – Third-order dispersion
TOF – Tuneable Optical Filter
URFL – Ultralong Raman fibre laser
UV – Ultraviolet
WDMs – Wavelength division multiplexers
XPM – Cross-phase modulation

FCUP Distributed and Remote fibre Sensing Assisted by Raman Effect
xx

FCUP Distributed and Remote fibre Sensing Assisted by Raman Effect
1
1 Introduction

FCUP Distributed and Remote fibre Sensing Assisted by Raman Effect
2
FCUP Distributed and Remote fibre Sensing Assisted by Raman Effect
3
1.1 Contextualization of the work
In the 21st century, light based technology plays a vital role in our daily lives, having
revolutionized areas as important as medicine, internet communications, among several
others. The importance of such systems is well established and recognized by
prestigious international entities: in 2009 Charles Kao won the Nobel Prize in Physics
for "groundbreaking achievements concerning the transmission of light in fibres for
optical communication"; in the end of 2013, the United Nations (UN) proclaimed 2015
as the International Year of Light and Light-based Technologies (IYL 2015).
In the context of optical fibres, a number of linear and nonlinear effects can be
generated which can set limitations or be used in an advantageous manner, depending
on the specific situation. Rayleigh scattering is the main effect responsible for fibre
losses in the 1.55 μm region. Brillouin scattering can limit the transmitted power,
especially with narrowband optical signals. Modulation instability (MI) and Raman
scattering can generate and amplify noise at frequencies near that of the main signal.
However, using the same effects, Rayleigh backscatter, Brillouin and Raman effects can
also be used for distributed sensing and MI has been used to generate stable ultra-short
pulses. Raman amplification has also been widely studied and reported in the scientific
literature as a way to increase the sensing range and signal-to-noise ratio (SNR) of
optical communications and sensing systems. Understanding these optical effects is
therefore of fundamental importance, whether to limit their impact on existing optical
systems or to develop new ones.
Among light based systems, the specific interest in fibre optic sensors has increased
significantly over the last decade due to their intrinsic properties, such as immunity to
electromagnetic noise, small size, geometric versatility, lightweight, relatively low cost,
possibility of remote operation and multiplexing capability. In most systems, the fibre
can be used as both the sensing element and the communication channel, which allows
numerous convenient solutions using this type of technology. When the number of
points to be monitored is very large, distributed sensors present clear advantages over
conventional point sensors, due to their low cost per monitored point, and should
therefore be preferred for monitoring large important infrastructures such as bridges,
dams, railways, pipelines for gas and oil transport, high power electrical lines or
national borders.
FCUP Distributed and Remote fibre Sensing Assisted by Raman Effect
4
Several types of distributed fibre optic sensors have been demonstrated for monitoring
different parameters at any point along a fibre. Optical time domain reflectometry
(OTDR) is a Rayleigh backscatter based technique commonly used for distributed
measurement of losses along the fibre (including the measurement of fibre attenuation,
the location of broken points and optical connectors, discontinuities and others).
Brillouin based sensing is traditionally used in strain and temperature sensing. The use
of phase-sensitive OTDR (ϕOTDR) has been demonstrated for the distributed
measurement of vibrations which can be used to monitor intrusions and, more recently,
for highly sensitive distributed temperature measurements. Depending on the required
spatial resolution, the distributed optical fibre sensors mentioned can typically present
measuring ranges of up to a few tens of kilometers which, depending on the application,
may not be enough.
In this context, the aim of this PhD program is to study the possibility of using the
Raman effect to improve the performance, mainly the sensing range and SNR, of
distributed and remote optical fibre sensors. Special care is taken with the detrimental
phenomena associated with the technique, mainly the amplified spontaneous emission
(ASE) noise introduced and the Relative Intensity Noise (RIN) transfer which can
severely degrade the system performance.
FCUP Distributed and Remote fibre Sensing Assisted by Raman Effect
5
1.2 Motivation and Objectives
The main motivations for the work reported in this PhD thesis were the study of the
possibility of using the Raman effect to improve the performance of distributed and
remote optical fibre sensors, mainly focused on vibration sensing.
Acquisition of further knowledge and better understanding of the different effects which
occur in optical fibres, and of the fundamental physical mechanisms which lead to them,
were also an ever present motivation for the work developed in this thesis.
The following objectives have been addressed in this PhD programme:
Perform a detailed study of ϕOTDR operation when used for distributed
vibration sensing, including proper identification of the main linear and
nonlinear effects which limit its performance, in order to avoid/minimize them
in future systems.
Document the use of first- and second-order Raman amplification schemes to
increase the performance of ϕOTDR distributed vibration sensing using the best
configurations identified in the previous point. Characterize its performance as
well as the limiting effects of the system, with especial attention to the RIN
transfer and ASE noise introduced by the Raman pumps.
Investigate the possibility of using a Raman fibre laser (RFL) combined with
fibre Bragg gratings (FBGs) for remote point sensing of vibrations with high
SNR and optical intensity variation interrogation.
Work with microstructured fibres, evaluating the possibility to use them for
optical sensing.
FCUP Distributed and Remote fibre Sensing Assisted by Raman Effect
6
1.3 Organization of the Dissertation
This thesis is divided into seven chapters in which several concepts related to the work
developed are described.
In chapter 1, besides the contextualization of the work and the description of motivation
and objectives, a list of the main contributions and publications is presented.
In chapter 2, the physical explanation of the optical properties of the fibres used in this
thesis is presented. Losses, dispersion and birefringence are discussed as linear effects.
As for the nonlinear effects, parametric nonlinearities and nonlinear refractive index,
which lead to the occurrence of MI in fibres, are discussed. Lastly, an overview of
Rayleigh and Raman scattering processes is presented.
In chapter 3, an extensive investigation on the use of ϕOTDR for distributed vibration
sensing, which includes experimental and theoretical descriptions using different
configurations, is presented. The limitations due to MI are discussed and the
performance of the different configurations, including the use of first and second-order
Raman amplification, is analyzed.
In chapter 4, a method to measure local variations of the phase birefringence along any
kind of optical fibre is proposed. The technique is based on the correlation of ϕOTDR
measurements of two orthogonal states of polarization.
In chapter 5, a new configuration for a remote intensity vibration sensor based on a
Raman fibre laser is proposed. The linear cavity of the Raman fibre laser relies on the
combination of a distributed Rayleigh mirror and FBGs, which are used as the sensing
element and intensity filter.
In chapter 6, two additional works, which resulted from parallel projects which were not
directly connected to the main theme of the thesis, are presented. Firstly, a curvature
sensor which uses a simple interrogation technique based on optical power variation
using a Photonic Crystal fibre (PCF) is proposed. Then, a dual-core fibre, in which one
of the cores is doped with Germanium and the other with Phosphorus, is used as an in-
line Mach-Zehnder (MZ) dispersive interferometer, is characterized for strain and
temperature measurement.
FCUP Distributed and Remote fibre Sensing Assisted by Raman Effect
7
In chapter 7, the final conclusions of the thesis and some suggestions for future work
are presented.
1.4 Main Contributions
The most important contributions which resulted from the work developed during this
PhD programme are listed below:
- Theoretical and experimental in-depth descriptions of the impact of MI in the
performance of a ϕOTDR are presented, to the best of our knowledge, for the
first time. It has been demonstrated that MI generally leads to localized fading of
the interference recorded in the trace and therefore to loss of sensitivity in these
positions. This work can be useful for understanding the limitations imposed by
MI in ϕOTDR operation in both dynamic and static measurements.
- An experimental and theoretical description of the use of first and second-order
Raman amplification to improve the performance of ϕOTDR is presented. The
detection of vibrations of up to 250 Hz and 380 Hz, respectively, over 125 km
with a resolution of 10 m and no post-processing was achieved.
- A technique that uses the cross-correlation between ϕOTDR measurements of
orthogonal states of polarization has been proposed and experimentally validated
for distributed birefringence measurement. The method offers the possibility to
discriminate local birefringence variations along many tens of km of optical
fibres with metric spatial resolution. The high birefringence accuracy
demonstrated (~10-7
) enables proper distributed characterization of low
birefringence single-mode fibres.
- A new device concept for a highly sensitive MZ interferometer, based on a dual-
core fibre with dissimilar-doping, has been described theoretically and
experimentally. Opposite sensitivities for wavelength peaks above and below the
central wavelength of the interferometer were demonstrated when strain and
temperature were applied. To our knowledge this is the first time that such
behaviour was demonstrated using this type of in-line interferometer based on a
dual-core fibre. A sensitivity of (0.102±0.002) nm/με, between 0-800 με, and
(-4.0±0.2) nm/ºC between 47-62ºC, was demonstrated.
FCUP Distributed and Remote fibre Sensing Assisted by Raman Effect
8
1.5 List of Publications
During the PhD thesis project the author published six papers in international scientific
journals, all as first author.
The results obtained during the PhD thesis were also presented at seven international
conferences and two national conferences. The references of the published articles and
conference proceedings are listed below.
1.5.1 Articles published in International Scientific Journals (6)
[1] Martins, H.F., et al., Intensity Curvature Sensor based on Photonic Crystal fibre
with Three Coupled Cores, Optics Communications, 2012 285(24): pp.5128-5131.
[2] Martins, H.F., et al., Modulation instability-induced fading in phase-sensitive optical
time-domain reflectometry. Optics Letters, 2013. 38(6): p. 872-874.
[3] Martins, H.F., et al., Coherent Noise Reduction in High Visibility Phase-Sensitive
Optical Time Domain Reflectometer for Distributed Sensing of Ultrasonic Waves.
Journal of Lightwave Technology, 2013. 31(23): p. 3631-3637.
[4] Martins, H.F., M.B. Marques, and O. Frazão, Intensity vibration sensor based on
Raman fibre laser using a distributed mirror combined with Bragg grating structures.
Applied Physics B, 2014. 114(4): p. 455-459.
[5] Martins, H.F., et al., Phase-sensitive optical time domain reflectometer assisted by
first-order Raman amplification for distributed vibration sensing over >100km. Journal
of Lightwave Technology, 2014. 32(8): p. 1510-1518.
[6] Martins, H.F., et al, High-sensitivity dispersive Mach-Zehnder interferometer based
on a dissimilar-doping dual-core fibre for sensing applications, Optics Letters, 2014
39(9): pp.2763-2766.
1.5.2 Conference Proceedings (11)
1. -H. F. Martins, M. J. Marques, P. Jorge, C. M. B. Cordeiro, O. Frazão, "Intensity
Curvature Sensor based on Photonic Crystal fibre with Three Coupled" Cores, SPIE
Photonics Europe 201 - SPIE Photonics Europe 2012 | Photonics, Optics, Lasers,
Micro- Nanotechnologies Research, vol.8026, Brussels, Belgium, 2012.
FCUP Distributed and Remote fibre Sensing Assisted by Raman Effect
9
2. -H. Martins, M. B. Marques and O. Frazão, "100 km-Ultralong Raman fibre Laser
using a Distributed Rayleigh Mirror for Sensing Applications" SEON 2012 - X
Symposium on Enabling Optical Networks and Sensors, Porto, Portugal, 2012.
3. -H. F. Martins, M. J. Marques, O. Frazão, "Sensor de vibração usando laser de
Raman com espalhamento de Rayleigh cooperativo," Física 2012 - Física 2012,
Aveiro, Portugal, 2012.
4. -H. F. Martins, S. M. Lopez, P. Corredera, M. L. Filograno, O. Frazão and M. G.
Herráez, "Modulation instability-induced visibility fading in phase-sensitive
OTDR," EWOFS 2013 - 5th European Workshop on Optical fibre Sensors, Kraków,
Poland, May, 2013.
5. -H. F. Martins, S. M. Lopez, P. Corredera, M. L. Filograno, O. Frazão and M. G.
Herráez, "High visibility phase-sensitive optical time domain reflectometer for
distributed sensing of ultrasonic waves," EWOFS 2013 - 5th European Workshop
on Optical fibre Sensors, Kraków, Poland, May, 2013.
6. -H. F. Martins, S. M. Lopez, P. Corredera, M. L. Filograno, O. Frazão and M. G.
Herráez, "Characterization of a phase-sensitive optical time domain reflectometer
used for distributed sensing of vibrations and its performance limits due to
modulation instability," OPTOEL 2013, Alcalá de Henares, Spain, 2013
7. -H. F. Martins, M. J. Marques, O. Frazão, "Raman fibre laser using a distributed
mirror combined with Bragg grating structures for intensity vibration sensing,"
RIAO/OPTILAS 2013 - VIII Iberoamerican Conference on Optics and XI
Latinamerican meeting on Optics Lasers and Applications, Oporto, Portugal, July,
2013.
8. -H. F. Martins, J. Bierlich, K.Wondraczek, S. Unger, J. Kobelke, K. Schuster, M. B.
Marquesa, M. Gonzalez-Herraez, O. Frazão, “Dual core fibre interferometer as in-
line Mach-Zenhder interferometer sensor”, AOP14 Second International Conference
on Applications of Optics and Photonics, Aveiro, Portugal, 2014
9. -H. F. Martins, J. Bierlich, K.Wondraczek, S. Unger, J. Kobelke, K. Schuster, M. B.
Marquesa, M. Gonzalez-Herraez, O. Frazão, “In-line Mach-Zehnder interferometer
based on a dissimilar-doping dual-core fibre for high sensitivity strain and
temperature sensing”, OFS-23 2014, Santander, Spain, 2014
10. -H. F. Martins, S. Martin-Lopez, M. L. Filograno, P. Corredera, O. Frazão, and M.
Gonzalez-Herraez, “Comparison of the use of first and second-order Raman

FCUP Distributed and Remote fibre Sensing Assisted by Raman Effect
10
amplification to assist a phase-sensitive optical time domain reflectometer in
distributed vibration sensing over 125 km”, OFS-23 2014, Santander, Spain, 2014
11. -H. F. Martins, X. Lu, M. A. Soto, M. Gonzalez-Herraez, L. Thévenaz. “Distributed
Birefringence Measurements Using Polarisation Correlation in Phase-Sensitive
OTDR”, ECOC 2014, Cannes, France, 2014 (paper accepted).
FCUP Distributed and Remote fibre Sensing Assisted by Raman Effect
11
2 Optical effects in fibres

FCUP Distributed and Remote fibre Sensing Assisted by Raman Effect
12
FCUP Distributed and Remote fibre Sensing Assisted by Raman Effect
13
2.1 Introduction
A number of processes can affect the characteristics of any optical wave travelling in a
medium, and optical fibres are no different. Since it is important for the reader to be
aware of this situation, a thorough theoretical description of the most relevant effects
which occur in optical fibres, within the context of the work reported in this
dissertation, will be presented in this chapter.
Firstly, the propagation of light in the linear regime will be described, presenting an
overview of the losses (with special emphasis on Rayleigh scattering), chromatic
dispersion and polarization-mode dispersion (PMD). Then, the nonlinear effects are
discussed: it is explained how parametric processes (mainly self-phase and cross-phase
modulation (XPM)) lead to a nonlinear dependence of the refractive index on the optical
power, which in turn leads to modulation instability (MI). An explanation of the
physical principles behind Rayleigh and Raman scattering is also presented.
2.2 Linear effects
When an electromagnetic wave with electric field E(ω) of angular frequency ω
propagates in a dielectric medium, it induces a linear polarization PL(ω) (assuming a
linear response of the medium) which is usually frequency dependent. This polarization
depends on how the bound electrons of the medium respond to the applied E(ω) and is
therefore strongly dependent on the resonance frequencies of the medium. From these
two quantities, the linear optical susceptibility χ(1)
(ω) can be defined as
(1)
0
( )( )
( )
LP
E
, (2.1)
where ε0 is the electric permittivity of free space. χ(1)
(ω) is a very important parameter
from which several important properties of the fibre can be derived. The complex
refractive index nc(ω) is derived from χ(1)
(ω):
)(1)( )1( cn . (2.2)
From the complex refractive index nc(ω), the real refractive index n(ω) and attenuation
constant α(ω) can be defined as [7]
FCUP Distributed and Remote fibre Sensing Assisted by Raman Effect
14
( ) Re( ( ))cn n (2.3)
2( ) Im( ( ))cn
c
, (2.4)
where c is the light velocity in the vacuum. Polarization-mode dispersion (PMD) and
polarization dependent loss (PDL) can also be described as a dependency of nc(ω) on
the polarization axis of the propagating wave.
2.2.1 Optical Losses: absorption and scattering
The electric field for a plane wave propagating along the z axis in a material, E(z,t), is
given by
( ) ( )( ) ( )
0 0( , )c cn n
i z t i z tc cE z t E e E e
. (2.5)
Due to the imaginary part of nc(ω) (see eq. 2.4), an optical signal propagating in a fibre
will experience losses proportional to the propagating power. Therefore, the optical
power P(L) of the signal after a distance of propagation L in the fibre will be given by
)()( L
iePLP , (2.6)
where Pi is the input power and α (usually given in km-1
) is the attenuation constant
which accounts for all losses in the medium. Usually the attenuation constant is given in
dB/km (αdB):
343.4)(log10))(
(log10
1010 eP
LP
L i
dB . (2.7)
In an optical fibre, optical absorption and optical scattering are the main causes of
losses. The losses can be divided into intrinsic losses of the material (optical absorption
peaks which occur at the resonance frequencies of the material and optical scattering)
and extrinsic losses (optical absorption peaks caused by impurities and mechanical
stress or curvatures applied to the fibre that induce local losses).
Regarding optical absorption losses, in the case of silica fibres, absorption peaks occur
in the ultraviolet (UV) (<200 nm) and infrared (IR) (~7000 nm), due to the resonances
of Si-O and electrons in atoms - intrinsic losses. These absorption peaks have tails that
extend into the visible and near IR wavelengths.
FCUP Distributed and Remote fibre Sensing Assisted by Raman Effect
15
Additional resonance peaks, and therefore additional absorption peaks will be added in
the presence of impurities - extrinsic losses. In the case of silica fibres, the presence of
OH- ions will cause absorption at the OH
- fundamental vibrational absorption peak at
2.73 μm, and its overtones near 1.37 μm, 1.23 μm and 0.95 μm [8].
Another type of optical absorption losses occurs due to atomic irregularities (color
centres). These are mostly negligible due to the optimized modern fibre fabrication
processes. However, when high intensities are employed, absorption in these
irregularities can lead to local changes of the structure of the fibre, which in turn will
lead to higher absorption. This exponential process can lead to the destruction of the
fibre.
In the case of the losses in fibres due to optical scattering (intrinsic losses), these can be
caused by Rayleigh scattering (scattering by inhomogeneities much smaller than the
wavelength), Mie scattering (scattering by inhomogeneities with size above the light
wavelength) and scattering generated by imperfections in the core-cladding interface
(waveguide scattering). However, due to the quality of the modern fabrication processes
of optical fibres, in which the typical size of density fluctuations are much smaller
(<10 %) than the propagating wavelengths, losses due to optical scattering in fibres are
mainly caused by Rayleigh scattering (described in further detail in section 2.4.1) The
Rayleigh scattering induced loss coefficient (αR) can be expressed as:
4
RR
C
. (2.8)
Usually αR is given in dB/km. The constant CR is dependent on the components and
fabrication method of the fibre, but is typically within the range 0.7-0.9 dB km-1
μm4
[9]. Since the Rayleigh scattering induced losses vary with λ-4
, they are dominant for
short wavelengths.
In Fig. 2.1, the typical loss spectrum (represented by the attenuation constant αdB) of an
optical silica fibre is presented. The Rayleigh scattering losses decrease as the
wavelength increases and a local minimum loss of ≈0.2 dB/km is observed at around
1550 nm, between the peak losses induced by the OH- ions and the IR absorption. This
minimum corresponds to the third transmission window and will be used in this
FCUP Distributed and Remote fibre Sensing Assisted by Raman Effect
16
dissertation. Two other local minima are located at 800 nm and 1310 nm, and
correspond to the first and second communication windows.
Fig. 2.1 Typical loss spectrum for a silica fibre (Adapted from ref. [10]).
2.2.2 Chromatic Dispersion
The linear optical refractive index n(ω) defines the phase velocities vp(ω) at which
different frequencies ω will travel in the fibre:
)()(
n
cp v . (2.9)
Eq. 2.9 therefore defines the chromatic dispersion of the fibre, which is the dependency
of vp(ω) (and hence n(ω)) on the frequency of the propagating wave, ω.
When working with optical pulses, it is useful to define the dispersion as a Taylor
expansion of the mode-propagation constant β(ω) around the central angular frequency
of the pulse, ω0:
2 3
0 1 0 2 0 3 0
1 1( ) ( ) ( ) ( ) ( ) ...
2 6n
c
. (2.10)
Here β0 is the mode-propagation constant at ω0, and βi is the ith
-order dispersion
coefficient, given by:
FCUP Distributed and Remote fibre Sensing Assisted by Raman Effect
17
0
( ) ( 0,1,2,3...)
i
i ii
. (2.11)
The first-order dispersion coefficient β1 is the inverse of the group velocity νg,
1
( )1 1 ( )( )
v ( )
g
g
n nn
c c
, (2.12)
where ng(ω) is the group refractive index. The second-order dispersion coefficient β2 is
also referred as group velocity dispersion (GVD), and β3 is the third-order dispersion
(TOD) coefficient. Physically, the group velocity is the velocity at which the envelope
of an optical pulse moves and the GVD describes the dispersion (i.e., dependency on ω)
of the group velocity. GVD is responsible for the broadening of optical pulses, since
different frequencies will travel at different velocities, and is therefore an undesired
effect in optical communication. When the GVD>0 (<0), the dispersion is said to be
normal (anomalous). In silica fibres, the GVD increases with the wavelength, crossing
the zero at ~1.3 μm, although dispersion-shifted fibres, where the zero has been shifted
to ~1.5 μm, have been developed a long time ago [11].
When working with optical fibres, the chromatic dispersion parameter D is commonly
used instead of GVD, being defined as
122
2 cD
, (2.13)
where λ is the wavelength corresponding to the mode of frequency ω. D is usually given
in ps km-1
nm-1
, and can be understood as the time delay (ps) between two waves of
wavelengths separated by 1 nm after travelling 1 km of fibre.
In optical fibres, chromatic dispersion can generally result from a dependency of n in ω
associated with the resonances of the material (material dispersion) but also from
geometrical effects (waveguide dispersion). Waveguide dispersion is associated with the
change of the modal radius with frequency. Since there is a difference between the n(ω)
of the core and cladding, this leads to an effective n(ω) variation with frequency.
Different modes of propagation also experience different value of n(ω), but in SMFs,
since there is only one mode of propagation, intermodal dispersion does not occur.
Another kind of dispersion is PMD, which is discussed in the next section.
FCUP Distributed and Remote fibre Sensing Assisted by Raman Effect
18
2.2.3 Polarization-mode dispersion
The linear polarization PL(ω) induced in a dielectric medium by an applied electric field
E(ω) is owed to a rearrangement of the charges in the medium. Therefore PL(ω) is
strongly dependent on the molecular structure of the medium and can depend on the
direction of the applied E(ω) in an anisotropic material. In this case, χ(1)
(ω) and n(ω)
depend on the state of polarization (SOP) of E(ω) and the medium is said to be
birefringent. In a birefringent medium, two modes with the same frequency and
different polarizations have different β – modal birefringence. The optical absorption
function can also be dependent on the polarization – PDL. Although this effect is less
important in fibre optics, it can be relevant for optical components. The strength of
modal birefringence βm is defined as [12]:
| | | |2
m x y x yn n
(2.14)
where nx, ny are the refractive indices for the two orthogonally polarized states. From
βm, the beat length LB, defined as the period over which the two modes exchange their
powers when propagating along the fibre, can be derived:
2
| |B
x y m
L
(2.15)
Since different polarizations experience different refractive indices, these will travel at
different velocities, which will cause a broadening of a pulse propagating in the fibre if
both polarization components are excited – PMD.
In an amorphous system with geometrical symmetry such as a single-mode fibre (SMF),
birefringence should not occur since it requires a break of symmetry. However, due to
random fluctuations of n(ω) or mechanical stresses, optical fibres always present some
birefringence. Although this does not considerably affect the value of n(ω) and can
therefore be neglected for most purposes when using unpolarized light, these small
fluctuations cause the SOP of propagating waves to change randomly, thus causing
instability in the output of the state of polarization.
In order to solve this problem, polarization-maintaining fibres (PMFs) have been
developed. These present a high built-in birefringence which prevents the coupling of
light from one polarization mode to the other. In this case, if the polarization of the light
FCUP Distributed and Remote fibre Sensing Assisted by Raman Effect
19
coupled is aligned with one of the polarization axis, the SOP will be preserved even if
the fibre is bent or small fluctuations in n(ω) occur. However, if both polarization axis
are excited, the SOP will change continuously, repeating itself after a period of LB.
PMFs are built by introducing asymmetries in the fabrication process. These
asymmetries can be geometrical (such as a non-circular core or asymmetric
microstructured fibre), due to a built-in mechanical stress (as in Panda or Bow-tie
fibres) or an asymmetric refractive index profile. Fig. 2.2 shows some of the most
common types of PMFs.
Fig. 2.2 Different types of PMF: a) Panda, b) Bow-tie, c) Elliptical-clad (Adapted from ref. [13]).
PMFs can also be used for sensing applications. The birefringence in a PMF can be
dependent on the applied pressure, thus making these fibres suitable for the
measurements of pressure [14]. In this dissertation, distributed measurement of
birefringence is achieved along PMF and SMF using phase-sensitive OTDR (ϕOTDR)
(chapter 4).
FCUP Distributed and Remote fibre Sensing Assisted by Raman Effect
20
2.3 Nonlinear Propagation
A number of nonlinear processes become relevant when the interaction length, or the
optical intensity, is high. Depending on the working conditions, some processes can be
neglected or are simply forbidden, while others take special relevance. In this section,
the most important parametric nonlinearities for the work developed in this thesis are
described. A process is called parametric if the initial and final states of the atoms in the
medium where the electromagnetic waves interact are the same. Therefore, the energy
and momentum of the interacting waves must be conserved and the medium plays a
passive role. In this category are included Self-Phase Modulation (SPM) and
Cross-Phase Modulation (XPM), which are a consequence of the Kerr effect (nonlinear
dependence of the refractive index on the optical power) and without which MI would
not occur.
2.3.1 Parametric nonlinearities
The polarization induced by the electromagnetic radiation in a dielectric medium
becomes nonlinear for high intensities. This response is generated by the anharmonic
oscillation of the bound electrons of the medium to the applied field. In this case, the
polarization response ( )P is given by a power series in the electric field ( )E
strength and eq. 2.1 can be modified to
(1) (2) (3)
0
2 3
( ) [ ( ) ( ) ( ) : ( ) ( ) ( ) ( ) ( ) ( ) ...]
( ) ( ) ( ) ... ,L NL NL
P E E E E E E
P P P
(2.16)
where ( )LP is the linear polarization, χ(i)
(i=2,3...) is the ith
order nonlinear optical
susceptibility and ( )iNLP is the ith
order nonlinear polarization. Typically, for
condensed matter, χ(1)
is of the order of the unit, χ(2)
≈10-12
m/V and χ(3)
≈10-24
m2/V
2 [7].
The quantity χ(2)
is responsible for Second-Harmonic Generation (SHG),
Sum-Frequency Generation (SFG) and Three-Wave Mixing. However, the existence of
a χ(n)
with an even order n implies that the medium does not have inversion symmetry.
Therefore, for amorphous media (such as amorphous silica), these terms are only
non-null at the interfaces and hence negligible for most purposes.
FCUP Distributed and Remote fibre Sensing Assisted by Raman Effect
21
The quantity χ(3)
is responsible for the third order nonlinear polarization 3 ( )NLP . The
molecular contributions to χ(3)
(Raman effect) can be neglected assuming instantaneous
response. Considering a monochromatic wave ( )E , then 3 ( )NLP will have a term
oscillating at frequency ω and another at 3ω (Third-Harmonic Generation - THG).
However, the THG term requires phase-matching and is usually negligible in optical
fibres. In this case 3 ( )NLP will be given by:
(3) 2
03
3 | ( ) |( ) ( )
4
xxxxNL
EP E
. (2.17)
3 ( )NLP is responsible for the Kerr effect, as seen in the next section.
2.3.2 Nonlinear refractive index
The refractive index n can be calculated from the total polarization (PL+P3NL, defined in
eq. 2.17), similarly to eq. 2.2. In this case, it is shown that n becomes dependent in the
optical intensity travelling in the medium (Kerr effect):
(3) 2(1) 23
0 2
0
( ) ( ) 3 | ( ) |1 1 | |
( ) 4
L NL xxxxP P En n n E
E
(2.18)
where (1)
0 Re( 1 )n and (3)
2 03Re( ) /8xxxxn n are the linear and nonlinear
refractive indices, respectively. In this case, the dispersion will also become nonlinear.
The last equality of eq. 2.18 is valid assuming that the nonlinearity is small (and hence
the Taylor series expansion can be truncated in the first term). The Kerr effect is
responsible for a number of nonlinear effects, such as SPM (modulation of the phase of
the own optical field with the applied intensity), XPM (modulation of the phase of
another field), MI (pulse breakup in a train of soliton under the combined effect of SPM
and anomalous dispersion) or self-focusing (Kerr lens). All these effects can be used for
supercontinuum generation (generation of a wide spectrum of wavelengths from a
coherent input beam). When working with optical fibres, the nonlinear phases
introduced by SPM and XPM are usually expressed as a function of the nonlinear
coefficient of the fibre γ, defined as
2n
eff
n
cA
, (2.19)
FCUP Distributed and Remote fibre Sensing Assisted by Raman Effect
22
where Aeff is the effective area of the guided mode of frequency ωn.
Another important third-order nonlinear parametric process is Four-Wave Mixing
(FWM) in which two or more electromagnetic waves exchange energy and generate
new frequency components at frequencies that are natural combinations of the
frequencies of the input beams. Since FWM is a coherent process, its efficiency is
strongly dependent on the relative phases and polarizations of the interacting waves.
The process is therefore sensitive to the dispersion of the medium and the phases added
by SPM and XPM effects. Owing to its nature, the effects of FWM gain relevance in
multichannel communication systems. The crosstalk (exchange of energy between
channels) and generation of new frequency channels caused by FWM is usually an
undesired effect that can degrade the signal in this type of systems. In single channel
systems, however, the occurrence of spontaneous degenerate FWM (FWM process
where two of the initial waves have the same frequency) is possible between a strong
pump wave and the optical noise in a spectral region close to it. In fact, the appearance
of two gain sidebands symmetrically placed around the central wavelength caused by
MI in single channel systems is a process which resembles a Degenerate FWM
(DFWM) process phase-matched by the nonlinear phase introduced by SPM.
2.3.2.1 Modulation Instability (MI)
MI results from the interplay of Kerr effect and anomalous GVD, and, in the time
domain, results in the breakup of a continuous wave (CW) beam into a train of ultra-
short pulses. In the spectral domain, MI results in the appearance of two gain sidebands
on each side of the central wavelength. In fibres, MI has been demonstrated a long time
ago [15] and can present a serious limitation in distributed sensing due to the large
spans of fibre usually involved. MI has been shown to limit the performance of
distributed fibre sensors based on stimulated Brillouin scattering (SBS) [16] and
ϕOTDR [2].
In order to explain the origin of MI, we start by describing the propagation of a
quasi-monochromatic (0/ 1 ) optical pulse with a central angular frequency ω0
and width ∆ω in nonlinear dispersive fibres. This can be described by solving the
Nonlinear Schrödinger equation (NLSE):
2 3232
2 3
( , ) ( , ) ( , )( , ) | ( , ) | ( , )
2 6 2
iA z T A z T A z TA z T i A z T A z T
z T T
, (2.20)
FCUP Distributed and Remote fibre Sensing Assisted by Raman Effect
23
where 1/ gT t z v t z , where t is time and z the fibre position, i.e., a frame of
reference moving with the pulse at the group velocity vg is used. A(z,t) is the scalar
envelope of the electric field, assumed to be a slowly varying function of z and
normalized such that |A|2 = optical power of the pulse (P0). Assuming that the carrier
wavelength is not too close to the zero-dispersion wavelength and a pulse temporal
width >5 ps, the contribution of β3 can be neglected. If the fibre losses are neglected
(α=0), a simplified version of eq. 2.20 can be derived [17]:
222
2
( , ) ( , )| ( , ) | ( , )
2
iA z T A z Ti A z T A z T
z T
. (2.21)
If A(z,T) remains constant over time during its propagation along the fibre, then a
steady-state solution can be easily derived:
0
0( , )iP z
A z T P e
. (2.22)
This solution, however, is not stable against perturbations. It can be demonstrated that
small perturbations a(z,T) in A will evolve as
1 2( , ) exp[ ( )] exp[ ( )]a z T a i Kz T a i Kz T (2.23)
where K and Ωare, respectively, the wave number and the angular frequency of the
perturbation a(z,T) which satisfy the dispersion relation [17]
2 02
2
41| |
2
PK
. (2.24)
The mathematical demonstration of this result is not trivial and is beyond the purpose of
this theoretical introduction, but a more extensive explanation can be found in ref. [17].
The physical meaning, however, can be easily understood when considering the factor
0 0( )i z te
, which was factored out in this presentation. In this case, the real wave
numbers and angular frequencies of the perturbation a(z,T) are, respectively, β0±K and
ω0±Ω. So a perturbation a results in the appearance of new spectral components in the
optical pulse spectrum, symmetrically placed around the pulse central angular frequency
ω0. The amplitude of these new spectral components is stable if K has a real value (i.e.,
if 2 0
2
4 P
). However, for negative values of β2 (anomalous GVD), K becomes
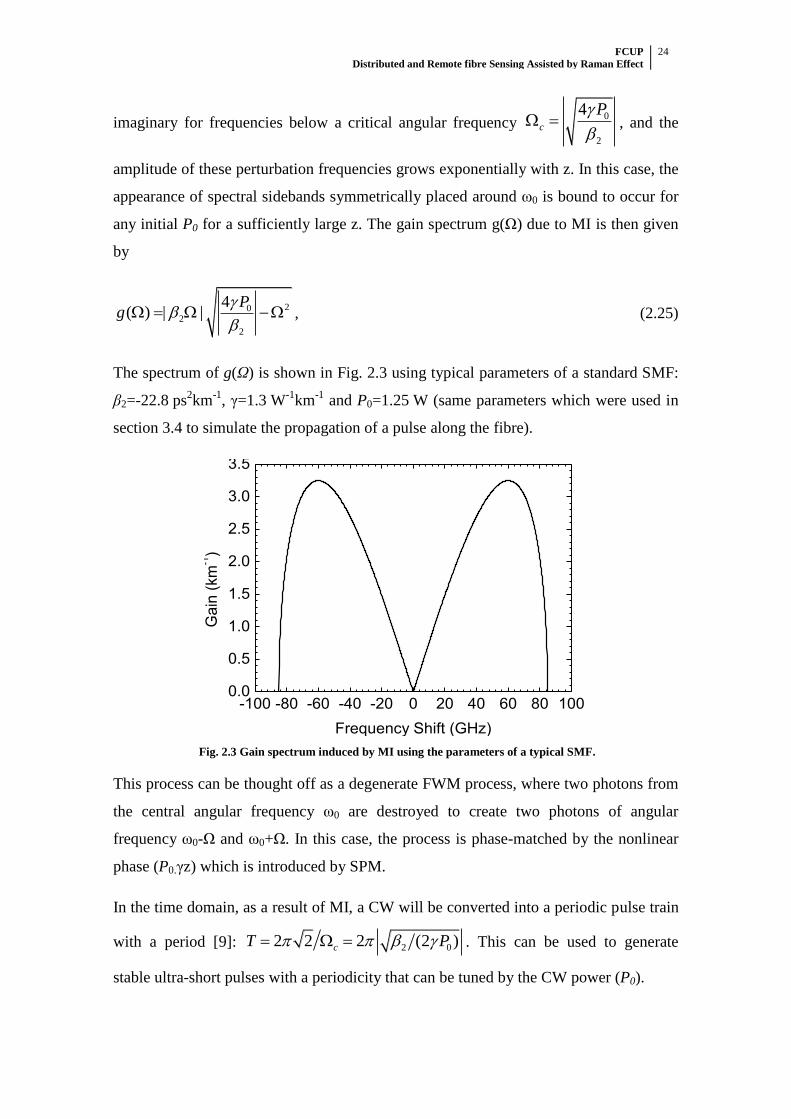
FCUP Distributed and Remote fibre Sensing Assisted by Raman Effect
24
imaginary for frequencies below a critical angular frequency 0
2
4c
P
, and the
amplitude of these perturbation frequencies grows exponentially with z. In this case, the
appearance of spectral sidebands symmetrically placed around ω0 is bound to occur for
any initial P0 for a sufficiently large z. The gain spectrum g(Ω) due to MI is then given
by
202
2
4( ) | |
Pg
, (2.25)
The spectrum of g(Ω) is shown in Fig. 2.3 using typical parameters of a standard SMF:
β2=-22.8 ps2km
-1, γ=1.3 W
-1km
-1 and P0=1.25 W (same parameters which were used in
section 3.4 to simulate the propagation of a pulse along the fibre).
-100 -80 -60 -40 -20 0 20 40 60 80 1000.0
0.5
1.0
1.5
2.0
2.5
3.0
3.5
Gain
(km
-1)
Frequency Shift (GHz)
Fig. 2.3 Gain spectrum induced by MI using the parameters of a typical SMF.
This process can be thought off as a degenerate FWM process, where two photons from
the central angular frequency ω0 are destroyed to create two photons of angular
frequency ω0-Ω and ω0+Ω. In this case, the process is phase-matched by the nonlinear
phase (P0.γz) which is introduced by SPM.
In the time domain, as a result of MI, a CW will be converted into a periodic pulse train
with a period [9]: 2 02 2 2 (2 )cT P . This can be used to generate
stable ultra-short pulses with a periodicity that can be tuned by the CW power (P0).
FCUP Distributed and Remote fibre Sensing Assisted by Raman Effect
25
2.4 Scattering
When travelling in a medium, light can be deflected from its straight trajectory due to
the interaction with the atoms and molecules that constitute it. This phenomenon is
known as scattering. At a quantum-mechanical level, scattering can be explained as the
absorption of an incident photon by an atom/molecule which then emits another photon
that can have a different direction/frequency/phase from that of the incident photon.
In optical fibres, different types of scattering can occur, which can be classified
according to the nature of the interaction. Depending on whether energy is exchanged
between the medium and the incident photons, the scattering can be elastic or inelastic:
Elastic scattering: The incident and scattered photons have the same energy (and
therefore the same frequency) and there is no exchange of energy with the
medium. However, since the scattered photon can have a different direction of
propagation from that of the incident photon, the medium can absorb
momentum.
o Rayleigh scattering: Scattering from non-propagating density
fluctuations. In optical fibres Rayleigh scattering is one of the main
mechanisms leading to losses, as discussed in section 2.2.1.
Inelastic scattering: The incident and scattered photons have different energies
(and therefore different frequencies). Since the overall energy of the process
must be conserved, only differences of energy between the incident and
scattered photons which can be absorbed/released by the medium are allowed. If
the energy of the incident photon is higher than the energy of the scattered
photon (i.e. the medium absorbs energy), the process is called Stokes scattering,
and if it is lower (i.e. the medium releases energy), the process is called
Anti-Stokes scattering.
o Raman scattering: A molecule of the medium scatters a photon with
different frequency of the incident photon. The energy difference is
absorbed/released by the molecule which transits to a higher/lower
energy vibration state.
o Brillouin scattering: An electromagnetic wave is reflected by an acoustic
wave propagating in the medium and its frequency is shifted due to the
Doppler effect. The energy difference is compensated by the
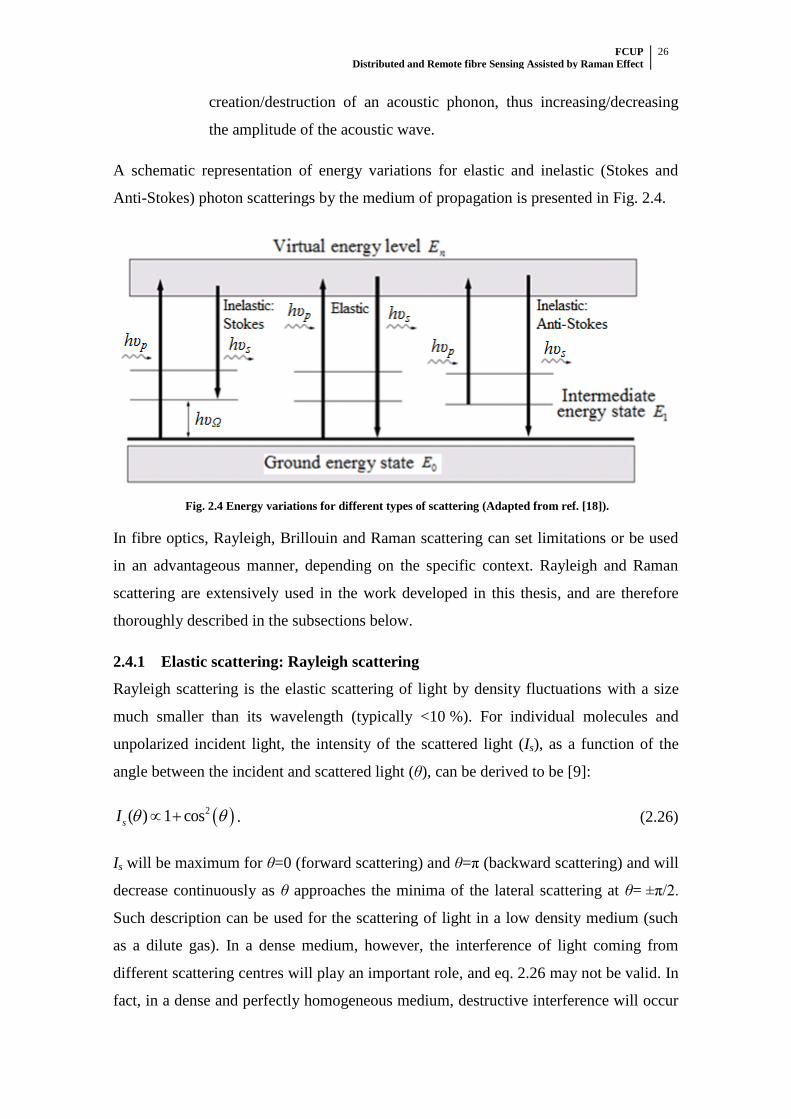
FCUP Distributed and Remote fibre Sensing Assisted by Raman Effect
26
creation/destruction of an acoustic phonon, thus increasing/decreasing
the amplitude of the acoustic wave.
A schematic representation of energy variations for elastic and inelastic (Stokes and
Anti-Stokes) photon scatterings by the medium of propagation is presented in Fig. 2.4.
Fig. 2.4 Energy variations for different types of scattering (Adapted from ref. [18]).
In fibre optics, Rayleigh, Brillouin and Raman scattering can set limitations or be used
in an advantageous manner, depending on the specific context. Rayleigh and Raman
scattering are extensively used in the work developed in this thesis, and are therefore
thoroughly described in the subsections below.
2.4.1 Elastic scattering: Rayleigh scattering
Rayleigh scattering is the elastic scattering of light by density fluctuations with a size
much smaller than its wavelength (typically <10 %). For individual molecules and
unpolarized incident light, the intensity of the scattered light (Is), as a function of the
angle between the incident and scattered light (θ), can be derived to be [9]:
2( ) 1 cossI . (2.26)
Is will be maximum for θ=0 (forward scattering) and θ=π (backward scattering) and will
decrease continuously as θ approaches the minima of the lateral scattering at θ= ±π/2.
Such description can be used for the scattering of light in a low density medium (such
as a dilute gas). In a dense medium, however, the interference of light coming from
different scattering centres will play an important role, and eq. 2.26 may not be valid. In
fact, in a dense and perfectly homogeneous medium, destructive interference will occur

FCUP Distributed and Remote fibre Sensing Assisted by Raman Effect
27
for light scattered in all directions except for forward scattering [7], which is the basis of
the origin of the refractive index.
However, if the medium is not perfectly homogeneous, perfectly destructive
interference will no longer occur due to the presence of inhomogeneities and scattering
can occur in all directions (Fig. 2.5). This will be the case of optical fibres, where the
presence of inhomogeneities resulting from the fabrication process (fluctuations in the
material density or dopant concentrations, impurities, etc) will result in losses due to
laterally Rayleigh scattered light. These losses are dominant at short wavelengths since
the intensity of the Rayleigh scattered light is proportional to 1/λ4.
Fig. 2.5 Rayleigh scattering of light propagating in a dense inhomogeneous medium.
2.4.1.1 Rayleigh Backscattering
When an optical wave propagates in a fibre, a small fraction of the Rayleigh scattered
light is coupled back into the fibre in the opposite direction (θ=π) of the initial wave.
This phenomenon is called Rayleigh backscattering and will create a
counter-propagating wave with the same frequency of the initial wave (Fig. 2.6). The
typical Rayleigh backscatter coefficient (αRayleigh Backscatter) in SMF is ≈-72 dB/m. While this
effect can be detrimental, introducing noise in optical communications or causing
instability in high coherence lasers, it can also be used advantageously: it is the basis of
OTDR (which can be used for distributed sensing of different parameters, as discussed
in section 3.2.2) and it can also be used as a distributed mirror to assist Raman fibre
lasers (RFLs) (as discussed in chapter 5).
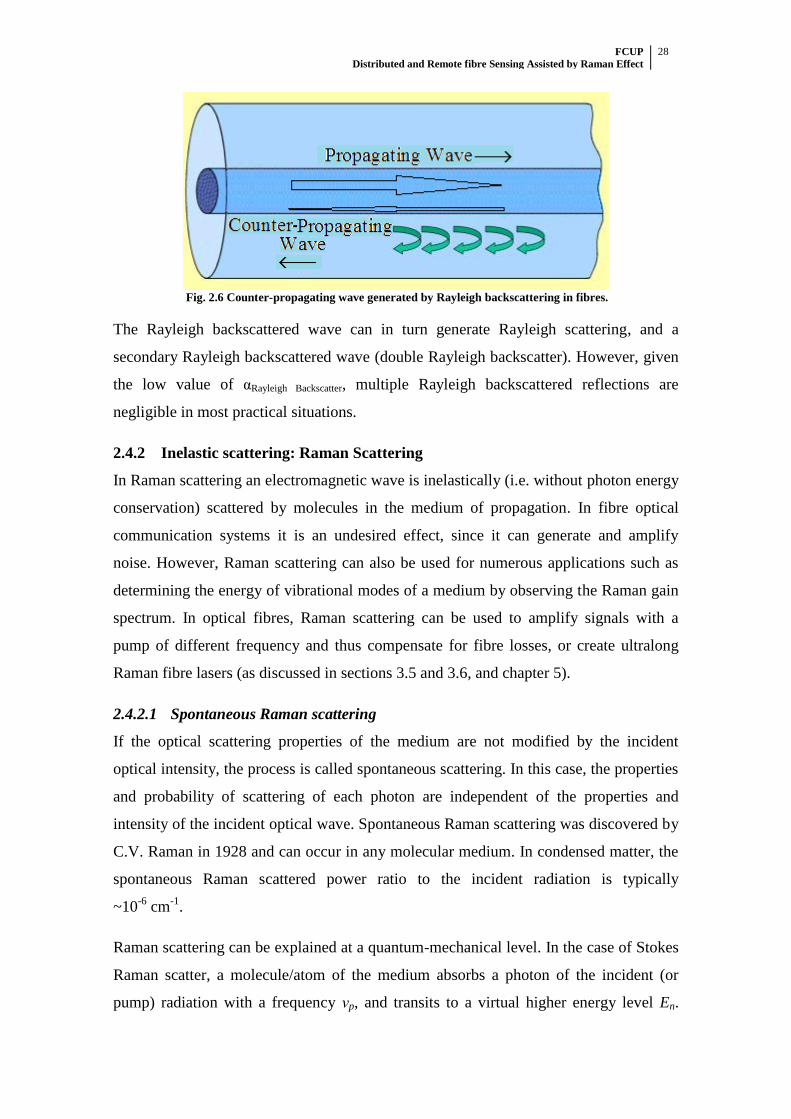
FCUP Distributed and Remote fibre Sensing Assisted by Raman Effect
28
Fig. 2.6 Counter-propagating wave generated by Rayleigh backscattering in fibres.
The Rayleigh backscattered wave can in turn generate Rayleigh scattering, and a
secondary Rayleigh backscattered wave (double Rayleigh backscatter). However, given
the low value of αRayleigh Backscatter, multiple Rayleigh backscattered reflections are
negligible in most practical situations.
2.4.2 Inelastic scattering: Raman Scattering
In Raman scattering an electromagnetic wave is inelastically (i.e. without photon energy
conservation) scattered by molecules in the medium of propagation. In fibre optical
communication systems it is an undesired effect, since it can generate and amplify
noise. However, Raman scattering can also be used for numerous applications such as
determining the energy of vibrational modes of a medium by observing the Raman gain
spectrum. In optical fibres, Raman scattering can be used to amplify signals with a
pump of different frequency and thus compensate for fibre losses, or create ultralong
Raman fibre lasers (as discussed in sections 3.5 and 3.6, and chapter 5).
2.4.2.1 Spontaneous Raman scattering
If the optical scattering properties of the medium are not modified by the incident
optical intensity, the process is called spontaneous scattering. In this case, the properties
and probability of scattering of each photon are independent of the properties and
intensity of the incident optical wave. Spontaneous Raman scattering was discovered by
C.V. Raman in 1928 and can occur in any molecular medium. In condensed matter, the
spontaneous Raman scattered power ratio to the incident radiation is typically
~10-6
cm-1
.
Raman scattering can be explained at a quantum-mechanical level. In the case of Stokes
Raman scatter, a molecule/atom of the medium absorbs a photon of the incident (or
pump) radiation with a frequency νp, and transits to a virtual higher energy level En.
FCUP Distributed and Remote fibre Sensing Assisted by Raman Effect
29
Then, the molecule/atom transits to a state of energy E1 higher than the initial ground
state E0, emitting a photon (signal radiation) with a frequency νs lower than the pump
photon. The energy and momentum differences between the pump and the signal
photons are therefore compensated by the molecule/atom, which absorbs a phonon of
frequency Ω. Raman anti-Stokes scatter occurs in a similar way, but the initial state of
the molecule/atom has a higher energy than the final state, and therefore the signal
photon has a higher frequency than the pump photon (see Fig. 2.4). Since the upper
levels are virtual, the incident and scattered photons can have any frequency, as long as
the energy difference between them (hΩ), where h is the Planck constant, can be
absorbed/released by the medium.
The rates at which the Stokes (WS) and Anti-Stokes (WAS) scatterings occur in thermal
equilibrium are proportional to the population of the states with energy E0 and E1 and,
therefore, the ratio between these quantities is given by the Boltzmann factor [19]
B
h
k TAS
S
We
W
, (2.27)
where kB is the Boltzmann constant and T is the absolute temperature. Depending on the
frequency shift Ω, the Raman Anti-Stokes rate of scattering can be much lower than the
Raman Stokes scattering rate at room temperatures. Also, since the Boltzmann factor is
strongly dependent on the temperature, the ratio between Stokes and Anti-Stokes
Raman scatterings can be used to determine the temperature along optical fibres [20].
2.4.2.2 Stimulated Raman Scattering (SRS)
If high radiation intensities already exist in the medium in the Raman gain spectrum, the
Raman scattering process will occur in the presence of seed photons (Fig. 2.7) and the
process is called Stimulated Raman Scattering (SRS). In this case, not only does the
scattered radiation tend to have the same frequencies of the pre-existent radiation, but
the scattering rate is also much higher, becoming intensity dependent [7].
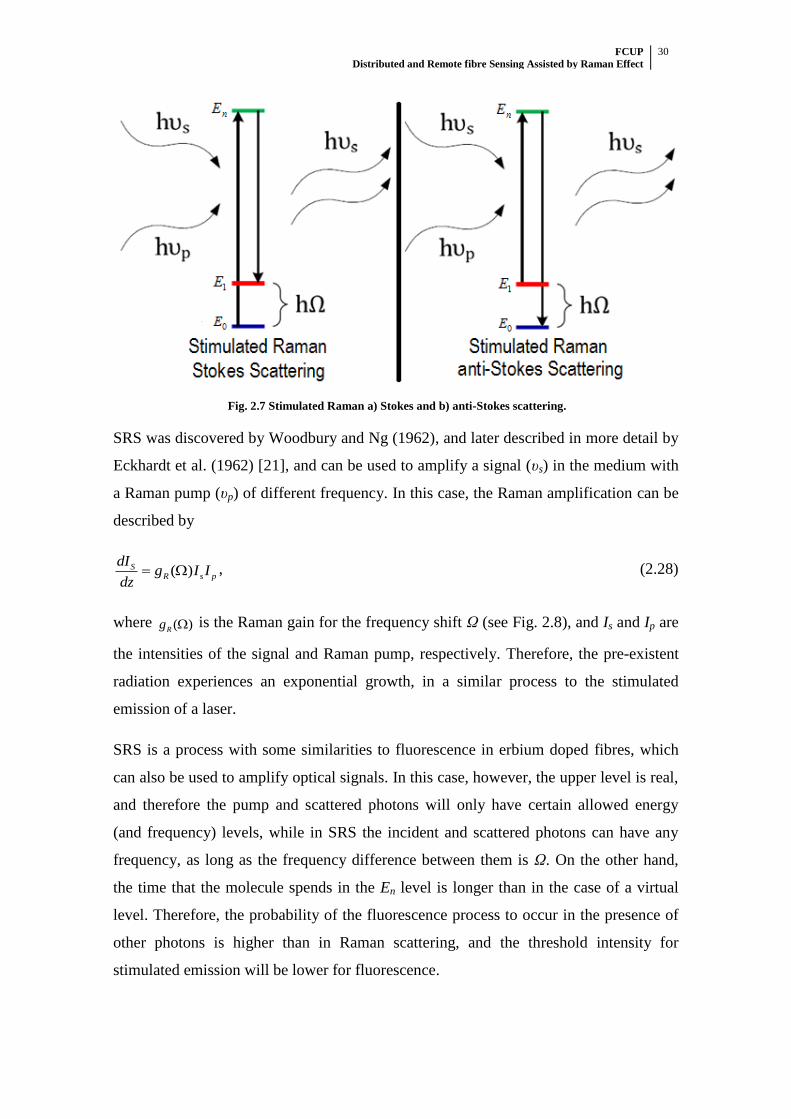
FCUP Distributed and Remote fibre Sensing Assisted by Raman Effect
30
Fig. 2.7 Stimulated Raman a) Stokes and b) anti-Stokes scattering.
SRS was discovered by Woodbury and Ng (1962), and later described in more detail by
Eckhardt et al. (1962) [21], and can be used to amplify a signal (υs) in the medium with
a Raman pump (υp) of different frequency. In this case, the Raman amplification can be
described by
( )SR s p
dIg I I
dz , (2.28)
where ( )Rg is the Raman gain for the frequency shift Ω (see Fig. 2.8), and Is and Ip are
the intensities of the signal and Raman pump, respectively. Therefore, the pre-existent
radiation experiences an exponential growth, in a similar process to the stimulated
emission of a laser.
SRS is a process with some similarities to fluorescence in erbium doped fibres, which
can also be used to amplify optical signals. In this case, however, the upper level is real,
and therefore the pump and scattered photons will only have certain allowed energy
(and frequency) levels, while in SRS the incident and scattered photons can have any
frequency, as long as the frequency difference between them is Ω. On the other hand,
the time that the molecule spends in the En level is longer than in the case of a virtual
level. Therefore, the probability of the fluorescence process to occur in the presence of
other photons is higher than in Raman scattering, and the threshold intensity for
stimulated emission will be lower for fluorescence.
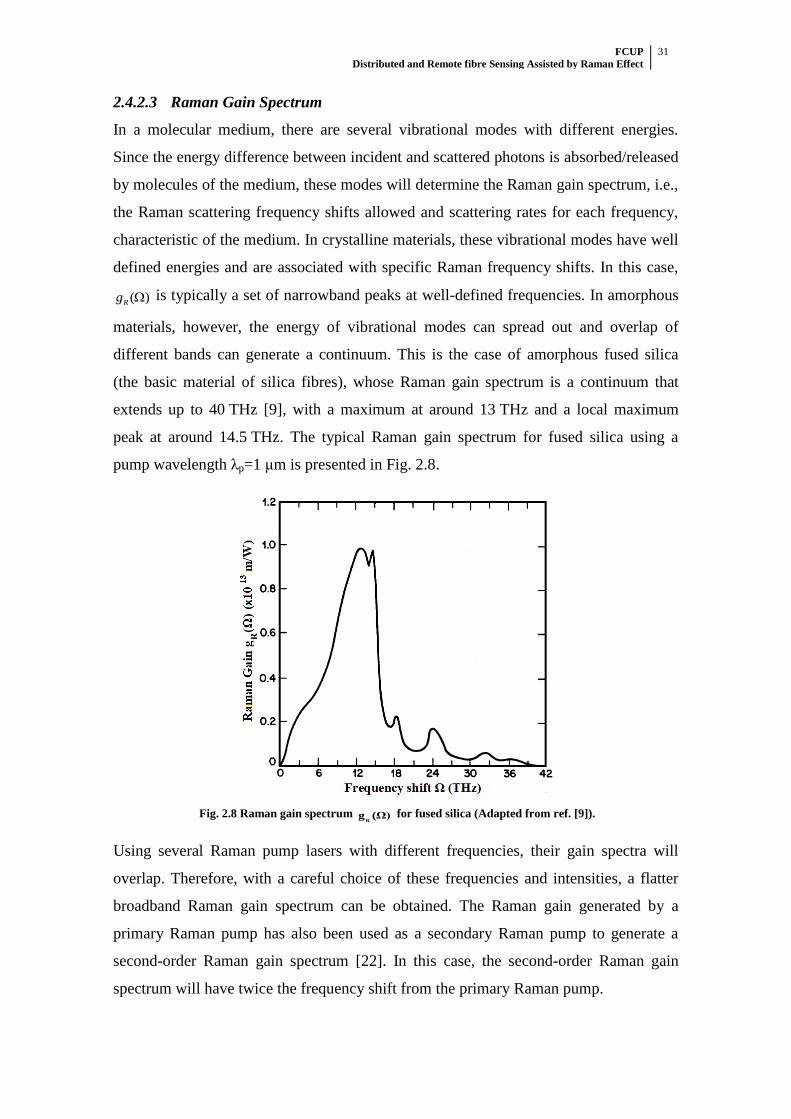
FCUP Distributed and Remote fibre Sensing Assisted by Raman Effect
31
2.4.2.3 Raman Gain Spectrum
In a molecular medium, there are several vibrational modes with different energies.
Since the energy difference between incident and scattered photons is absorbed/released
by molecules of the medium, these modes will determine the Raman gain spectrum, i.e.,
the Raman scattering frequency shifts allowed and scattering rates for each frequency,
characteristic of the medium. In crystalline materials, these vibrational modes have well
defined energies and are associated with specific Raman frequency shifts. In this case,
( )Rg is typically a set of narrowband peaks at well-defined frequencies. In amorphous
materials, however, the energy of vibrational modes can spread out and overlap of
different bands can generate a continuum. This is the case of amorphous fused silica
(the basic material of silica fibres), whose Raman gain spectrum is a continuum that
extends up to 40 THz [9], with a maximum at around 13 THz and a local maximum
peak at around 14.5 THz. The typical Raman gain spectrum for fused silica using a
pump wavelength λp=1 μm is presented in Fig. 2.8.
Fig. 2.8 Raman gain spectrum R
g (Ω) for fused silica (Adapted from ref. [9]).
Using several Raman pump lasers with different frequencies, their gain spectra will
overlap. Therefore, with a careful choice of these frequencies and intensities, a flatter
broadband Raman gain spectrum can be obtained. The Raman gain generated by a
primary Raman pump has also been used as a secondary Raman pump to generate a
second-order Raman gain spectrum [22]. In this case, the second-order Raman gain
spectrum will have twice the frequency shift from the primary Raman pump.
FCUP Distributed and Remote fibre Sensing Assisted by Raman Effect
32
2.4.2.4 Intensity evolution and threshold for noise amplification
When a Raman pump (frequency υp, intensity Ip, loss αp) is used to amplify a signal
(frequency υs, intensity Is, loss αs) along an optical fibre (z) using SRS, the variations of
the intensities of the two waves, in the CW case, are described by the two following
coupled equations [9]:
( )p p
R s p p p
s
dIg I I I
dz
(2.29)
( )SR s p s s
dIg I I I
dz . (2.30)
Assuming that Ip>>Is, the Raman pump depletion (variation of Ip due to the gain
provided to Is) can be neglected [23], and eq. 2.29 and 2.30 are then modified to
( )p
p p
dI zI
dz (2.31)
0( ) p pISR s p s s
dIg I I e I
dz
. (2.32)
From which the evolution of the Ip and Is along the fibre (z) can be derived, setting as
boundary conditions the initial intensities of Raman pump (Ip0) and signal (Is0) at the
fibre beginning (z=0):
0( ) pz
p pI z I e
(2.33)
0 0
1( ) exp ( )
p z
S s R p s
p
eI z I g I z
. (2.34)
From this solution, it is derived that a reduction of the effective interaction length (zeff)
occurs due to αp:
eff
1 p z
p
ez
. (2.35)
zeff will be lower than z, and for long fibre lengths (αpz>>1) zeff is reduced to 1/αp, which
is of the order of ≈20 km for a typical fibre loss, at 1550 nm, of αp ≈0.047 km-1
≈0.2 dB/km.
FCUP Distributed and Remote fibre Sensing Assisted by Raman Effect
33
A theoretical model and numerical calculations of the evolution of the intensities of the
Raman pump and of the signal along an optical fibre is presented in section 3.4. In this
simulation, two counter-propagating Raman pumps are launched from each end of the
fibre.
From eq. 2.34 it is derived that if there is no signal launched at the fibre entrance (i.e.,
Is0=0), SRS should not occur. In this case however, spontaneous Raman scattering will
generate radiation which will then act as a seed that will be amplified though SRS. A
broadband spectrum is generated this way, which can build up to high intensities if the
Raman pump is strong enough.
This process can be modelled using a fictitious photon in each frequency mode of the
( )Rg at z=0, from which it can be derived that the threshold Raman pump power ( 0
th
pP ),
defined as the Raman pump power at which the amplified spectrum power becomes
equal to the Raman pump power at the end of the fibre, is given by [9]:
eff0
eff
16th
p
R
AP
g z
(2.36)
Using the typical values of a SMF at a wavelength of 1550 nm (effective mode area
Aeff=50 μm2,
Rg =6.6∙10-14
m/W) for a long fibre length (αpz>>1, zeff ≈1/αp ≈20 km), a
threshold Raman pump power of 0
th
pP ≈600 mW can be estimated.

FCUP Distributed and Remote fibre Sensing Assisted by Raman Effect
34
FCUP Distributed and Remote fibre Sensing Assisted by Raman Effect
35
3 Phase-sensitive OTDR (ϕOTDR) for
distributed vibration sensing

FCUP Distributed and Remote fibre Sensing Assisted by Raman Effect
36
FCUP Distributed and Remote fibre Sensing Assisted by Raman Effect
37
3.1 Introduction
In this chapter, we present an extensive investigation on the use of phase-sensitive
optical time domain reflectometry (ϕOTDR) for distributed vibration sensing, which
includes experimental and theoretical descriptions using different configurations.
Firstly (section 3.2), in order to clarify the context of the technique to the reader, the
principles of operation and a detailed state-of-the-art of the use ϕOTDR for distributed
vibration sensing is presented, comparing the problems and performance trade-offs
between previously reported configurations. Then, an overview of the characteristics
and performance of the different existing distributed fibre optic sensors (DFOS) is
presented in order to provide a frame for comparison between ϕOTDR and other DFOS.
Then (section 3.3), the ϕOTDR operation is described under normal operation. A
theoretical model describing the signal statistics, fading probability and noise, is
presented and used for comparison with the experimental results. The performance of
the ϕOTDR is then characterized for distributed vibration sensing. Distributed
measurement of ultrasonic vibrations is achieved, to the best of our knowledge, for the
first time.
Next (section 3.4), a study aimed to identify the limitations in terms of ϕOTDR pulse
peak power, imposed by nonlinearities, is presented. MI is identified as the first
nonlinear effect to arise under normal operation conditions and its impact on the
performance of ϕOTDR is thoroughly described, both theoretically and experimentally.
This study provides an important basis for understanding the problems and limitations
of this system, and thus it helps to maximize its performance when used for both
dynamic and static measurements.
In the last two sections of this chapter, the uses of first-order (section 3.5) and
second-order (section 3.6) Raman amplification to assist ϕOTDR operation, with the
intent of greatly increasing the sensing range, are described and compared. Using
first-order Raman assistance (section 3.5), the ϕOTDR pulse is optically observed at
different points, thus clearly depicting its evolution along the setup and evidencing the
impact of the different setup components on it. The quality of the obtained ϕOTDR
trace along the fibre is evaluated using different Raman pump powers and compared
with the theoretical predictions. The noise is characterized both optically and
FCUP Distributed and Remote fibre Sensing Assisted by Raman Effect
38
electrically, with special emphasis being given to the RIN transfer from the Raman
pumps. Then, vibration measurements performed over 110 km and 125 km of SMF are
described. In section 3.6, the performance of the sensor is compared with a scheme
using ϕOTDR assisted by second-order Raman amplification under similar
measurement conditions.
The main results presented in this chapter were published in Optics Letters and Journal
of Lightwave Technology [2, 3, 5].
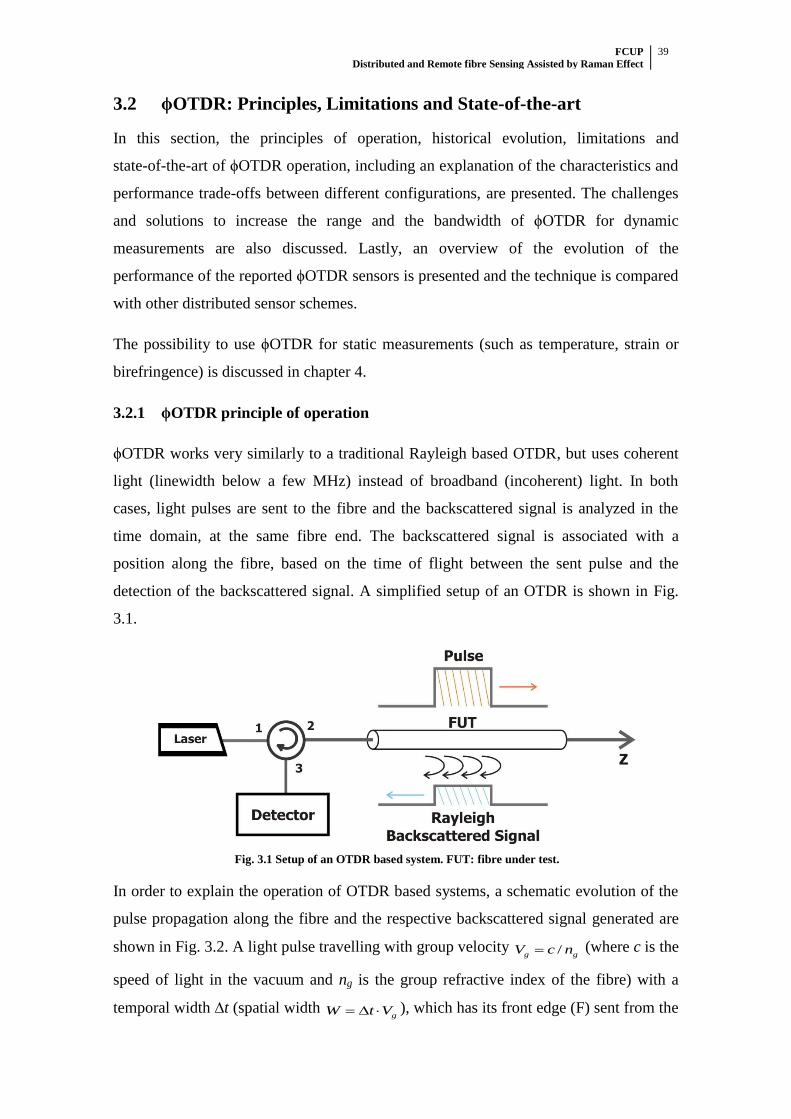
FCUP Distributed and Remote fibre Sensing Assisted by Raman Effect
39
3.2 ϕOTDR: Principles, Limitations and State-of-the-art
In this section, the principles of operation, historical evolution, limitations and
state-of-the-art of ϕOTDR operation, including an explanation of the characteristics and
performance trade-offs between different configurations, are presented. The challenges
and solutions to increase the range and the bandwidth of ϕOTDR for dynamic
measurements are also discussed. Lastly, an overview of the evolution of the
performance of the reported ϕOTDR sensors is presented and the technique is compared
with other distributed sensor schemes.
The possibility to use ϕOTDR for static measurements (such as temperature, strain or
birefringence) is discussed in chapter 4.
3.2.1 ϕOTDR principle of operation
ϕOTDR works very similarly to a traditional Rayleigh based OTDR, but uses coherent
light (linewidth below a few MHz) instead of broadband (incoherent) light. In both
cases, light pulses are sent to the fibre and the backscattered signal is analyzed in the
time domain, at the same fibre end. The backscattered signal is associated with a
position along the fibre, based on the time of flight between the sent pulse and the
detection of the backscattered signal. A simplified setup of an OTDR is shown in Fig.
3.1.
Fig. 3.1 Setup of an OTDR based system. FUT: fibre under test.
In order to explain the operation of OTDR based systems, a schematic evolution of the
pulse propagation along the fibre and the respective backscattered signal generated are
shown in Fig. 3.2. A light pulse travelling with group velocity /g gV c n (where c is the
speed of light in the vacuum and ng is the group refractive index of the fibre) with a
temporal width ∆t (spatial width gW t V ), which has its front edge (F) sent from the
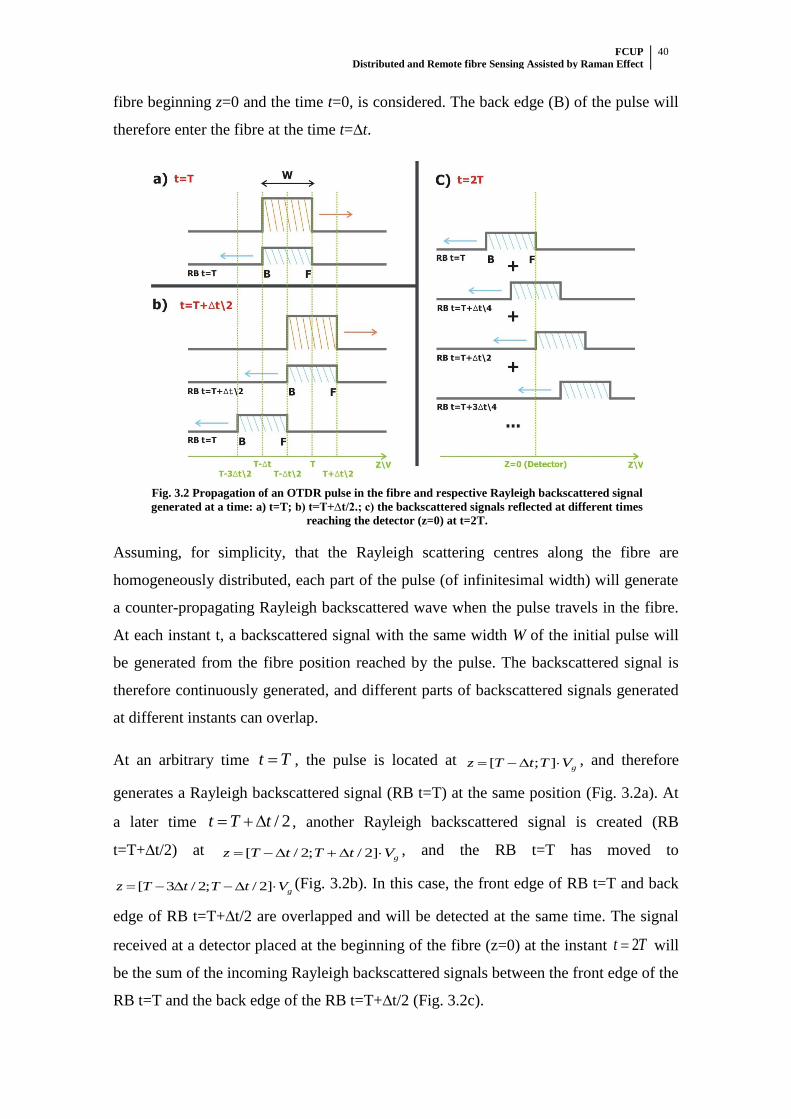
FCUP Distributed and Remote fibre Sensing Assisted by Raman Effect
40
fibre beginning z=0 and the time t=0, is considered. The back edge (B) of the pulse will
therefore enter the fibre at the time t=∆t.
Fig. 3.2 Propagation of an OTDR pulse in the fibre and respective Rayleigh backscattered signal
generated at a time: a) t=T; b) t=T+∆t/2.; c) the backscattered signals reflected at different times
reaching the detector (z=0) at t=2T.
Assuming, for simplicity, that the Rayleigh scattering centres along the fibre are
homogeneously distributed, each part of the pulse (of infinitesimal width) will generate
a counter-propagating Rayleigh backscattered wave when the pulse travels in the fibre.
At each instant t, a backscattered signal with the same width W of the initial pulse will
be generated from the fibre position reached by the pulse. The backscattered signal is
therefore continuously generated, and different parts of backscattered signals generated
at different instants can overlap.
At an arbitrary time t T , the pulse is located at [ ; ] gz T t T V , and therefore
generates a Rayleigh backscattered signal (RB t=T) at the same position (Fig. 3.2a). At
a later time / 2t T t , another Rayleigh backscattered signal is created (RB
t=T+∆t/2) at [ / 2; / 2] gz T t T t V , and the RB t=T has moved to
[ 3 / 2; / 2] gz T t T t V (Fig. 3.2b). In this case, the front edge of RB t=T and back
edge of RB t=T+∆t/2 are overlapped and will be detected at the same time. The signal
received at a detector placed at the beginning of the fibre (z=0) at the instant 2t T will
be the sum of the incoming Rayleigh backscattered signals between the front edge of the
RB t=T and the back edge of the RB t=T+∆t/2 (Fig. 3.2c).
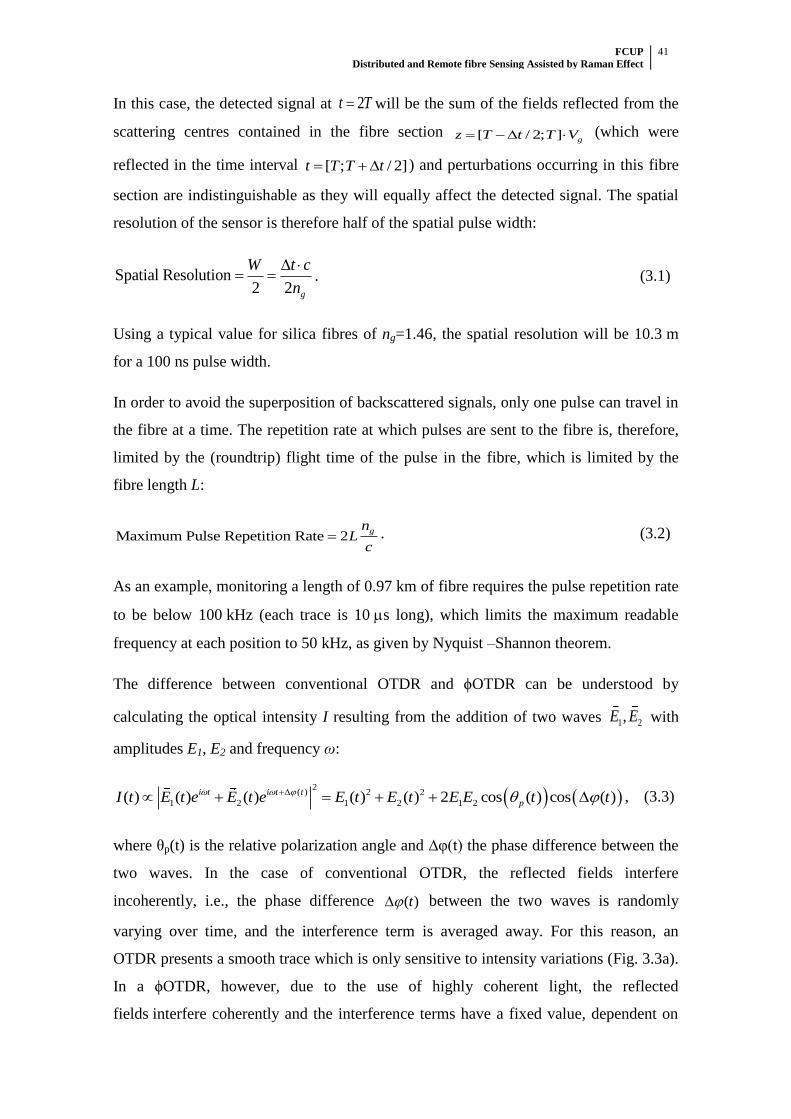
FCUP Distributed and Remote fibre Sensing Assisted by Raman Effect
41
In this case, the detected signal at 2t T will be the sum of the fields reflected from the
scattering centres contained in the fibre section [ / 2; ] gz T t T V (which were
reflected in the time interval [ ; / 2]t T T t ) and perturbations occurring in this fibre
section are indistinguishable as they will equally affect the detected signal. The spatial
resolution of the sensor is therefore half of the spatial pulse width:
Spatial Resolution2 2 g
W t c
n
. (3.1)
Using a typical value for silica fibres of ng=1.46, the spatial resolution will be 10.3 m
for a 100 ns pulse width.
In order to avoid the superposition of backscattered signals, only one pulse can travel in
the fibre at a time. The repetition rate at which pulses are sent to the fibre is, therefore,
limited by the (roundtrip) flight time of the pulse in the fibre, which is limited by the
fibre length L:
Maximum Pulse Repetition Rate 2gn
Lc
. (3.2)
As an example, monitoring a length of 0.97 km of fibre requires the pulse repetition rate
to be below 100 kHz (each trace is 10 s long), which limits the maximum readable
frequency at each position to 50 kHz, as given by Nyquist –Shannon theorem.
The difference between conventional OTDR and ϕOTDR can be understood by
calculating the optical intensity I resulting from the addition of two waves 1 2,E E with
amplitudes E1, E2 and frequency ω:
2
( ) 2 2
1 2 1 2 1 2( ) ( ) ( ) ( ) ( ) 2 cos ( ) cos ( )i t i t t
pI t E t e E t e E t E t E E t t , (3.3)
where θp(t) is the relative polarization angle and ∆φ(t) the phase difference between the
two waves. In the case of conventional OTDR, the reflected fields interfere
incoherently, i.e., the phase difference ( )t between the two waves is randomly
varying over time, and the interference term is averaged away. For this reason, an
OTDR presents a smooth trace which is only sensitive to intensity variations (Fig. 3.3a).
In a ϕOTDR, however, due to the use of highly coherent light, the reflected
fields interfere coherently and the interference terms have a fixed value, dependent on
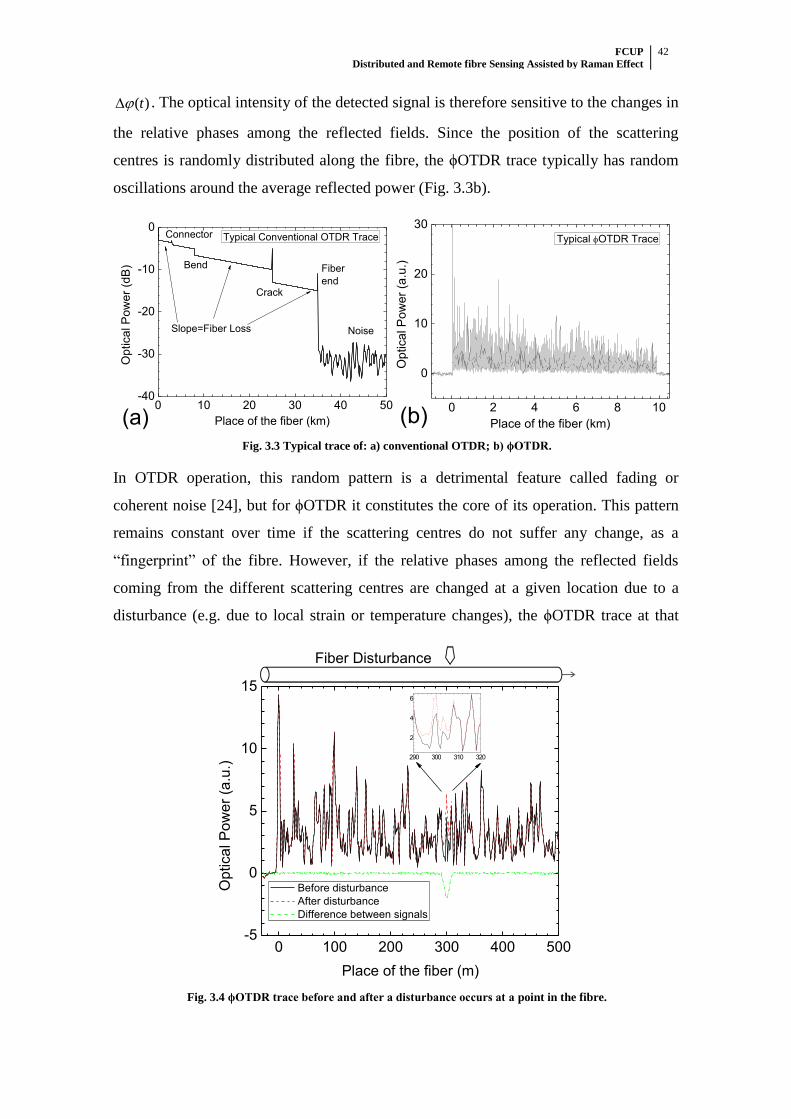
FCUP Distributed and Remote fibre Sensing Assisted by Raman Effect
42
( )t . The optical intensity of the detected signal is therefore sensitive to the changes in
the relative phases among the reflected fields. Since the position of the scattering
centres is randomly distributed along the fibre, the ϕOTDR trace typically has random
oscillations around the average reflected power (Fig. 3.3b).
0 10 20 30 40 50-40
-30
-20
-10
0Connector Typical Conventional OTDR Trace
(a)
Op
tica
l P
ow
er
(dB
)
Place of the fiber (km)
Bend
Noise
Fiber
endCrack
Slope=Fiber Loss
0 2 4 6 8 10
0
10
20
30
Typical OTDR Trace
(b)
Optica
l P
ow
er
(a.u
.)
Place of the fiber (km)
Fig. 3.3 Typical trace of: a) conventional OTDR; b) ϕOTDR.
In OTDR operation, this random pattern is a detrimental feature called fading or
coherent noise [24], but for ϕOTDR it constitutes the core of its operation. This pattern
remains constant over time if the scattering centres do not suffer any change, as a
“fingerprint” of the fibre. However, if the relative phases among the reflected fields
coming from the different scattering centres are changed at a given location due to a
disturbance (e.g. due to local strain or temperature changes), the ϕOTDR trace at that
0 100 200 300 400 500-5
0
5
10
15
Fiber Disturbance
Op
tica
l P
ow
er
(a.u
.)
290 300 310 320
2
4
6
Place of the fiber (m)
Before disturbance
After disturbance
Difference between signals
Fig. 3.4 ϕOTDR trace before and after a disturbance occurs at a point in the fibre.
FCUP Distributed and Remote fibre Sensing Assisted by Raman Effect
43
position (but only at that position) will vary (Fig. 3.4). In the case of localized
vibrations, the ϕOTDR trace will show local variations synchronized with the vibration
frequency.
An important feature of ϕOTDR operation is that the signal detected from one point in
the fibre is completely independent from the signal originated from another point (as
long as the two points distance is not within the spatial resolution of the sensor). This is
an important advantage when compared to other systems which present cumulative
effects along the fibre, such as OTDR (in which the detection of a signal requires an
intensity variation and therefore a decrease of the sensing range) or polarization OTDR
(POTDR) (where an event at one point affects the entire fibre signal after that point), as
discussed in section 3.2.8.
3.2.2 ϕOTDR Historical Perspective
Nowadays, the phase-sensitive OTDR designation is the most commonly used in the
scientific literature to refer to an OTDR using highly coherent light, although a few
early papers used simply “phase-OTDR” [25, 26]. Authors have also used coherent
OTDR (COTDR) [27] to refer to an OTDR using heterodyne (also called coherent)
detection and highly coherent light. Commercial systems often use “distributed acoustic
sensing” to refer to the distributed detection of vibrations along optical fibres, usually
using ϕOTDR.
ϕOTDR was initially introduced by Henry F. Taylor and Chung E. Lee in 1993 as a
powerful tool for fibre optic intrusion sensing [28]. The invention described a system
sensitive to the phase modulation of the light which exploited a phenomenon (coherent
interference of light) previously regarded as a detrimental effect in OTDR operation
(fading or coherent noise) [24], for sensing purposes. Despite being proposed over two
decades ago, the principles of operation remain the same in modern configurations:
highly coherent light pulses are injected into a fibre and the backscattered signal is
observed in the time domain.
Following preliminary experimental results which confirmed the potential for intrusion
detection [29, 30], the same authors investigated and thoroughly characterized a
spectrally stable Er-Fibre laser with the specific intent of application in ϕOTDR
operation [31] which used a long (25 km) optical-feedback loop to achieve a narrow
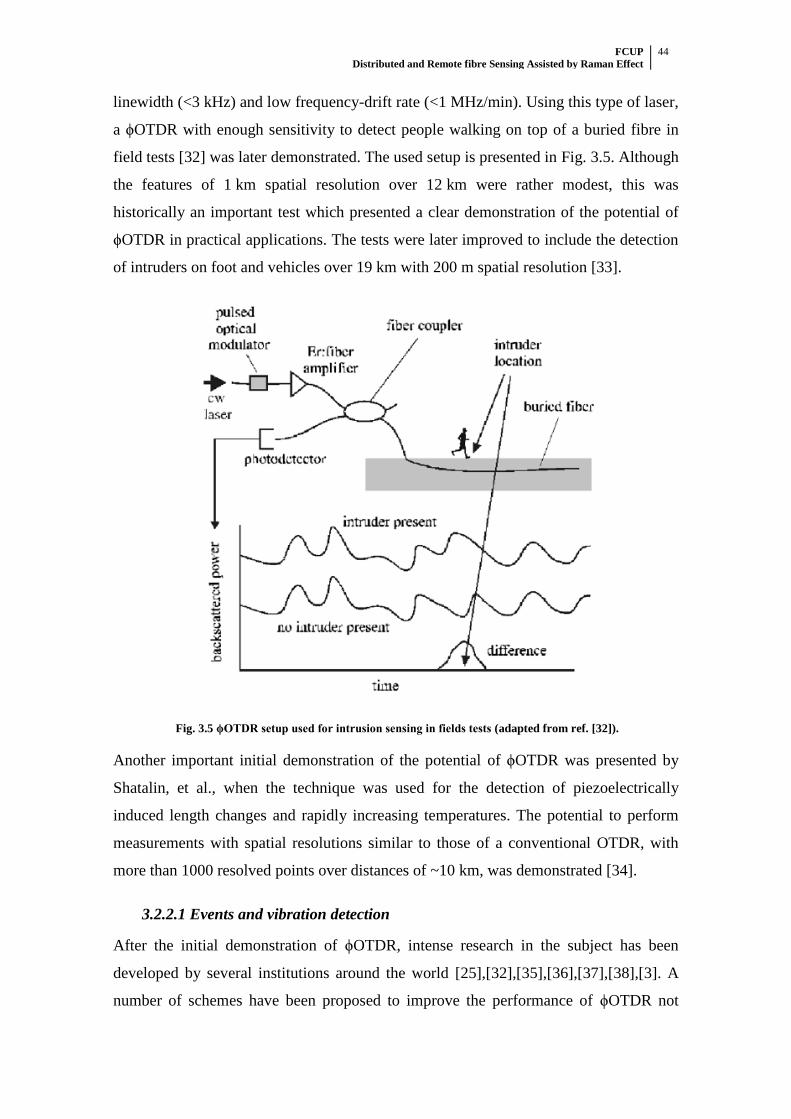
FCUP Distributed and Remote fibre Sensing Assisted by Raman Effect
44
linewidth (<3 kHz) and low frequency-drift rate (<1 MHz/min). Using this type of laser,
a ϕOTDR with enough sensitivity to detect people walking on top of a buried fibre in
field tests [32] was later demonstrated. The used setup is presented in Fig. 3.5. Although
the features of 1 km spatial resolution over 12 km were rather modest, this was
historically an important test which presented a clear demonstration of the potential of
ϕOTDR in practical applications. The tests were later improved to include the detection
of intruders on foot and vehicles over 19 km with 200 m spatial resolution [33].
Fig. 3.5 ϕOTDR setup used for intrusion sensing in fields tests (adapted from ref. [32]).
Another important initial demonstration of the potential of ϕOTDR was presented by
Shatalin, et al., when the technique was used for the detection of piezoelectrically
induced length changes and rapidly increasing temperatures. The potential to perform
measurements with spatial resolutions similar to those of a conventional OTDR, with
more than 1000 resolved points over distances of ~10 km, was demonstrated [34].
3.2.2.1 Events and vibration detection
After the initial demonstration of ϕOTDR, intense research in the subject has been
developed by several institutions around the world [25],[32],[35],[36],[37],[38],[3]. A
number of schemes have been proposed to improve the performance of ϕOTDR not
FCUP Distributed and Remote fibre Sensing Assisted by Raman Effect
45
only for dynamic but also for static measurements [27]. The characterization of ϕOTDR
for dynamic measurements reported in the literature can generally be divided into the
detection of events and vibrations.
The detection of events corresponds to the application of a discrete perturbation at a
given time (an impact such as a pencil break next to the fibre [25], hitting a pipe [38], or
footsteps [39]) and then observing the changes of the trace in the time domain. The
signal-to-noise ratio (SNR) is given by the ratio of the maximum power variation of the
trace (signal) against the power fluctuations of the trace at a different time/spatial point
when/where the impact is not felt (noise). Averaging of the trace is usually used to
reduce the noise and highlight low frequency signals.
As for the detection of vibrations, it is usually produced by applying a pure vibration
(usually stationary, although the detection of non-stationary vibrations has also been
characterized [40]), using a piezoelectric element (PZT) [41],[38] or a mechanical
actuator [3], and monitoring the signal in the frequency domain. In this case, the SNR is
given by the amplitude of the central frequency (signal) against the amplitudes of the
rest of the frequency spectrum (noise). The use of trace averaging is avoided as it
decreases the detection bandwidth of the system.
Surely the frequency spectrum of an event, and variations over time of a pure frequency,
can also be analyzed, but the detection of events is typically more associated with
intrusion detection, while the detection of vibrations can be used to properly
characterize the true frequency bandwidth of the detection system, rather than simply
estimating it based on the pulse repetition rate (eq. 3.2). It is used, as well, for the
characterization of complex signals (for instance, distinguishing patterns corresponding
to different types of machinery), having also important applications in structural health
monitoring.
3.2.3 Detection Schemes and Noise
An overview of the main differences between direct and coherent detection schemes in
ϕOTDR operation, as well as the main sources of noise involved and possible solutions
for noise reduction is presented below.

FCUP Distributed and Remote fibre Sensing Assisted by Raman Effect
46
3.2.3.1 Direct detection and noise in ϕOTDR operation
When the signal to detect is not critically low, as often happens if the sensing fibre is
not very long, schemes using direct detection provide a simple and effective solution for
ϕOTDR operation [32],[3]. Direct detection schemes present low complexity (the signal
is detected directly in the time domain) and are also rather stable when compared to
coherent detection schemes, where polarization and phase noises are much more an
issue, often requiring averaging and post-processing denoising, as well as lasers of
much higher coherence length [41]. The principle of operation and practical setup of a
ϕOTDR using a direct detection scheme are as described in section 3.2.1.
There are several sources of noise which should be mentioned in ϕOTDR under normal
operation (using direct detection), mainly: phase noise, laser frequency drift,
polarization noise and finite extinction ratio (ER) of the ϕOTDR pulse. The phase noise
can be understood as fluctuations in the values of ( )t (see eq. 3.3) and is essentially
determined by the linewidth of the laser. In order to ensure low fluctuations of the
relative phases ( )t of the reflected waves of the signal of interest (coming from a
fibre section of length W/2), the coherence length of the laser should be longer than the
pulse width. As an example, for a pulse width of ~50 ns (10 m in the fibre), a laser with
linewidth of a ~few MHz is required [3]. Although a higher coherence of the laser will
result in a decrease of the phase noise, it is not a straightforward deduction that the use
of higher coherence lasers will improve the performance of ϕOTDR operation once
above a coherence length equal to the pulse length. In fact, the use of extremely high
coherence lasers may actually perform worse in a ϕOTDR system using direct detection,
due to the increase of coherent noise, as discussed in section 3.3.2.2.
Since different laser frequencies will result in different ϕOTDR traces (different
interference patterns) [27], the laser frequency drift, i.e., the variation of the central
frequency ω over time, will result in a variation of the trace pattern over time, thus
introducing noise in the measurement. For this reason, a ϕOTDR laser should not only
have high coherence, but also high frequency stability over time. In theory, the laser
frequency drift can also introduce phase noise in the measurement as the beginning and
the end of the pulse will have different central frequencies. However, this effect should
be very small, since it is proportional to the frequency drift over the time of the pulse
width.
FCUP Distributed and Remote fibre Sensing Assisted by Raman Effect
47
As for the polarization noise, it can be observed from eq. 3.3 that the amplitude of the
interference terms will be dependent on the relative angle of polarization θp(t) of the
interfering waves. If the polarizations of two interfering waves are aligned, maximum
visibility will be achieved, while in the case when the polarizations are orthogonal, the
interference terms are null and the visibility will be zero. The visibility of the ϕOTDR
trace is therefore sensitive to changes in the relative polarization between interfering
fields. Since in low birefringence fibres, such as SMF, the state of polarization (SOP)
varies randomly along the fibre, the polarizations of the interfering waves may not be
fully aligned, even if linear polarization is used at the input, and the visibility of the
trace will decrease. Similarly to coherent detection schemes [27], scrambling the
polarization can help to reduce the polarization noise in the ϕOTDR trace. Since the
orthogonal polarizations of the backscattered waves do not interfere, it has been
demonstrated that these can be split and monitored separately, thus obtaining two
statistically independent channels with higher visibility, which improves the detection
of intrusions using ϕOTDR [33, 39].
Lastly, a finite ER of the ϕOTDR pulse will result in a CW component between the
pulses which will generate a CW backscattered noise that will be added to the signal.
Since the power of the backscattered noise increases with the fibre length, it can be an
important limitation, especially if very long fibres are used.
Using ϕOTDR with direct detection, vibration measurements of up to 40 kHz (limited
by the flight time of pulses in the fibre) over 1.25 km, with a resolution of 5 m, were
achieved. In this case, a semiconductor optical amplifier (SOA) was used to achieve
high extinction ratios in the ϕOTDR pulses and therefore suppress coherent noise [3].
The simplicity of the scheme was maintained as no averaging, post-processing or
extremely high coherence lasers (a semiconductor laser with a linewidth of 1.6 MHz
was used) were required.
Further considerations on the noises and performance of ϕOTDR operation are
discussed in section 3.3.2, where a theoretical model which includes the signal statistics
of the ϕOTDR trace, before and after a perturbation, is presented.
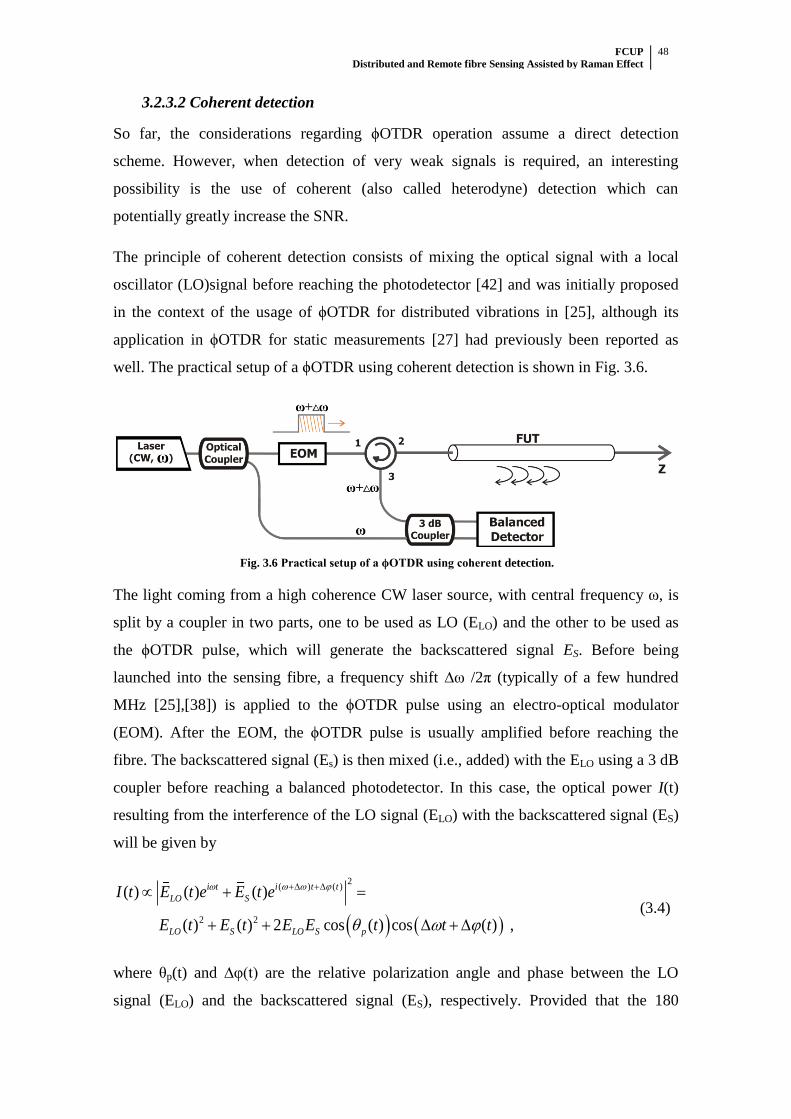
FCUP Distributed and Remote fibre Sensing Assisted by Raman Effect
48
3.2.3.2 Coherent detection
So far, the considerations regarding ϕOTDR operation assume a direct detection
scheme. However, when detection of very weak signals is required, an interesting
possibility is the use of coherent (also called heterodyne) detection which can
potentially greatly increase the SNR.
The principle of coherent detection consists of mixing the optical signal with a local
oscillator (LO)signal before reaching the photodetector [42] and was initially proposed
in the context of the usage of ϕOTDR for distributed vibrations in [25], although its
application in ϕOTDR for static measurements [27] had previously been reported as
well. The practical setup of a ϕOTDR using coherent detection is shown in Fig. 3.6.
Fig. 3.6 Practical setup of a ϕOTDR using coherent detection.
The light coming from a high coherence CW laser source, with central frequency ω, is
split by a coupler in two parts, one to be used as LO (ELO) and the other to be used as
the ϕOTDR pulse, which will generate the backscattered signal ES. Before being
launched into the sensing fibre, a frequency shift ∆ω /2π (typically of a few hundred
MHz [25],[38]) is applied to the ϕOTDR pulse using an electro-optical modulator
(EOM). After the EOM, the ϕOTDR pulse is usually amplified before reaching the
fibre. The backscattered signal (Es) is then mixed (i.e., added) with the ELO using a 3 dB
coupler before reaching a balanced photodetector. In this case, the optical power I(t)
resulting from the interference of the LO signal (ELO) with the backscattered signal (ES)
will be given by
2( ) ( )
2 2
( ) ( ) ( )
( ) ( ) 2 cos ( ) cos ( ) ,
i t i t t
LO S
LO S LO S p
I t E t e E t e
E t E t E E t t t
(3.4)
where θp(t) and ∆φ(t) are the relative polarization angle and phase between the LO
signal (ELO) and the backscattered signal (ES), respectively. Provided that the 180
FCUP Distributed and Remote fibre Sensing Assisted by Raman Effect
49
degree phase shift between the two outputs of the 3 dB coupler is preserved, the use of
balanced detection will eliminate the Direct Current (DC) and common mode
components and improve the SNR by 3 dB [25]. The main differences between direct
and heterodyne detection can be readily deduced from eq. 3.4.
The main advantage comes from the fact that the optical amplitude of the LO signal will
be typically much higher than that of the backscattered signal (|ELO|>>|ES|). In this case,
the intensity of the signal of interest (LO SE E ) will be higher than then intensity of the
signal using direct detection ( 2
SE ), even though there is no optical amplification. If
the optical amplitude of the LO is made high enough, the SNR of heterodyne detection
can be made shot noise limited [25] even for weak signals, while when using direct
detection this can only be achieved with rather high signals powers. Therefore, coherent
detection can provide a much higher sensitivity for detection of weak signals.
As for the disadvantages of coherent detection, apart from the problems which affect the
quality of the backscattered signal (ES), previously commented in the case of direct
detection, these mainly derive from the requirement of coherently interfering the
backscattered signal (ES) and the LO signal (ELO), which can be separated by as much
as twice the fibre length. In this case, the relative phase noise and relative polarization
between backscattered and the LO signals may lead to higher noise and instability when
compared with the direct detection situation [42].
While in direct detection the required coherence length of the laser is of the order of the
pulse width (~few MHz [3]), as interference occurs between waves separated by as
much as that length, the required laser coherence length for coherent detection schemes
will be much higher, the linewidth being typically of the order of a few kHz for a few
kilometers of fibre [25],[41],[37],[35]. In long range (>100 km) operation, lasers with
linewidth as low as 100 Hz have been used [43],[44], which can considerably increase
the complexity and cost of the system. The drift of the laser central frequency will also
introduce noise in the measurement.
The amplitude of the interference between ELO and ES strongly depends on their relative
state of polarization and can even reach zero for the case of orthogonal polarizations.
Coherent detection is therefore generally dependent on changes of the SOP along the
optical paths of ELO and ES before these are mixed, and the setup is therefore very
FCUP Distributed and Remote fibre Sensing Assisted by Raman Effect
50
sensitive to SOP changes. While scrambling the polarization can help to reduce the
polarization noise in the ϕOTDR trace [27], another solution is to maintain the SOP
constant along the sensing fibre: by using PMF, as well as polarization maintaining
components, the SOP variations are eliminated, thus increasing the stability and
performance of the system [26]. However, PMFs are expensive and, more importantly,
present high losses, which severely limit the sensing range when compared to the use of
SMF.
Using ϕOTDR with coherent detection, the detection of vibrations of up to 1 kHz has
been demonstrated with 5 m of spatial resolution over 5 km of SMF [25]. Later, using
PMF, of up to 2.25 kHz with a spatial resolution of 1 m over 200 m [26]. In this case,
the detection bandwidth was limited due to the use of (moving) averaging of the traces,
but also by the limited pulse repetition rate of the system (10 kHz). By using suitable
post-processing denoising methods, these features were later improved to 8 kHz with
0.5 m spatial resolution over 1 km of SMF [41].
3.2.4 Post-processing
Similarly to other distributed fibre sensors, the backscattered signal to be analyzed in
ϕOTDR operation is rather low and has to be carefully handled. Using direct detection,
the use of optical amplification before detection can increase the SNR [39], but this may
not be sufficient, depending on the application. As for coherent detection schemes,
although the signal of interest has a higher power, the noise sources previously
discussed will cause fluctuations in the ϕOTDR trace which can mask the phase
modulation induced by a perturbation. In these cases, the use of post-processing
denoising methods may be a solution and, in general, proper data treatment for specific
applications can increase the performance of the sensors.
Averaging the ϕOTDR (by N) traces can reduce the signal fluctuations (by N ) and
increase the SNR, but this will also result in a decrease of the detection bandwidth (by
N). Although the use of moving averages can reduce this effect [25], the method
essentially still removes high frequencies and retains low frequencies, and therefore a
reduction of the detection bandwidth still occurs.
Other methods have been proposed aiming to reduce the noise in the signal without
reducing the bandwidth of detection. Among these, wavelet denoising methods have
FCUP Distributed and Remote fibre Sensing Assisted by Raman Effect
51
been used to assist ϕOTDR operation in several schemes [41],[40],[38]. The principle of
the method is described in [41] and consists of decomposing the signal into a series of
base functions of dilated and translated versions of the mother wavelet function. Using
the wavelet transform (which can be continuous [40] or discrete[41]), wavelet
coefficients are calculated and those considered to correspond to noise are removed.
The signal is then reconstructed without the noise coefficients.
A very important feature for practical applications is then to identify what kind of event
corresponds to a certain disturbance pattern. In this context, specific intruder signature
analysis has been reported to distinguish the patterns of a person walking from a car
[45].
3.2.5 Range increase
To achieve reliable vibration measurements, it is indispensable to achieve good
visibility and high SNR in the measured trace. In addition, it is generally desired to have
the best possible range and resolution. The visibility of the trace will remain high if the
coherence of the ϕOTDR pulse is high (in comparison with its width) and remains so all
along the fibre. As for the range, resolution and SNR, it should be established that these
are tightly related parameters. For a given resolution (ϕOTDR pulse width), an increase
in the dynamic range and SNR of a ϕOTDR sensor can be achieved by increasing the
ϕOTDR pulse peak power. However, the ϕOTDR pulse peak power cannot be
indefinitely increased due to the onset of nonlinear effects, mainly modulation
instability (MI) [2]. Although specific signal post-processing can improve the
performance of a ϕOTDR [41], as presented in the previous section (3.2.4) , a
significant increase in the sensing range can only be achieved using optical
amplification [46]. In particular, distributed Raman amplification seems an ideal route
to achieve this range enhancement, as the amplification can be engineered to keep the
power of the optical pulse almost constant along the whole fibre length [5],[38].
Unfortunately, the use of Raman amplification also presents drawbacks, mainly due to
relative intensity noise (RIN) transfer from the Raman pumps [47]. Recently, the use of
Brillouin amplification has also been proposed to extend the sensing range in ϕOTDR
operation [43], although in this case several practical drawbacks also arise: several
fibres with different Brillouin frequency shifts (which had to be precisely controlled)
were required to tune the gain along the setup and the gain is also
FCUP Distributed and Remote fibre Sensing Assisted by Raman Effect
52
temperature-dependent, which can lead to instability of the system. An overview of the
main problems and solutions for increasing the sensing range in ϕOTDR operation is
presented in this section.
3.2.5.1 ϕOTDR Peak power limitations due to nonlinearities
When the ϕOTDR pulse peak power is increased above a certain level, the increase of
nonlinearities will degrade the performance of the system. The limitations imposed by
some of these nonlinear effects have been briefly described in the general context of
coherent OTDRs [48]. Among these nonlinear limitations, the first effect to arise in the
usual conditions for ϕOTDR operation is MI [2].
MI in fibres results from the interplay of Kerr effect and anomalous dispersion, and, in
the time domain, results in the breakup of a CW beam into a train of ultra-short pulses.
In the spectral domain, MI manifests itself as the build-up of two sidebands at each side
of the centre beam wavelength, as shown in section 2.3.2.1. MI was demonstrated to
occur in optical fibres a long time ago [15], and its effects have been theoretically and
experimentally described [9, 49], including in-depth descriptions of its spectral
dependence [50]. In the strong conversion regime (i.e., when the sidebands grow up to
powers comparable to the main line), the MI process exhibits a reversible power
exchange between the main laser line and the sidebands known as the
Fermi-Pasta-Ulam (FPU) recurrence [51]. In the specific context of distributed fibre
sensors, MI has been shown to limit the performance of distributed fibre sensors based
on stimulated Brillouin scattering (SBS) [16]. In the specific case of ϕOTDR, ref. [48]
provided useful limits to avoid the effect of MI in the general case of coherent OTDRs.
However, in this study, there was no description of the effect of MI on the trace.
An in-depth experimental and theoretical description of the impact of MI in the
performance of a ϕOTDR is presented in section 3.4.
In some cases, MI may not be the main limitation to the ϕOTDR peak power (e.g., in
fibres with normal dispersion at the operating wavelength). In this case, depending on
the specific settings, the peak power may be limited by Brillouin or Raman effects. For
SRS, the threshold Raman pump power ( th
RP ) will be given by eff
eff
16th
R
R
AP
g z
(eq.
2.36), where Aeff is the effective mode area, gR is the Raman gain coefficient and zeff is
the effective fibre length. As for the SBS effect, the threshold Brillouin pump power
FCUP Distributed and Remote fibre Sensing Assisted by Raman Effect
53
( th
BP ) can be demonstrated [9] to be eff21th
B
B p
AP
g L
, where gB is the Brillouin gain
coefficient and LP is the pulse length (it is assumed that the pulse width is much longer
than the phonon lifetime, which is usually the case in conventional settings). As it can
be seen, for the Brillouin case, the relevant length to evaluate the threshold is reduced to
the length of the pulse, as the scattered wave is counter-propagating with the pulse.
Since gR is ~103 times lower than gB, the thresholds for the Brillouin and Raman effects
will be similar when the length of the pulse is ~103 times lower than zeff. For a long
fibre (zeff≈20 km), this occurs for a pulse width of 20 m. If the eff
B p
R
g L
g z
is higher/lower
than ~1, then the Brillouin/Raman will be the main limiting effect, respectively.
3.2.5.2 Raman Amplification
Raman amplification has been used for more than two decades to increase the
performance of optical communication systems [52-54], and since then, it has been
widely described theoretically and experimentally in the literature, for a number of
long-distance applications [22, 23, 47, 55-60]. In optical sensing, a number of different
architectures using Raman amplification have been proposed to assist distributed [23,
56, 57],[5],[38] and point [58] fibre sensors. Different pumping configurations have
been studied using first [38],[5, 56],[23], second [22, 57],[61] and even third-order [59]
Raman amplification. The noise introduced by the Raman gain process, mainly due to
RIN transfer from the Raman pumps, is one of the main concerns when using this type
of amplification [5, 47, 60, 62]. If not carefully handled, this can completely mask the
signal.
In ϕOTDR operation, Raman amplification can be used to maintain the ϕOTDR pulse
power high along the whole fibre length, thus extending the sensing range. Using direct
detection, encouraging efforts were initially reported describing the use of first-order
Raman amplification to assist ϕOTDR for intrusion sensing over distances of up to
62 km [63] and 74 km [46] with spatial resolutions of 100 m and 20 m respectively. In
these cases, however, the performance as a vibration sensor was not clearly established,
as no vibration measurement was performed, and no in-depth study of signal noise was
developed. In ref. [63], averaging of 50 traces was required, which greatly reduces the
detection bandwidth of the system. Recently, the use of first-order Raman amplification
and balanced detection to reduce the RIN transfer from the Raman pumps was reported
FCUP Distributed and Remote fibre Sensing Assisted by Raman Effect
54
[5], achieving distributed vibration measurements of up to 390/250 Hz over 100/125 km
with a spatial resolution of 10 m. Theoretical simulations of the pulse power evolution
and system noise evaluation were also included. The use of second-order Raman
amplification has also been described, and a performance improvement over first-order
Raman amplification under similar measurement conditions was reported: distributed
vibrations measurements of up to 380 Hz over 125 km, with a spatial resolution of 10 m
and higher SNR were achieved [61].
The use of Raman amplification to assist ϕOTDR for distributed intrusion and vibration
sensing using coherent detection has also been described in [38], showing an
improvement of SNR versus direct detection [5] over a similar range. Frequencies of up
to 375 Hz (limited by the flight time of pulses in the fibre) over 125 km, with a spatial
resolution of 8 m and higher SNR (up to 21.5 dB for intrusion sensing), were achieved.
In this case, however, the complexity of the scheme was increased due to the use of
coherent detection (previously discussed in section 3.2.3.2), which required a laser with
a linewidth three orders of magnitude lower than in ref. [5]. The detection of events for
intrusion sensing was also demonstrated, although in this case post-processing
denoising was used as well as averaging of 32 traces, which limited the detection
bandwidth to frequencies below 5 Hz.
The experimental and theoretical description of the advantages and limitations of using
ϕOTDR assisted by first- and second-order Raman amplification, including simulations
of the ϕOTDR pulse power evolution and noise dependency on several factors, such as
RIN transfer, are presented in sections 3.5 and 3.6.
3.2.5.3 Brillouin Amplification
The use of Brillouin amplification to assist ϕOTDR operation has been recently
proposed as an alternative to the use of Raman amplification. Since SBS presents a
higher gain coefficient than stimulated Raman scattering (SRS), lower pump powers are
required for signal amplification [43]. Since the Brillouin gain is dependent on the
frequency difference between the signal and the pump, the gain can be tuned along the
sensing fibre with a proper choice of fibres with different Brillouin frequency shifts.
This, however, also constitutes a drawback of the technique, as the gain will also be
dependent on the temperature of the fibre, which can lead to instability of the system.
Using ϕOTDR assisted by Brillouin amplification, intrusion sensing was demonstrated
FCUP Distributed and Remote fibre Sensing Assisted by Raman Effect
55
over 124 km [43]. In this case, a coherent detection scheme with an ultra-narrow
linewidth (100 Hz) laser, and wavelet denoising, were used. By combining first and
second-order Raman amplification with Brillouin amplification the sensing range was
improved to 175 km [44].
3.2.6 Bandwidth increase
In conventional ϕOTDR operation, only one pulse can travel in the fibre at a time in
order to avoid the superposition of backscattered signals. Therefore, the maximum pulse
repetition rate is limited by the sensing fibre length (eq. 3.2). In order to increase the
pulse repetition rate above this limit, a technique has been recently proposed. By using
coherent detection, it is possible to distinguish between superimposed traces resulting
from ϕOTDR pulses with different frequencies. In this case, ϕOTDR pulses separated
by a time delay lower than the time interval corresponding to the fibre length can be
used, thus increasing the sampling rate [64],[65]. By using two and four ϕOTDR pulses
of different frequencies, the maximum sampling rate was increased by two times [64]
(2∙80 kHz over 1 km of fibre) and four times (4∙10 kHz over 10 km of fibre) [65],
respectively, when compared to that of a conventional ϕOTDR limited by the fibre
length. However, it should be pointed out that the possibility of noise increase in the
system, due to the detection of superimposed traces, was not properly analyzed.
Therefore a straightforward deduction that the true frequency detection bandwidth of
these systems will be increased by a factor of two and four is incorrect. The complexity
of the demodulation process is also increased, thus requiring more processing power,
which can present a limitation in real practical applications.
Another solution has been proposed to greatly increase the frequency detection
bandwidth, which consists of combining a Mach-Zehnder interferometer (MZI) and a
ϕOTDR [66],[67]. In the same fibre, CW light is used for the MZI measurements, which
allows the detection of frequency vibrations in the MHz range. Narrow pulses (~10 m)
were used for the ϕOTDR operation, which allows the localization of the vibration
events. The technique allowed the detection of distributed frequency vibrations of up to
6 MHz of a pencil break event over ~1 km of fibre with 5 m of spatial resolution.
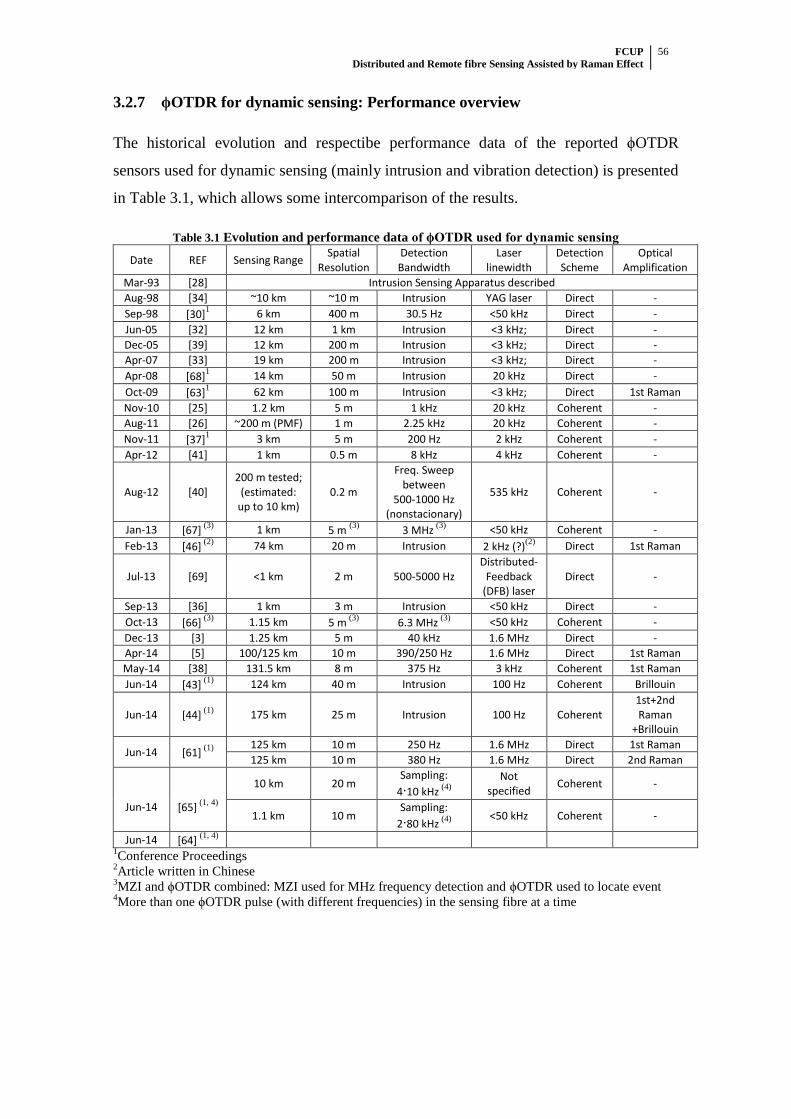
FCUP Distributed and Remote fibre Sensing Assisted by Raman Effect
56
3.2.7 ϕOTDR for dynamic sensing: Performance overview
The historical evolution and respectibe performance data of the reported ϕOTDR
sensors used for dynamic sensing (mainly intrusion and vibration detection) is presented
in Table 3.1, which allows some intercomparison of the results.
Table 3.1 Evolution and performance data of ϕOTDR used for dynamic sensing
Date REF Sensing Range Spatial
Resolution Detection Bandwidth
Laser linewidth
Detection Scheme
Optical Amplification
Mar-93 [28] Intrusion Sensing Apparatus described
Aug-98 [34] ~10 km ~10 m Intrusion YAG laser Direct -
Sep-98 [30]1 6 km 400 m 30.5 Hz <50 kHz Direct -
Jun-05 [32] 12 km 1 km Intrusion <3 kHz; Direct -
Dec-05 [39] 12 km 200 m Intrusion <3 kHz; Direct -
Apr-07 [33] 19 km 200 m Intrusion <3 kHz; Direct -
Apr-08 [68]1 14 km 50 m Intrusion 20 kHz Direct -
Oct-09 [63]1 62 km 100 m Intrusion <3 kHz; Direct 1st Raman
Nov-10 [25] 1.2 km 5 m 1 kHz 20 kHz Coherent -
Aug-11 [26] ~200 m (PMF) 1 m 2.25 kHz 20 kHz Coherent -
Nov-11 [37]1 3 km 5 m 200 Hz 2 kHz Coherent -
Apr-12 [41] 1 km 0.5 m 8 kHz 4 kHz Coherent -
Aug-12 [40] 200 m tested;
(estimated: up to 10 km)
0.2 m
Freq. Sweep between
500-1000 Hz (nonstacionary)
535 kHz Coherent -
Jan-13 [67] (3)
1 km 5 m (3)
3 MHz (3)
<50 kHz Coherent -
Feb-13 [46] (2)
74 km 20 m Intrusion 2 kHz (?)(2)
Direct 1st Raman
Jul-13 [69] <1 km 2 m 500-5000 Hz Distributed-
Feedback (DFB) laser
Direct -
Sep-13 [36] 1 km 3 m Intrusion <50 kHz Direct -
Oct-13 [66] (3)
1.15 km 5 m (3)
6.3 MHz (3)
<50 kHz Coherent -
Dec-13 [3] 1.25 km 5 m 40 kHz 1.6 MHz Direct -
Apr-14 [5] 100/125 km 10 m 390/250 Hz 1.6 MHz Direct 1st Raman
May-14 [38] 131.5 km 8 m 375 Hz 3 kHz Coherent 1st Raman
Jun-14 [43] (1)
124 km 40 m Intrusion 100 Hz Coherent Brillouin
Jun-14 [44] (1)
175 km 25 m Intrusion 100 Hz Coherent 1st+2nd Raman
+Brillouin
Jun-14 [61] (1)
125 km 10 m 250 Hz 1.6 MHz Direct 1st Raman
125 km 10 m 380 Hz 1.6 MHz Direct 2nd Raman
Jun-14
[65] (1, 4)
10 km 20 m Sampling:
4∙10 kHz (4)
Not specified
Coherent -
1.1 km 10 m Sampling:
2∙80 kHz (4)
<50 kHz Coherent -
Jun-14 [64] (1, 4)
1Conference Proceedings
2Article written in Chinese
3MZI and ϕOTDR combined: MZI used for MHz frequency detection and ϕOTDR used to locate event
4More than one ϕOTDR pulse (with different frequencies) in the sensing fibre at a time
FCUP Distributed and Remote fibre Sensing Assisted by Raman Effect
57
3.2.8 Comparison with other DFOS
In order to provide a comparison between the characteristics and performances of
ϕOTDR and other distributed fibre optic sensors (DFOS), an overview of the features of
the different existing DFOS is presented in this section.
Using a single interrogation unit, DFOS can currently provide up to hundreds of
thousand or even million [70] resolved sensing points along an optical fibre distance
which can range from a few metres [71] to hundreds of kilometers [72]. Such features
cannot be matched by any other technology. Furthermore, the fibre is used as both the
sensing element and the communication channel which, allied to the small size,
geometric versatility and lightweight of fibres, renders DFOS a high potential to be used
as the “nerve system” of modern structures, by mapping different parameters in real
time. The 1D monitoring of vibrations over >100 km, which can be used for intrusion
detection along gas pipelines [5], the 2D surface temperature mapping, for
environmental purposes, of a coal waste pile in combustion [73] or the 3D internal
strain measurement of a large building to assess its structural integrity [74], these are a
few of the possibilities which DFOS can be used for.
DFOS can be classified according to the type of scattering they rely on, mainly Raman
[20], Brillouin [75] and Rayleigh [76] scattering. The measurements of the signal can
also be performed in the time or frequency domain. Comparisons between the
characteristics of the different DFOS can be found in the literature [77],[74],[78]. Due
to different underlying physical working principles, these sensors present trade-offs in
their performance characteristics, and are therefore best suited for different applications.
A short description of DFOS techniques is presented below in order to provide a
comparison with ϕOTDR sensors.
3.2.8.1 Rayleigh based distributed sensing
Historically, Rayleigh based OTDR (commonly referred simply as “OTDR”) was the
first DFOS technique to be demonstrated, almost four decades ago [76, 79], and is still
commonly used for distributed measurement of losses along the fibre (thus allowing the
measurement of fibre attenuation and the location of broken points, optical connectors,
micro-bending or discontinuities), providing typical spatial resolutions of sub-
meter/hundreds of metres over a few kilometers/hundreds of kilometers. OTDR works
FCUP Distributed and Remote fibre Sensing Assisted by Raman Effect
58
by sending light pulses into an optical fibre and monitoring the Rayleigh backscattered
light in the time domain, at the same fibre end. OTDR uses low coherence (broadband)
light and can, therefore, only measure intensity variations along an optical fibre. But
other parameters can be measured by implementing suitable transducing mechanisms
which can convert the quantity to be measured into intensity variations of the light
propagating in the fibre. The use of heterodyne detection (also called coherent
detection), which consists of combining the optical signal coherently with a LO signal
before reaching the photodetector, has been demonstrated to allow a performance
improvement when compared with direct detection OTDR [80], but can also lead to
amplitude fluctuations in the coherent OTDR trace introduced by the fading noise
resulting from the interference between the signal and the LO signal [42, 81].
A few years after the OTDR implementation, POTDR, which works similarly to OTDR
but using polarized light, was introduced [82]. POTDR attracted a considerable amount
of attention due to the possibility of performing nondestructive distributed
measurements of birefringence (inversely proportional to the polarization beat length)
[83] and coupling length, which allowed the measurement of the PMD [84-87] and
polarization dependent loss (PDL) [87]. Later, POTDR was also proposed for intrusion
sensing, based on the high sensitivity to external perturbations of the SOP [88-90]. A
preliminary work showed the possibility of intrusion detection over more than 100 km
using POTDR assisted by second-order Raman amplification [88]. The main limitation
of the technique is that, due to the nature of the SOP, when an event occurs in a point of
the fibre, it affects the entire trace after that point. POTDR can therefore detect the
starting point of a perturbation very precisely, but not its end [89]. Nevertheless, the
detection of pure vibration frequencies of up to 5 kHz over 1 km, with 10 m of spatial
resolution in multiple points, has been demonstrated [90].
In the time domain, the backscattered signal is associated with a position of the fibre
based on the time between the sent pulse and the detection of the backscattered signal.
In this case, the spatial resolution is ultimately limited by the pulse width in the optical
domain and the bandwidth of the photodetector/digitizer in the electric domain. For high
spatial resolution, these systems become very expensive and complicated due to the low
SNR of the received signal and the high bandwidth required. An alternative solution to
perform high spatial resolution measurements is optical frequency domain reflectometry
(OFDR). In this case, a tuneable laser frequency is continuously swept and reflections
FCUP Distributed and Remote fibre Sensing Assisted by Raman Effect
59
from the fibre under test (FUT) interfere at the detector with a fixed reflection, the LO
signal. After performing a Fourier transform, the amplitude of each frequency has
information corresponding to power reflected at a given fibre position [91]. OFDR
presents a spatial resolution inversely proportional to the tuneable frequency range of
the laser [91, 92]. As for the sensing range, it is limited, among other factors, by the
laser coherence length [91], being typically of up to a few tens to hundreds of metres.
Using a laser with a typical tuning range of up to 40 nm, a spatial resolution of 22 μm
over 35 m has been reported [71].
3.2.8.2 Raman based distributed sensing
Raman based distributed temperature sensing (DTS) relies on the principle that the
temperature can be determined from the ratio of measured Stokes and anti-Stokes
Raman scatterings. This principle is owed to the fact that the intensity of the Stokes and
anti-Stokes Raman scatterings depends on the populations of the initial states of the
material of the fibre, which in turn depend on the temperature. The technique was
initially demonstrated by Dakin et al. [20], and commercial Raman based DTSs were
made available in the 90’s, before Brillouin based ones [93]. Although less commonly
used, temperature can also be determined from the ratio of the anti-Stokes to the
Rayleigh backscattered light intensities.
The weak anti-Stokes Raman signal, which is 20-30 dB lower than the Rayleigh
scattered light, presents one of the main challenges to the use of Raman based DTS. To
overcome this problem, high power lasers and long signal averaging times are typically
required. Early works used multimode fibres (MMF) to enhance the sensitivity [94], but
this limited the sensing range due to the high losses of such fibres.
Using Raman OTDR, different spatial/temperature resolutions and sensing ranges have
been demonstrated, ranging from 0.01 m/3ºC over a 3 m of fibre with 60 s integration
time (using single photon-counting techniques) [95], to 17 m/5ºC over 40 km [96]
(using a 255 bit Simplex coding and discrete Raman amplification). Currently available
commercial systems provide spatial resolutions of 5 m over 30 km with measurement
time of a few minutes [78]. Raman OTDR has also been combined with Brillouin
frequency-based sensing to perform temperature compensated strain measurements,
achieving a spatial/strain/temperature resolution of 0.24 m/97 με/2.5ºC over 135 m [97].
FCUP Distributed and Remote fibre Sensing Assisted by Raman Effect
60
3.2.8.3 Brillouin based distributed sensing
In the Brillouin scattering process, an electromagnetic wave is scattered by an acoustic
wave. The Brillouin frequency shift between the incident and the scattered wave is
dependent on the strain and on temperature applied to a fibre, and can therefore be used
to measure these quantities. The possibility of strain measurement as well as the longer
sensing ranges achievable as compared to Raman based DTS [93], led to intensive
research on Brillouin based distributed sensing in the last two decades, and a number of
configurations based on this principle have been reported. In the time domain, Brillouin
optical time domain reflectometry (BOTDR) makes use of spontaneous Brillouin
scattering, requiring only access to one end of the fibre [98], while Brillouin optical
time domain analysis (BOTDA) [99] makes use of SBS, thus achieving higher SNR, but
requiring access to both ends of the fibre. Recently, a spatial/temperature/strain
resolution of 5 m/1.9ºC/38 με over a 240 km fibre loop (120 km sensing range) was
demonstrated using first and second-order Raman-assisted pulse-coded BOTDA [100].
A BOTDA can operate in two different configurations: Brillouin gain [101] and
Brillouin loss [102].
The phonon lifetime in a silica fibre (~6 ns) sets a “natural” resolution of ~1 m for
standard BOTDA. In order to overcome this limitation and further increase the
resolution, a number of techniques have been recently proposed, such as dark pulse
[103], dynamic grating [104], differential pre-excitation [105], Brillouin echoes [106] or
Differential Pulse-Width pair (DPP) [107], [72]. Among these, DPP-BOTDA presents
the best features for long range sensing, and spatial/temperature resolutions ranging
from 0.02 m/2ºC over 2 km [107] to 0.5 m/2.9ºC over 100 km [72] (assisted by Raman
amplification) have been demonstrated.
An important feature of the Brillouin based sensing is that it has been already
demonstrated to provide absolute measurements of temperature and strain unlike
temperature measurement using ϕOTDR, which requires a comparison between two
fibre measurements. The long-term stability of the ϕOTDR “fingerprint” of a given
optical fibre remains an unsolved question, which has to be seriously addressed. A
limitation of Brillouin-based sensors in general is that the Brillouin scattering signal (for
spontaneous scattering) is generally lower than the Rayleigh scattering one and
therefore averaging of traces is usually required to increase the SNR. This limits the
maximum readable frequency in dynamic measurements. In fact, for sensing distances

FCUP Distributed and Remote fibre Sensing Assisted by Raman Effect
61
of a few kilometers, Brillouin sensors are typically limited to a few tens of Hz, which is
far from the tens of kHz demonstrated using ϕOTDR [3].
FCUP Distributed and Remote fibre Sensing Assisted by Raman Effect
62
3.3 ϕOTDR for distributed vibration sensing
3.3.1 Introduction
In this section, the performance of a ϕOTDR used for distributed vibration sensing,
using a direct detection scheme, is characterized both theoretically and experimentally,
using the best measuring conditions which avoid nonlinearities (discussed in
section 3.4). An analysis of the statistics and noise of the ϕOTDR signal is also
presented. Distributed measurement of ultrasonic vibrations is achieved, to the best of
our knowledge, for the first time.
3.3.2 Theoretical Model
3.3.2.1 Signal statistics
We start by developing a theoretical model for a ϕOTDR, which will allow us to
understand the performance of the experimental system described later on. For the
theoretical model, we assume that a short spatial width (W) ϕOTDR pulse of highly
coherent light is delivered into a fibre with constant loss (α) and isotropic propagation.
This pulse reaches the position z in the fibre at time T. The ϕOTDR signal received
from the pulse at that position (at instant 2T) will be the sum of the fields reflected from
the M scattering points contained in the section of fibre [ - / 2; ]g gz T V W T V (as
deducted in section 3.2.1), and will be
2 2
0 1( 2 , 0) m
M iz i T
mmE t T z E e e r e
, (3.5)
where Vg is the group velocity and [ - / 4]gz T V W is the position corresponding to
the centre of the fibre section from which the signal is being collected. It should be
noted that the signal received E(t=2T, z=0) accounts for the contributions generated by
the passage of the whole pulse (from leading to trailing edge), despite being the sum of
the fields reflected from a fibre section of length W/2, as discussed in section 3.2.1. The
mth
scattering centre has a reflectivity [0,1]mr (usually mr <<1), and the phase
introduced in the reflected field by both the optical path and the scattering centres is m
(where [0,2 ]m is assumed to be uniformly distributed). The amplitude of the
reflected field will follow a Rayleigh distribution, as shown in previous papers [81]. The
FCUP Distributed and Remote fibre Sensing Assisted by Raman Effect
63
normalized intensity (I) received at the beginning of the fibre (z=0), neglecting the
losses, will therefore be [108]
12 2 2
1 1 1 1| | | | 2 cos( )m
M M M Mi
m m i j i jm m i j iI E r e r rr
. (3.6)
This addition of M (M→∞; 1
1M
mmr
) wave amplitudes is a random walk process,
and its probability distribution will follow an exponential distribution [108]:
( )1( )
MI
MMP I e
M
. (3.7)
It is interesting to note that the average intensity of the detected field from a given
position will be proportional to the number of scattering centres M
( 0
I ( )M M M MI P I dI M
) within the pulse length at that position.
It can be seen that there is a certain probability of having a close-to-zero signal at a
given position (a signal below the noise level of the detector, δ). This probability is
termed “fading probability”, since the system “loses” completely the signal at this
position. The fading probability (P(IM<δ)), as a function of the detector noise level δ,
will be the cumulative probability of the intensity distribution function.
If a perturbation is introduced in the qth
( [1, ]q M ) scattering centre with a
corresponding phase perturbation φp, then the corresponding intensity variation (I∆)
between the unperturbed (I) and the perturbed (I’) signals will be given by
1
1' 2 [cos( ) cos( )]
q M
i j i j i j pi j qI I I rr
. (3.8)
It is clear that the response of the system is generally nonlinear, except for very small
values of the perturbation φp. The perturbed and unperturbed signals have correlated
exponential probability distributions. Thus, the probability distribution of the intensity
variation will be Laplace-distributed [108, 109] (a different form of exponential
distribution). In the case of an applied vibration, a ϕOTDR should therefore provide
better information regarding the form (frequency) of the perturbation rather than from
its amplitude. Again, the signal variation is proportional to M and the ϕOTDR signal
intensity. A higher average back-reflected intensity (I) will result in higher values of I∆,
increasing the sensitivity of the system and decreasing the fading probability of the
FCUP Distributed and Remote fibre Sensing Assisted by Raman Effect
64
signal of interest (I∆). The most obvious solution to reduce the fading probability is then
to raise the ϕOTDR pulse power. However, this approach is limited by the onset of
optical nonlinearities [2], as discussed in section 3.4.
3.3.2.2 Signal-to-noise ratio (SNR)
As previously, the minimum detectable signal will be limited by noise in the optical
detection. Two types of noise sources are present in a ϕOTDR system: electrical noise
caused by the photodetection process (including shot noise and thermal noise), and
optical noise which causes fluctuations in the input power to the detector (introduced by
optical amplifiers, and coherent noise due to leakage of the pulse generation system).
Considering high performance photodetectors, like the ones available commercially in
fibre-optic instrumentation, the noise contributions introduced by the photodetection
process are close to the fundamental minimum. Considering typical values of the
parameters (pulse peak power on the order of hundreds of milliwatts, pulse length of a
few metres, Rayleigh backscatter coefficient (αRayleigh Backscatter) of -72 dB/m), the SNR
given by pure detection processes in a 100 MHz detector is of the order of 20 dB, using
the traditional formula for a p-i-n receiver [110]. Optical noise is generally much more a
problem, as we will see next.
For a ϕOTDR system like the one described in section 3.3.3, we can consider two main
sources of optical noise: signal-spontaneous and spontaneous-spontaneous beating
caused by the backscattered amplified spontaneous emission (ASE) from the optical
amplifiers and the non-infinite ER of the pulse generator. Fig. 3.7 presents the power
distribution along the fibre for a ϕOTDR pulse with finite ER. Intra-band noise is
generated due to the fact that there is optical power, at the ϕOTDR pulse frequency,
outside the ϕOTDR pulse. The ratio between the peak power of ϕOTDR pulse (P1) and
the leaked power at the master frequency (P2) is the ER of the pulse generator used
(ER=P1/P2). Considering an incoherent type of noise, then:
Incoherent Intra-band noise: ( / )pulse fiberSNR ER L L , (3.9)
where Lfibre and Lpulse are, respectively, the lengths of the fibre and of the pulse in the
fibre. However, if the coherence length of the master laser is much longer than the pulse
length, and spreads over the complete extension of the fibre (which is the case in most
typical high-visibility ϕOTDRs reported in the literature), then the backscattered CW
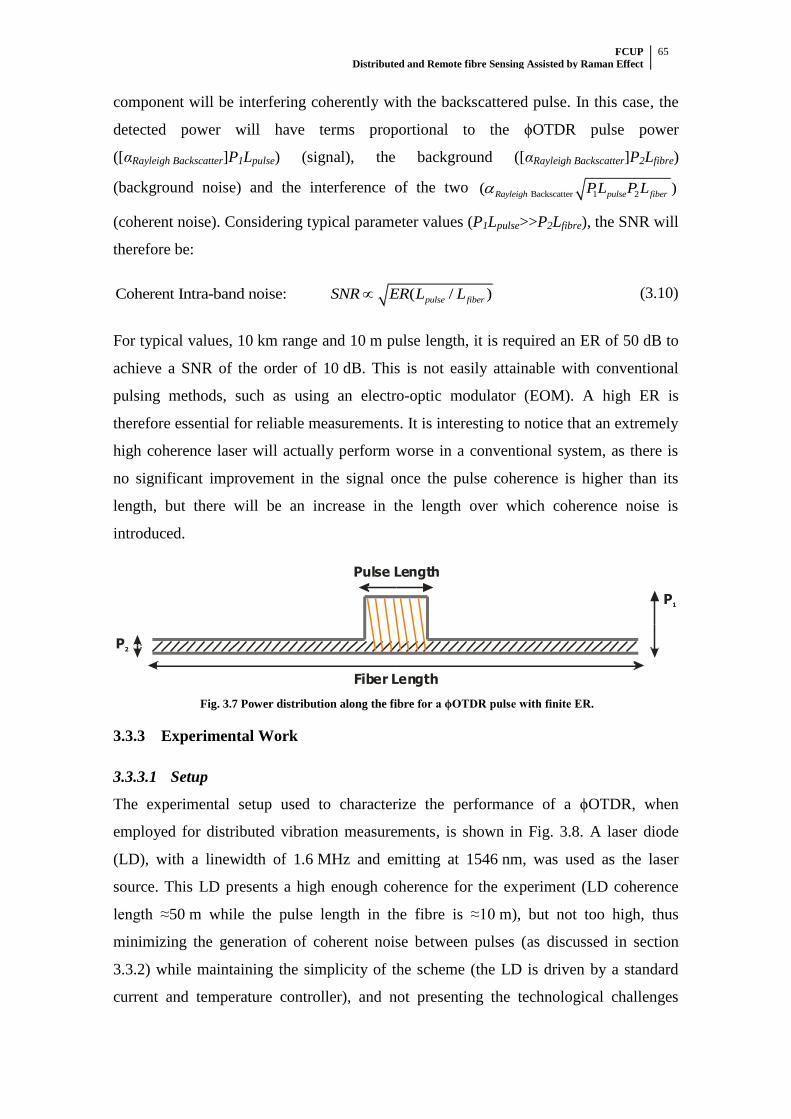
FCUP Distributed and Remote fibre Sensing Assisted by Raman Effect
65
component will be interfering coherently with the backscattered pulse. In this case, the
detected power will have terms proportional to the ϕOTDR pulse power
([αRayleigh Backscatter]P1Lpulse) (signal), the background ([αRayleigh Backscatter]P2Lfibre)
(background noise) and the interference of the two Backscatter 1 2( )Rayleigh pulse fiberPL P L
(coherent noise). Considering typical parameter values (P1Lpulse>>P2Lfibre), the SNR will
therefore be:
Coherent Intra-band noise: ( / )pulse fiberSNR ER L L (3.10)
For typical values, 10 km range and 10 m pulse length, it is required an ER of 50 dB to
achieve a SNR of the order of 10 dB. This is not easily attainable with conventional
pulsing methods, such as using an electro-optic modulator (EOM). A high ER is
therefore essential for reliable measurements. It is interesting to notice that an extremely
high coherence laser will actually perform worse in a conventional system, as there is
no significant improvement in the signal once the pulse coherence is higher than its
length, but there will be an increase in the length over which coherence noise is
introduced.
P2
P1
Fiber Length
Pulse Length
Fig. 3.7 Power distribution along the fibre for a ϕOTDR pulse with finite ER.
3.3.3 Experimental Work
3.3.3.1 Setup
The experimental setup used to characterize the performance of a ϕOTDR, when
employed for distributed vibration measurements, is shown in Fig. 3.8. A laser diode
(LD), with a linewidth of 1.6 MHz and emitting at 1546 nm, was used as the laser
source. This LD presents a high enough coherence for the experiment (LD coherence
length ≈50 m while the pulse length in the fibre is ≈10 m), but not too high, thus
minimizing the generation of coherent noise between pulses (as discussed in section
3.3.2) while maintaining the simplicity of the scheme (the LD is driven by a standard
current and temperature controller), and not presenting the technological challenges
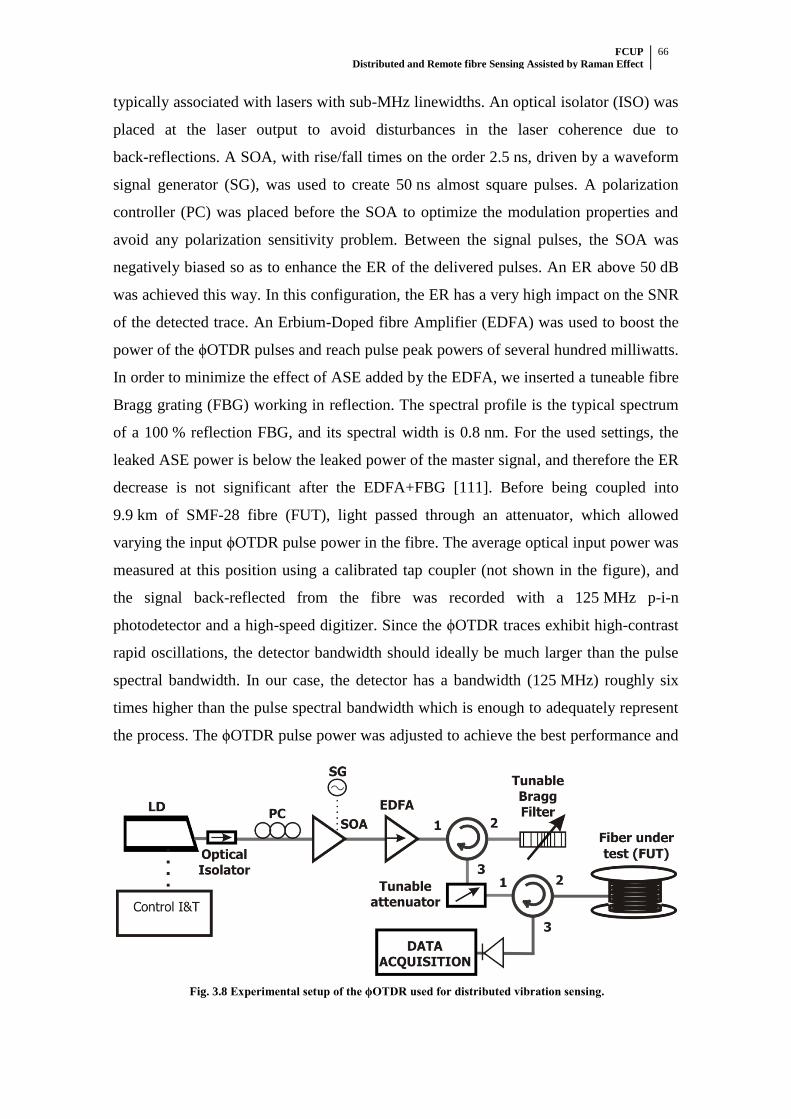
FCUP Distributed and Remote fibre Sensing Assisted by Raman Effect
66
typically associated with lasers with sub-MHz linewidths. An optical isolator (ISO) was
placed at the laser output to avoid disturbances in the laser coherence due to
back-reflections. A SOA, with rise/fall times on the order 2.5 ns, driven by a waveform
signal generator (SG), was used to create 50 ns almost square pulses. A polarization
controller (PC) was placed before the SOA to optimize the modulation properties and
avoid any polarization sensitivity problem. Between the signal pulses, the SOA was
negatively biased so as to enhance the ER of the delivered pulses. An ER above 50 dB
was achieved this way. In this configuration, the ER has a very high impact on the SNR
of the detected trace. An Erbium-Doped fibre Amplifier (EDFA) was used to boost the
power of the ϕOTDR pulses and reach pulse peak powers of several hundred milliwatts.
In order to minimize the effect of ASE added by the EDFA, we inserted a tuneable fibre
Bragg grating (FBG) working in reflection. The spectral profile is the typical spectrum
of a 100 % reflection FBG, and its spectral width is 0.8 nm. For the used settings, the
leaked ASE power is below the leaked power of the master signal, and therefore the ER
decrease is not significant after the EDFA+FBG [111]. Before being coupled into
9.9 km of SMF-28 fibre (FUT), light passed through an attenuator, which allowed
varying the input ϕOTDR pulse power in the fibre. The average optical input power was
measured at this position using a calibrated tap coupler (not shown in the figure), and
the signal back-reflected from the fibre was recorded with a 125 MHz p-i-n
photodetector and a high-speed digitizer. Since the ϕOTDR traces exhibit high-contrast
rapid oscillations, the detector bandwidth should ideally be much larger than the pulse
spectral bandwidth. In our case, the detector has a bandwidth (125 MHz) roughly six
times higher than the pulse spectral bandwidth which is enough to adequately represent
the process. The ϕOTDR pulse power was adjusted to achieve the best performance and
Fig. 3.8 Experimental setup of the ϕOTDR used for distributed vibration sensing.
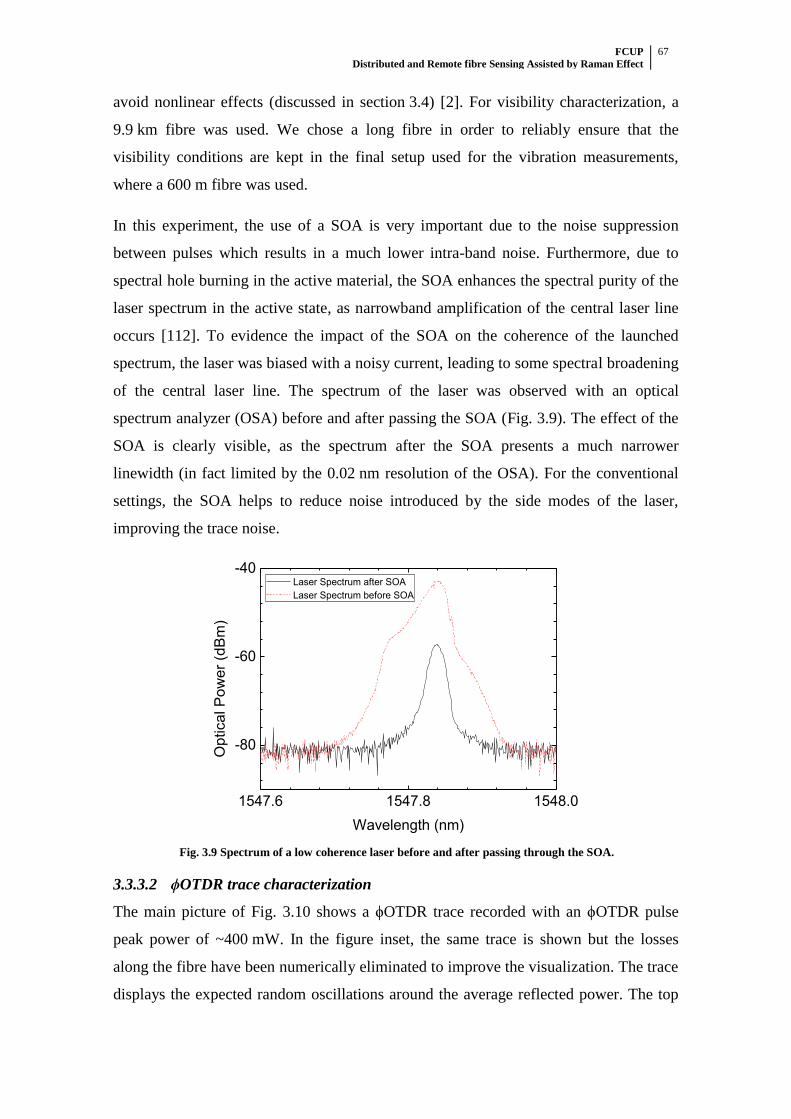
FCUP Distributed and Remote fibre Sensing Assisted by Raman Effect
67
avoid nonlinear effects (discussed in section 3.4) [2]. For visibility characterization, a
9.9 km fibre was used. We chose a long fibre in order to reliably ensure that the
visibility conditions are kept in the final setup used for the vibration measurements,
where a 600 m fibre was used.
In this experiment, the use of a SOA is very important due to the noise suppression
between pulses which results in a much lower intra-band noise. Furthermore, due to
spectral hole burning in the active material, the SOA enhances the spectral purity of the
laser spectrum in the active state, as narrowband amplification of the central laser line
occurs [112]. To evidence the impact of the SOA on the coherence of the launched
spectrum, the laser was biased with a noisy current, leading to some spectral broadening
of the central laser line. The spectrum of the laser was observed with an optical
spectrum analyzer (OSA) before and after passing the SOA (Fig. 3.9). The effect of the
SOA is clearly visible, as the spectrum after the SOA presents a much narrower
linewidth (in fact limited by the 0.02 nm resolution of the OSA). For the conventional
settings, the SOA helps to reduce noise introduced by the side modes of the laser,
improving the trace noise.
1547.6 1547.8 1548.0
-80
-60
-40
Op
tica
l P
ow
er
(dB
m)
Wavelength (nm)
Laser Spectrum after SOA
Laser Spectrum before SOA
Fig. 3.9 Spectrum of a low coherence laser before and after passing through the SOA.
3.3.3.2 ϕOTDR trace characterization
The main picture of Fig. 3.10 shows a ϕOTDR trace recorded with an ϕOTDR pulse
peak power of ~400 mW. In the figure inset, the same trace is shown but the losses
along the fibre have been numerically eliminated to improve the visualization. The trace
displays the expected random oscillations around the average reflected power. The top
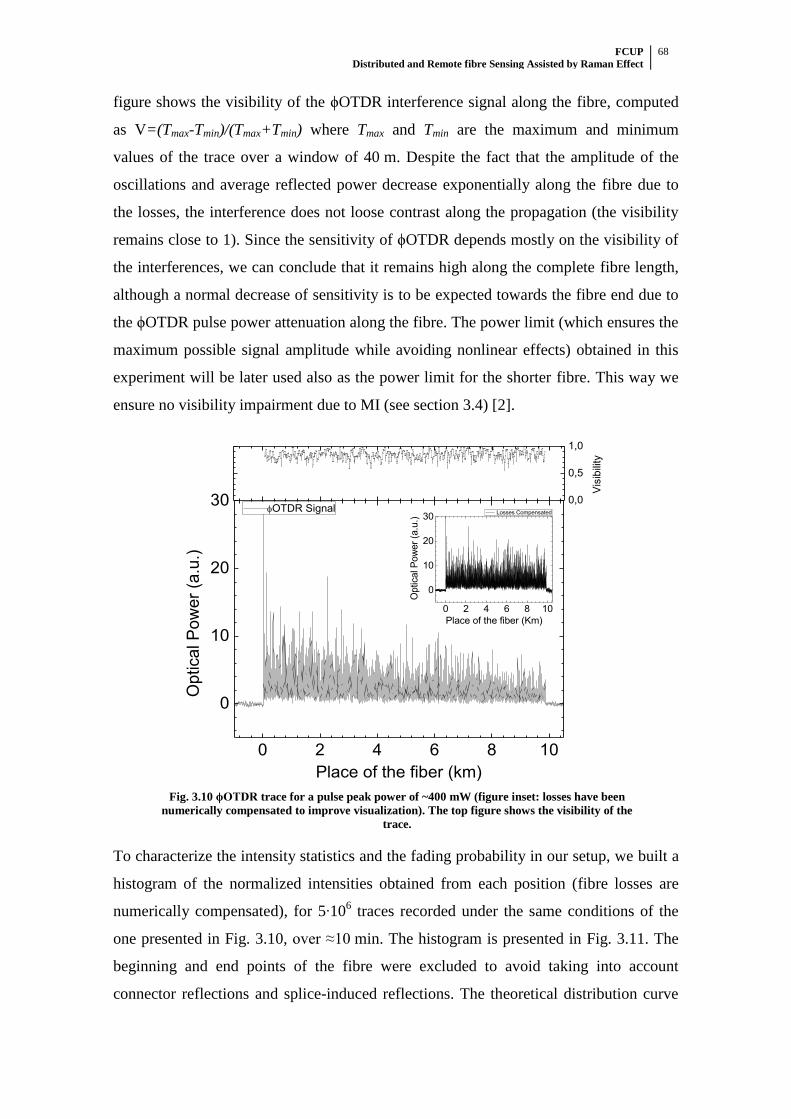
FCUP Distributed and Remote fibre Sensing Assisted by Raman Effect
68
figure shows the visibility of the ϕOTDR interference signal along the fibre, computed
as V=(Tmax-Tmin)/(Tmax+Tmin) where Tmax and Tmin are the maximum and minimum
values of the trace over a window of 40 m. Despite the fact that the amplitude of the
oscillations and average reflected power decrease exponentially along the fibre due to
the losses, the interference does not loose contrast along the propagation (the visibility
remains close to 1). Since the sensitivity of ϕOTDR depends mostly on the visibility of
the interferences, we can conclude that it remains high along the complete fibre length,
although a normal decrease of sensitivity is to be expected towards the fibre end due to
the ϕOTDR pulse power attenuation along the fibre. The power limit (which ensures the
maximum possible signal amplitude while avoiding nonlinear effects) obtained in this
experiment will be later used also as the power limit for the shorter fibre. This way we
ensure no visibility impairment due to MI (see section 3.4) [2].
0 2 4 6 8 10
0
10
20
30 0,0
0,5
1,0
0 2 4 6 8 10
0
10
20
30
Optical P
ow
er
(a.u
.)
Place of the fiber (Km)
Losses Compensated
Optica
l P
ow
er
(a.u
.)
Place of the fiber (km)
OTDR Signal
Vis
ibili
ty
Fig. 3.10 ϕOTDR trace for a pulse peak power of ~400 mW (figure inset: losses have been
numerically compensated to improve visualization). The top figure shows the visibility of the
trace.
To characterize the intensity statistics and the fading probability in our setup, we built a
histogram of the normalized intensities obtained from each position (fibre losses are
numerically compensated), for 5∙106 traces recorded under the same conditions of the
one presented in Fig. 3.10, over ≈10 min. The histogram is presented in Fig. 3.11. The
beginning and end points of the fibre were excluded to avoid taking into account
connector reflections and splice-induced reflections. The theoretical distribution curve
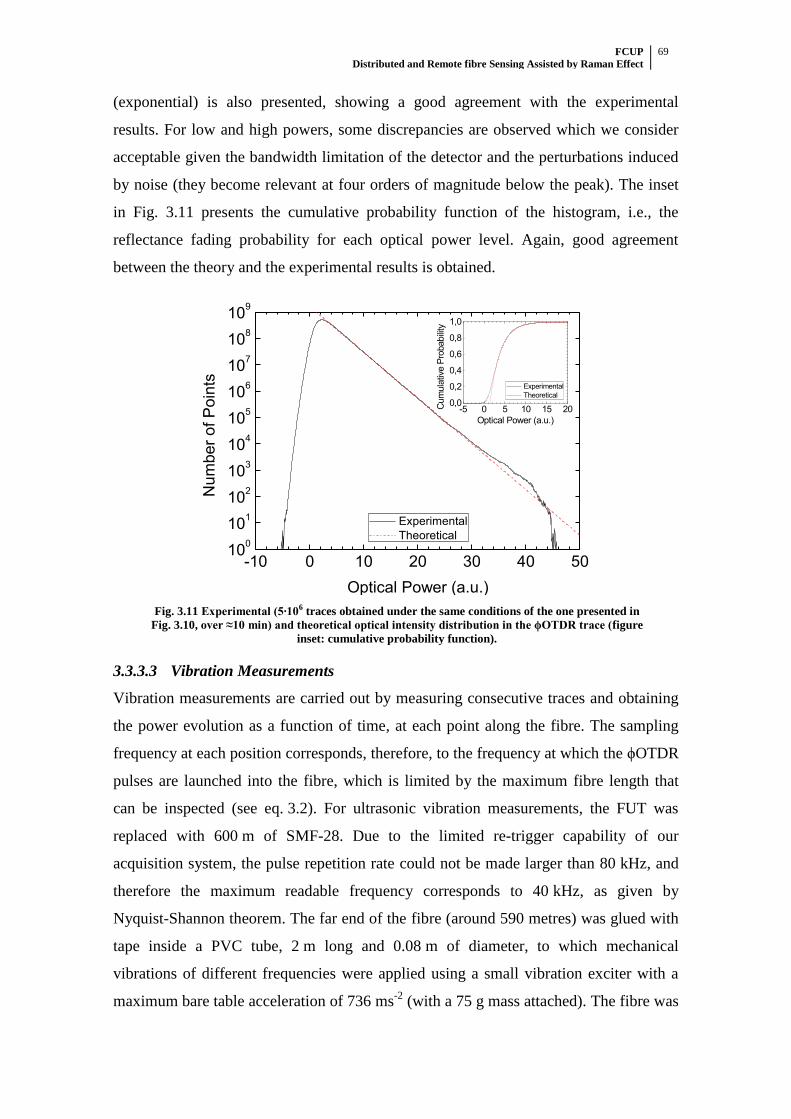
FCUP Distributed and Remote fibre Sensing Assisted by Raman Effect
69
(exponential) is also presented, showing a good agreement with the experimental
results. For low and high powers, some discrepancies are observed which we consider
acceptable given the bandwidth limitation of the detector and the perturbations induced
by noise (they become relevant at four orders of magnitude below the peak). The inset
in Fig. 3.11 presents the cumulative probability function of the histogram, i.e., the
reflectance fading probability for each optical power level. Again, good agreement
between the theory and the experimental results is obtained.
-10 0 10 20 30 40 5010
0
101
102
103
104
105
106
107
108
109
-5 0 5 10 15 200,0
0,2
0,4
0,6
0,8
1,0
Experimental
Theoretical
Cum
ula
tive P
robabili
ty
Optical Power (a.u.)
Num
ber
of P
oin
ts
Optical Power (a.u.)
Experimental
Theoretical
Fig. 3.11 Experimental (5∙106 traces obtained under the same conditions of the one presented in
Fig. 3.10, over ≈10 min) and theoretical optical intensity distribution in the ϕOTDR trace (figure
inset: cumulative probability function).
3.3.3.3 Vibration Measurements
Vibration measurements are carried out by measuring consecutive traces and obtaining
the power evolution as a function of time, at each point along the fibre. The sampling
frequency at each position corresponds, therefore, to the frequency at which the ϕOTDR
pulses are launched into the fibre, which is limited by the maximum fibre length that
can be inspected (see eq. 3.2). For ultrasonic vibration measurements, the FUT was
replaced with 600 m of SMF-28. Due to the limited re-trigger capability of our
acquisition system, the pulse repetition rate could not be made larger than 80 kHz, and
therefore the maximum readable frequency corresponds to 40 kHz, as given by
Nyquist-Shannon theorem. The far end of the fibre (around 590 metres) was glued with
tape inside a PVC tube, 2 m long and 0.08 m of diameter, to which mechanical
vibrations of different frequencies were applied using a small vibration exciter with a
maximum bare table acceleration of 736 ms-2
(with a 75 g mass attached). The fibre was
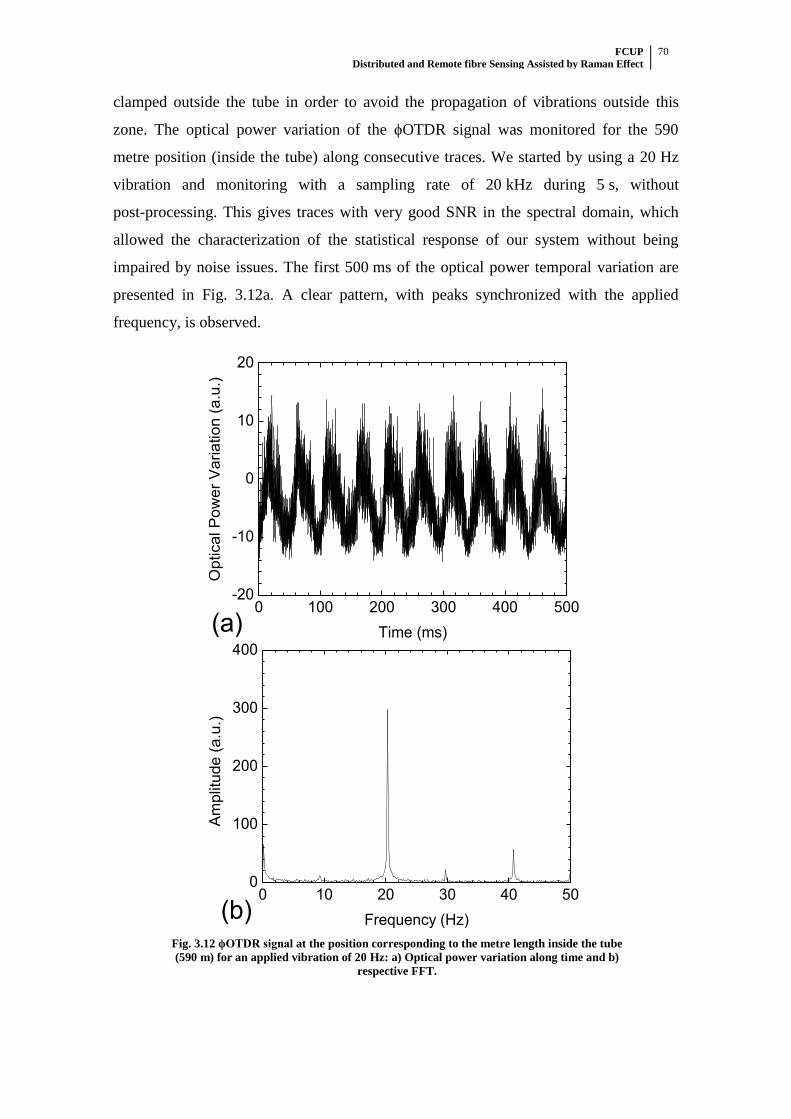
FCUP Distributed and Remote fibre Sensing Assisted by Raman Effect
70
clamped outside the tube in order to avoid the propagation of vibrations outside this
zone. The optical power variation of the ϕOTDR signal was monitored for the 590
metre position (inside the tube) along consecutive traces. We started by using a 20 Hz
vibration and monitoring with a sampling rate of 20 kHz during 5 s, without
post-processing. This gives traces with very good SNR in the spectral domain, which
allowed the characterization of the statistical response of our system without being
impaired by noise issues. The first 500 ms of the optical power temporal variation are
presented in Fig. 3.12a. A clear pattern, with peaks synchronized with the applied
frequency, is observed.
0 100 200 300 400 500-20
-10
0
10
20
Optical P
ow
er
Variation (
a.u
.)
Time (ms)(a)
0 10 20 30 40 500
100
200
300
400
(b)
Am
plit
ude (
a.u
.)
Frequency (Hz)
Fig. 3.12 ϕOTDR signal at the position corresponding to the metre length inside the tube
(590 m) for an applied vibration of 20 Hz: a) Optical power variation along time and b)
respective FFT.
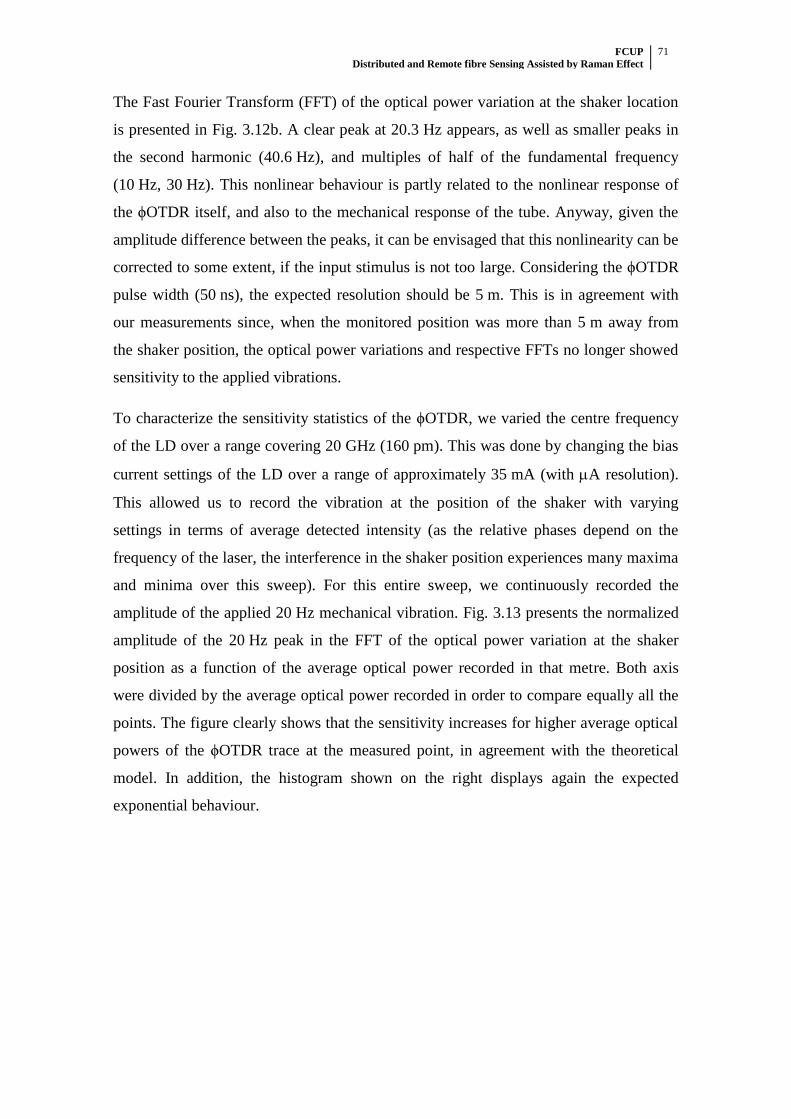
FCUP Distributed and Remote fibre Sensing Assisted by Raman Effect
71
The Fast Fourier Transform (FFT) of the optical power variation at the shaker location
is presented in Fig. 3.12b. A clear peak at 20.3 Hz appears, as well as smaller peaks in
the second harmonic (40.6 Hz), and multiples of half of the fundamental frequency
(10 Hz, 30 Hz). This nonlinear behaviour is partly related to the nonlinear response of
the ϕOTDR itself, and also to the mechanical response of the tube. Anyway, given the
amplitude difference between the peaks, it can be envisaged that this nonlinearity can be
corrected to some extent, if the input stimulus is not too large. Considering the ϕOTDR
pulse width (50 ns), the expected resolution should be 5 m. This is in agreement with
our measurements since, when the monitored position was more than 5 m away from
the shaker position, the optical power variations and respective FFTs no longer showed
sensitivity to the applied vibrations.
To characterize the sensitivity statistics of the ϕOTDR, we varied the centre frequency
of the LD over a range covering 20 GHz (160 pm). This was done by changing the bias
current settings of the LD over a range of approximately 35 mA (with A resolution).
This allowed us to record the vibration at the position of the shaker with varying
settings in terms of average detected intensity (as the relative phases depend on the
frequency of the laser, the interference in the shaker position experiences many maxima
and minima over this sweep). For this entire sweep, we continuously recorded the
amplitude of the applied 20 Hz mechanical vibration. Fig. 3.13 presents the normalized
amplitude of the 20 Hz peak in the FFT of the optical power variation at the shaker
position as a function of the average optical power recorded in that metre. Both axis
were divided by the average optical power recorded in order to compare equally all the
points. The figure clearly shows that the sensitivity increases for higher average optical
powers of the ϕOTDR trace at the measured point, in agreement with the theoretical
model. In addition, the histogram shown on the right displays again the expected
exponential behaviour.
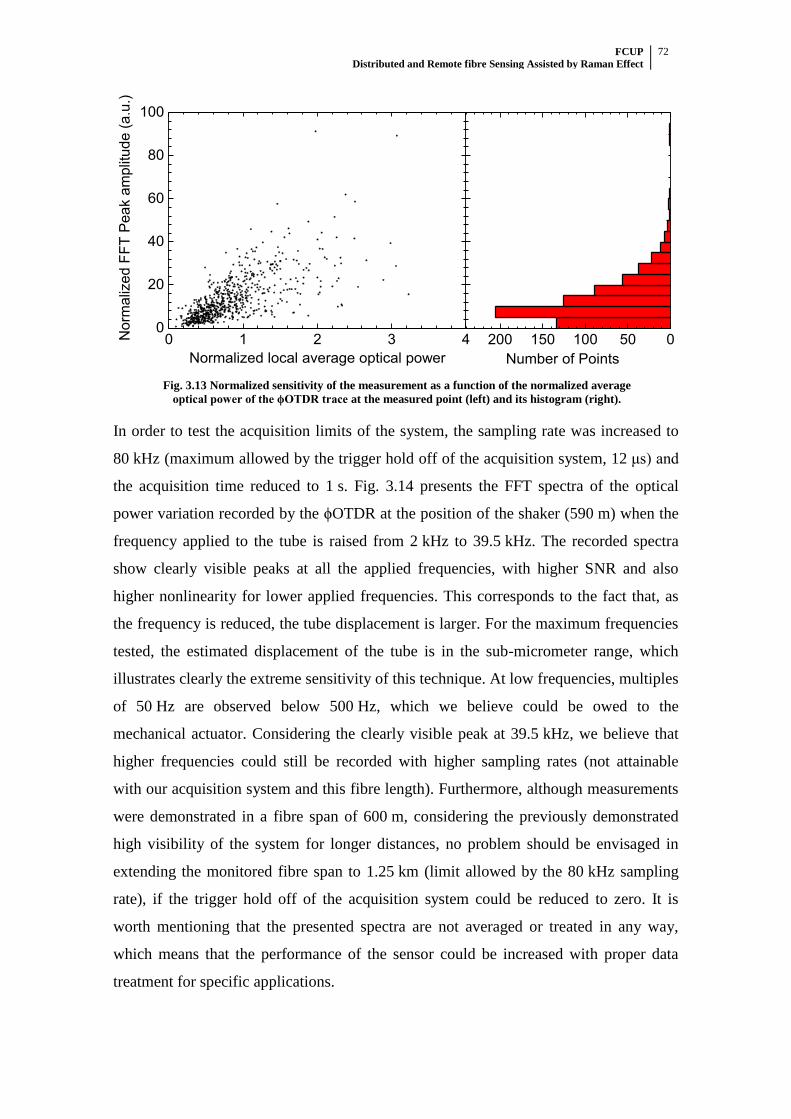
FCUP Distributed and Remote fibre Sensing Assisted by Raman Effect
72
0 1 2 3 40
20
40
60
80
100
Norm
aliz
ed F
FT
Pea
k a
mplit
ude (
a.u
.)
Normalized local average optical power
200 150 100 50 0
Number of Points
Fig. 3.13 Normalized sensitivity of the measurement as a function of the normalized average
optical power of the ϕOTDR trace at the measured point (left) and its histogram (right).
In order to test the acquisition limits of the system, the sampling rate was increased to
80 kHz (maximum allowed by the trigger hold off of the acquisition system, 12 μs) and
the acquisition time reduced to 1 s. Fig. 3.14 presents the FFT spectra of the optical
power variation recorded by the ϕOTDR at the position of the shaker (590 m) when the
frequency applied to the tube is raised from 2 kHz to 39.5 kHz. The recorded spectra
show clearly visible peaks at all the applied frequencies, with higher SNR and also
higher nonlinearity for lower applied frequencies. This corresponds to the fact that, as
the frequency is reduced, the tube displacement is larger. For the maximum frequencies
tested, the estimated displacement of the tube is in the sub-micrometer range, which
illustrates clearly the extreme sensitivity of this technique. At low frequencies, multiples
of 50 Hz are observed below 500 Hz, which we believe could be owed to the
mechanical actuator. Considering the clearly visible peak at 39.5 kHz, we believe that
higher frequencies could still be recorded with higher sampling rates (not attainable
with our acquisition system and this fibre length). Furthermore, although measurements
were demonstrated in a fibre span of 600 m, considering the previously demonstrated
high visibility of the system for longer distances, no problem should be envisaged in
extending the monitored fibre span to 1.25 km (limit allowed by the 80 kHz sampling
rate), if the trigger hold off of the acquisition system could be reduced to zero. It is
worth mentioning that the presented spectra are not averaged or treated in any way,
which means that the performance of the sensor could be increased with proper data
treatment for specific applications.
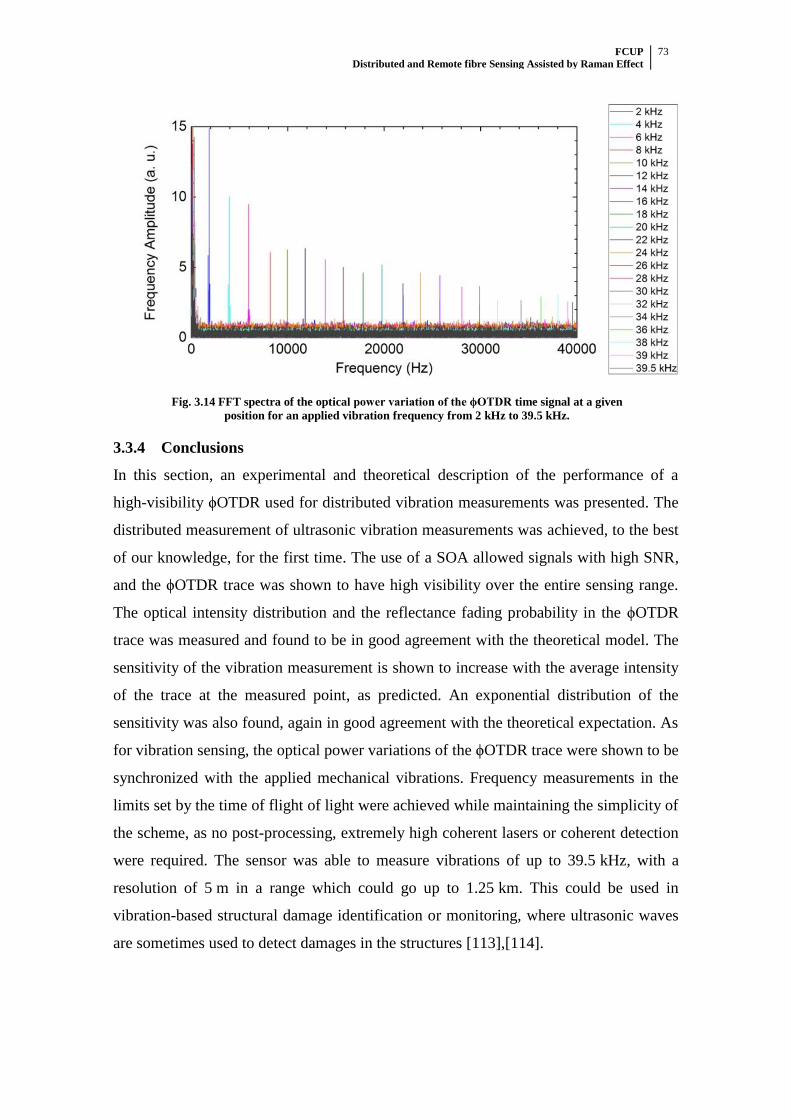
FCUP Distributed and Remote fibre Sensing Assisted by Raman Effect
73
Fig. 3.14 FFT spectra of the optical power variation of the ϕOTDR time signal at a given
position for an applied vibration frequency from 2 kHz to 39.5 kHz.
3.3.4 Conclusions
In this section, an experimental and theoretical description of the performance of a
high-visibility ϕOTDR used for distributed vibration measurements was presented. The
distributed measurement of ultrasonic vibration measurements was achieved, to the best
of our knowledge, for the first time. The use of a SOA allowed signals with high SNR,
and the ϕOTDR trace was shown to have high visibility over the entire sensing range.
The optical intensity distribution and the reflectance fading probability in the ϕOTDR
trace was measured and found to be in good agreement with the theoretical model. The
sensitivity of the vibration measurement is shown to increase with the average intensity
of the trace at the measured point, as predicted. An exponential distribution of the
sensitivity was also found, again in good agreement with the theoretical expectation. As
for vibration sensing, the optical power variations of the ϕOTDR trace were shown to be
synchronized with the applied mechanical vibrations. Frequency measurements in the
limits set by the time of flight of light were achieved while maintaining the simplicity of
the scheme, as no post-processing, extremely high coherent lasers or coherent detection
were required. The sensor was able to measure vibrations of up to 39.5 kHz, with a
resolution of 5 m in a range which could go up to 1.25 km. This could be used in
vibration-based structural damage identification or monitoring, where ultrasonic waves
are sometimes used to detect damages in the structures [113],[114].
FCUP Distributed and Remote fibre Sensing Assisted by Raman Effect
74
3.4 ϕOTDR Pulse Peak Power limitation: Modulation Instability (MI)
3.4.1 Introduction
For a given spatial resolution, the dynamic range and SNR of a ϕOTDR sensor can be
achieved by increasing the ϕOTDR pulse peak power. However, the ϕOTDR pulse peak
power cannot be indefinitely increased due to the onset of nonlinear effects (see
section 3.2.5.1).
In this section, a study aimed to identify the limitations imposed by nonlinearities in
ϕOTDR operation is presented. MI is identified as the most important limiting factor, as
it is the first nonlinear effect to arise under normal operation conditions. The effects of
MI on the performance of ϕOTDR are thoroughly described, both theoretically and
experimentally. This study provides an important basis for the understanding of the
problems and limitations of ϕOTDR operation, which allows a better maximization of
the performance of these systems, when used for both dynamic and static
measurements.
3.4.2 Theoretical Model: Pulse propagation affected by MI
The physical principles which lead to the onset of MI, and its consequences in the
general case of light propagating on a dispersive medium, have already been discussed
in section 2.3.2.1. In this section, in order to provide a proper description of the effects
of MI in ϕOTDR operation, we start by theoretically describing the impact of MI on the
spectrum of a pulse propagating along an optical fibre. This is done by numerically
solving the Nonlinear Schrödinger Equation (NLSE) for the scalar electric field
envelope A(z, t):
2 3232
2 3| |
2 6 2
iA A AA i A A
z t t
(3.11)
Eq. 3.11 was solved using a split-step Fourier algorithm [9] with adaptive step size. The
fibre parameters used in the simulation were those of a typical SMF at the wavelength
of 1546 nm (the same of the laser used for characterization of the ϕOTDR performance
in section 3.3.3): attenuation coefficient α=0.2 dB/km, nonlinear coefficient
γ=1.3 W-1
·km-1
, GVD coefficient β2=-22.8 ps2km
-1 (corresponding to a dispersion
coefficient D=18 ps·nm-1
km-1
), third-order dispersion (TOD) coefficient
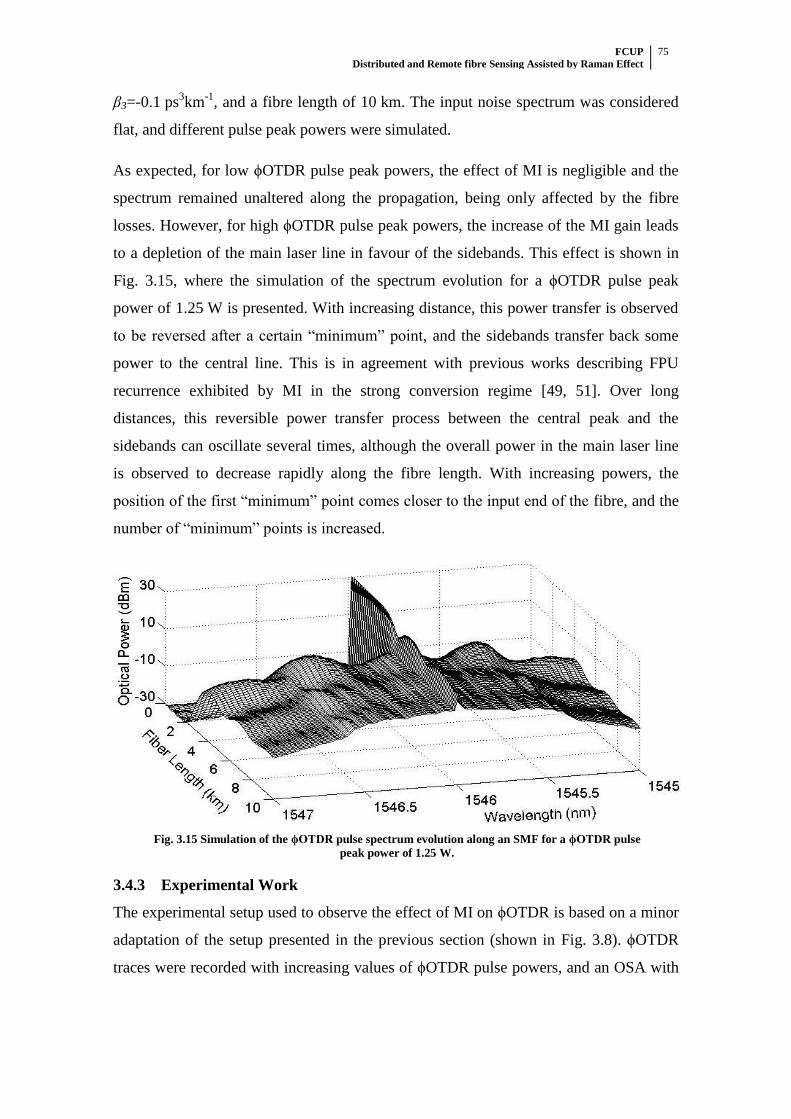
FCUP Distributed and Remote fibre Sensing Assisted by Raman Effect
75
β3=-0.1 ps3km
-1, and a fibre length of 10 km. The input noise spectrum was considered
flat, and different pulse peak powers were simulated.
As expected, for low ϕOTDR pulse peak powers, the effect of MI is negligible and the
spectrum remained unaltered along the propagation, being only affected by the fibre
losses. However, for high ϕOTDR pulse peak powers, the increase of the MI gain leads
to a depletion of the main laser line in favour of the sidebands. This effect is shown in
Fig. 3.15, where the simulation of the spectrum evolution for a ϕOTDR pulse peak
power of 1.25 W is presented. With increasing distance, this power transfer is observed
to be reversed after a certain “minimum” point, and the sidebands transfer back some
power to the central line. This is in agreement with previous works describing FPU
recurrence exhibited by MI in the strong conversion regime [49, 51]. Over long
distances, this reversible power transfer process between the central peak and the
sidebands can oscillate several times, although the overall power in the main laser line
is observed to decrease rapidly along the fibre length. With increasing powers, the
position of the first “minimum” point comes closer to the input end of the fibre, and the
number of “minimum” points is increased.
Fig. 3.15 Simulation of the ϕOTDR pulse spectrum evolution along an SMF for a ϕOTDR pulse
peak power of 1.25 W.
3.4.3 Experimental Work
The experimental setup used to observe the effect of MI on ϕOTDR is based on a minor
adaptation of the setup presented in the previous section (shown in Fig. 3.8). ϕOTDR
traces were recorded with increasing values of ϕOTDR pulse powers, and an OSA with
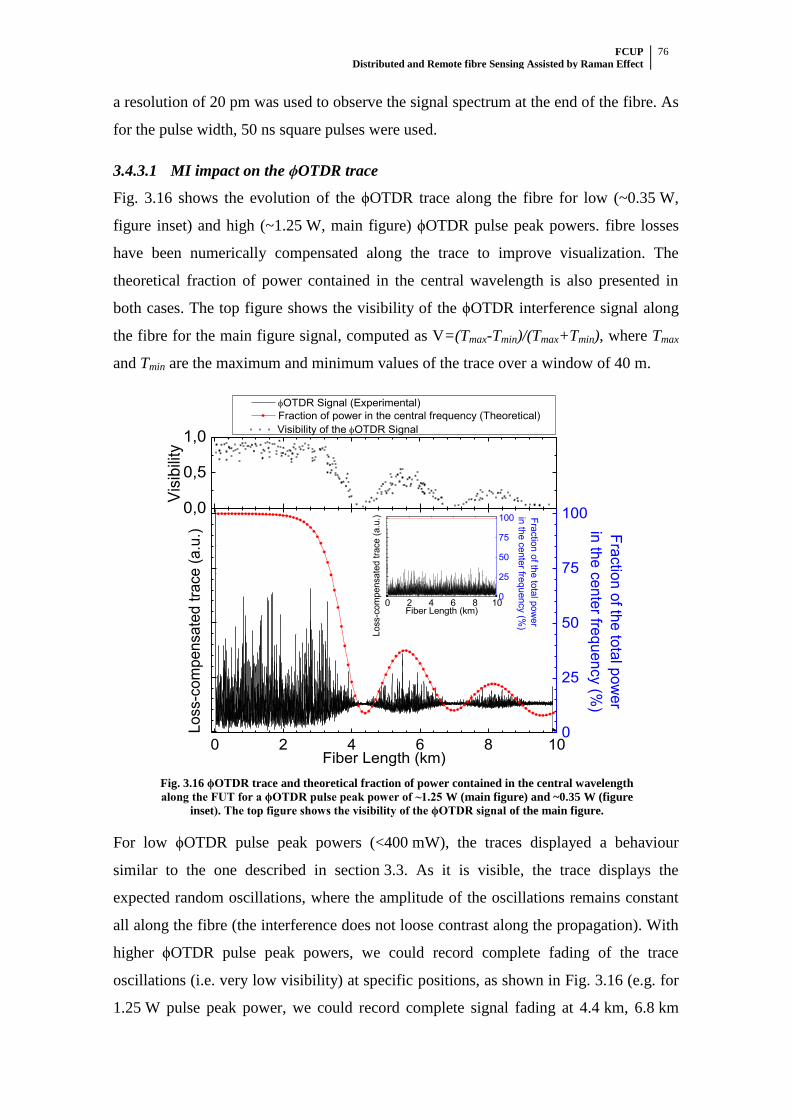
FCUP Distributed and Remote fibre Sensing Assisted by Raman Effect
76
a resolution of 20 pm was used to observe the signal spectrum at the end of the fibre. As
for the pulse width, 50 ns square pulses were used.
3.4.3.1 MI impact on the ϕOTDR trace
Fig. 3.16 shows the evolution of the ϕOTDR trace along the fibre for low (~0.35 W,
figure inset) and high (~1.25 W, main figure) ϕOTDR pulse peak powers. fibre losses
have been numerically compensated along the trace to improve visualization. The
theoretical fraction of power contained in the central wavelength is also presented in
both cases. The top figure shows the visibility of the ϕOTDR interference signal along
the fibre for the main figure signal, computed as V=(Tmax-Tmin)/(Tmax+Tmin), where Tmax
and Tmin are the maximum and minimum values of the trace over a window of 40 m.
0,0
0,5
1,0
0 2 4 6 8 10
0 2 4 6 8 10
Fiber Length (km)
0
25
50
75
100
Loss-c
om
pensate
d tra
ce (
a.u
.)
OTDR Signal (Experimental)
Fraction of power in the central frequency (Theoretical)
Fiber Length (km)
Lo
ss-c
om
pe
nsa
ted
tra
ce
(a
.u.)
0
25
50
75
100Fra
ctio
n o
f the to
tal p
ow
er
in th
e c
ente
r frequency (%
)
Fra
ctio
n o
f the
tota
l po
we
r
in th
e c
en
ter fre
qu
en
cy (%
)
Visibility of the OTDR Signal
Vis
ibili
ty
Fig. 3.16 ϕOTDR trace and theoretical fraction of power contained in the central wavelength
along the FUT for a ϕOTDR pulse peak power of ~1.25 W (main figure) and ~0.35 W (figure
inset). The top figure shows the visibility of the ϕOTDR signal of the main figure.
For low ϕOTDR pulse peak powers (<400 mW), the traces displayed a behaviour
similar to the one described in section 3.3. As it is visible, the trace displays the
expected random oscillations, where the amplitude of the oscillations remains constant
all along the fibre (the interference does not loose contrast along the propagation). With
higher ϕOTDR pulse peak powers, we could record complete fading of the trace
oscillations (i.e. very low visibility) at specific positions, as shown in Fig. 3.16 (e.g. for
1.25 W pulse peak power, we could record complete signal fading at 4.4 km, 6.8 km
FCUP Distributed and Remote fibre Sensing Assisted by Raman Effect
77
and 9.5 km). Since the sensitivity of the ϕOTDR depends on the visibility of the
interferences, we can conclude that at these positions we would have almost no
vibration sensitivity. It is also noticeable that the overall sensitivity would also be
decreasing rapidly, thus severely reducing the performance of the sensor.
These results can be interpreted as follows: for low powers (<400 mW), the effect of MI
is negligible and the coherence of the pulse (and therefore the visibility of the
interference) remains high along the fibre. For higher powers, however, the appearance
of spectrally broadband sidebands due to MI greatly decreases the coherence of the
ϕOTDR pulse (and therefore the visibility of the interference) and the contrast of the
oscillations will diminish. When the power transfer is reversed and the sidebands
transfer back some power to the central line, the coherence of the pulse is again
increased and the ϕOTDR trace recovers the contrast in the recorded interferences. FPU
recurrence will therefore lead to an oscillatory behaviour of the visibility of the
interferences measured along the fibre.
In this case, the experimental results obtained show an excellent agreement with the
theoretical model presented in section 3.4.2. To provide an easier comparison, we plot
in Fig. 3.16 the fraction of power contained in the centre wavelength of the simulation
as a function of the fibre length (using the same input ϕOTDR pulse power conditions
as those recorded for Fig. 3.16). As it is visible, the positions where the contrast of the
trace is higher correspond to positions where the theoretical model predicts a high
fraction of power in the central wavelength. On the contrary, the positions where the
ϕOTDR trace provides the smallest contrast correspond to positions where the power in
the central peak is minimal. It is worth remarking that, at the fading points, the peak
power in the central line estimated from simulation reached 10 % of the spectral
power, while the measured visibility at these positions was 3-5 %. We believe that this
discrepancy may be caused by a non-ideal visibility of the experimental input ϕOTDR
pulses and also by a non-flat distribution of the input noise. We have verified by
simulation that introducing a higher input noise close to the central peak leads to a
deeper depletion of the central line.
3.4.3.2 Pulse spectra at the fibre end (in transmission)
Further insight into this explanation can be obtained by looking at the transmission
output pulse spectra. Fig. 3.17 shows a plot of the optical power in the peak frequency
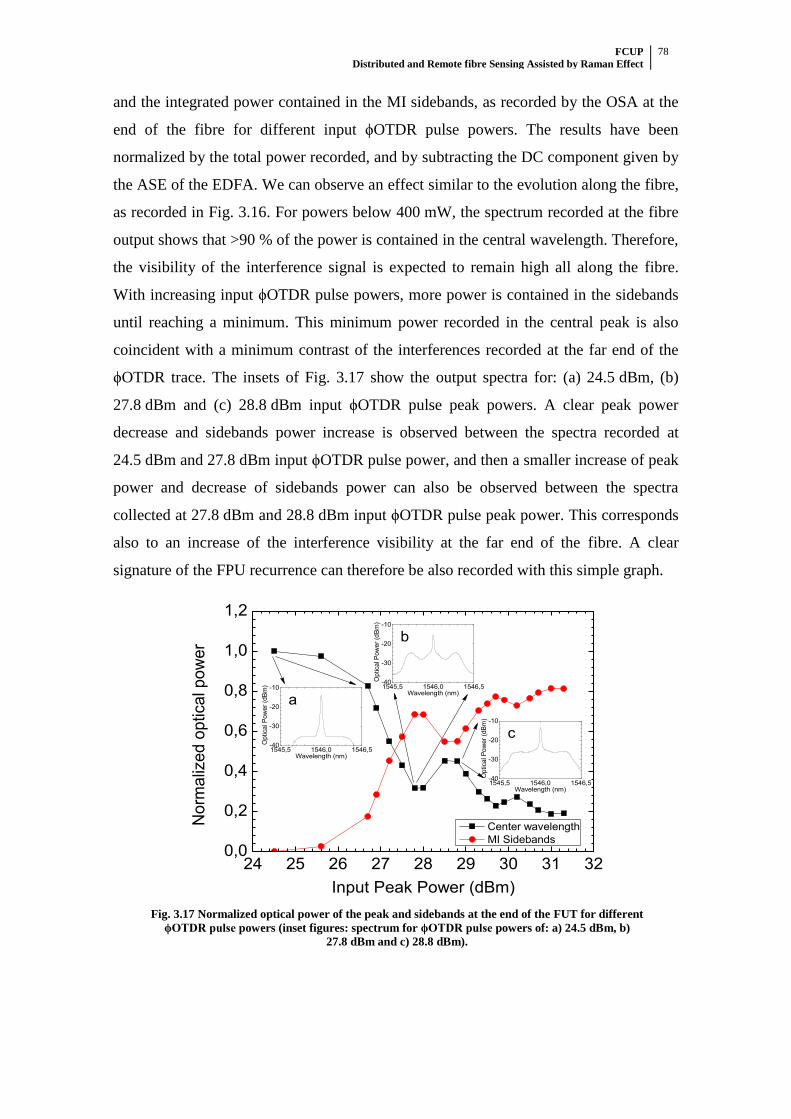
FCUP Distributed and Remote fibre Sensing Assisted by Raman Effect
78
and the integrated power contained in the MI sidebands, as recorded by the OSA at the
end of the fibre for different input ϕOTDR pulse powers. The results have been
normalized by the total power recorded, and by subtracting the DC component given by
the ASE of the EDFA. We can observe an effect similar to the evolution along the fibre,
as recorded in Fig. 3.16. For powers below 400 mW, the spectrum recorded at the fibre
output shows that >90 % of the power is contained in the central wavelength. Therefore,
the visibility of the interference signal is expected to remain high all along the fibre.
With increasing input ϕOTDR pulse powers, more power is contained in the sidebands
until reaching a minimum. This minimum power recorded in the central peak is also
coincident with a minimum contrast of the interferences recorded at the far end of the
ϕOTDR trace. The insets of Fig. 3.17 show the output spectra for: (a) 24.5 dBm, (b)
27.8 dBm and (c) 28.8 dBm input ϕOTDR pulse peak powers. A clear peak power
decrease and sidebands power increase is observed between the spectra recorded at
24.5 dBm and 27.8 dBm input ϕOTDR pulse power, and then a smaller increase of peak
power and decrease of sidebands power can also be observed between the spectra
collected at 27.8 dBm and 28.8 dBm input ϕOTDR pulse peak power. This corresponds
also to an increase of the interference visibility at the far end of the fibre. A clear
signature of the FPU recurrence can therefore be also recorded with this simple graph.
24 25 26 27 28 29 30 31 320,0
0,2
0,4
0,6
0,8
1,0
1,2
1545,5 1546,0 1546,5-40
-30
-20
-10
Optical P
ow
er
(dB
m)
Wavelength (nm)
a1545,5 1546,0 1546,5-40
-30
-20
-10
b
Optical P
ow
er
(dB
m)
Wavelength (nm)
1545,5 1546,0 1546,5-40
-30
-20
-10
c
Optical P
ow
er
(dB
m)
Wavelength (nm)
Norm
aliz
ed o
ptical pow
er
Input Peak Power (dBm)
Center wavelength
MI Sidebands
Fig. 3.17 Normalized optical power of the peak and sidebands at the end of the FUT for different
ϕOTDR pulse powers (inset figures: spectrum for ϕOTDR pulse powers of: a) 24.5 dBm, b)
27.8 dBm and c) 28.8 dBm).
FCUP Distributed and Remote fibre Sensing Assisted by Raman Effect
79
3.4.4 Conclusions
In this section, we have provided an in-depth explanation of the effects of MI on
ϕOTDR traces. We have shown that MI leads to fading (and therefore to loss of
sensitivity) in the ϕOTDR trace, associated with loss of power at the narrow laser
wavelength in favor of the MI sidebands. The process is position-dependent due to the
reversibility of the power transfer between the main ϕOTDR pulse laser line and the MI
sidebands (FPU recurrence). The evolution of the interference signal recorded is in
agreement with the spectral measurements obtained at the fibre end, the theoretical
model and our own qualitative explanation of the obtained results. The presented
description of the limitations imposed by MI in ϕOTDR operation provides an
important basis to the optimization of schemes using ϕOTDR for both dynamic and
static measurements.
While this effect is detrimental in the context of distributed vibration analysis using
ϕOTDR, it can also be a convenient and highly visual way of evidencing the FPU
recurrence associated with the MI process in optical fibres.
FCUP Distributed and Remote fibre Sensing Assisted by Raman Effect
80
3.5 Extending the sensing range: ϕOTDR assisted by first-order
Raman
3.5.1 Introduction
Having achieved frequency measurements in the limits set by the time of flight of light
in section 3.3, in this section we focus on extending the sensing range of ϕOTDR
operation by using first-order Raman gain to assist it. The spectrum of the ϕOTDR
pulse was observed at different points, thus clearly depicting its evolution along the
setup and evidencing the impact of the different setup components. The quality of the
obtained ϕOTDR trace along the fibre is evaluated using different Raman pump powers,
and the results are compared with the theoretical predictions. The noise is characterized
both optically and electrically, with special emphasis being given to RIN transfer from
the Raman pumps. Special care was also taken to ensure high ER ϕOTDR pulses. Then,
distributed vibration measurements were performed over 110 km and 125 km of fibre.
3.5.2 Theoretical Model: ϕOTDR pulse power evolution along the fibre
In this section, we provide a mathematical model for the evolution of the
Raman-assisted ϕOTDR trace along the distance. This model just reflects the “average”
behaviour of the trace evolution, and not the statistical fluctuations expectable in any
ϕOTDR. A detailed statistical analysis of these fluctuations has already been discussed
in section 3.3.
For the theoretical model, we assume that two similar continuous-wave (CW) Raman
pumps (at 1455 nm) are launched at both ends of the fibre, providing Raman gain (gR) at
the wavelength of the ϕOTDR pulse (1550 nm). The ϕOTDR pulse is shaped from
highly coherent light and its wavelength is located near the peak Raman gain of the
fibre. In our analysis, the pulse is delivered at z=0 into the fibre and propagates in the
forward direction (towards increasing values of z). As it travels along the fibre, the
Rayleigh backscattered light from the ϕOTDR pulse will create a ϕOTDR signal (at the
same wavelength), which propagates backwards until the input end of the fibre, where it
is detected. The fibre is supposed to present constant loss at the wavelength of the
Raman pump (αR) and also at the ϕOTDR pulse wavelength (αP).
In normal operation of a Raman-assisted ϕOTDR, the pulse peak power is about two
orders of magnitude below the power of the Raman pumps. Therefore, pump depletion
FCUP Distributed and Remote fibre Sensing Assisted by Raman Effect
81
effects are neglected [23]. For the purpose of knowing the signal evolution along the
fibre, our model also neglects ASE created by the Raman pumps and double Rayleigh
backscatter. With the above assumptions, the evolution of the forward (+) and backward
(-) propagating Raman pump powers along the optical fibre can be obtained by solving
the following equations [23]:
( )( )R
R R
dP zP z
dz
. (3.12)
As for the evolution of the ϕOTDR pulse power, it can be obtained solving the equation:
( )( ) ( )[ ( ) ( )]P
P P R P R R
dP zP z g P z P z P z
dz . (3.13)
Considering the boundary conditions given by the optical powers launched into the fibre
( (0)RP and ( )RP L are the forward (+) and backward (-) input Raman pump powers, and
(0)PP is the ϕOTDR pulse peak power), the evolution of the Raman pump powers and
the ϕOTDR pulse peak power along the optical fibre will be given by [23]:
( ) (0) R z
R RP z P e (3.14)
( )( ) ( ) R z L
R RP z P L e (3.15)
( )( ) (0) exp ( ) (0) 1{ }P R R Rz z L L zR R
P P R R
R R
g gP z P e P L e e P e
. (3.16)
When the ϕOTDR pulse goes through a given point z0, the power of the ϕOTDR signal
reflected at that point ( 0
0( )z
SP z ) will be given by
0
0 0( ) ( )z
S RayleighBackscatter PP z P z , (3.17)
where αRayleighBackscatter is the Rayleigh backscatter coefficient. Please note that in this
case a fully incoherent treatment is given to the scattered power PS. This considerably
simplifies the treatment of the equations and does not harm the main objective of our
analysis, which is to determine the overall evolution of the back-scattered signal.
From that point (z0), the backscattered signal has to travel back to the detector, and
therefore should also experience fibre losses and Raman gain. The evolution of the

FCUP Distributed and Remote fibre Sensing Assisted by Raman Effect
82
power of the ϕOTDR signal corresponding to z0 along the fibre can be obtained by
solving the equation
0
0 0( )
( ) ( ) [ ( ) ( )]z
z zSP S R S R R
dP zP z g P z P z P z
dz . (3.18)
Considering the previous equations, we can now establish the evolution of the
backscattered ϕOTDR signal corresponding to z0 for any position z<z0. The evolution of
the backscattered power will be given by
0 0 0 0 0( ) ( )( )
0 0( ) ( ) exp ( ) (0){ }P R RR R
z z z z z L zz L zR R
S S R R
R R
g gP z z P z e P L e e P e e
. (3.19)
At the detection point (input of the fibre), the ϕOTDR signal corresponding to z0 (0 (0)
z
SP )
will be:
0 0
2
0 00
( ) ( )(0) ( )
(0) (0)
z zP PS S RayleighBackscatter
P P
P z P zP P z
P P . (3.20)
The values of the parameters used in the theoretical modelling are presented in Table
3.2.
Table 3.2: Values of the parameters used in the theoretical modelling
Symbol Parameter Value Units
P+
R(0) ,
P-R(L)
Forward (+) and backward (-) input Raman pump power 600 mW
αR Fibre loss at the wavelength of the Raman pump (1455 nm) 0.0553 km-1
gR Raman gain at the wavelength of the ϕOTDR pump 0.3 W-1
km-1
PP OTDR pulse peak power 10 mW
αP Fibre loss at the wavelength of the ϕOTDR pulse (1550 nm) 0.047 km-1
αRayleigh
Backscatter Rayleigh Backscatter coefficient -72 dB/m
3.5.3 Experimental Work
3.5.3.1 Setup
The experimental setup used to characterize ϕOTDR assisted by first-order Raman
amplification is shown in Fig. 3.18, consisting of an improvement of the setup reported
in sections 3.3 and 3.4 (described in detail after Fig. 3.8), to which a first-order Raman
amplification scheme and balanced detection were added.
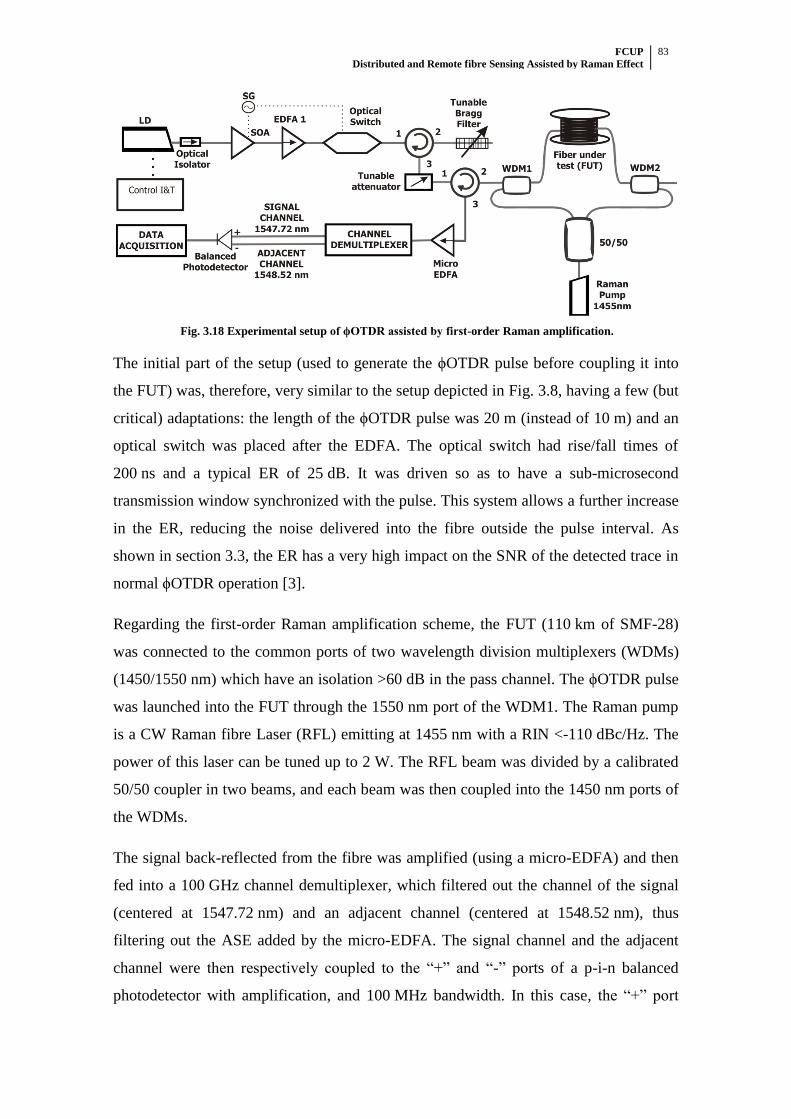
FCUP Distributed and Remote fibre Sensing Assisted by Raman Effect
83
Fig. 3.18 Experimental setup of ϕOTDR assisted by first-order Raman amplification.
The initial part of the setup (used to generate the ϕOTDR pulse before coupling it into
the FUT) was, therefore, very similar to the setup depicted in Fig. 3.8, having a few (but
critical) adaptations: the length of the ϕOTDR pulse was 20 m (instead of 10 m) and an
optical switch was placed after the EDFA. The optical switch had rise/fall times of
200 ns and a typical ER of 25 dB. It was driven so as to have a sub-microsecond
transmission window synchronized with the pulse. This system allows a further increase
in the ER, reducing the noise delivered into the fibre outside the pulse interval. As
shown in section 3.3, the ER has a very high impact on the SNR of the detected trace in
normal ϕOTDR operation [3].
Regarding the first-order Raman amplification scheme, the FUT (110 km of SMF-28)
was connected to the common ports of two wavelength division multiplexers (WDMs)
(1450/1550 nm) which have an isolation >60 dB in the pass channel. The ϕOTDR pulse
was launched into the FUT through the 1550 nm port of the WDM1. The Raman pump
is a CW Raman fibre Laser (RFL) emitting at 1455 nm with a RIN <-110 dBc/Hz. The
power of this laser can be tuned up to 2 W. The RFL beam was divided by a calibrated
50/50 coupler in two beams, and each beam was then coupled into the 1450 nm ports of
the WDMs.
The signal back-reflected from the fibre was amplified (using a micro-EDFA) and then
fed into a 100 GHz channel demultiplexer, which filtered out the channel of the signal
(centered at 1547.72 nm) and an adjacent channel (centered at 1548.52 nm), thus
filtering out the ASE added by the micro-EDFA. The signal channel and the adjacent
channel were then respectively coupled to the “+” and “-” ports of a p-i-n balanced
photodetector with amplification, and 100 MHz bandwidth. In this case, the “+” port
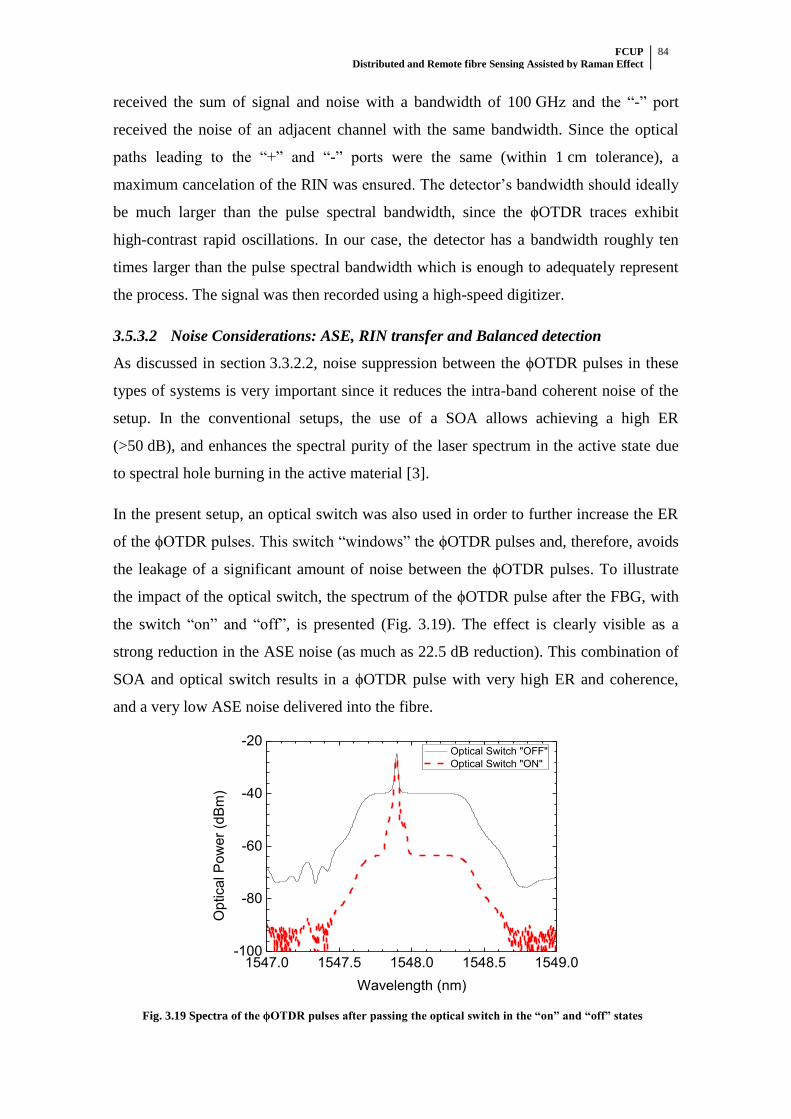
FCUP Distributed and Remote fibre Sensing Assisted by Raman Effect
84
received the sum of signal and noise with a bandwidth of 100 GHz and the “-” port
received the noise of an adjacent channel with the same bandwidth. Since the optical
paths leading to the “+” and “-” ports were the same (within 1 cm tolerance), a
maximum cancelation of the RIN was ensured. The detector’s bandwidth should ideally
be much larger than the pulse spectral bandwidth, since the ϕOTDR traces exhibit
high-contrast rapid oscillations. In our case, the detector has a bandwidth roughly ten
times larger than the pulse spectral bandwidth which is enough to adequately represent
the process. The signal was then recorded using a high-speed digitizer.
3.5.3.2 Noise Considerations: ASE, RIN transfer and Balanced detection
As discussed in section 3.3.2.2, noise suppression between the ϕOTDR pulses in these
types of systems is very important since it reduces the intra-band coherent noise of the
setup. In the conventional setups, the use of a SOA allows achieving a high ER
(>50 dB), and enhances the spectral purity of the laser spectrum in the active state due
to spectral hole burning in the active material [3].
In the present setup, an optical switch was also used in order to further increase the ER
of the ϕOTDR pulses. This switch “windows” the ϕOTDR pulses and, therefore, avoids
the leakage of a significant amount of noise between the ϕOTDR pulses. To illustrate
the impact of the optical switch, the spectrum of the ϕOTDR pulse after the FBG, with
the switch “on” and “off”, is presented (Fig. 3.19). The effect is clearly visible as a
strong reduction in the ASE noise (as much as 22.5 dB reduction). This combination of
SOA and optical switch results in a ϕOTDR pulse with very high ER and coherence,
and a very low ASE noise delivered into the fibre.
1547.0 1547.5 1548.0 1548.5 1549.0-100
-80
-60
-40
-20
Op
tica
l P
ow
er
(dB
m)
Wavelength (nm)
Optical Switch "OFF"
Optical Switch "ON"
Fig. 3.19 Spectra of the ϕOTDR pulses after passing the optical switch in the “on” and “off” states

FCUP Distributed and Remote fibre Sensing Assisted by Raman Effect
85
Fig. 3.20a shows the spectrum reflected from the FUT (i.e., the ϕOTDR signal) before
the micro-EDFA. As expected, a background noise (with the spectral power distribution
similar to the Raman gain curve) is observed due to the ASE introduced by the Raman
amplification in the FUT. Further amplification in the micro-EDFA introduces more
ASE noise. Even after spectral filtering, this ASE noise is comparable to the signal
level, and therefore requires some kind of elimination strategy. Moreover, the effect of
RIN is strongly manifested in this ASE noise.
1530 1540 1550 1560 1570
-54
-52
-50
-48
-46
-44
Optical P
ow
er
(dB
m)
Wavelength (nm)
Spectrum Returned from FUT (before micro-EDFA)
a)
1547.0 1547.5 1548.0 1548.5 1549.0 1549.5-50
-40
-30
-20
-10
b)
Op
tica
l P
ow
er
(dB
m)
Wavelength (nm)
Spectrum Returned from FUT (after micro-EDFA)
Signal channel (1547.72 nm)
Adjacent channel (1548.52 nm)
Fig. 3.20 Optical spectrum returning from the FUT: a) before the micro-EDFA and b) after the
micro-EDFA (including signals received in the “+” and “-” ports of the balanced detector (signal
channel and adjacent channel)).
The use of balanced detection between two adjacent channels (one with signal+ ASE
noise and the other with ASE noise only) allows suppressing the strong and very noisy
DC component given by Raman ASE noise. The optical spectra of the signal channel
(1547.72 nm) and the adjacent channel (1548.52 nm) received in the balanced detector
are shown in Fig. 3.20b. As we see, the amount of ASE noise subtracted is roughly
equal in both channels. Furthermore, a power fluctuation in the Raman pump laser at a
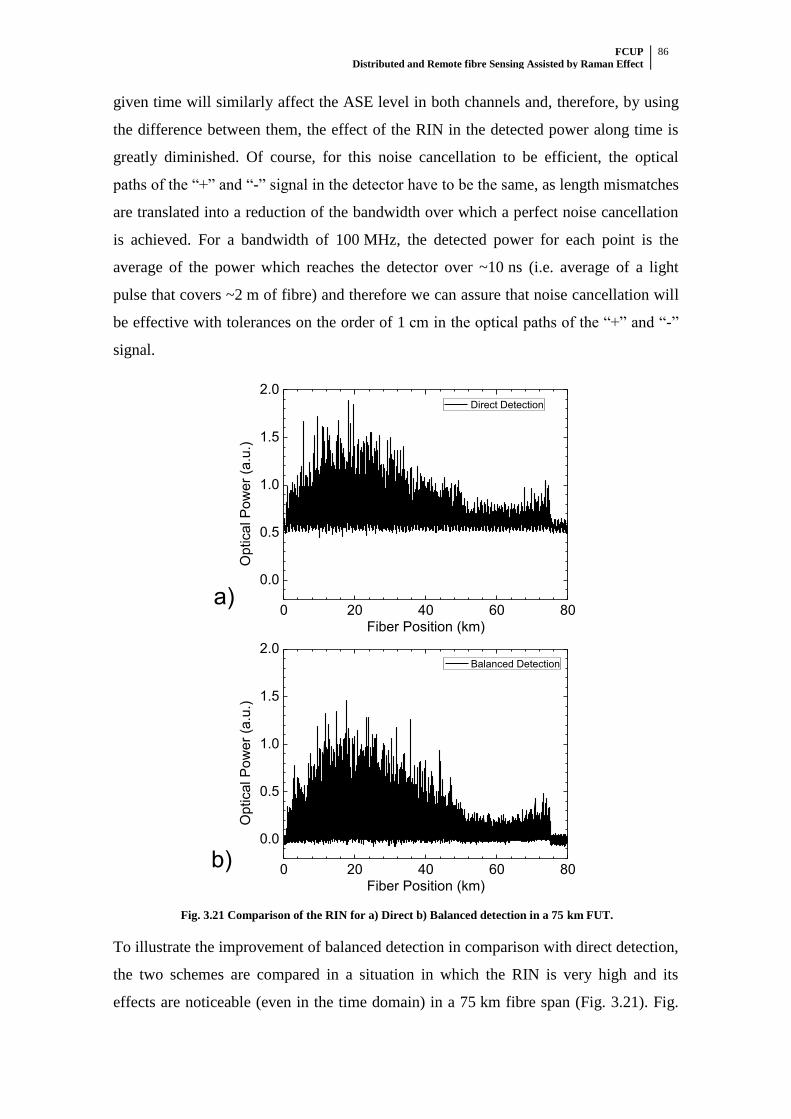
FCUP Distributed and Remote fibre Sensing Assisted by Raman Effect
86
given time will similarly affect the ASE level in both channels and, therefore, by using
the difference between them, the effect of the RIN in the detected power along time is
greatly diminished. Of course, for this noise cancellation to be efficient, the optical
paths of the “+” and “-” signal in the detector have to be the same, as length mismatches
are translated into a reduction of the bandwidth over which a perfect noise cancellation
is achieved. For a bandwidth of 100 MHz, the detected power for each point is the
average of the power which reaches the detector over ~10 ns (i.e. average of a light
pulse that covers ~2 m of fibre) and therefore we can assure that noise cancellation will
be effective with tolerances on the order of 1 cm in the optical paths of the “+” and “-”
signal.
0 20 40 60 80
0.0
0.5
1.0
1.5
2.0
a)
Optical P
ow
er
(a.u
.)
Fiber Position (km)
Direct Detection
0 20 40 60 80
0.0
0.5
1.0
1.5
2.0
b)
Op
tica
l P
ow
er
(a.u
.)
Fiber Position (km)
Balanced Detection
Fig. 3.21 Comparison of the RIN for a) Direct b) Balanced detection in a 75 km FUT.
To illustrate the improvement of balanced detection in comparison with direct detection,
the two schemes are compared in a situation in which the RIN is very high and its
effects are noticeable (even in the time domain) in a 75 km fibre span (Fig. 3.21). Fig.
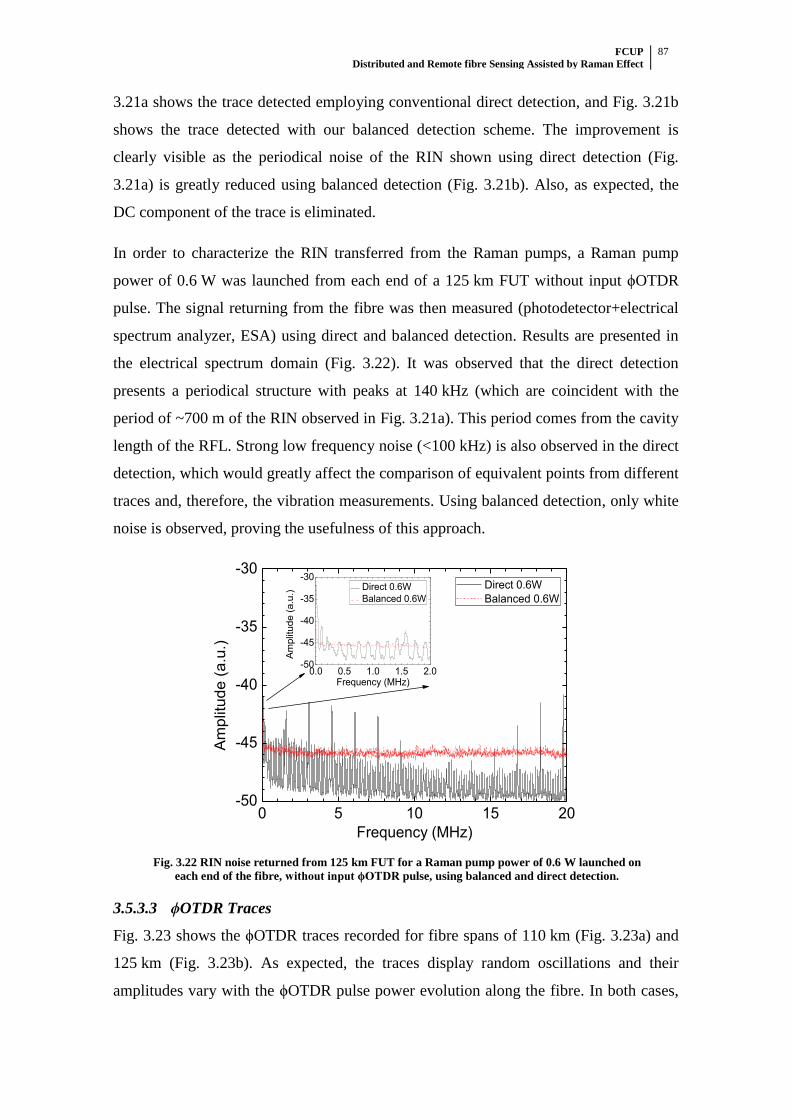
FCUP Distributed and Remote fibre Sensing Assisted by Raman Effect
87
3.21a shows the trace detected employing conventional direct detection, and Fig. 3.21b
shows the trace detected with our balanced detection scheme. The improvement is
clearly visible as the periodical noise of the RIN shown using direct detection (Fig.
3.21a) is greatly reduced using balanced detection (Fig. 3.21b). Also, as expected, the
DC component of the trace is eliminated.
In order to characterize the RIN transferred from the Raman pumps, a Raman pump
power of 0.6 W was launched from each end of a 125 km FUT without input ϕOTDR
pulse. The signal returning from the fibre was then measured (photodetector+electrical
spectrum analyzer, ESA) using direct and balanced detection. Results are presented in
the electrical spectrum domain (Fig. 3.22). It was observed that the direct detection
presents a periodical structure with peaks at 140 kHz (which are coincident with the
period of ~700 m of the RIN observed in Fig. 3.21a). This period comes from the cavity
length of the RFL. Strong low frequency noise (<100 kHz) is also observed in the direct
detection, which would greatly affect the comparison of equivalent points from different
traces and, therefore, the vibration measurements. Using balanced detection, only white
noise is observed, proving the usefulness of this approach.
0 5 10 15 20-50
-45
-40
-35
-30
0.0 0.5 1.0 1.5 2.0-50
-45
-40
-35
-30
Am
plit
ude (
a.u
.)
Frequency (MHz)
Direct 0.6W
Balanced 0.6W
Am
plit
ude (
a.u
.)
Frequency (MHz)
Direct 0.6W
Balanced 0.6W
Fig. 3.22 RIN noise returned from 125 km FUT for a Raman pump power of 0.6 W launched on
each end of the fibre, without input ϕOTDR pulse, using balanced and direct detection.
3.5.3.3 ϕOTDR Traces
Fig. 3.23 shows the ϕOTDR traces recorded for fibre spans of 110 km (Fig. 3.23a) and
125 km (Fig. 3.23b). As expected, the traces display random oscillations and their
amplitudes vary with the ϕOTDR pulse power evolution along the fibre. In both cases,
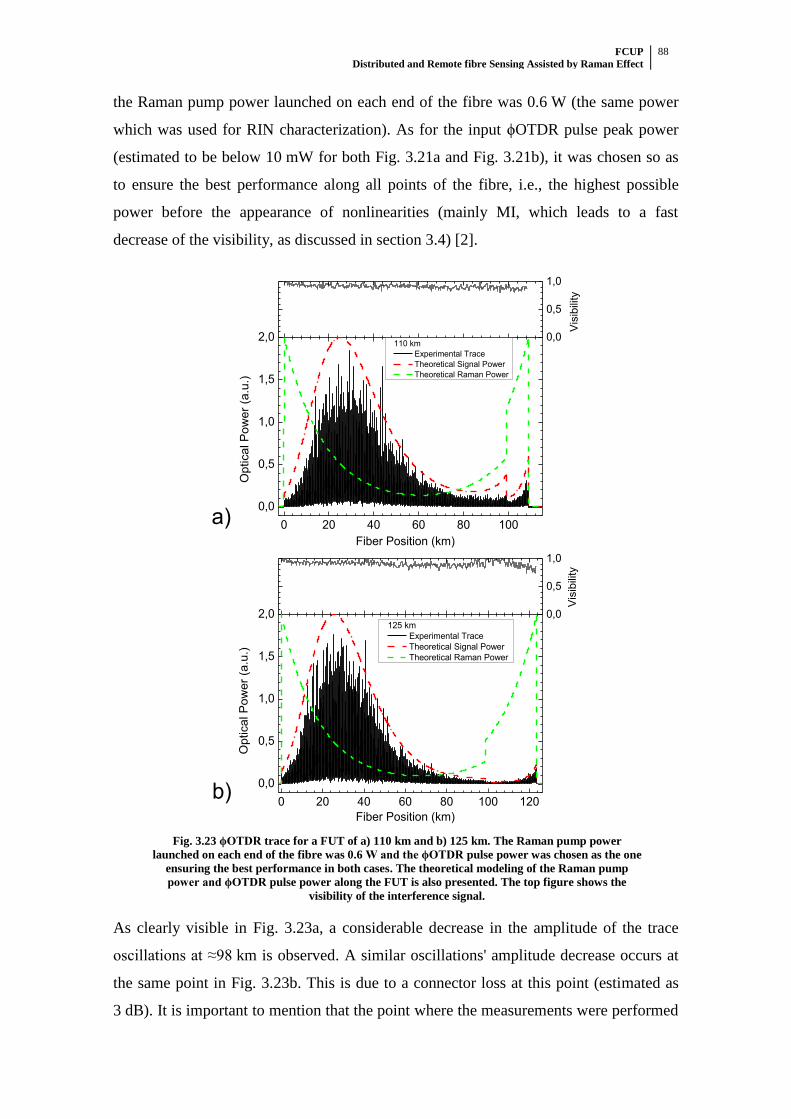
FCUP Distributed and Remote fibre Sensing Assisted by Raman Effect
88
the Raman pump power launched on each end of the fibre was 0.6 W (the same power
which was used for RIN characterization). As for the input ϕOTDR pulse peak power
(estimated to be below 10 mW for both Fig. 3.21a and Fig. 3.21b), it was chosen so as
to ensure the best performance along all points of the fibre, i.e., the highest possible
power before the appearance of nonlinearities (mainly MI, which leads to a fast
decrease of the visibility, as discussed in section 3.4) [2].
0 20 40 60 80 100
0,0
0,5
1,0
1,5
2,0 0,0
0,5
1,0
a)
Op
tica
l P
ow
er
(a.u
.)
Fiber Position (km)
110 km
Experimental Trace
Theoretical Signal Power
Theoretical Raman Power
Vis
ibili
ty
0 20 40 60 80 100 120
0,0
0,5
1,0
1,5
2,0 0,0
0,5
1,0
b)
Optical P
ow
er
(a.u
.)
Fiber Position (km)
125 km
Experimental Trace
Theoretical Signal Power
Theoretical Raman Power
Vis
ibili
ty
Fig. 3.23 ϕOTDR trace for a FUT of a) 110 km and b) 125 km. The Raman pump power
launched on each end of the fibre was 0.6 W and the ϕOTDR pulse power was chosen as the one
ensuring the best performance in both cases. The theoretical modeling of the Raman pump
power and ϕOTDR pulse power along the FUT is also presented. The top figure shows the
visibility of the interference signal.
As clearly visible in Fig. 3.23a, a considerable decrease in the amplitude of the trace
oscillations at ≈98 km is observed. A similar oscillations' amplitude decrease occurs at
the same point in Fig. 3.23b. This is due to a connector loss at this point (estimated as
3 dB). It is important to mention that the point where the measurements were performed
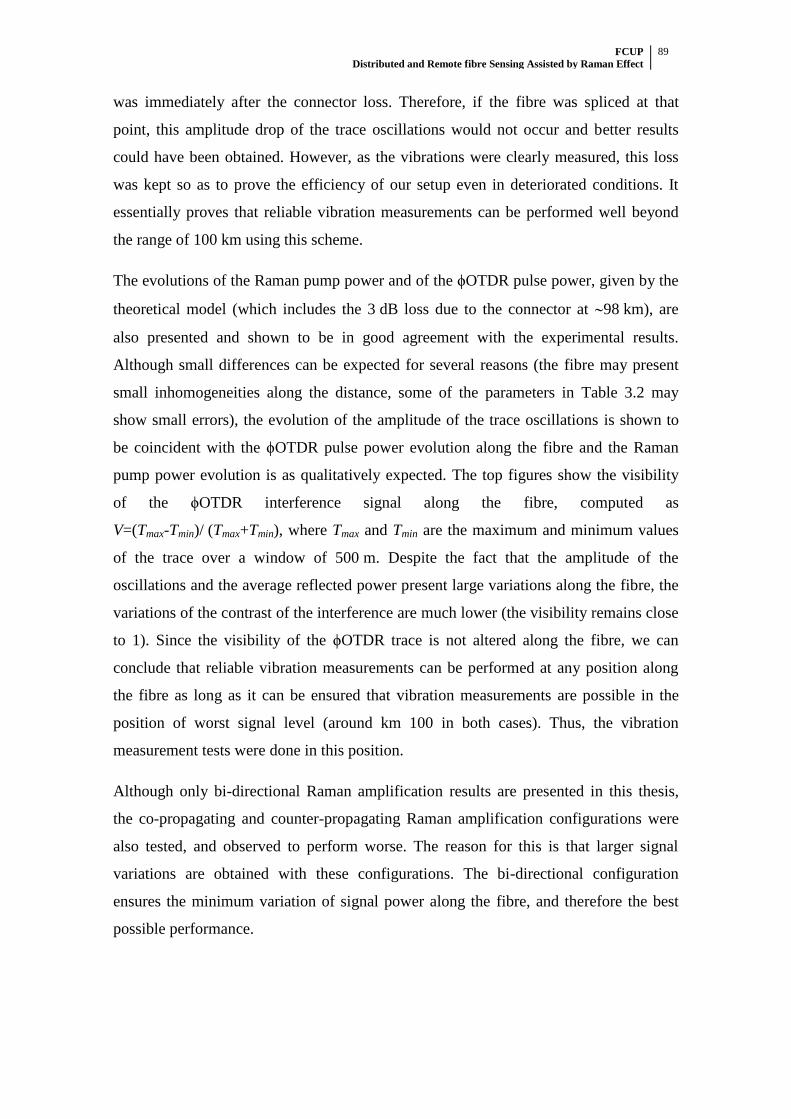
FCUP Distributed and Remote fibre Sensing Assisted by Raman Effect
89
was immediately after the connector loss. Therefore, if the fibre was spliced at that
point, this amplitude drop of the trace oscillations would not occur and better results
could have been obtained. However, as the vibrations were clearly measured, this loss
was kept so as to prove the efficiency of our setup even in deteriorated conditions. It
essentially proves that reliable vibration measurements can be performed well beyond
the range of 100 km using this scheme.
The evolutions of the Raman pump power and of the ϕOTDR pulse power, given by the
theoretical model (which includes the 3 dB loss due to the connector at 98 km), are
also presented and shown to be in good agreement with the experimental results.
Although small differences can be expected for several reasons (the fibre may present
small inhomogeneities along the distance, some of the parameters in Table 3.2 may
show small errors), the evolution of the amplitude of the trace oscillations is shown to
be coincident with the ϕOTDR pulse power evolution along the fibre and the Raman
pump power evolution is as qualitatively expected. The top figures show the visibility
of the ϕOTDR interference signal along the fibre, computed as
V=(Tmax-Tmin)/ (Tmax+Tmin), where Tmax and Tmin are the maximum and minimum values
of the trace over a window of 500 m. Despite the fact that the amplitude of the
oscillations and the average reflected power present large variations along the fibre, the
variations of the contrast of the interference are much lower (the visibility remains close
to 1). Since the visibility of the ϕOTDR trace is not altered along the fibre, we can
conclude that reliable vibration measurements can be performed at any position along
the fibre as long as it can be ensured that vibration measurements are possible in the
position of worst signal level (around km 100 in both cases). Thus, the vibration
measurement tests were done in this position.
Although only bi-directional Raman amplification results are presented in this thesis,
the co-propagating and counter-propagating Raman amplification configurations were
also tested, and observed to perform worse. The reason for this is that larger signal
variations are obtained with these configurations. The bi-directional configuration
ensures the minimum variation of signal power along the fibre, and therefore the best
possible performance.
FCUP Distributed and Remote fibre Sensing Assisted by Raman Effect
90
3.5.3.4 Evolution of the ϕOTDR trace for different Raman Pump powers
The evolution of the trace profile for increasing Raman pump powers (0.6, 0.9, 1.2 and
1.5 W of total Raman input power, half inserted on each side) using a FUT of 110 km is
shown in Fig. 3.24. Again, the input ϕOTDR pulse power was adjusted for each Raman
pump power to achieve the best possible performance while avoiding nonlinearities.
Thus, for increasing Raman pump powers, the input ϕOTDR pulse power was
decreased. It was observed that for Raman pump powers higher than 1.2 W (0.6 W on
each side), the point with the lowest amplitude of trace oscillations was at the beginning
of the fibre. This high pumping level is, nevertheless, not used in practice, as the Raman
noise is too large for performing reliable vibration measurements.
Fig. 3.24 Experimental and theoretical evolution of the trace profile for different Raman pump
powers (total Raman input power), using a FUT of 110 km. The ϕOTDR pulse power chosen for
each Raman pump power was the one ensuring the best performance.
In agreement with eq. 3.16, it can be seen that, for increasing Raman pump powers, the
maximum of the input ϕOTDR pulse power (when the Raman gain equals the fibre
losses) occurs further into the fibre. This is the point at which Raman gain and linear
fibre loss are equal. This condition will occur always for a certain level of Raman pump
power, so for higher input Raman powers, this maximum comes obviously further
inside the fibre.
3.5.3.5 Vibration Measurements
Vibration measurements were carried out in a similar manner to the methodology
described in section 3.3. For each point along the fibre, the optical power evolution as a
function of time was obtained by measuring the equivalent point in consecutive traces
and plotting the signal levels recorded for that point against the time. The sampling
frequency at each position will, therefore, be the frequency at which the ϕOTDR pulses
FCUP Distributed and Remote fibre Sensing Assisted by Raman Effect
91
are launched into the fibre, which is limited by the fibre length to be monitored (see
eq. 3.2).
Two FUT lengths were tested: 110 km and 125 km. These consisted of two fibre spools
of 50 km and one fibre spool of 10/25 km of SMF-28, all linked by optical connectors.
The ϕOTDR pulse repetition rate was 781/625 Hz, which limits the maximum
detectable frequency to 390.5/312.5 Hz (Nyquist-Shannon theorem) and the theoretical
maximum fibre span to be monitored to 131/163 km.
The Raman pump power and the input ϕOTDR pulse power were the same as the ones
used in the traces of Fig. 3.23a and Fig. 3.23b. The point with the lowest amplitude of
the trace oscillations, which in both cases was observed to be after the connector at
≈98 km, was placed inside a 2 m long PVC tube with 0.08 m of diameter, to which
mechanical vibrations of controllable frequency were applied using a small vibration
exciter with a maximum bare table acceleration of 736 ms-2
(with a 75 g mass attached).
The fibre was clamped outside the PVC tube in order to avoid the propagation of
vibrations outside it.
Fig. 3.25a shows the optical power variation of the ϕOTDR signal at the point inside the
PVC tube, when a 40 Hz vibration was applied to the tube. The trace was recorded
using the same conditions of Fig. 3.23a (FUT=110 km) with no post-processing. A clear
pattern, with peaks synchronized with the applied frequency, is observed. The FFT of
the optical power variation is presented in Fig. 3.25b. The ϕOTDR signal is observed to
present a nonlinear response, as a clear peak appears at 40 Hz followed by a smaller
peak in the second harmonic (80 Hz). The optical power variations of the ϕOTDR signal
and respective FFTs of fibre points, which were more than 10 m away from the PVC
tube, did not show sensitivity to the applied vibrations. This is in agreement with the
expected resolution of 10 m (corresponding to a 100 ns pulse).
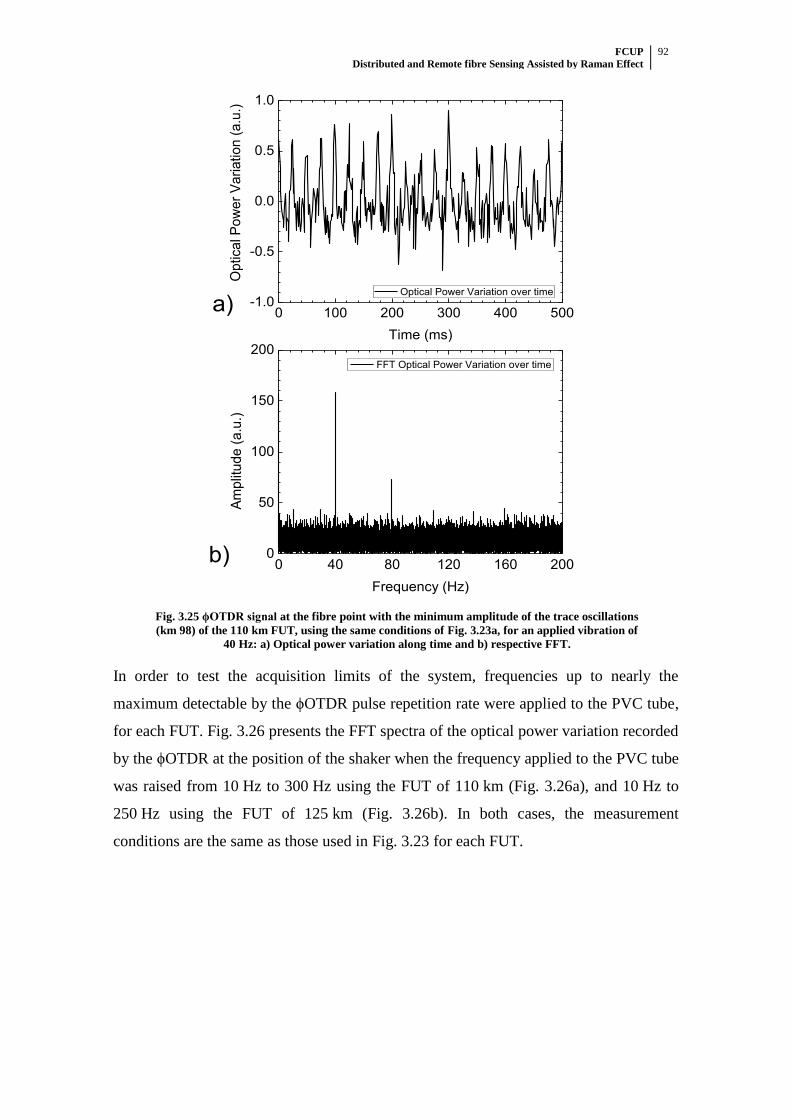
FCUP Distributed and Remote fibre Sensing Assisted by Raman Effect
92
0 100 200 300 400 500-1.0
-0.5
0.0
0.5
1.0
a)
Optical P
ow
er
Variation (
a.u
.)
Time (ms)
Optical Power Variation over time
0 40 80 120 160 2000
50
100
150
200
b)
Am
plit
ud
e (
a.u
.)
Frequency (Hz)
FFT Optical Power Variation over time
Fig. 3.25 ϕOTDR signal at the fibre point with the minimum amplitude of the trace oscillations
(km 98) of the 110 km FUT, using the same conditions of Fig. 3.23a, for an applied vibration of
40 Hz: a) Optical power variation along time and b) respective FFT.
In order to test the acquisition limits of the system, frequencies up to nearly the
maximum detectable by the ϕOTDR pulse repetition rate were applied to the PVC tube,
for each FUT. Fig. 3.26 presents the FFT spectra of the optical power variation recorded
by the ϕOTDR at the position of the shaker when the frequency applied to the PVC tube
was raised from 10 Hz to 300 Hz using the FUT of 110 km (Fig. 3.26a), and 10 Hz to
250 Hz using the FUT of 125 km (Fig. 3.26b). In both cases, the measurement
conditions are the same as those used in Fig. 3.23 for each FUT.
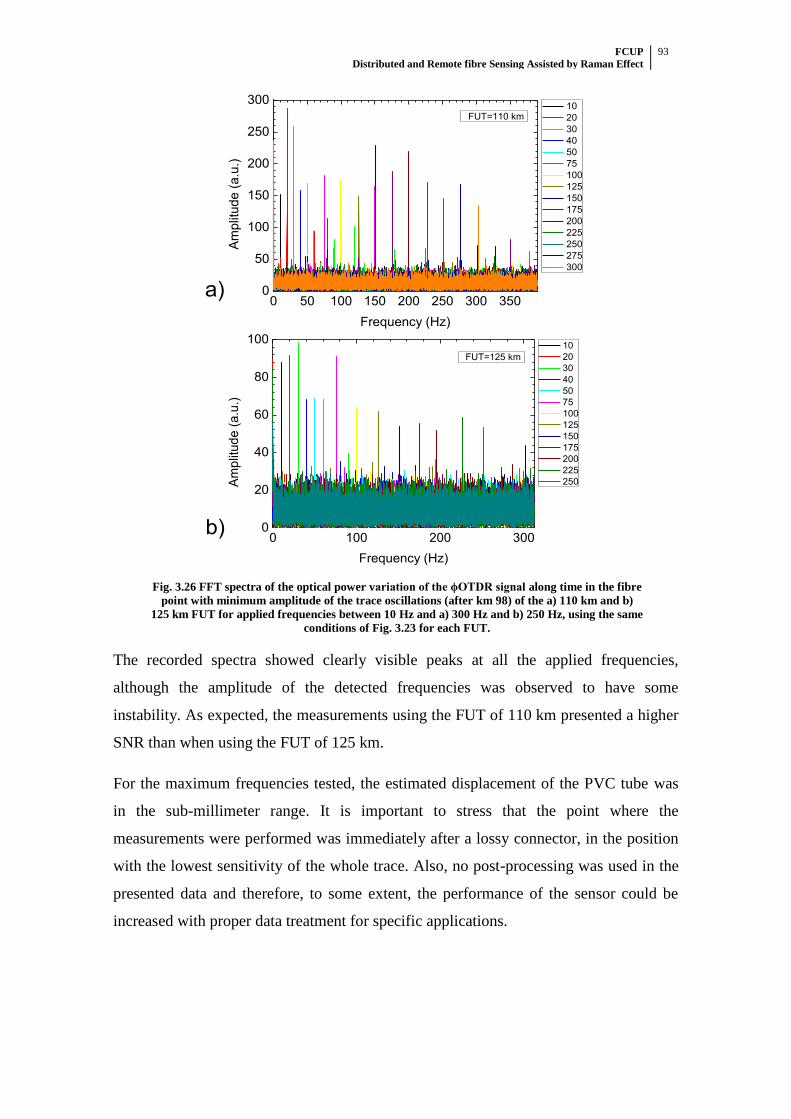
FCUP Distributed and Remote fibre Sensing Assisted by Raman Effect
93
0 50 100 150 200 250 300 3500
50
100
150
200
250
300
a)
FUT=110 km
Am
plit
ud
e (
a.u
.)
Frequency (Hz)
10
20
30
40
50
75
100
125
150
175
200
225
250
275
300
0 100 200 3000
20
40
60
80
100
b)
FUT=125 km
Am
plit
ud
e (
a.u
.)
Frequency (Hz)
10
20
30
40
50
75
100
125
150
175
200
225
250
Fig. 3.26 FFT spectra of the optical power variation of the ϕOTDR signal along time in the fibre
point with minimum amplitude of the trace oscillations (after km 98) of the a) 110 km and b)
125 km FUT for applied frequencies between 10 Hz and a) 300 Hz and b) 250 Hz, using the same
conditions of Fig. 3.23 for each FUT.
The recorded spectra showed clearly visible peaks at all the applied frequencies,
although the amplitude of the detected frequencies was observed to have some
instability. As expected, the measurements using the FUT of 110 km presented a higher
SNR than when using the FUT of 125 km.
For the maximum frequencies tested, the estimated displacement of the PVC tube was
in the sub-millimeter range. It is important to stress that the point where the
measurements were performed was immediately after a lossy connector, in the position
with the lowest sensitivity of the whole trace. Also, no post-processing was used in the
presented data and therefore, to some extent, the performance of the sensor could be
increased with proper data treatment for specific applications.
FCUP Distributed and Remote fibre Sensing Assisted by Raman Effect
94
3.5.4 Conclusions
This section, presents experimental and theoretical descriptions of the use of first-order
Raman amplification to improve the performance of a ϕOTDR, when used for vibration
measurements. The evolution of the ϕOTDR signal along the fibre is shown to be in
good agreement with the theoretical model for different Raman pump powers. The
Raman amplification combined with the noise reduction provided by the use of
balanced detection, a SOA and an optical switch, allows to greatly increase the SNR
and the sensing range of the ϕOTDR. Frequency measurements close to the limits set by
the time of flight of light pulses were achieved this way in a range which, to our
knowledge, is the highest for ϕOTDR vibration sensing achieved at the time of
publication of ref. [5]. The sensor was able to detect vibrations of up to 250/300 Hz at a
distance of 125/110 km, with a resolution of 10 m, without post-processing. This sensor
could be used to monitor intrusions in large structures, such as national borders or
pipelines. The best performance was achieved using the scheme of bi-directional Raman
pumping, which is a clear drawback of the setup, as access to both fibre ends is
required. However, unlike the case of Brillouin Optical Time Domain Analyzers, in this
scheme there are no restrictions in terms of having the two access points in the same
place, as the Raman pumps on each side can be physically separated. In addition,
depending on the application (for instance, using a circular geometry to monitor the
perimeter of a military base), the use of bi-directional pumping may not be at all a
limitation.

FCUP Distributed and Remote fibre Sensing Assisted by Raman Effect
95
3.6 Extending the sensing range: ϕOTDR assisted by second-order
Raman
3.6.1 Introduction
The use of second-order Raman amplification to assist ϕOTDR operation is presented in
this section. The noise, signal evolution along the fibre and spatial resolution are
discussed, and the distributed detection of vibrations over 125 km is characterized. The
sensor is compared with the first-order Raman-assisted ϕOTDR presented in the
previous section (3.5), and observed to present a better performance.
3.6.2 Experimental Setup
The experimental setup used to characterize the second-order Raman-assisted ϕOTDR
(shown in Fig. 3.27) is based on a couple of minor adaptations of the setup used in the
previous section (3.5) to characterize first-order Raman amplification (Fig. 3.18): (1) a
second-order (instead of first-order) Raman amplification scheme was used, (2) a
different tuneable filter was used after the EDFA, which presented an approximate
gaussian profile with 0.2 nm FWHM, replacing the 0.8 nm FBG with a typical spectrum
of a 100 % reflection which was previously used. Similarly to the first-order Raman
setup (Fig. 3.18), the ϕOTDR pulse length was also 20 m and an optical switch was
used after the EDFA, with rise/fall times of 200 ns and a typical ER of 25 dB, driven as
to realize a sub-microsecond transmission window synchronized with the pulse. This
ensures a reliable comparison between the performance of the two schemes.
Fig. 3.27 Experimental setup of ϕOTDR assisted by second-order Raman amplification.
A full description of the initial part of the setup (used to generate the ϕOTDR pulse
before coupling into the FUT) can be found in the description of Fig. 3.8, for the
ϕOTDR scheme without amplification. Regarding the second-order Raman
FCUP Distributed and Remote fibre Sensing Assisted by Raman Effect
96
amplification scheme, the FUT (125 km of SMF-28) is connected to the common ports
of two WDMs (1310/1550 nm). The ϕOTDR pulse is launched into the FUT through
the 1550 nm (1460-1620 nm) port of WDM1. The primary Raman pump is a Raman
fibre Laser (RFL) emitting at 1365 nm with RIN <-105 dBc/Hz. The power of this laser
can be tuned up to 5 W. The RFL beam is divided by a calibrated 50/50 coupler in two
beams, and each beam is then coupled into the 1310 nm (1270-1350 nm) ports of the
WDMs. Two FBGs centred at 1455 nm, with 0.5 nm FWHM and with 80 % reflectivity,
are placed at both ends of the fibre, thus creating an ultralong Raman fibre laser (URFL)
cavity. It is important to understand the dynamics of this URFL in order to understand
the advantage of this setup over first-order Raman assistance. If the URFL had a
resolvable mode structure, it would have a spectral mode spacing of
∆υ≈0.8 kHz=c/(2nL), where c is the velocity of light in the vacuum, n is the refractive
index, and L is the FUT length. In practice however, and depending on the pump power
applied, the mode structure can be partially or totally erased due to Rayleigh
backscattering and the four-wave mixing between the multiple modes [55]. Either way,
the RIN introduced by the second-order Raman amplification (see Fig. 3.28) is mostly
transferred to a much lower frequency range [62] than the typical frequencies (~10’s of
MHz) of schemes using first-order Raman amplification (see Fig. 3.22). This is a key
advantage, as the balanced detection implemented in the setup will provide a better
suppression of the common-mode noise. The power variation of the URFL along the
FUT will also be lower than the power variations of the primary RFL pumps.
Similarly to the first-order Raman assisted setup (Fig. 3.18), the signal back-reflected
from the fibre is amplified (using a micro-EDFA) and then goes through a 100 GHz
channel demultiplexer before reaching a balanced photodetector. Since the optical paths
leading to the “+” and “-” ports are the same (within 1 cm tolerance), effective
cancelation of the RIN noise is ensured. The signal was then recorded using a
high-speed digitizer.
3.6.3 RIN noise: Balanced VS Direct detection
Fig. 3.28 shows the signal returning from the fibre in the electrical spectrum domain
when a 28.5 dBm Raman pump power was launched on each side of the FUT without
input ϕOTDR pulse, for direct and balanced detections. This was observed as the best
Raman pump power for balanced detection (and was later used for the measurements),
since for higher powers the noise of the signal was observed to increase abruptly, due to
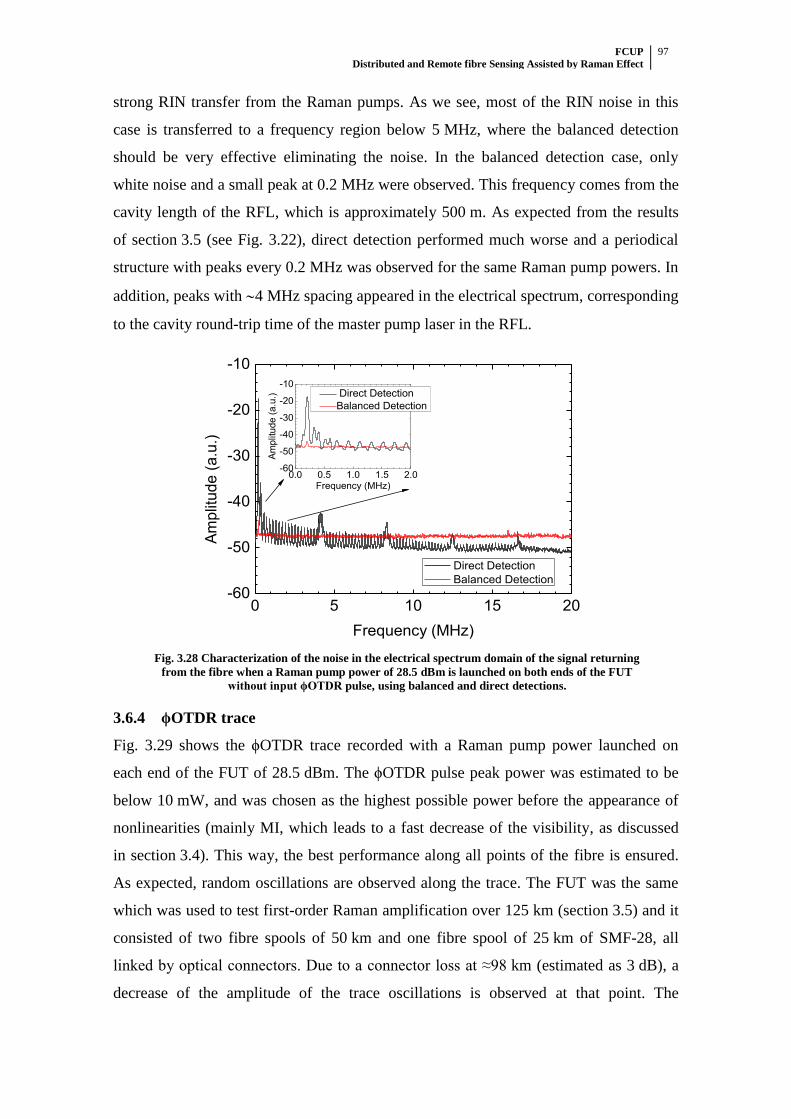
FCUP Distributed and Remote fibre Sensing Assisted by Raman Effect
97
strong RIN transfer from the Raman pumps. As we see, most of the RIN noise in this
case is transferred to a frequency region below 5 MHz, where the balanced detection
should be very effective eliminating the noise. In the balanced detection case, only
white noise and a small peak at 0.2 MHz were observed. This frequency comes from the
cavity length of the RFL, which is approximately 500 m. As expected from the results
of section 3.5 (see Fig. 3.22), direct detection performed much worse and a periodical
structure with peaks every 0.2 MHz was observed for the same Raman pump powers. In
addition, peaks with 4 MHz spacing appeared in the electrical spectrum, corresponding
to the cavity round-trip time of the master pump laser in the RFL.
0 5 10 15 20-60
-50
-40
-30
-20
-10
0.0 0.5 1.0 1.5 2.0-60
-50
-40
-30
-20
-10
Am
plit
ude (
a.u
.)
Frequency (MHz)
Direct Detection
Balanced Detection
Am
plit
ud
e (
a.u
.)
Frequency (MHz)
Direct Detection
Balanced Detection
Fig. 3.28 Characterization of the noise in the electrical spectrum domain of the signal returning
from the fibre when a Raman pump power of 28.5 dBm is launched on both ends of the FUT
without input ϕOTDR pulse, using balanced and direct detections.
3.6.4 ϕOTDR trace
Fig. 3.29 shows the ϕOTDR trace recorded with a Raman pump power launched on
each end of the FUT of 28.5 dBm. The ϕOTDR pulse peak power was estimated to be
below 10 mW, and was chosen as the highest possible power before the appearance of
nonlinearities (mainly MI, which leads to a fast decrease of the visibility, as discussed
in section 3.4). This way, the best performance along all points of the fibre is ensured.
As expected, random oscillations are observed along the trace. The FUT was the same
which was used to test first-order Raman amplification over 125 km (section 3.5) and it
consisted of two fibre spools of 50 km and one fibre spool of 25 km of SMF-28, all
linked by optical connectors. Due to a connector loss at ≈98 km (estimated as 3 dB), a
decrease of the amplitude of the trace oscillations is observed at that point. The
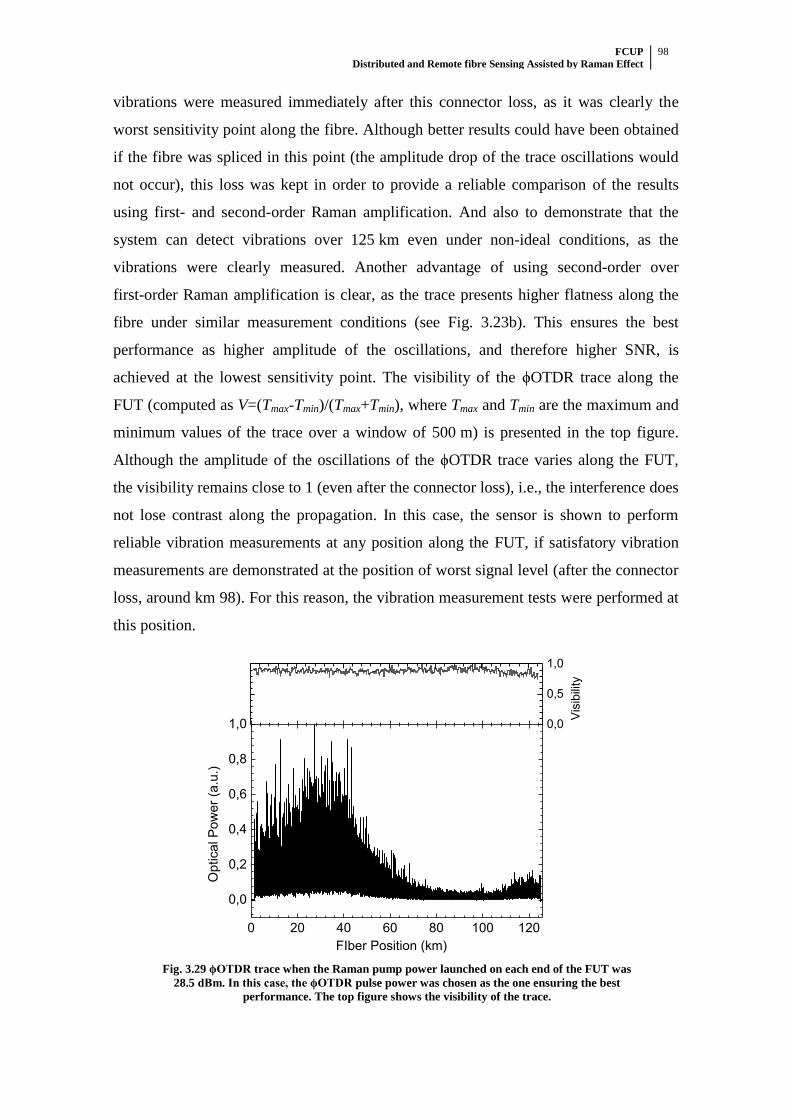
FCUP Distributed and Remote fibre Sensing Assisted by Raman Effect
98
vibrations were measured immediately after this connector loss, as it was clearly the
worst sensitivity point along the fibre. Although better results could have been obtained
if the fibre was spliced in this point (the amplitude drop of the trace oscillations would
not occur), this loss was kept in order to provide a reliable comparison of the results
using first- and second-order Raman amplification. And also to demonstrate that the
system can detect vibrations over 125 km even under non-ideal conditions, as the
vibrations were clearly measured. Another advantage of using second-order over
first-order Raman amplification is clear, as the trace presents higher flatness along the
fibre under similar measurement conditions (see Fig. 3.23b). This ensures the best
performance as higher amplitude of the oscillations, and therefore higher SNR, is
achieved at the lowest sensitivity point. The visibility of the ϕOTDR trace along the
FUT (computed as V=(Tmax-Tmin)/(Tmax+Tmin), where Tmax and Tmin are the maximum and
minimum values of the trace over a window of 500 m) is presented in the top figure.
Although the amplitude of the oscillations of the ϕOTDR trace varies along the FUT,
the visibility remains close to 1 (even after the connector loss), i.e., the interference does
not lose contrast along the propagation. In this case, the sensor is shown to perform
reliable vibration measurements at any position along the FUT, if satisfatory vibration
measurements are demonstrated at the position of worst signal level (after the connector
loss, around km 98). For this reason, the vibration measurement tests were performed at
this position.
0 20 40 60 80 100 120
0,0
0,2
0,4
0,6
0,8
1,0 0,0
0,5
1,0
Optical P
ow
er
(a.u
.)
FIber Position (km)
Vis
ibili
ty
Fig. 3.29 ϕOTDR trace when the Raman pump power launched on each end of the FUT was
28.5 dBm. In this case, the ϕOTDR pulse power was chosen as the one ensuring the best
performance. The top figure shows the visibility of the trace.
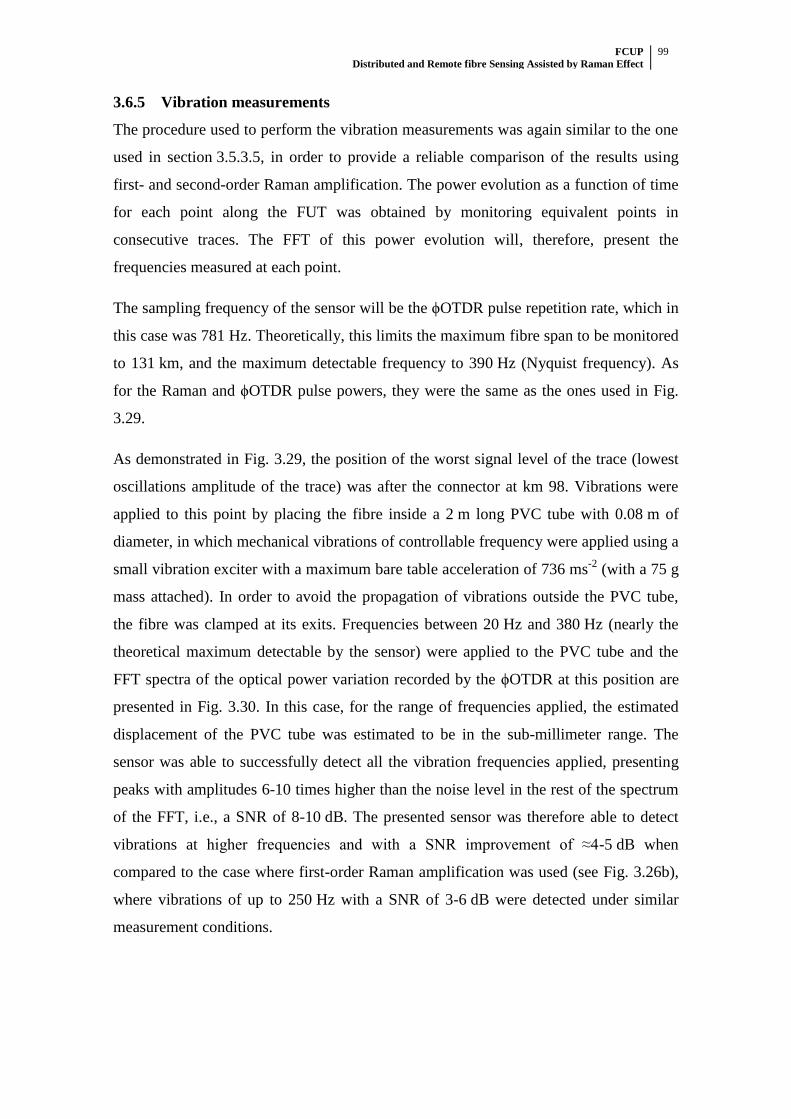
FCUP Distributed and Remote fibre Sensing Assisted by Raman Effect
99
3.6.5 Vibration measurements
The procedure used to perform the vibration measurements was again similar to the one
used in section 3.5.3.5, in order to provide a reliable comparison of the results using
first- and second-order Raman amplification. The power evolution as a function of time
for each point along the FUT was obtained by monitoring equivalent points in
consecutive traces. The FFT of this power evolution will, therefore, present the
frequencies measured at each point.
The sampling frequency of the sensor will be the ϕOTDR pulse repetition rate, which in
this case was 781 Hz. Theoretically, this limits the maximum fibre span to be monitored
to 131 km, and the maximum detectable frequency to 390 Hz (Nyquist frequency). As
for the Raman and ϕOTDR pulse powers, they were the same as the ones used in Fig.
3.29.
As demonstrated in Fig. 3.29, the position of the worst signal level of the trace (lowest
oscillations amplitude of the trace) was after the connector at km 98. Vibrations were
applied to this point by placing the fibre inside a 2 m long PVC tube with 0.08 m of
diameter, in which mechanical vibrations of controllable frequency were applied using a
small vibration exciter with a maximum bare table acceleration of 736 ms-2
(with a 75 g
mass attached). In order to avoid the propagation of vibrations outside the PVC tube,
the fibre was clamped at its exits. Frequencies between 20 Hz and 380 Hz (nearly the
theoretical maximum detectable by the sensor) were applied to the PVC tube and the
FFT spectra of the optical power variation recorded by the ϕOTDR at this position are
presented in Fig. 3.30. In this case, for the range of frequencies applied, the estimated
displacement of the PVC tube was estimated to be in the sub-millimeter range. The
sensor was able to successfully detect all the vibration frequencies applied, presenting
peaks with amplitudes 6-10 times higher than the noise level in the rest of the spectrum
of the FFT, i.e., a SNR of 8-10 dB. The presented sensor was therefore able to detect
vibrations at higher frequencies and with a SNR improvement of ≈4-5 dB when
compared to the case where first-order Raman amplification was used (see Fig. 3.26b),
where vibrations of up to 250 Hz with a SNR of 3-6 dB were detected under similar
measurement conditions.
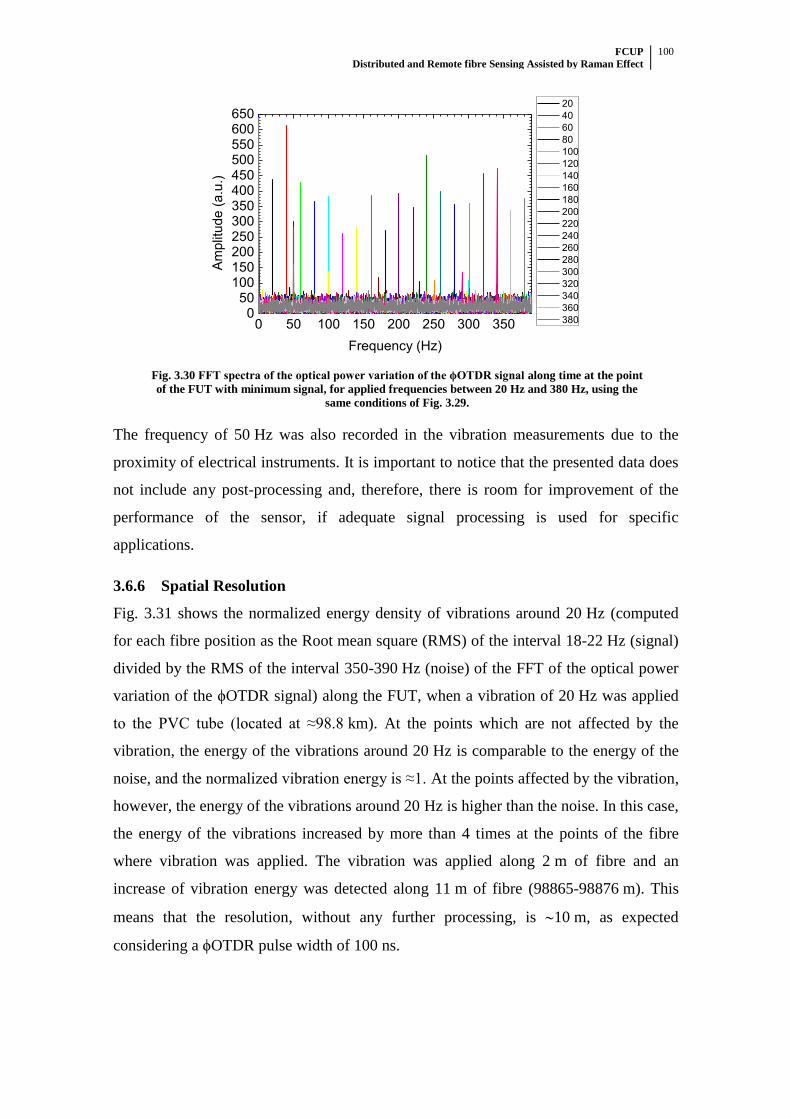
FCUP Distributed and Remote fibre Sensing Assisted by Raman Effect
100
0 50 100 150 200 250 300 3500
50100150200250300350400450500550600650
Am
plit
ude (
a.u
.)
Frequency (Hz)
20
40
60
80
100
120
140
160
180
200
220
240
260
280
300
320
340
360
380
Fig. 3.30 FFT spectra of the optical power variation of the ϕOTDR signal along time at the point
of the FUT with minimum signal, for applied frequencies between 20 Hz and 380 Hz, using the
same conditions of Fig. 3.29.
The frequency of 50 Hz was also recorded in the vibration measurements due to the
proximity of electrical instruments. It is important to notice that the presented data does
not include any post-processing and, therefore, there is room for improvement of the
performance of the sensor, if adequate signal processing is used for specific
applications.
3.6.6 Spatial Resolution
Fig. 3.31 shows the normalized energy density of vibrations around 20 Hz (computed
for each fibre position as the Root mean square (RMS) of the interval 18-22 Hz (signal)
divided by the RMS of the interval 350-390 Hz (noise) of the FFT of the optical power
variation of the ϕOTDR signal) along the FUT, when a vibration of 20 Hz was applied
to the PVC tube (located at ≈98.8 km). At the points which are not affected by the
vibration, the energy of the vibrations around 20 Hz is comparable to the energy of the
noise, and the normalized vibration energy is ≈1. At the points affected by the vibration,
however, the energy of the vibrations around 20 Hz is higher than the noise. In this case,
the energy of the vibrations increased by more than 4 times at the points of the fibre
where vibration was applied. The vibration was applied along 2 m of fibre and an
increase of vibration energy was detected along 11 m of fibre (98865-98876 m). This
means that the resolution, without any further processing, is 10 m, as expected
considering a ϕOTDR pulse width of 100 ns.
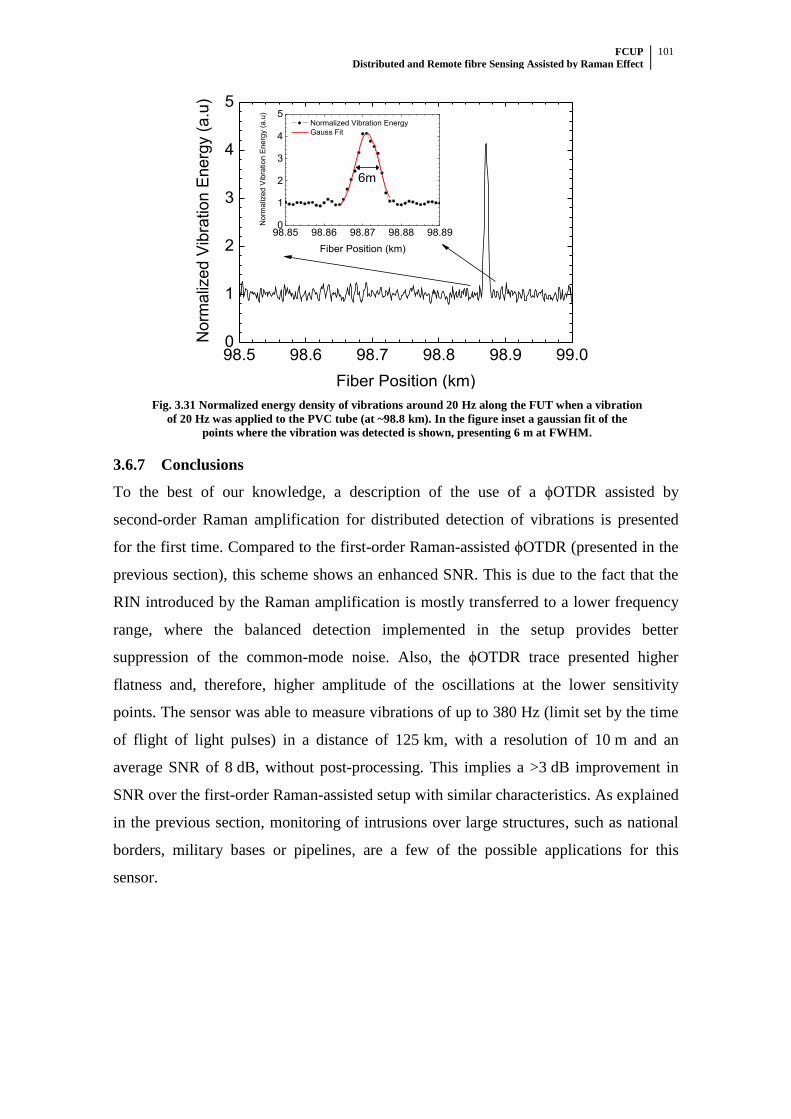
FCUP Distributed and Remote fibre Sensing Assisted by Raman Effect
101
98.5 98.6 98.7 98.8 98.9 99.00
1
2
3
4
5
98.85 98.86 98.87 98.88 98.890
1
2
3
4
5
Norm
aliz
ed V
ibra
tion E
nerg
y (
a.u
)
Fiber Position (km)
Normalized Vibration Energy
Gauss Fit
6m
Norm
aliz
ed V
ibra
tion
En
erg
y (
a.u
)
Fiber Position (km)
Fig. 3.31 Normalized energy density of vibrations around 20 Hz along the FUT when a vibration
of 20 Hz was applied to the PVC tube (at ~98.8 km). In the figure inset a gaussian fit of the
points where the vibration was detected is shown, presenting 6 m at FWHM.
3.6.7 Conclusions
To the best of our knowledge, a description of the use of a ϕOTDR assisted by
second-order Raman amplification for distributed detection of vibrations is presented
for the first time. Compared to the first-order Raman-assisted ϕOTDR (presented in the
previous section), this scheme shows an enhanced SNR. This is due to the fact that the
RIN introduced by the Raman amplification is mostly transferred to a lower frequency
range, where the balanced detection implemented in the setup provides better
suppression of the common-mode noise. Also, the ϕOTDR trace presented higher
flatness and, therefore, higher amplitude of the oscillations at the lower sensitivity
points. The sensor was able to measure vibrations of up to 380 Hz (limit set by the time
of flight of light pulses) in a distance of 125 km, with a resolution of 10 m and an
average SNR of 8 dB, without post-processing. This implies a >3 dB improvement in
SNR over the first-order Raman-assisted setup with similar characteristics. As explained
in the previous section, monitoring of intrusions over large structures, such as national
borders, military bases or pipelines, are a few of the possible applications for this
sensor.
FCUP Distributed and Remote fibre Sensing Assisted by Raman Effect
102
3.7 ϕOTDR for distributed vibration sensing: Conclusions
In this chapter, an extensive investigation was presented on the use of ϕOTDR for
distributed vibration sensing, which included theoretical and experimental descriptions
of the signal and the noise for different configurations.
Over short fibre lengths, a simple ϕOTDR scheme without amplification allowed the
detection of frequencies of up to 39.5 kHz over 1.25 km (section 3.3). The noise and
signal statistics were characterized, showing good agreement with the theoretical model.
Under normal operation, MI was identified as the limiting nonlinear effect on the
performance of a ϕOTDR, leading to position-dependent fading (FPU recurrence) in the
ϕOTDR trace when the pulse peak power is increased (section 3.4).
In order to extend the sensing range, the use of first-order (section 3.5) and second-order
(section 3.6) Raman amplification to assist ϕOTDR operation were described and
intercompared, and allowed distributed vibration sensing over more than 100 km. The
RIN transfer from the Raman pumps was observed to be one of the main drawbacks of
these schemes. However, the use of balanced detection was demonstrated to greatly
reduce its impact on the detected signal. The scheme using ϕOTDR assisted by
second-order Raman amplification was observed to perform better, allowing the
detection of frequencies up to 380 Hz over 125 km.
In short, distributed vibration measurements up to frequencies in the limits set by the
time of flight of light were achieved when using ϕOTDR over distances ranging from
1.25 km (section 3.3) to 125 km (section 3.6), while maintaining the simplicity of the
schemes, as no post-processing, extremely high coherent lasers or coherent detection
were required. To the best of our knowledge, the presented results include records in
ϕOTDR distributed vibration sensing for the highest vibration frequency detected
(39.5 kHz) and the highest sensing range (125 km) at the time of publication of ref. [3]
and [5], respectively.
Schemes optimized for short fibre lengths (high frequency detection) could be used in
vibration-based structural damage identification or monitoring, where ultrasonic waves
are sometimes used to detect damages in the structures, while the schemes with
amplification could be used for monitoring intrusions over large structures, such as
national borders, military bases or pipelines.
FCUP Distributed and Remote fibre Sensing Assisted by Raman Effect
103
4 ϕOTDR for distributed birefringence
measurements

FCUP Distributed and Remote fibre Sensing Assisted by Raman Effect
104
FCUP Distributed and Remote fibre Sensing Assisted by Raman Effect
105
4.1 Introduction
After the description of ϕOTDR for dynamic measurements in chapter 3, in this chapter
we focus in describing the use of ϕOTDR for static measurements. Distributed
measurement of birefringence is achieved with a technique based on the correlation of
ϕOTDR measurements using two orthogonal states of polarization. Owing to the nature
of ϕOTDR, the potential for high accuracy (measurable variations in the refractive index
difference between the two polarization axis (∆n) of ~10-7
) over large distances (10’s of
kilometers), and with metre resolution, is demonstrated. Distributed birefringence
measurements were performed over PMF and low birefringence SMF.
4.2 State-of-the-Art
As discussed in section 2.2.3, in a birefringent medium, two modes with the same
frequency and orthogonal linear polarizations experience different refractive indices and
travel at different velocities. This will cause broadening of a pulse propagating in the
fibre which can significantly distort optical signals, especially over long distances and at
very high data rates.
In optical fibres, birefringence can occur due to several factors that introduce
asymmetries in the fibre refractive index profile. With current manufacturing
techniques, low birefringence can be achieved in SMF, being typically ~10-7
. As for
PMFs, these are built by introducing asymmetries in the fabrication process (see Fig.
2.2) which lead to high built-in birefringence (e.g. ~10-4
), and can preserve the SOP
along the fibre, thus making them very attractive for several applications.
While several techniques have been proposed to characterize the birefringence of fibres
[115-121], most of them only measure the average birefringence and cannot be used to
discriminate local birefringence variations along the fibre [115-118]. However,
birefringence typically presents fluctuations along the fibre due to inhomogeneities
resulting from the fibre drawing process, bendings and twists introduced during the
cabling and installation processes, as well as due to external environmental conditions
such as temperature and strain variations. High birefringence can occur in short fibre
sections and become an important factor in the scaling of the overall PMD. The
FCUP Distributed and Remote fibre Sensing Assisted by Raman Effect
106
distributed measurement of birefringence can, therefore, be an important tool for the
characterization of fibres.
The techniques reported for distributed birefringence measurements are essentially
based on OFDR [119, 120] and dynamic Brillouin gratings (DBG) [121]. While OFDR
has been shown to allow very high spatial resolution, the sensing range is typically
limited to a few hundreds of metres [120], which can be an important limitation when
characterizing long fibres employed in optical communication systems. As for the
DBG-based method, it relies on a complex system [121], where high power and precise
adjustment of frequency and polarization of the three interacting optical waves is
required to generate the gratings by stimulated Brillouin scattering (SBS) and read them
in the transversal polarization. Furthermore, the mentioned techniques have only been
described for measurement of birefringence along PMFs, which present much higher
birefringence than SMFs.
Owing to their nature, ϕOTDR systems are typically focused on providing
measurements at much longer distances (10’s of kilometers) and have been
demonstrated to allow high measurand resolution for static measurements (0.01ºC) over
long distances (8 km) with one metre spatial resolution [27]. The discrimination of
signals corresponding to different polarization axes has also been demonstrated in
ϕOTDR operation [39], which makes it a suitable candidate for measurement of
distributed birefringence.
4.3 ϕOTDR for static measurements: Theoretical model
The general principles (section 3.2.1), signal statistics and noise (section 3.3.2) of
ϕOTDR operation have previously been described in the context of dynamic
measurements. Here, we present a theoretical model and measurement principle for
static measurements using ϕOTDR.
We start by recovering eq. 3.6, which describes the normalized optical intensity I
detected at the fibre beginning (z=0), resulting from the interference of the fields
reflected from M scattering centres, contained in a fibre section with length W/2 and
centred at z . The reflection results from the propagation of a ϕOTDR pulse (length W –
FCUP Distributed and Remote fibre Sensing Assisted by Raman Effect
107
i.e., double the length of the fibre section, as discussed in section 3.2.1 - and frequency
ω), and losses are neglected:
12 2 2
1 1 1 1( ) | | | | 2 cos( )m
M M M Mi
m m i j i jm m i j iI z E r e r rr
, (4.1)
where [0,1]mr (usually <<1; 1
1M
mmr
) and [0,2 ]m are the reflectivity and
phase of the wave reflected from the mth
scattering centre. Considering a one
dimensional model, then i j for two scattering centres i, j, placed at the positions zi,
zj, will be written as
2( )i j
i j
n z z
c
, (4.2)
where n is the local refractive index at z=[zi ; zj]. In this case, the interference pattern
I(z) along the fibre will be dependent on ω, n and the position of the scattering centres
zm. The core concept of using ϕOTDR for static measurements relies on the principle
that changes in n (and zm) can be compensated by changes in ω. Then, the pattern I(z)
which results from using ω for a given n (and zm) will be similar to I(z) produced by
using ω+∆ω for another n’ (and zm’). By measuring the ∆ω shift that compensates the n
(and zm) changes induced by temperature/strain applied to the fibre, the refractive index
change can be measured with much higher resolution than those provided by Brillouin
based sensing [122]: temperature/spatial resolutions of 0.01ºC/1 m have been
demonstrated over 8 km using ϕOTDR [27]. Reported sensitivities to changes in
temperature ∆T and strain ∆ε (for a central wavelength ~1550 nm) are [123],[27]:
66.92 10 T
(4.3)
0.78
. (4.4)
The standard procedure for static measurements is to perform ϕOTDR measurements
while changing ω step by step and record the pattern I(z) for each ω [I(z, ω)], at a given
time t1. The measurement is then repeated at a different time t2, and the cross-correlation
between the two measurement sets is computed for each z. If changes in n do not occur
between t1 and t2, then the maximum of the cross-correlation will occur for ∆ω=0.
However, if a change ∆n occurs, then the maximum of the cross-correlation will occur
FCUP Distributed and Remote fibre Sensing Assisted by Raman Effect
108
for ∆ω≠0. A full mathematical description of the procedure can be found in [27]. Since
( )I z is only sensitive to local changes in n around z (within a length W/2), then the
distributed measurement of variations in n can be performed along the fibre.
For each frequency step, the measurement is performed similarly to the dynamic
OTDR measurements. For this reason, all the considerations for noise and system
stability (pulse coherence, laser stability and polarization noise) made in chapter 3 also
apply to the case of static measurements. However, for static measurements, the
comparison between OTDR traces, which can be several minutes apart (depending on
the number of frequency steps and averaging), is required. In this case, the long-term
frequency stability of the laser plays a critical role, since a frequency drift ∆ω of the
laser will be indistinguishable from an actual change in n. Schemes using a laser with
locked operating frequency, where the frequency of the OTDR pulses is scanned using
an electro-optic modulator (EOM), are therefore usually adopted [124]. Since the
bandwidth is no longer a critical parameter, averaging of OTDR traces is also typically
used to reduce the fluctuations of the pattern I(z) and improve the SNR.
If the induced ∆ω is higher than the frequency range that is scanned, then the
cross-correlation will show no peak and the measurement is inconclusive. In this case, a
practical problem for OTDR sensors can arise from their high sensitivity: the scan of a
high frequency range (~GHz per ºC, for a central wavelength ~1550 nm) may be
necessary to monitor modest temperature/strain changes.
4.3.1 Birefringence measurements
In order to perform birefringence measurements, the main difference, with respect to
conventional OTDR used for static measurements, is that the two measurements are
performed at orthogonal states of polarization. Since birefringence is translated into a
refractive index difference ∆n=ns-nf between the slow (ns) and fast (nf) polarization
axes, then, from eq. 4.2, the expected cross-correlation peak shift ∆ω=ωs-ωf, between
the measurements of the two axes can be derived as
( ) ( ) .s s s f f f
s f
nn n
n
(4.5)
If the two measurements are performed in the same polarization axis, then the
cross-correlation peak shift is expected to be ∆ω=0, since ∆n=0. In practice, this
FCUP Distributed and Remote fibre Sensing Assisted by Raman Effect
109
correlation peak provides a measurement of the averaged laser frequency drift, as well
as of the fluctuations of the fibre temperature during the acquisition time [27]. Since
these effects can significantly impact on the accuracy of the frequency measurements,
measuring the peak at ∆ω=0 provides a reliable method to evaluate the stability of the
system, and to compensate for undesired cross-sensitivities.
4.4 Experimental Work
4.4.1 Setup
The experimental ϕOTDR setup (using polarized light) which was used for local phase
birefringence measurements is shown in Fig. 4.1. A distributed-feedback (DFB) laser,
operating at 1535 nm, and a semiconductor optical amplifier (SOA) are used to generate
optical pulses with high extinction ratio (ER). The pulse width is set to 20 ns,
corresponding to a spatial resolution of 2 m. While the laser temperature is tuned to
coarsely scan the optical frequency of the pulses in a wide frequency range (many 10’s
of GHz), an electro-optic modulator (EOM), driven by a microwave source, is used to
accurately scan the light frequency with steps of 10 MHz. A tuneable 10 GHz fibre
Bragg grating (FBG) is utilized to select one of the sidebands generated by the EOM.
Then, optical pulses are amplified by an Erbium-doped fibre amplifier (EDFA),
followed by a tuneable optical filter (TOF) used to suppress the amplified spontaneous
emission (ASE) noise. Before launching the pulses into the fibre under test (FUT) using
a circulator, a polarization switch (PSw) and a polarization controller (PC) are used to
launch light into the FUT with orthogonal states of polarization. Three different FUTs
were evaluated: two PMFs (an 80 m Panda and a 100 m elliptical-core fibre) and one
SMF (3 km). A polarizer followed by a power metre are placed at the output of the
FUT. By monitoring the transmitted power at the power metre and
maximizing/minimizing it, a maximum coupling of light into the slow/fast axis (in this
case, the polarizer is aligned with the slow axis of the PMF) is ensured. With this
procedure, the correlation peak amplitude is enhanced, thus improving the accuracy of
the frequency measurements. At the receiver, the Rayleigh backscattered signals are
sent to a 125 MHz bandwidth photodetector, and then acquired by a computer. Finally,
the birefringence is computed based on the frequency shift of the peak of the
cross-correlation between ϕOTDR measurements using pulses with orthogonal states of
polarization, as discussed in section 4.3.1.

FCUP Distributed and Remote fibre Sensing Assisted by Raman Effect
110
Fig. 4.1 Experimental setup of the ϕOTDR used for distributed birefringence measurements.
4.4.2 Birefringence of PMFs
We start by describing the birefringence measurements performed in the PMFs, using
the setup described in Fig. 4.1. Fig. 4.2 shows the birefringence-induced frequency shift
( 2 ) along the FUT, obtained from the cross-correlation of ϕOTDR
measurements at the two orthogonal states of polarization for the Panda (Fig. 4.2a) and
the elliptic-core (Fig. 4.2b) fibres. From ∆υ, the profile of the modal birefringence ∆n
(defined in eq. 2.14) along the fibre is computed (using eq. 4.5), and is presented in the
right-hand side vertical axis. The average value of ∆n was ≈56.2∙10-5
for the Panda fibre
(Fig. 4.2a) and ≈32.6∙10-5
for the elliptic-core fibre (Fig. 4.2b). Fluctuations of ∆n of the
order of ~0.1∙10-5
were clearly observed along both fibres.
Fig. 4.2 Distributed profile of phase birefringence versus distance along a) 80 m Panda PMF and b) 100 m
elliptical-core PMF.
Laser
PSw FUT
Computer-wave
Generator
EOM
RF DC
SOA
EDFA
PulseFBG
PCTOF
DetectorPolariser
Power meter
Bir
efr
inge
nce
[1
0-5]
55.8
56.0
56.2
56.4
56.6
56.8
Distance [m]
Fre
qu
en
cy [
GH
z]
0 20 40 60 80
74.5
75
75.5
(a)
Bir
efr
inge
nce
[1
0-5]
31.5
32.0
32.5
33.0
33.5
Distance [m]
Fre
qe
un
cy [
GH
z]
0 20 40 60 80 10041.5
42
42.5
43
43.5
44
44.5
45(b)
Δn
·10
-5
Fre
qu
en
cy s
hif
t Δυ
(G
Hz)
Fibre position (m)
Δn
(x
10
-5)
Fibre position (m)
Fre
qu
en
cy s
hif
t Δυ
(G
Hz)
Δn
(x
10
-5)
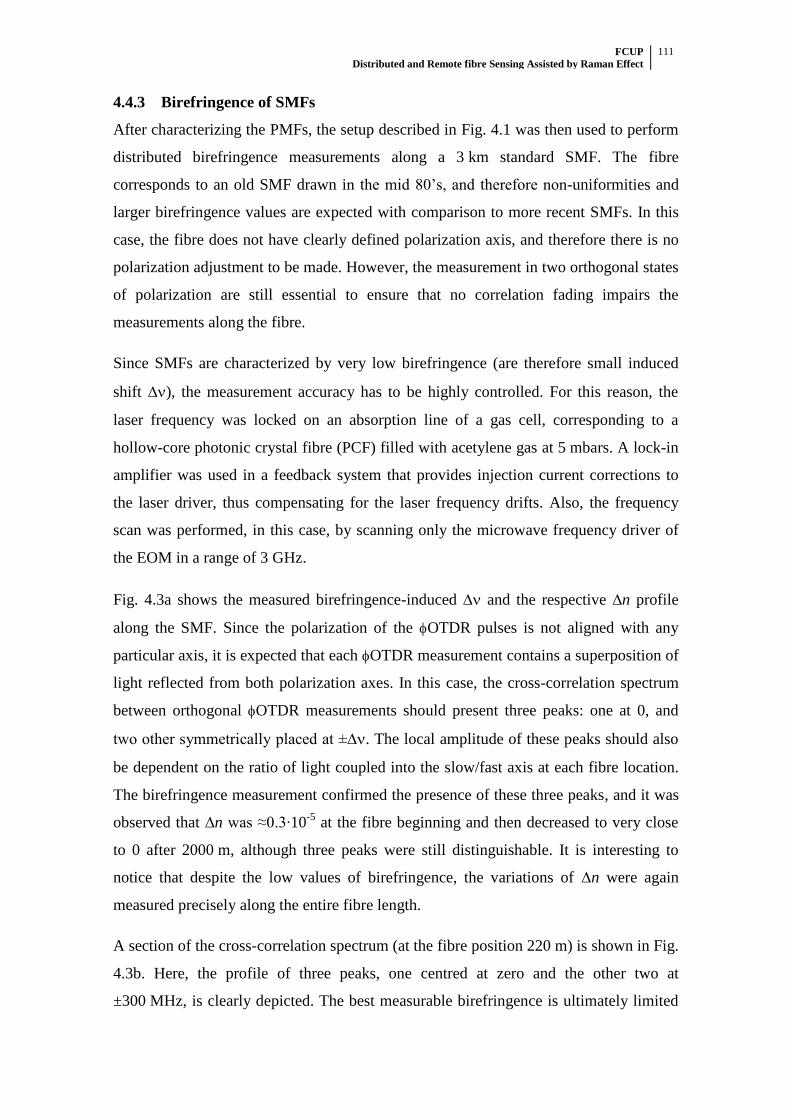
FCUP Distributed and Remote fibre Sensing Assisted by Raman Effect
111
4.4.3 Birefringence of SMFs
After characterizing the PMFs, the setup described in Fig. 4.1 was then used to perform
distributed birefringence measurements along a 3 km standard SMF. The fibre
corresponds to an old SMF drawn in the mid 80’s, and therefore non-uniformities and
larger birefringence values are expected with comparison to more recent SMFs. In this
case, the fibre does not have clearly defined polarization axis, and therefore there is no
polarization adjustment to be made. However, the measurement in two orthogonal states
of polarization are still essential to ensure that no correlation fading impairs the
measurements along the fibre.
Since SMFs are characterized by very low birefringence (are therefore small induced
shift ∆), the measurement accuracy has to be highly controlled. For this reason, the
laser frequency was locked on an absorption line of a gas cell, corresponding to a
hollow-core photonic crystal fibre (PCF) filled with acetylene gas at 5 mbars. A lock-in
amplifier was used in a feedback system that provides injection current corrections to
the laser driver, thus compensating for the laser frequency drifts. Also, the frequency
scan was performed, in this case, by scanning only the microwave frequency driver of
the EOM in a range of 3 GHz.
Fig. 4.3a shows the measured birefringence-induced ∆ and the respective ∆n profile
along the SMF. Since the polarization of the OTDR pulses is not aligned with any
particular axis, it is expected that each OTDR measurement contains a superposition of
light reflected from both polarization axes. In this case, the cross-correlation spectrum
between orthogonal OTDR measurements should present three peaks: one at 0, and
two other symmetrically placed at ±∆. The local amplitude of these peaks should also
be dependent on the ratio of light coupled into the slow/fast axis at each fibre location.
The birefringence measurement confirmed the presence of these three peaks, and it was
observed that ∆n was ≈0.3∙10-5
at the fibre beginning and then decreased to very close
to 0 after 2000 m, although three peaks were still distinguishable. It is interesting to
notice that despite the low values of birefringence, the variations of ∆n were again
measured precisely along the entire fibre length.
A section of the cross-correlation spectrum (at the fibre position 220 m) is shown in Fig.
4.3b. Here, the profile of three peaks, one centred at zero and the other two at
±300 MHz, is clearly depicted. The best measurable birefringence is ultimately limited
FCUP Distributed and Remote fibre Sensing Assisted by Raman Effect
112
by the width of the correlation peaks, which is observed to be ≈50 MHz. This is
consistent with the spectral width defined by the 20 ns pulses, and corresponds to a
measurable birefringence of ∆n~3∙10-7
.
Fig. 4.3 Distributed birefringence measurement in a SMF: a) Measured frequency and birefringence profile
versus distance b) cross-correlation spectrum at 220 m distance.
4.5 Conclusions
To the best of our knowledge, distributed measurement of birefringence using OTDR
has been presented for the first time. The technique uses the correlation of ϕOTDR
measurements at two orthogonal states of polarization. Owing to the high birefringence
accuracy achieved (∆n~10-7
), the discrimination of local birefringence changes was
clearly demonstrated along not only PMFs, but also along low birefringence SMF. The
potential for metre spatial resolutions over several km was also demonstrated.
A potential drawback to the technique is that it requires a comparison between OTDR
traces which can be several minutes apart. However, by using unpolarized light and
Bir
efr
inge
nce
[1
0-5]
0 500 1000 1500 2000 2500 3000
-1.0
-0.5
0
0.5
1.0
Distance [m]
Fre
qu
en
cy [
GH
z]
-1.5
-1.0
-0.5
0
0.5
1.0
1.5(a)
-500 -250 0 250 500
-0.5
0
0.5
1.0
Frequency [MHz]
No
rmalised
co
rrela
tio
n
50 MHz
Correlation at 220 m(b)
Frequency shift Δυ (MHz)
)
No
rmal
ise
d c
ross
-co
rre
lati
on
Fibre position (m)
Fre
qu
en
cy s
hif
t Δυ
(G
Hz)
Δn
(x
10
-5)

FCUP Distributed and Remote fibre Sensing Assisted by Raman Effect
113
correlating the measured frequency sweep with itself, it may be possible to perform
measurements with a single frequency sweep, thus increasing the stability of the system.

FCUP Distributed and Remote fibre Sensing Assisted by Raman Effect
114
FCUP Distributed and Remote fibre Sensing Assisted by Raman Effect
115
5 URFL for remote vibration sensing

FCUP Distributed and Remote fibre Sensing Assisted by Raman Effect
116
FCUP Distributed and Remote fibre Sensing Assisted by Raman Effect
117
5.1 Introduction
In the present chapter, a new configuration for an intensity vibration sensor based on a
Raman fibre laser is proposed. The linear cavity of the Raman fibre laser relies on the
combination of a distributed Rayleigh mirror and FBGs, which are used as the sensing
element and intensity filter. The main advantages of the proposed configuration are the
simple high SNR scheme for remote sensing, and the possibility of easy multiplexing.
The main results presented in this chapter were published in Journal of Lightwave
Technology [4].
5.2 State-of-the-Art
Raman FBG lasers using a linear cavity have been widely researched and improved
over the last two decades [125]. Recently, ultralong Raman fibre lasers (URFL) have
been implemented as very attractive solutions for optical communication links [126].
Although fibre lasers based on the Raman effect can present some restrictions when
high power is injected in the fibre due to the gain suppression created by the Rayleigh
scattering growth, systems where power losses are continuously compensated using
second-order Raman pumping, creating virtually lossless fibre spans, have been
demonstrated [22]. The principle was used to demonstrate a resolvable mode structure
of an URFL with a 270 km cavity in 2009 [55]. Rayleigh scattering can also be used as
a distributed random mirror to enhance the generation of Brillouin-Raman comb lasers
[127-130], multiwavelength generation [131, 132] and random distributed lasers [133].
In 2010, a 200 km dual-wavelength URFL using two FBGs with different Bragg
wavelengths, one on each side of the fibre span, was reported [134]. The laser cavities
of the two independent Raman fibre lasers were formed between the FBGs and a
distributed random mirror created by Rayleigh scattering, resulting in laser action at the
wavelength of the FBG peak.
In optical sensing, several sensors combining the use of FBGs with Rayleigh scattering
have been reported. FBGs can be used as sensing heads for measurement of strain,
temperature or other physical parameters, since the variation of these parameters
induces changes on the central Bragg wavelength [135, 136]. Recently, a
temperature-insensitive strain sensor using two different wavelength Raman FBG
lasers, which used cooperative Rayleigh scattering, was reported [137]. The use of
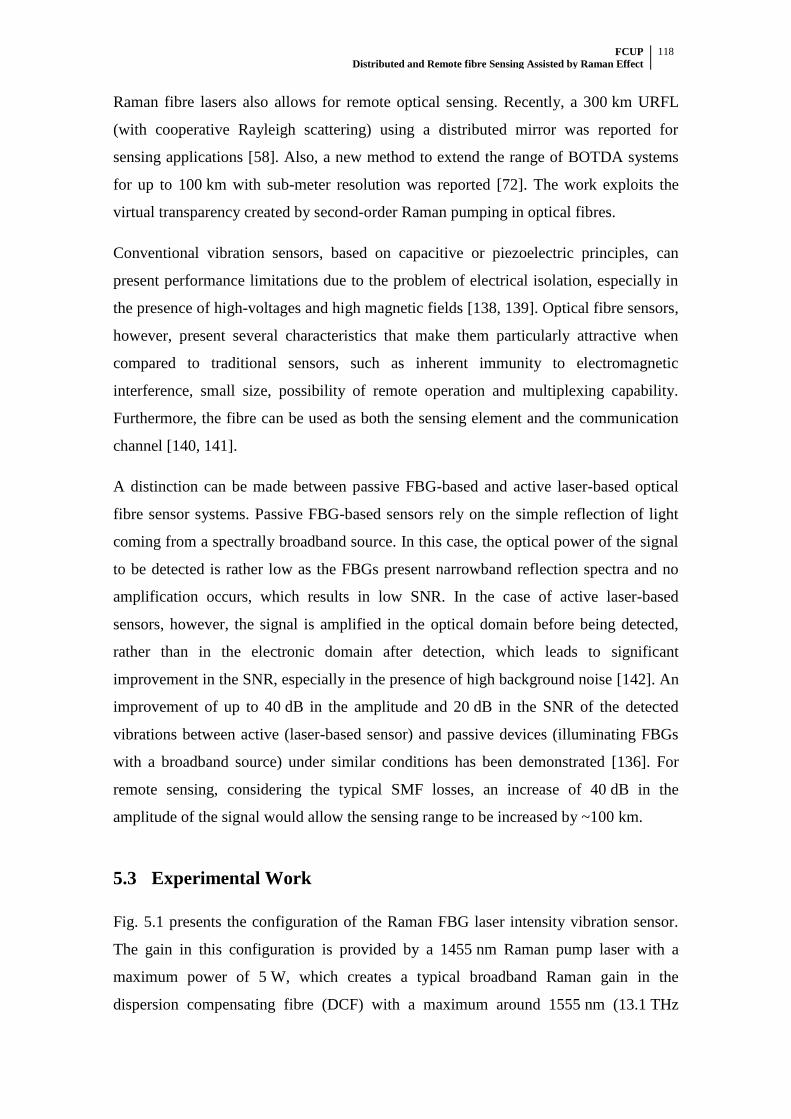
FCUP Distributed and Remote fibre Sensing Assisted by Raman Effect
118
Raman fibre lasers also allows for remote optical sensing. Recently, a 300 km URFL
(with cooperative Rayleigh scattering) using a distributed mirror was reported for
sensing applications [58]. Also, a new method to extend the range of BOTDA systems
for up to 100 km with sub-meter resolution was reported [72]. The work exploits the
virtual transparency created by second-order Raman pumping in optical fibres.
Conventional vibration sensors, based on capacitive or piezoelectric principles, can
present performance limitations due to the problem of electrical isolation, especially in
the presence of high-voltages and high magnetic fields [138, 139]. Optical fibre sensors,
however, present several characteristics that make them particularly attractive when
compared to traditional sensors, such as inherent immunity to electromagnetic
interference, small size, possibility of remote operation and multiplexing capability.
Furthermore, the fibre can be used as both the sensing element and the communication
channel [140, 141].
A distinction can be made between passive FBG-based and active laser-based optical
fibre sensor systems. Passive FBG-based sensors rely on the simple reflection of light
coming from a spectrally broadband source. In this case, the optical power of the signal
to be detected is rather low as the FBGs present narrowband reflection spectra and no
amplification occurs, which results in low SNR. In the case of active laser-based
sensors, however, the signal is amplified in the optical domain before being detected,
rather than in the electronic domain after detection, which leads to significant
improvement in the SNR, especially in the presence of high background noise [142]. An
improvement of up to 40 dB in the amplitude and 20 dB in the SNR of the detected
vibrations between active (laser-based sensor) and passive devices (illuminating FBGs
with a broadband source) under similar conditions has been demonstrated [136]. For
remote sensing, considering the typical SMF losses, an increase of 40 dB in the
amplitude of the signal would allow the sensing range to be increased by ~100 km.
5.3 Experimental Work
Fig. 5.1 presents the configuration of the Raman FBG laser intensity vibration sensor.
The gain in this configuration is provided by a 1455 nm Raman pump laser with a
maximum power of 5 W, which creates a typical broadband Raman gain in the
dispersion compensating fibre (DCF) with a maximum around 1555 nm (13.1 THz
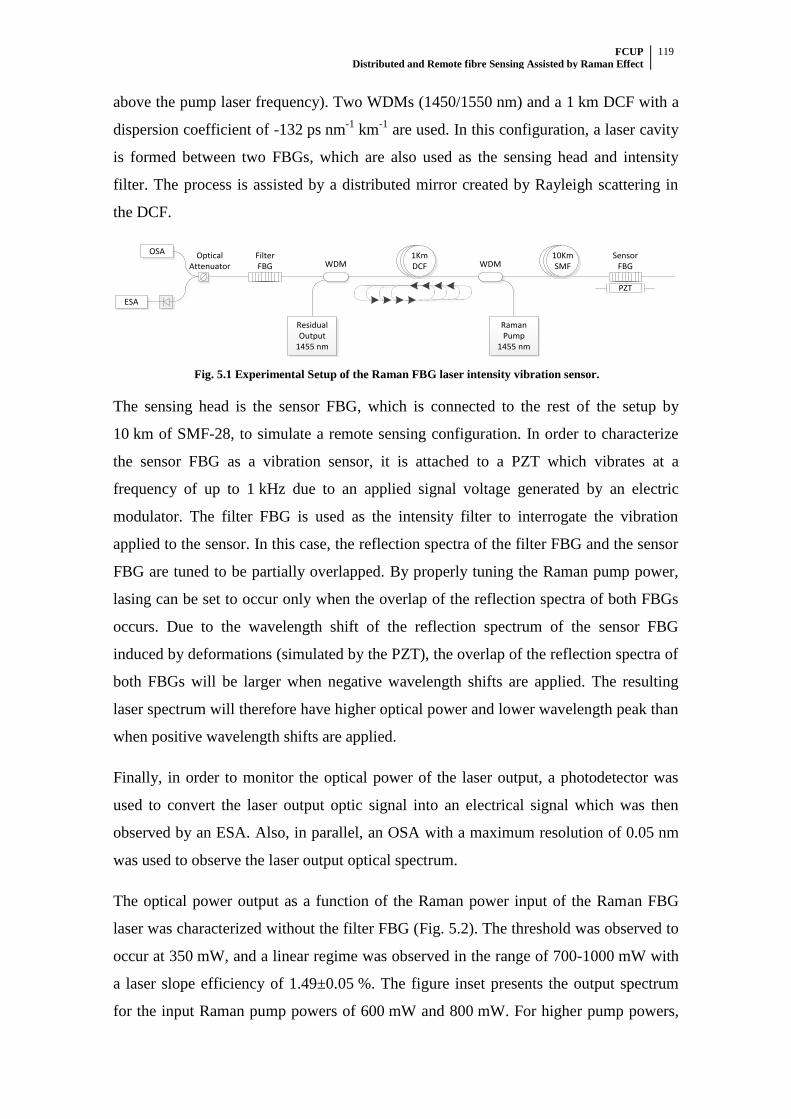
FCUP Distributed and Remote fibre Sensing Assisted by Raman Effect
119
above the pump laser frequency). Two WDMs (1450/1550 nm) and a 1 km DCF with a
dispersion coefficient of -132 ps nm-1
km-1
are used. In this configuration, a laser cavity
is formed between two FBGs, which are also used as the sensing head and intensity
filter. The process is assisted by a distributed mirror created by Rayleigh scattering in
the DCF.
1Km DCF
Raman Pump
1455 nm
10Km SMFWDM
Sensor FBG
Residual Output
1455 nm
WDMFilter FBG
Optical Attenuator
OSA
ESA
PZT
Fig. 5.1 Experimental Setup of the Raman FBG laser intensity vibration sensor.
The sensing head is the sensor FBG, which is connected to the rest of the setup by
10 km of SMF-28, to simulate a remote sensing configuration. In order to characterize
the sensor FBG as a vibration sensor, it is attached to a PZT which vibrates at a
frequency of up to 1 kHz due to an applied signal voltage generated by an electric
modulator. The filter FBG is used as the intensity filter to interrogate the vibration
applied to the sensor. In this case, the reflection spectra of the filter FBG and the sensor
FBG are tuned to be partially overlapped. By properly tuning the Raman pump power,
lasing can be set to occur only when the overlap of the reflection spectra of both FBGs
occurs. Due to the wavelength shift of the reflection spectrum of the sensor FBG
induced by deformations (simulated by the PZT), the overlap of the reflection spectra of
both FBGs will be larger when negative wavelength shifts are applied. The resulting
laser spectrum will therefore have higher optical power and lower wavelength peak than
when positive wavelength shifts are applied.
Finally, in order to monitor the optical power of the laser output, a photodetector was
used to convert the laser output optic signal into an electrical signal which was then
observed by an ESA. Also, in parallel, an OSA with a maximum resolution of 0.05 nm
was used to observe the laser output optical spectrum.
The optical power output as a function of the Raman power input of the Raman FBG
laser was characterized without the filter FBG (Fig. 5.2). The threshold was observed to
occur at 350 mW, and a linear regime was observed in the range of 700-1000 mW with
a laser slope efficiency of 1.49±0.05 %. The figure inset presents the output spectrum
for the input Raman pump powers of 600 mW and 800 mW. For higher pump powers,
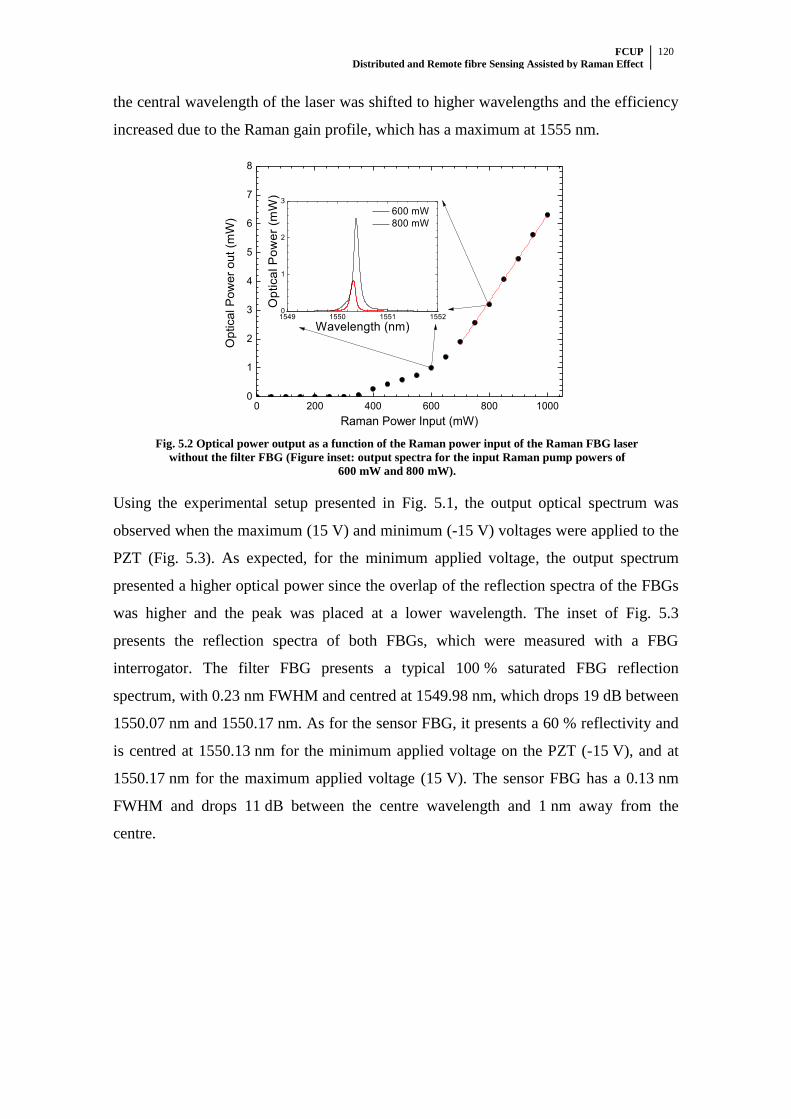
FCUP Distributed and Remote fibre Sensing Assisted by Raman Effect
120
the central wavelength of the laser was shifted to higher wavelengths and the efficiency
increased due to the Raman gain profile, which has a maximum at 1555 nm.
0 200 400 600 800 10000
1
2
3
4
5
6
7
8
1549 1550 1551 15520
1
2
3
Op
tica
l P
ow
er
(mW
)
Wavelength (nm)
600 mW
800 mW
Optical P
ow
er
out
(mW
)
Raman Power Input (mW)
Fig. 5.2 Optical power output as a function of the Raman power input of the Raman FBG laser
without the filter FBG (Figure inset: output spectra for the input Raman pump powers of
600 mW and 800 mW).
Using the experimental setup presented in Fig. 5.1, the output optical spectrum was
observed when the maximum (15 V) and minimum (-15 V) voltages were applied to the
PZT (Fig. 5.3). As expected, for the minimum applied voltage, the output spectrum
presented a higher optical power since the overlap of the reflection spectra of the FBGs
was higher and the peak was placed at a lower wavelength. The inset of Fig. 5.3
presents the reflection spectra of both FBGs, which were measured with a FBG
interrogator. The filter FBG presents a typical 100 % saturated FBG reflection
spectrum, with 0.23 nm FWHM and centred at 1549.98 nm, which drops 19 dB between
1550.07 nm and 1550.17 nm. As for the sensor FBG, it presents a 60 % reflectivity and
is centred at 1550.13 nm for the minimum applied voltage on the PZT (-15 V), and at
1550.17 nm for the maximum applied voltage (15 V). The sensor FBG has a 0.13 nm
FWHM and drops 11 dB between the centre wavelength and 1 nm away from the
centre.
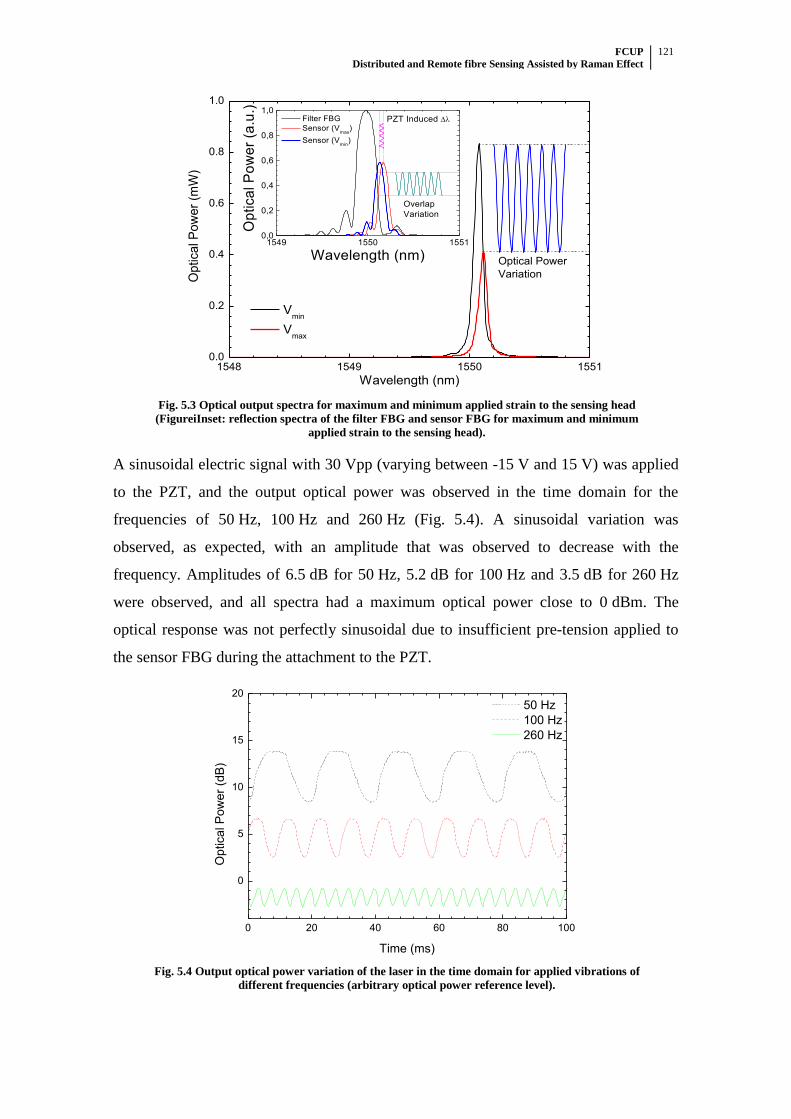
FCUP Distributed and Remote fibre Sensing Assisted by Raman Effect
121
1548 1549 1550 15510.0
0.2
0.4
0.6
0.8
1.0
1549 1550 15510,0
0,2
0,4
0,6
0,8
1,0
Overlap
Variation
Op
tica
l P
ow
er
(a.u
.)Wavelength (nm)
Filter FBG
Sensor (Vmax
)
Sensor (Vmin
)
PZT Induced
Optical P
ow
er
(mW
)
Wavelength (nm)
Vmin
Vmax
Optical Power
Variation
Fig. 5.3 Optical output spectra for maximum and minimum applied strain to the sensing head
(FigureiInset: reflection spectra of the filter FBG and sensor FBG for maximum and minimum
applied strain to the sensing head).
A sinusoidal electric signal with 30 Vpp (varying between -15 V and 15 V) was applied
to the PZT, and the output optical power was observed in the time domain for the
frequencies of 50 Hz, 100 Hz and 260 Hz (Fig. 5.4). A sinusoidal variation was
observed, as expected, with an amplitude that was observed to decrease with the
frequency. Amplitudes of 6.5 dB for 50 Hz, 5.2 dB for 100 Hz and 3.5 dB for 260 Hz
were observed, and all spectra had a maximum optical power close to 0 dBm. The
optical response was not perfectly sinusoidal due to insufficient pre-tension applied to
the sensor FBG during the attachment to the PZT.
0 20 40 60 80 100
0
5
10
15
20
50 Hz
100 Hz
260 Hz
Optical P
ow
er
(dB
)
Time (ms)
Fig. 5.4 Output optical power variation of the laser in the time domain for applied vibrations of
different frequencies (arbitrary optical power reference level).
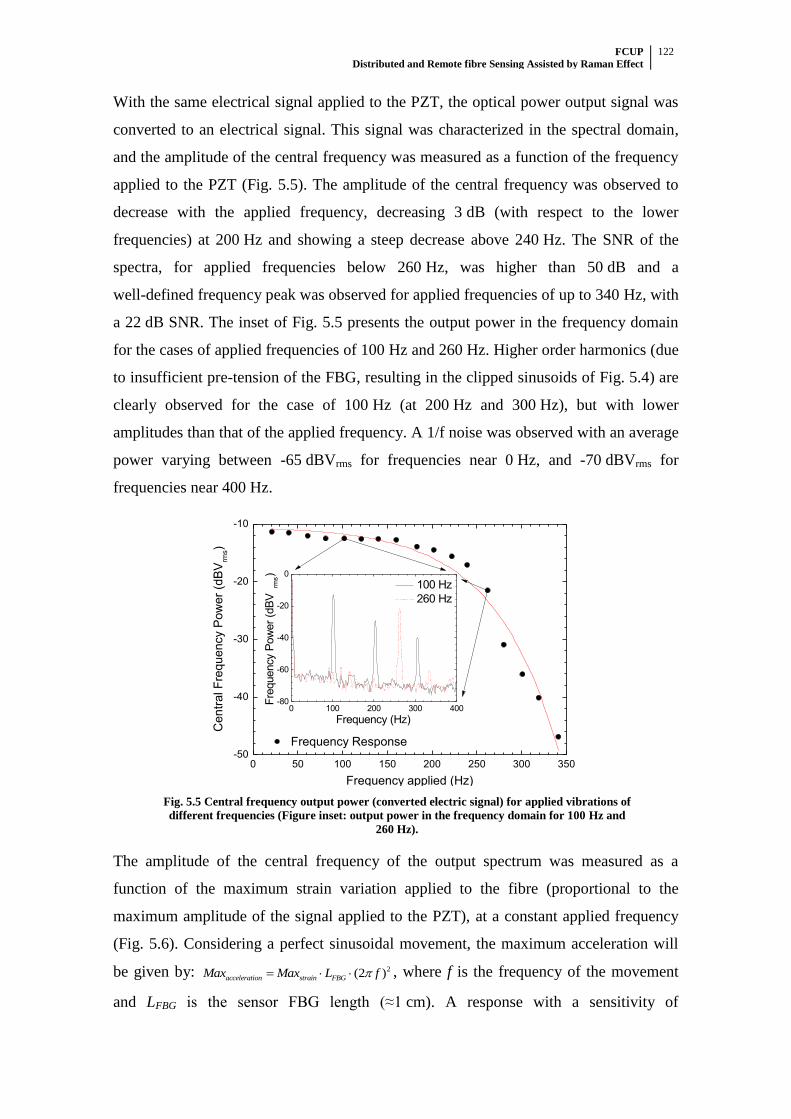
FCUP Distributed and Remote fibre Sensing Assisted by Raman Effect
122
With the same electrical signal applied to the PZT, the optical power output signal was
converted to an electrical signal. This signal was characterized in the spectral domain,
and the amplitude of the central frequency was measured as a function of the frequency
applied to the PZT (Fig. 5.5). The amplitude of the central frequency was observed to
decrease with the applied frequency, decreasing 3 dB (with respect to the lower
frequencies) at 200 Hz and showing a steep decrease above 240 Hz. The SNR of the
spectra, for applied frequencies below 260 Hz, was higher than 50 dB and a
well-defined frequency peak was observed for applied frequencies of up to 340 Hz, with
a 22 dB SNR. The inset of Fig. 5.5 presents the output power in the frequency domain
for the cases of applied frequencies of 100 Hz and 260 Hz. Higher order harmonics (due
to insufficient pre-tension of the FBG, resulting in the clipped sinusoids of Fig. 5.4) are
clearly observed for the case of 100 Hz (at 200 Hz and 300 Hz), but with lower
amplitudes than that of the applied frequency. A 1/f noise was observed with an average
power varying between -65 dBVrms for frequencies near 0 Hz, and -70 dBVrms for
frequencies near 400 Hz.
0 50 100 150 200 250 300 350-50
-40
-30
-20
-10
0 100 200 300 400-80
-60
-40
-20
0
Fre
quency P
ow
er
(dB
Vrm
s)
Frequency (Hz)
100 Hz
260 Hz
Centr
al F
requency P
ow
er
(dB
Vrm
s)
Frequency applied (Hz)
Frequency Response
Fig. 5.5 Central frequency output power (converted electric signal) for applied vibrations of
different frequencies (Figure inset: output power in the frequency domain for 100 Hz and
260 Hz).
The amplitude of the central frequency of the output spectrum was measured as a
function of the maximum strain variation applied to the fibre (proportional to the
maximum amplitude of the signal applied to the PZT), at a constant applied frequency
(Fig. 5.6). Considering a perfect sinusoidal movement, the maximum acceleration will
be given by: 2(2 )acceleration strain FBGMax Max L f , where f is the frequency of the movement
and LFBG is the sensor FBG length (≈1 cm). A response with a sensitivity of
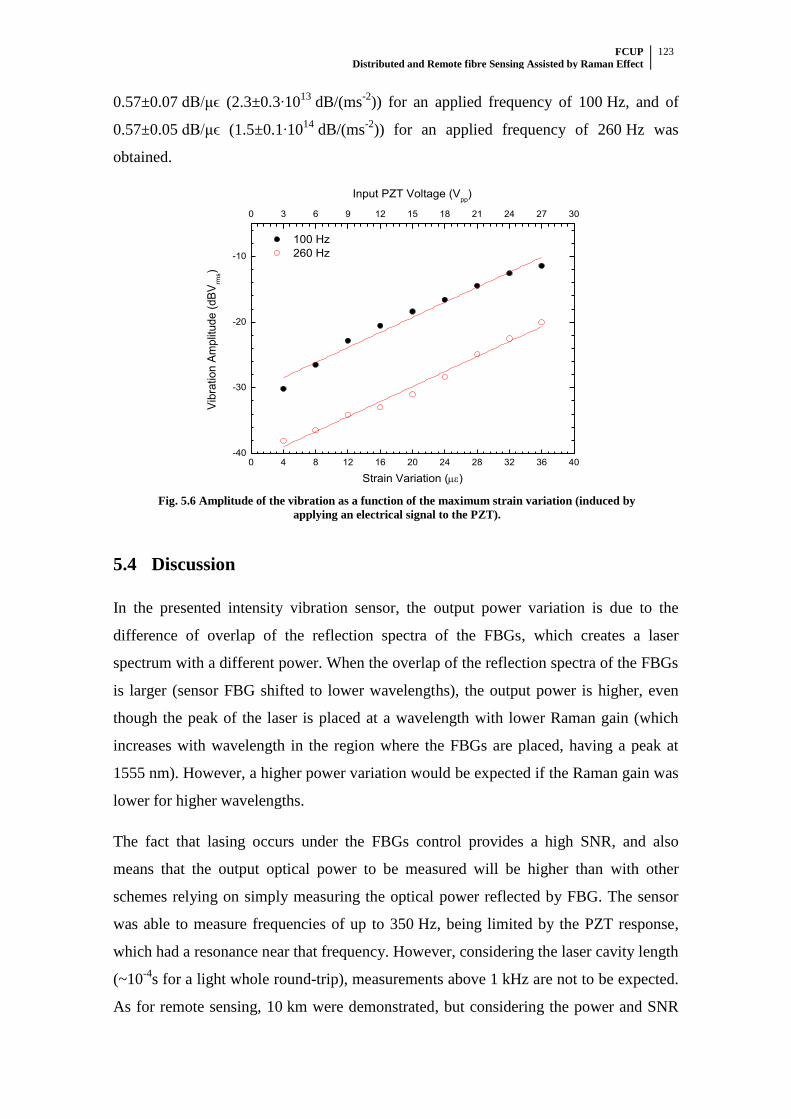
FCUP Distributed and Remote fibre Sensing Assisted by Raman Effect
123
0.57±0.07 dB/μϵ (2.3±0.3∙1013
dB/(ms-2
)) for an applied frequency of 100 Hz, and of
0.57±0.05 dB/μϵ (1.5±0.1∙1014
dB/(ms-2
)) for an applied frequency of 260 Hz was
obtained.
0 4 8 12 16 20 24 28 32 36 40-40
-30
-20
-10
Input PZT Voltage (Vpp
)
Vib
ration A
mplit
ude (
dB
Vrm
s)
Strain Variation ()
100 Hz
260 Hz
0 3 6 9 12 15 18 21 24 27 30
Fig. 5.6 Amplitude of the vibration as a function of the maximum strain variation (induced by
applying an electrical signal to the PZT).
5.4 Discussion
In the presented intensity vibration sensor, the output power variation is due to the
difference of overlap of the reflection spectra of the FBGs, which creates a laser
spectrum with a different power. When the overlap of the reflection spectra of the FBGs
is larger (sensor FBG shifted to lower wavelengths), the output power is higher, even
though the peak of the laser is placed at a wavelength with lower Raman gain (which
increases with wavelength in the region where the FBGs are placed, having a peak at
1555 nm). However, a higher power variation would be expected if the Raman gain was
lower for higher wavelengths.
The fact that lasing occurs under the FBGs control provides a high SNR, and also
means that the output optical power to be measured will be higher than with other
schemes relying on simply measuring the optical power reflected by FBG. The sensor
was able to measure frequencies of up to 350 Hz, being limited by the PZT response,
which had a resonance near that frequency. However, considering the laser cavity length
(~10-4
s for a light whole round-trip), measurements above 1 kHz are not to be expected.
As for remote sensing, 10 km were demonstrated, but considering the power and SNR
FCUP Distributed and Remote fibre Sensing Assisted by Raman Effect
124
of the output signal, no problems are envisaged for distances of up to 100 km, although
a maximum detectable frequency bandwidth decrease would be expected.
Temperature variations in the sensing head will shift the reflection spectra of the sensor
FBG and could, in principle, interfere with the vibration measurement. In a typical case,
however, the temperature variations will be much slower than the strain variations of the
vibration to be detected. Therefore, the temperature variations will not affect the
vibration measurements, if the temperature difference between the two FBGs is not too
high (~20ºC), in which case the reflection spectra of the FBGs would no longer overlap
and vibration measurements would no longer be possible.
5.5 Conclusions
To our knowledge, the use of a Raman FBG laser for an intensity vibration sensor is
reported for the first time. When vibrations were applied to the sensing head, a
sinusoidal variation of the output power of the Raman fibre laser was observed with
maximum optical output power of 0 dBm and maximum amplitude of 6.5 dB. The
sensor was able to measure vibrations with frequencies of up to 350 Hz and also the
amplitude of the vibrations with a sensitivity of up to 0.57±0.07 dB/μϵ
(2.3±0.3∙1013
dB/(ms-2
) for 100 Hz), for vibrations with a maximum strain variation of
up to 35 μϵ (maximum acceleration of up to 9∙10-13
ms-2
for 100 Hz). The frequency
spectra were observed to have a SNR higher than 50 dBVrms for frequencies below
250 Hz. Remote sensing at a distance of 10 km was simulated, but no problems are
envisaged for distances up to 100 km, although a maximum detectable frequency
bandwidth decrease would be expected.
The presented configuration allows for low cost interrogation of vibrations since the
measurand is an optical power variation, and high SNRs are achieved. The performance
of the sensor could be improved by using higher quality FBGs and a different Raman
gain profile.

FCUP Distributed and Remote fibre Sensing Assisted by Raman Effect
125
6 Other Contributions

FCUP Distributed and Remote fibre Sensing Assisted by Raman Effect
126
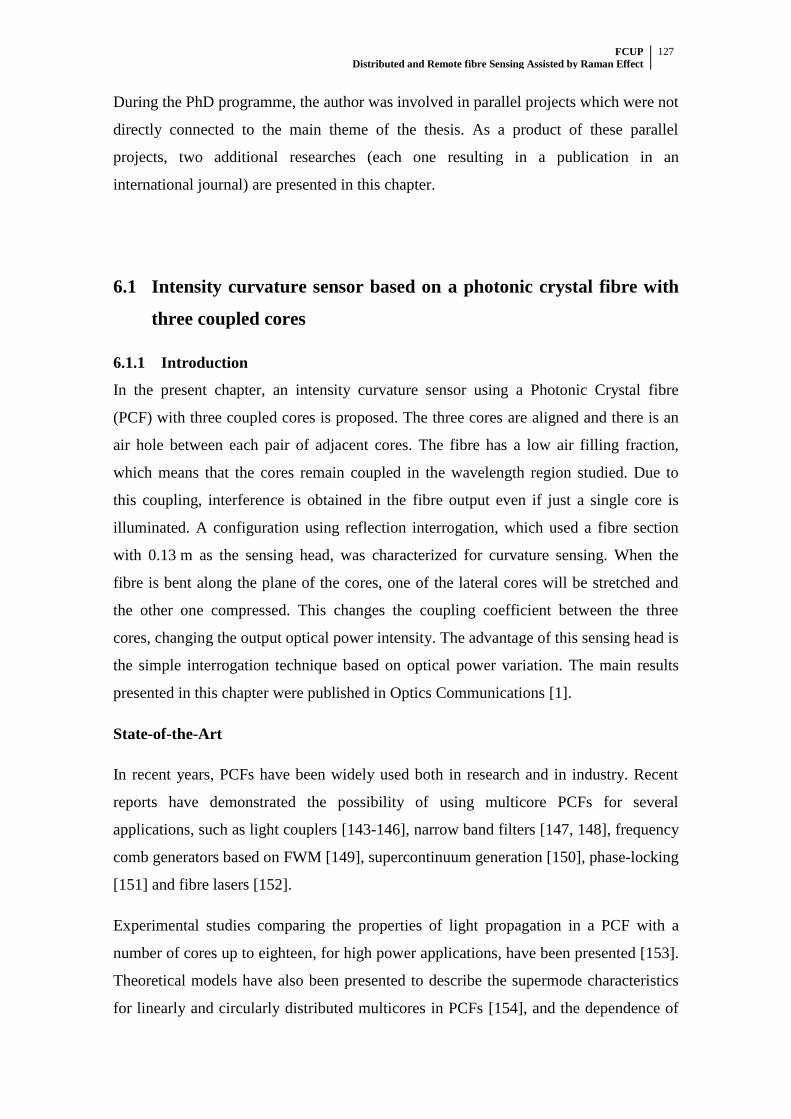
FCUP Distributed and Remote fibre Sensing Assisted by Raman Effect
127
During the PhD programme, the author was involved in parallel projects which were not
directly connected to the main theme of the thesis. As a product of these parallel
projects, two additional researches (each one resulting in a publication in an
international journal) are presented in this chapter.
6.1 Intensity curvature sensor based on a photonic crystal fibre with
three coupled cores
6.1.1 Introduction
In the present chapter, an intensity curvature sensor using a Photonic Crystal fibre
(PCF) with three coupled cores is proposed. The three cores are aligned and there is an
air hole between each pair of adjacent cores. The fibre has a low air filling fraction,
which means that the cores remain coupled in the wavelength region studied. Due to
this coupling, interference is obtained in the fibre output even if just a single core is
illuminated. A configuration using reflection interrogation, which used a fibre section
with 0.13 m as the sensing head, was characterized for curvature sensing. When the
fibre is bent along the plane of the cores, one of the lateral cores will be stretched and
the other one compressed. This changes the coupling coefficient between the three
cores, changing the output optical power intensity. The advantage of this sensing head is
the simple interrogation technique based on optical power variation. The main results
presented in this chapter were published in Optics Communications [1].
State-of-the-Art
In recent years, PCFs have been widely used both in research and in industry. Recent
reports have demonstrated the possibility of using multicore PCFs for several
applications, such as light couplers [143-146], narrow band filters [147, 148], frequency
comb generators based on FWM [149], supercontinuum generation [150], phase-locking
[151] and fibre lasers [152].
Experimental studies comparing the properties of light propagation in a PCF with a
number of cores up to eighteen, for high power applications, have been presented [153].
Theoretical models have also been presented to describe the supermode characteristics
for linearly and circularly distributed multicores in PCFs [154], and the dependence of
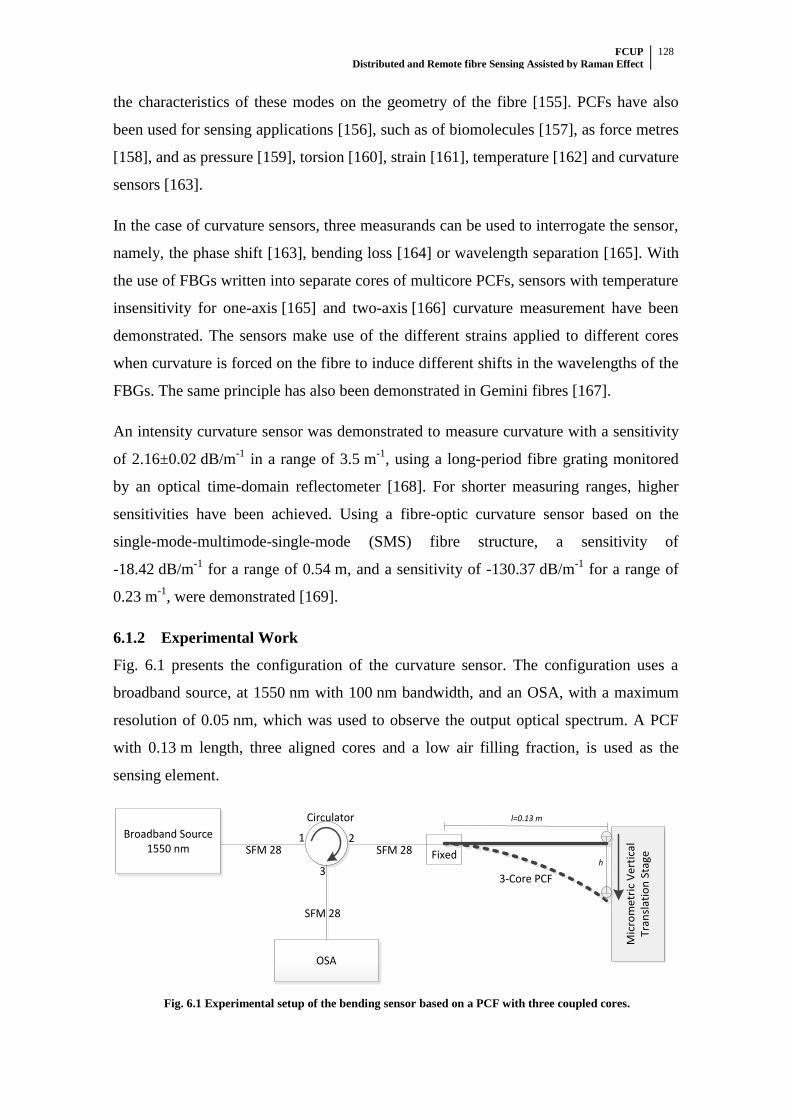
FCUP Distributed and Remote fibre Sensing Assisted by Raman Effect
128
the characteristics of these modes on the geometry of the fibre [155]. PCFs have also
been used for sensing applications [156], such as of biomolecules [157], as force metres
[158], and as pressure [159], torsion [160], strain [161], temperature [162] and curvature
sensors [163].
In the case of curvature sensors, three measurands can be used to interrogate the sensor,
namely, the phase shift [163], bending loss [164] or wavelength separation [165]. With
the use of FBGs written into separate cores of multicore PCFs, sensors with temperature
insensitivity for one-axis [165] and two-axis [166] curvature measurement have been
demonstrated. The sensors make use of the different strains applied to different cores
when curvature is forced on the fibre to induce different shifts in the wavelengths of the
FBGs. The same principle has also been demonstrated in Gemini fibres [167].
An intensity curvature sensor was demonstrated to measure curvature with a sensitivity
of 2.16±0.02 dB/m-1
in a range of 3.5 m-1
, using a long-period fibre grating monitored
by an optical time-domain reflectometer [168]. For shorter measuring ranges, higher
sensitivities have been achieved. Using a fibre-optic curvature sensor based on the
single-mode-multimode-single-mode (SMS) fibre structure, a sensitivity of
-18.42 dB/m-1
for a range of 0.54 m, and a sensitivity of -130.37 dB/m-1
for a range of
0.23 m-1
, were demonstrated [169].
6.1.2 Experimental Work
Fig. 6.1 presents the configuration of the curvature sensor. The configuration uses a
broadband source, at 1550 nm with 100 nm bandwidth, and an OSA, with a maximum
resolution of 0.05 nm, which was used to observe the output optical spectrum. A PCF
with 0.13 m length, three aligned cores and a low air filling fraction, is used as the
sensing element.
Broadband Source 1550 nm
OSA
Mic
rom
etr
ic V
ert
ical
T
ran
slat
ion
Sta
geFixed
1 2
3
Circulator
3-Core PCF
SFM 28 SFM 28
SFM 28
l=0.13 m
h
Fig. 6.1 Experimental setup of the bending sensor based on a PCF with three coupled cores.
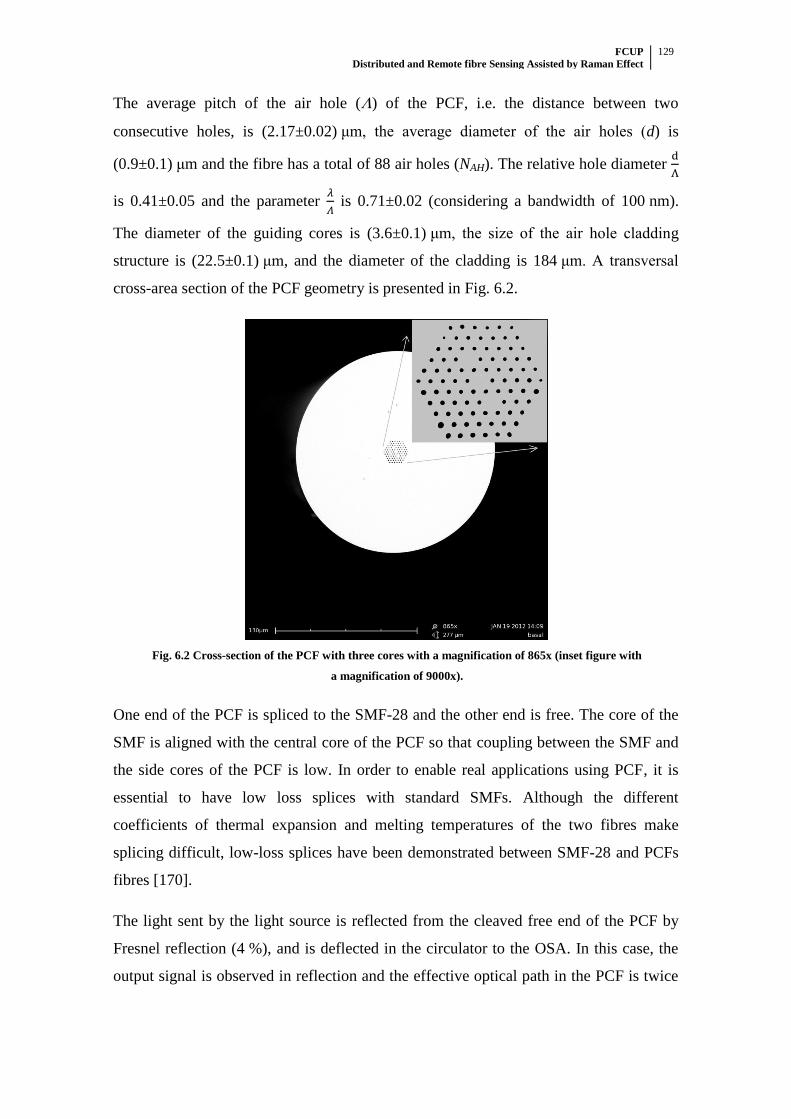
FCUP Distributed and Remote fibre Sensing Assisted by Raman Effect
129
The average pitch of the air hole () of the PCF, i.e. the distance between two
consecutive holes, is (2.17±0.02) μm, the average diameter of the air holes (d) is
(0.9±0.1) μm and the fibre has a total of 88 air holes (NAH). The relative hole diameter
is 0.41±0.05 and the parameter
is 0.71±0.02 (considering a bandwidth of 100 nm).
The diameter of the guiding cores is (3.6±0.1) μm, the size of the air hole cladding
structure is (22.5±0.1) μm, and the diameter of the cladding is 184 μm. A transversal
cross-area section of the PCF geometry is presented in Fig. 6.2.
Fig. 6.2 Cross-section of the PCF with three cores with a magnification of 865x (inset figure with
a magnification of 9000x).
One end of the PCF is spliced to the SMF-28 and the other end is free. The core of the
SMF is aligned with the central core of the PCF so that coupling between the SMF and
the side cores of the PCF is low. In order to enable real applications using PCF, it is
essential to have low loss splices with standard SMFs. Although the different
coefficients of thermal expansion and melting temperatures of the two fibres make
splicing difficult, low-loss splices have been demonstrated between SMF-28 and PCFs
fibres [170].
The light sent by the light source is reflected from the cleaved free end of the PCF by
Fresnel reflection (4 %), and is deflected in the circulator to the OSA. In this case, the
output signal is observed in reflection and the effective optical path in the PCF is twice
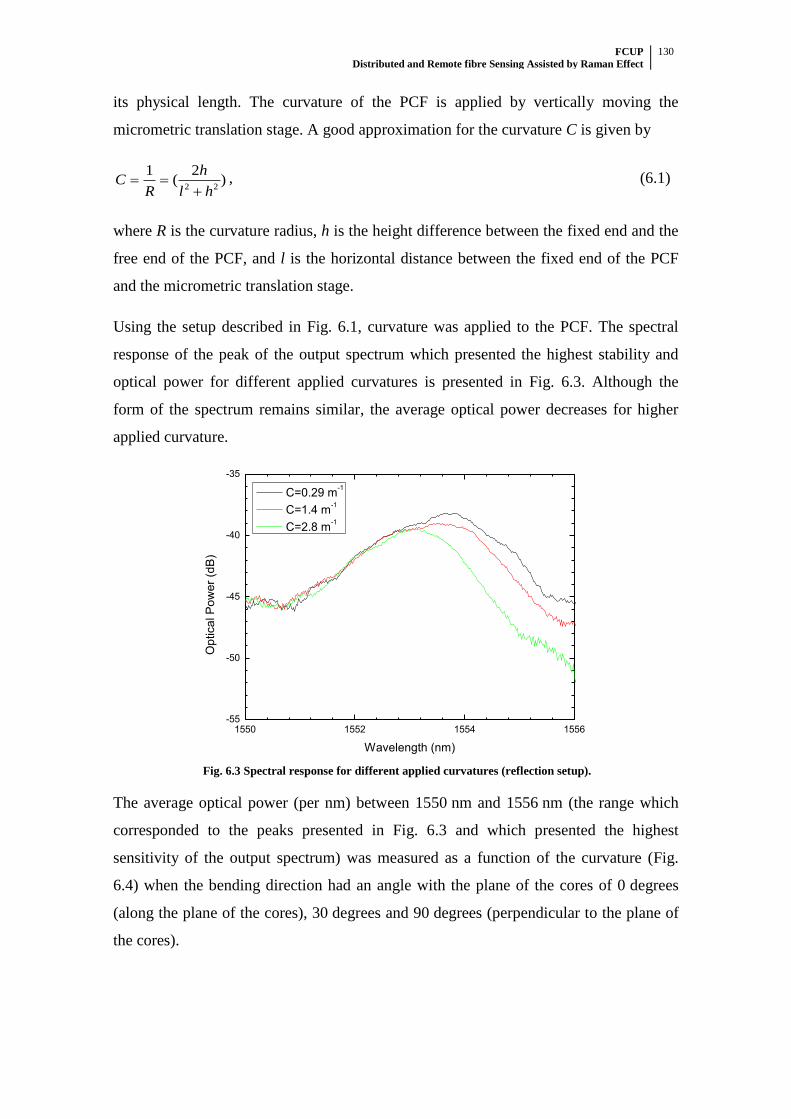
FCUP Distributed and Remote fibre Sensing Assisted by Raman Effect
130
its physical length. The curvature of the PCF is applied by vertically moving the
micrometric translation stage. A good approximation for the curvature C is given by
)2
(1
22 hl
h
RC
, (6.1)
where R is the curvature radius, h is the height difference between the fixed end and the
free end of the PCF, and l is the horizontal distance between the fixed end of the PCF
and the micrometric translation stage.
Using the setup described in Fig. 6.1, curvature was applied to the PCF. The spectral
response of the peak of the output spectrum which presented the highest stability and
optical power for different applied curvatures is presented in Fig. 6.3. Although the
form of the spectrum remains similar, the average optical power decreases for higher
applied curvature.
1550 1552 1554 1556-55
-50
-45
-40
-35
Op
tica
l P
ow
er
(dB
)
Wavelength (nm)
C=0.29 m-1
C=1.4 m-1
C=2.8 m-1
Fig. 6.3 Spectral response for different applied curvatures (reflection setup).
The average optical power (per nm) between 1550 nm and 1556 nm (the range which
corresponded to the peaks presented in Fig. 6.3 and which presented the highest
sensitivity of the output spectrum) was measured as a function of the curvature (Fig.
6.4) when the bending direction had an angle with the plane of the cores of 0 degrees
(along the plane of the cores), 30 degrees and 90 degrees (perpendicular to the plane of
the cores).
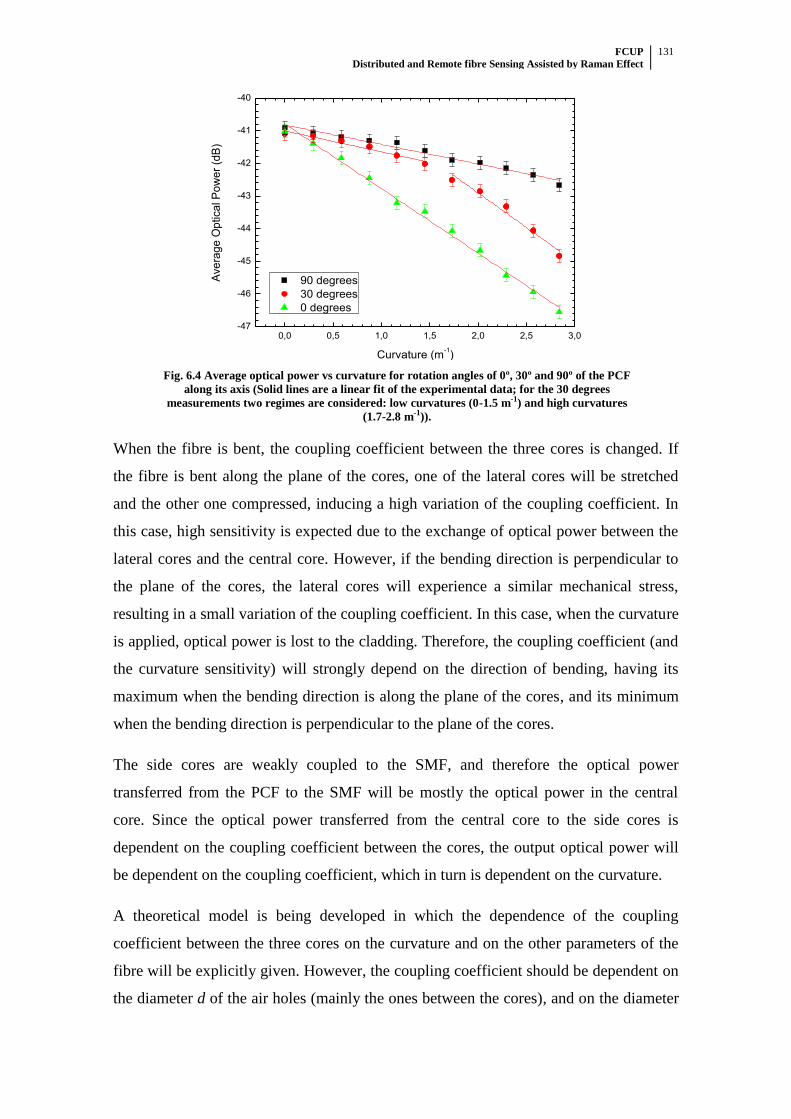
FCUP Distributed and Remote fibre Sensing Assisted by Raman Effect
131
0,0 0,5 1,0 1,5 2,0 2,5 3,0-47
-46
-45
-44
-43
-42
-41
-40
Ave
rag
e O
ptica
l P
ow
er
(dB
)
Curvature (m-1)
90 degrees
30 degrees
0 degrees
Fig. 6.4 Average optical power vs curvature for rotation angles of 0º, 30º and 90º of the PCF
along its axis (Solid lines are a linear fit of the experimental data; for the 30 degrees
measurements two regimes are considered: low curvatures (0-1.5 m-1) and high curvatures
(1.7-2.8 m-1)).
When the fibre is bent, the coupling coefficient between the three cores is changed. If
the fibre is bent along the plane of the cores, one of the lateral cores will be stretched
and the other one compressed, inducing a high variation of the coupling coefficient. In
this case, high sensitivity is expected due to the exchange of optical power between the
lateral cores and the central core. However, if the bending direction is perpendicular to
the plane of the cores, the lateral cores will experience a similar mechanical stress,
resulting in a small variation of the coupling coefficient. In this case, when the curvature
is applied, optical power is lost to the cladding. Therefore, the coupling coefficient (and
the curvature sensitivity) will strongly depend on the direction of bending, having its
maximum when the bending direction is along the plane of the cores, and its minimum
when the bending direction is perpendicular to the plane of the cores.
The side cores are weakly coupled to the SMF, and therefore the optical power
transferred from the PCF to the SMF will be mostly the optical power in the central
core. Since the optical power transferred from the central core to the side cores is
dependent on the coupling coefficient between the cores, the output optical power will
be dependent on the coupling coefficient, which in turn is dependent on the curvature.
A theoretical model is being developed in which the dependence of the coupling
coefficient between the three cores on the curvature and on the other parameters of the
fibre will be explicitly given. However, the coupling coefficient should be dependent on
the diameter d of the air holes (mainly the ones between the cores), and on the diameter
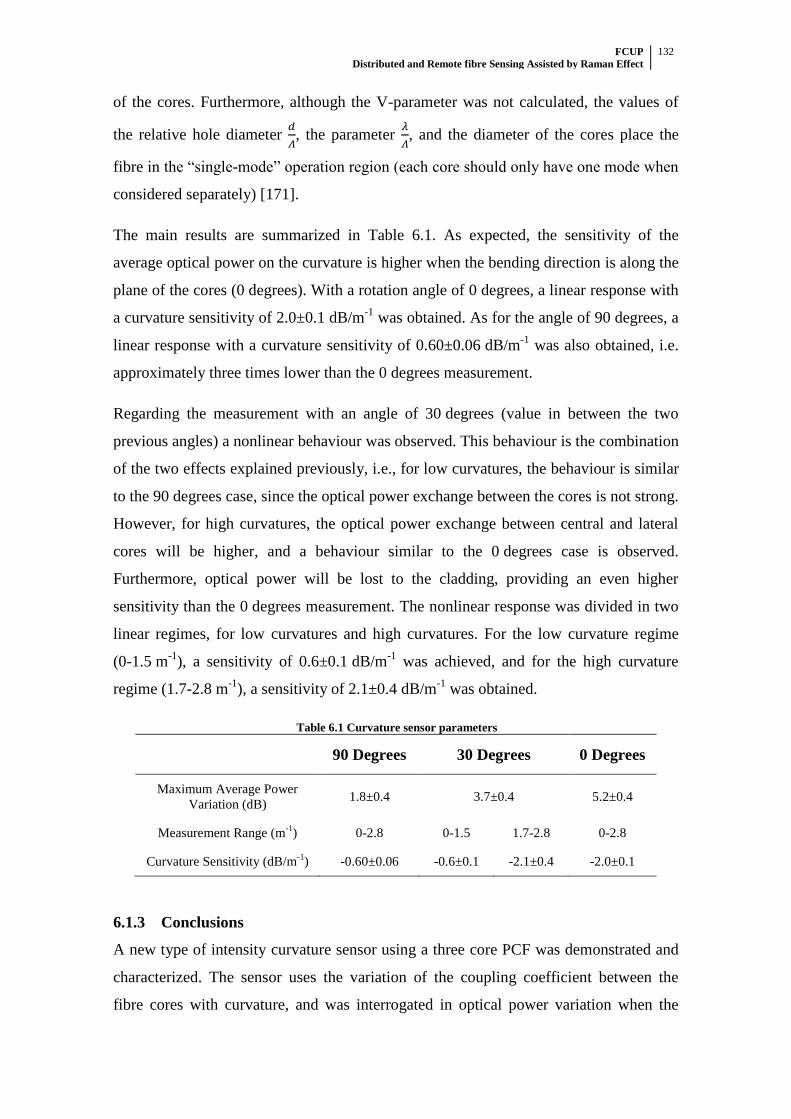
FCUP Distributed and Remote fibre Sensing Assisted by Raman Effect
132
of the cores. Furthermore, although the V-parameter was not calculated, the values of
the relative hole diameter
, the parameter
, and the diameter of the cores place the
fibre in the “single-mode” operation region (each core should only have one mode when
considered separately) [171].
The main results are summarized in Table 6.1. As expected, the sensitivity of the
average optical power on the curvature is higher when the bending direction is along the
plane of the cores (0 degrees). With a rotation angle of 0 degrees, a linear response with
a curvature sensitivity of 2.0±0.1 dB/m-1
was obtained. As for the angle of 90 degrees, a
linear response with a curvature sensitivity of 0.60±0.06 dB/m-1
was also obtained, i.e.
approximately three times lower than the 0 degrees measurement.
Regarding the measurement with an angle of 30 degrees (value in between the two
previous angles) a nonlinear behaviour was observed. This behaviour is the combination
of the two effects explained previously, i.e., for low curvatures, the behaviour is similar
to the 90 degrees case, since the optical power exchange between the cores is not strong.
However, for high curvatures, the optical power exchange between central and lateral
cores will be higher, and a behaviour similar to the 0 degrees case is observed.
Furthermore, optical power will be lost to the cladding, providing an even higher
sensitivity than the 0 degrees measurement. The nonlinear response was divided in two
linear regimes, for low curvatures and high curvatures. For the low curvature regime
(0-1.5 m-1
), a sensitivity of 0.6±0.1 dB/m-1
was achieved, and for the high curvature
regime (1.7-2.8 m-1
), a sensitivity of 2.1±0.4 dB/m-1
was obtained.
Table 6.1 Curvature sensor parameters
90 Degrees 30 Degrees 0 Degrees
Maximum Average Power
Variation (dB) 1.8±0.4 3.7±0.4 5.2±0.4
Measurement Range (m-1
) 0-2.8 0-1.5 1.7-2.8 0-2.8
Curvature Sensitivity (dB/m-1
) -0.60±0.06 -0.6±0.1 -2.1±0.4 -2.0±0.1
6.1.3 Conclusions
A new type of intensity curvature sensor using a three core PCF was demonstrated and
characterized. The sensor uses the variation of the coupling coefficient between the
fibre cores with curvature, and was interrogated in optical power variation when the
FCUP Distributed and Remote fibre Sensing Assisted by Raman Effect
133
sensing head was subjected to curvature. Furthermore, the sensitivity can be tuned by
applying the curvature along different planes. A maximum curvature sensitivity of
2.0±0.1 dB/m-1
was obtained for a measurement range of 0-2.8 m-1
.
Although for shorter measurement ranges sensors with much higher sensitivities have
been demonstrated [169], the presented sensor has a similar sensitivity to other fibre
based intensity curvature sensors for similar measurement ranges [168]. Using
interferometric techniques, curvature sensors with a sensitivity up to an order of
magnitude higher than the presented sensor have been reported [165, 172]. This sensor,
however, is focused on providing a simpler interrogation scheme, and has also the
advantage of using a reflection interrogation scheme which is simpler to implement in
practical applications. Furthermore, the sensitivity of the presented sensor can be
increased while maintaining the simplicity of the interrogation scheme by increasing the
length of the PCF.
FCUP Distributed and Remote fibre Sensing Assisted by Raman Effect
134
6.2 High sensitivity dispersive Mach-Zehnder interferometer based
on a dissimilar-doping dual-core fibre for sensing applications
6.2.1 Introduction
In the work reported in the present chapter, a dual-core fibre, in which one of the cores
is doped with Germanium and the other one with Phosphorus, is used as an in-line MZ
dispersive interferometer. By ensuring equal lengths of the interferometer arms (the two
cores), but with different dispersion dependencies, high sensitivity strain and
temperature sensing were achieved. Opposite sensitivities for high and low wavelength
peaks were also demonstrated when strain and temperature were applied. To our
knowledge, this is the first time that such behaviour is demonstrated using this type of
in-line interferometer based on a dual-core fibre. The dispersive interferometer was
characterized in strain and temperature, and demonstrated to be an alternative solution
for high sensitivity measurement of these magnitudes. The main results presented in this
chapter were published in Optics Letters [6].
State-of-the-Art
Dual-core, or two-core fibres, were first proposed as strain sensors in 1981 [173]. These
types of fibres were also demonstrated as temperature sensors in 1983 [174]. With the
advent of microstructured fibres, several dual-core fibres were developed, such as
twin-core fibres with special air cladding [175], based on photonic band-gap fibres
[176, 177], and polymer fibres [178]. Hybrid dual-core fibres, where light is guided by
total internal reflection in one core and by band-gap guidance in the other, were also
proposed for wavelength-selective coupling [179]. More recently, another type of
microstructured dual-core fibre was developed: the suspended twin-core fibre. In this
case, the two cores appear to be suspended in large air holes by thin glass bridges [180].
All these configurations can be used for measurement of different parameters, such as
refractive index [177, 181, 182], or for biosensing [178]. Through the selective
infiltration of a single hole with fluid along a dual-core PCF, a record sensitivity for a
fibre device of 30100 nm per refractive index unit was demonstrated [182].
Usually, when the Mach-Zenhder interferometer is subjected to changes in a physical
parameter, the phase changes as the length or/and the refractive index is altered in one
of arms. The main advantage of using a single fibre with twin-cores is the stability of
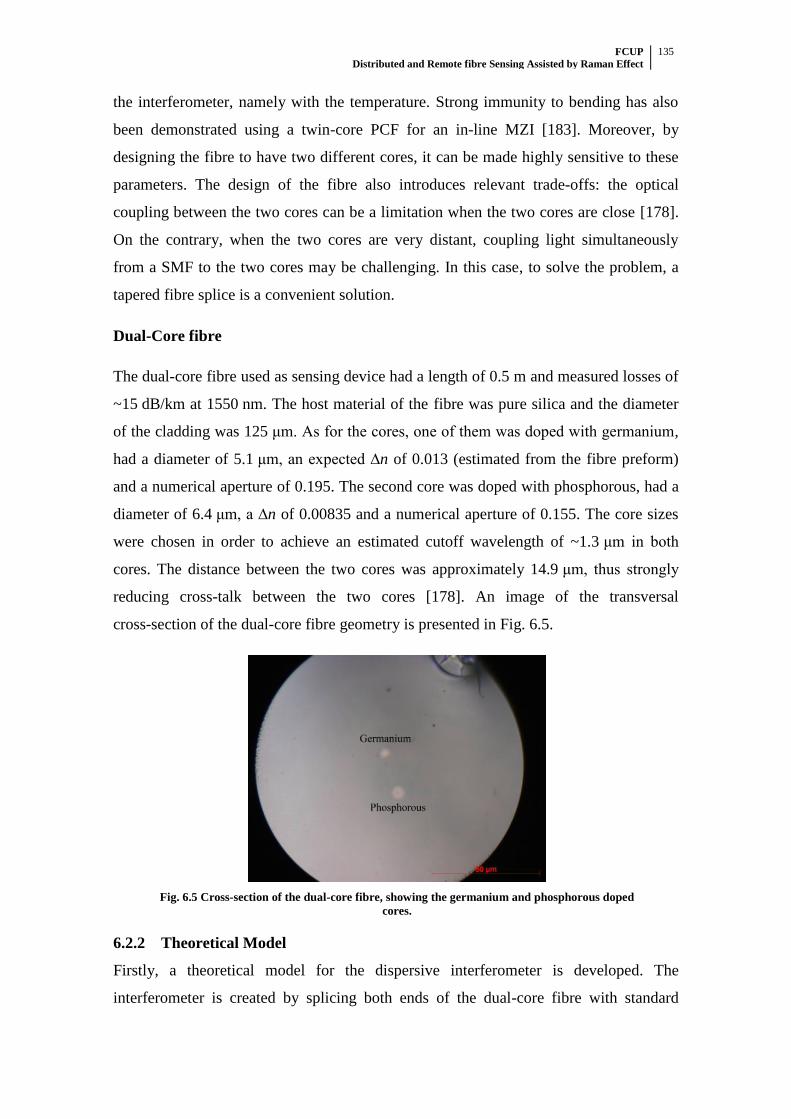
FCUP Distributed and Remote fibre Sensing Assisted by Raman Effect
135
the interferometer, namely with the temperature. Strong immunity to bending has also
been demonstrated using a twin-core PCF for an in-line MZI [183]. Moreover, by
designing the fibre to have two different cores, it can be made highly sensitive to these
parameters. The design of the fibre also introduces relevant trade-offs: the optical
coupling between the two cores can be a limitation when the two cores are close [178].
On the contrary, when the two cores are very distant, coupling light simultaneously
from a SMF to the two cores may be challenging. In this case, to solve the problem, a
tapered fibre splice is a convenient solution.
Dual-Core fibre
The dual-core fibre used as sensing device had a length of 0.5 m and measured losses of
~15 dB/km at 1550 nm. The host material of the fibre was pure silica and the diameter
of the cladding was 125 μm. As for the cores, one of them was doped with germanium,
had a diameter of 5.1 μm, an expected ∆n of 0.013 (estimated from the fibre preform)
and a numerical aperture of 0.195. The second core was doped with phosphorous, had a
diameter of 6.4 μm, a ∆n of 0.00835 and a numerical aperture of 0.155. The core sizes
were chosen in order to achieve an estimated cutoff wavelength of ~1.3 μm in both
cores. The distance between the two cores was approximately 14.9 μm, thus strongly
reducing cross-talk between the two cores [178]. An image of the transversal
cross-section of the dual-core fibre geometry is presented in Fig. 6.5.
Fig. 6.5 Cross-section of the dual-core fibre, showing the germanium and phosphorous doped
cores.
6.2.2 Theoretical Model
Firstly, a theoretical model for the dispersive interferometer is developed. The
interferometer is created by splicing both ends of the dual-core fibre with standard
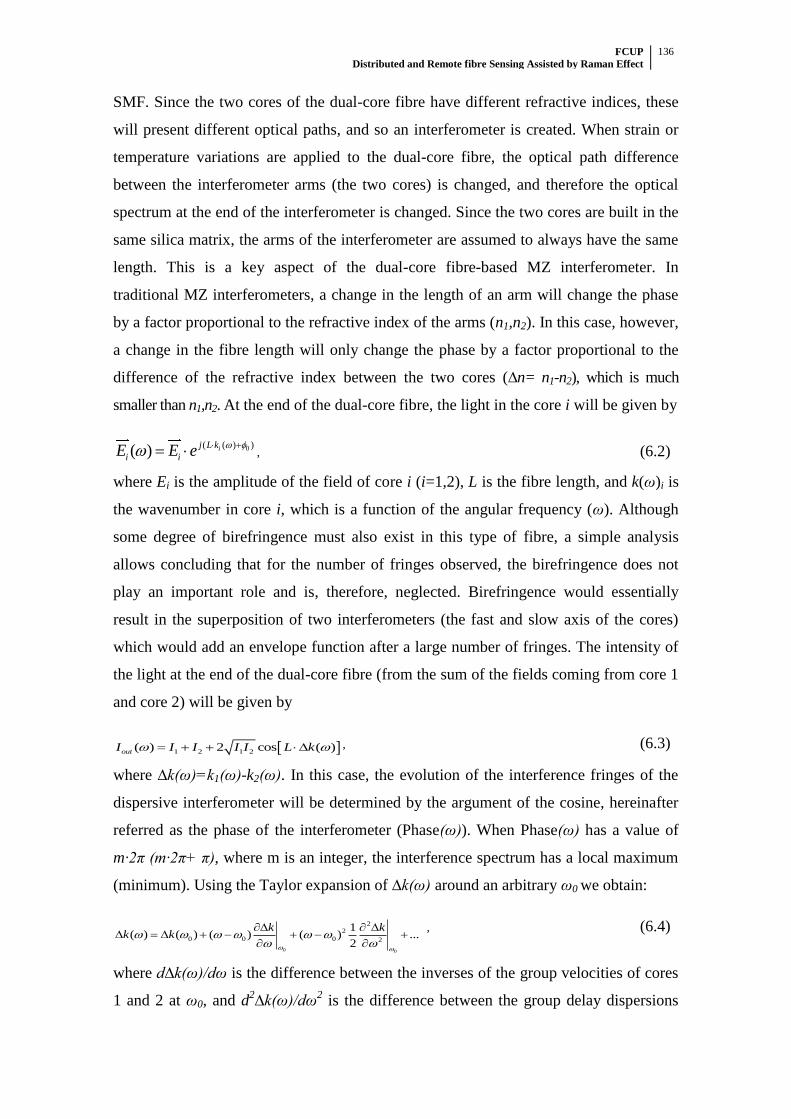
FCUP Distributed and Remote fibre Sensing Assisted by Raman Effect
136
SMF. Since the two cores of the dual-core fibre have different refractive indices, these
will present different optical paths, and so an interferometer is created. When strain or
temperature variations are applied to the dual-core fibre, the optical path difference
between the interferometer arms (the two cores) is changed, and therefore the optical
spectrum at the end of the interferometer is changed. Since the two cores are built in the
same silica matrix, the arms of the interferometer are assumed to always have the same
length. This is a key aspect of the dual-core fibre-based MZ interferometer. In
traditional MZ interferometers, a change in the length of an arm will change the phase
by a factor proportional to the refractive index of the arms (n1,n2). In this case, however,
a change in the fibre length will only change the phase by a factor proportional to the
difference of the refractive index between the two cores (∆n= n1-n2), which is much
smaller than n1,n2. At the end of the dual-core fibre, the light in the core i will be given by
0( ( ) )( ) ij L k
i iE E e
, (6.2)
where Ei is the amplitude of the field of core i (i=1,2), L is the fibre length, and k(ω)i is
the wavenumber in core i, which is a function of the angular frequency (ω). Although
some degree of birefringence must also exist in this type of fibre, a simple analysis
allows concluding that for the number of fringes observed, the birefringence does not
play an important role and is, therefore, neglected. Birefringence would essentially
result in the superposition of two interferometers (the fast and slow axis of the cores)
which would add an envelope function after a large number of fringes. The intensity of
the light at the end of the dual-core fibre (from the sum of the fields coming from core 1
and core 2) will be given by
1 2 1 2( ) 2 cos ( )outI I I I I L k , (6.3)
where ∆k(ω)=k1(ω)-k2(ω). In this case, the evolution of the interference fringes of the
dispersive interferometer will be determined by the argument of the cosine, hereinafter
referred as the phase of the interferometer (Phase(ω)). When Phase(ω) has a value of
m∙2π (m∙2π+ π), where m is an integer, the interference spectrum has a local maximum
(minimum). Using the Taylor expansion of ∆k(ω) around an arbitrary ω0 we obtain:
0 0
22
0 0 0 2
1( ) ( ) ( ) ( ) ...
2
k kk k
, (6.4)
where d∆k(ω)/dω is the difference between the inverses of the group velocities of cores
1 and 2 at ω0, and d2∆k(ω)/dω
2 is the difference between the group delay dispersions
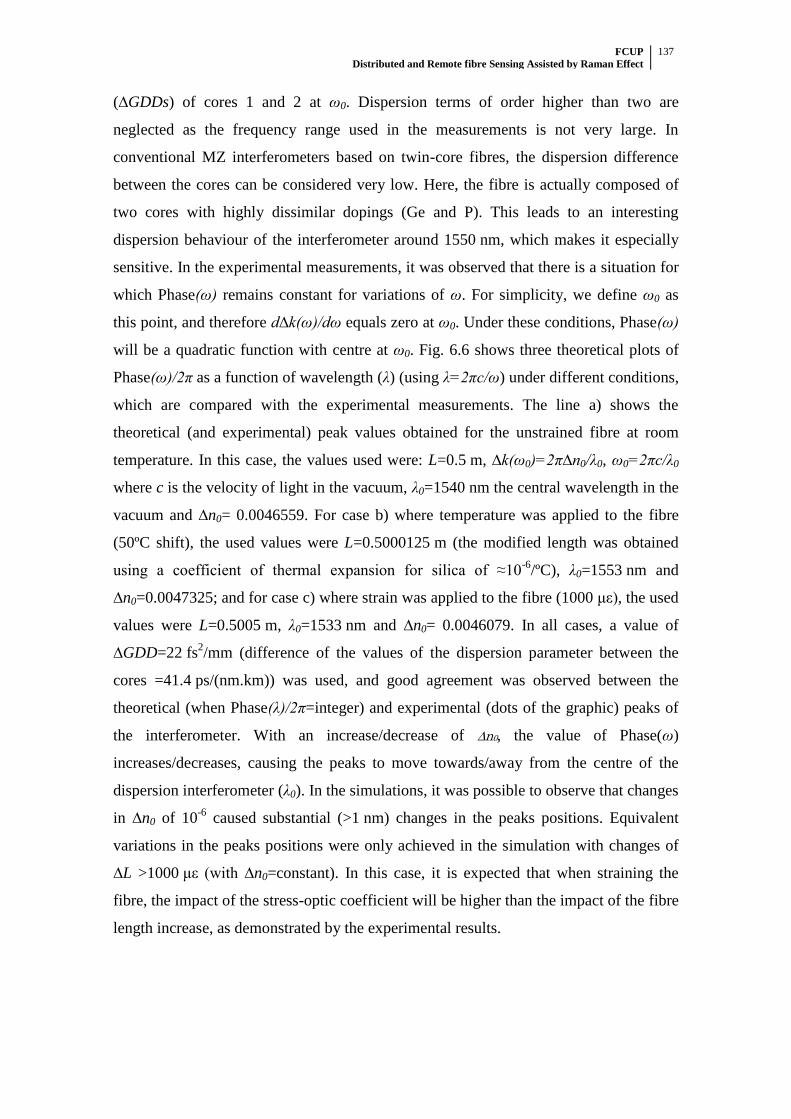
FCUP Distributed and Remote fibre Sensing Assisted by Raman Effect
137
(∆GDDs) of cores 1 and 2 at ω0. Dispersion terms of order higher than two are
neglected as the frequency range used in the measurements is not very large. In
conventional MZ interferometers based on twin-core fibres, the dispersion difference
between the cores can be considered very low. Here, the fibre is actually composed of
two cores with highly dissimilar dopings (Ge and P). This leads to an interesting
dispersion behaviour of the interferometer around 1550 nm, which makes it especially
sensitive. In the experimental measurements, it was observed that there is a situation for
which Phase(ω) remains constant for variations of ω. For simplicity, we define ω0 as
this point, and therefore d∆k(ω)/dω equals zero at ω0. Under these conditions, Phase(ω)
will be a quadratic function with centre at ω0. Fig. 6.6 shows three theoretical plots of
Phase(ω)/2π as a function of wavelength (λ) (using λ=2πc/ω) under different conditions,
which are compared with the experimental measurements. The line a) shows the
theoretical (and experimental) peak values obtained for the unstrained fibre at room
temperature. In this case, the values used were: L=0.5 m, ∆k(ω0)=2π∆n0/λ0, ω0=2πc/λ0
where c is the velocity of light in the vacuum, λ0=1540 nm the central wavelength in the
vacuum and ∆n0= 0.0046559. For case b) where temperature was applied to the fibre
(50ºC shift), the used values were L=0.5000125 m (the modified length was obtained
using a coefficient of thermal expansion for silica of ≈10-6
/ºC), λ0=1553 nm and
∆n0=0.0047325; and for case c) where strain was applied to the fibre (1000 με), the used
values were L=0.5005 m, λ0=1533 nm and ∆n0= 0.0046079. In all cases, a value of
∆GDD=22 fs2/mm (difference of the values of the dispersion parameter between the
cores =41.4 ps/(nm.km)) was used, and good agreement was observed between the
theoretical (when Phase(λ)/2π=integer) and experimental (dots of the graphic) peaks of
the interferometer. With an increase/decrease of ∆n0, the value of Phase(ω)
increases/decreases, causing the peaks to move towards/away from the centre of the
dispersion interferometer (λ0). In the simulations, it was possible to observe that changes
in ∆n0 of 10-6
caused substantial (>1 nm) changes in the peaks positions. Equivalent
variations in the peaks positions were only achieved in the simulation with changes of
∆L >1000 με (with ∆n0=constant). In this case, it is expected that when straining the
fibre, the impact of the stress-optic coefficient will be higher than the impact of the fibre
length increase, as demonstrated by the experimental results.
FCUP Distributed and Remote fibre Sensing Assisted by Raman Effect
138
1450 1500 1550 1600 1650
1505
1510
1515
1520
1525
1530b)
a)
Ph
ase
/ 2
Wavelength (nm)
a) Room temperature and unstrained
b) Temperature applied
c) Strain applied
c)
Fig. 6.6 Theoretical phase (the lines) of the interferometer as a function of the wavelength for a
fibre at a) Room temperature with no strain, b) temperature applied, c) strain applied. The
experimental peaks are also represented (dots). The values used in the simulation are presented
in the text.
6.2.3 Experimental Work
Fig. 6.7 presents the experimental configuration used to characterize the dispersion
interferometer based on a dual-core fibre as sensing element. The dispersive
interferometer is created by splicing both ends of the dual-core fibre with SMF. The
core of the SMF was placed between the two cores, thus minimizing the difference
between the amount of light coupled into each one of the cores, therefore increasing the
visibility. After the fusion splice, the fibre is tapered, reducing the diameter of the fibre
in the splice region to ≈60 μm (approximately half the initial size). This increases the
numerical aperture and, therefore, the coupling of light into both cores. Strain was
applied to the dual core fibre by fixing one end to a stationary stage and the other end to
a micrometric translation stage, which applied deformations at 13ºC. As for the
temperature measurements, they were performed with no strain applied to the dual-core
fibre. An erbium doped fibre amplifier (EDFA) was used to illuminate the dispersive
interferometer and an OSA, with a maximum resolution of 0.01 nm, was used to
interrogate it in transmission.
FCUP Distributed and Remote fibre Sensing Assisted by Raman Effect
139
OSA
Dual-Core Fiber(l=0.5m)
SFM-28SFM-28
Micrometric Translation
Stage
StationaryStage
BroadbandLigth
Source
Fig. 6.7 Experimental setup used to characterize the dual-core fibre as a strain and temperature
sensor.
Fig. 6.8 presents the transmission spectrum of the dispersive interferometer and the
respective wavelength shift for increasing applied strain (Fig. 6.8a) and temperature
(Fig. 6.8b). The characteristic dips of an interferometer out appear in the spectral
response, as expected. The spacing between the dips presents symmetry around a central
wavelength (at ≈1540 nm), and decreases when moving away from it. In terms of
sensitivity (both to strain and temperature), the interferometer peaks present opposite
response for wavelengths higher and lower than the central wavelength. These peaks
move symmetrically away/towards the centre for applied strain/temperature, as
predicted by the theoretical model. To our knowledge, this is the first time that this
effect is observed in this type of in-line interferometer based on a dual-core fibre. As
explained in the theoretical model, this is owed to a change in the sign of the derivative
of ∆k(ω). The visibility of the peaks seems to decrease when moving away from the
centre. This effect, however, is owed to the emission spectrum of the EDFA, which
transmits more light in the 1500-1600 nm range than in the rest of the observed range.
When observed with a broader light source, the peaks presented similar visibilities in a
higher range (at least 1400-1700 nm).
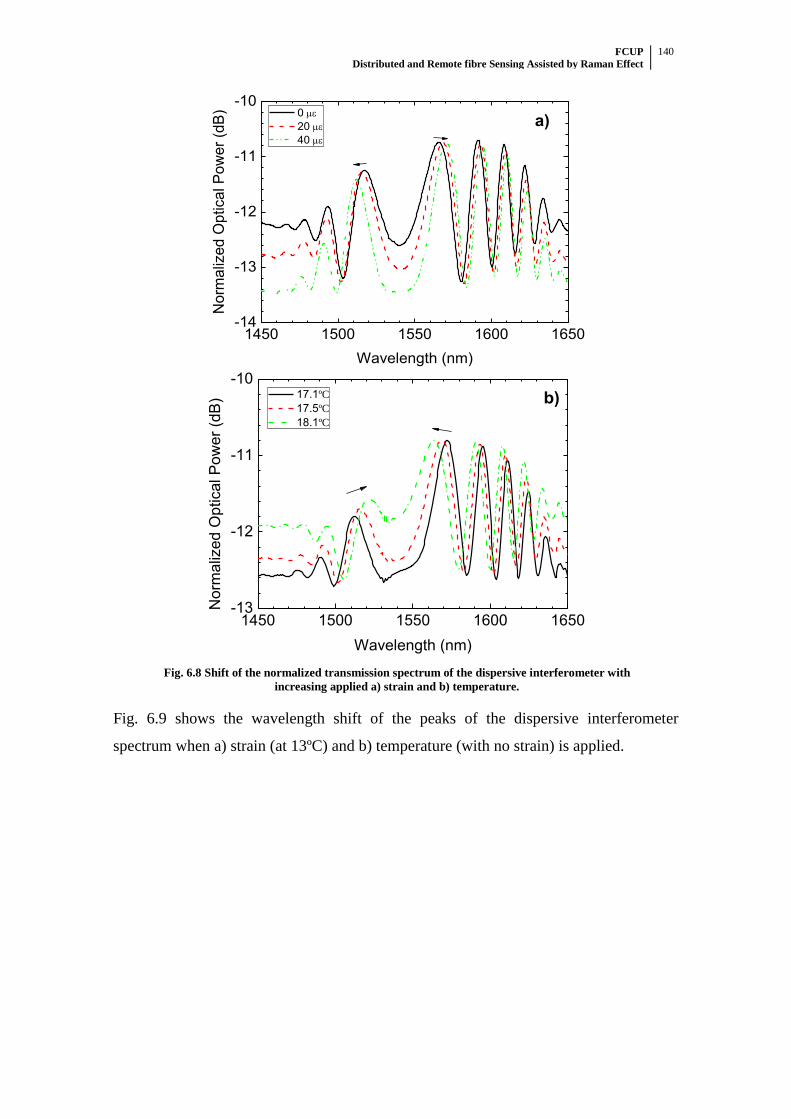
FCUP Distributed and Remote fibre Sensing Assisted by Raman Effect
140
1450 1500 1550 1600 1650-14
-13
-12
-11
-10
a)
No
rma
lize
d O
ptica
l P
ow
er
(dB
)
Wavelength (nm)
0
20
40
1450 1500 1550 1600 1650-13
-12
-11
-10
b)
No
rma
lize
d O
ptica
l P
ow
er
(dB
)
Wavelength (nm)
17.1ºC
17.5ºC
18.1ºC
Fig. 6.8 Shift of the normalized transmission spectrum of the dispersive interferometer with
increasing applied a) strain and b) temperature.
Fig. 6.9 shows the wavelength shift of the peaks of the dispersive interferometer
spectrum when a) strain (at 13ºC) and b) temperature (with no strain) is applied.
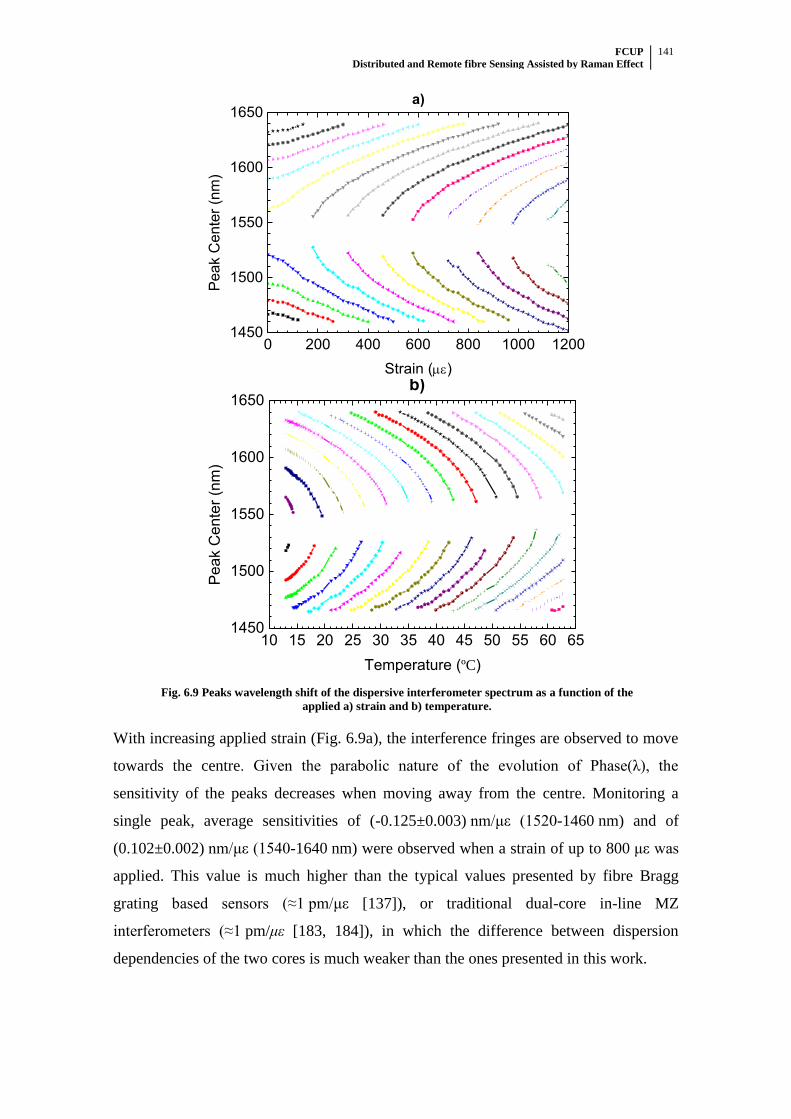
FCUP Distributed and Remote fibre Sensing Assisted by Raman Effect
141
0 200 400 600 800 1000 12001450
1500
1550
1600
1650a)
Pea
k C
ente
r (n
m)
Strain ()
10 15 20 25 30 35 40 45 50 55 60 651450
1500
1550
1600
1650b)
Pe
ak C
en
ter
(nm
)
Temperature (ºC)
Fig. 6.9 Peaks wavelength shift of the dispersive interferometer spectrum as a function of the
applied a) strain and b) temperature.
With increasing applied strain (Fig. 6.9a), the interference fringes are observed to move
towards the centre. Given the parabolic nature of the evolution of Phase(λ), the
sensitivity of the peaks decreases when moving away from the centre. Monitoring a
single peak, average sensitivities of (-0.125±0.003) nm/με (1520-1460 nm) and of
(0.102±0.002) nm/με (1540-1640 nm) were observed when a strain of up to 800 με was
applied. This value is much higher than the typical values presented by fibre Bragg
grating based sensors (≈1 pm/με [137]), or traditional dual-core in-line MZ
interferometers (≈1 pm/με [183, 184]), in which the difference between dispersion
dependencies of the two cores is much weaker than the ones presented in this work.

FCUP Distributed and Remote fibre Sensing Assisted by Raman Effect
142
As for the temperature measurements, with increasing applied temperature (Fig. 6.9b)
the interference fringes are observed to move away from the centre. Monitoring a single
peak, average sensitivities of (-4.0±0.1) nm/ºC (1640-1570 nm) and of (4.2±0.1) nm/ºC
(1460-1540 nm) were observed when the temperature was raised from 47ºC to 62ºC. In
this case, taking the resolution of the OSA (0.01 nm), resolutions of the experimental
setup of 0.002 με and of 0.08ºC can be estimated.
It is also important to point out that the centre of the spectrum (∆k(ω)=0) was observed
to shift ≈-7 nm from 1540 nm to 1533 nm, while maintaining the form of the
transmission spectrum, for an applied strain between 0-1000 με (Fig. 6.9a), and ≈13 nm
(from 1540 nm to 1553 nm) when the temperature was raised from 13ºC to 62ºC (Fig.
6.9b). This means that the dispersion curve was changed when applying
temperature/strain. This effect can be used to measure the value of the absolute
temperature/strain rather than only measuring variations of temperature/strain.
6.2.4 Conclusions
In conclusion, a new device concept for a highly sensitive MZ interferometer, based on
a dual-core fibre with dissimilar-doping, is described theoretically and experimentally.
By ensuring the same length in both arms of the interferometer (built in the same silica
matrix), the interferometer is only sensitive to the variations in differential dispersion
between the two cores, thus allowing high sensitivity strain and temperature sensing
with also a good robustness and even potential for absolute measurements.
A theoretical model was presented, showing good agreement with the experimental
results. Opposite sensitivities for wavelength peaks higher and lower than the central
wavelength of the interferometer were demonstrated when strain and temperature were
applied. To our knowledge, this is the first time that such behaviour is demonstrated
using this type of in-line interferometer based on a dual-core fibre. The effect is
demonstrated to be owed to a sign reversal in differential dispersion between the
wavenumbers of the core fields.
A sensitivity of (0.102±0.002) nm/με, between 0-800 με, and of (-4.0±0.2) nm/ºC
between 47-62ºC is demonstrated. The centre of the spectrum was observed to shift to
higher/lower wavelengths with applied temperature/strain, which allows the
measurement of absolute temperature/strain.

FCUP Distributed and Remote fibre Sensing Assisted by Raman Effect
143
7 Final Conclusions and Future Work

FCUP Distributed and Remote fibre Sensing Assisted by Raman Effect
144
FCUP Distributed and Remote fibre Sensing Assisted by Raman Effect
145
7.1 Final Conclusions
The results reported in this PhD thesis fulfill all the proposed objectives of the work
plan.
The use of phase-sensitive optical time domain reflectometry (ϕOTDR), and the effects
involved in its operation, were studied for both dynamic and static measurements. MI
was identified as the limiting nonlinear effect of the performance of a ϕOTDR under
normal operation conditions, and its impact on ϕOTDR operation was thoroughly
described, both theoretically and experimentally. For dynamic sensing, mainly
distributed vibration along optical fibres, three configurations were tested which
presented different trade-offs in their performances: ϕOTDR without amplification
(39.5 kHz over 1.25 km, 5 m resolution), assisted by first-order Raman amplification
(250/300 Hz over 125/110 km, 10 m resolution), and assisted by second-order Raman
amplification (380 Hz over 125 km, 10 m resolution). Apart from achieving frequency
measurements in the limits set by the time of flight of light using ϕOTDR without
amplification and assisted by second-order Raman amplification, to the best of our
knowledge, the presented results include records in ϕOTDR distributed vibration
sensing for the highest vibration frequency detected (39.5 kHz) and the largest sensing
range (125 km) at the time of publication of ref. [3] and [5], respectively. The noise was
carefully characterized and minimized in all configurations, and balanced detection was
demonstrated to greatly reduce the RIN, which is one of the main undesired effects
which arise with the use of Raman amplification.
As for static measurements, a technique based on the correlation of ϕOTDR
measurements at two orthogonal states of polarization was used to achieve high
sensitivity distributed measurement of birefringence over very long optical fibres
(PMFs and SMFs), with an ultimate accuracy of 10-7
for a spatial resolution of 2 m.
A new configuration for an intensity vibration sensor based on a Raman fibre laser was
demonstrated for remote point sensing. The sensor was able to measure vibrations with
frequencies of up to 350 Hz, and also the amplitude of the vibrations with a sensitivity
of up to 0.57±0.07 dB/μϵ (2.3±0.3∙1013
dB/(ms-2
) for 100 Hz) for vibrations with a
maximum strain variation of up to 35 μϵ.
FCUP Distributed and Remote fibre Sensing Assisted by Raman Effect
146
As a result of parallel projects which were not directly connected to the main theme of
the thesis, it was possible to test microstructured fibres for different applications. An
intensity curvature sensor, with a sensitivity of 2.0±0.1 dB/m-1
, based on a three core
PCF, and a high-sensitivity strain and temperature sensor with a sensitivity of
(0.102±0.002) nm/με, between 0-800 με, and of (-4.0±0.2) nm/ºC, based on a
dissimilar-doping dual-core fibre, were demonstrated.
7.2 Future Work
The following topics are proposed for further improvement of the work developed in the
PhD programme:
For distributed vibration sensing using ϕOTDR, given that the RIN was one of
the main limitations imposed by Raman amplification, the use of semiconductor
lasers (which present lower RIN figures than Raman fibre lasers) as pumps to
provide the amplification should be tested. The combination of first- and
second-order Raman amplification, which has been demonstrated to improve the
performance of Brillouin based systems, also presents an interesting possibility
to further improve the range of sensing. The use of post-processing denoising
was not addressed in this PhD programme, but could improve the performance
of the system. Lastly, once the detection of vibrations is clearly established, it is
then very important to interpret what these vibrations mean: the analyses of
signature patterns resultant from different perturbations (e.g. distinguish the
pattern of people walking from cars moving around the fibre) is of critical
importance when working towards practical applications.
Consolidate the work using ϕOTDR for distributed birefringence measurements
and test the limits of its performance, such as the maximum fibre length which
can be measured and the spatial resolution. The noise should be properly
characterized and the main limiting factors (which can be strongly dependent on
the type of fibre used) should be identified. More efficient ways to perform the
measurement can also be proposed: by using unpolarized light and correlating
the measured frequency sweep with itself, it may be possible to perform
measurements with a single frequency sweep, thus decreasing the measurement
time and increasing the stability of the system. After that, the possibility of using

FCUP Distributed and Remote fibre Sensing Assisted by Raman Effect
147
amplification to improve the range of the measurements can also be addressed.
A number of interesting applications based on this work can be proposed, such
as measurement of pressure or curvature.
Test the possibility of multiplexing using the setup of URFL for remote point
sensing.
Test the possibility of integrating microstructured fibres in distributed sensing.

FCUP Distributed and Remote fibre Sensing Assisted by Raman Effect
148

FCUP Distributed and Remote fibre Sensing Assisted by Raman Effect
149
References

FCUP Distributed and Remote fibre Sensing Assisted by Raman Effect
150

FCUP Distributed and Remote fibre Sensing Assisted by Raman Effect
151
References
1. Martins, H., et al., Intensity curvature sensor based on photonic crystal fiber
with three coupled cores. Optics Communications, 2012. 285(24): p. 5128-5131.
2. Martins, H.F., et al., Modulation instability-induced fading in phase-sensitive
optical time-domain reflectometry. Optics Letters, 2013. 38(6): p. 872-874.
3. Martins, H.F., et al., Coherent Noise Reduction in High Visibility Phase-
Sensitive Optical Time Domain Reflectometer for Distributed Sensing of
Ultrasonic Waves. Journal of Lightwave Technology, 2013. 31(23): p. 3631-
3637.
4. Martins, H.F., M.B. Marques, and O. Frazão, Intensity vibration sensor based on
Raman fiber laser using a distributed mirror combined with Bragg grating
structures. Applied Physics B, 2014. 114(4): p. 455-459.
5. Martins, H.F., et al., Phase-sensitive optical time domain reflectometer assisted
by first-order Raman amplification for distributed vibration sensing over
>100km. Journal of Lightwave Technology, 2014. 32(8): p. 1510-1518.
6. Martins, H.F., et al., High-sensitivity dispersive Mach -Zehnder interferometer
based on a dissimilar-doping dual-core fiber for sensing applications. Optics
Letters, 2014. 39(9): p. 2763-2766.
7. Boyd, R.W., Nonlinear Optics. Third ed2008: Academic Press.
8. Keck, D.B., R.D. Maurer, and P.C. Schultz, Ultimate Lower Limit of Attenuation
in Glass Optical Waveguides. Applied Physics Letters, 1973. 22(7): p. 307-309.
9. Agrawal, G.P., Nonlinear Fiber Optics. Third ed2001: Academic Press.
10. Paulo Sérgio, B.A., Componentes optoelectrónicos para redes fotónicas de alto
débito, in Physics Department2002, University of Aveiro.
11. Cohen, L.G., C. Lin, and W.G. French, Tailoring Zero Chromatic Dispersion
into the 1.5-1.6 Mu-M Low-Loss Spectral Region of Single-Mode Fibers.
Electronics Letters, 1979. 15(12): p. 334-335.
12. Kaminow, I.P., Polarization in Optical Fibers. Ieee Journal of Quantum
Electronics, 1981. 17(1): p. 15-22.
13. Wikipedia. http://en.wikipedia.org/wiki/Polarization-maintaining_optical_fiber.
accessed in 01/03/2014].
14. Maier, R.R.J., et al., Distributed sensing using Rayleigh scatter in polarization-
maintaining fibres for transverse load sensing. Measurement Science &
Technology, 2010. 21(9).
15. Tai, K., A. Hasegawa, and A. Tomita, Observation of Modulational Instability
in Optical Fibers. Physical Review Letters, 1986. 56(2): p. 135-138.
16. Alasia, D., et al., Detrimental effect of modulation instability on distributed
optical fibre sensors using stimulated Brillouin scattering. 17th International
Conference on Optical Fibre Sensors, Pts 1 and 2, 2005. 5855: p. 587-590.
17. Agrawal, G.P., Nonlinear Fiber Optics, 2001, Academic Press. p. 136-140.
18. Orlando José dos Reis, F., Sensores em Fibra Óptica Baseados em
Interferometria e Efeitos Não-Lineares, in Physics Department2009, University
of Porto.
19. Islam, M.N., Raman Amplifiers for Telecommunications I - Physical Principles.
Springer Series in Optical Sciences, 2004: Springer-Velag.
20. Dakin, J.P., et al., Distributed Optical Fiber Raman Temperature Sensor Using
a Semiconductor Light-Source and Detector. Electronics Letters, 1985. 21(13):
p. 569-570.
FCUP Distributed and Remote fibre Sensing Assisted by Raman Effect
152
21. Eckhardt, G., et al., Stimulated Raman Scattering from Organic Liquids.
Physical Review Letters, 1962. 9(11): p. 455-&.
22. Ania-Castanon, J.D., et al., Ultralong raman fiber lasers as virtually lossless
optical media. Physical Review Letters, 2006. 96(2): p. -.
23. Rodriguez-Barrios, F., et al., Distributed Brillouin Fiber Sensor Assisted by
First-Order Raman Amplification. Lightwave Technology, Journal of, 2010.
28(15): p. 2162-2172.
24. Shimizu, K., T. Horiguchi, and Y. Koyamada, Characteristics and Reduction of
Coherent Fading Noise in Rayleigh Backscattering Measurement for Optical
Fibers and Components. Journal of Lightwave Technology, 1992. 10(7): p. 982-
988.
25. Lu, Y.L., et al., Distributed Vibration Sensor Based on Coherent Detection of
Phase-OTDR. Journal of Lightwave Technology, 2010. 28(22): p. 3243-3249.
26. Qin, Z.G., et al., High Sensitivity Distributed Vibration Sensor Based on
Polarization-Maintaining Configurations of Phase-OTDR. Ieee Photonics
Technology Letters, 2011. 23(15): p. 1091-1093.
27. Koyamada, Y., et al., Fiber-Optic Distributed Strain and Temperature Sensing
With Very High Measurand Resolution Over Long Range Using Coherent
OTDR. Journal of Lightwave Technology, 2009. 27(9): p. 1142-1146.
28. Taylor, H.F. and C.E. Lee, Apparatus and method for fiber optic intrusion
sensing, U.S. Patent 5194847, Texas A & M University System, March 16,
1993.
29. Park, J. and H.F. Taylor, Fiber optic intrusion sensor. Fiber Optic Sensors V,
1996. 2895: p. 214-221.
30. Park, J.H., W.K. Lee, and H.F. Taylor, A fiber optic intrusion sensor with the
configuration of an optical time domain reflectometer using coherent
interference of Rayleigh backscattering. Optical and Fiber Optic Sensor
Systems, 1998. 3555: p. 49-56.
31. Choi, K.N. and H.F. Taylor, Spectrally stable Er-fiber laser for application in
phase-sensitive optical time-domain reflectometry. Ieee Photonics Technology
Letters, 2003. 15(3): p. 386-388.
32. Juarez, J.C., et al., Distributed fiber-optic intrusion sensor system. Journal of
Lightwave Technology, 2005. 23(6): p. 2081-2087.
33. Juarez, J.C. and H.F. Taylor, Field test of a distributed fiber-optic intrusion
sensor system for long perimeters. Applied Optics, 2007. 46(11): p. 1968-1971.
34. Shatalin, S.V., V.N. Treschikov, and A.J. Rogers, Interferometric optical time-
domain reflectometry for distributed optical-fiber sensing. Applied Optics, 1998.
37(24): p. 5600-5604.
35. Zhou, J., et al., Characteristics and Explanations of Interference Fading of a
phi-OTDR With a Multi-Frequency Source. Journal of Lightwave Technology,
2013. 31(17): p. 2947-2954.
36. Zhu, T., et al., Enhancement of SNR and Spatial Resolution in phi-OTDR System
by Using Two-Dimensional Edge Detection Method. Journal of Lightwave
Technology, 2013. 31(17): p. 2851-2856.
37. Pan, Z.Q., et al., Phase-sensitive OTDR system based on digital coherent
detection. Optical Sensors and Biophotonics Iii, 2011. 8311.
38. Peng, F., et al., Ultra-long high-sensitivity phi-OTDR for high spatial resolution
intrusion detection of pipelines. Optics Express, 2014. 22(11): p. 13804-13810.
FCUP Distributed and Remote fibre Sensing Assisted by Raman Effect
153
39. Juarez, J.C. and H.F. Taylor, Polarization discrimination in a phase-sensitive
optical time-domain reflectometer intrusion-sensor system. Optics Letters, 2005.
30(24): p. 3284-3286.
40. Qin, Z.G., L. Chen, and X.Y. Bao, Continuous wavelet transform for non-
stationary vibration detection with phase-OTDR. Optics Express, 2012. 20(18):
p. 20459-20465.
41. Qin, Z.G., L. Chen, and X.Y. Bao, Wavelet Denoising Method for Improving
Detection Performance of Distributed Vibration Sensor. Ieee Photonics
Technology Letters, 2012. 24(7): p. 542-544.
42. Izumita, H., et al., Stochastic amplitude fluctuation in coherent OTDR and a new
technique for its reduction by stimulating synchronous optical frequency
hopping. Journal of Lightwave Technology, 1997. 15(2): p. 267-278.
43. Li, J., et al., 124km phase-sensitive OTDR with Brillouin amplification. 23rd
International Conference on Optical Fibre Sensors, 2014. 9157.
44. Wang, Z., et al., 175km Phase-sensitive OTDR with Hybrid Distributed
Amplification. 23rd International Conference on Optical Fibre Sensors, 2014.
9157.
45. Madsen, C.K., T. Bae, and T. Snider, Intruder signature analysis from a phase-
sensitive distributed fiber-optic perimeter sensor - art. no. 6770OK. Fiber Optic
Sensors and Applications V, 2007. 6770: p. Ok770-Ok770.
46. Wang, J., et al., Phase-sensitive optical time-domain reflectometer based on bi-
directional Raman amplification. Acta Physica Sinica, 2013. 62(4).
47. Bristiel, B., et al., New model of noise figure and RIN transfer in fiber Raman
amplifiers. Ieee Photonics Technology Letters, 2006. 18(5-8): p. 980-982.
48. Izumita, H., et al., The Performance Limit of Coherent Otdr Enhanced with
Optical-Fiber Amplifiers Due to Optical Nonlinear Phenomena. Journal of
Lightwave Technology, 1994. 12(7): p. 1230-1238.
49. Van Simaeys, G., P. Emplit, and M. Haelterman, Experimental study of the
reversible behavior of modulational instability in optical fibers. Journal of the
Optical Society of America B-Optical Physics, 2002. 19(3): p. 477-486.
50. Anderson, D., et al., Features of modulational instability of partially coherent
light: Importance of the incoherence spectrum (vol E 69, art no 025601, 2004).
Physical Review E, 2004. 69(3).
51. Van Simaeys, G., P. Emplit, and M. Haelterman, Experimental demonstration of
the Fermi-Pasta-Ulam recurrence in a modulationally unstable optical wave.
Physical Review Letters, 2001. 87(3).
52. Hegarty, J., N.A. Olsson, and L. Goldner, Cw Pumped Raman Preamplifier in a
45 Km-Long Fiber Transmission-System Operating at 1.5 Mu-M and 1 Gbit/S.
Electronics Letters, 1985. 21(7): p. 290-292.
53. Aoki, Y., Properties of Fiber Raman Amplifiers and Their Applicability to
Digital Optical Communication-Systems. Journal of Lightwave Technology,
1988. 6(7): p. 1225-1239.
54. Hansen, P.B., et al., Capacity upgrades of transmission systems by Raman
amplification. Ieee Photonics Technology Letters, 1997. 9(2): p. 262-264.
55. Turitsyn, S.K., et al., 270-km Ultralong Raman Fiber Laser. Physical Review
Letters, 2009. 103(13): p. -.
56. Alahbabi, M.N., Y.T. Cho, and T.P. Newson, 150-km-range distributed
temperature sensor based on coherent detection of spontaneous Brillouin
backscatter and in-line Raman amplification. Journal of the Optical Society of
America B-Optical Physics, 2005. 22(6): p. 1321-1324.
FCUP Distributed and Remote fibre Sensing Assisted by Raman Effect
154
57. Martin-Lopez, S., et al., Brillouin optical time-domain analysis assisted by
second-order Raman amplification. Optics Express, 2010. 18(18): p. 18769-
18778.
58. Martins, H., M.B. Marques, and O. Frazao, 300 km-ultralong Raman fiber lasers
using a distributed mirror for sensing applications. Optics Express, 2011.
19(19): p. 18149-18154.
59. Jia, X.H., et al., Detailed theoretical investigation on improved quasi-lossless
transmission using third-order Raman amplification based on ultralong fiber
lasers. Journal of the Optical Society of America B-Optical Physics, 2012.
29(4): p. 847-854.
60. Nuno, J., M. Alcon-Camas, and J.D. Ania-Castanon, RIN transfer in random
distributed feedback fiber lasers. Optics Express, 2012. 20(24): p. 27376-27381.
61. Martins, H.F., et al., Comparison of the use of first and second-order Raman
amplification to assist a phase-sensitive optical time domain reflectometer in
distributed vibration sensing over 125 km. 23rd International Conference on
Optical Fibre Sensors, 2014. 9157.
62. Alcon-Camas, M. and J.D. Ania-Castanon, RIN transfer in 2nd-order distributed
amplification with ultralong fiber lasers. Optics Express, 2010. 18(23): p.
23569-23575.
63. Rao, Y.-J., et al., Long-distance fiber-optic phi-OTDR intrusion sensing system.
20th International Conference on Optical Fibre Sensors, 2009. 7503.
64. He, Q., et al., Real distributed vibration sensing with high frequency response
based on pulse pair. 23rd International Conference on Optical Fibre Sensors,
2014. 9157.
65. Pan, Z., et al., High sampling rate multi-pulse phase-sensitive OTDR employing
frequency division multiplexing. 23rd International Conference on Optical Fibre
Sensors, 2014. 9157.
66. He, Q., et al., All Fiber Distributed Vibration Sensing Using Modulated Time-
Difference Pulses. Ieee Photonics Technology Letters, 2013. 25(20): p. 1955-
1957.
67. Zhu, T., et al., Modulated pulses based distributed vibration sensing with high
frequency response and spatial resolution. Optics Express, 2013. 21(3): p. 2953-
2963.
68. Rao, Y.J., et al., Distributed intrusion detection based on combination of phi-
OTDR and POTDR. 19th International Conference on Optical Fibre Sensors, Pts
1 and 2, 2008. 7004.
69. Masoudi, A., M. Belal, and T.P. Newson, A distributed optical fibre dynamic
strain sensor based on phase-OTDR. Measurement Science & Technology,
2013. 24(8).
70. Denisov, A., M.A. Soto, and L. Thévenaz, 1'000'000 resolved points along a
Brillouin distributed fibre sensor. 23rd International Conference on Optical
Fibre Sensors, 2014. 9157.
71. Soller, B.J., et al., High resolution optical frequency domain reflectometry for
characterization of components and assemblies. Optics Express, 2005. 13(2): p.
666-674.
72. Angulo-Vinuesa, X., et al., Raman-assisted Brillouin optical time-domain
analysis with sub-meter resolution over 100 km. Optics Express, 2012. 20(11):
p. 12147-12154.
FCUP Distributed and Remote fibre Sensing Assisted by Raman Effect
155
73. Viveiros, D., et al., Fiber optic sensing system for monitoring of coal waste piles
in combustion. 23rd International Conference on Optical Fibre Sensors, 2014.
9157.
74. Lopez-Higuera, J.M., et al., Fiber Optic Sensors in Structural Health
Monitoring. Journal of Lightwave Technology, 2011. 29(4): p. 587-608.
75. Horiguchi, T. and M. Tateda, Optical-Fiber-Attenuation Investigation Using
Stimulated Brillouin-Scattering between a Pulse and a Continuous Wave. Optics
Letters, 1989. 14(8): p. 408-410.
76. Barnoski, M.K., et al., Optical Time Domain Reflectometer. Applied Optics,
1977. 16(9): p. 2375-2379.
77. Thévenaz, L. Review and progress in distributed fiber sensing. in Optical Fiber
Sensors, OFS 2006. 2006. Cancun; Mexico.
78. Bao, X.Y. and L. Chen, Recent Progress in Distributed Fiber Optic Sensors.
Sensors, 2012. 12(7): p. 8601-8639.
79. Barnoski, M.K. and S.M. Jensen, Fiber Waveguides - Novel Technique for
Investigating Attenuation Characteristics. Applied Optics, 1976. 15(9): p. 2112-
2115.
80. Koyamada, Y. and H. Nakamoto, High-Performance Single-Mode Otdr Using
Coherent Detection and Fiber Amplifiers. Electronics Letters, 1990. 26(9): p.
573-575.
81. Healey, P., Fading in Heterodyne Otdr. Electronics Letters, 1984. 20(1): p. 30-
32.
82. Rogers, A.J., Polarization Optical-Time Domain Reflectometry. Electronics
Letters, 1980. 16(13): p. 489-490.
83. Wuilpart, M., et al., Measurement of the spatial distribution of birefringence in
optical fibers. Ieee Photonics Technology Letters, 2001. 13(8): p. 836-838.
84. Corsi, F., A. Galtarossa, and L. Palmieri, Polarization mode dispersion
characterization of single-mode optical fiber using backscattering technique.
Journal of Lightwave Technology, 1998. 16(10): p. 1832-1843.
85. Ellison, J.G. and A.S. Siddiqui, A fully polarimetric optical time-domain
reflectometer. Ieee Photonics Technology Letters, 1998. 10(2): p. 246-248.
86. Huttner, B., B. Gisin, and N. Gisin, Distributed PMD measurement with a
polarization-OTDR in optical fibers. Journal of Lightwave Technology, 1999.
17(10): p. 1843-1848.
87. Galtarossa, A. and L. Palmieri, Spatially resolved PMD measurements. Journal
of Lightwave Technology, 2004. 22(4): p. 1103-1115.
88. Peng, F., et al., 106km fully-distributed fiber-optic fence based on P-OTDR with
2nd-order Raman amplification. 2013 Optical Fiber Communication Conference
and Exposition and the National Fiber Optic Engineers Conference (Ofc/Nfoec),
2013.
89. Linze, N., P. Megret, and M. Wuilpart, Development of an Intrusion Sensor
Based on a Polarization-OTDR System. Ieee Sensors Journal, 2012. 12(10): p.
3005-3009.
90. Zhang, Z.Y. and X.Y. Bao, Distributed optical fiber vibration sensor based on
spectrum analysis of Polarization-OTDR system. Optics Express, 2008. 16(14):
p. 10240-10247.
91. Oberson, P., et al., Optical frequency domain reflectometry with a narrow
linewidth fiber laser. Ieee Photonics Technology Letters, 2000. 12(7): p. 867-
869.
FCUP Distributed and Remote fibre Sensing Assisted by Raman Effect
156
92. Eickhoff, W. and R. Ulrich, Optical Frequency-Domain Reflectometry in Single-
Mode Fiber. Applied Physics Letters, 1981. 39(9): p. 693-695.
93. Wait, P.C., K. DeSouza, and T.P. Newson, A theoretical comparison of
spontaneous Raman and Brillouin based fibre optic distributed temperature
sensors. Optics Communications, 1997. 144(1-3): p. 17-23.
94. Farahani, M.A. and T. Gogolla, Spontaneous raman scattering in optical fibers
with modulated probe light for distributed temperature Raman remote sensing.
Journal of Lightwave Technology, 1999. 17(8): p. 1379-1391.
95. Dyer, S.D., et al., Analysis of a distributed fiber-optic temperature sensor using
single-photon detectors. Optics Express, 2012. 20(4): p. 3456-3466.
96. Bolognini, G., et al., Analysis of distributed temperature sensing based on
Raman scattering using OTDR coding and discrete Raman amplification.
Measurement Science & Technology, 2007. 18(10): p. 3211-3218.
97. Belal, M., et al., A temperature-compensated high spatial resolution distributed
strain sensor. Measurement Science & Technology, 2010. 21(1).
98. Shimizu, K., et al., Coherent Self-Heterodyne Detection of Spontaneously
Brillouin-Scattered Light Waves in a Single-Mode Fiber. Optics Letters, 1993.
18(3): p. 185-187.
99. Kurashima, T., T. Horiguchi, and M. Tateda, Distributed-Temperature Sensing
Using Stimulated Brillouin-Scattering in Optical Silica Fibers. Optics Letters,
1990. 15(18): p. 1038-1040.
100. Soto, M.A., et al., Extending the Real Remoteness of Long-Range Brillouin
Optical Time-Domain Fiber Analyzers. Journal of Lightwave Technology, 2014.
32(1): p. 152-162.
101. Nikles, M., L. Thevenaz, and P.A. Robert, Brillouin gain spectrum
characterization in single-mode optical fibers. Journal of Lightwave
Technology, 1997. 15(10): p. 1842-1851.
102. Bao, X., D.J. Webb, and D.A. Jackson, 32-Km Distributed Temperature Sensor-
Based on Brillouin Loss in an Optical-Fiber. Optics Letters, 1993. 18(18): p.
1561-1563.
103. Brown, A.W., B.G. Colpitts, and K. Brown, Dark-pulse Brillouin optical time-
domain sensor with 20-mm spatial resolution. Journal of Lightwave
Technology, 2007. 25(1): p. 381-386.
104. Song, K.Y., et al., Time-Domain Distributed Fiber Sensor With 1 cm Spatial
Resolution Based on Brillouin Dynamic Grating. Journal of Lightwave
Technology, 2010. 28(14): p. 2062-2067.
105. Jamioy, C.A.G. and J.M. Lopez-Higuera, Decimeter Spatial Resolution by Using
Differential Preexcitation BOTDA Pulse Technique. Ieee Sensors Journal, 2011.
11(10).
106. Foaleng, S.M., et al., High Spatial and Spectral Resolution Long-Range Sensing
Using Brillouin Echoes. Journal of Lightwave Technology, 2010. 28(20): p.
2993-3003.
107. Dong, Y.K., et al., 2 cm spatial-resolution and 2 km range Brillouin optical fiber
sensor using a transient differential pulse pair. Applied Optics, 2012. 51(9): p.
1229-1235.
108. Wojcik, A.K., Signal statistics of phase dependent optical time domain
reflectometry, 2006, Texas A&M University: Available at:
http://hdl.handle.net/1969.1/4873.
FCUP Distributed and Remote fibre Sensing Assisted by Raman Effect
157
109. Kotz, S., T.J. Kozubowski, and K. Podgórski, The Laplace distribution and
generalizations: a revisit with applications to Communications, Economics,
Engineering and Finance, 2001, Boston: Birkhäuser. p. 23.
110. Agrawal, G.P., Fiber Optic Communication Systems, 2002: ., New York: Wiley.
p. 156-158.
111. Baney, D.M., P. Gallion, and R.S. Tucker, Theory and measurement techniques
for the noise figure of optical amplifiers. Optical Fiber Technology, 2000. 6(2):
p. 122-154.
112. Kim, J., et al., Static gain saturation model of quantum-dot semiconductor
optical amplifiers. Ieee Journal of Quantum Electronics, 2008. 44(7-8): p. 658-
666.
113. Cho, H.J. and C.J. Lissenden, Structural health monitoring of fatigue crack
growth in plate structures with ultrasonic guided waves. Structural Health
Monitoring-an International Journal, 2012. 11(4): p. 393-404.
114. Botsev, Y., et al., Structural Health Monitoring using an Embedded PZT-FBG
Ultrasonic Sensor Array. Proceedings of the Fourth European Workshop on
Structural Health Monitoring 2008, 2008: p. 649-656.
115. Olsson, B.E., M. Karlsson, and P.A. Andrekson, Polarization mode dispersion
measurement using a sagnac interferometer and a comparison with the fixed
analyzer method. Ieee Photonics Technology Letters, 1998. 10(7): p. 997-999.
116. Flavin, D.A., R. McBride, and J.D.C. Jones, Dispersion of birefringence and
differential group delay in polarization-maintaining fiber. Optics Letters, 2002.
27(12): p. 1010-1012.
117. Kim, C.S., et al., Optical fiber modal birefringence measurement based on Lyot-
Sagnac interferometer. Ieee Photonics Technology Letters, 2003. 15(2): p. 269-
271.
118. Hlubina, P. and D. Ciprian, Spectral-domain measurement of phase modal
birefringence in polarization-maintaining fiber. Optics Express, 2007. 15(25): p.
17019-17024.
119. Huttner, B., et al., Local birefringence measurements in single-mode fibers with
coherent optical frequency-domain reflectometry. Ieee Photonics Technology
Letters, 1998. 10(10): p. 1458-1460.
120. Froggatt, M.E., et al., Characterization of polarization-maintaining fiber using
high-sensitivity optical-frequency-domain reflectometry. Journal of Lightwave
Technology, 2006. 24(11): p. 4149-4154.
121. Dong, Y.K., L. Chen, and X.Y. Bao, Truly distributed birefringence
measurement of polarization-maintaining fibers based on transient Brillouin
grating. Optics Letters, 2010. 35(2): p. 193-195.
122. Koyamada, Y., et al., Novel fiber-optic distributed strain and temperature
sensor with very high resolution. Ieice Transactions on Communications, 2006.
E89b(5): p. 1722-1725.
123. Imahama, M., Y. Koyamada, and K. Hogari, Restorability of Rayleigh
backscatter traces measured by coherent OTDR with precisely frequency-
controlled light source. Ieice Transactions on Communications, 2008. E91b(4):
p. 1243-1246.
124. Lu, X., M.A. Soto, and L. Thévenaz, MilliKelvin resolution in cryogenic
temperature distributed fibre sensing based on coherent Rayleigh scattering.
23rd International Conference on Optical Fibre Sensors, 2014. 9157.
125. Grubb, S.G., et al., High-Power 1.48 µm Cascaded Raman Laser in
Germanosilicate Fibers. Optical Amplifiers and Their Applications, 1995. 18.
FCUP Distributed and Remote fibre Sensing Assisted by Raman Effect
158
126. Ania-Castanon, J.D., et al., Simultaneous spatial and spectral transparency in
ultralong fiber lasers. Physical Review Letters, 2008. 101(12): p. -.
127. Park, K.D., et al., Dynamics of cascaded Brillouin-Rayleigh scattering in a
distributed fiber Raman amplifier. Optics Letters, 2002. 27(3): p. 155-157.
128. Min, B., P. Kim, and N. Park, Flat amplitude equal spacing 798-channel
Rayleigh-assisted Brillouin/Raman multiwavelength comb generation in
dispersion compensating fiber. Ieee Photonics Technology Letters, 2001.
13(12): p. 1352-1354.
129. Zamzuri, A.K., et al., Brillouin-Raman comb fiber laser with cooperative
Rayleigh scattering in a linear cavity. Optics Letters, 2006. 31(7): p. 918-920.
130. Shahi, S., S.W. Harun, and H. Ahmad, Multi-wavelength Brillouin fiber laser
using Brillouin-Rayleigh scatterings in distributed Raman amplifier. Laser
Physics Letters, 2009. 6(10): p. 737-739.
131. Pinto, A.M.R., et al., Multiwavelength fiber laser based on a photonic crystal
fiber loop mirror with cooperative Rayleigh scattering. Applied Physics B-
Lasers and Optics, 2010. 99(3): p. 391-395.
132. Pinto, A.M.R., et al., Multiwavelength Raman Fiber Lasers Using Hi-Bi
Photonic Crystal Fiber Loop Mirrors Combined With Random Cavities. Journal
of Lightwave Technology, 2011. 29(10): p. 1482-1488.
133. Turitsyn, S.K., et al., Random distributed feedback fibre laser. Nature Photonics,
2010. 4(4): p. 231-235.
134. El-Taher, A.E., et al., Dual-wavelength, ultralong Raman laser with Rayleigh-
scattering feedback. Optics Letters, 2010. 35(7): p. 1100-1102.
135. Frazao, O., et al., Applications of fiber optic grating technology to multi-
parameter measurement. Fiber and Integrated Optics, 2005. 24(3-4): p. 227-244.
136. Ferreira, M.S., et al., A vibration sensor based on a distributed Bragg reflector
fibre laser. Laser Physics Letters, 2013. 10(9).
137. Martins, H.F., M.B. Marques, and O. Frazao, Temperature-insensitive strain
sensor based on four-wave mixing using Raman fiber Bragg grating laser sensor
with cooperative Rayleigh scattering. Applied Physics B-Lasers and Optics,
2011. 104(4): p. 957-960.
138. Demjanenko, V., et al., A Noninvasive Diagnostic Instrument for Power Circuit-
Breakers. Ieee Transactions on Power Delivery, 1992. 7(2): p. 656-663.
139. Runde, M., et al., Acoustic Diagnosis of High-Voltage Circuit-Breakers. Ieee
Transactions on Power Delivery, 1992. 7(3): p. 1306-1315.
140. Gangopadhyay, T.K., Prospects for Fibre Bragg Gratings and fabry-perot
interferometers in fibre-optic vibration sensing. Sensors and Actuators a-
Physical, 2004. 113(1): p. 20-38.
141. Giallorenzi, T.G., et al., Optical Fiber Sensor Technology. Ieee Journal of
Quantum Electronics, 1982. 18(4): p. 626-665.
142. Mandal, J., et al., Bragg grating tuned fiber laser system for measurement of
wider range temperature and strain. Optics Communications, 2005. 244(1-6): p.
111-121.
143. Varshney, S.K., et al., Coupling Characteristics of Multicore Photonic Crystal
Fiber-Based 1 x 4 Power Splitters. Journal of Lightwave Technology, 2009.
27(12): p. 2062-2068.
144. Yue, Y., et al., Broadband single-polarization single-mode photonic crystal
fiber coupler. Ieee Photonics Technology Letters, 2006. 18(17-20): p. 2032-
2034.
FCUP Distributed and Remote fibre Sensing Assisted by Raman Effect
159
145. Laegsgaard, J., O. Bang, and A. Bjarklev, Photonic crystal fiber design for
broadband directional coupling. Optics Letters, 2004. 29(21): p. 2473-2475.
146. Chen, M.Y., X.X. Fu, and Y.K. Zhang, Design and analysis of a low-loss
terahertz directional coupler based on three-core photonic crystal fibre
configuration. Journal of Physics D-Applied Physics, 2011. 44(40).
147. Saitoh, K., et al., Tunable photonic crystal fiber couplers with a thermo-
responsive liquid crystal resonator. Journal of Lightwave Technology, 2008.
26(5-8): p. 663-669.
148. Saitoh, K., et al., Design of narrow band-pass filters based on the resonant-
tunneling phenomenon in multicore photonic crystal fibers. Optics Express,
2005. 13(25): p. 10327-10335.
149. Husakou, A.V. and J. Herrmann, Frequency comb generation by four-wave
mixing in a multicore photonic crystal fiber. Applied Physics Letters, 2003.
83(19): p. 3867-3869.
150. Dudley, J.M., G. Genty, and S. Coen, Supercontinuum generation in photonic
crystal fiber. Reviews of Modern Physics, 2006. 78(4): p. 1135-1184.
151. Mafi, A. and J.V. Moloney, Phase locking in a passive multicore photonic
crystal fiber. Journal of the Optical Society of America B-Optical Physics, 2004.
21(5): p. 897-902.
152. Michaille, L., et al., Characteristics of a Q-switched multicore photonic crystal
fiber laser with a very large mode field area. Optics Letters, 2008. 33(1): p. 71-
73.
153. Michaille, L., et al., Multicore Photonic Crystal Fiber Lasers for High
Power/Energy Applications. Ieee Journal of Selected Topics in Quantum
Electronics, 2009. 15(2): p. 328-336.
154. Guan, C.Y., L.B. Yuan, and J.H. Shi, Supermode analysis of multicore photonic
crystal fibers. Optics Communications, 2010. 283(13): p. 2686-2689.
155. Wang, C.C., et al., Photonic crystal fiber for fundamental mode operation of
multicore fiber lasers and amplifiers. Optics Communications, 2008. 281(21): p.
5364-5371.
156. Cardenas-Sevilla, G.A., et al., Photonic crystal fiber sensor array based on
modes overlapping. Optics Express, 2011. 19(8): p. 7596-7602.
157. Jensen, J.B., et al., Photonic crystal fiber based evanescent-wave sensor for
detection of biomolecules in aqueous solutions. Optics Letters, 2004. 29(17): p.
1974-1976.
158. Reimlinger, M., et al., Multicore Photonic Crystal Fiber Force Meters. Sensors
and Smart Structures Technologies for Civil, Mechanical, and Aerospace
Systems 2011, 2011. 7981.
159. Chen, D., G. Hu, and L. Chen, Dual-Core Photonic Crystal Fiber for
Hydrostatic Pressure Sensing. Ieee Photonics Technology Letters, 2011. 23(24).
160. Chen, W.G., et al., Highly Sensitive Torsion Sensor Based on Sagnac
Interferometer Using Side-Leakage Photonic Crystal Fiber. Ieee Photonics
Technology Letters, 2011. 23(21): p. 1639-1641.
161. Deng, M., et al., PCF-Based Fabry-Perot Interferometric Sensor for Strain
Measurement at High Temperatures. Ieee Photonics Technology Letters, 2011.
23(11): p. 700-702.
162. Nalawade, S.M. and H.V. Thakur, Photonic Crystal Fiber Strain-Independent
Temperature Sensing Based on Modal Interferometer. Ieee Photonics
Technology Letters, 2011. 23(21): p. 1600-1602.
FCUP Distributed and Remote fibre Sensing Assisted by Raman Effect
160
163. MacPherson, W.N., et al., Remotely addressed optical fibre curvature sensor
using multicore photonic crystal fibre. Optics Communications, 2001. 193(1-6):
p. 97-104.
164. Michaille, L., et al., Damage threshold and bending properties of photonic
crystal and photonic band-gap optical fibres. Integrated Optical Devices,
Nanostructures, and Displays, 2004. 5618: p. 30-38.
165. Burnett, J.G., P.M. Blanchard, and A.H. Greenaway, Optical Fibre-based
Vectoral Shape Sensor. Strain, 2000. 36(3): p. 127-133.
166. Flockhart, G.M.H., et al., Two-axis bend measurement with Bragg gratings in
multicore optical fiber. Optics Letters, 2003. 28(6): p. 387-389.
167. Zetterlund, E., et al., Gemini Fiber for Interferometry and Sensing Applications.
Journal of Sensors, 2009. 2009.
168. Frazao, O., et al., Optical bend sensor based on a long-period fiber grating
monitored by an optical time-domain reflectometer. Optical Engineering, 2005.
44(11).
169. Gong, Y., et al., All-Fiber Curvature Sensor Based on Multimode Interference.
Ieee Photonics Technology Letters, 2011. 23(11): p. 679-681.
170. Frazao, O., J.P. Carvalho, and H.M. Salgado, Low-loss splice in a
microstructured fibre using a conventional fusion splicer. Microwave and
Optical Technology Letters, 2005. 46(2): p. 172-174.
171. Kuhlmey, B.T., et al., Microstructured optical fibers: where's the edge? Optics
Express, 2002. 10(22): p. 1285-1290.
172. Gander, M.J., et al., Two-axis bend measurement using multicore optical fibre.
Optics Communications, 2000. 182(1-3): p. 115-121.
173. Meltz, G. and E. Snitzer, Fiber optic strain sensor, WIPO Patent
WO1981000618 A1, March 5, 1981, Google Patents.
174. Meltz, G., et al., Cross-Talk Fiber-Optic Temperature Sensor. Applied Optics,
1983. 22(3): p. 464-477.
175. Zhang, L. and C.X. Yang, Polarization-dependent coupling in twin-core
photonic crystal fibers. Journal of Lightwave Technology, 2004. 22(5): p. 1367-
1373.
176. Wang, Z., et al., Coupling in dual-core photonic bandgap fibers: theory and
experiment. Optics Express, 2007. 15(8): p. 4795-4803.
177. Yuan, W., G.E. Town, and O. Bang, Refractive Index Sensing in an All-Solid
Twin-Core Photonic Bandgap Fiber. Ieee Sensors Journal, 2010. 10(7): p. 1192-
1199.
178. Markos, C., et al., Label-free biosensing with high sensitivity in dual-core
microstructured polymer optical fibers. Optics Express, 2011. 19(8): p. 7790-
7798.
179. Sun, X.W., Wavelength-selective coupling of dual-core photonic crystal fiber
with a hybrid light-guiding mechanism. Optics Letters, 2007. 32(17): p. 2484-
2486.
180. Frazao, O., et al., Temperature- and strain-independent torsion sensor using a
fiber loop mirror based on suspended twin-core fiber. Optics Letters, 2010.
35(16): p. 2777-2779.
181. Town, G.E., et al., Microstructured optical fiber refractive index sensor. Optics
Letters, 2010. 35(6): p. 856-858.
182. Wu, D.K.C., B.T. Kuhlmey, and B.J. Eggleton, Ultrasensitive photonic crystal
fiber refractive index sensor. Optics Letters, 2009. 34(3): p. 322-324.
FCUP Distributed and Remote fibre Sensing Assisted by Raman Effect
161
183. Kim, B., et al., Twin core photonic crystal fiber for in-line Mach-Zehnder
interferometric sensing applications. Optics Express, 2009. 17(18): p. 15502-
15507.
184. Liu, S.H., et al., Simple In-Line M-Z Interferometer Based on Dual-Core
Photonic Crystal Fiber. Ieee Photonics Technology Letters, 2012. 24(19): p.
1768-1770.