distortions in firm selection during recessionssep.luiss.it/sites/sep.luiss.it/files/wp sep 04-16...
TRANSCRIPT

LUISS Guido CarliSchool of European Political Economy
Working Paper4/2016
Distortions in Firm SelectionDuring Recessions
A Comparison Across European Countries
Fabio Landini

LUISS Guido Carli / School of European Political Economy Working paper n. 4/2016 Publication date: October 2016 Distortions in Firm Selection During Recessions: A Comparison Across European Countries
© 2016 Fabio Landini ISBN 978-‐88-‐6856-‐078-‐2
This working paper is distributed for purposes of comment and discussion only. It may not be reproduced without permission of the copyright holder.
LUISS Academy is an imprint of LUISS University Press – Pola s.r.l. a socio unico Viale Pola 12, 00198 Roma Tel. 06 85225485 e-‐mail [email protected] www.luissuniversitypress.it
Editorial Committee: Leonardo Morlino (chair) Paolo Boccardelli Matteo Caroli Giovanni Fiori Daniele Gallo Nicola Lupo Stefano Manzocchi Giuseppe Melis Marcello Messori Gianfranco Pellegrino Giovanni Piccirilli Arlo Poletti Andrea Prencipe Pietro Reichlin
1
Distortions in Firm Selection During Recessions: A Comparison Across European Countries
Fabio Landini
School of European Political Economy LUISS University – Italy
ICRIOS Bocconi University – Italy
October 2016
Abstract Recent evidence documents the weakness of market selection based on productivity differentials and the absence of cleansing during recessions. This paper argues that a possible explanation lies in the role of competitive rents, i.e., market advantages due to idiosyncrasies of the firm’s demand. Competitive rents allow firms to sustain profit independently of their internal efficiency, creating a selection advantage. During an economic recession, this advantage increases because competitive rents operate as a resilience factor. The process of firm selection can thus be distorted with relatively inefficient firms that manage to survive. These predictions are tested on a sample of French, Italian, and Spanish manufacturing firms, looking at the selection that took place during the Great Recession. Ceteris paribus, firms with competitive rents are less likely to exit than firms without competitive rents. This effect is stronger in countries more severely impacted by the downturn. The implications of these results for policy interventions to sustain aggregate productivity growth are discussed.
Keywords: firm selection, profit, productivity, competitive rents, Great Recession.
JEL codes: D24; L11; L25.

© F. Landini | LUISS School of European Political Economy | WORKING PAPER | 10/2016
2
1. Introduction Starting from late 2008 the Eurozone has experienced a prolonged period of economic recession (the so-‐called Great Recession), which only recently is giving way to weak signals of recovery. The European Union (EU) policy makers have thus devoted increasing attention to practical ways of sustaining productivity growth, especially in the EU periphery. The economic literature usually informs these initiatives by relying on models that attribute an important role to processes of firm selection based on productivity differentials (Jovanovic, 1982; Hopenhayn, 1992; Melitz, 2003; Asplund and Nocke, 2006; Melitz and Ottaviano, 2008). In these models aggregate productivity movements originate from the reallocation of market shares to more efficient producers, either through market share shifts or through entry and exit. Firms with high productivity levels are more likely to survive and grow than their less efficient counterparts, creating selection-‐driven aggregate productivity increases. Therefore, the theories point to the existence of a direct productivity-‐survival link as a crucial driver of productivity growth (Foster et al., 2008).
The theoretical approaches underlying these views and the related policy recommendations, however, are difficult to reconcile with two empirical facts. The first one concerns the existence of widespread and persistent within-‐industry heterogeneity in firm performances. Syverson (2004), for instance, shows that within four-‐digit SIC industries in the U.S. manufacturing sector, plant in the 90th percentile of the productivity distribution makes on average twice as much output with the same measured inputs as the 10th percentile plant and these differences are persistent. Similar results have been obtained for several European countries (Bartlesmam et al., 2013) as well as for China and India, with average 90-‐10 productivity ratio that in the latter two cases reach over 5:1 (Hsieh and Klenow, 2009). High and persistent variability exists in other firm-‐level measures as well, such as firm size (Bottazzi et al., 2007; Dosi, 2007) and intangible investments (Arrighetti et al., 2014). In sum, in almost every industry and country one observes few highly productive and innovative firms that co-‐exist with many relatively inefficient competitors. This evidence contrasts with the view of markets as accurate selective environments: if “long tails” of relatively inefficient firms can persistently survive, one should conclude that selection based on productivity differentials works at best imperfectly (if working at all).1
The second empirical fact that contrasts with a direct productivity-‐survival link is related to the effect of economic recessions. If highly productive firms enjoy a selection advantage during upturns of the business cycles, this advantage should become even greater during downturns, when additional competitive pressure drives unproductive arrangements out of business, freeing up resources for more productive uses. Such “cleansing effect”, which dates as far back as Schumpeter (1939), features prominently in several economic models (Hall et al., 1995; Caballero and Hammour, 1994; Gomes at al., 2001). In this case too, however, the available evidence partially contradicts the hypothesized effect. Some recent papers highlight that rather than cleansing, recessions can scar the economy and destroy relatively productive firms (Barlevy, 2002; Ouyang, 2009; Hallward-‐Driemeier and Rijkers, 2013). Certainly this 1 Several studies using the between component in the decomposition of productivity change as a proxy for selection dynamics find that the reallocation pressure due to differential productivities operates very slowly and sometime is even perverse. According to Bottazzi et al. (2010: 1955) “…when the between component has the expected positive sign, idiosyncratic learning (the within term) generally offers a comparatively larger contribution to productivity growth”. Moreover, some studies find not significant (Baldwin and Gu, 2006) and even negative between effect (Disney et al., 2003), which suggests that reallocation can go in favour of less productive plants or firms.
© F. Landini | LUISS School of European Political Economy | WORKING PAPER | 10/2016
3
“sullying effect” cannot be general and may depend on the specific nature of recessions. Nevertheless, Foster et al. (2016), Kehring (2015) and Calligaris et al. (2016) suggest that during the Great Recession the sullying effect has been predominant, with within-‐industry dispersion in productivity levels that has on average increased.
This evidence suggests that more research into the process of firm selection is needed, especially during recessions. How do we make sense of the prolonged survival of relatively inefficient firms in almost every industry and country? Why are recessions unable to purge these inefficiencies out of the system? The answer matters for policy: depending on the explanation given for the weakness of the cleansing mechanism, different policy recommendations to sustain productivity growth may follow. This paper investigates the nature of distortions in the process of firm selection during the Great Recession. In doing so it contributes to the literature that investigates deviations from efficiency-‐enhancing selection dynamics during recessions. Barlevy (2002, 2003), for instance, suggests that during downturns the cleansing effect can be reversed in presence of credit market imperfections, because efficient firms may be hurt disproportionally due to their higher financial needs. Ouyang (2009) focuses on the uncertainty surrounding a firm’s real quality and argues that recessions may worsen resource allocation because they destroy potentially superior firms during their infancy. A series of papers also suggest that labour market regulations and policies governing firm dynamics can be particularly relevant in distorting the process of firm selection in presence of negative shocks, because they allow relatively inefficient firms to survive (Haltiwanger et al., 2008; Collier and Goderis, 2009; Hallward-‐Driemeier and Rijkers, 2013).
Compared to these contributions the present paper provides an alternative, and to some extent complementary, explanation. Based on the recent and growing literature on demand factors as determinants of industry dynamics (e.g. Foster et al., 2008, 2016) the paper suggests that, rather than by imperfections on the market for inputs or uncertainty, the weakness of the cleansing effect can be explained by demand idiosyncrasies. The latter may derive from different factors such as specificities of niche and local markets, long-‐term buyer-‐supplier ties as well as market protection. In all these cases firms with positive demand idiosyncrasies enjoy competitive rents, which allow them to sustain profit independently of their internal efficiency. In presence of an economic recession such additional profit strengthen the firm’s capacity to resist the shock and thus create a selection advantage. Firms with large competitive rents can survive despite of their relative inefficiency and the cleansing effect is ultimately attenuated. To provide some structure to the above argument I present a two-‐stage entry and production model where firms differ along two dimensions: productivity and competitive rents. The basic structure of the model is taken from Foster et al. (2008). Starting from the same long-‐period equilibrium I study what happens when a negative shock hit the economy, reducing the profit of all firms. The model yields two main predictions: a) after the negative shock firms with large competitive rents are more likely to survive than firms with low competitive rents; and b) the selection advantage of firms with large competitive rents gets larger the stronger the shock (i.e. the more severe the recession). The predictions of the model are tested on a sample of European manufacturing firms taken from the EFIGE-‐Amadeus matched dataset. Data refers to selection processes taking place during the Great Recession. The latter is well suited to this aim because it was both a deep and relatively unexpected recession, especially for the European manufacturing sector. Moreover, although global in nature, the Great Recession had a heterogeneous impact across countries,

© F. Landini | LUISS School of European Political Economy | WORKING PAPER | 10/2016
4
which can be exploited to estimate its effect on firm selection. Due do data availability the analysis is restricted to three countries: France, Italy and Spain. Overall, the empirical analysis provides results that are consistent with theoretical predictions. Firms with competitive rents enjoy a selection advantage and ceteris paribus are less likely to exit than firms without competitive rents. Moreover, the size of the selection advantage is stronger in the countries that were more severely hit by the downturn, i.e. Italy and Spain relative to France.
This work contributes to several streams of research. First, it extents the literature on demand-‐related industry dynamics (e.g. Foster et al., 2008, 2016) by focusing on the role that demand idiosyncrasies and the related competitive rents play in distorting the process of firm selection during recessions. Second, the paper makes a contribution to the literature on the “cleansing vs. sullying” effect of recessions (e.g. Barlevy 2002, 2003; Ouyang, 2009; Haltiwanger et al., 2008; Collier and Goderis, 2009; Hallward-‐Driemeier and Rijkers, 2013) by highlighting that, alongside supply factors, there can be also demand factors that help explaining the lack of cleansing during downturns. Finally, at a more general level, the argument developed in this paper opens new lines of research concerning the determinants of firm selection in market economies. In particular, the paper provides a possible explanation for the recent findings that show that market share reallocation is slower and less systematic that it is assumed in most selection-‐based theories of competition (e.g. Coad, 2007; Bottazzi et al., 2010; Dosi et al., 2015).
From a policy perspective the results have two main implications. First, alongside interventions that aim at strengthening the flexibility of input markets (which is the current focus to improve resource allocation), policy makers should devote more attention to policies that foster firm competition and eliminate the sources of competitive rents (be either physical such as transportation costs or institutional such as long-‐term buyer-‐supplier ties). In fact, even in presence of input flexibility, firms with competitive rents can continue to operate independently of their relative inefficiency, retaining resources that could be freed up for more productive uses. Second, the fact that the selection distortion due to competitive rents is more acute in the countries that are severely hit by the downturn implies that recovery can be particularly difficult in those contexts. In particular, the effect of standard market-‐based economic interventions can be weakened and non-‐standard policy interventions may be needed.
The paper is organized as follows. The next section discusses the theoretical framework and derives the model predictions. Section 3 presents the data and variables used in the empirical analysis. Section 4 discusses some descriptive statistics on competitive rents. Section 5 shows the results on the firm-‐level determinants of exit during the Great Recession. Section 6 discusses the policy implications. Section 7, finally, concludes.
2. Theoretical framework
2.1 Productivity, profitability and firm selection
Does firm selection depend on productivity or profit? Although this question may seem trivial, there are reasons to believe it is not. According to well-‐established streams of research in the economic literature profit is the main driver of firm survival. This is the case in the Schumpeterian framework, where the profit surplus ensured by successful innovations is what leads more innovative firms to thrive and less innovative firms to shrink and eventually exit the market (Schumpeter, 1934, 1939). This same view is shared by the more recent Neo-‐

© F. Landini | LUISS School of European Political Economy | WORKING PAPER | 10/2016
5
Schumpeterian tradition, which expands the sources of profit variation across firms to include also routines and capabilities (Nelson and Winter, 1982). Finally, the fact that firm selection is on profit is a common assumption in most canonical models of industry dynamics with differentiated producers (Jovanovic, 1982; Hopenhayn, 1992; Melitz, 2003; Asplund and Nocke, 2006; Melitz and Ottaviano, 2008). Nevertheless, most of the scientific and policy debates on the determinants of firm selection concentrate on productivity and not profit. The reason for this is twofold. On the one hand the majority of formal models takes productivity as the single idiosyncratic factor that explains the persistent heterogeneity of firm profit. As a result while the models stick to the assumption of a profit-‐survival link, productivity often becomes the unique idiosyncratic factor that entirely mediates such link (Foster et al., 2008). On the other hand a large number of empirical contributions has documented that firms with higher measured productivity levels tend to grow faster and are more likely to survive than their less productive industry cohorts (for a comprehensive survey see Syverson, 2011). These results have favoured the view according to which the productivity-‐survival link is a good approximation of how firm selection actually takes place.
However, none of these views is exempt from critiques. With respect to the sources of profit heterogeneity, Foster et al. (2008) points out that productivity is only one of several possible idiosyncratic factors that determine profits, a key alternative being demand idiosyncrasies. In presence of high enough transportation costs, for instance, firms with privileged access to local markets that happened to be characterized by particularly high demand are likely able to set higher prices (or sell more at a given price) than firms in low-‐demand markets. This idiosyncratic spatial differentiation may thus translate into high profit differentials that are however unrelated to firms’ production efficiency. A similar result can obtain in presence of history-‐laden and customized relationships between suppliers and their consumers. For example, some consumers may decide to enter into a contract with a specific supplier because of some match-‐specific factor (e.g. past history with the same supplier, customization), rather than the supplier’s product being considered superior by all possible consumers. In this case too, just as with spatial differentiation, such supplier benefits of a market power that is independent of its productivity but inevitably affects profit. Other factors that may produce similar results include political connections (Cingano and Pinotti, 2013) and more generally different forms of market protections.
In addition to the sources of profit heterogeneity also the empirical evidence on the relationship between productivity and survival presents some weakness (Mairesse and Jaumandreu, 2005; Katayama et al., 2009). Most of the research using business microdata to measure productivity lacks information on firm-‐level prices. As a consequence firm output is measured as revenue divided by a common industry-‐level deflator, with the result that price differences are embodied in the measures of productivity. However, if prices reflect idiosyncratic demand shifts or market power rather than differences in output quality or efficiency, then firms with high measured “productivity” levels may not be particularly efficient. Under these conditions, the positive relationship between the measured “productivity” and firm survival should be treated as evidence of selection on profit, but not necessarily productivity (Foster et al., 2008).
Starting from these considerations a growing literature has began to document how demand-‐related factors interact with productivity and profit to shape industry dynamics. Foster et al. (2008) use establishment-‐level data on a set of eleven US commodity-‐like products to show that demand idiosyncrasies are a dominant factor as opposed to output-‐based productivity
© F. Landini | LUISS School of European Political Economy | WORKING PAPER | 10/2016
6
measures in determining firm survival. By relying on similar data, Foster et al. (2016) investigate why new businesses are typically smaller than their established industry competitors and show that these patterns reflects more differences in demand-‐side fundamentals than productivity gaps. Similar contributions with a focus on demand-‐side effects on firm’s growth and survival include Das et al. (2007), Eslava et al. (2008), Kee and Krishna (2008), De Loecker (2011), Roberts et al. (2011), Pozzi and Schivardi (2012) and De Loecker and Goldberg (2014). None of these contributions, however, studies the effect of demand idiosyncrasies on the process of firm selection during recessions. This is precisely the aim of the next section.
2.2 A simple model
In this section I present a two-‐stage entry and production model providing some intuitions on how idiosyncratic productivity and demand factors can distort the process of firm selection during recessions. The model is a simplified version of the one presented by Foster et al. (2008). Like them I abstract from dynamics so that the results can be interpreted as highlighting selection effects taking place across long-‐run equilibria. Moreover, I consider the same demand system, which combines product differentiation with demand idiosyncrasies at the firm level. Although simple, the model makes it possible to derive testable predictions. The qualitative features of the results hold using other demand structures as well.
An industry consists of L (>0) consumers and a continuum of firms of measure N (>0). Firms are indexed by i∈I, where I is the set of firms. Each firm supplies a distinct variety of the industry product. Preferences are defined over varieties and a homogeneous good chosen as numeraire. All consumers share the same utility function, which is given by
( ) ( ) ( )∫∫ ∫ ∈∈ ∈−−++=
Ii
CiIi Ii
Ci
Cii diqdiqdiqyU 22
21
21
γηδα (1)
where y and Ciq are the consumption level of the numeraire and each variety i, respectively.
The parameters α (> 0) and η (> 0) are standard demand shifters of differentiated varieties relative to the numeraire. The parameter γ (≥ 0) captures the extent to which varieties are differentiated. When γ is higher consumers experience a greater utility loss from consuming idiosyncratically large or small quantities of any C
iq and product differentiation increases. As γ→0 consumers only care about their consumption level over all varieties, diqQ
Ii
Ci
C ∫∈= , and
substitutability becomes perfect. For a similar approach to the modeling of product differentiation see Mellitz and Ottaviano (2008). The most important feature of the utility depicted in equation (1) is parameter δi. The latter is a variety-‐specific mean-‐zero taste shifter, which shifts demand for variety i relative to α. The actual value of δi reflects demand idiosyncrasies that can be due to several factors, such as specificities of niche markets, long-‐term buyer-‐supplier ties as well as market protection (see above). In all these cases firms enjoying a positive δi have some degree of market power, because they are able to set higher prices, or sell more at a given price, than those with zero or negative δi. In this sense δi reflects what I define as a demand-‐based competitive rent. The role

© F. Landini | LUISS School of European Political Economy | WORKING PAPER | 10/2016
7
played by such competitive rent in the process of firm selection is the main focus of the analysis.
For all goods consumed in positive quantities (i.e. 0>Ciq ), utility maximization implies the
following inverse demand function for each variety i
CCiii Qqp ηγδα −−+= . (2)
Equation (2) can be shown to imply that firms face the following linear market demand (see Foster et al., 2005, Melitz and Ottaviano, 2008):
iiCii
LLNNpL
NNpL
NLLqq δ
γδ
γγηη
γγηη
γγηα
++
−+
+−+
=≡ (3)
where ∫∈=*
)/1(Ii idipNp and ∫∈=
*)/1(
Ii idiN δδ (with II ⊂* indicating the subset of firms
whose varieties are consumed) are average price and competitive rent among industry producers (notice that δ need not be zero in equilibrium).
The technology is represented by a single-‐input production function
iii xq ω= (4)
where xi is the input and ωi (≥ 0) is a firm-‐specific productivity. The production input can be purchased at a price w, which is assumed constant for all firms. It follows that the firm’s total cost and marginal cost is respectively
ii
ii qwwxTC ⎟⎟⎠
⎞⎜⎜⎝
⎛==
ω and
ii
wMCω
= . (5)
This setting can thus generate within-‐industry heterogeneity along two dimensions: demand (δi) and productivity (ωi).
The firm’s profit can be written as:
⎟⎟⎠
⎞⎜⎜⎝
⎛−=
iiiiwpqω
π . (6)
By replacing equation (3) into (6) I can rewrite the profit function as follows
⎟⎟⎠
⎞⎜⎜⎝
⎛−⎟⎟
⎠
⎞⎜⎜⎝
⎛+
+−
++−
+=
iiiiiwpLL
NNpL
NNpL
NL
ωδ
γδ
γγηη
γγηη
γγηα
π . (7)
Given the continuum of competitors, firms maximize equation (7) taking as given the average price level p and number of firms N. This gives the following optimal price
( )[ ]⎭⎬⎫
⎩⎨⎧
++−++
=i
iiwpN
Np
ωδδηγα
γη1
21* , (8)
© F. Landini | LUISS School of European Political Economy | WORKING PAPER | 10/2016
8
which is decreasing in ωi and increasing in δi. The first effect captures the standard argument that more efficient firms enjoy a cost advantage over competitors, allowing them to set lower prices. The second effect is instead associated with the exploitation of market power, which allow firms with competitive rents to set higher prices. Notice that if differentiation is null (i.e. γ=0) and competitive rents are absent (i.e. δi=0 for all i) all firms set price equals marginal cost. Substituting equation (8) into (3) gives the firm’s optimal quantity
( )[ ]⎭⎬⎫
⎩⎨⎧
−+−++
=i
iiwpN
NLq
ωδδηγα
γηγ1
2* . (9)
This result neglects the fact that some goods may not be purchased at the price given by equation (8). In fact, equation (1) suggests the marginal utility for any particular variety i is bounded at α + δi so that only varieties such that pi ≤ α + δi are purchased. However, it is possible to show that any firm that is active in equilibrium (i.e., having πi ≥ 0 and qi > 0) satisfies this condition (see Foster et al., 2005).
Replacing equations (9) and (8) into (6) gives the maximized profit
( )[ ]2
* 14 ⎭
⎬⎫
⎩⎨⎧
−+−++
=i
iiwpN
NL
ωδδηγα
γηγπ , (10)
which is intuitively increasing in both competitive rent (δi) and productivity (ωi). Provided that within-‐industry heterogeneity in profit exists, firms with either higher competitive rents or higher productivity (or both) will also enjoy relatively higher profits and will thus find it more convenient to operate. In particular, from equation (10) it is possible to derive a cutoff profit condition below which firms make negative profits and exit. The latter is given by
( )[ ] ϕδηγαγηω
δ =−++
−≥− pNN
w
ii
1 . (11)
Using equation (11) it is then possible to write the maximized profit in terms of the cutoff 2
*
4 ⎭⎬⎫
⎩⎨⎧
−−= ϕω
δγ
πi
iiwL . (12)
The process of entry is modeled as follows. A large set of potential entrants decides whether to pay a sunk cost of entry s (>0). Firms who pay s receive competitive rent and productivity draws from a joint distribution with probability density function ( )ωδ ,f . Marginal distributions of δ and ω are defined respectively over [ ]ee δδ ,− and [ ]ul ωω , , where αδ <e and
0>lω . After having observed the draws, firms decide whether to begin production and earn the corresponding profit as from equation (12). Obviously, only potential entrants with draws that satisfy the cutoff condition will choose to produce in equilibrium. Hence, the expected value of entry Ve is the expected value of (12) over ( )ωδ ,f conditional on drawings that satisfy (11) minus the cost of entry s. Under a free-‐entry condition ϕ must then set Ve equal to zero, so that no new entry occurs. In other words, ϕ must satisfy
( )∫ ∫ +=−⎟⎟
⎠
⎞⎜⎜⎝
⎛−−=
u
l
e
wi
ie sddfwLV
ω
ω
δ
ϕω
ωδωδϕω
δγ
0 ,4
2
. (13)
© F. Landini | LUISS School of European Political Economy | WORKING PAPER | 10/2016
9
Equation (13) summarizes the industry equilibrium. All firms make nonnegative profit and entry continues until potential entrant firms receive productivity and competitive rent draws such that the expected value of entry is zero. In equilibrium all active firms satisfy the cutoff condition described above. The actual value of the cutoff will depend on the distribution of the competitive rent and productivity draws as well as the other parameters of the model (including the equilibrium number of active firms). Without loss of generality let the value of the cutoff that satisfies equation (13) be ϕ*. The equilibrium profit for any firm i can thus be written as
0~~
4
2** ≥⎭⎬⎫
⎩⎨⎧
−−= ϕω
δγ
πi
iiwL , (14)
where iδ~ and iω
~ are i’s actual competitive rent and productivity draws upon entry.
Starting from this condition I study what happens to the process of firm selection when a negative shock hits the economy. There are many ways of modeling such shock including decreases in demand and/or productivity shocks.2 In all cases the main effect of the shock is to reduce the profit margin and thus create a tougher environment for firm survival. To capture this effect in a simple and intuitive way I choose to model the negative shock as a cost ζ (>0) that hits all firms operating in equilibrium independently of productivity and competitive rent. We could interpret ζ as a generalized increase in the cost of financing firm operations. After the shock occurred some of the firms operating at the lower end of the profit distribution, i.e. those making small equilibrium profit, will turn into negative profit and will be forced to exit. The question of interest is how the combination of productivity and competitive rent affects such process of exit.
Using equation (14) the new profit after the negative shock can be written as
ζϕω
δγ
π −⎭⎬⎫
⎩⎨⎧
−−=2
*~
~4 i
iSi
wL . (15)
Clearly both competitive rent and productivity strengthen the firm’s resilience to the negative shock. In particular, equation (15) can be exploited to derive a productivity threshold that yields nonnegative post-‐shock profit:
0≥Siπ ⇔
( )*
2/1*~
/4~~
ii
i Lw
ωγζϕδ
ω =−−
≥ (16)
All firms whose productivity satisfies condition (16) survive after the shock. Conversely, the firms with productivity levels below *~
iω exit. This expression yields three results of interest: 1) 0/~* >∂∂ ζωi , 2) 0/~* <∂∂ ii δω and 3) 0/~*2 <∂∂∂ ii δζω . The first result suggests that the larger the negative shock, the higher the productivity threshold and thus the stronger the selective pressure against firms with relatively low productivity. This is the standard “cleansing effect” hypothesis, which is therefore confirmed by the model results. The second results shows that the level of productivity that ensures survival is not the same across all firms, rather it decreases with the competitive rent. In other words, firms with relatively low productivity can still survive after the shock provided that they enjoy sufficiently high 2 Models that are driven by demand and productivity shocks include respectively Caballero and Hammour (1994) and Kehring (2015).

© F. Landini | LUISS School of European Political Economy | WORKING PAPER | 10/2016
10
competitive rent. Finally, the third result highlights that the rate at which the productivity threshold increases after the shock is lower the greater the competitive rents, meaning that the selective pressure is lower for firms with high competitive rent. The latter reflects what can be interpreted as a distortion effect in the process of firm selection because it leads firms with relatively low productivity but high competitive rent to enjoy a selection advantage during recessions.
Figure 1 provides a graphical representation of condition (16). The three lines show the value of the productivity threshold as a function of competitive rent for different sizes of the negative shock, where ζ < ζ' < ζ''. As one can see, on average, the negative shock makes the productivity thresholds more stringent, forcing low productivity firms to exit. However, while such “cleansing” effect is particularly strong for firms that exhibit relatively small competitive rent (i.e. those close to the origin), it is weaker for firms enjoying large rents. The latter benefit of a selection advantage with respect to competitors that is unrelated to their productivity level and it becomes larger the stronger the shock. I call the latter a “distortionary effect” of economic recessions.
Figure 1 – Competitive rent and distortions of firm selection
Note: productivity thresholds as a function of competitive rent for different size of the negative shock. Curves have been drawn for w = 2; ϕ* = -‐1; γ = 0.9; ζ = 1; ζ' = 1.5; ζ'' = 2; L = 10.
Based on the above results it is possible to derive two testable predictions:
Prediction 1: During an economic recession, firms with large competitive rent (δ i ) enjoy a
selection advantage and are less likely to exit than firms with small competitive rents.
Prediction 2: The selection advantage of firms with large competitive rent is greater, the stronger the recession (i.e. the larger ζ).
The main aim of the following sections is to provide an empirical test of these predictions.
Ω*(Ζ)
Ω*(Ζ') Ω*(Ζ'')
0.0 0.1 0.2 0.3 0.4 0.52
4
6
8
10
12
Competitive rent, ∆i
Productivity,Ω
i
© F. Landini | LUISS School of European Political Economy | WORKING PAPER | 10/2016
11
3. Context, data and variables 3.1 Context
The Great Recession, which originated in the US in 2008 and then spread to Europe (as well as worldwide) in the following years, is a suitable context to test the predictions derived in Section 2.1 for three reasons. First of all, the Great Recession represents the deepest downturn in the history of capitalism since the Great Depression of the 1930s.3 Secondly, the Great Recession happened to be a relatively unexpected event, especially for the European manufacturing sector. According to Claessens et al. (2012) its negative impact on industrial performance was mainly due to the sudden interruption of financial and trade flows at the global level and it can thus be considered unrelated to firm decisions taken before that period.4 Finally, although the Great Recession was certainly global in nature, it did not affect all countries in the same way. Within the Eurozone the crisis impacted the so-‐called “peripheral” countries more severely than the so-‐called “core” countries, especially if one considers the protracted period of recession that followed the outbreak of the crisis (Groot et al., 2011). In this sense the Eurozone represents a quasi-‐experimental setting, where the heterogeneity of the crisis across countries can be exploited to estimate the effect of recessions on firm selection.
3.2 Data
The analysis in this paper relies on EFIGE data, a unique dataset of manufacturing firms in seven European countries: Germany, France, Italy, Spain, United Kingdom, Austria and Hungary. The EFIGE dataset has several unique features (for details see Altomonte and Aquilante, 2012). First, it is a stratified sample built to be representative of the manufacturing structure of the countries covered. Second, it contains data that are fully comparable across countries, since it is derived from responses to the same questionnaire, administered over the same time span. Third, it provides both qualitative and quantitative information on the firm’s internal structure (e.g. property structure, workforce, investments, technological innovation, R&D, internationalization, finance, market and pricing), which allow a deeper analysis than just balance sheet information. Finally, most of the questions in the survey refer to 2008; they thus allow one to control for firm’s characteristics at the beginning of the recession (Altomonte et al., 2013). EFIGE data were integrated with information retrieved from the Amadeus-‐BVD database for the period 2001-‐2008. In addition to balance sheet and profit and loss statement information, Amadeus data contains information on the present status of the firms (active vs. non-‐active 3 According to the International Monetary Fund (IMF) between 2008 and 2009 the GDP of advanced economies dropped on average by 3.4%, with peak drops in the US and the Eurozone of respectively 2.8% and 4.5% (IMF, 2016). During the same period the volume of world trade collapsed by 10.5% and unemployment rate rose by 40% (advanced economies) (IMF, 2009, 2010). Moreover, especially in the Eurozone, these short-‐term effects were followed by a protracted period of stagnation with an average GDP growth that in period 2010-‐2013 was only 0.6%, far below the 2% growth registered by the US (IMF, 2016).
4 According to Eurostat (2016) in 2006, the year before the outbreak of the mortgage crisis in the US, the production of manufacturing activities within the Eurozone was growing at 7%. This went together with high level of confidence in the economy, as measured by the Eurostat’s economic sentiment indicator, which scored in the last quarter of 2006 the highest value since the early 2000. Then, in 2008 manufacturing production dropped by nearly 14% and the economic sentiment indicator reduced by 36%, reaching the lowest value over the last 20 years.
© F. Landini | LUISS School of European Political Economy | WORKING PAPER | 10/2016
12
and merged vs. acquired), which is exploited to distinguish between active and exiting firms (see below). The quality of the Amadeus data varies by country, and not all the variables are available on all balance sheets. France, Italy and Spain are the countries with the best coverage and I thus restrict the analysis to them. After having matched EFIGE data with Amadeus data I remain with a restricted sample of 6,865 firms (compared to the 8,826 firms in the unrestricted sample), with the following distribution by country: 2,252 firms in France, 2,642 firms in Italy and 1,971 firms in Spain. Altomonte et al. (2012) provide detailed discussion of the characteristics of the restricted EFIGE-‐Amadeus matched sample and find no major difference with respect to the unrestricted sample.
Overall, I obtain an unbalanced panel with information in three time-‐horizons. First, I have firm-‐level information on the internal characteristics of the firms in coincidence with the outbreak of the Great Recession, i.e., 2008. Second, I have access to the balance sheet of all firms before the Great Recession, i.e., from 2001 to 2008. Finally, I can identify the firms that are still active and those that exited the market by 2015. Using these data I can estimate the determinants of firm exit during the recession, paying particular attention to the role of competitive rents.
3.3 Firm exit
The dependent variable distinguishes between surviving and exiting firms. Information contained in the Amadeus-‐BVD database makes it possible to detect firms that are active in 2008 but have changed their status before 2015. On this basis, I rely on the same algorithm used in Arrighetti et al. (2015) and Landini et al. (2016) (see Appendix) to identify firms that have effectively exited the market. In contrast to previous literature (see Agarwal and Audretsch, 2001; Cefis and Marsili, 2005), I can distinguish between exit resulting from the death of the firm and exit occurring through merger and acquisition. In this paper, I focus only on the former; the firms subject to mergers and acquisitions are removed from the sample. Unfortunately, the Amadues-‐BVD database does not provide reliable information on the year in which exit actually occurs. Therefore, the dependent variable that I consider (EXIT) is a dummy variable that takes value 1 if a firm has exited the market before 2015, and zero otherwise.
3.4 Competitive rents
The key variable in the analysis is the measure of competitive rents. Differently from Forster et al. (2008), who estimate a version of the model described in Section 2.2, I do not have access to distinct information for firm-‐level prices and quantities. Therefore, I have to rely on a proxy variable that exploits value measures to capture the firms that are most likely enjoying competitive rents. Along these lines, I base my analysis on two main variables: labour productivity (LABPROD) measured as the logarithm of value added per employee; and profit (PROFIT) measured as the ratio of value added minus wages over sales. Since competitive rents are conceived as a persistent feature of the firms, I compute both LABPROD and PROFIT considering the mean of the year-‐specific variables over the pre-‐crisis period 2001-‐2008. Then for each firm i in the sample, I construct the a proxy of competitive rents, which I call H PROFIT-‐L LABPRODi, as follows:
⎩⎨⎧
=
<>==
otherwise ,0 and if ,1
- iiiii
LABPRODLABPRODPROFITPROFITLABPRODLPROFITH
© F. Landini | LUISS School of European Political Economy | WORKING PAPER | 10/2016
13
where PROFITi and LABPRODi is the industry mean (NACE 3 digits classification) of PROFITi and LABPRODi respectively. In other words, H PROFIT-‐L LABPRODi is a dummy variable selecting the firms that during the pre-‐crisis period present higher-‐than-‐industry-‐mean profit but lower-‐than-‐industry-‐mean labour productivity. Since these firms are likely being less efficient than their direct competitors, their positive profit gap must derive from some alternative factors, including competitive rents. On this respect, it is important to notice that it is only idiosyncratic factors that are potentially captured by this measure given that the measure deviates from industry means. Therefore, although it is not possible to directly associate H PROFIT-‐L LABPRODi to demand idiosyncrasies of the type discussed in Section 2, it is highly likely that the latter play an important role in determining whether or not a firm is classified as H PROFIT-‐L LABPRODi.
A possible shortcoming of this classification, however, is that it does not take into account the heterogeneity of production inputs, which may affect the measured values of both productivity and profit. For instance, it is possible for a firm to adopt a “low cost” strategy that involves hiring low qualified labour and investing in low quality capital goods. In this case the relatively low cost of production inputs may imply a relatively high measured profit, without this necessarily implying that the firm is inefficient. For this reason I consider also a refined measure of competitive rents that controls for this effect. In particular, I split the firms classified as H PROFIT-‐L LABPRODi into two groups. The first one, which I call LOW-‐COSTi, is captured by a dummy variable taking the following values:
⎩⎨⎧
=
<<===
otherwise ,0 and and 1 - if ,1
- iiiiii
INVINVWWLABPRODLPROFITHCOSTLOW
where Wi is the total labor cost in 2008 and INVi is the cost of investments in plants, machine and equipment as the share firm’s turnover in 2008, with Wi and INVi being the correspondent industry means. In other words this variable identifies the firms that while being characterized by relatively high profit and low labour productivity, they also exhibit relatively low costs for production inputs compared to their industry competitors. Following the above discussion these are firms whose high measured profit is likely to derive more from their low cost structure than from competitive rents. The second group of firms that I consider consists instead of the firms that are most likely enjoying competitive rents. The latter are captured by a dummy variable selecting the residual group of firms that are classified as H PROFIT-‐L LABPRODi but do not exhibit relatively low costs:
⎩⎨⎧
=
====
otherwise ,00- and 1 - if ,1
- iii
COSTLOWLABPRODLPROFITHRENTCOMP .
In other words this variable identifies the firms whose relatively high profit and low labour productivity cannot be explained by supply-‐side factors such as the purchase of low quality inputs. Rather, their positive profit gap most likely derives from demand-‐side idiosyncrasies such as competitive rents. These firms are the main focus of the analysis.
© F. Landini | LUISS School of European Political Economy | WORKING PAPER | 10/2016
14
4. Competitive rents across countries, regions and industries
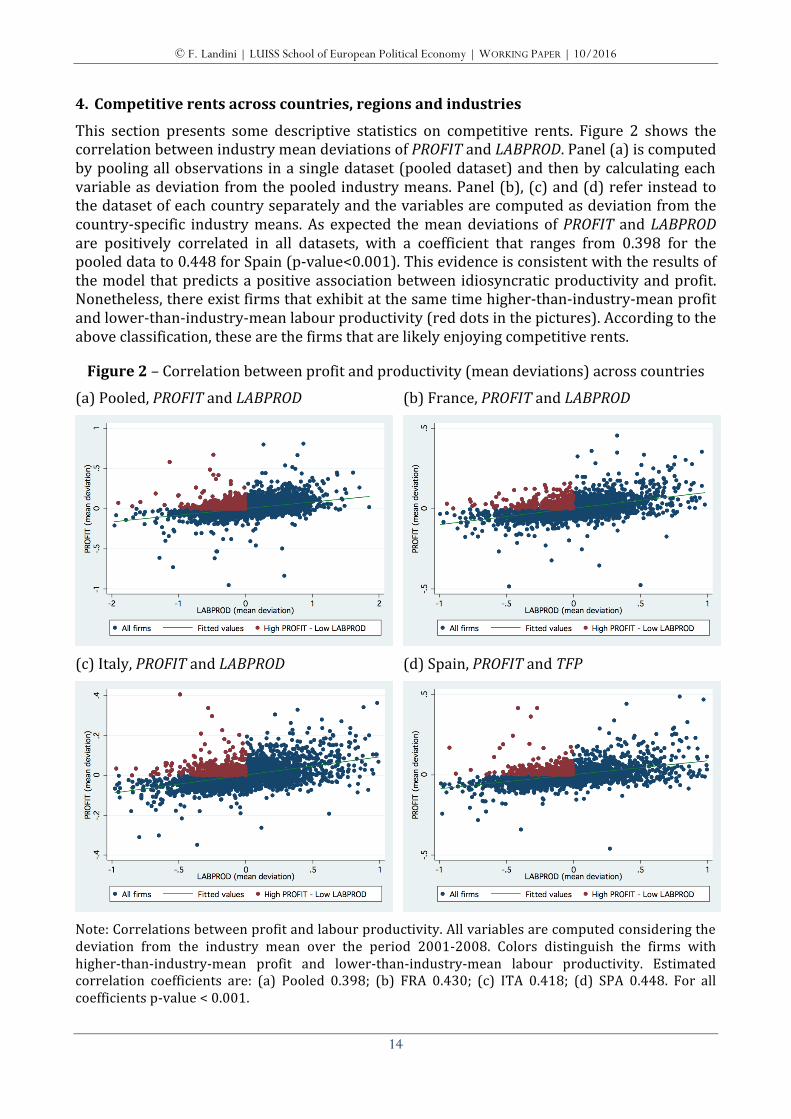
This section presents some descriptive statistics on competitive rents. Figure 2 shows the correlation between industry mean deviations of PROFIT and LABPROD. Panel (a) is computed by pooling all observations in a single dataset (pooled dataset) and then by calculating each variable as deviation from the pooled industry means. Panel (b), (c) and (d) refer instead to the dataset of each country separately and the variables are computed as deviation from the country-‐specific industry means. As expected the mean deviations of PROFIT and LABPROD are positively correlated in all datasets, with a coefficient that ranges from 0.398 for the pooled data to 0.448 for Spain (p-‐value<0.001). This evidence is consistent with the results of the model that predicts a positive association between idiosyncratic productivity and profit. Nonetheless, there exist firms that exhibit at the same time higher-‐than-‐industry-‐mean profit and lower-‐than-‐industry-‐mean labour productivity (red dots in the pictures). According to the above classification, these are the firms that are likely enjoying competitive rents.
Figure 2 – Correlation between profit and productivity (mean deviations) across countries
(a) Pooled, PROFIT and LABPROD (b) France, PROFIT and LABPROD
(c) Italy, PROFIT and LABPROD (d) Spain, PROFIT and TFP
Note: Correlations between profit and labour productivity. All variables are computed considering the deviation from the industry mean over the period 2001-‐2008. Colors distinguish the firms with higher-‐than-‐industry-‐mean profit and lower-‐than-‐industry-‐mean labour productivity. Estimated correlation coefficients are: (a) Pooled 0.398; (b) FRA 0.430; (c) ITA 0.418; (d) SPA 0.448. For all coefficients p-‐value < 0.001.

© F. Landini | LUISS School of European Political Economy | WORKING PAPER | 10/2016
15
Figure 3 reports the distribution of the firms classified as H PROFIT-‐L LABPROD, LOW-‐COST and COMP-‐RENT across countries. In all countries around 14% of firms presents higher-‐than-‐industry-‐mean profit and lower-‐than-‐industry-‐mean labour productivity (H PROFIT-‐L LABPROD). Nearly half of them sustain profit via the low cost of inputs (LOW-‐COST) and the other half via competitive rents (COMP-‐RENT). In particular, the share of firms classified as COMP-‐RENT is around 6% in France, 8% in Italy and 7% in Spain. Therefore, while competitive rents seem to be a fairly widespread phenomenon in all countries, there do exist some slight difference in the distribution across countries, with competitive rents being relatively more common in Italy and Spain than in France.
Figure 3 – Competitive rents: comparison across countries
Note: Cross-‐country comparison of firms with-‐higher-‐than-‐industry-‐mean profit and lower-‐than-‐industry-‐mean labour productivity. The figure distinguishes between firms that support profit via low costs of inputs and firms that support profit via competitive rents.
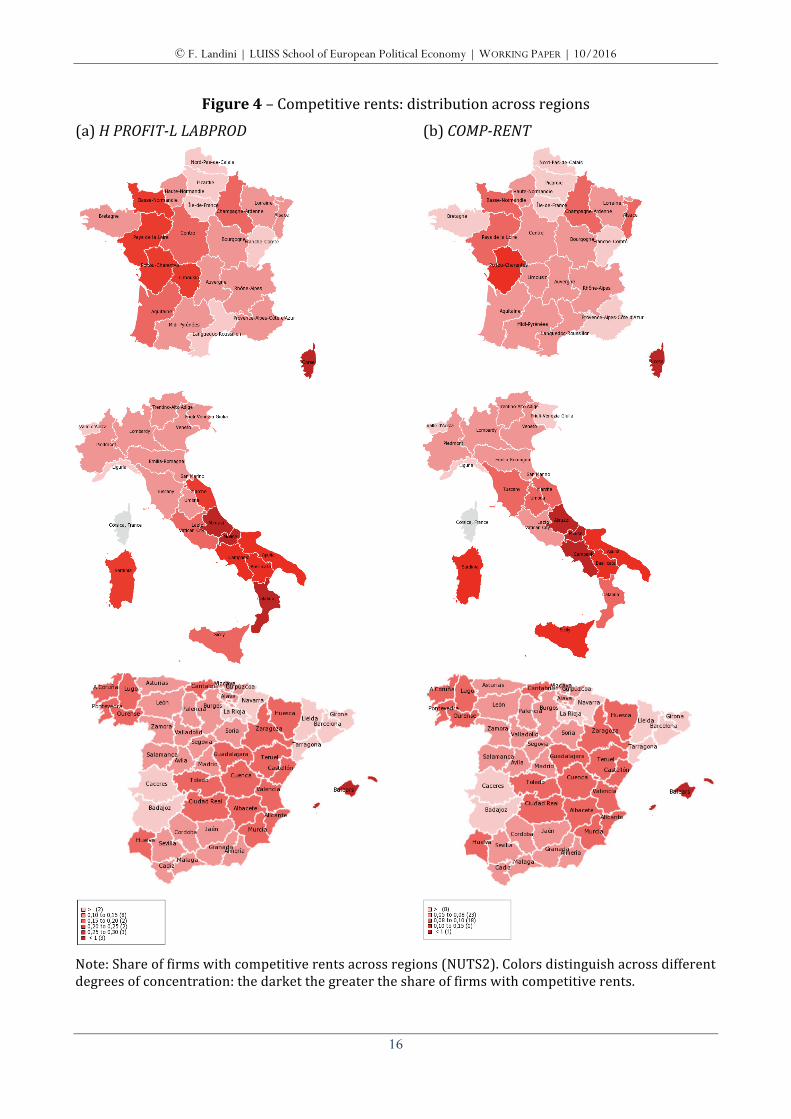
Some additional information on the geographic distribution of competitive rents is provided by Figure 4, which shows the share of firms classified as H PROFIT-‐L LABPROD (panel a) and COMP-‐RENT (panel b) across NUTS 2 regions. In France the concentration of firms with competitive rents is stronger in the Northwestern regions as well as in Corse. An even greater degree of geographic differentiation exits in Italy, where the firms classified as H PROFIT-‐L LABPROD and COMP-‐RENT tend to be more frequent in the Southern regions as well as in Sicily and Sardinia. In Spain, on the contrary, the distribution across the national territory seems more homogeneous. The causes of this different geographic distribution among countries can be several, including the existence of different sources of competitive rents. In Italy, for instance, the fact that competitive rents are particularly common in the Southern regions may be due to the well-‐known institutional divide between North and South that characterizes the country (Felice, 2013).
© F. Landini | LUISS School of European Political Economy | WORKING PAPER | 10/2016
16
Figure 4 – Competitive rents: distribution across regions
(a) H PROFIT-‐L LABPROD (b) COMP-‐RENT
Note: Share of firms with competitive rents across regions (NUTS2). Colors distinguish across different degrees of concentration: the darket the greater the share of firms with competitive rents.

© F. Landini | LUISS School of European Political Economy | WORKING PAPER | 10/2016
17
To deepen the analysis, Figure 5 plots the regional share of firms classified as H PROFIT-‐L LABPROD and COMP-‐RENT against two possible sources of competitive rents, namely transportation costs measured as the regional diffusion of motorways (panels a and b) and the quality of local institutions measured by the European Quality of Government Index (EQI) (panels c and d). The EQI is an index that captures the quality of the public services administered by the public sector along several dimensions, including: the degree of corruption, the rule of law, the protection of property rights and the government bureaucratic effectiveness in impartially administering public goods and services (Charron et al., 2015). The data on both transportation costs and EQI is derived from the Quality of Government dataset available from the University of Gothenburg.5
Figure 5 – Competitive rents, transportation costs and quality of institutions across regions
(a) H PROFIT-‐L LABPROD, transportation costs
(b) COMP-‐RENT, transportation costs
(c) H PROFIT-‐L LABPROD, quality of government
(d) COMP-‐RENT, quality of government
Note: Correlations between share of firms with competitive rents and transportation costs/quality of governement at the regional level (NUTS2). Estimated correlation coefficients are: (a) -‐0.398; (b) -‐0.290; (c) -‐0.485; (d) -‐0.445. For coefficients (a), (c) and (d) p-‐value < 0.001; for coefficient (b) p-‐value < 0.050.
5 http://qog.pol.gu.se/data
© F. Landini | LUISS School of European Political Economy | WORKING PAPER | 10/2016
18
All graphs suggest that the higher the transportation costs (i.e. the lower the regional diffusion of motorways) and the lower the quality of local institutions, the greater the diffusion of firms with competitive rents. This correlation is in line with the above discussion on the sources of competitive rents: in regions where transportation costs are high and institutions can be subject to elite capture, firms are more likely to enjoy positive demand idiosyncrasies and competitive rents are more common.
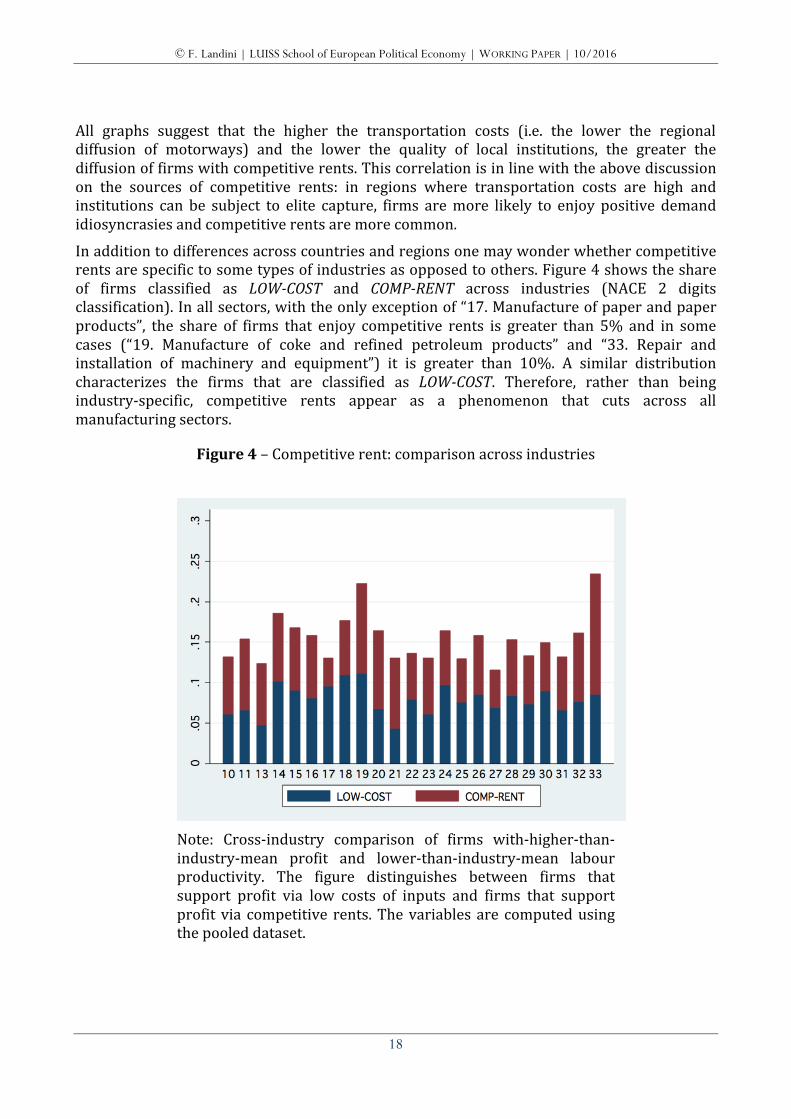
In addition to differences across countries and regions one may wonder whether competitive rents are specific to some types of industries as opposed to others. Figure 4 shows the share of firms classified as LOW-‐COST and COMP-‐RENT across industries (NACE 2 digits classification). In all sectors, with the only exception of “17. Manufacture of paper and paper products”, the share of firms that enjoy competitive rents is greater than 5% and in some cases (“19. Manufacture of coke and refined petroleum products” and “33. Repair and installation of machinery and equipment”) it is greater than 10%. A similar distribution characterizes the firms that are classified as LOW-‐COST. Therefore, rather than being industry-‐specific, competitive rents appear as a phenomenon that cuts across all manufacturing sectors.
Figure 4 – Competitive rent: comparison across industries
Note: Cross-‐industry comparison of firms with-‐higher-‐than-‐industry-‐mean profit and lower-‐than-‐industry-‐mean labour productivity. The figure distinguishes between firms that support profit via low costs of inputs and firms that support profit via competitive rents. The variables are computed using the pooled dataset.
© F. Landini | LUISS School of European Political Economy | WORKING PAPER | 10/2016
19
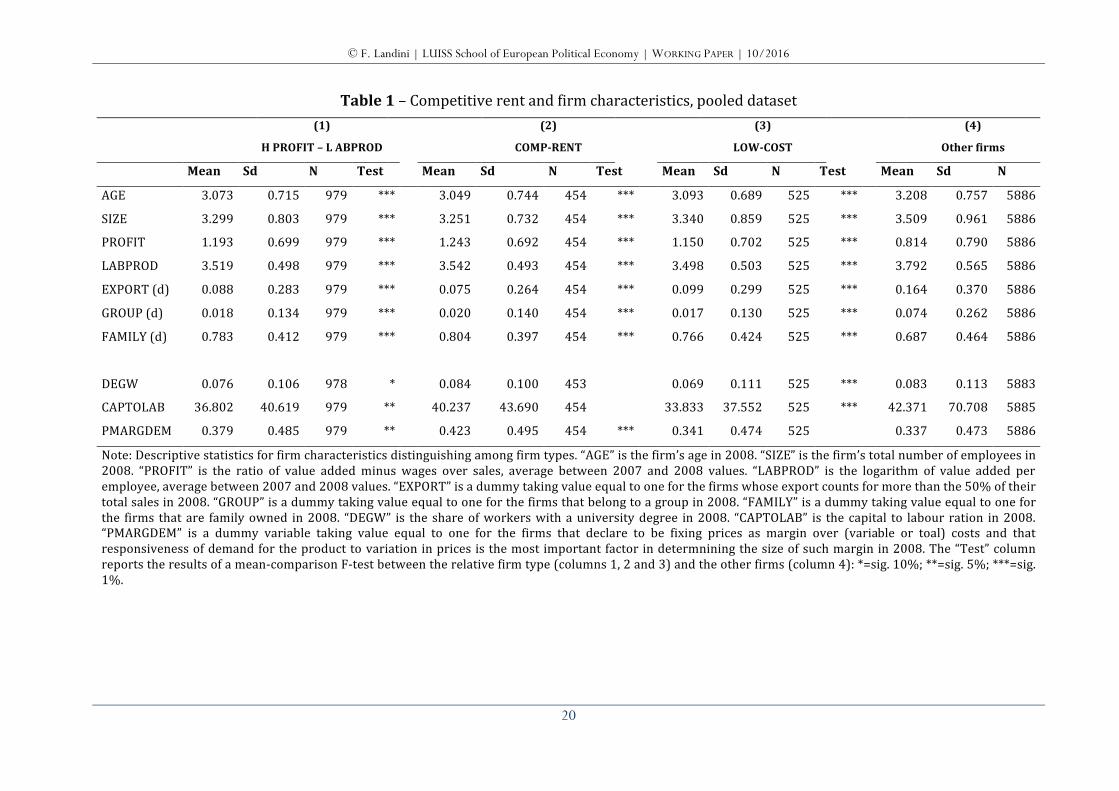
Finally, Table 1 reports some firm-‐level descriptive statistics distinguishing among H PROFIT-‐L LABPROD firms (column 1), LOW-‐COST firms (column 2), COMP-‐RENT firms (column 3) as well as other firms (column 4). For all firm types the “Test” column shows the results of an F-‐test comparing the mean difference between each firm type (columns 1, 2 and 3) and the other firms (column 4). In general, firms with competitive rents (COMP-‐RENT) are younger (AGE), smaller (SIZE), less involved in export activities (EXPORT), less likely to be part of a group (GROUP) and more likely to be family firms (FAMILY) than the other firms. Similar differences characterize also the firms classified as LOW-‐COST firms. Quite interestingly, however, COMP-‐RENT and LOW-‐COST firms differ for the last three variables included in the table, which refer to the share of workers with university degree (DEGW), the capital to labour ratio (CAPTOLAB) and the share of firms that in the survey declare to be fixing prices as demand-‐based margins over costs (PMARGDEM). LOW-‐COST firms differ from the other firms in terms of the low quality of production inputs, i.e. lower DEGW and CAPTOLAB, but not in terms of the pricing strategy, i.e. PMARGDEM. On the contrary, COMP-‐RENT firms exhibit no significant difference with respect to the input structure, but a larger fraction of them declare to be fixing prices as demand-‐based margins over costs. This result confirms that COMP-‐RENT selects firms that indeed enjoy some degree of market power, which is likely be due to demand-‐based factors such as competitive rents. In sum the descriptive analysis reveals four interesting results. First, firms with competitive rents tend to be fairly widespread and are slightly more common in Italy and Spain than in France. Second, the distribution of competitive rents across regions presents some degree of differentiation, which seems to be driven by both physical factors (e.g. transportation costs) and institutional factors (e.g. quality of local institutions). Third, firms with competitive rents exist in all manufacturing sectors and their presence does not seem to be a specific feature of any industry in particular. Finally, firms with competitive rents tend to be small and young family firms that are active mainly in local markets. Their input structure is not different from that of the other firms and their pricing strategy reflects some positive degree of market power due to specificities of demand. Based on this descriptive evidence, the next sections will rely on a multivariate analysis to explore if and how competitive rents affect the process of firm selection during recessions.
© F. Landini | LUISS School of European Political Economy | WORKING PAPER | 10/2016
20
Table 1 – Competitive rent and firm characteristics, pooled dataset
(1)
H PROFIT – L ABPROD
(2)
COMP-‐RENT
(3)
LOW-‐COST
(4)
Other firms
Mean Sd N Test Mean Sd N Test
Mean Sd N Test
Mean Sd N
AGE 3.073 0.715 979 *** 3.049 0.744 454 ***
3.093 0.689 525 ***
3.208 0.757 5886
SIZE 3.299 0.803 979 *** 3.251 0.732 454 ***
3.340 0.859 525 ***
3.509 0.961 5886
PROFIT 1.193 0.699 979 *** 1.243 0.692 454 ***
1.150 0.702 525 ***
0.814 0.790 5886
LABPROD 3.519 0.498 979 *** 3.542 0.493 454 ***
3.498 0.503 525 ***
3.792 0.565 5886
EXPORT (d) 0.088 0.283 979 *** 0.075 0.264 454 ***
0.099 0.299 525 ***
0.164 0.370 5886
GROUP (d) 0.018 0.134 979 *** 0.020 0.140 454 ***
0.017 0.130 525 ***
0.074 0.262 5886
FAMILY (d) 0.783 0.412 979 *** 0.804 0.397 454 ***
0.766 0.424 525 ***
0.687 0.464 5886
DEGW 0.076 0.106 978 * 0.084 0.100 453
0.069 0.111 525 ***
0.083 0.113 5883
CAPTOLAB 36.802 40.619 979 ** 40.237 43.690 454 33.833 37.552 525 *** 42.371 70.708 5885
PMARGDEM 0.379 0.485 979 ** 0.423 0.495 454 *** 0.341 0.474 525 0.337 0.473 5886
Note: Descriptive statistics for firm characteristics distinguishing among firm types. “AGE” is the firm’s age in 2008. “SIZE” is the firm’s total number of employees in 2008. “PROFIT” is the ratio of value added minus wages over sales, average between 2007 and 2008 values. “LABPROD” is the logarithm of value added per employee, average between 2007 and 2008 values. “EXPORT” is a dummy taking value equal to one for the firms whose export counts for more than the 50% of their total sales in 2008. “GROUP” is a dummy taking value equal to one for the firms that belong to a group in 2008. “FAMILY” is a dummy taking value equal to one for the firms that are family owned in 2008. “DEGW” is the share of workers with a university degree in 2008. “CAPTOLAB” is the capital to labour ration in 2008. “PMARGDEM” is a dummy variable taking value equal to one for the firms that declare to be fixing prices as margin over (variable or toal) costs and that responsiveness of demand for the product to variation in prices is the most important factor in determnining the size of such margin in 2008. The “Test” column reports the results of a mean-‐comparison F-‐test between the relative firm type (columns 1, 2 and 3) and the other firms (column 4): *=sig. 10%; **=sig. 5%; ***=sig. 1%.

© F. Landini | LUISS School of European Political Economy | WORKING PAPER | 10/2016
21
5. Competitive rents and firm exit 5.1 Empirical strategy
As argued above the impact of the Great Recession was heterogeneous within the Eurozone. This is true even when we restrict the analysis to France, Italy and Spain. According to Eurostat6, France experienced an overall increase of nearly 6% in GDP between 2008 and 2013, meanwhile Italy and Spain experienced a reduction, which was stronger in Spain (-‐8%) than in Italy (-‐2%). Similar differences characterize the trend of other macroeconomic variables as well, such as the unemployment rate, which during the same period has grown by 117% in Spain and 89% in Italy but “only” by 39% in France. Starting from this evidence the empirical strategy aims at exploiting such cross-‐country heterogeneity to test: a) the effect of competitive rents on the probability of firm exit during the recession; and b) whether such effect differs depending on the strength of the recession.
In particular, I estimate a set of cross-‐country probit regressions taking the following form:
)'-()1Pr( ,,,,1, jcjijijji LLABPRODHPROFITEXIT ββXC+⋅Φ== β (17)
)'()1Pr( ,,,,2,,1, jcjijijjijji LOWCOSTCOMPRENTEXIT ββXC+⋅+⋅Φ== ββ (18)
for j =FRA, ITA, SPA, where is the cumulative distribution function for the standard normal, XCi,j is a vector of control variables; and β1,j, β2,j and βc,j are the parameters to be estimated. The baseline assumption is that the beginning of the crisis acted as an exogenous and unexpected shock for firms, which allow the parameters in (17) and (18) to be estimated. The cross-‐country comparison of coefficients β1,j makes it possible to check if the effect of competitive rents varies with the strength of the crisis. In particular, the main hypotheses to be tested are that:
0,1 <jβ for j =FRA, ITA, SPA and FRAITASPA ,1,1,1 βββ >>
(Model’s Prediction 1) (Model’s Prediction 2)
Parameters are estimated via maximum likelihood (ML) estimation.
All independent variables in equations (17) and (18) are evaluated at the beginning of the Great Recession, i.e., considering the average between the 2007 and 2008 values. For some variables, only the 2008 value is considered (see below). On this basis, I use these variables to predict the probability of a firm exiting the market within the next 7 years (i.e., before 2015). Given the structure of the data, I obviously cannot exclude the possibility of model misspecification and omitted variable bias. To address this issue, I add to vector XCi,j several variables as controls for different types of firm-‐specific effects, offsetting the risk of running 6 Own elaboration of the data available at http://ec.europa.eu/eurostat/data/database (Accessed on: 26th of May 2016).
)(⋅Φ
© F. Landini | LUISS School of European Political Economy | WORKING PAPER | 10/2016
22
into multicollinearity. Because my concern is especially related to firm exit and competitive rents, I focus my attention on variables that can be correlated with them. For the potential correlates of firm exit I consider the following variables. First, in line with the literature that links firm performance and survival (for a review see Bartelsman and Doms, 2000), I control for PROFITi (average between 2007 and 2008 values) and LABPRODi (2008 value). Second, I include a set of demographic controls such as firm size measured in terms of number of employees (SIZEi) and age (AGEi) (both variables considering the logs of the 2008 value). On this respect, several works suggest that both size and age matter for firm survival (Jovanovic, 1982; Doms et al., 1995; Dunne et al., 1988; Mata and Portugal, 1994; Audretsch, 1995; Baldwin, 1995). Third, I include a set of financial variables to control for the firm’s vulnerability to financial shocks. In particular, I control for: a) the ratio of interest expenses over sales (IE/Si), which provides a flow measure of the annual costs borne by firms to repay debt (average between 2007 and 2008 values); b) the ratio of short term debts over sales (STD/Si), which gives a stock measure of the short term exposure of firms (average between 2007 and 2008 values); and c) the liquidity ratio (LIQUIDi), which captures the firms’ ability to repay debt out of their total cash (average between 2007 and 2008 values). Several contributions suggest that these variables affect the probability of firm survival (Bottazzi et al., 2011) and this effect may become particularly strong during recessions. Fourth, to control for trade as one of the transmission channel of the Great Recession (Claessens et al., 2012), I add a dummy variable taking value equal to one for the firms whose export counts for more than the 50% of their total sales and zero otherwise (EXPORTi) (2008 value). Finally, to control for institutional differences at the firm level, I include two dummy variables taking value equal to one for the firms that belong to a group (GROUPi) and for the firms that are family owned (FAMILYi), and zero otherwise (both variables considering the 2008 value).
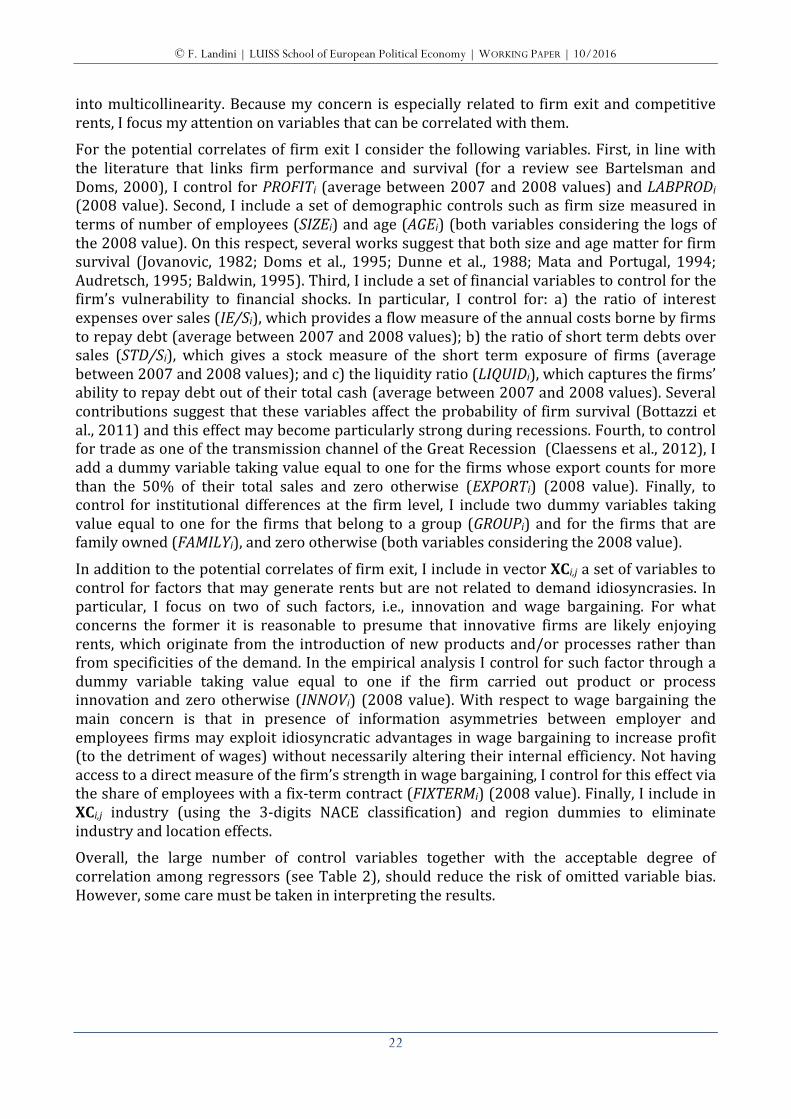
In addition to the potential correlates of firm exit, I include in vector XCi,j a set of variables to control for factors that may generate rents but are not related to demand idiosyncrasies. In particular, I focus on two of such factors, i.e., innovation and wage bargaining. For what concerns the former it is reasonable to presume that innovative firms are likely enjoying rents, which originate from the introduction of new products and/or processes rather than from specificities of the demand. In the empirical analysis I control for such factor through a dummy variable taking value equal to one if the firm carried out product or process innovation and zero otherwise (INNOVi) (2008 value). With respect to wage bargaining the main concern is that in presence of information asymmetries between employer and employees firms may exploit idiosyncratic advantages in wage bargaining to increase profit (to the detriment of wages) without necessarily altering their internal efficiency. Not having access to a direct measure of the firm’s strength in wage bargaining, I control for this effect via the share of employees with a fix-‐term contract (FIXTERMi) (2008 value). Finally, I include in XCi,j industry (using the 3-‐digits NACE classification) and region dummies to eliminate industry and location effects. Overall, the large number of control variables together with the acceptable degree of correlation among regressors (see Table 2), should reduce the risk of omitted variable bias. However, some care must be taken in interpreting the results.
© F. Landini | LUISS School of European Political Economy | WORKING PAPER | 10/2016
23
Table 2 – Correlation matrix, pooled dataset (1) (2) (3) (4) (5) (6) (7) (8) (9) (10) (11)
(1) PROFIT 1.000
(2) LABPROD 0.403* 1.000
(3) AGE -‐0.011 0.071* 1.000
(4) SIZE -‐0.021 0.010 0.177* 1.000
(5) IE/S 0.130* -‐0.085* -‐0.052* -‐0.012 1.000
(6) STD/S 0.034* -‐0.061* -‐0.057* 0.025* 0.545* 1.000
(7) LIQUID 0.283* 0.134* 0.074* -‐0.077* -‐0.237* -‐0.299* 1.000
(8) EXPORT (d) 0.013 0.146* 0.047* 0.207* 0.024* 0.063* -‐0.048* 1.000
(9) GROUP (d) -‐0.031* 0.125* 0.046* 0.362* -‐0.055* -‐0.016 -‐0.010 0.164* 1.000
(10) FAMILY (d) 0.022 -‐0.092* 0.066* -‐0.146* 0.074* 0.020 0.000 -‐0.029* -‐0.219* 1.000
(11) INNOV (d) 0.037 0.022 0.030* 0.142* 0.056* 0.057* -‐0.063* 0.129* 0.043* 0.060* 1.000
(12) FIXTERM 0.036* -‐0.099* -‐0.067* -‐0.006 0.044* -‐0.066* 0.040* -‐0.071* -‐0.023 0.076* 0.074*
Note: *=sig. 5%.
© F. Landini | LUISS School of European Political Economy | WORKING PAPER | 10/2016
24
5.2 Descriptive analysis on firm exit
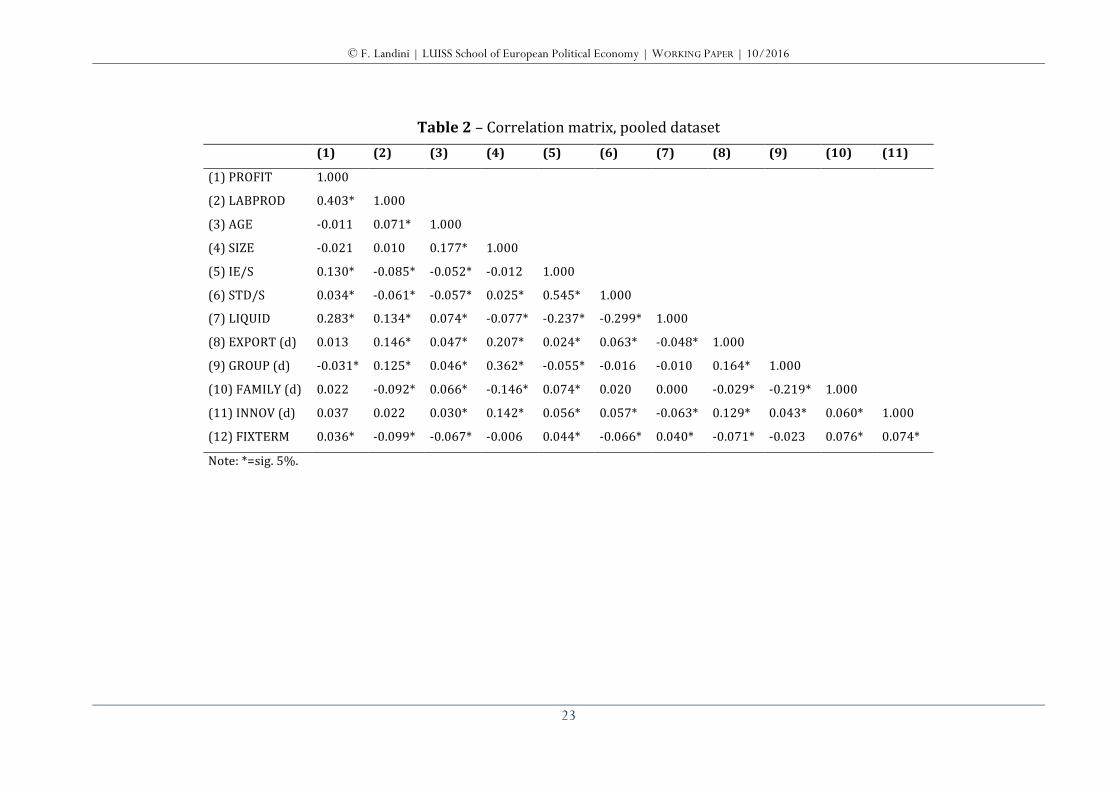
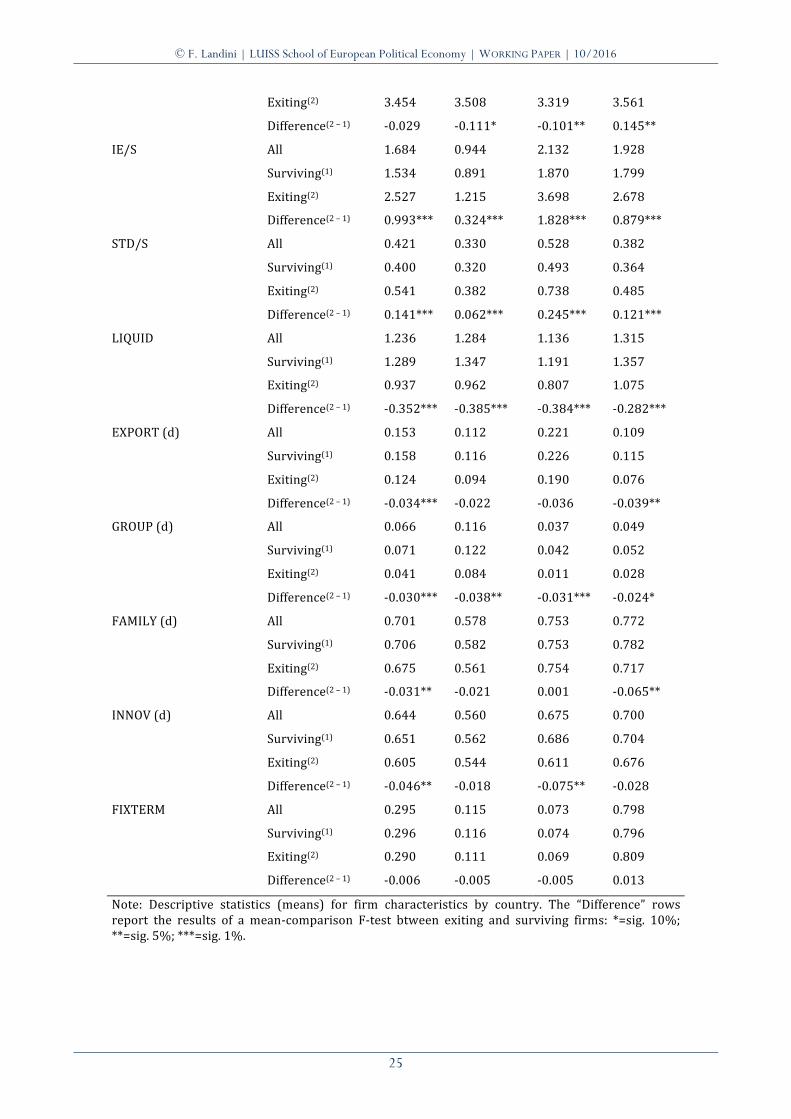
Table 3 presents summary statistics for surviving and exiting firms, disaggregated by country. Comparing across columns enables one to observe whether some differences exist among countries. Exiting firms are on average less profitable, less productive, younger, smaller, more exposed to financial constraints (in terms of both higher interest expenses and higher debts), less liquid and less likely to be part of a group than firm that survive. In Spain exiting firms are also less likely to be involved in export and to be family owned than surviving firms, whereas no significant difference in these respects emerge for Italy and France. At the same time the involvement in innovation activities is a characteristic that differentiate surviving and exiting firms in Italy (higher for the former than for the latter) but not in France and Spain.
Table 3 – Descriptive statistics (means), by country
(1)
Pooled
(2)
France
(3)
Italy
(4)
Spain
Mean Mean Mean Mean
H PROFIT–L LABPROD All 0.143 0.136 0.146 0.145
Surviving(1) 0.146 0.144 0.147 0.153
Exiting(2) 0.125 0.097 0.138 0.100
Difference(2 – 1) -‐0.021* -‐0.047** -‐0.009 -‐0.053**
COMP-‐RENT All 0.066 0.057 0.077 0.068
Surviving(1) 0.067 0.060 0.080 0.073
Exiting(2) 0.061 0.043 0.061 0.038
Difference(2 – 1) -‐0.006 -‐0.017 -‐0.019 -‐0.035**
LOW-‐COST All 0.076 0.079 0.069 0.077
Surviving(1) 0.079 0.084 0.068 0.080
Exiting(2) 0.064 0.054 0.077 0.062
Difference(2 – 1) -‐0.015 -‐0.030** 0.009 -‐0.018
PROFIT All 0.868 0.750 0.926 0.925
Surviving(1) 0.922 0.839 0.964 0.958
Exiting(2) 0.568 0.303 0.699 0.735
Difference(2 – 1) -‐0.354*** -‐0.536*** -‐0.265*** -‐0.223***
LABPROD All 3.753 3.779 3.823 3.629
Surviving(1) 3.791 3.830 3.863 3.651
Exiting(2) 3.537 3.520 3.581 3.500
Difference(2 – 1) -‐0.254*** -‐0.310*** -‐0.282*** -‐0.151***
AGE All 3.189 3.322 3.167 3.067
Surviving(1) 3.205 3.338 3.195 3.069
Exiting(2) 3.101 3.240 3.000 3.054
Difference(2 – 1) -‐0.104*** -‐0.098** -‐0.195*** -‐0.015
SIZE All 3.479 3.601 3.406 3.437
Surviving(1) 3.483 3.619 3.420 3.416
© F. Landini | LUISS School of European Political Economy | WORKING PAPER | 10/2016
25
Exiting(2) 3.454 3.508 3.319 3.561
Difference(2 – 1) -‐0.029 -‐0.111* -‐0.101** 0.145**
IE/S All 1.684 0.944 2.132 1.928
Surviving(1) 1.534 0.891 1.870 1.799
Exiting(2) 2.527 1.215 3.698 2.678
Difference(2 – 1) 0.993*** 0.324*** 1.828*** 0.879***
STD/S All 0.421 0.330 0.528 0.382
Surviving(1) 0.400 0.320 0.493 0.364
Exiting(2) 0.541 0.382 0.738 0.485
Difference(2 – 1) 0.141*** 0.062*** 0.245*** 0.121***
LIQUID All 1.236 1.284 1.136 1.315
Surviving(1) 1.289 1.347 1.191 1.357
Exiting(2) 0.937 0.962 0.807 1.075
Difference(2 – 1) -‐0.352*** -‐0.385*** -‐0.384*** -‐0.282***
EXPORT (d) All 0.153 0.112 0.221 0.109
Surviving(1) 0.158 0.116 0.226 0.115
Exiting(2) 0.124 0.094 0.190 0.076
Difference(2 – 1) -‐0.034*** -‐0.022 -‐0.036 -‐0.039**
GROUP (d) All 0.066 0.116 0.037 0.049
Surviving(1) 0.071 0.122 0.042 0.052
Exiting(2) 0.041 0.084 0.011 0.028
Difference(2 – 1) -‐0.030*** -‐0.038** -‐0.031*** -‐0.024*
FAMILY (d) All 0.701 0.578 0.753 0.772
Surviving(1) 0.706 0.582 0.753 0.782
Exiting(2) 0.675 0.561 0.754 0.717
Difference(2 – 1) -‐0.031** -‐0.021 0.001 -‐0.065**
INNOV (d) All 0.644 0.560 0.675 0.700
Surviving(1) 0.651 0.562 0.686 0.704
Exiting(2) 0.605 0.544 0.611 0.676
Difference(2 – 1) -‐0.046** -‐0.018 -‐0.075** -‐0.028
FIXTERM All 0.295 0.115 0.073 0.798
Surviving(1) 0.296 0.116 0.074 0.796
Exiting(2) 0.290 0.111 0.069 0.809
Difference(2 – 1) -‐0.006 -‐0.005 -‐0.005 0.013
Note: Descriptive statistics (means) for firm characteristics by country. The “Difference” rows report the results of a mean-‐comparison F-‐test btween exiting and surviving firms: *=sig. 10%; **=sig. 5%; ***=sig. 1%.
© F. Landini | LUISS School of European Political Economy | WORKING PAPER | 10/2016
26
With respect to competitive rents Table 3 provides a mixed picture. When the most general classification is used, i.e. variable H PROFIT-‐L LABPROD, the share of firms enjoying competitive rents is on average smaller among exiting firms than among surviving firms. This result is in line with the model’s predictions. However, the difference is statistically significant only in France and Spain, as well as in the pooled dataset, but not in Italy. When the split between LOW-‐COST and COMP-‐RENT firms is considered, firms with competitive rents remain less frequent among exiting firms than among surviving firms, but the difference is statistically significant only in Spain. Meanwhile, the adoption of a low cost strategy significantly differentiates surviving and exiting firms in France (more common in the former than in the latter), but not in Italy and Spain. Overall, the descriptive analysis confirms most of the previous findings concerning the features of exiting firms. This is true especially with reference to firm’s demographic characteristics (size and age), performance measures (profit and productivity) as well as finance-‐related indicators. Less clear is the evidence concerning the role of competitive rents. While the summary statistics suggest that exiting firms tend to be less likely to enjoy competitive rents than surviving firms, this evidence is not robust across countries. Moreover, from Table 3 it is not possible to establish whether the selection advantage ensured by competitive rents is bigger the stronger the crisis.
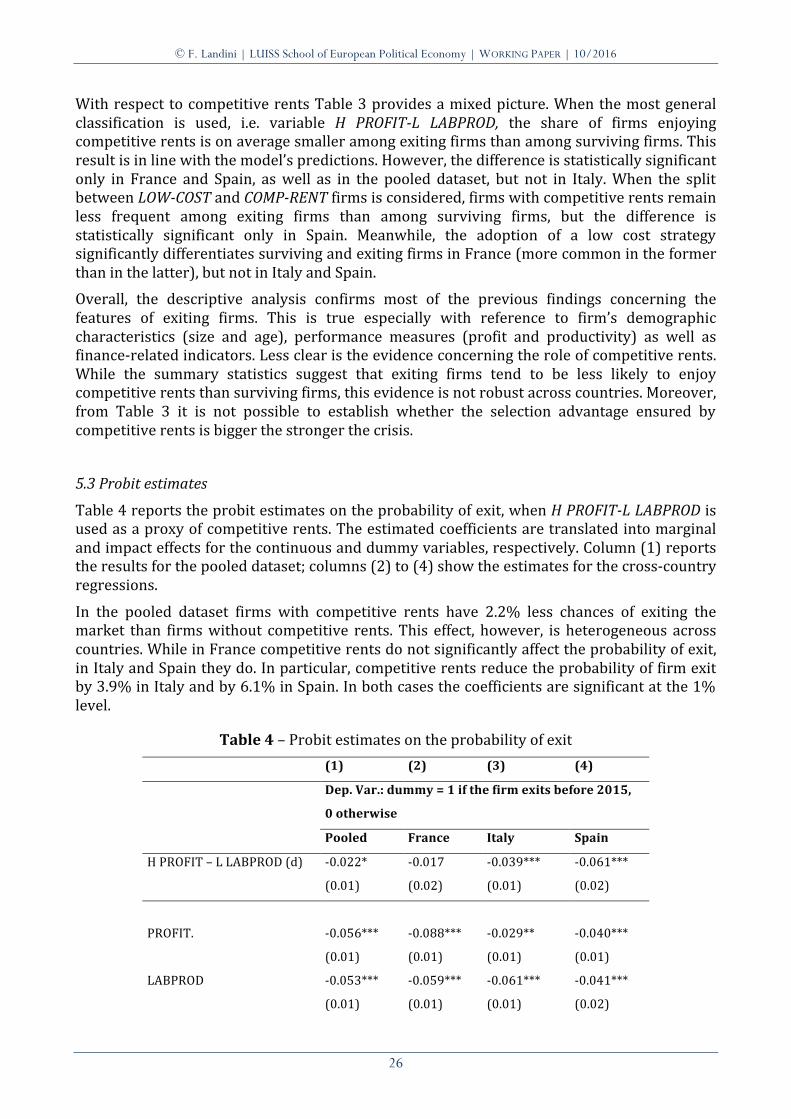
5.3 Probit estimates
Table 4 reports the probit estimates on the probability of exit, when H PROFIT-‐L LABPROD is used as a proxy of competitive rents. The estimated coefficients are translated into marginal and impact effects for the continuous and dummy variables, respectively. Column (1) reports the results for the pooled dataset; columns (2) to (4) show the estimates for the cross-‐country regressions.
In the pooled dataset firms with competitive rents have 2.2% less chances of exiting the market than firms without competitive rents. This effect, however, is heterogeneous across countries. While in France competitive rents do not significantly affect the probability of exit, in Italy and Spain they do. In particular, competitive rents reduce the probability of firm exit by 3.9% in Italy and by 6.1% in Spain. In both cases the coefficients are significant at the 1% level.
Table 4 – Probit estimates on the probability of exit (1) (2) (3) (4)
Dep. Var.: dummy = 1 if the firm exits before 2015,
0 otherwise
Pooled France Italy Spain
H PROFIT – L LABPROD (d) -‐0.022* -‐0.017 -‐0.039*** -‐0.061***
(0.01) (0.02) (0.01) (0.02)
PROFIT. -‐0.056*** -‐0.088*** -‐0.029** -‐0.040***
(0.01) (0.01) (0.01) (0.01)
LABPROD -‐0.053*** -‐0.059*** -‐0.061*** -‐0.041***
(0.01) (0.01) (0.01) (0.02)
© F. Landini | LUISS School of European Political Economy | WORKING PAPER | 10/2016
27
AGE -‐0.011** -‐0.008 -‐0.033*** 0.012
(0.01) (0.01) (0.01) (0.01)
SIZE 0.003 -‐0.020** 0.007 0.027***
(0.00) (0.01) (0.01) (0.01)
IE/S 0.023*** 0.012** 0.023*** 0.024***
(0.00) (0.01) (0.00) (0.00)
STD/S 0.062*** -‐0.003 0.071*** 0.027
(0.02) (0.05) (0.02) (0.03)
LIQUID -‐0.017* -‐0.072*** -‐0.027 -‐0.004
(0.01) (0.01) (0.02) (0.01)
EXPORT (d) -‐0.014 0.002 -‐0.021 -‐0.036*
(0.01) (0.03) (0.01) (0.02)
GROUP (d) -‐0.055*** -‐0.049** -‐0.050** -‐0.074***
(0.01) (0.02) (0.03) (0.02)
FAMILY (d) -‐0.026*** -‐0.016 -‐0.016 -‐0.059***
(0.01) (0.01) (0.01) (0.02)
INNOV (d) -‐0.016* 0.001 -‐0.030** -‐0.012
(0.01) (0.01) (0.01) (0.02)
FIXTERM 0.008 -‐0.004 -‐0.024 0.038
(0.02) (0.03) (0.04) (0.03)
Reg. dummies Yes Yes Yes Yes
Ind. dummies Yes Yes Yes Yes
Obs 6865 2252 2642 1971
LogL -‐2484.562 -‐826.253 -‐851.647 -‐698.737
Chi2 566.747*** 269.645*** 366.153*** 221.397***
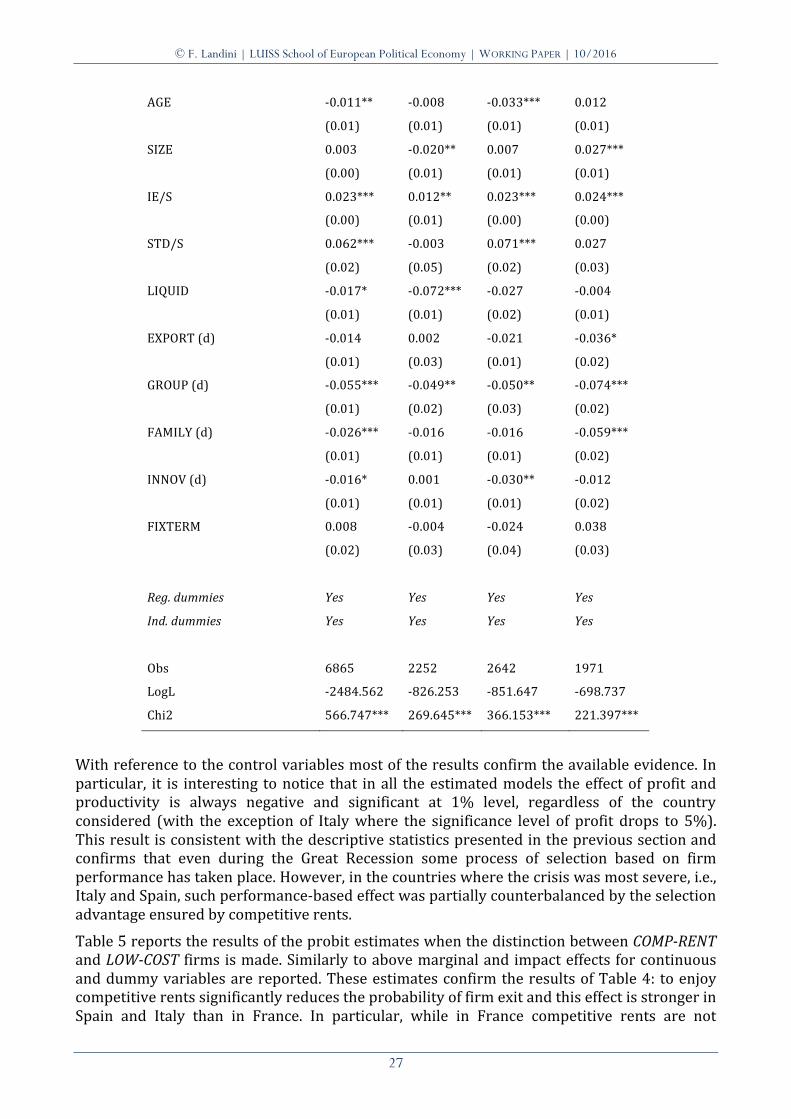
With reference to the control variables most of the results confirm the available evidence. In particular, it is interesting to notice that in all the estimated models the effect of profit and productivity is always negative and significant at 1% level, regardless of the country considered (with the exception of Italy where the significance level of profit drops to 5%). This result is consistent with the descriptive statistics presented in the previous section and confirms that even during the Great Recession some process of selection based on firm performance has taken place. However, in the countries where the crisis was most severe, i.e., Italy and Spain, such performance-‐based effect was partially counterbalanced by the selection advantage ensured by competitive rents.
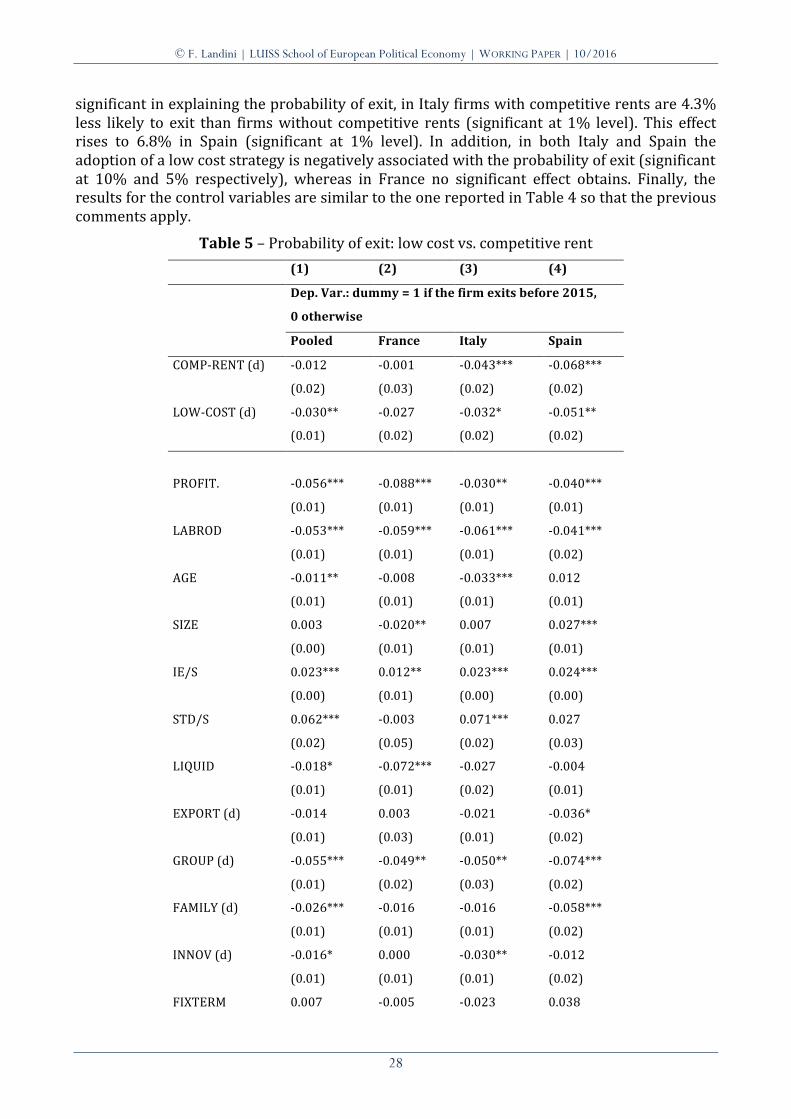
Table 5 reports the results of the probit estimates when the distinction between COMP-‐RENT and LOW-‐COST firms is made. Similarly to above marginal and impact effects for continuous and dummy variables are reported. These estimates confirm the results of Table 4: to enjoy competitive rents significantly reduces the probability of firm exit and this effect is stronger in Spain and Italy than in France. In particular, while in France competitive rents are not
© F. Landini | LUISS School of European Political Economy | WORKING PAPER | 10/2016
28
significant in explaining the probability of exit, in Italy firms with competitive rents are 4.3% less likely to exit than firms without competitive rents (significant at 1% level). This effect rises to 6.8% in Spain (significant at 1% level). In addition, in both Italy and Spain the adoption of a low cost strategy is negatively associated with the probability of exit (significant at 10% and 5% respectively), whereas in France no significant effect obtains. Finally, the results for the control variables are similar to the one reported in Table 4 so that the previous comments apply.
Table 5 – Probability of exit: low cost vs. competitive rent (1) (2) (3) (4)
Dep. Var.: dummy = 1 if the firm exits before 2015,
0 otherwise
Pooled France Italy Spain
COMP-‐RENT (d) -‐0.012 -‐0.001 -‐0.043*** -‐0.068***
(0.02) (0.03) (0.02) (0.02)
LOW-‐COST (d) -‐0.030** -‐0.027 -‐0.032* -‐0.051**
(0.01) (0.02) (0.02) (0.02)
PROFIT. -‐0.056*** -‐0.088*** -‐0.030** -‐0.040***
(0.01) (0.01) (0.01) (0.01)
LABROD -‐0.053*** -‐0.059*** -‐0.061*** -‐0.041***
(0.01) (0.01) (0.01) (0.02)
AGE -‐0.011** -‐0.008 -‐0.033*** 0.012
(0.01) (0.01) (0.01) (0.01)
SIZE 0.003 -‐0.020** 0.007 0.027***
(0.00) (0.01) (0.01) (0.01)
IE/S 0.023*** 0.012** 0.023*** 0.024***
(0.00) (0.01) (0.00) (0.00)
STD/S 0.062*** -‐0.003 0.071*** 0.027
(0.02) (0.05) (0.02) (0.03)
LIQUID -‐0.018* -‐0.072*** -‐0.027 -‐0.004
(0.01) (0.01) (0.02) (0.01)
EXPORT (d) -‐0.014 0.003 -‐0.021 -‐0.036*
(0.01) (0.03) (0.01) (0.02)
GROUP (d) -‐0.055*** -‐0.049** -‐0.050** -‐0.074***
(0.01) (0.02) (0.03) (0.02)
FAMILY (d) -‐0.026*** -‐0.016 -‐0.016 -‐0.058***
(0.01) (0.01) (0.01) (0.02)
INNOV (d) -‐0.016* 0.000 -‐0.030** -‐0.012
(0.01) (0.01) (0.01) (0.02)
FIXTERM 0.007 -‐0.005 -‐0.023 0.038

© F. Landini | LUISS School of European Political Economy | WORKING PAPER | 10/2016
29
(0.02) (0.03) (0.04) (0.03)
Reg. dummies Yes Yes Yes Yes
Ind. dummies Yes Yes Yes Yes
Obs 6865 2252 2642 1971
LogL -‐2484.136 -‐826.025 -‐851.508 -‐698.534
Chi2 566.468*** 271.176*** 367.582*** 222.388***
Overall, the results of the estimated models are highly consistent with Model’s predictions. In line with Prediction 1 firms with competitive rents enjoy a selection advantage and ceteris paribus they are less likely to exit than firms without competitive rents. Moreover, following Prediction 2, the size of the selection advantage tends to be stronger in the countries that were more severely hit by the downturn, i.e. Italy and Spain relative to France. The results of the control variables confirm that firm-‐level performance matters for survival, but this effect needs to be considered jointly with the selection distortions caused by competitive rents. Finally, the estimates suggest that especially in Italy and Spain the choice to sustain profitability via the adoption of a low cost strategy can improve the chances of survival. Whether the latter aspect is a good thing with respect to the need to sustain aggregate productivity growth during recovery, however, is an open question.
5.4. Robustness checks
I conduct a series of robustness checks. First, I run the same analysis discussed in the previous sections considering total factor productivity (TFP) instead of LABPROD as a measure of the firm’s internal efficiency. TFP is calculated according to Levinsohn and Petrin’s (2003) semi-‐parametric algorithm (for details see Altomonte et al. 2013). The reason why TFP was not used in the first place is twofold. Firstly, for both France and Spain the estimates of the TFP based on the variables available in the EFIGE-‐Amadeus matched sample report several missing values, so that the number of observations drops (form 2252 to 1983 observations in France and from 1971 to 1955 observations in Spain). Secondly, the adopted measures of competitive rents rest on a deviation-‐from-‐the-‐industry-‐mean specification of LABPROD, so that any productivity differential due to industry-‐specific differences in capital intensity is eliminated. At the same time, however, it is not possible to rule out the existence of within-‐industry differences in firm-‐level capital intensity. Therefore, a test based on TFP measures of internal efficiency is appropriate.
Tables 6 and 7 report the results of such test. TFP is used in place of LABPROD both as control variable and in the computation of competitive rents. The model specifications and the measures of the other variables remain the same as in Tables 4 and 5. Most of the previous results are valid. Competitive rents reduce the probability of exit between 2.8% and 3.9% in Italy and between 3.7 and 4.5% in Spain, depending on the model specification. These effects are significant at 5% level in all models, expect for the estimate of H PROFIT -‐ L TFP that in Italy is significant only at 10% level. No significant effect for competitive rents is found for France. Among the control variables it is worth noticing that TFP is not significant in explaining the probability of exit in France and only weakly significant in Spain. While this result is in partial contrast with the previous estimates and with other studies, it can be
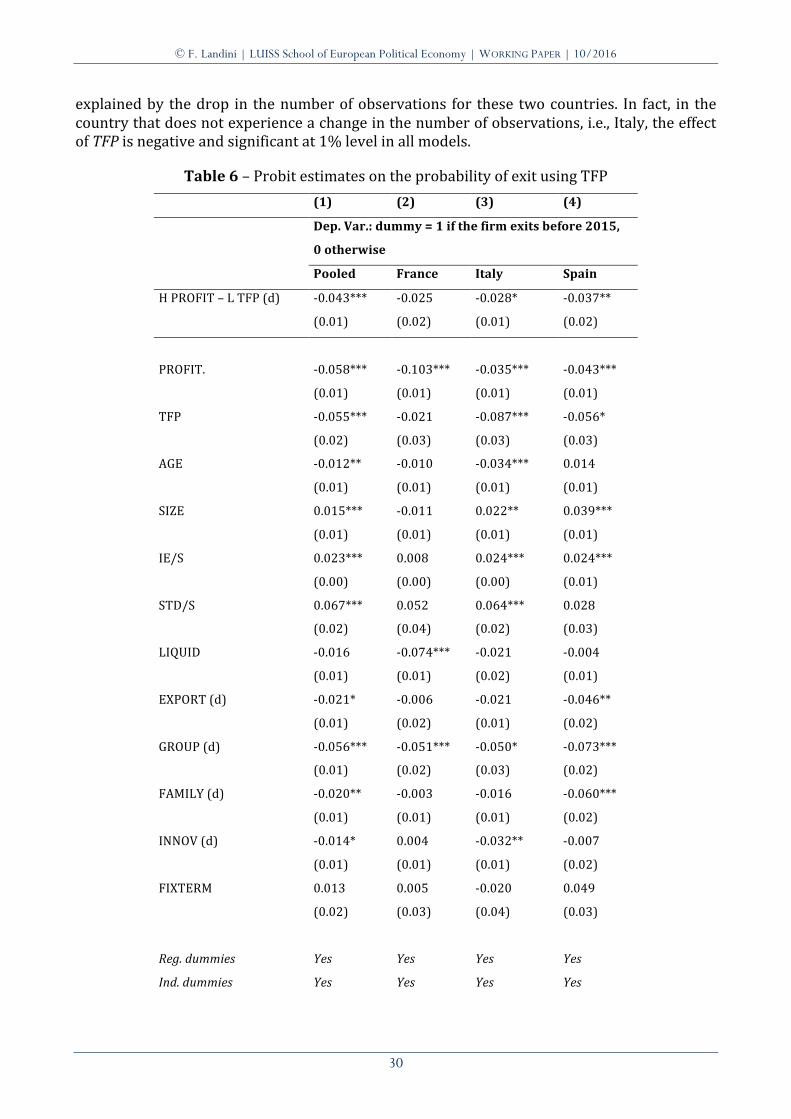
© F. Landini | LUISS School of European Political Economy | WORKING PAPER | 10/2016
30
explained by the drop in the number of observations for these two countries. In fact, in the country that does not experience a change in the number of observations, i.e., Italy, the effect of TFP is negative and significant at 1% level in all models.
Table 6 – Probit estimates on the probability of exit using TFP (1) (2) (3) (4)
Dep. Var.: dummy = 1 if the firm exits before 2015,
0 otherwise
Pooled France Italy Spain
H PROFIT – L TFP (d) -‐0.043*** -‐0.025 -‐0.028* -‐0.037**
(0.01) (0.02) (0.01) (0.02)
PROFIT. -‐0.058*** -‐0.103*** -‐0.035*** -‐0.043***
(0.01) (0.01) (0.01) (0.01)
TFP -‐0.055*** -‐0.021 -‐0.087*** -‐0.056*
(0.02) (0.03) (0.03) (0.03)
AGE -‐0.012** -‐0.010 -‐0.034*** 0.014
(0.01) (0.01) (0.01) (0.01)
SIZE 0.015*** -‐0.011 0.022** 0.039***
(0.01) (0.01) (0.01) (0.01)
IE/S 0.023*** 0.008 0.024*** 0.024***
(0.00) (0.00) (0.00) (0.01)
STD/S 0.067*** 0.052 0.064*** 0.028
(0.02) (0.04) (0.02) (0.03)
LIQUID -‐0.016 -‐0.074*** -‐0.021 -‐0.004
(0.01) (0.01) (0.02) (0.01)
EXPORT (d) -‐0.021* -‐0.006 -‐0.021 -‐0.046**
(0.01) (0.02) (0.01) (0.02)
GROUP (d) -‐0.056*** -‐0.051*** -‐0.050* -‐0.073***
(0.01) (0.02) (0.03) (0.02)
FAMILY (d) -‐0.020** -‐0.003 -‐0.016 -‐0.060***
(0.01) (0.01) (0.01) (0.02)
INNOV (d) -‐0.014* 0.004 -‐0.032** -‐0.007
(0.01) (0.01) (0.01) (0.02)
FIXTERM 0.013 0.005 -‐0.020 0.049
(0.02) (0.03) (0.04) (0.03)
Reg. dummies Yes Yes Yes Yes
Ind. dummies Yes Yes Yes Yes
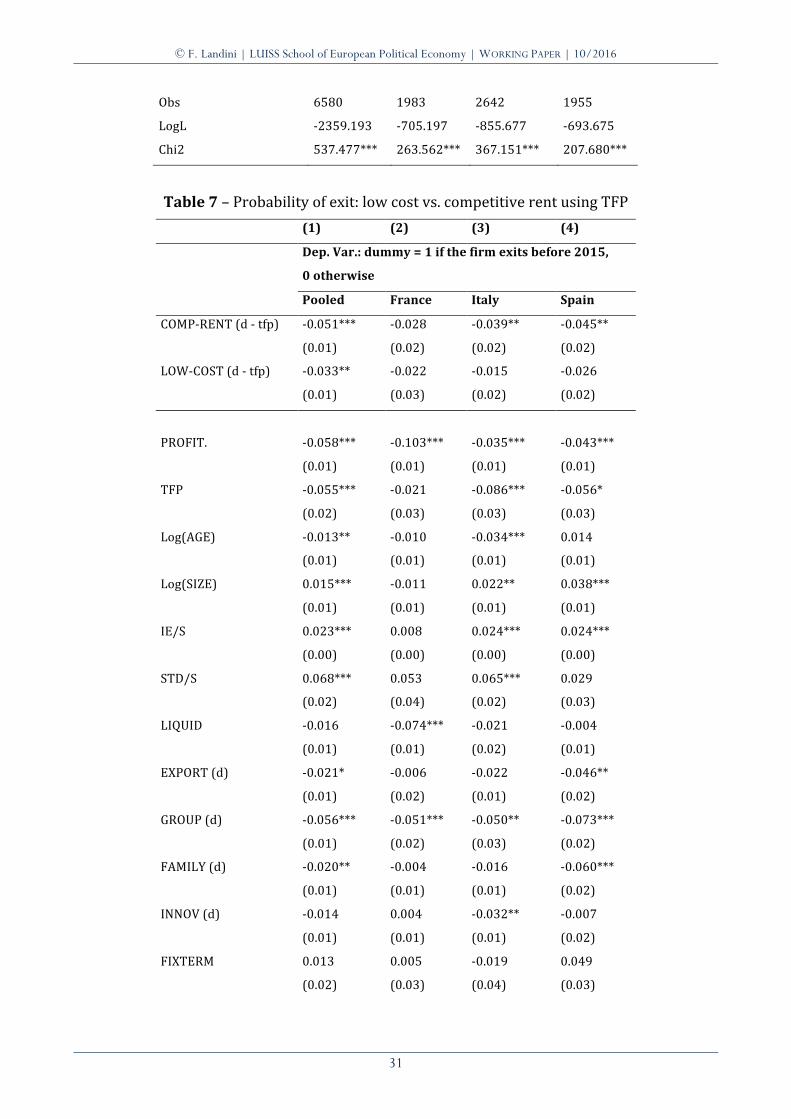
© F. Landini | LUISS School of European Political Economy | WORKING PAPER | 10/2016
31
Obs 6580 1983 2642 1955
LogL -‐2359.193 -‐705.197 -‐855.677 -‐693.675
Chi2 537.477*** 263.562*** 367.151*** 207.680***
Table 7 – Probability of exit: low cost vs. competitive rent using TFP (1) (2) (3) (4)
Dep. Var.: dummy = 1 if the firm exits before 2015,
0 otherwise
Pooled France Italy Spain
COMP-‐RENT (d -‐ tfp) -‐0.051*** -‐0.028 -‐0.039** -‐0.045**
(0.01) (0.02) (0.02) (0.02)
LOW-‐COST (d -‐ tfp) -‐0.033** -‐0.022 -‐0.015 -‐0.026
(0.01) (0.03) (0.02) (0.02)
PROFIT. -‐0.058*** -‐0.103*** -‐0.035*** -‐0.043***
(0.01) (0.01) (0.01) (0.01)
TFP -‐0.055*** -‐0.021 -‐0.086*** -‐0.056*
(0.02) (0.03) (0.03) (0.03)
Log(AGE) -‐0.013** -‐0.010 -‐0.034*** 0.014
(0.01) (0.01) (0.01) (0.01)
Log(SIZE) 0.015*** -‐0.011 0.022** 0.038***
(0.01) (0.01) (0.01) (0.01)
IE/S 0.023*** 0.008 0.024*** 0.024***
(0.00) (0.00) (0.00) (0.00)
STD/S 0.068*** 0.053 0.065*** 0.029
(0.02) (0.04) (0.02) (0.03)
LIQUID -‐0.016 -‐0.074*** -‐0.021 -‐0.004
(0.01) (0.01) (0.02) (0.01)
EXPORT (d) -‐0.021* -‐0.006 -‐0.022 -‐0.046**
(0.01) (0.02) (0.01) (0.02)
GROUP (d) -‐0.056*** -‐0.051*** -‐0.050** -‐0.073***
(0.01) (0.02) (0.03) (0.02)
FAMILY (d) -‐0.020** -‐0.004 -‐0.016 -‐0.060***
(0.01) (0.01) (0.01) (0.02)
INNOV (d) -‐0.014 0.004 -‐0.032** -‐0.007
(0.01) (0.01) (0.01) (0.02)
FIXTERM 0.013 0.005 -‐0.019 0.049
(0.02) (0.03) (0.04) (0.03)
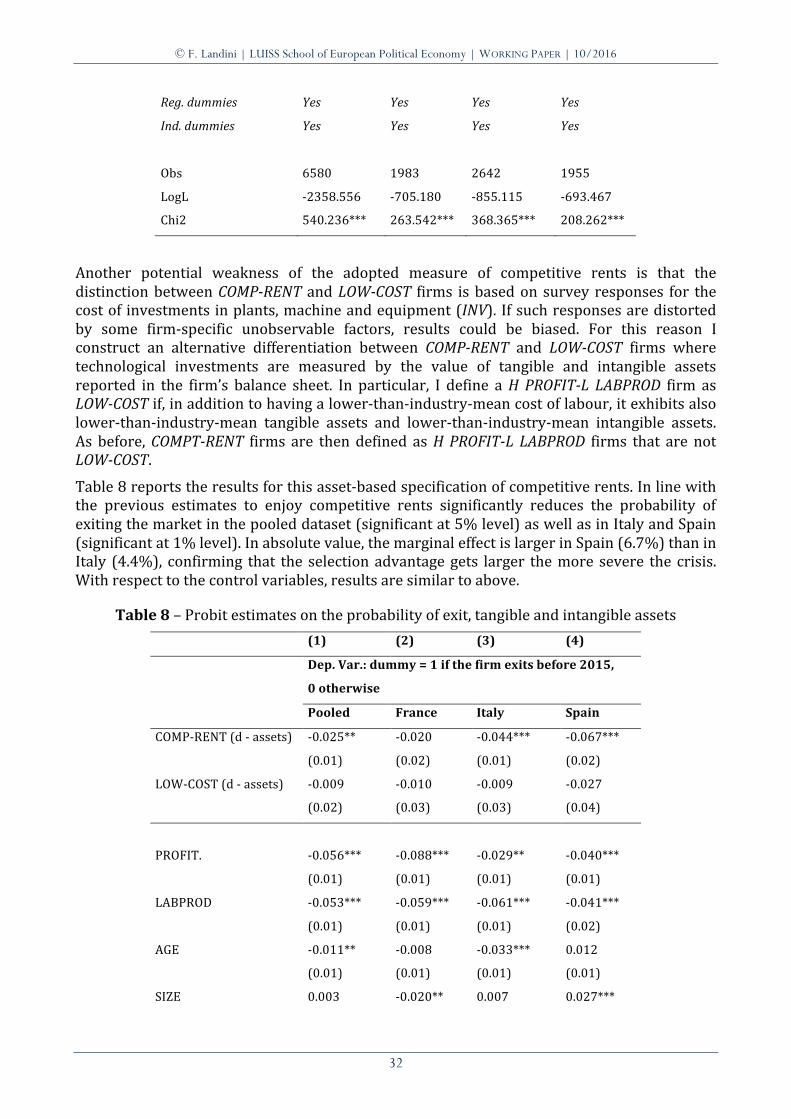
© F. Landini | LUISS School of European Political Economy | WORKING PAPER | 10/2016
32
Reg. dummies Yes Yes Yes Yes
Ind. dummies Yes Yes Yes Yes
Obs 6580 1983 2642 1955
LogL -‐2358.556 -‐705.180 -‐855.115 -‐693.467
Chi2 540.236*** 263.542*** 368.365*** 208.262***
Another potential weakness of the adopted measure of competitive rents is that the distinction between COMP-‐RENT and LOW-‐COST firms is based on survey responses for the cost of investments in plants, machine and equipment (INV). If such responses are distorted by some firm-‐specific unobservable factors, results could be biased. For this reason I construct an alternative differentiation between COMP-‐RENT and LOW-‐COST firms where technological investments are measured by the value of tangible and intangible assets reported in the firm’s balance sheet. In particular, I define a H PROFIT-‐L LABPROD firm as LOW-‐COST if, in addition to having a lower-‐than-‐industry-‐mean cost of labour, it exhibits also lower-‐than-‐industry-‐mean tangible assets and lower-‐than-‐industry-‐mean intangible assets. As before, COMPT-‐RENT firms are then defined as H PROFIT-‐L LABPROD firms that are not LOW-‐COST.
Table 8 reports the results for this asset-‐based specification of competitive rents. In line with the previous estimates to enjoy competitive rents significantly reduces the probability of exiting the market in the pooled dataset (significant at 5% level) as well as in Italy and Spain (significant at 1% level). In absolute value, the marginal effect is larger in Spain (6.7%) than in Italy (4.4%), confirming that the selection advantage gets larger the more severe the crisis. With respect to the control variables, results are similar to above.
Table 8 – Probit estimates on the probability of exit, tangible and intangible assets (1) (2) (3) (4)
Dep. Var.: dummy = 1 if the firm exits before 2015,
0 otherwise
Pooled France Italy Spain
COMP-‐RENT (d -‐ assets) -‐0.025** -‐0.020 -‐0.044*** -‐0.067***
(0.01) (0.02) (0.01) (0.02)
LOW-‐COST (d -‐ assets) -‐0.009 -‐0.010 -‐0.009 -‐0.027
(0.02) (0.03) (0.03) (0.04)
PROFIT. -‐0.056*** -‐0.088*** -‐0.029** -‐0.040***
(0.01) (0.01) (0.01) (0.01)
LABPROD -‐0.053*** -‐0.059*** -‐0.061*** -‐0.041***
(0.01) (0.01) (0.01) (0.02)
AGE -‐0.011** -‐0.008 -‐0.033*** 0.012
(0.01) (0.01) (0.01) (0.01)
SIZE 0.003 -‐0.020** 0.007 0.027***
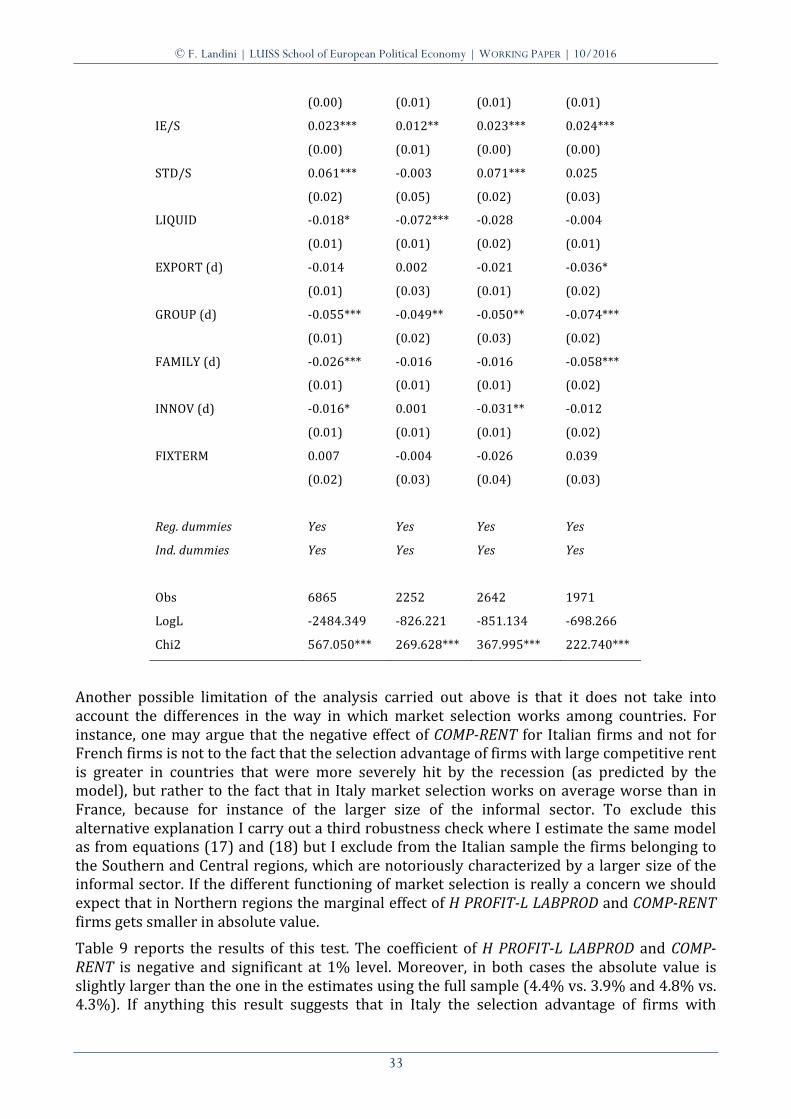
© F. Landini | LUISS School of European Political Economy | WORKING PAPER | 10/2016
33
(0.00) (0.01) (0.01) (0.01)
IE/S 0.023*** 0.012** 0.023*** 0.024***
(0.00) (0.01) (0.00) (0.00)
STD/S 0.061*** -‐0.003 0.071*** 0.025
(0.02) (0.05) (0.02) (0.03)
LIQUID -‐0.018* -‐0.072*** -‐0.028 -‐0.004
(0.01) (0.01) (0.02) (0.01)
EXPORT (d) -‐0.014 0.002 -‐0.021 -‐0.036*
(0.01) (0.03) (0.01) (0.02)
GROUP (d) -‐0.055*** -‐0.049** -‐0.050** -‐0.074***
(0.01) (0.02) (0.03) (0.02)
FAMILY (d) -‐0.026*** -‐0.016 -‐0.016 -‐0.058***
(0.01) (0.01) (0.01) (0.02)
INNOV (d) -‐0.016* 0.001 -‐0.031** -‐0.012
(0.01) (0.01) (0.01) (0.02)
FIXTERM 0.007 -‐0.004 -‐0.026 0.039
(0.02) (0.03) (0.04) (0.03)
Reg. dummies Yes Yes Yes Yes
Ind. dummies Yes Yes Yes Yes
Obs 6865 2252 2642 1971
LogL -‐2484.349 -‐826.221 -‐851.134 -‐698.266
Chi2 567.050*** 269.628*** 367.995*** 222.740***
Another possible limitation of the analysis carried out above is that it does not take into account the differences in the way in which market selection works among countries. For instance, one may argue that the negative effect of COMP-‐RENT for Italian firms and not for French firms is not to the fact that the selection advantage of firms with large competitive rent is greater in countries that were more severely hit by the recession (as predicted by the model), but rather to the fact that in Italy market selection works on average worse than in France, because for instance of the larger size of the informal sector. To exclude this alternative explanation I carry out a third robustness check where I estimate the same model as from equations (17) and (18) but I exclude from the Italian sample the firms belonging to the Southern and Central regions, which are notoriously characterized by a larger size of the informal sector. If the different functioning of market selection is really a concern we should expect that in Northern regions the marginal effect of H PROFIT-‐L LABPROD and COMP-‐RENT firms gets smaller in absolute value. Table 9 reports the results of this test. The coefficient of H PROFIT-‐L LABPROD and COMP-‐RENT is negative and significant at 1% level. Moreover, in both cases the absolute value is slightly larger than the one in the estimates using the full sample (4.4% vs. 3.9% and 4.8% vs. 4.3%). If anything this result suggests that in Italy the selection advantage of firms with

© F. Landini | LUISS School of European Political Economy | WORKING PAPER | 10/2016
34
competitive rents is not driven by the bad functioning of market selection; rather it is consistent with a resilience effect of competitive rents, as suggested by the theoretical model.
Table 9 – Probit estimates on the probability of exit of firms from Italian Northern regions (1) (2)
Dep. Var.: dummy = 1 if the firm exits before 2015, 0 otherwise
Italy Italy
H PROFIT – L LABPROD (d) -‐0.044***
(0.02)
COMP-‐RENT (d) -‐0.048***
(0.02)
LOW-‐COST (d) -‐0.036
(0.02)
PROFIT. -‐0.042*** -‐0.042***
(0.01) (0.01)
LABPROD -‐0.050*** -‐0.050***
(0.02) (0.02)
AGE -‐0.032*** -‐0.032***
(0.01) (0.01)
SIZE -‐0.011 -‐0.011
(0.01) (0.01)
IE/S 0.019*** 0.019***
(0.00) (0.00)
STD/S 0.075*** 0.076***
(0.03) (0.03)
LIQUID -‐0.018 -‐0.018
(0.02) (0.02)
EXPORT (d) -‐0.034** -‐0.034**
(0.01) (0.01)
GROUP (d) -‐0.043* -‐0.043*
(0.02) (0.02)
FAMILY (d) -‐0.040** -‐0.041**
(0.02) (0.02)
INNOV (d) -‐0.003 -‐0.003
(0.01) (0.01)
FIXTERM 0.018 0.019
(0.05) (0.05)
© F. Landini | LUISS School of European Political Economy | WORKING PAPER | 10/2016
35
Reg. dummies Yes Yes
Ind. dummies Yes Yes
Obs 1819 1819
LogL -‐555.019 -‐554.905
Chi2 250.627*** 252.723***
6. Policy implications The empirical analysis provides results that are consistent with the proposition according to which competitive rents generate a selection advantage that may distort the process of firm selection during recessions. Competitive rents allows relatively inefficient firms to sustain profit via setting higher prices (or selling more quantities at a given price), which in turn strengthen their ability to absorb external shocks. When such selection advantage is particularly strong, it can attenuate the cleansing mechanism based on productivity differentials leaving the economy with widespread spots of production inefficiency.
These results have two relevant policy implications. The first one concerns the debate on the determinants of weak selection among firms. So far the academic and policy discourse has focused on imperfections in the markets for inputs as the main source of distortions in the process of firm selection. According to this view capital and labour market flexibility is what the economy needs to carry out the reallocation of workers and capital needed for productivity growth. High-‐productivity firms must be able grow, and low-‐productivity firms to contract and eventually exit. Production inputs must therefore be reallocated from the latter to the former as efficiently as possible, otherwise aggregate productivity growth slows down. On this respect, Petrin and Sivadasan (2013) find that legislations imposing high costs to dismiss workers are indeed a key factor that reduces allocative efficiency among firms. Along the same lines, Banerjee and Minshi (2004) show that financial market imperfections are important determinants of capital misallocation across producers. Hsieh and Klenow (2009), Bartelsman et al., (2013) and Restuccia and Rogerson (2008) (among others) find similar results. Based on this evidence, EU policy makers have devoted increasing attention to the flexibility of input markets (especially labour) as a key requirement to improve allocative efficiency and productivity growth within the EU (e.g. European Commission, 2015; Calligaris et al., 2016).
However, as suggested by the results of the previous section, the rigidity of the input markets is only one of the factors that may distort the process of firm selection, another being demand idiosyncrasies and the related competitive rents. Indeed, there are almost surely complementarities between input market flexibility and competitive rents in determining the appropriateness of the selection dynamics. For instance, if some firms enjoy large and persistent competitive rents, input flexibility alone cannot ensure that an efficient reallocation of resources from low-‐productivity to high-‐productivity producers will actually take place. Firms that are relatively inefficient buy enjoy competitive rents will continue to operate in the markets, retaining resources that could be freed up for more productive uses. As a result allocative efficiency will only partially be achieved and aggregate productivity will stagnate.
For this reason, alongside interventions that aim at strengthening the flexibility of input markets, policy makers should devote far more attention to policies that foster firm

© F. Landini | LUISS School of European Political Economy | WORKING PAPER | 10/2016
36
competition and eliminate (for what is possible) the sources of competitive rents. As discussed above, among such sources there can be both physical and institutional factors. In Italy, for instance, the duality of transportation costs that characterize southern and northern provinces can certainly be the source of competitive rents, which could be attenuated through well-‐designed investments in infrastructure (Picci, 2002; Lakshmanan, 2011; Redding and Turner, 2014). Similar factors affect the performance of manufacturing firms in Spain (Cantos et al., 2005) and France (Combes and Lafourcade, 2005). Moreover, institutional factors can also be important determinants of competitive rents. Cingano and Pinotti (2013), for instance, show that connections between firms and politicians can be a relevant source of competitive rents via sustained sales in domestic markets. In this case too policy interventions aimed at reducing the distortionary effects of such factors should be welcomed.
The second policy implication of the above analysis concerns the post-‐crisis recovery phase. The above results suggest not only that in presence of competitive rents relatively inefficient firms, which should otherwise exit, may survive during the crisis, but also that such distortionary effect is larger in the countries that are more severely hit by the downturn. This implies that alongside the social costs due to increased unemployment and uncertainty, the recession can have also an economic cost associated with the permanence of long tails of inefficient producers within the economy. During the recovery phase such long tails can slow down the process of aggregate productivity growth and weaken the effect standard market-‐based economic interventions. Therefore, non-‐standard economic policies to sustain economic growth (e.g. via public investments) may be needed.
7. Conclusion This paper has explored the role of demand idiosyncrasies and the related competitive rents in distorting the process of firm selection during recessions. Firms with competitive rents can sustain profit independently of their internal efficiency, weakening the process of firm selection based on productivity differentials. In presence of an economic recession the selection advantage of competitive rents gets larger, because the latter operate as a resilience factor that helps firms to absorb the negative shocks. As a result the supposedly cleansing role of recessions is limited. The effect of competitive rents is tested on a sample of European manufacturing firms. A wide set of firm-‐level characteristics at the beginning of the Great Recession is used to predict the probability of exit within the next 7 years. The estimates provide results that are highly consistent with the theoretical predictions: (a) ceteris paribus firms with competitive rents are less likely to exit than firms without competitive rents; and (b) the size of this effect (in absolute value) is larger in the countries that were more severely hit by the downturn, i.e. Italy and Spain relative to France. Alongside the contribution to the scientific debate on the weakness of firm selection and the lack of cleansing effects, these results have interesting policy implications. First they suggest that in addition to input market rigidity, which is usually the focus of policy makers, also competitive rents can be important causes of allocative inefficiency within the economic system. Interventions aimed at reducing the sources of competitive rents, e.g. via the elimination of the physical and institutional barriers to competition, should therefore be welcomed. Second, the results of the analysis reveal that recovery can be particularly difficult in the countries that are most severely hit by the downturn, where the allocative distortions due to competitive rents is particularly acute. In these countries non-‐standard economic policies to sustain economic growth (e.g. via public investments) may be needed.
© F. Landini | LUISS School of European Political Economy | WORKING PAPER | 10/2016
37
As is often the case, the analysis suffers of some weaknesses. With respect to the data, the availability of comparable firm-‐level information for three countries only is certainly a limit. In particular, it could be interesting to integrate the dataset with information from other countries as well, especially Germany. This would make the findings more robust. Moreover, the fact that the panel-‐structure of the balance sheet data cannot be exploited to study firm selection is also a limit. In this sense the empirical analysis is to be interpreted more as an exercise providing results that are consistent with the model prediction, than as a definite tests on the determinants of firm exit. Finally, the results of the paper open new lines for future research. In particular, it could be interesting to study in greater detail the different sources of competitive rents and test their impact on firm performance. As argued above, alongside transportation costs and institutional barriers, competitive rents can also derive from firm-‐specific strategies, such as product customization. The extent to which the latter can be the source of allocative inefficiencies and their relative strength compared to other determinants of competitive rents is an interesting question for both academics and policy makers.
Acknowledgement
I thank Alessandro Arrighetti, Stefano Bianchini and Marcello Messori for the useful comments. I have also benefited from seminar participants at the School of European Political Economy -‐ LUISS University and University of Parma. The usual caveat applies.
© F. Landini | LUISS School of European Political Economy | WORKING PAPER | 10/2016
38
Appendix.
The identification of firms that are part of EFIGE dataset and exited the market before 2015 is based on the information contained in the Amadeus-‐BVD database. For each firm such database makes it possible to establish the “firm status” following different types of legal action. The available classification distinguishes between firms that are “active” and those that are “inactive” or “in liquidation”.
Then, independently of the available “firm status”, I checked whether the Amadeus-‐BVD database contains information on the specific legal actions to which a firm may be subjected. Although an ending date for pending legal action is not always available in the database, it is plausible to assume that the opening of such an action (for instance the company’s liquidation or failure) is a signal of a significant downsizing of the firm’s operations, which may even be associated with the firm’s actual exit. On this basis, I have identified a series of criteria that help categorizing firms as being either “surviving” or “exiting”. In particular, I define a firm as “surviving” if in 2015:
a) Her status in the Amadeus-‐BVD database is “active” with no pending legal actions; b) Her status in the Amadeus-‐BVD database is “active” and there are pending legal actions
that refer only to a transfer to another province.
A firm is instead categorized as “exiting” if in 2014: a) Her status in the Amadeus-‐BVD database is “in liquidation”
b) Her status in the Amadeus-‐BVD database is “inactive” and there are no pending legal actions related to merges and/or acquisitions
c) Her status in the Amadeus-‐BVD database is “active” and there are pending legal actions related to debt restructuring, failure, liquidation, insolvency, creditor agreement.
Moreover, a third category of firms was created with the label “in transformation”. A firm is categorized as “in transformation” if in 2015:
a) Her status in the Amadeus-‐BVD database is “active” and there are pending legal procedures related to merges and/or acquisitions;
b) Her status in the Amadeus-‐BVD database is “inactive” and there are pending legal procedures related to merges and/or acquisitions or other legal transformations;
In the present paper we consider only firms that are categorized as “active” or “exiting”. Firms categorized as “in transformation” are removed from the sample.
© F. Landini | LUISS School of European Political Economy | WORKING PAPER | 10/2016
39
References
Agarwal, R., and Audretsch, D. B., (2001). Does entry size matter? The impact of the life cycle and technology on firm survival. Journal of Industrial Economics 49, 21–43.
Altomonte, C., and Aquilante, T., (2012). The EU-‐EFIGE/Bruegel-‐Unicredit dataset. Working Papers, Bruegel 753, Bruegel.
Altomonte, C., Aquilante, T., and Ottaviano, G. I., (2012). The triggers of competitiveness: the EFIGE cross-‐country report. Blueprints, Bruegel, No. 738.
Altomonte, C., Aquilante, T., Békés, G., and Ottaviano, G. I. (2013). Internationalization and innovation of firms: evidence and policy. Economic Policy, 28(76), 663-‐700.
Arrighetti, A., Brancati, R., Lasagni, A., Maresca, A., (2015). Firms’ Heterogeneity and Performance in Manufacturing During the Great Recession. Department of Economics, University of Parma, Working Papers.
Arrighetti, A., Landini, F., and Lasagni, A. (2014). Intangible assets and firm heterogeneity: Evidence from Italy. Research Policy, 43(1), 202-‐213.
Asplund, M., and Nocke, V. (2006). Firm turnover in imperfectly competitive markets. Review of Economic Studies, 73(2), 295-‐327.
Caballero, R. J., and Hammour, M. L. (1994). The Cleansing Effect of Recessions. American Economic Review, 1350-‐1368.
Cefis, E., and Marsili, O., (2005). A matter of life and death: innovation and firm survival. Industrial and Corporate change 14(6), 1167-‐1192.
Charron, N., Dijkstra, L., and Lapuente, V. (2015). Mapping the regional divide in Europe: A measure for assessing quality of government in 206 European regions. Social Indicators Research, 122(2), 315-‐346.
Coad, A. (2007). Testing the principle of ‘growth of the fitter’: the relationship between profits and firm growth. Structural Change and economic dynamics, 18(3), 370-‐386.
Baldwin, J. R., and Gu, W. (2006). Plant turnover and productivity growth in Canadian manufacturing. Industrial and Corporate Change, 15(3), 417-‐465.
Baneerjee, A., and Munshi, L. (2004). How Efficiently is Capital Allocated? Evidence from the Knitted Garment Industry in Tipur. Review of Economic Studies, 71, 19-‐42.
Barlevy, G. (2002). The sullying effect of recessions. Review of Economic Studies, 69(1), 65-‐96.
Barlevy, G. (2003). Credit market frictions and the allocation of resources over the business cycle. Journal of Monetary Economics, 50(8), 1795-‐1818.
Bartelsman, E., Haltiwanger, J., and Scarpetta, S. (2013). Cross-‐country differences in productivity: The role of allocation and selection. American Economic Review, 103(1), 305-‐334.
Bartelsman, E. J., and Doms, M. (2000). Understanding productivity: Lessons from longitudinal microdata. Journal of Economic literature, 38(3), 569-‐594.
Bottazzi, G., Cefis, E., Dosi, G., and Secchi, A. (2007). Invariances and diversities in the patterns of industrial evolution: Some evidence from Italian manufacturing industries. Small Business Economics, 29(1-‐2), 137-‐159.
© F. Landini | LUISS School of European Political Economy | WORKING PAPER | 10/2016
40
Bottazzi, G., Dosi, G., Jacoby, N., Secchi, A., and Tamagni, F. (2010). Corporate performances and market selection: some comparative evidence. Industrial and Corporate Change, 19(6), 1953-‐1996.
Calligaris, S., M. del Gatto, Hassan, F., Ottaviano, G. I. P. and Schivardi, F. (2016) Italy’s productivity conundrum: A study on resource misallocation in Italy. European Economy Discussion Paper N30-‐2016, European Commission.
Cantos, P., Gumbau‐Albert, M., and Maudos, J. (2005). Transport infrastructures, spillover effects and regional growth: evidence of the Spanish case. Transport reviews, 25(1), 25-‐50.
Cingano, F., and Pinotti, P. (2013). Politicians at work: The private returns and social costs of political connections. Journal of the European Economic Association, 11(2), 433-‐465.
Claessens, S., Tong, H., and Wei, S. J. (2012). From the financial crisis to the real economy: Using firm-‐level data to identify transmission channels. Journal of International Economics, 88(2), 375-‐387.
Collier, P., and Goderis, B. (2009). Structural policies for shock-‐prone developing countries. Oxford economic papers, 61(4), 703-‐726.
Combes, P. P., and Lafourcade, M. (2005). Transport costs: measures, determinants, and regional policy implications for France. Journal of Economic Geography, 5(3), 319-‐349.
Disney, R., Haskel, J., and Heden, Y. (2003). Entry, exit and establishment survival in UK manufacturing. Journal of Industrial Economics, 51(1), 91-‐112.
Dosi, G. (2007). Statistical Regularities in the Evolution of Industries. A Guide through some Evidence and Challenges for the Theory. In F. Malerba and S. Brusoni (eds.), Perspectives on innovation. Cambridge University Press: Cambridge, UK.
Dosi, G., Moschella, D., Pugliese, E., and Tamagni, F. (2015). Productivity, market selection, and corporate growth: comparative evidence across US and Europe. Small Business Economics, 45(3), 643-‐672.
European Commission (2015). The five president's report: completing Europe's Economic and Monetary Union, available at: http://ec.europa.eu/priorities/sites/beta-‐political/files/5-‐presidents-‐report_en.pdf (accessed on 31st of August 2016).
Eurostat (2016). Online database, available at: http://ec.europa.eu/eurostat/data/database (accessed on 2nd of August 2016).
Felice, E. (2013). Perché il Sud è rimasto indietro. Il mulino: Bologna. Foster, L., Haltiwanger, J., and Syverson, C. (2008). Reallocation, Firm Turnover, and
Efficiency: Selection on Productivity or Profitability?. American Economic Review, 98(1), 394-‐425.
Foster, L., Haltiwanger, J., and Syverson, C. (2016). The slow growth of new plants: Learning about demand?. Economica, 83(329), 91-‐129.
Foster, L., Grim, C., and Haltiwanger, J. (2016). Reallocation in the Great Recession: Cleansing or Not?. Journal of Labor Economics, 34(1 pt 2).
Gomes, J., Greenwood, J., and Rebelo, S. (2001). Equilibrium unemployment. Journal of Monetary Economics, 48(1), 109-‐152.
© F. Landini | LUISS School of European Political Economy | WORKING PAPER | 10/2016
41
Groot, S. P., Möhlmann, J. L., Garretsen, J. H., and De Groot, H. L. (2011). The crisis sensitivity of European countries and regions: stylized facts and spatial heterogeneity. Cambridge Journal of Regions, Economy and Society, 4(3), 437-‐456.
Hall, R. E., Farber, H., and Haltiwanger, J. (1995). Lost jobs. Brookings Papers on Economic Activity, 1995(1), 221-‐273.
Hallward-‐Driemeier, M., and Rijkers, B. (2013). Do crises catalyze creative destruction? Firm-‐level evidence from Indonesia. Review of Economics and Statistics, 95(1), 1788-‐1810.
Haltiwanger, J., Scarpetta, S., and Schweiger, H. (2008). Assessing job flows across countries: The role of industry, firm size and regulations. NBER working paper No. w13920.
Hopenhayn, H. A. (1992). Entry, exit, and firm dynamics in long run equilibrium. Econometrica 60(5), 1127-‐1150.
Hsieh, C. T., and Klenow, P. J. (2009). Misallocation and manufacturing TFP in China and India. Quarterly Journal of Economics, 124(4), 1403-‐1448.
IMF (2009). World economic outlook: crisis and recovery. International Monetary Fund, Washington, April.
IMF (2010). World economic outlook: rebalancing growth. International Monetary Fund, Washington, April.
IMF (2016). World economic outlook: too slow for too long. International Monetary Fund, Washington, April.
Jovanovic, B. (1982). Selection and the Evolution of Industry. Econometrica 50(3), 649-‐670.
Katayama, H., Lu, S., and Tybout, J. R. (2009). Firm-‐level productivity studies: illusions and a solution. International Journal of Industrial Organization, 27(3), 403-‐413.
Kehrig, M. (2015). The cyclical nature of the productivity distribution. Earlier version: US Census Bureau Center for Economic Studies Paper No. CES-‐WP-‐11-‐15.
Lakshmanan, T. R. (2011). The broader economic consequences of transport infrastructure investments. Journal of transport geography, 19(1), 1-‐12.
Landini, F., Arrighetti, A., and Lasagni, A. (2015). Economic crisis and firm exit: do intangibles matter?. LUISS SEP WP 09/2015
Mairesse, J., and Jaumandreu, J. (2005). Panel‐data Estimates of the Production Function and the Revenue Function: What Difference Does It Make?. Scandinavian Journal of Economics, 107(4), 651-‐672.
Melitz, M. J. (2003). The impact of trade on intra‐industry reallocations and aggregate industry productivity. Econometrica, 71(6), 1695-‐1725.
Melitz, M. J., and Ottaviano, G. I. (2008). Market size, trade, and productivity. Review of Economic Studies, 75(1), 295-‐316.
Nelson, R. R., and Winter, S. G. (1982). An evolutionary theory of economic change. Cambridge, Mass.: Harvard University Press.
Ouyang, M. (2009). The scarring effect of recessions. Journal of Monetary Economics, 56(2), 184-‐199.
Petrin, A., and Sivadasan, J. (2013). Estimating lost output from allocative inefficiency, with an application to Chile and firing costs. Review of Economics and Statistics, 95(1), 286-‐301.

© F. Landini | LUISS School of European Political Economy | WORKING PAPER | 10/2016
42
Picci, L. (2002). Le infrastrutture in Italia. Le differenze territoriali e l’efficienza della spesa. In Baldassarri, M., Galli, G., Piga, G. (Eds.) L'Italia nella competizione globale -‐ Regole per il mercato, Edizioni il Sole 24.
Redding, S. J., and Turner, M. A. (2014). Transportation costs and the spatial organization of economic activity. National Bureau of Economic Research Working Paper, No. w20235
Restuccia, D., and Rogerson, R. (2008). Policy distortions and aggregate productivity with heterogeneous establishments. Review of Economic Dynamics, 11(4), 707-‐720.
Schumpeter, J. A. (1934). The theory of economic development. Cambridge, Mass.: Harvard University Press.
Schumpeter, J. A. (1939). Business cycles (Vol. 1, pp. 161-‐74). New York: McGraw-‐Hill. Syverson, C. (2004). Product substitutability and productivity dispersion. Review of
Economics and Statistics, 86(2), 534-‐550.
Syverson, C. (2011). What Determines Productivity?. Journal of Economic Literature, 49(2), 326-‐365.