distinct ecg phenotypes identified in hypertrophic...
TRANSCRIPT
ORIGINAL RESEARCHpublished: 13 March 2018
doi: 10.3389/fphys.2018.00213
Frontiers in Physiology | www.frontiersin.org 1 March 2018 | Volume 9 | Article 213
Edited by:
Ahsan H. Khandoker,
Khalifa University, United Arab
Emirates
Reviewed by:
Eric A. Sobie,
Icahn School of Medicine at Mount
Sinai, United States
Mohammad Hasan Imam,
American International
University-Bangladesh, Bangladesh
*Correspondence:
Blanca Rodriguez
†These authors have contributed
equally to this work and first authors.
Specialty section:
This article was submitted to
Computational Physiology and
Medicine,
a section of the journal
Frontiers in Physiology
Received: 14 November 2017
Accepted: 26 February 2018
Published: 13 March 2018
Citation:
Lyon A, Ariga R, Mincholé A,
Mahmod M, Ormondroyd E, Laguna P,
de Freitas N, Neubauer S, Watkins H
and Rodriguez B (2018) Distinct ECG
Phenotypes Identified in Hypertrophic
Cardiomyopathy Using Machine
Learning Associate With Arrhythmic
Risk Markers. Front. Physiol. 9:213.
doi: 10.3389/fphys.2018.00213
Distinct ECG Phenotypes Identifiedin Hypertrophic CardiomyopathyUsing Machine Learning AssociateWith Arrhythmic Risk MarkersAurore Lyon 1†, Rina Ariga 2†, Ana Mincholé 1, Masliza Mahmod 2, Elizabeth Ormondroyd 2,
Pablo Laguna 3, Nando de Freitas 1, Stefan Neubauer 2, Hugh Watkins 2 and
Blanca Rodriguez 1*
1Department of Computer Science, University of Oxford, Oxford, United Kingdom, 2Division of Cardiovascular Medicine,
Radcliffe Department of Medicine, University of Oxford, Oxford, United Kingdom, 3Biomedical Signal Interpretation &
Computational Simulation Group, CIBER-BBN, University of Zaragoza, Zaragoza, Spain
Aims: Ventricular arrhythmia triggers sudden cardiac death (SCD) in hypertrophic
cardiomyopathy (HCM), yet electrophysiological biomarkers are not used for risk
stratification. Our aim was to identify distinct HCM phenotypes based on ECG
computational analysis, and characterize differences in clinical risk factors and anatomical
differences using cardiac magnetic resonance (CMR) imaging.
Methods: High-fidelity 12-lead Holter ECGs from 85 HCM patients and 38 healthy
volunteers were analyzed using mathematical modeling and computational clustering
to identify phenotypic subgroups. Clinical features and the extent and distribution of
hypertrophy assessed by CMR were evaluated in the subgroups.
Results: QRS morphology alone was crucial to identify three HCM phenotypes with
very distinct QRS patterns. Group 1 (n = 44) showed normal QRS morphology, Group
2 (n = 19) showed short R and deep S waves in V4, and Group 3 (n = 22) exhibited
short R and long S waves in V4-6, and left QRS axis deviation. However, no differences
in arrhythmic risk or distribution of hypertrophy were observed between these groups.
Including T wave biomarkers in the clustering, four HCM phenotypes were identified:
Group 1A (n = 20), with primary repolarization abnormalities showing normal QRS yet
inverted T waves, Group 1B (n = 24), with normal QRS morphology and upright T
waves, and Group 2 and Group 3 remaining as before, with upright T waves. Group
1A patients, with normal QRS and inverted T wave, showed increased HCM Risk-SCD
scores (1A: 4.0%, 1B: 1.8%, 2: 2.1%, 3: 2.5%, p = 0.0001), and a predominance of
coexisting septal and apical hypertrophy (p < 0.0001). HCM patients in Groups 2 and 3
exhibited predominantly septal hypertrophy (85 and 90%, respectively).
Conclusion: HCM patients were classified in four subgroups with distinct ECG
features. Patients with primary T wave inversion not secondary to QRS abnormalities
had increased HCM Risk-SCD scores and coexisting septal and apical hypertrophy,

Lyon et al. Four ECG Phenotypes in HCM
suggesting that primary T wave inversion may increase SCD risk in HCM, rather
than T wave inversion secondary to depolarization abnormalities. Computational ECG
phenotyping provides insight into the underlying processes captured by the ECG and
has the potential to be a novel and independent factor for risk stratification.
Keywords: hypertrophic cardiomyopathy, electrocardiography, e-cardiology, phenotyping, computational
clustering
INTRODUCTION
Hypertrophic cardiomyopathy (HCM) remains a common yetchallenging genetic heart muscle disease due to its heterogeneousclinical course. Ventricular arrhythmias are a major cause ofsudden cardiac death (SCD) in young people (Maron et al.,2000; Maron, 2002). Accurate identification of high risk patientsis a clinical priority since implantable cardioverter-defibrillators(ICD) can successfully treat ventricular arrhythmias triggeringSCD.
In HCM, both ionic remodeling (Passini et al., 2016) andstructural abnormalities [hypertrophy (Spirito et al., 2000),myocyte disarray (Varnava et al., 2001b) and fibrosis (Adabaget al., 2008)] create a pro-arrhythmic substrate to different extentsin specific patients. Previous studies have attempted to assess theelectrophysiological signature of HCM by visually inspecting thestandard 12-lead paper electrocardiogram (ECG). Abnormalitiessuch as abnormal Q waves, wide and high amplitude QRScomplexes, ST segment displacement as well as giant inverted Twaves have been reported in HCM (Savage et al., 1978; Lakdawalaet al., 2011). However, no single abnormality was shown to becharacteristic of HCM patients (Maron et al., 1983) and it isunclear whether T wave inversion is secondary to abnormaldepolarization or a consequence of abnormal repolarizationdynamics and heterogeneity. Furthermore, previous studiesincluding cohorts of high-risk HCM patients also failed toproduce reliable stratification, finding no differences in ECGbetween patients with and without appropriate ICD shocks(Maron et al., 1982; Sherrid et al., 2009). Some studies forexample reported TWI to be related to increase in SCD risk(Ostman-Smith et al., 2010) but others did not (Maron et al.,1982; Sherrid et al., 2009). This may be due to the limitations inthe methodology and therefore, more sophisticated approachesand new knowledge are required to improve the informationextracted from the ECG for HCM phenotyping.
In the absence of reliable ECG biomarkers, five conventionalrisk factors [non-sustained ventricular tachycardia (NSVT),unexplained syncope, family history of SCD, massive leftventricular hypertrophy (LVH) and abnormal exercise blood
Abbreviations: AHA, American Heart Association; BP, blood pressure;
BPR, blood pressure response; CMR, cardiovascular magnetic resonance;
ECG, electrocardiogram; G+LVH-, genotype positive HCM with normal left
ventricular wall thickness; HCM, hypertrophic cardiomyopathy; ICD, implantable
cardioverter-defibrillator; LAD, left axis deviation; LV, left ventricle; LVH, left
ventricular hypertrophy; LVOT, left ventricular outflow tract; MYBPC3, myosin-
binding protein C; MYH7, beta-myosin heavy chain; NSVT, non-sustained
ventricular tachycardia; NYHA, New York Heart Association; SCD, sudden
cardiac death; TWI, T wave inversion.
pressure response] provide clinical utility for predicting SCDin HCM (Maron et al., 2007; Christiaans et al., 2010). Morerecently, the prospectively validated HCM Risk-SCD predictionmodel (O’Mahony et al., 2014) recommended by the 2014ESC guidelines (Elliott et al., 2014), has performed better thanconventional risk factors albeit with limitations (Maron et al.,2015). However, neither method captures the degree of theunderlying myocardial abnormalities which lead to arrhythmicrisk.
Our aim was to identify discrete subgroups of HCM patientswith differences in electrophysiological and structural phenotypeusing novel computational analysis of high fidelity 12-lead HolterECGs, through combined machine learning and mathematicalmodeling. To this end, we first extracted morphology-basedbiomarkers from the QRS using a mathematical model based onHermite functions. We then applied an unsupervised clusteringapproach to ECG-based biomarkers, to automatically identifythe presence of different phenotypic subgroups in the HCMpopulation. Cardiac magnetic resonance (CMR) imaging andarrhythmic risk markers were evaluated to further characterizethe patient subgroups. The low incidence of SCD in HCM of<1% per year (O’Mahony et al., 2013), and our reliance onpatients without comorbidities, precluded its use as an endpointin this study. Instead, we provide a deeper characterizationof HCM phenotypes capitalizing on recently acquired digitalECG in conjunction with CMR data which is unattainable inlarger retrospective databases. We hypothesized that detailedquantification of QRS morphology and T wave abnormalitiesusing high fidelity ECGs would identify important features ofthe underlying electrophysiological and anatomical substrate, toenable improved phenotypic characterization of HCM patients.
MATERIALS AND METHODS
Ethics and Study PopulationThis prospective study was approved by the National ResearchEthics Committee (REC ref 12/LO/1979) and informed writtenconsent was obtained from each participant. Eighty-five patientswith HCM were recruited from the University of OxfordInherited Cardiac Conditions clinic, John Radcliffe Hospital,Oxford, UK. HCM diagnosis was made by presence of apathogenic mutation in a known sarcomeric gene or, in theabsence of an identified mutation, HCM was defined as LVH(≥15mm) not originating from another cause. Gene positivepatients without hypertrophy (G+LVH-) were included in thestudy as a number of SCDs have been reported in this patientcohort (Varnava et al., 2001a; Pasquale et al., 2012) and theconsideration of LVH alone has limitations (Sen-Chowdhry et al.,
Frontiers in Physiology | www.frontiersin.org 2 March 2018 | Volume 9 | Article 213
Lyon et al. Four ECG Phenotypes in HCM
2016); of note, five of the G+LVH- subjects had abnormalECGs with voltage criteria for LVH. Thirty-eight age- andgender-matched healthy volunteers were non-smokers withoutcardiovascular disease, hypertension, diabetes, or family historyof cardiomyopathy or SCD.
The methodology is summarized in Figure 1 and detailedmethods can be found in Supplementary Material 1.
Electrocardiographic MeasurementsParticipants underwent 12-lead ambulatory Holter monitoring(sampling frequency 1,000Hz, H12+, Mortara Instrument,Milwaukee, WI, USA) for 24 h and a standard 12-leadresting digital electrocardiograph (Burdick 8500, Glasgow, UK)(Macfarlane et al., 1990). Standard measurements of ECG axes,amplitudes and intervals were obtained for both global (reportedin Tables 1, 3, 4) and single-leads from the Burdick ECG XMLfiles.
Cardiovascular Magnetic Resonance(CMR) ImagingCMR imaging was performed at 3 tesla (TIM Trio, Siemens)in all participants, except in 10 patients with ICD at thetime of enrollment (CMR prior to ICD insertion performedfor clinical care was evaluated in these patients). Analysiswas performed using cmr42© (Circle Cardiovascular Imaging,Calgary, Canada). The extent, and morphology, of hypertrophywas identified on short axis images and categorized into 4subtypes: no hypertrophy—genotype positive patients with wallthickness≤12mm (G+LVH-); septal hypertrophy—basal and/ormid septal wall thickness >12mm in genotype positive patientsor ≥15mm in genotype negative patients; apical hypertrophy—apical wall thickness ≥15mm below papillary muscle level;mixed hypertrophy—coexisting hypertrophy in septal and apicalsegments.
Clinical Data CollectionGenetic results and the conventional risk factors (Elliott et al.,2000) were obtained as part of the patient’s routine clinical care.The five conventional risk factors were defined as: NSVT (threeor more consecutive ventricular beats at a rate of ≥120 bpmlasting <30 s on clinical 3-lead 24- to 48-h Holter monitoring),unexplained syncope (≥1 episode of unexplained syncope),family history of SCD (history of SCD in ≥1 first degreerelative ≤40 years old or SCD in a first degree relative withconfirmed HCM at any age), massive LVH (LV wall thicknessin any myocardial segment of ≥30mm on short axis CMRimages) and abnormal exercise blood pressure (BP) response(rise in systolic BP <20 mmHg or a fall of >10 mmHg frombaseline to peak exercise in patients ≤40 years old). HCMRisk-SCD score (2014 ESC guidelines) was calculated using 7disease variables as in O’Mahony et al. (2014) (SupplementaryMaterial 1.4). A ≥6% risk of SCD at 5 years is classified ashigh risk and ICD implantation is recommended, 4–6% isintermediate risk and ICD may be considered, and <4% is lowrisk.
Holter ECG Pre-processingThe first 30-min ECG excerpt was used to analyze the 8 linearlyindependent leads (I, II, V1-6) with custom-built software usingMATLAB (Mathworks, MA, USA). A wavelet based delineator(Martínez et al., 2004) extracted the peaks and boundaries of theECGwaveforms. High frequency noise was removed using a low-pass Butterworth filter with cut-off frequency of 45Hz, baselinedrift was removed by a cubic spline method and a notch filterrejected the 50Hz mains power artifact. The first twenty beatswith maximal ST segment-T wave signal-to-noise ratio were thenconsidered for analysis and were aligned with respect to theQRS complex by Woody’s method (Sörnmo and Laguna, 2005)(Supplementary Material 1.5). A sensitivity analysis showed thatanalyzing different 30-min excerpts in the recording yieldedthe same results. Thirty minutes also provided enough data toscreen the excerpts and avoid changes in beat morphology dueto changes in heart rate. Average QRS and STT waveforms werethen computed from these 20 beats.
Extraction of QRS and T Wave BiomarkersAll biomarkers were calculated per lead. QRS biomarkers arelisted and illustrated in Supplementary Material 1.6, FigureS1. In addition to standard QRS biomarkers computed fromsignal processing, the QRS shape (morphology) was quantifiedby mathematically modeling the QRS waveform using acombination of Hermite functions, with well-established abilityto provide a compact representation of the QRS complex (Lagunaet al., 1996) (Supplementary Material 1.7, Figure S2). Indeed,three Hermite functions (Supplementary Material 1.7) enableto recover 98% of the QRS energy in control subjects (Sornmoet al., 1981). However, four Hermite functions were needed inHCM due to greater QRS heterogeneity. Any particular QRSmorphology such as an RSR’ pattern can thus be generated as thesum of these scaled shapes.
Identification of Subgroups in HCM UsingQRS and T Wave BiomarkersEach patient was assigned a vector of morphological QRS and Twave biomarkers. Seven significant features were selected usingthe Multi-cluster feature selection method described in Cai et al.(2010), which is an unsupervised feature selection algorithm toreduce the number of variables under consideration. In short,the method consists in a combination of spectral analysis of thedata with a L1-regularized least squares optimization method.This method was chosen for its ability to preserve the multi-cluster structure of the dataset. The 7 features were then reducedto two dimensions for visualization purposes, using Laplacianeigenmaps dimensionality reduction, as described in Belkin andNiyogi (2003). This method preserves the local geometricalproperties of the dataset by computing the eigenvalues andeigenvectors of the graph Laplacian generalized eigenvectorproblem (Belkin and Niyogi, 2003).
A density-based clustering algorithm, DBSCAN (Ester et al.,1996), was then applied on this low-dimensional representationof the dataset to extract subgroups. This algorithm identifiedclusters by maximizing the density in each of the clusters. Theminimum number of individuals in a cluster was set to n/25 = 3,
Frontiers in Physiology | www.frontiersin.org 3 March 2018 | Volume 9 | Article 213

Lyon et al. Four ECG Phenotypes in HCM
FIGURE 1 | Summary of the methodologies applied in this study for the analysis and classification of 85 HCM patient ECGs using mathematical modeling and
machine learning, and to investigate associations with clinical and cardiovascular magnetic resonance features.
with n = 86 HCM patients. The distance between neighboringindividuals was evaluated using the Euclidean distance. Thesame results (i.e., same patients’ subgroups) were obtained usinga different clustering algorithm (k-means). Clustering analysisbased only on QRS morphology was performed, and thenrepeated with the addition of T wave biomarkers. Clusteringwas performed by AL who was blinded to clinical data.To assess the effect of G+LVH- patients on the results, afurther clustering analysis was performed excluding the G+LVH-patients.
Statistical AnalysisData are expressed as mean± standard deviation or median andrange. Normally-distributed data were compared using t-testsor analysis of variance. Non-normally distributed data werecompared using the Mann–Whitney U-test or Kruskal–Wallistest. Categorical data were compared with Chi-square or Fisher’sexact tests. Statistical significance was assumed when p < 0.05(after Bonferroni adjustment for multiple comparisons, whereappropriate). Statistical analysis was performed with IBM SPSSStatistics, version 20.0 (IBM Corp, Armonk, NY, USA).
Frontiers in Physiology | www.frontiersin.org 4 March 2018 | Volume 9 | Article 213

Lyon et al. Four ECG Phenotypes in HCM
TABLE 1 | Characteristics of healthy volunteers and HCM patients.
Healthy volunteers
(n = 38)
HCM patients
(n = 85)
p-value
Age, years 47 ± 15 45 ± 14 0.54
Male 25 (66) 58 (68) 0.84
Body mass index, kg/m2 24 ± 4 26 ± 4 0.06
Systolic BP, mmHg 117 ± 14 118 ± 14 0.76
Diastolic BP, mmHg 70 ± 10 72 ± 12 0.33
CMR DIMENSIONS AND FUNCTION
LV end-diastolic volume, ml 155 ± 35 154 ± 33 0.88
LV end-systolic volume, ml 50 ± 17 41 ± 16 0.007
LV ejection fraction, % 68 ± 5 74 ± 7 0.00003
LV mass index, g/m2 54 ± 11 72 ± 25 0.00002
Maximal LV wall thickness, mm 11 ± 1 20 ± 6 2 × 10⁻¹⁴
Left atrial diameter, mm 33 ± 7 39 ± 7 0.00004
ECG FEATURES
Heart rate, bpm 58 ± 11 58 ± 10 0.81
QRS axis, ◦ 40 ± 34 13 ± 43 0.0007
QRS duration, ms 91 ± 9 98 ± 15 0.02
R wave amplitude 683 ± 200 764 ± 341 0.46
QRS amplitude, mV 1441 ± 414 1825 ± 652 0.002
QRS ascending slope 74 ± 22 89 ± 32 0.025
QRS descending slope −118 ± 51 −150 ± 57 0.001
Pathological Q wave 0 20 (23) 0.0004
T wave axis, ◦ 34 ± 17 69 ± 54 0.0001
Abnormal T wave axis 0 28 (35) 9 × 10⁻⁶
T wave amplitude, mV 356 ± 141 170 ± 257 0.0001
T wave inversion 0 26 (30) 0.00002
Giant T wave inversion 0 6 (7) 0.18
T peak to T end interval, ms 81 ± 14 85 ± 18 0.16
ST segment displacement, mV 42 ± 45 26 ± 49 0.14
QTc interval, ms 411 ± 17 440 ± 27 8 × 10⁻⁸
JTc interval, ms 300 ± 43 354 ± 99 0.00003
Mean ± standard deviation, or number of participants (%). BP, blood pressure; CMR,
cardiovascular magnetic resonance; LV, left ventricular. Bold values mean p-value
significant (p < 0.05).
RESULTS
Study Population CharacteristicsThe study population characteristics are summarized in Table 1.HCM patients (n= 85) had a more leftward QRS axis, larger QRSduration and amplitude, steeper QRS slopes and abnormal Qwaves compared with healthy volunteers (n = 38) (all p < 0.03).They also showed lower T wave amplitude, T wave inversion(TWI), abnormal T wave axis and prolonged QTc (all p <
0.001). Table 2 describes the clinical characteristics for the HCMpatients. Patients were mainly asymptomatic (median NYHAfunctional class = 1) and were low risk for SCD (median HCMRisk-SCD score = 2.5%; median total risk factor = 1). Nineteenpatients had an ICD implanted for primary prevention with amedian follow-up of 3 years. Only 1 patient (5%) received anappropriate shock, which is in keeping with primary preventiondischarge rates seen in a previous study (Maron et al., 2000).
TABLE 2 | Clinical and genotype characteristics of HCM patients.
NYHA class, [median (range)] 1 (1–3)
NYHA III/IV 5 (6)
LVOT obstruction (gradient ≥30 mmHg) 11 (13)
Implantable cardioverter-defibrillator 19 (22)
Appropriate ICD shocks 1
ICD follow-up, years [median (range)] 3 (0–12)
HYPERTROPHY MORPHOLOGY
No LVH (G+LVH-) 9 (11)
Septal LVH 58 (68)
Apical LVH 4 (5)
Mixed septal & apical LVH 14 (16)
HCM Risk-SCD score, % [median (range)] 2.5 (0.8–11.0)
CONVENTIONAL RISK FACTORS
NSVT 23 (27)
Syncope 10 (12)
Family History SCD 17 (20)
Abnormal exercise BP response 7 (8)
Massive LVH ≥30mm 1 (1)
Total number of risk factors [median (range)] 1 (0–3)
0 Risk factors 34 (40)
1 Risk factor 45 (53)
≥2 Risk factors 6 (7)
GENOTYPE
Gene negative 27(32)
MYBPC3 33 (39)
MYH7 24 (28)
Troponin I 1 (1)
Number of patients (%). NYHA, New York Heart Association; LVOT, left ventricular
outflow tract; ICD, implantable cardioverter-defibrillator; LVH, left ventricular hypertrophy;
G+LVH-, genotype positive HCMwith normal wall thickness; SCD, sudden cardiac death;
NSVT, non-sustained ventricular tachycardia; BP, blood pressure; ESC, European Society
of Cardiology; HCM, hypertrophic cardiomyopathy; MYBPC3, myosin-binding protein C;
MYH7, beta-myosin heavy chain.
Eleven percent of patients were G+LVH- and the majority hadisolated septal hypertrophy (68%).
Clustering Using QRS Morphology OnlyBased on QRS morphology alone, three HCM groups wereobtained (Figure 2A), with the main differences in first, secondand third Hermite basis in lead II and lateral precordial leads(Figures 2B–D; Supplementary Material 2.2, Figure S3). TheECG features for the QRS-based groups can be found inSupplementary Material 2.2, Table S1.
Group 1 was the largest with 52% of the patients, displayingnormal QRS morphology (Figures 2, 4A). Group 2 (22% ofpatients) showed differences in V4 (in the first three Hermitebases) compared to healthy volunteers and Group 1 but nodifference in V6 (Figure 2, all post-hoc p < 0.001). Thus, leadV4 in Group 2 displayed shorter R wave duration (2: 38ms,1: 47ms; 2 vs. 1, p = 0.003) and deeper S waves (2: −1,170 µv,1:−568µv; 2 vs. 1, p= 0.0003) compared to Group 1 (Figure 4A;Supplementary Material 2.2, Table S1).
Group 3 (26% of patients) exhibited vast differences in leadII and V4-6 (in the first three Hermite bases) compared to
Frontiers in Physiology | www.frontiersin.org 5 March 2018 | Volume 9 | Article 213
Lyon et al. Four ECG Phenotypes in HCM
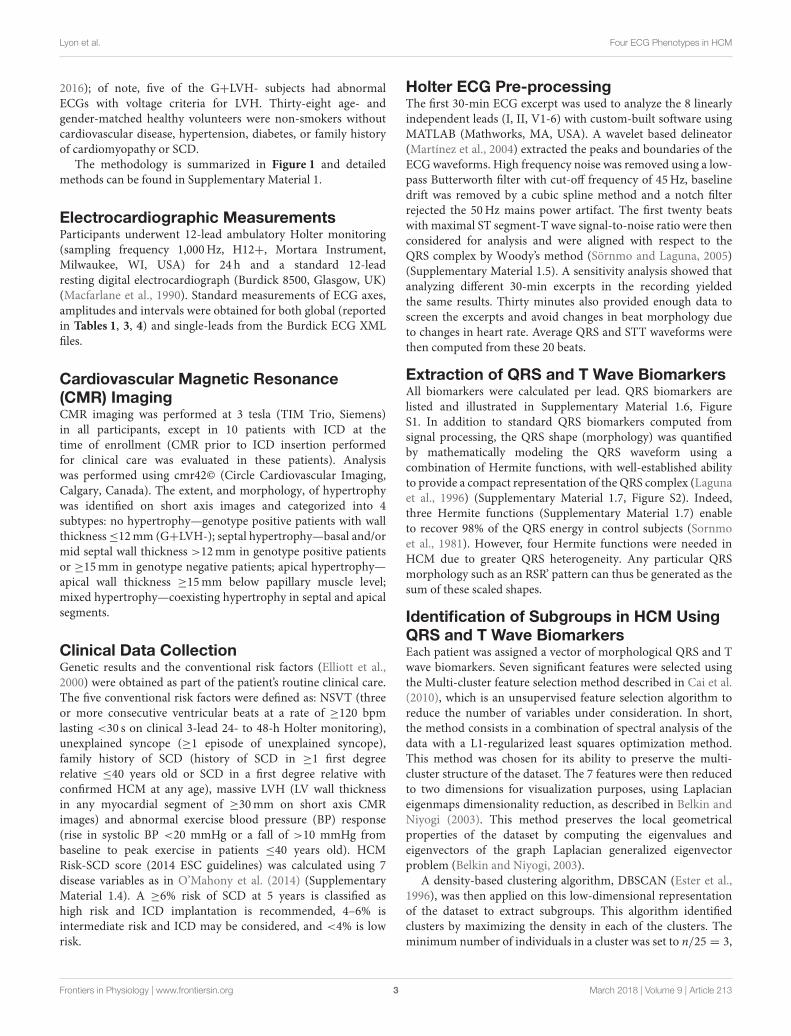
FIGURE 2 | Clustering using QRS morphology alone identifies three HCM groups showing group differences in 3 features in lead II and the lateral precordial leads. (A)
The three QRS-based HCM groups identified by cluster analysis using QRS morphological biomarkers alone are shown on the 2-dimensional space obtained by
dimensionality reduction, as described in Materials and Methods section. (B–D) These QRS-based HCM groups show differences in the 1st, 2nd, and 3rd Hermite
coefficients (mathematical functions representing the QRS shape: QRS morphological biomarkers) in leads II, V4 and V6. Healthy volunteers are shown for visual
comparison but were not included in Kruskal–Wallis ANOVA (**p < 1 × 10⁻⁶, *p < 0.001).
the other HCM groups and healthy volunteers (Figure 2, allpost-hoc p < 6 × 10⁻⁶). Differences in lead II were manifestedas abnormally shifted QRS axis toward left axis deviation (LAD)(3: −37◦, 1: 30◦, 2: 29◦; 3 vs. 1 and 3 vs. 2, all post-hoc p< 2 × 10⁻⁷). In V4, the R wave duration was shorter thanGroup 1 and amplitude was shorter than Groups 1 and 2, Swave duration was longer than Group 1, and S amplitude wasdeeper than Group 1 (3 vs. 1 and 3 vs. 2, all post-hoc p <
0.003). In V6, R wave duration and amplitude were shorter,and S wave duration and amplitude larger than both theother groups (3 vs. 1 and 3 vs. 2, all post-hoc p < 0.01;Figure 4A).
Although ECG features were significantly different betweenthe QRS-based groups, clinical features and markers ofarrhythmic risk were not (Table 3), suggesting that QRSbiomarkers alone, may not be useful for risk stratification.
Frontiers in Physiology | www.frontiersin.org 6 March 2018 | Volume 9 | Article 213
Lyon et al. Four ECG Phenotypes in HCM
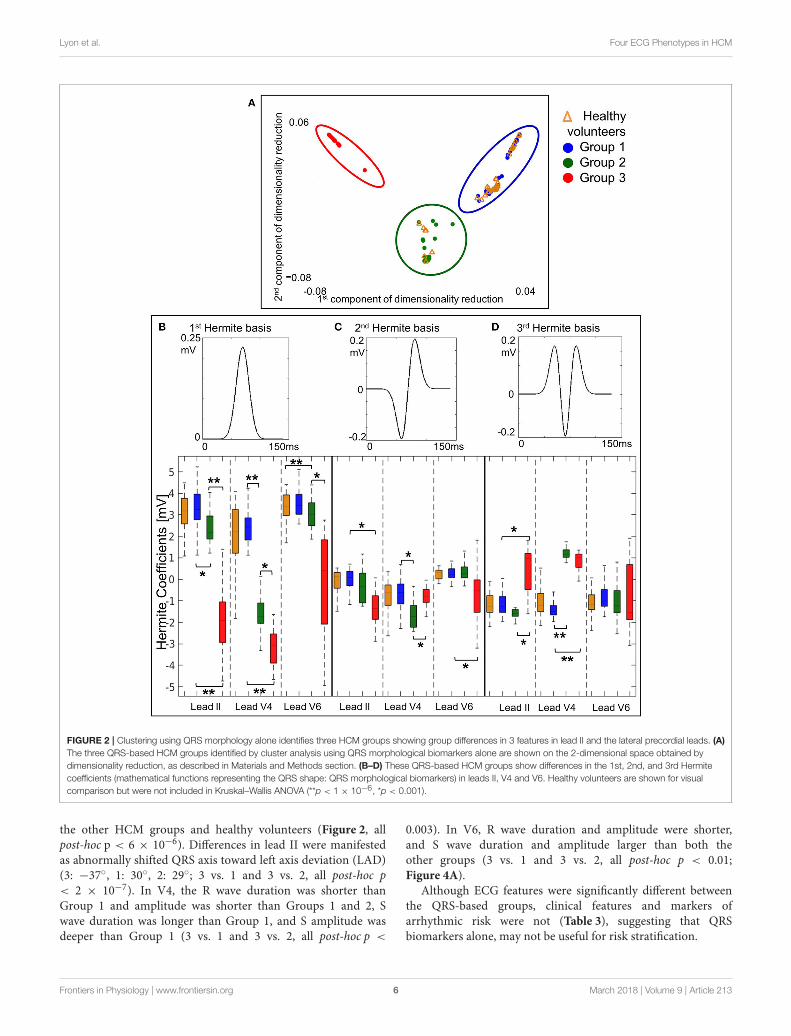
TABLE 3 | Clinical features for QRS-based HCM groups.
Group 1
(n = 44)
Group 2
(n = 19)
Group 3
(n = 22)
p-value
(group
comparison)
Age, years 47 ± 15 44 ± 12 43 ± 13 0.34
Male 30 (68) 12 (63) 16 (73) 0.79
Body mass index, kg/m2 27 ± 5 25 ± 4 25 ± 4 0.16
Systolic BP, mmHg 120 ± 13 117 ± 13 114 ± 15 0.28
Diastolic BP, mmHg 74 ± 11 73 ± 13 68 ± 12 0.13
HCM Risk-SCD score, %, 2.6 (1–11) 2.1 (1–6) 2.5 (1–9) 0.98
CONVENTIONAL RISK FACTORS
NSVT 14 (32) 4 (21) 5 (23) 0.69
Syncope 6 (14) 2 (11) 2 (9) 0.91
Family History SCD 7 (16) 5 (26) 5 (23) 0.60
Abnormal exercise BPR 5 (11) 0 2 (9) 0.44
Massive LVH ≥30mm 0 0 1 (5) –
HYPERTROPHY
LV mass index, g/m2 74 ± 28 63 ± 17 73 ± 26 0.30
Max LV wall, mm 19 ± 6 19 ± 5 21 ± 6 0.22
Hypertrophy morphology 0.006
No LVH (G+LVH-) 8 (18) 1 (5) 0
Septal LVH 23 (51) 16 (85) 20 (90)
Apical LVH 2 (4) 1 (5) 1 (5)
Mixed septal & apical LVH 12 (27) 1 (5) 1 (5)
OTHER CLINICAL FEATURES
LV end-diastolic volume, ml 152 ± 28 155 ± 33 156 ± 41 0.87
LV end-systolic volume ml 40 ± 14 43 ± 14 41 ± 21 0.50
LV ejection fraction, % 74 ± 8 72 ± 8 74 ± 7 0.61
Left atrial diameter, mm 40 ± 7 37 ± 6 38 ± 8 0.25
LVOT gradient, mmHg 7.0
(4–111)
6.7
(2–110)
6.8
(3–92)
0.92
GENOTYPE
Gene positive 28 (64) 13 (68) 17 (77) 0.59
Mean ± standard deviation, median (range) or number of patients (%). HCM,
hypertrophic cardiomyopathy; SCD, sudden cardiac death; NSVT, non-sustained
ventricular tachycardia; BP, blood pressure; BPR, blood pressure response; LVH, left
ventricular hypertrophy; LV, left ventricular; G+LVH-, genotype positive HCM with normal
wall thickness; LVOT, left ventricular outflow tract. Bold values mean p-value significant (p
< 0.05).
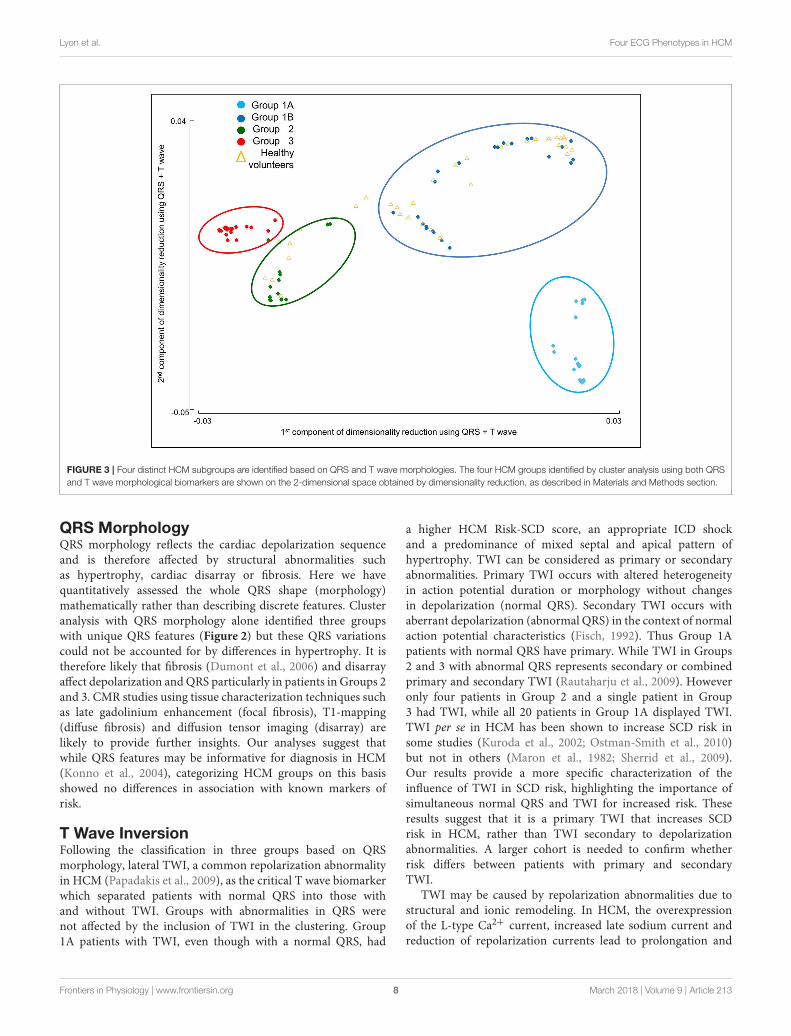
Combined Clustering With QRSMorphology and T Wave BiomarkersIdentify Four HCM PhenotypesWith the addition of T wave biomarkers to QRS morphologyin the clustering analysis, four HCM groups were identified(Figure 3). TWI of the averaged beat in at least two contiguousleads in V3-6 was the principal T wave biomarker whichsubdivided Group 1 into two separate clusters. Groups 2 and3 remained unchanged. Group 1A (n = 20) had normal QRSwith TWI. Group 1B (n = 24) had normal QRS without TWI.Group 2 (n = 19) had short R wave duration and deep Swave amplitude in V4. Group 3 (n = 22) exhibited shortR wave duration and amplitude together with long S waveduration and amplitude in V4-6, and left QRS axis deviation(Figure 4A; Supplementary Material 2.3). Table 4 summarizes
the clinical and standard ECG features for the four HCMgroups. Of note, Group 1B had an absence of patients withpathological Q waves (post-hoc p < 0.0005). There was nodifference in demographics, LV volumes or genotype between thegroups.
Differences Between the Four HCMPhenotypes in HCM Risk-SCD Score andExtent of LV HypertrophyGroup 1A had the highest median HCM Risk-SCD score (1A:4.0%, 1B: 1.8%, 2: 2.1%, 3: 2.5%; 1A vs. 1B, 1A vs. 2, 1A vs. 3, allp ≤ 0.02; Figure 4C). NSVT differed between the 4 phenotypes(p = 0.016) but this was not significant when corrected for thethree other risk factors also tested. Group 1A also contained theonly ICD patient with an appropriate shock. Group 1B contained8 of the 9 G+LVH- patients (Table 4, post-hoc p = 0.0003), ofwhich 5 patients demonstrated ECG voltage criteria for LVH. Inspite of their more abnormal QRS morphology, Groups 2 and3 patients had a lower HCM Risk-SCD score than Group 1Apatients (3: 2.5%, 2: 2.1%, 1A: 3.8%; 3 vs. 1A, 2 vs. 1A; post-hoc≤ 0.02).
Group 1A exhibited a predominance of patients with mixedseptal and apical hypertrophy (1A: 11 patients, 1B: 1 patient, 2: 1patient, 3: 1 patient; post-hoc p = 4 × 10⁻⁶; Figure 4B). Groups1B, 2 and 3 had predominantly isolated septal hypertrophy (63,85, and 90%, respectively).
We also evaluated the effect of excluding the 9 G+LVH-patients on the results (Supplementary Material 2.4, Table S2).The clustering algorithm yielded the same four remaining groupsas with G+LVH-patients, with the same differences in QRSand T wave morphologies. Group 1A still exhibited a higherHCM Risk-SCD score compared to Group 1B and to Group3 (post-hoc p = 0.006 and 0.04, respectively), and there wasstill a predominance of mixed septal and apical LVH in Group1A.
DISCUSSION
The main findings of this study are that four HCM phenotypesare identified based on QRS morphology and T wave biomarkersanalyzed computationally using high fidelity ECGs, andthey show differences in HCM Risk-SCD score and thedistribution of LV hypertrophy from CMR. Patients withnormal QRS morphology and primary TWI not secondaryto QRS abnormalities (Group 1A) had the highest HCMRisk-SCD score and coexistence of septal and apicalhypertrophy. Groups 2 and 3 with abnormalities in QRSmorphology in V4 and V4-V6, respectively, had predominantlyisolated septal hypertrophy. Since the ECG reflects ionicand structural abnormalities which are not captured bycurrent measures within HCM risk stratification, the ECG-based classification proposed here may help to improve riskassessment. Our study shows the benefits of using machinelearning methods to effectively dissect HCM heterogeneity,and presents a step forward in improving individual patientmanagement.
Frontiers in Physiology | www.frontiersin.org 7 March 2018 | Volume 9 | Article 213
Lyon et al. Four ECG Phenotypes in HCM
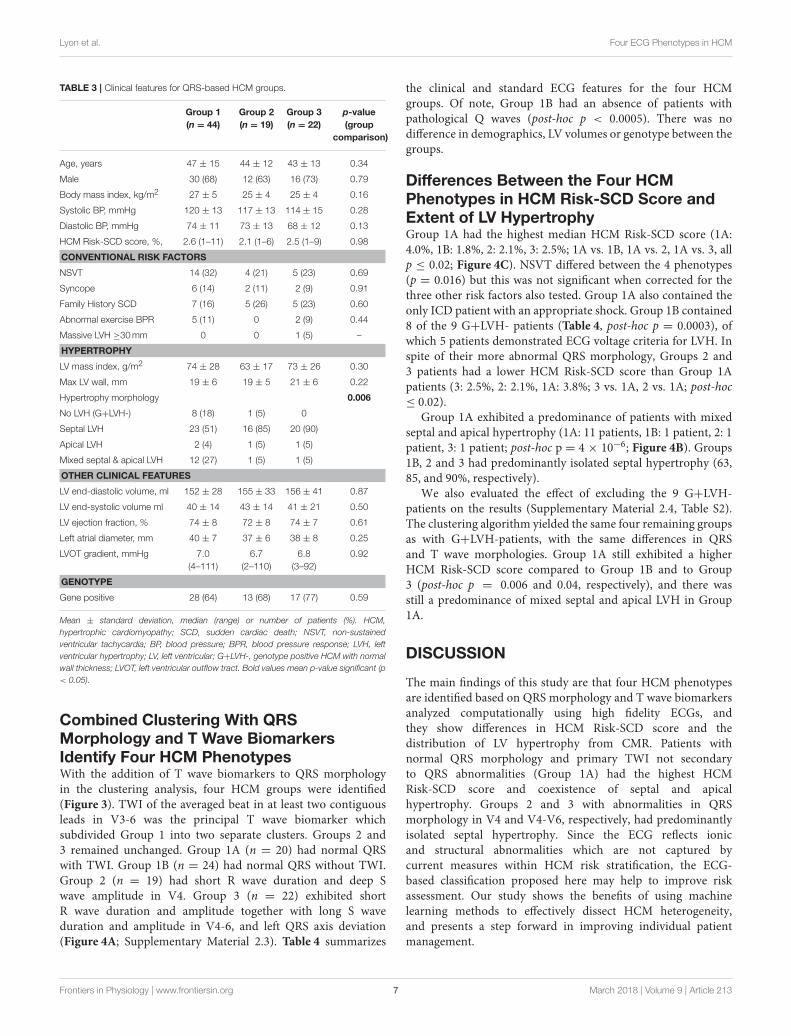
FIGURE 3 | Four distinct HCM subgroups are identified based on QRS and T wave morphologies. The four HCM groups identified by cluster analysis using both QRS
and T wave morphological biomarkers are shown on the 2-dimensional space obtained by dimensionality reduction, as described in Materials and Methods section.
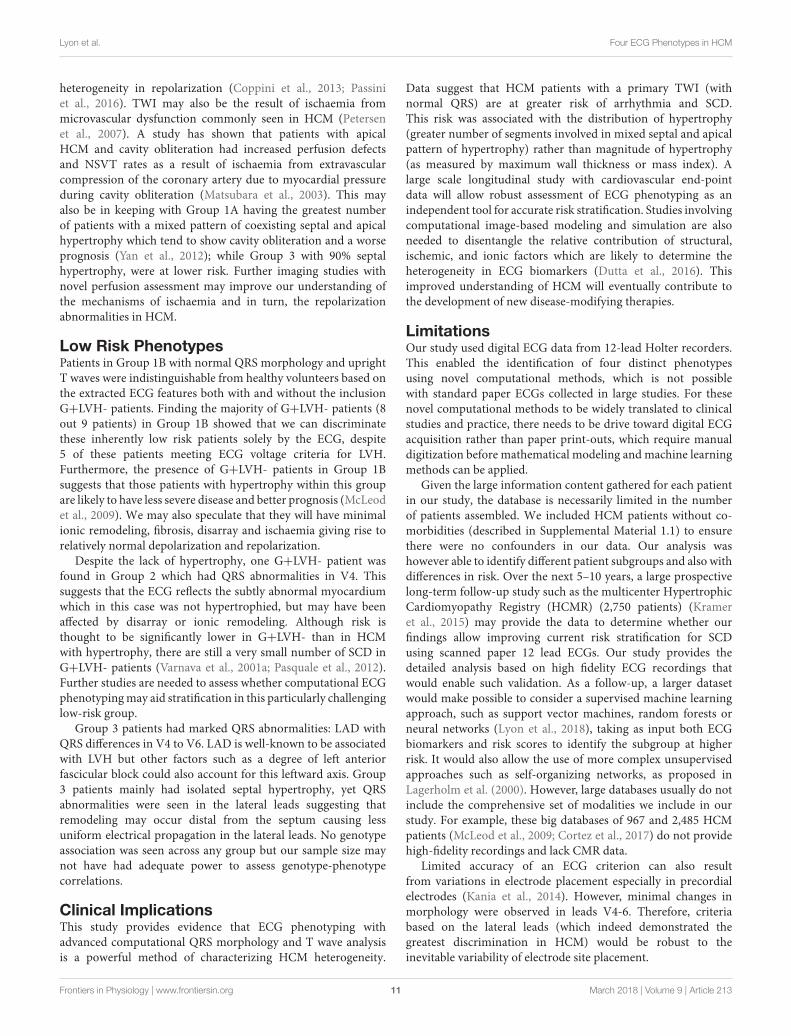
QRS MorphologyQRS morphology reflects the cardiac depolarization sequenceand is therefore affected by structural abnormalities suchas hypertrophy, cardiac disarray or fibrosis. Here we havequantitatively assessed the whole QRS shape (morphology)mathematically rather than describing discrete features. Clusteranalysis with QRS morphology alone identified three groupswith unique QRS features (Figure 2) but these QRS variationscould not be accounted for by differences in hypertrophy. It istherefore likely that fibrosis (Dumont et al., 2006) and disarrayaffect depolarization andQRS particularly in patients in Groups 2and 3. CMR studies using tissue characterization techniques suchas late gadolinium enhancement (focal fibrosis), T1-mapping(diffuse fibrosis) and diffusion tensor imaging (disarray) arelikely to provide further insights. Our analyses suggest thatwhile QRS features may be informative for diagnosis in HCM(Konno et al., 2004), categorizing HCM groups on this basisshowed no differences in association with known markers ofrisk.
T Wave InversionFollowing the classification in three groups based on QRSmorphology, lateral TWI, a common repolarization abnormalityin HCM (Papadakis et al., 2009), as the critical T wave biomarkerwhich separated patients with normal QRS into those withand without TWI. Groups with abnormalities in QRS werenot affected by the inclusion of TWI in the clustering. Group1A patients with TWI, even though with a normal QRS, had
a higher HCM Risk-SCD score, an appropriate ICD shockand a predominance of mixed septal and apical pattern ofhypertrophy. TWI can be considered as primary or secondaryabnormalities. Primary TWI occurs with altered heterogeneityin action potential duration or morphology without changesin depolarization (normal QRS). Secondary TWI occurs withaberrant depolarization (abnormal QRS) in the context of normalaction potential characteristics (Fisch, 1992). Thus Group 1Apatients with normal QRS have primary. While TWI in Groups2 and 3 with abnormal QRS represents secondary or combinedprimary and secondary TWI (Rautaharju et al., 2009). Howeveronly four patients in Group 2 and a single patient in Group3 had TWI, while all 20 patients in Group 1A displayed TWI.TWI per se in HCM has been shown to increase SCD risk insome studies (Kuroda et al., 2002; Ostman-Smith et al., 2010)but not in others (Maron et al., 1982; Sherrid et al., 2009).Our results provide a more specific characterization of theinfluence of TWI in SCD risk, highlighting the importance ofsimultaneous normal QRS and TWI for increased risk. Theseresults suggest that it is a primary TWI that increases SCDrisk in HCM, rather than TWI secondary to depolarizationabnormalities. A larger cohort is needed to confirm whetherrisk differs between patients with primary and secondaryTWI.
TWI may be caused by repolarization abnormalities due tostructural and ionic remodeling. In HCM, the overexpressionof the L-type Ca2+ current, increased late sodium current andreduction of repolarization currents lead to prolongation and
Frontiers in Physiology | www.frontiersin.org 8 March 2018 | Volume 9 | Article 213

Lyon et al. Four ECG Phenotypes in HCM
FIGURE 4 | Four distinct ECG phenotypes in hypertrophic cardiomyopathy exhibit differences in hypertrophy morphology and arrhythmic risk. (A) Representative
ECGs for patients in each of the four groups with distinct ECG morphology, identified by combined clustering with QRS morphology and T wave biomarkers. Group
1A—normal QRS with inverted T wave (primary T wave inversion), Group 1B—normal QRS with upright T wave, Group 2—short R wave duration and deep S wave in
V4, Group 3—left axis deviation, short R wave duration and amplitude, and long S wave duration and amplitude in V4 and V6. (B) Distribution of hypertrophy
illustrated using a representative CMR for each group (top), and the segment of maximum left ventricular wall thickness for each patient (marked as a dot) in each
group using the AHA 16-segment model (Cerqueira et al., 2002). Group 1A had a predominance of patients with mixed septal and apical left ventricular hypertrophy
(LVH; pink dots). Group 1B had the most gene positive patients with no hypertrophy (gray dots). Group 2 and 3 patients mainly had isolated septal hypertrophy
(orange dots). Four patients had apical hypertrophy (navy dots). (C) HCM Risk-SCD score for each group. Patients with primary T wave inversion not secondary to
QRS abnormalities (Group 1A), had the greatest HCM Risk-SCD score.
Frontiers in Physiology | www.frontiersin.org 9 March 2018 | Volume 9 | Article 213

Lyon et al. Four ECG Phenotypes in HCM
TABLE 4 | Characteristics of the four HCM phenotypes from combined QRS and T wave clustering.
Group 1A
(n = 20)
Group 1B
(n = 24)
Group 2
(n = 19)
Group 3
(n = 22)
p-value
(group comparison)
Age, years 47 ± 12 48 ± 18 44 ± 12 43 ± 13 0.53
Male 15 (76) 15 (63) 12 (63) 16 (73) 0.78
Body mass index, kg/m2 28 ± 6 26 ± 4 25 ± 4 25 ± 4 0.06
HCM Risk-SCD score, % 4.0 (2–11)a,b,c 1.8 (1–4) 2.1 (1–6) 2.5 (1–9) 0.0001
CONVENTIONAL RISK FACTORS
NSVT 11 (55)* 3 (13) 4 (21) 5 (23) 0.016
Syncope 2 (10) 4 (17) 2 (10) 2 (9) 0.88
Family History SCD 5 (254) 2 (8) 5 (26) 5 (23) 0.36
Abnormal exercise BPR 2 (10) 3 (12) 0 2 (9) 0.51
Massive LVH ≥30mm 0 0 0 1 (5) -
Appropriate ICD shock 1 0 0 0 -
HYPERTROPHY
LV mass index, g/m2 90 ± 27a,b 62 ± 23 63 ± 17 73 ± 26 0.0003
Max LV wall, mm 22 ± 4a 16 ± 5 19 ± 5 21 ± 6 0.002
Hypertrophy morphology 1 × 10⁻⁷
No LVH (G+LVH-) 0 8 (33)* 1 (5) 0
Septal LVH 7 (35)* 15 (63) 16 (85) 20 (90)
Apical LVH 2 (10) 0 1 (5) 1 (5)
Mixed septal & apical LVH 11 (52)* 1 (4) 1 (5) 1 (5)
OTHER CLINICAL FEATURES
LV EDV, ml 150 ± 26 154 ± 31 155 ± 33 156 ± 41 0.94
LV ESV, ml 35 ± 10 43 ± 15 43 ± 14 41 ± 21 0.26
LV ejection fraction, % 76 ± 7 72 ± 8 72 ± 8 74 ± 7 0.28
Left atrial diameter, mm 41 ± 5 39 ± 8 37 ± 6 38 ± 8 0.25
LVOT gradient, mmHg 6.5 (5–110) 7.2 (4–111) 6.7 (2–110) 6.8 (3–92) 0.81
GENOTYPE
Gene positive 9 (45) 19 (79) 13 (68) 17 (77) 0.08
ECG FEATURES
Heart rate, bpm 58 ± 10 58 ± 8 59 ± 13 58 ± 10 0.66
QRS axis, ◦ 14 ± 30c 44 ± 29e 29 ± 34f −37 ± 28 8 × 10⁻¹³
QRS duration, ms 94 ± 8 100 ± 21 96 ± 16 102 ± 13 0.23
QRS amplitude, mV 2006 ± 780 1762 ± 621 1807 ± 588 1737 ± 613 0.70
QRS ascending slope 93 ± 36 95 ± 33 92 ± 34 76 ± 23 0.19
QRS descending slope −160 ± 60 −139 ± 56 −155 ± 60 −149 ± 56 0.47
Pathological Q waves 3 (14) 0†
8 (38) 9 (43) 0.0003
T wave axis, ◦ 156 ± 45a,b,c 42 ± 27 49 ± 47 68 ± 41 2 × 10⁻¹¹
Abnormal T axis 17 (81)†
0†
6 (33) 5 (25) 7 × 10⁻⁸
T amplitude, mV −135 ± 202a,b,c 308 ± 144 219 ± 209 257 ± 214 9 × 10⁻⁸
T wave inversion 21 (100)†
0 4 (21) 1 (5) 8 × 10⁻¹⁷
Giant T wave inversion 5 (24)†
0 1 (5) 0 0.003
T peak to T end, ms 91 ± 17 80 ± 20 86 ± 16 84 ± 19 0.19
ST segment displacement*, mV −13 ± 51a,b,c 32 ± 33 38 ± 51 48 ± 38 0.0001
QTc interval, ms 452 ± 22 435 ± 26 429 ± 26 443 ± 29 0.05
JTc interval, ms 359 ± 47 349 ± 87 342 ± 97 366 ± 145 0.42
Mean ± standard deviation, median (range) or number of patients (%). HCM, hypertrophic cardiomyopathy; SCD, sudden cardiac death; NSVT, non-sustained ventricular tachycardia;
BPR, blood pressure response; LVH, left ventricular hypertrophy; LV, left ventricular; G+LVH-, genotype positive HCM with normal wall thickness; EDV, end-diastolic volume; ESV,
end-systolic volume; LVOT, left ventricular outflow tract.aGroup 1A vs. 1B,b1A vs. 2, c1A vs. 3, d1B vs. 2, e1B vs. 3, f2 vs. 3, p < 0.05 on post-hoc pairwise comparisons (p-values multiplied by 6 for Bonferroni adjustment of 6 tests).
*,†p < 0.05 on post-hoc contingency table analysis (p-values multiplied by 16 and 8 for Bonferroni adjustment of 4 × 4 and 4 × 2 combinations, respectively). Bold values mean p-value
significant (p < 0.05).
Frontiers in Physiology | www.frontiersin.org 10 March 2018 | Volume 9 | Article 213
Lyon et al. Four ECG Phenotypes in HCM
heterogeneity in repolarization (Coppini et al., 2013; Passiniet al., 2016). TWI may also be the result of ischaemia frommicrovascular dysfunction commonly seen in HCM (Petersenet al., 2007). A study has shown that patients with apicalHCM and cavity obliteration had increased perfusion defectsand NSVT rates as a result of ischaemia from extravascularcompression of the coronary artery due to myocardial pressureduring cavity obliteration (Matsubara et al., 2003). This mayalso be in keeping with Group 1A having the greatest numberof patients with a mixed pattern of coexisting septal and apicalhypertrophy which tend to show cavity obliteration and a worseprognosis (Yan et al., 2012); while Group 3 with 90% septalhypertrophy, were at lower risk. Further imaging studies withnovel perfusion assessment may improve our understanding ofthe mechanisms of ischaemia and in turn, the repolarizationabnormalities in HCM.
Low Risk PhenotypesPatients in Group 1B with normal QRS morphology and uprightT waves were indistinguishable from healthy volunteers based onthe extracted ECG features both with and without the inclusionG+LVH- patients. Finding the majority of G+LVH- patients (8out 9 patients) in Group 1B showed that we can discriminatethese inherently low risk patients solely by the ECG, despite5 of these patients meeting ECG voltage criteria for LVH.Furthermore, the presence of G+LVH- patients in Group 1Bsuggests that those patients with hypertrophy within this groupare likely to have less severe disease and better prognosis (McLeodet al., 2009). We may also speculate that they will have minimalionic remodeling, fibrosis, disarray and ischaemia giving rise torelatively normal depolarization and repolarization.
Despite the lack of hypertrophy, one G+LVH- patient wasfound in Group 2 which had QRS abnormalities in V4. Thissuggests that the ECG reflects the subtly abnormal myocardiumwhich in this case was not hypertrophied, but may have beenaffected by disarray or ionic remodeling. Although risk isthought to be significantly lower in G+LVH- than in HCMwith hypertrophy, there are still a very small number of SCD inG+LVH- patients (Varnava et al., 2001a; Pasquale et al., 2012).Further studies are needed to assess whether computational ECGphenotypingmay aid stratification in this particularly challenginglow-risk group.
Group 3 patients had marked QRS abnormalities: LAD withQRS differences in V4 to V6. LAD is well-known to be associatedwith LVH but other factors such as a degree of left anteriorfascicular block could also account for this leftward axis. Group3 patients mainly had isolated septal hypertrophy, yet QRSabnormalities were seen in the lateral leads suggesting thatremodeling may occur distal from the septum causing lessuniform electrical propagation in the lateral leads. No genotypeassociation was seen across any group but our sample size maynot have had adequate power to assess genotype-phenotypecorrelations.
Clinical ImplicationsThis study provides evidence that ECG phenotyping withadvanced computational QRS morphology and T wave analysisis a powerful method of characterizing HCM heterogeneity.
Data suggest that HCM patients with a primary TWI (withnormal QRS) are at greater risk of arrhythmia and SCD.This risk was associated with the distribution of hypertrophy(greater number of segments involved in mixed septal and apicalpattern of hypertrophy) rather than magnitude of hypertrophy(as measured by maximum wall thickness or mass index). Alarge scale longitudinal study with cardiovascular end-pointdata will allow robust assessment of ECG phenotyping as anindependent tool for accurate risk stratification. Studies involvingcomputational image-based modeling and simulation are alsoneeded to disentangle the relative contribution of structural,ischemic, and ionic factors which are likely to determine theheterogeneity in ECG biomarkers (Dutta et al., 2016). Thisimproved understanding of HCM will eventually contribute tothe development of new disease-modifying therapies.
LimitationsOur study used digital ECG data from 12-lead Holter recorders.This enabled the identification of four distinct phenotypesusing novel computational methods, which is not possiblewith standard paper ECGs collected in large studies. For thesenovel computational methods to be widely translated to clinicalstudies and practice, there needs to be drive toward digital ECGacquisition rather than paper print-outs, which require manualdigitization before mathematical modeling and machine learningmethods can be applied.
Given the large information content gathered for each patientin our study, the database is necessarily limited in the numberof patients assembled. We included HCM patients without co-morbidities (described in Supplemental Material 1.1) to ensurethere were no confounders in our data. Our analysis washowever able to identify different patient subgroups and also withdifferences in risk. Over the next 5–10 years, a large prospectivelong-term follow-up study such as the multicenter HypertrophicCardiomyopathy Registry (HCMR) (2,750 patients) (Krameret al., 2015) may provide the data to determine whether ourfindings allow improving current risk stratification for SCDusing scanned paper 12 lead ECGs. Our study provides thedetailed analysis based on high fidelity ECG recordings thatwould enable such validation. As a follow-up, a larger datasetwould make possible to consider a supervised machine learningapproach, such as support vector machines, random forests orneural networks (Lyon et al., 2018), taking as input both ECGbiomarkers and risk scores to identify the subgroup at higherrisk. It would also allow the use of more complex unsupervisedapproaches such as self-organizing networks, as proposed inLagerholm et al. (2000). However, large databases usually do notinclude the comprehensive set of modalities we include in ourstudy. For example, these big databases of 967 and 2,485 HCMpatients (McLeod et al., 2009; Cortez et al., 2017) do not providehigh-fidelity recordings and lack CMR data.
Limited accuracy of an ECG criterion can also resultfrom variations in electrode placement especially in precordialelectrodes (Kania et al., 2014). However, minimal changes inmorphology were observed in leads V4-6. Therefore, criteriabased on the lateral leads (which indeed demonstrated thegreatest discrimination in HCM) would be robust to theinevitable variability of electrode site placement.
Frontiers in Physiology | www.frontiersin.org 11 March 2018 | Volume 9 | Article 213
Lyon et al. Four ECG Phenotypes in HCM
CONCLUSIONS
Four HCM phenotypes were identified based on QRSmorphology and T wave biomarkers using a machine learningapproach. Patients with primary TWI not secondary to QRSabnormalities had an increased HCM Risk-SCD score andcoexisting septal and apical hypertrophy. These results, and thenature of the underlying processes captured by the ECG, suggestthat computational ECG phenotyping has the potential to be anovel and independent factor for risk stratification.
AUTHOR CONTRIBUTIONS
RA recruited the HCM and Control populations and performedthe statistical analysis; AL performed the ECG signal analysis andthe computational clustering; RA and AL worked on the writingof the manuscript; MM and EO provided help in the collection ofthe data; PL and NdF gave input on the computational methodsfor signal processing and clustering; SN, HW, AM, and BRprovided help and guidance on the study design and the writingof the manuscript.
FUNDING
AL is supported by a scholarship provided by the British HeartFoundation Centre of Research Excellence. RA is supported
by a British Heart Foundation Clinical Research TrainingFellowship. AM and BR are supported by BR’s Wellcome TrustSenior Research Fellowship in Basic Biomedical Sciences. PL issupported by project TIN2014-53567-R and TEC2013-44666-R,Spain and Grupo Consolidado BSICoS from DGA, Aragón,Spain. SN and HW acknowledge support from the OxfordNIHR Biomedical Research Centre and the British HeartFoundation. This project has also received funding fromthe European Union’s Horizon 2020 research and innovationprogramme under Grant Agreement No. 675451 (CompBioMedproject).
ACKNOWLEDGMENTS
We thank Jane Francis for assisting with CMR scanning, JoanneSellwood for nursing support, Rachel Given for data input,the Oxford Medical Genetics Laboratories, Oxford UniversityHospitals NHS Foundation Trust for genetic data, Dr. SanjayManohar for helpful discussions and Prof. Martin Farrall foradvice with statistics.
SUPPLEMENTARY MATERIAL
The Supplementary Material for this article can be foundonline at: https://www.frontiersin.org/articles/10.3389/fphys.2018.00213/full#supplementary-material
REFERENCES
Adabag, A. S., Maron, B. J., Appelbaum, E., Harrigan, C. J., Buros, J. L.,
Gibson, C. M., et al. (2008). Occurrence and frequency of arrhythmias
in hypertrophic cardiomyopathy in relation to delayed enhancement on
cardiovascular magnetic resonance. J. Am. Coll. Cardiol. 51, 1369–1374.
doi: 10.1016/j.jacc.2007.11.071
Belkin, M., and Niyogi, P. (2003). Laplacian eigenmaps for dimensionality
reduction and data representation. Neural Comput. 15, 1373–1396.
doi: 10.1162/089976603321780317
Cai, D., Zhang, C., and He, X. (2010). “Unsupervised feature selection for multi-
cluster data,” in Proceedings of the 16th ACM SIGKDD International Conference
on Knowledge Discovery and Data Mining [Internet] (New York, NY: ACM)
(cited June 10, 2016), 333–342. Available online at: http://doi.acm.org/10.1145/
1835804.1835848
Cerqueira, M. D., Weissman, N. J., Dilsizian, V., Jacobs, A. K., Kaul, S.,
Laskey, W. K., et al. (2002). Standardized myocardial segmentation and
nomenclature for tomographic imaging of the heart. A statement for healthcare
professionals from the Cardiac imaging committee of the council on clinical
Cardiology of the American Heart Association. Circulation 105, 539–542.
doi: 10.1161/hc0402.102975
Christiaans, I., van Engelen, K., van Langen, I. M., Birnie, E., Bonsel, G. J., Elliott,
P. M., et al. (2010). Risk stratification for sudden cardiac death in hypertrophic
cardiomyopathy: systematic review of clinical risk markers. Europace 12,
313–321. doi: 10.1093/europace/eup431
Coppini, R., Ferrantini, C., Yao, L., Fan, P., Del Lungo, M., Stillitano, F.,
et al. (2013). Late sodium current inhibition reverses electromechanical
dysfunction in human hypertrophic cardiomyopathy. Circulation 127,
575–584. doi: 10.1161/CIRCULATIONAHA.112.134932
Cortez, D., Schlegel, T. T., Ackerman, M. J., and Bos, J. M. (2017). ECG-
derived spatial QRS-T angle is strongly associated with hypertrophic
cardiomyopathy. J. Electrocardiol. 50, 195–202. doi: 10.1016/j.jelectrocard.2016.
10.001
Dumont, C. A., Monserrat, L., Soler, R., Rodríguez, E., Fernandez, X., Peteiro,
J., et al. (2006). Interpretation of electrocardiographic abnormalities in
hypertrophic cardiomyopathy with cardiac magnetic resonance. Eur. Heart J.
27, 1725–31. doi: 10.1093/eurheartj/ehl101
Dutta, S., Mincholé, A., Zacur, E., Quinn, T. A., Taggart, P., and Rodriguez,
B. (2016). Early afterdepolarizations promote transmural reentry in ischemic
human ventricles with reduced repolarization reserve. Prog. Biophys. Mol. Biol.
120, 236–248. doi: 10.1016/j.pbiomolbio.2016.01.008
Elliott, P. M., Borger, M. A., Borggrefe, M., Cecchi, F., Charron, P., Hagege,
A. A., et al. (2014). ESC guidelines on diagnosis and management of
hypertrophic cardiomyopathy: the task force for the diagnosis andmanagement
of hypertrophic cardiomyopathy of the European Society of Cardiology (ESC).
Eur. Heart J. 35, 2733–2779. doi: 10.1093/eurheartj/ehu284
Elliott, P. M., Poloniecki, J., Dickie, S., Sharma, S., Monserrat, L., Varnava,
A., et al. (2000). Sudden death in hypertrophic cardiomyopathy:
identification of high risk patients. J. Am. Coll. Cardiol. 36, 2212–2218.
doi: 10.1016/S0735-1097(00)01003-2
Ester, M., Kriegel, H., Sander, J., and Xu, X. (1996). “A density-based algorithm
for discovering clusters in large spatial databases with noise,” in KDD-96
Proceedings (Portland, OR: AAAI Press), 226–231.
Fisch, C. (1992). “Electrocardiography and vectorcardiography,” in Heart
Disease: A Textbook of Cardiovascular Medicine, 4th Edn., ed E. Braunwald
(Philadelphia, PA: WB Saunders), 116–160.
Kania, M., Rix, H., Fereniec, M., Zavala-Fernandez, H., Janusek, D., Mroczka, T.,
et al. (2014). The effect of precordial lead displacement on ECG morphology.
Med. Biol. Eng. Comput. 52, 109–119. doi: 10.1007/s11517-013-1115-9
Konno, T., Shimizu, M., Ino, H., Yamaguchi, M., Terai, H., Uchiyama, K.,
et al. (2004). Diagnostic value of abnormal Q waves for identification of
preclinical carriers of hypertrophic cardiomyopathy based on a molecular
genetic diagnosis. Eur. Heart J. 25, 246–251. doi: 10.1016/j.ehj.2003.10.031
Kramer, C. M., Appelbaum, E., Desai, M. Y., Desvigne-Nickens, P., DiMarco, J.
P., Friedrich, M. G., et al. (2015). Hypertrophic cardiomyopathy registry: the
rationale and design of an international, observational study of hypertrophic
cardiomyopathy. Am. Heart J. 170, 223–230. doi: 10.1016/j.ahj.2015.05.013
Kuroda, N., Ohnishi, Y., Yoshida, A., Kimura, A., and Yokoyama, M. (2002).
Clinical significance of T-wave alternans in Hypertrophic Cardiomyopathy.
Circ. J. 66, 457–462. doi: 10.1253/circj.66.457
Frontiers in Physiology | www.frontiersin.org 12 March 2018 | Volume 9 | Article 213

Lyon et al. Four ECG Phenotypes in HCM
Lagerholm, M., Peterson, C., Braccini, G., Edenbrandt, L., and Sornmo, L. (2000).
Clustering ECG complexes using Hermite functions and self-organizing maps.
IEEE Trans. Biomed. Eng. 47, 838–848. doi: 10.1109/10.846677
Laguna, P., Jane, R., Olmos, S., Thakor, N. V., Rix, H., and Caminal, P. (1996).
Adaptive estimation of QRS complex wave features of ECG signal by the
Hermite model.Med. Biol. Eng. Comput. 34, 58–68. doi: 10.1007/BF02637023
Lakdawala, N. K., Thune, J. J., Maron, B. J., Cirino, A. L., Havndrup, O., Bundgaard,
H., et al. (2011). Electrocardiographic features of sarcomere mutation carriers
with and without clinically overt hypertrophic cardiomyopathy. Am. J. Cardiol.
108, 1606–1613. doi: 10.1016/j.amjcard.2011.07.019
Lyon, A., Mincholé, A., Martínez, J. P., Laguna, P., and Rodriguez, B. (2018).
Computational techniques for ECG analysis and interpretation in light
of their contribution to medical advances. J. R Soc. Interf. 15:20170821.
doi: 10.1098/rsif.2017.0821
Macfarlane, P. W., Devine, B., Latif, S., McLaughlin, S., Shoat, D. B., and Watts,
M. P. (1990). Methodology of ECG interpretation in the Glasgow program.
Methods Inf. Med. 29, 354–361.
Maron, B. J. (2002). Hypertrophic cardiomyopathy: a systematic review. JAMA
287, 1308–1320. doi: 10.1001/jama.287.10.1308
Maron, B. J., Casey, S. A., Chan, R. H., Garberich, R. F., Rowin, E. J., and Maron,
M. S. (2015). Independent assessment of the European Society of Cardiology
sudden death risk model for Hypertrophic Cardiomyopathy. Am. J. Cardiol.
116, 757–764. doi: 10.1016/j.amjcard.2015.05.047
Maron, B. J., Roberts, W. C., and Epstein, S. E. (1982). Sudden death
in hypertrophic cardiomyopathy: a profile of 78 patients. Circulation 65,
1388–1394. doi: 10.1161/01.CIR.65.7.1388
Maron, B. J., Shen, W. K., Link, M. S., Epstein, A. E., Almquist, A. K., Daubert,
J. P., et al. (2000). Efficacy of implantable cardioverter-defibrillators for the
prevention of sudden death in patients with hypertrophic cardiomyopathy. N
Engl. J. Med. 342, 365–373. doi: 10.1056/NEJM200002103420601
Maron, B. J., Spirito, P., Shen, W.-K., Haas, T. S., Formisano, F., Link, M.
S., et al. (2007). Implantable cardioverter-defibrillators and prevention of
sudden cardiac death in hypertrophic cardiomyopathy. JAMA 298, 405–412.
doi: 10.1001/jama.298.4.405
Maron, B. J., Wolfson, J. K., Ciró, E., and Spirito, P. (1983). Relation
of electrocardiographic abnormalities and patterns of left ventricular
hypertrophy identified by 2-dimensional echocardiography in patients
with hypertrophic cardiomyopathy. Am. J. Cardiol. 51, 189–194.
doi: 10.1016/S0002-9149(83)80034-4
Martínez, J. P., Almeida, R., Olmos, S., Rocha, A. P., and Laguna, P. (2004). A
wavelet-based ECG delineator: evaluation on standard databases. IEEE Trans.
Biomed. Eng. 51, 570–581. doi: 10.1109/TBME.2003.821031
Matsubara, K., Nakamura, T., Kuribayashi, T., Azuma, A., and Nakagawa,
M. (2003). Sustained cavity obliteration and apical aneurysm formation
in apical hypertrophic cardiomyopathy. J. Am. Coll. Cardiol. 42, 288–295.
doi: 10.1016/S0735-1097(03)00576-X
McLeod, C. J., Ackerman, M. J., Nishimura, R. A., Tajik, A. J., Gersh, B.
J., and Ommen, S. R. (2009). Outcome of patients with hypertrophic
cardiomyopathy and a normal electrocardiogram. J. Am. Coll. Cardiol. 54,
229–233. doi: 10.1016/j.jacc.2009.02.071
O’Mahony, C., Elliott, P., and McKenna, W. (2013). Sudden cardiac death in
Hypertrophic Cardiomyopathy. Circ. Arrhythm. Electrophysiol. 6, 443–451.
doi: 10.1161/CIRCEP.111.962043
O’Mahony, C., Jichi, F., Pavlou, M., Monserrat, L., Anastasakis, A., Rapezzi, C.,
et al. (2014). A novel clinical risk prediction model for sudden cardiac death in
hypertrophic cardiomyopathy (HCM Risk-SCD). Eur. Heart J. 35, 2010–2020.
doi: 10.1093/eurheartj/eht439
Ostman-Smith, I., Wisten, A., Nylander, E., Bratt, E. L., Granelli, A., Oulhaj,
A., et al. (2010). Electrocardiographic amplitudes: a new risk factor for
sudden death in hypertrophic cardiomyopathy. Eur. Heart J. 31, 439–449.
doi: 10.1093/eurheartj/ehp443
Papadakis, M., Basavarajaiah, S., Rawlins, J., Edwards, C., Makan, J., Firoozi,
S., et al. (2009). Prevalence and significance of T-wave inversions in
predominantly Caucasian adolescent athletes. Eur. Heart J. 30, 1728–1735.
doi: 10.1093/eurheartj/ehp164
Pasquale, F., Syrris, P., Kaski, J. P., Mogensen, J., McKenna, W. J., and Elliott,
P. (2012). Long-term outcomes in hypertrophic cardiomyopathy caused by
mutations in the cardiac troponin T gene. Circ. Cardiovasc. Genet. 5, 10–17.
doi: 10.1161/CIRCGENETICS.111.959973
Passini, E., Mincholé, A., Coppini, R., Cerbai, E., Rodriguez, B., Severi,
S., et al. (2016). Mechanisms of pro-arrhythmic abnormalities in
ventricular repolarisation and anti-arrhythmic therapies in human
hypertrophic cardiomyopathy. J. Mol. Cell Cardiol. 96, 72–81.
doi: 10.1016/j.yjmcc.2015.09.003
Petersen, S. E., Jerosch-Herold, M., Hudsmith, L. E., Robson, M. D.,
Francis, J. M., Doll, H. A., et al. (2007). Evidence for microvascular
dysfunction in hypertrophic cardiomyopathy: new insights from
multiparametric magnetic resonance imaging. Circulation 115, 2418–2425.
doi: 10.1161/CIRCULATIONAHA.106.657023
Rautaharju, P. M., Surawicz, B., and Gettes, L. S. (2009). AHA/ACCF/HRS
Recommendations for the standardization and interpretation of the
electrocardiogrampart IV: The ST segment, T and U waves, and the
QT interval a scientific statement from the American heart association
electrocardiography and arrhythmias committee, council on clinical
cardiology; the american college of cardiology foundation; and the heart
rhythm society endorsed by the international society for computerized
electrocardiology. J. Am. Coll. Cardiol. 53, 982–991. doi: 10.1016/j.jacc.2008.
12.014
Savage, D. D., Seides, S. F., Clark, C. E., Henry, W. L., Maron, B. J., Robinson, F.
C., et al. (1978). Electrocardiographic findings in patients with obstructive and
nonobstructive hypertrophic cardiomyopathy. Circulation 58(3 Pt 1), 402–408.
doi: 10.1161/01.CIR.58.3.402
Sen-Chowdhry, S., Jacoby, D., Moon, J. C., and McKenna, W. J.
(2016). Update on hypertrophic cardiomyopathy and a guide to the
guidelines. Nat. Rev. Cardiol. 13, 651–675. doi: 10.1038/nrcardio.
2016.140
Sherrid, M. V., Cotiga, D., Hart, D., Ehlert, F., Haas, T. S., Shen, W.-K.,
et al. (2009). Relation of 12-lead electrocardiogram patterns to implanted
defibrillator-terminated ventricular tachyarrhythmias in hypertrophic
cardiomyopathy. Am. J. Cardiol. 104, 1722–1726. doi: 10.1016/j.amjcard.2009.
07.056
Sörnmo, L., and Laguna, P. (eds.). (2005). Bioelectrical Signal Processing in Cardiac
and Neurological Applications. Burlington: Academic Press (cited October 10,
2014). Available online at: http://www.sciencedirect.com/science/article/pii/
B9780124375529500015
Sornmo, L., Ola Borjesson, P., Nygards, M.-E., and Pahlm, O. (1981). A
method for evaluation of QRS shape features using a mathematical model for
the ECG. IEEE Trans. Biomed. Eng. 28, 713–717. doi: 10.1109/TBME.1981.
324666
Spirito, P., Bellone, P., Harris, K. M., Bernabo, P., Bruzzi, P., and Maron, B.
J. (2000). Magnitude of left ventricular hypertrophy and risk of sudden
death in hypertrophic cardiomyopathy. N Engl. J. Med. 342, 1778–1785.
doi: 10.1056/NEJM200006153422403
Varnava, A. M., Elliott, P. M., Baboonian, C., Davison, F., Davies, M. J., and
McKenna, W. J. (2001a). Hypertrophic cardiomyopathy: histopathological
features of sudden death in cardiac troponin T disease. Circulation 104,
1380–1384. doi: 10.1161/hc3701.095952
Varnava, A. M., Elliott, P. M., Mahon, N., Davies, M. J., and McKenna,
W. J. (2001b). Relation between myocyte disarray and outcome
in hypertrophic cardiomyopathy. Am. J. Cardiol. 88, 275–279.
doi: 10.1016/S0002-9149(01)01640-X
Yan, L., Wang, Z., Xu, Z., Li, Y., Tao, Y., and Fan, C. (2012). Two hundred
eight patients with apical hypertrophic cardiomyopathy in china: clinical
feature, prognosis, and comparison of pure and mixed forms. Clin. Cardiol. 35,
101–106. doi: 10.1002/clc.20995
Conflict of Interest Statement: The authors declare that the research was
conducted in the absence of any commercial or financial relationships that could
be construed as a potential conflict of interest.
Copyright © 2018 Lyon, Ariga, Mincholé, Mahmod, Ormondroyd, Laguna,
de Freitas, Neubauer, Watkins and Rodriguez. This is an open-access article
distributed under the terms of the Creative Commons Attribution License (CC
BY). The use, distribution or reproduction in other forums is permitted, provided
the original author(s) and the copyright owner are credited and that the original
publication in this journal is cited, in accordance with accepted academic practice.
No use, distribution or reproduction is permitted which does not comply with these
terms.
Frontiers in Physiology | www.frontiersin.org 13 March 2018 | Volume 9 | Article 213