distant visual acuity loss among japanese grammar …
TRANSCRIPT

J. &-on. Dis. 1963, Vol. 16, pp. 31-54. Pergamon Press Ltd. Printed in Great Britain
DISTANT VISUAL ACUITY LOSS AMONG JAPANESE GRAMMAR SCHOOL CHILDREN:
THE ROLES OF HEREDITY AND THE ENVIRONMENT*
ROBERT W. MILLER, M.D.7
Department of Epidemiology, School of Public Health, University of Michigan
(Received 15 April 1962)
IN THIS investigation a single defect in childhood is examined with respect to a variety of factors which may be subtly associated with it. The abnormality, loss of distant visual acuity, is common and easily measured. Because the eye is so highly specialized. minimal changes in its structure produce disordered function that would go undetected in less specialized tissue. The study of an ocular disability, then, may reveal environmental and genetic influences that are not recognizable by current measurements of other organ systems.
Unfortunately, loss of distant visual acuity is not a diagnosis but a physical sign produced by an array of eye diseases. An attempt will be made to sort these out and to focus attention on myopia, a defect with a pathogenesis that has intrigued physicians for centuries.
BACKGROUND
The study. In the years following the war pregnant women in Japan were allowed an extra ration of rice for which they could register beginning in the fifth month of pregnancy. This gave the Atomic Bomb Casualty Commission (ABCC) a case-finding mechanism that brought into its Genetics Program 93 per cent of all children born in Hiroshima and Nagasaki from mid-1948 through 1953. A full description of the plan and the outcome of 71,270 pregnancies is given in a monograph by NEEL and
&HULL [I].
From the histories obtained it was found that about 5 per cent of the marriages were between first cousins and another 2 per cent were between first-cousins-once-removed
*This work is a portion of a Child Health Survey sponsored by the U.S. Atomic Energy Commission, the Rockefeller Foundation, the Association for Aid to Crippled Children, and the U.S. Public Health Service’s National Institute of Dental Research. The Atomic Bomb Casualty Commission, a research agency of the National Academy of Sciences-National Research Council and the Japanese National Institute of Health, contributed facilities and personnel in Hiroshima and Nagasaki.
This study was partially supported by an Epidemiology training grant from the United States Public Health Service, National Institutes of Health USPHS 2G-6 (C3) 38535. The basic data in this paper were abstracted from a dissertation submitted in partial fulfilment of requirements for the degree of Doctor of Public Health at the University of Michigan.
TPresent address: Chief, Epidemiology Branch, National Cancer Institute, Bethesda 14. Maryland,
31
32 ROBERT W. MILLER
(l-) cousins) or second cousins. Thus, in the two cities about 5000 of the children were born of parents who were second cousins or more closely related. This observation led to the creation of the present study, directed by Drs. JAMES V. NEEL and WILLIAM J. SCHULL of the University of Michigan-a study which sought to determine the effect of inbreeding on child health. The comparisons made were between inbred children and an approximately equal number of systematically selected children whose parents were unrelated. These ‘control’ youngsters had also previously been examined in the Genetics Program. To avoid confounding inbreeding effects with radiation effects, the child was excluded from the study if either parent was thought to have received a significant radiation exposure from the atomic bomb. For 57 per cent of the children, both parents were outside the city at the time of the bomb. The remainder in the present study were born of parents who averaged less than 10 rep each (NEEL- SCHULL radiation category 2) [l].
In this survey the children were studied comprehensively through screening pro- cedures designed to reveal physical fitness. The panorama of data provided a means for evaluating the relationship of distant visual acuity loss to inheritance, to the environment during embryologic life, infancy, and childhood, and to growth. The events studied began with the parental mating and ended in mid-childhood.
Vision screening. The Snellen test, a measure of distant visual acuity, may be abnormal in (1) diseases which interfere with the transmission of light to the retina or of the impulse to the brain, as, for example, cataracts or optic neuropathy (termed organic disease by ophthalmologists); (2) defects in the focusing system, which are the consequence of refractive errors or of an abnormality of accommodation; and (3) functional disturbances such as amblyopia or poor cooperation. During the grammar school years myopia is the principal reason for failing the Snellen test when performed without a cycloplegic [2-4].
In this survey a cycloplegic was not used; hence accommodation was active. This omission would not help the test performance of myopic youngsters since accom- modation would intensify their disability. The same is not true for hypermetropia: an American survey [2] has shown that for each hypermetropic child who scored 20/70 or worse without a cycloplegic there were 26 when tested with the drug. The corres- ponding increase in the detection of astigmatism was tenfold.
The frequency of myopia increases steeply with age through the grammar school years, whereas manifest hypermetropia and astigmatism do not [2-4]. For comparison with our findings, the results of a study of grammar school children in Shizuoka City, Japan, are particularly pertinent because of the similarity of that program to ours. MAJIMA, NAKAJIMA and their co-workers [4], a group of experienced ophthalmologists, examined 3033 youngsters in a broad survey of child health, which, through the sub- sequent use of the Japanese official family register (koseki) would allow comparisons of the observations by the degree of inbreeding. They found that 10 per cent of the children had myopia of -1.0 diopter or worse, only one child had severe astigmatism, 3 of 6027 eyes were hypermetropic, and 0.8 per cent of the children had organic lesions associated with visual acuity of 0.5 (20/40) or worse.
METHODS The Hiroshima examinations were performed from October 1958 through June
1959. Those in Nagasaki were begun in August 1959 and ended in June 1960. In each

Distant Visual Acuity Loss Among Japanese Grammar School Children 33
city medical, socio-economic, consanguinity and pregnancy histories were obtained at the child’s home by one of five nurses. Within two weeks the child was examined at the clinic by one of four pediatricians supervised by the author. In Hiroshima the neurological and psychometric examinations were overseen by a neurologist. At the time of the clinic visit the socio-economic and consanguinity histories were not known to the clinic personnel.
The anthropologic measurements were made by a nurse while a physician recorded the data. Psychometric exa~nations were given by two technicians, and the oral examination was performed by a dentist. The audiometric and vision tests were given by the author assisted by a nurse. The ABCC laboratories carried out the hematologic, urine, parasitologic, and X-ray examinations, and the serologic test for syphilis. The X-rays were read by the author; positive fihns were reviewed with the ABCC radio- logist. In Hiroshima the hour-long Wechsler Intelligence Scale for Children (WISC) was given to 80 per cent of the survey children individually by the Department of Psychology of Hiroshima University using its own facilities. At the end of the academic year the school records were abstracted at the schools by survey personnel as further measures of intelligence and morbidity (attendance record). A fuller presentation of the planning and procedures will be made in the comprehensive report of the effect of inbreeding on child health [S].
Vision screening. The test of distant visual acuity required the child to read a Snellen (number) chart at a distance of 20 feet. The test was performed in an evenly lit corridor, the chart being illuminated by lamps placed at either side of it. The small proportion of children who were unable to read numbers were tested by the use of the illiterate E chart. The right eye was tested first while a black plastic paddle occluder was heId over the left eye. The child read the type as pointed out by the tester, who picked out the figures in an irregular fashion to minimize the influence of memoriz- ation. Two errors were allowed in each of the lines from 20/20 to 20/70. One error was allowed in the 20/100 line. Squinting and turning the head to one side were dis- couraged. The child was given every chance to settle down and do his best in reading the chart. The cut-off value between normal and abnormal distant visual acuity was a score of 20140 or worse for either eye, as recommended by CRANE and her associates [6] and subsequently confirmed by the findings of the Orinda study ]3].
Each child was examined ophthalmoscopically by a pediatrician as part of the general medical evaluation which followed the Snellen test. Those in Nagasaki who failed the Snellen test and who were not found on medical examination to have organic disease of the eye were re-examined at their schools at the conclusion of the regular survey (July 1960) to test the reproducibility of Snellen test scores among children presumed to have refractive errors and to estimate the proportion with myopia, At the schools the Snellen test was once again performed. Each child unable to read the 20/30 line without corrective lenses was asked to try again, using the most elective of a series of minus spherical lenses set vertically in a wooden paddle. If no correction could be obtained, ophthalmoscopy was once more performed. This procedure followed that of MAJIMA and his colleagues [4].
The matched control. To evaluate the effect of the environment on refractive errors the 481 children with Snellen scores of 20/70 or worse, not attributable to organic disease, were compared with a group of children with Snellen scores of 20/20-30

34 ROBERT W. MILLER
selected at random from among those matched with each affected child simultaneously
by age, sex, city, and consanguinity.
RESULTS
Community cooperation in the survey was exceptional. Of those in the sample still living in Nagasaki, 99.5 per cent appeared for examination; in Hiroshima 97.5 per
cent did so. All who attended the clinic were given the Snellen test unless they were
physically, mentally, or emotionally incapable of performing it. Not tested were 29 (0.7 per cent) in Nagasaki and 21 (0.8 per cent) in Hiroshima. So small were these
losses that the groups compared were judged to be representative of children of inbred and outbred parentage in the cities studied.
Inbreeding and congenital disease qf the eye. Organic defects were classed as con- genital if the abnormality was one usually regarded as inborn and if there was no history of associated trauma or infection. Included among the congenital organic
lesions were primary lesions of the eye, such as glaucoma, and general diseases in which the eye is among the organs affected, as in albinism. Vision loss was partial or com- plete, and unilateral or bilateral. The prevalence data were pooled for all congenital organic lesions except for isolated nystagmus, which occurred often enough to allow a
separate comparison. Excluded from the tabulations were three inbred children with strabismus of
uncertain origin, one outbred and four inbred children with visual acuity loss of an
undetermined nature, and four outbred and three inbred children with acquired organic lesions. The difference between five exclusions among 3556 outbred and ten
exclusions among 3 151 inbred was not statistically significant. Table 1 lists the organic lesions which were designated as congenital. The results for
each of the two cities were similar. When the data for the two cities were pooled, the proportion of children with congenital organic defects of the eye increased very significantly as the degree of inbreeding became greater.
When the comparison was limited to less diverse diseases, that is, to those causing
blindness in one or both eyes, significantly more cases were again found among the
inbred than among the controls (one-tailed exact chi square test showed P=O.O08). The prevalence of isolated congenital nystagmus, however, did not differ significantly between the most inbred (2.68/1000) and the controls (1.41/1000). The sum of these findings indicated that inbreeding markedly increased the risk of congenital organic disease of the eye.
The re-examination in Nagasaki. The environment for the re-examination in the schools was far from ideal, and varied greatly from school to school. The retest can be regarded only as a rough guide, and not as a sophisticated estimate of the constancy of the Snellen test scores. The results may aid, though, in the interpretation of the data obtained during the regular survey.
Children with scores of 20/70 or worse on the first Snellen test seldom obtained normal ratings (20/20-30) on re-examination. Only 3.5 per cent did so as compared with 36.5 per cent normal retests among those scoring 20/40-50 initially. Because of this finding, the bulk of this analysis concerns children whose initial Snellen score was 20/70 or worse for either eye, and not attributable to organic disease. On the re- examination, no additional organic lesions were found.

Distant Visual Acuity Loss Among Japanese Grammar School Children 35
TABLE 1. CONGENITAL ORGANIC LESIONS OF THE EYE ASSOCIATED WITH SNELLEN TEST SCORES OF 20/70
OR WORSE BY CITY AND CONSANGUINITY CLASS
_____ - _- - ~ ~- I Parental relationship
Congenital organic lesions ) Unrelated 2nd Cousins
i Hiro NaFiirb _. ___~~~ ~~_~~ _ _ .._~ __- Anophthalmia ,* I Microphthalmiz I 1* Persistent pupillary membrane Nystagmus with major CNS disorder 1 Albinism Congenital cataracts Pigmentary degeneration of retina Congenital glaucoma Severe abnormality of shape or
position of pupils I Microcornea 1 ! Coloboma iris and retina I Marfan’s syndrome (severe myopia) Congenital vitreous opacity ’ ’
Total affected 1 5 0 At risk ( 1403 2148 264
Naga
I
1*
2 450
Rate/1000 for each city 1 0.71 2.33 - 4.44 Rate/l000 for both cities I 1.69 2.80
-.
______-~ _ 1 f Cousins 1st Cousins
Hiro Naga Hiro Naga
1
1
1* 2” 2*
2 1 1 1 1* 1 2
1*
2
0 2 7 11 246 383 i 658 1140 - 5.22 ;10.64 9.65
3.18 10.01
Summary of Statistical Analysis Source of variation x” DF P
Due to regression? 11.79 I 0.005 Due to residual 0.83 2 0.5-0.7
Total 12.62 3
“Blind in one or both eyes.
TStatistical procedure as described by SCHULL [7], fits a weighted regression of the negative logarithm of the fraction of individuals with defective vision on the coefficient of inbreeding, F. In the absence of significant heterogeneity, one-tailed tests of significance are appropriate because of the prior specification of the sign of the regression coefficients.
No age, sex, or consanguinity effect was noted among the children who scored normal on the retest or among the small proportion not retested.
Screening by the use of a series of minus spherical lenses gave some indication of the relative frequency of myopia among those with 20170 visual acuity or worse in the absence of organic lesions. Of the 303 children in all consanguinity groups retested in
this category the visual acuity of 18.5 per cent could not be corrected by the minus lenses under the conditions of our procedure. Contributing to this frequency were 11 children (3.6 per cent) whose fundi were in focus only when plus lenses were used on ophthalmoscopy, and 45 (14.9 per cent) whose fundi were in focus at zero to -2 diopters. In the last-mentioned children the disc often appeared to be elliptical or eccentric in shape. This led to the impression that astigmatism without a component of moderate myopia accounted for the majority of vision defects not correctable by

Un
rela
ted
2nd
Cou
sins
-
M
F
T
M
F
T
l+ C
ousi
ns
-- M
F
T
5 T
otal
15
6
21
4 3
7 2
3 5
m*
3 0
3 0
0 0
1 1
2 s*
0
0 0
0 0
0 0
0 0
6 T
otal
15
3 16
7 32
0 30
35
65
20
28
48
m
9
14
23
2 4
6 1
0 1
S
6 11
17
1
1 2
1 1
2
I T
otal
19
5 17
1 36
6 39
41
80
m
4
6 10
0
0 0
S
13
11
24
4 0
4
8 T
otal
21
5 19
2 40
7 m
7
13
20
S
11
13
24
43
37
80
1 4
3 ;:
7
45
28
73
0 3
3 3
2 5
9 T
otal
23
2 22
6 45
8 m
3
6 9
S
17
16
33
43
40
83
; 2
E:
6
47
44
91
1 1
2 3
0 3
38
39
77
126
121
247
2 2
4 4
7 11
3
2 5
13
12
25
10 T
otal
24
3 22
8 47
1 m
5
10
15
S
27
20
47
11 T
otal
m
S
54
40
94
3 0
3 5
4 9
53
44
97
0 1
1 4
8 12
12
12
24
1 0
1 1
0 1
48
33
81
132
128
260
3 2
5 5
3 8
5 1
6 14
16
30
8 8
16
22
16
38
0 0
0 0
0 0
1 2
3 2
3 5
Tot
al
m
S
T
-
107
1030
21
37
34
49
83
79
75
154
228
219
447
6 12
1:
13
28
204
I76
380
592
531
1123
8
11
19
26
33
59
16
12
28
50
59
109
TABLET.
CHILDREN WHOFAILED
THE SNELLENTW,
DISTRIBUTED BYAGE,TESTSCORE*,CITY,CONSANGU~N~TYAND
SEX
Nag
asak
i H
iros
him
a
Par
enta
l t&
tion
ship
1s
t C
ousi
ns
Un
rela
ted
2nd
Cou
sins
. c
-
M
F
T
M
F
T
M
F
T
7 4
11
1 2
A
0 0
74
64
138
7 12
19
4
6 10
119
98
217
3 6
9 7
10
17
67
72
139
7 15
22
0
2 2
124
94
218
14
7 21
4
1 5
112
100
212
6 4
10
10
12
22
132
122
254
5 6
11
11
4 15
148
130
278
; 7
9 I
16
174
149
323
2 3
5 12
9
21
101
84
185
1 1
2 6
9 15
1 2
3 0
0 0
0 0
0
13
20
33
3 3
6 0
0 0
15
19
34
2 0
2 0
0 0
27
28
55
1 3
4 2
3 5
21
27
48
1 A
2
1 1
36
22
58
5 0
5 1
1 2
12
23
35
1 1
2 2
2 4
- -
- -
- -
- -
- _-
II - 747
653
1400
39
70
::
32
74
124
139
263
13
8 21
6
6 12
-
1% C
ousi
ns
____
~
M
F
T
15
17
32
2 4
6 1
0 1
16
26
42
1 3
4 1
0 1
24
19
43
1 1
2 1
1 2
25
27
52
1 0
1 1
3 4
24
29
53
2 0
2 0
5 5
9 14
23
0
0 I:
1
5
- -
- -
- -
- -
-
113
132
245
7 8
15
8 10
18
-p
-
1st
Cou
sins
M
F
T
29
22
51
5 2
7 0
0 0
49
45
94
i: 7 3
10 6
65
53
118
5 3
8 3
3 6
70
68
138
4 5
9 6
6 12
67
88
155
3 4
7 3
6 9
52
40
92
4 4
8 2
4 6
- -
- _
.-
- -
- -
332
316
648
24
25
49
17
22
39
*Sn
elle
n
scor
e 20
/40-
50
(m)
or 2
0170
or
wor
se
(s)
in o
ne
or b
oth
ey
es,
not
du
e to
org
anic
di
seas
e.

Distant Visual Acuity Loss Among Japanese Grammar School Children 31
TABLE 3. AGE-SPECIFIC PROPOR~ONS OF CHILDREN IN EACH crry WHOSE SNELLEN SCORE WAS 20/70
ORWORSEFORONEORBO~EYES,NOTDUETOORGANICDISEASE-BYCONSANGUINITY
Age (yr) Nagasaki
Parental relationship
Hiroshima
Unrelated If-2nd Cousins
1st Cousins
Unrelated 1+2nd Cousins
1st Cousins
5 (0) 6 0.0531 1 0.0656 8 0.0590 9 0.0721
10 0.0998 11 0.0957
(O)=Iess than 25 at risk.
(0) (0) 0.0144 0.0154 (0) 0.0354 0.0725 0.0229 0.0132 0.0638 0.0688 0.0783 0.0591 0.0714 0.0508 0.0705 0.1038 0.0576 0.0500 0.0870 0.0476 0.1012 0.0650 0.0631 0.0581 0.1011 0.1154 0.0811 0.1552 0.0652 0.1000 0.1316 (0) (0) (0)
--~ _
minus spherical lenses. Among the most inbred, 19 (1.84 per cent) of the 1034 children tested were so categorized, as compared with 22 (1.16 per cent) of 1894 control children. These differences were not statistically significant (x0”= 1.7.5;* 0.1 <P < 0.2). The prevalence of defects not correctable by minus spherical lenses did not rise with inbreeding or age.
In consequence of these observations, it was concluded that the group scoring 20170 or worse consisted largely of myopes, although there was some dilution of the data due to other refractive errors. Among those scoring 20/40-50 there was an additional dilution from children who had, in fact, normal visual acuity. Of those who failed both examinations with this score in Nagasaki, 19 per cent were not correctable by minus spherical lenses. In view of these observations, in the text which follows, children who failed the Snellen test for reasons other than demonstrable organic disease will be regarded as having refractive errors-primarily myopia.
Prevalence, by age, sex and city, of children with refractive errors. Table 2 shows the numbers of children given the Snellen test and the numbers who
failed it, by age, sex, city, and consanguinity. Age. Inspection of these data reveals that, with age, mild defects (20/a50) became
less common, whereas severe defects (20,‘70 or worse) became more common. Among the outbred children the frequency of severe loss of visual acuity mounted from about 1 per cent at 5 years of age to 8-10 per cent at 10 years of age (Table 3).
Since the surveys in the two cities included only 160 outbred 5-year-olds, the data for all four consanguinity groups were pooled in an effort to increase the precision of the estimated prevalence of severe acuity loss at this age. It was found that 3 (1 per cent) of 299 5-year-olds were affected. The approximate 95 per cent confidence limits (Poisson) [8] indicate that the true prevalence probably lies between 0.20 and 2.41 per cent. It was concluded that children of Hiroshima and Nagasaki under 6 years of age seldom have severe refractive errors of any type. The rise in prevalence with age apparently is due to myopia, an interpretation drawn from the literature and with which the Nagasaki retest findings were in agreement.
*Xc2=Chi square test with Yates’ correction.

38 ROBERTW.MILLER
TABLET. PROPORTIONSOFCHILDRENWHOFAILEDTHESNELLENTEST*,DISTRIBUTED BY CITY, CONSANGUINITY, TEST SCORE, AND SEX
___~__~~~~_. _
Snellen test score
Parental relationship
Nagasaki Unrelated 2nd cousins 13 cousins 1 st cousins Total
20170 or worse 20140 or worse
Boys Girls Total Boys Girls Total
0.0714 0.0728 0.0721 0.1021 0.1204 0.1109 0.0658 0.0594 0.0626 0.0921 0.0868 0.0895 0.0784 0.0682 0.0737 0.1176 0.1307 0.1237 0.0845 0.1111 0.0971 0.1284 0.1733 0.1496 0.0751 0.0813 0.1098 0.1319
Hiroshima Unrelated 2nd cousins
0.0562 0.0490 0.0529 0.0977 0.1087 0.1029 0.0484 0.0432 0.0456 0.1532 0.1007 0.1255
1: cousins 0.0708 0.0758 0.0735 0.1327 0.1364 0.1347 1 st cousins 0.0512 0.0696 0.0602 0.1235 0.1487 0.1358 Total 0.0555 0.0565 0.1125 0.1210
*One or both eyes, not due to organic disease.
Sex*. The sex distribution of children who failed the Snellen test was about 1: I in each consanguinity class except for the most inbred in Nagasaki (Table 4). For children with Snellen scores of 20/70 or worse, no sex effect was indicated when the data were analyzed separately by city. The excess of such scores among girls whose parents were first cousins was not significant (~1~=2.68?; P-0.01).
City. Overall, among children with Snellen scores of 20/70 or worse, there was a nominally significant city effect (x12=3. 84; P=O.O5), the greater prevalence being in Nagasaki. Comparison of the two cities at each year of age (6-10 years) and for each consanguinity group shows that the rates for Nagasaki exceed those for Hiroshima in 12 of the 15 contrasts; the three exceptions involve children of l+-2nd cousins, where the relatively small sample size results in less stable values than for the other groups. Separate analysis by consanguinity groups showed a significant city effect only among children of first cousins (x12=4.08; 0.02 <P < 0.05). Separate analysis by sex revealed no significant effect of city among males (~1~ m: 1 .17; PzO .3) or females (xla=2.62, 0.1 <P<O.2).
Inheritance and refractive errors. There was a tendency for the risk of refractive errors to increase as the degree of inbreeding increased (Table 4). In each city the rise in the frequency of Snellen scores of 20/40 or worse proved to be highly significant (Table 5) when the frequencies were fitted to a linear regression on the coefficient of inbreeding and compared with the horizontal line that would have obtained had there been no effect of inbreeding (statistical procedure described by SCHULL [7]). When the cut-off was raised to 20/70, the rates for Nagasaki inbred children were significantly different from the controls, but the corresponding differences in Hiroshima were not statistically significant. When the data for both cities were pooled, using either cut-off
*Sex and city effects evaluated by the ~2 test for summary measures of relative risk, as described by MANTEL and H~ENSZEL [9].
tx2=Chi square with i degrees of freedom.

Distant Visual Acuity Loss Among Japanese Grammar School Children 39
TABLE 5. ANALYSISOFTHERELA~ONSHIPBETWEENCONSANGUINITYANDTHEFREQUENCYOFABNORMAL SNELLEN TEST SCORES NOTDUE TO ORGANIC DISEASE
Snellen score City Source of Variation x” DF
20140 or worse Nagasaki
Hiroshima
Both
20170 or worse Nagasaki
Hiroshima
Both
*One failed test.
Due to regression* 9.89 I Residual 3.69 2
Total 13.58 3
Due to regression* Residual
4.81 0.85
Total 5.66
1 2
- 3
Individual regressions* Common regression*
14.70 14.59
2 I
Heterogeneity Residual
0.11 4.54
Total 19.24
1 4
- 6
Due to regression* Residual
5.70 1.75
Total 7.45
1 2
- 3
Due to regression* Residual
0.73 1.67
I 2
Total 2.40 3
Individual regressions* Common regression*
6.43 5.30
2 1
Heterogeneity Residual
1.13 3.42
Total 9.85
1 4
- 6
P
<o 003 0.1-0.2
co.03 0.5-0.7
<0.0005 <0.0005
0.7 0.3-0.5
zo.01 0.3-0.5
EO.3 0.3-0.5
co.03 co.02
0.2-0.3 0.40.5
value, the common regression differed very significantly from zero, and no hetero- geneity was demonstrated between the cities (Table 5). Reference again to Table 4 reveals that the consanguinity effect was more marked among girls than boys.
The data were examined to determine if children who failed the Snellen test clustered in families. The observations summarized in Table 6 suggest that they tended to do so, the effect being recognizable when the number of sib-pairs at risk was sufficiently large. Here the 20/40 cut-off was used because there were too few children with visual acuity of 20/70 orworse to permit evaluation of a familial aggregation of cases. Age correction, desirable since an effect of age on refractive errors has been shown, has not been made in the calculation of the expected numbers of families with more than one child affected. The data in their present coded form did not permit such an adjustment in this instance.
Gestational and neonatal environment. Five variables associated with gestation were studied. When the matched samples were compared, it was found that neither

40 ROBERT W. MILLER
TABLE 6. OBSERVEDANDEXPECTEDNUMBERSOFFAMILIESWITHMORETHANONECHKDWITHASNELLEN SCORE OF 20140 OR WORSE, NOT DUE TO ORGANIC DISEASE. DISTRIBUTED BY CITY AND CONSANGUINITY
CLASS
Families with 2 or 3 children examined
Proportion of children Number of families with 2 Number of families with City failing Snellen test ; or 3 children examined > 1 child affected
Parental relationship all sizes of family 2 Children 3 Children Observed Expected*
_____-____ Nagasaki
Unrelated 0.111 71 2 1 0.94 Special unrelated? 0.116 220 6 10 3.18 2nd cousins 0.089 93 12 1 0.99 14 cousins 0.124 105 6 3 1.79 1 st cousins 0.150 259 23 13 7.22
Hiroshima Unrelated 0.103 24 0 0 0.25 2nd cousins 0.126 31 3 0 0.61 1) cousins 0.135 48 1 1 1.04 1st cousins 0.136 109 7 5 2.38
*As calculated by expansion of the binomial, in which p is proportion of children affected in a given consanguinity group and nt represents the total families in that consanguinity group contributing 2 or 3 children to the survey.
tSpecia1 sub-study of systematically selected sibs of outbred children in the regular survey.
maternal age nor birth rank among liveborn children showed a relationship to the risk of severe visual acuity loss (Tables 7 and 8). An attempt to evaluate the history of pregnancy wastage was thwarted by the uncertain reliability of this portion of the history. The descriptions of livebirths, apparently quite accurate, revealed no meaning- ful differences in the visual acuity groups compared : mothers of children who scored 20/70 or worse reported 1789 livebirths, whereas mothers of the matched control children reported 1835.
Birth weight had been entered on the ABCC genetics record by the midwife at the time of the child’s birth. She had been instructed to weigh the baby on a spring-type scale provided by ABCC. Although the distribution of weights reported showed concentrations at certain values, particularly at 3OOOg, the spread was wide and symmetrical, and it seemed reasonable to expect that unusually large or small babies would have been weighed with greater interest than those near average weight. Because of this and because several reports in the literature [lo-141 had linked myopia to prematurity, the analysis here was concerned only with birth weights less than 2500g (Table 9). Significantly more children with Snellen scores of 20/70 or worse fell into this category than did their matched controls (x22= 13.66; P < 0.005). The role of twinning was not prominent, for only three of the 49 visually defective children of low birth weight were twins.
Thus far, in this presentation an increased frequency of refractive errors has been associated with inbreeding and with low birth weight. One wonders if these last two variables are related to each other. MORTON [15] has shown that in this population inbreeding had little effect on birth weight. Secondly, the association of low birth

Distant Visual Acuity Loss Among Japanese Grammar School Children 41
TABLET. DISTRIBUTION OF CHILDREN BY MATERNAL AGE AT THEIR BIRTHS. CHILDREN WITH NON-
ORGANIC MSUAL ACUITY LOSS COMPARED BY CITY WITH MATCHED CONTROLS
Maternal age (Yr)
<25 25-29 30-34
35+
Nagasaki Hiroshima -.-
Child’s Snellen score
20/70+ 20/20-30 20170 + 20/20-30
90 90 42 45 113 114 65 60 81 74 2.5 21 54 60 11 17
-
TABLE& DISTRIBUIION OF CHILDREN BY BIRTH RANK AMONG LIVEBORN. CHILDREN WITH NON-
ORGANIC MSUAL ACUITY LOSS COMPARED BY CITY WITH MATCHED CONTROLS
Birth order
1 2 3 4 5+
Nagasaki Hiroshima
Child’s Snellen score
20170 + 20,‘20-30 20170 + 20/20-30 -~_
87 79 47 40 102 94 51 49 55 53 22 28 38 47 10 12 56 65 13 14
TABLE 9. PREVALENCE OF BIRTH WEIGHT LESS THAN 2500 GRAMS AMONG CHILDREN WITH REFRACTIVE ERRORS, AS COMPARED BY CITY WITH THEIR MATCHED CONTROLS*
-____ Nagasaki Hiroshima
Child’s Snellen score 20170 + 20/20-30 20/70 + 20/20-30
- At risk 319 319 143 143 Birth weight ~2500 g 34 12 15 8 Percentage 10.7 3.8 10.5 5.6
*Excludes 19 Nagasaki children for whom recorded birth weights were not readily available. These children were in a systematic sample of sibs of survey children whose parents were unrelated.
weight and visual acuity loss was found in the present study although the con- sanguinity of the groups compared was identical (matched controls). It was concluded that the risks associated with low birth weight and inbreeding were separately mediated. If it could be shown than an interaction of the two potentiated the rise in frequency of visual acuity loss, an interplay of genes and the environment would be implied. Among children with refractive errors, the proportions with low birth weight in each con- sanguinity group should be the same unless potentiation did occur. It was found that low birth weight was more common among the most inbred (12.8 per cent of 148)

42 ROBERT W. MILLER
TABLE 10. PREVALENCE OF CHILDREN WITH REFRACTIVE ERRORS (SNELLEN SCORE 20170 OR WORSE) BY MONTH OF BIRTH AND CITY, ALL CONSANGUINITY GROUPS COMBINED*
Month of birth
JFMAMJJASOND -
Hiroshima At risk 267 230 198 170 175 161 239 251 222 249 198 196 Affected 18 12 11 15 11 13 21 7 6 10 11 8 Percentage 6.7 5.2 5.6 8.8 6.3 8.1 8.8 2.8 2.7 4.0 5.6 4.1
Nagasaki At risk 381 341 343 291 300 265 380 375 319 358 357 377 Affected 34 31 28 24 22 24 23 29 27 32 21 24 Percentage 8.9 9.1 8.2 8.2 7.3 9.1 6.1 7.7 8.5 8.9 5.9 6.4
*See footnote to Table 9.
TABLE 11. PREVALENCE OF CHILDREN WITH SNELLEN SCORES OF 20170 OR WORSE, NOT DUE TO ORGANIC DISEASE, BY MONTH OF BIRTH, CITY, AND CONSANGUINITY*
Parental relationship
Birth month Unrelated 14 +2nd Cousins 1st Cousins
No. V % No. v % No. v %
Nagasaki l-3 4-6 7-9
IO-12
Hiroshima 1-3 4-6 7-9
lo-12
567 50 8.8 226 16 7.1 272 27 9.9 433 28 6.5 184 14 7.6 239 28 11.7 562 38 6.8 207 11 5.3 305 30 9.8 575 38 6.6 210 15 7.1 307 24 7.8
384 25 6.5 127 4 3.1 184 12 6.5 295 20 6.8 94 9 9.6 117 10 8.5 386 17 4.4 146 9 6.2 180 8 4.4 335 12 3.6 141 8 5.7 167 9 5.4
*See footnote to Table 9.
than among those whose parents were unrelated (7.9 per cent of 228). The difference, although relatively large, was not statistically significant (P=O .12). Hence potent.i- ation could not be conclusively demonstrated.
To evaluate further whether the environment during or just after intra-uterine life may predispose to refractive errors, the prevalence of such defects by month of birth was studied. The pooled data for Hiroshima (5$ years and all consanguinity groups) yielded prevalences by month of birth which differed significantly from the city average of 5.6 per cent (x112= 19.9; P < 0.05). In Nagasaki the corresponding differences from the average prevalence of 7.8 per cent were not of statistical significance (Table 10). In Hiroshima the peak in the first half of the year and the nadir in the second half suggests a cyclical pattern. This was not duplicated in Nagasaki (Fig. 1). For each consanguinity group in each city, the highest seasonal frequency of refractive errors

Distant Visual Acuity Loss Among Japanese Grammar School Children 43
10.0 -
8.0 -
2 I- ”
if 6.0 -
2 I- I
---- Nogosaki
01’ ” ’ 11 I1
0 I 2 3 4 5 6 7 8 9 IO II 12
MONTH OF BIRTH
FIG. 1. Prevalence of children with refractive errors, by month of birth and city: data combined for consanguinity groups and the years 1948-1953.
occurred among those born in the first half of the year (Table 11). When the seasonal
prevalence for each year of birth was studied (consanguinity groups combined; Fig. 2 and Table 12), it was found that in four of the five years studied, the highest preval- ences of refractive errors in Hiroshima occurred among those born in the springtime. In Nagasaki only the two most recent years showed springtime peaks, although for
0 ’ Su F W Sp Su F W Sp Su F W Sp Su F W SP Su F W Sp SU F
1948 1949 1950 1951 1952 1953
YEAR AND SEASON OF BIRTH
FIG. 2. Prevalence, by year and season of birth, of Snellen scores of 20/70 or worse, not due to organic disease; data for all consanguinity classes pooled for each city.

TA
BL
E 12
. P
RE
VA
LE
NC
E
OF
CH
ILD
RE
N
WIT
H S
NE
LL
EN
SC
OR
ES
O
F 2
0170
OR
WO
RS
E, NOT
DU
E T
O O
RG
AN
IC DIS
EA
SE
, BY
CIT
Y, YEAR AND SEASON O
F B
JR
TH
. AL
L
Co
NsA
NG
UIN
lTy
GR
OW
S C
OM
BIN
ED
’
Bir
th m
on
th
Hir
osh
ima
1-3
4-6
l-9
lo-1
2
Na
ga
sak
i l-
3 4-
6 7-
9 lo
-12
1948
19
49
No
.v
%
No
. v
%
--
_ -
-.
-~
.-__
___-
-
---
179
15
8.4
147
7 4.
8 14
6 12
8.
2 10
1 4
4.0
22
4 18
.2
123
13
10.6
10
6 6
5.7
90
8 8.
9 96
5
5.2
153
12
7.8
134
6 4.
5 11
3 7
6.2
120
7 5.
8 84
1
1.2
121
6 5.
0 12
5 9
7.2
142
9 6.
3 10
0 3
3.0
99
1 1.
0
I--
242
23
9.5
-Y
; -0
22
5 26
1 25
32
11
.1
12.3
61
6
9.8
267
24
9.0
1950
19
51
1952
19
53
No
. v
%
N
o.
v
%
No
. v
%
N
o.
v
%
206
25
12.1
19
4 17
8.
8 16
8 7
4.2
168
13
7.7
229
18
7.9
196
10
5.1
265
21
7.9
209
16
7.7
236
17
7.2
182
10
5.5
f 21
145
15
10.3
14
9 10
6.
7 20
6 13
6.
3 17
9 6
3.4
186
6 3.
2 10
5 4
3.8
114
3 2.
6 g
69
3 4.
3 10
8 1
0.9
!
56
1 1.
8 9 z
*See
foo
tno
te t
o T
ab
le 9
. E
xcl
ud
es a
lso
on
e N
ag
asa
ki
chil
d b
orn
in
Ja
nu
ary
195
4.

Distant Visual Acuity Loss Among Japanese Grammar School Children 45
four of the five years studied, the prevalence of refractive errors was higher among those born in the first half of the year. In general, the graphs for each city showed similar patterns. Both exhibited relatively low frequencies in the spring of 1950 as compared with the years just before and after. The downward trend from 1949 through 1953 was an age effect, myopia being less common among the younger children. In brief, these variations with season of birth raise the possibility that the prenatal or early postnatal environment may contribute to the development of myopia.
Environment during infancy and childhood. The relationship of childhood illnesses to refractive errors in this survey was evaluated through the history, the evidence on physical examination of sub-acute or chronic disease, and the school attendance record. The medical questionnaire used in the survey sought information about major medical events which were likely to be recalled, to be diagnosed readily, and to occur often enough to allow statistical comparisons to be made. The five questions which most closely met these objectives concerned (1) glomerulonephritis; (2) severe gastroenteritis between the ages of one and five years, called ekiri if characterized primarily by diarrhea, and autointoxication if the foremost sign was pernicious vomiting; (3) sickness at home for more than two weeks or ever in the hospital; (4) convulsions; (5) accidents which caused unconsciousness for more than five minutes, a broken bone, or a scar from a burn.
The results for these questions and for the less sharply-defined history of tuber- culosis and pneumonia are summarized in Table 13. There were no meaningful differences in the frequencies with which these events were reported for the children who failed the Snellen test with scores of 20/70 or worse as compared with the matched sample of children who passed the test.
TABLE 13. DLQRIBU~ON OF THE HISTORY OF SEVERE ILLNESSES AMONG CHILDREN \NITH SNELLEN
SCORES OF 20170 ORWORSE,NOT DUE TO ORGANIC DISEASE, AS COMPARED WITH THEIR MATCHED
CONTROLS
Snellen score Never Once Twice or more
111 at home for 2 weeks- 20170 + 360 103 18 or ever hospitalized 20/20-30 360 100 21
Pneumonia 20170 + 428 44 9 20/20-30 430 48 3
Glomerulonephritis 20170 + 453 28 20/20-30* 461 19
Ekiri or auto- 20/70+* 446 34 intoxication 20/20-30* 449 31
Tuberculosis 20170 + 463 18 20/20-30* 455 25
Severe accidents 20170 + 414 67 20/2r330 415 66
&5 Febrile Other Convulsions 20/70+ 431 44 6
20/20-30 430 42 9
*One child’s history unknown.
46 ROBERT W. MILLER
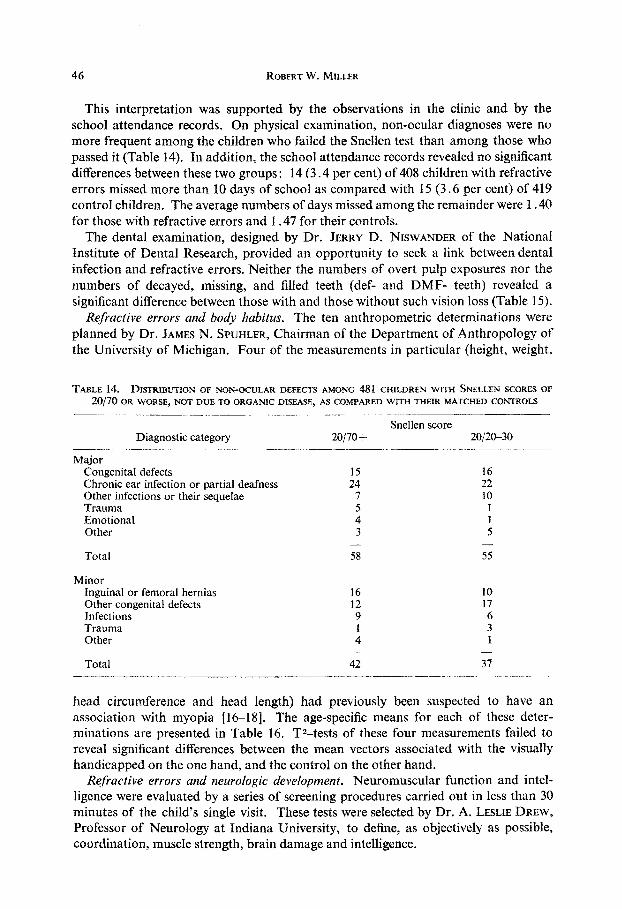
This interpretation was supported by the observations in the clinic and by the school attendance records. On physical examination, non-ocular diagnoses were no more frequent among the children who failed the Snellen test than among those who passed it (Table 14). In addition, the school attendance records revealed no significant differences between these two groups: 14 (3.4 per cent) of 408 children with refractive errors missed more than 10 days of school as compared with 15 (3.6 per cent) of 419 control children. The average numbers of days missed among the remainder were 1.40 for those with refractive errors and 1.47 for their controls.
The dental examination, designed by Dr. JERRY D. NISWANDER of the National Institute of Dental Research, provided an opportunity to seek a link between dental infection and refractive errors. Neither the numbers of overt pulp exposures nor the numbers of decayed, missing, and filled teeth (def- and DMF- teeth) revealed a significant difference between those with and those without such vision loss (Table 15).
Refractive errors and body habitus. The ten anthropometric determinations were planned by Dr. JAMES N. SPUHLER, Chairman of the Department of Anthropolo~ of the University of Michigan. Four of the measurements in particular (height, weight,
TABLE 14. DISTRIBUTION OF NON-OCULAR DEFECTS AMONG 481 CHILDREN WITH SNELLEN SCORES OF
20,‘7Ooa WORSE,NOTDUETOOROANICDISEASE, AS CO~AREDWITHTH~RMATCHEDCO~RO~ -._-__ ~_~_ _I_____ _.___
Diagnostic category 20/70 + ~- . -~.-.- -___ Major
Congenital defects 15 Chronic ear infection or partial deafness 24 Other infections or their sequelae 7 Trauma Emotional : Other 3
- Total 58
Minor Inguinal or femoral hernias 16 Other congenital defects 12 Infections 9 Trauma 1 Other 4
- Total 42
Snellen score 20/20-30
16 22 10
I 1 5
- 5.5
10 17 6 3 1
- 37
- -- __~~___ -...--.
head circumference and head length) had previously been suspected to have an association with myopia [16-181. The age-specific means for each of these deter- minations are presented in Table 16. T2-tests of these four measurements failed to reveal significant differences between the mean vectors associated with the visually handicapped on the one hand, and the control on the other hand.
Refractive errors and neurologic development. Neuromuscular function and intel- ligence were evaluated by a series of screening procedures carried out in less than 30 minutes of the child’s single visit. These tests were selected by Dr. A. LESLIE DREW,
Professor of Neurology at Indiana University, to define, as objectively as possible, coordination, muscIe strength, brain damage and intelligence.

Distant Visual Acuity Loss Among Japanese Grammar School Children 47
TABLE 15. AVERAGEMEASURESOFDE~ALINFECTIONBYAGEFORCHILDRENWITHSNELLENSCORES OF
20170 ORWORSE,NOTDUETOORGANICDISEASE,AS COMPARED WITHMATCHED CONTROLS
Pulp exposures
Age No. def* DMFt Primary teeth Permanent teeth (months) ____- ______~~ ~________..~___.__.__._~~_ ____~.~_ ~_~.. ~~ ~~_
20/70+ 20/20-30 20/70?- 20/20-30 20/70+ 20/20-30 20170 1 20/20-30
60- 2 15.0 11.5 0.0 1.0 5.5 1.5 0 0 0.0 70- 26 10.6 12.0 0.4 0.3 2.6 3.5 0 0 0.0 so- 45 9.0 8.8 0.2 0.5 2.8 3.2 0.0 0.0 90- 87 8.0 7.5 0.1) 0.8 2.9 2.8 0. i 0.1
loo- 79 5.9 6.7 1 .3 0.9 2.3 2.5 0.2 0.1 llo- 91 4.4 4.9 1.3 1.1 1.6 2.0 0. 2 0.2 120- 111 3.1 2.8 1.4 1.5 1.2 1.2 0. 3 0.2 130- 40 1.4 1.9 2.1 1.3 0.6 0.5 0.5 0.2
__~ ______ ‘def: Number of primary teeth in need of filling (d) or extraction(e),oralreadyfilled(f). TDMF: Number of permanent teeth showing caries (D), missing (M), or fillings (F).
TABLETS. MEAN ANTHROPOLOGIC MEASUREMENTS BY AGE AND SEX, BOTH CITIES COMBINED, FOR
CHILDRENWITHSNELLENSCORESOF 20170 ORWORSE,NOTDUETOORGANICDISEASE, ASCOMPARED WITH
MATCHED CONTROLS*
Age (months)
Boys 6O- 70- 80- 90-
100- llO- 12& 130-
Girls 60 70- 80- 90-
100- llo- 120- 130-
No.
1 107.80 101.60 21.70 16.60 50.90 12 109.41 109.66 18.35 17.89 50.27 23 114.20 115.68 20.17 20.86 50.92 47 118.77 119.14 21.81 21.87 50.75 37 123.34 124.03 23.74 23.64 51.44 43 125.55 126.92 24.65 25.12 51.19 56 130.71 129.88 26.86 26.60 51.45 18 132.69 132.64 27.82 28.59 51.35
1 108.60 115.80 16.80 22.70 49.20 49.60 16.30 16.80 14 109.75 110.06 18.08 18.64 49.32 49.52 16.24 16.21 22 113.23’ 112.10 ~ 19.07 18.89 49.90 49.65 16.32 16.45 40 117.44 118.78 / 20.76 21.82 49.98 50.39 16.57 16.63 41 122.12 121.95 23.04 23.19 50.30 50.37 16.54 16.61 48 126.84 127.89 24.94 25.26 50.69 50.99 16.90 16.92 55 129.78 132.60 26.27 28.05 50.99 51.30 16.76 16.86 22 135.09 134.57 28.75 28.38 51.30 51.43 17.12 17.07
Height Weight (cm) (kg)
Head Head length circumference (cm)
(cm)
Snellen scores 20/70+ 20/20-30 20/70 + 20/20-30 / 20/70 +
-. __.._~~~~ ~~ ~~ 20/20-30 ,20/70 + 20/2&30
51.80 16.80 17.70 50.27 16.48 16.71 50.75 16.75 16.70 51.22 1 16.84 16.90 51.07 I 17.16 16.82 51.74 51.52
; 17.00 17.37 17.14 17.20
51.73 17.26 17.22
*Excludes one visually handicapped child with Morquio’s disease and his matched control.
No significant differences were found between the children with refractive errors and
their matched controls in coordination as measured by the speed with which they
could tap a hand-counter with their right forefingers (average of 5 ten-second trials;
see Table 17), the history of accidents (Table 13), the sequelae of accidents as found on physical examination (Table 14), or the frequency of clumsiness observed by the

48 ROBERT W. MILLER
TABLB~~. AVERAGENEUROLOGIC TESTSCORESBYAGE FORCHILDRENW~THSNELLEN SCORES OF 20170 ORWORSE,N~TDUETOORGANICDISEA.SE,ASCOMPAR!~D WITHMATCHED CONTROLS
Right hand Dynamometer
Age No.
(months) 20170 + 2012s3(
60- 2 7.5 9.0 70- 26 7.2 7.9*
80- 45 8.5 ’ 10.3
8.9 90- 87 10.1
loo- 79 10.5 11.7 llO- 91 11.8 12.1 120- 111
/ :::: 13.8
13O- 40 13.9
*One child not tested. tTwo children not tested. $Three children not tested.
Right hand Color trail
Tapping 1
Snellen scores !0/70+ 20/20-30 20/70+ 20/2@-30
18.5 15.5 112.0 120.0 23.2* 21.0 83.1* 76.8* 25.8 23.3 64.5* 58.5 25.6 25.6* 48.3 43.8 27.6t 27.4 40.3 39.5 29.7$ 29.8 34.0t 31.2t 32.6 31.1 26.6 30.7 33.0 33.4 28.1 28.0
-
12
-
i
_-
A
1-
-
Maze test
!0/70 + 20/20-30
6.5 7.0
8.4* 9.1* 11.3* 11.2 13.2 13.3 13.6 14.5 15.9t 15.7 16.1 16.2 16.1 15.6
pediatrician when the child performed successive movements (18 among 48 1 with refractive errors as compared with 14 among their matched controls). The right-hand grip was measured by a dynamometer and, as a gross indicator of brain damage, each child was given a paper-and-pencil color-trail test in which he drew a continuous line alternately connecting by color and shape a variety of colored geometric forms [5, 191. No meaningful differences were found between the two visual acuity groups in the results of these tests (Table 17).
The average score for the hour-long WISC test given individually to 80 per cent of the Hiroshima survey children was 108 .O for those with refractive errors and 108.4 for their controls. This lack of a significant difference between the groups was supported by the similarity of the average scores for the Porteus maze tests given to each child during his clinic visit (Table 17).
Refractive errors and dental growth. No association was found between visual acuity loss and dental growth as appraised from the numbers of primary and secondary teeth present (Table 18) or by the frequency of children with dental hypoplasia, hypomaturation, or both (56.1 per cent of the 481 with refractive errors as compared with 53.6 per cent among their matched controls).
TABLETS. AVERAGE NUMBER OFTEETH BY AGE AMONG CH~DREN WITH SNELLEN SCORES OF 20170 OR WORSE,NOT DUETOORGANICDISEASE,AS COMPAREDWITHTHEIRMATCHED CONTROLS
Age (months)
No. Primary teeth Permanent teeth
Snellen score 20170 + 20/20-30 20170 + 20/20-30
60- 2 19.0 7& 26 18.1 80- 45 15.3 90- 87 12.5
lOO- 79 10.0 IlO- 91 7.5 120- 111 5.4 130- 40 2.7
20.0 3.0 1.0 18.3 4.0 2.7
15.4 7.0 12.6 10.3 ;.; 10.2 13.0 13:1
8.6 15.4 14.6 4.9 18.3 18.6 3.3 21 .o 21.1

Distant Visual Acuity Loss Among Japanese Grammar School Children 49
Refractive errors and socio-economic status. When the nurse took the history at the child’s home, she routinely asked several questions pertaining to the socio-economic status. The most reliable response perhaps concerned the number of straw floor-mats in the home. The mats are of standard size, and the area of each room is a multiple of half-mats. On the average, in Nagasaki the affected children were from homes having slightly more mats per person (0.15) than the matched controls, whereas in Hiroshima those with refractive errors had slightly fewer than the controls (0.20). Food costs per person per month gave similar results: In Nagasaki the affected children averaged 4.7 per cent (133 yen) more than the controls, whereas in Hiroshima they averaged 2.5 per cent (78 yen) less. Furthermore, no significant differences were found in comparisons involving the highest educational level attained by the father (closely related in Japan to income) or the nurse’s gross evaluation of the home. Thus, an effect of socio-economic status on refractive errors could not be demonstrated from these data.
DISCUSSION
Inheritance. Eight years before MENDEL’S work was published, a Louisville physician named BEMISS [20] described the abnormalities among 3822 children of cousins whose histories were volunteered by physicians throughout the U.S. in response to a published request by BEMISS. His data show that the frequency of blindness among children of first cousins was 2.2 per cent, midway between the values for children of greater and lesser inbreeding. The effect of consanguinity on the eye was further indicated in a study performed by Dr. ALEXANDER GRAHAM BELL [21], as part of the 1900 U.S. National Census. He found that 13.5 per cent of persons with congenital blindness reported their parents to be first cousins, as compared with about 3 per cent for those with acquired blindness. Our results cannot readily be compared with the above because of differences in the selection of the samples, the age dis- tributions, and the range of visual acuity loss considered. However, the study reported here did substantiate the increased prevalence of congenital eye defects among the children of first cousins. The frequency of such lesions associated with visual acuity of 20/70 or worse was only 1. C per cent, considerably less than the 2.2 per cent Wind reported by BEMISS.
At present, before all the data of our survey have been analyzed, it appears that the eye will show the detrimental effects of inbreeding to a greater extent than any other clinical measure of health. Although it is likely that this was the consequence of the conspicuous position or function of the eye, it may be that the eye is more often affected than other organs by the increased homozygosity that occurs with inbreeding.
In the genesis of refractive errors the role of inheritance was again implicated, though less dramatically than in the case of congenital defects. Refractive errors occurred with increased frequency as the degree of inbreeding increased, and they tended to cluster in outbred as well as inbred families. No environmental factors were found which could have accounted for these groupings.
A racial difference in the prevalence rates for refractive errors could be further evidence of the influence of heredity. Although dissimilarities in survey techniques make comparisons of different investigators of questionable value, it is of interest to contrast the results by age for outbred children in this survey with a similar study

50 ROBERT W. MILLER
TABLE 19. AGE SPECIFIC PREVALENCE OF CHILDREN WHO SCORED 20170 OR WORSE FOR EITHER EYE, ORGANIC DBEASE INCLUDED. U.S. COMPARED WITH JAPAN*
Age aid East Coast U.S. Hiroshima Nagasaki
6- l-
;I lo- ll-
Total examined
2.0 2.7 2.8 6.6 ::;
2.4 2.4 5.8 6.5 7.0 7.2 4.6 8.1 10.2 3.8 - 9.6
6000 1264t 2127t
*Failed U.S. Snellen test with score of 3110 or worse in one or both eyes. Failed our Snellen test with score of 20170 or worse in one or both eyes.
tTotaIs for children of unrelated parents as given in Table 1 minus the numbers for 5-year-olds as given in Table 2.
in 1924 of American school children [22] (Table 19). The Japanese rates at each year of age were about double those described in the U.S. A more definitive evalua- tion of racial differences could come from a comparison of rates for refractive errors among Californian school children of Japanese descent and those of European descent.
Environment and refractive errors. The results of this study were in agreement with several recent reports [lo-141 that the frequency of myopia is increased among children who were of low birth weight. The data from our survey further suggested (although the differences were not quite statistically significant) that, among children who were both inbred and of low birth weight, the increased risk of refractive errors was poten- tiated. Such potentiation would imply an interaction of genes and environment.
Season of birth has not previously been related to the prevalence of refractive errors. While our data seem to show a seasonal variation for Hiroshima, study of a larger series would be necessary to substantiate this interpretation. At first thought the tendency is to ascribe an association of prevalence with month of birth to environ- mental influences operative during embryologic development or soon after birth. That this variation may instead be related to inheritance is shown by FRASER ROBERTS’S
study [23 ] of the average IQ scores by month of birth. He confirmed the observation of numerous other investigators that children conceived in the summer months had, on the average, lower scores than those conceived in the winter months. However, he found no difference in the IQ scores of winter-conceived children as compared with their summer-conceived sibs. Thus, when heredity and environment were similar, no association could be demonstrated between season of birth and IQ. FRASER ROBERTS
concluded that it was not season of birth that influenced intelligence, but (parental) intelligence which influenced season of birth.
From our data it cannot be determined if the relationship of the prevalence of refractive errors in Hiroshima and month of birth can also be explained by behavioural characteristics of the parents which affect the seasonal frequency of conceptions. It was apparent, however, that the variation in prevalence by birth-month was not a con- comitant of consanguinity or of prematurity, each of which was associated with an increased risk of refractive errors. It was not a concomitant of variation in mortality rates by month of birth either, for the two distributions were neither parallel nor were

Distant Visual Acuity Loss Among Japanese Grammar School Children 51
they inversely related. The dissimilarity in these results for Hiroshima and Nagasaki, cities which are 500 miles apart, raises the possibility of an environmental influence that is more marked in Hiroshima than in Nagasaki.
Other suggestive evidence of an effect of intrauterine environment on myopia comes from the observations of GARDINER and JAMES [24] that mothers of full-term children with congenital myopia reported significantly more frequent illness during that pregnancy than did mothers of children with other eye defects.
Refractive errors, growth, and health during icfancy and childhood. Reports that myopes tend to be taller than usual [16, 171 and dolichocephalic [18] were not supported by the observations in this study. Since the retina is derived during embryo- logic development from the brain, defects of one may also affect the other, but this survey disclosed no evidence of neuromuscular dysfunction or impairment of intel- ligence among those with refractive errors. Furthermore, no association was found between such vision defects and dental health, physical health, or socio-economic status. Though it takes but a few words to tell of these negative findings they may clear the air considerably about the genesis of myopia. It is possible that refractive errors stemming from environmental insult have their onset at a more advanced age than 11 years, the upper limit of this study, and thus the relationship eluded us.
Myopic children may with age show different interests from other children either because incomplete correction limits their distant visual perception or because they are sensitive about wearing glasses. Care must be taken not to regard as causes of visual impairment aberrations which are, in fact, the results of disturbances of sight.
City dijkences in the prevalence of refractive errors. Table 19 shows that at each year of age the prevalence rate for visual acuity loss among outbred children was higher in Nagasaki than in Hiroshima. The difference was even greater when the rates for the children of first cousins were compared (Table 3). So consistent were the dissimilarities that they cannot be charged to chance. Without more precise ophthal- mologic measurements than the Snellen test: it cannot be determined if the differences between the rates for the two cities were biologic in origin or due to variation in the screening technique.
The discrepancy between cities was not due to a greater proportion of false positives in Nagasaki, for it was found on re-examination there that 96 per cent of those who scored 20/70 or worse on the first examination also received imperfect scores on the retest (20/40 or worse). This establishes the reproducibility of the judgment that distant visual acuity was impaired, but the Snellen test is too gross to yield identical scores on repeat examination.
X-irradiation and visual acuity loss. From another survey in Hiroshima one further tabulation is introduced here because it suggests that visual acuity is modified by at least one environmental agent. In 1954, as part of the ABCC pediatric program, 4407 children who had been exposed to the atomic bomb were given a Snellen test and examined ophthalmoscopically [ZS], as in the survey reported here. The testers were unaware at the time of the examination of the child’s radiation category. In the analysis the data were distributed by age and by distance from the bomb (a rough indicator of radiation dose), as shown in Table 20. In the youngest age group (8-l I years) and the oldest (16-19 years) the prevalences of visual acuity loss were signifi- cantly higher for those within 1500 meters of the hypocenter than for those beyond 1800 meters. In the intermediate age group, this increase was not observed. A further

52 ROBOT W. MILLER
TABLE 20. PREVALENCE OF SNBLLEN SCORES OF 20170 OR WORSE, NOT DUE TO ORGANIC DJSEASE, AMONG ATOMIC BOMB SURvIvORS LESS THAN 20 YEARS OF AGE WHEN EXAmED IN 1954
Distance from hypocenter in meters
Age in 1954 Or)
8-l 1 12-15 16-19 Total
1500 and under 1501-1800 Over 1800
With defective With defective With defective vision vision vision
Total Total Total No. % No. % No. %
437 31 7.1* 441 22 5.0 981 4.0 491 42 8.6 906 :z 8.2 171 35 20.5t 361 33 9.1
1099 108 9.8 2248 146 6.5
*Differs significantly from ‘Over 1800 m’ group: 0.01 < P -c 0.05. TDiffers very significantly from ‘Over 1800 m’ group: P < 0.001.
From MILLER [25].
peculiarity in these data is that the intermediate distance group (1501-1800 m) for the 16-19 year old subjects did not show a prevalence intermediate between those closer to the bomb and those further away. Instead it had the same high frequency as the group closer to the hypocenter. The ocular disturbance responsible for this excess of visual acuity loss is not known. It was not due to cataracts. A similar loss described in X-irradiated monkeys [26,27] suggests that the observations among the Japanese were not spurious.
The pathogenesis of myopia. SORSBY and his associates [ZS] found that myopia up to 4.0 diopters in severity was characterized by a failure in correlation between cornea1 refractive power and axial length, although the measurement for each of these variables was within normal limits. They postulated that retinal size determined axial length, and, by causing the surrounding sclera to enlarge, the retina influenced the scleral tension on the cornea, thus affecting its cu~ature. (The sclera and cornea together form a sphere; the larger the sphere, the flatter will be the cornea.) This explanation does not make clear why in myopia the retina should rather suddenly lose its capacity to ‘organize’ the refractive elements of the eye, the loss occurring 6-16 years or more after birth.
An embryologic basis for such a defect was given by MANN [29], who wrote: “The lower and posterior part of the s&era can be looked upon as phylogenetically and ontogenetically the weakest portion . . . . In the human eye we see that the scleral condensation starts in the region of the insertions of the recti [7th week of gestation] and only reaches the posterior pole comparatively late in development . . . . Delayed consolidation of the sclera might, ii’slight, only make its effects felt after birth, during the years that the eye is normally still enlarging slightly , . . . a simple arrest of the final stages of scleral condensation will account for it [myopia] emb~ologically.”
From the evidence presented it appears that the underlying defect in myopia is present at birth or soon thereafter (influence of heredity, association with prematurity and perhaps season of birth, but not with later events except possibly for heavy exposure to ionizing radiation). This is compatible with the development of an

Distant Visual Acuity Loss Among Japanese Grammar School Children 53
imperfection of the sclera during its formative stages. If the period of susceptibility is indeed thus limited. the lesion must lie dormant for ten years, on the average, before becoming clinically apparent, often after a rather abrupt onset followed by a period of rapid progression. It is as if the physiologic reserve of the eye has suddenly been exhausted at a certain stage of its growth, and visual impairment ensues.
SUMMARY AND CONCLUSIONS
In a comprehensive survey of a probability sample of 6954 Japanese grammar school children, about half of whom were born of parents who were cousins, the loss of distant visual acuity has been studied with respect to a wide variety of variables. It was expected that, because of the precision required by the eye for normal sight, the influences of heredity and the environment would be more readily detected in this rather than in some other organ system.
The prevalence of congenital organic lesions of the eye increased very significantly with inbreeding-from 1.69 per thousand for children of unrelated parents to 10.01 per thousand for children whose parents were first cousins.
Loss of distant visual acuity in which no organic lesion was revealed by ophthal- moscopy was attributed to refractive errors; about 80 per cent of the children with 20170 visual acuity or worse in one or both eyes were considered to have myopia. The role of inheritance was implicated in the genesis of these defects by their increase in frequency as the degree of inbreeding increased. A tendency for cases to aggregate in families was also noted.
Effects of the environment during intra-uterine life, or soon thereafter, were suggest- ed by the association of a birth weight of less than 25OOg with an increased risk of myopia and, independently, by the suggestion in Hiroshima (but not Nagasaki) of the relationship of season of birth to the risk of such vision loss. No relationship to maternal age or to birth order was detected in this survey.
No association was found between visual acuity loss and socio-economic status; physical, neurological, or dental development; or the history or presence of illness. The age-specific prevalence rates were consistently higher in Nagasaki than in Hiroshima, and the rates for each city exceeded those in a similar U.S. survey. It was not possible with the information at hand to ascertain if these differences were biologic in origin or due to variation in the screening technique.
The accumulated evidence to date suggests that myopia is attributable to a develop- mental flaw in the sclera. The results of this survey indicate that it would be profitable in the future to investigate the origin of myopia through family studies, well-controlled racial comparisons involving Japanese migrants to the United States, and surveys relating embryologic and at-birth events to the occurrence of myopia.
Acknowledgments --The success of a comprehensive survey depends on the talents of many persons. In addition to those cited in the text, the author expresses his great appreciation for the devoted efforts of the patient-contactors, home-visiting nurses, clinic nurses, technicians, clerks, his five pediatrician-colleagues-Drc% KANJI 110, M~JNETAKA MIYAKE, SHOTARO NERIISHI, HIROMI TANAKA and NOBORU YANAI-and his dentist colleague, DR. CHOKUDO SUJAKU. Thanks are also due to DR. W. J. SCHULL and MR. NATHAN MANTEL for their aid in the statistical analysis.

54 ROBERT W. MILLER
REFERENCES
NEEL, J. and SCHULL, W. : The effect of exposure to the atomic bombs on pregnancy termination in Hiroshima and Nagasaki, Nat. Acud. Sci. Pubf. No. 461, Washington, DC., 1956. KEMPF, G., COLLINS, S. and JARMAN, B. : Refractive errors in the eyes of children as determined by retinoscopic examination with a cycloplegic, Publ. Iilth Bull., Wash., #182, 1, 1928. BLUM, H., PETERS, H. and BERMAN, J.: Vision Screening for Elementary Schools: Xhe Orinda Study, University of California Press, Los Angeles, 1959. MAJIMA, A., NAKAJIMA, A., ICHIKAWA, H. and WATANABE, M.: Prevalence of ocular anomalies among school children, Amer. J. Ophthal. 50,139, 1960. NEEL, J., SCHX.JLL, W. et al.: monograph on the Ejects of Inbreeding. In preparation. CRANE, M., FOOTE, F., SCOBEE, R. and GREEN, E.: Screening school children for visual defects, Child. Bur. Publ. No. 345, Washington, D.C., 1954. SCHULL, W. : Empirical risks in consanguineous marriages: sex ratio, malformation, and viability, Amer. J. hum. Genet. 10,294, 1958. PEARSON, E. and HARTLEY, H.: Biometrika Tables for Statisticians, Vol. 1, Table 7, Cambridge University Press, London, 1958. MANUEL, N. and HAENSZEL, W.: Statistical aspects of the analysis of data from retrospective studies of disease, J. nat. Cancer Inst. 22,719, 1959. EAMES, T.: Eye conditions among children of premature, full-term, and hypermature birth, Amer. J. Ophthal. 29,57, 1946. DWLIEN, C. : Growth and development in a group of children of very low birth weight, Arch. Dis. Child. 33, 10, 1958. FLETCHER, M. and BRANDON, S.: Myopia of prematurity, Amer. J. Ophthal. 40,414, 1955. GREGORY, I. : Retinopathy of prematurity (retrolental fibroplasia) in children in whom the disease has not progressed to complete blindness, and the subsequent inv~ti~tion of cases of myopia, &it. J. Ophtha~. 41,321, 1957. BIRGE, H. : Myopia caused by prematurity, Amer. J. Ophthul. 41,292, 1956. MORTON, N. : Empirical risks in consanguineous marriages: birth weight, gestation time, and measurements of infants, Amer. J. hum. Genet. 10,344,1958. JOHANSEN, E. : Simple myopia in schoolboys in relation to body height and weight, Acta Ophthal., Kbh. 28, 355, 1950. GARDINER, P.: The relation of myopia to growth, Lancer 1,476,1954. DUKE-EWER, S.: The Practice of Refraction, Blakiston, Philadelphia, 1943. DREW, A. : Publication in preparation, Dept. of Neurology, Indiana University. BEMISS, S. : Report on the influence of marriages of consanguinity upon offspring, Trans. Amer. med. Ass. 11, 321, 1858. BELL, A. : Cited in ARNER, G. : Consanguineous marriage in the American population, Columbia Univ. Stud. Hist. Econ. publ. Law 31,1,1908. COLLINS, S.: The eyesight of the school child as determined by the Snellen test, Publ. Hlth. Rep., Wash. 39,3013, 1924. FRASER ROBERTS, J.: Intelligence and season of conception, Brit. med. J. 1,320, 1944. GARDINER, P. and JAMFZS, G.: Association between maternal disease during pregnancy and myopia in the child, Brit. J. Ophthal. 44, 172, 1960. MILLER, R. : Delayed effects occurring within the first decade after exposure of young in- dividuals to the Hiroshima atomic bomb, Pediutrics 18, 1, 1956. BROWN, W. and MCDOWELL, A. : Visual acuity performance of normal and chronic irradiated monkeys, J. genet. Psychol. %, 133,196O. MCDOWELL, A. and BROWN, W. : Visual acuity performer of normal and chronic focal-head irradiated monkeys, J. genet. Psychoi. %, 139,196O. SORSBY, A., BENJAMIN, B., DAVEY, J., SHERIDAN, M. and TANNER, J.: Emmetropia and its aberrations, Spec. Rep. Ser. med. Res. Coun., Lond. No. 293, 1957. MANN, 1.: Developmental Abnormalities of the Eye, Cambridge University Press, London, 1937,
1.
2.
3.
4.
5. 6.
7
8.
9.
10.
11.
12. 13.
14. 15.
16.
17. 18. 19. 20.
21.
22.
23. 24.
25.
26.
27.
28.
29.