distance metric learning in data mining (part i) … metric learning in data mining (part i) fei...
TRANSCRIPT
1
Distance Metric Learning in Data Mining (Part I)
Fei Wang and Jimeng Sun IBM TJ Watson Research Center
2
Outline
Part I - Applications Motivation and Introduction
Patient similarity application
Part II - Methods
Unsupervised Metric Learning
Supervised Metric Learning Semi-supervised Metric Learning
Challenges and Opportunities for Metric Learning
3
Outline
Part I - Applications Motivation and Introduction
Patient similarity application
Part II - Methods
Unsupervised Metric Learning
Supervised Metric Learning Semi-supervised Metric Learning
Challenges and Opportunities for Metric Learning
4
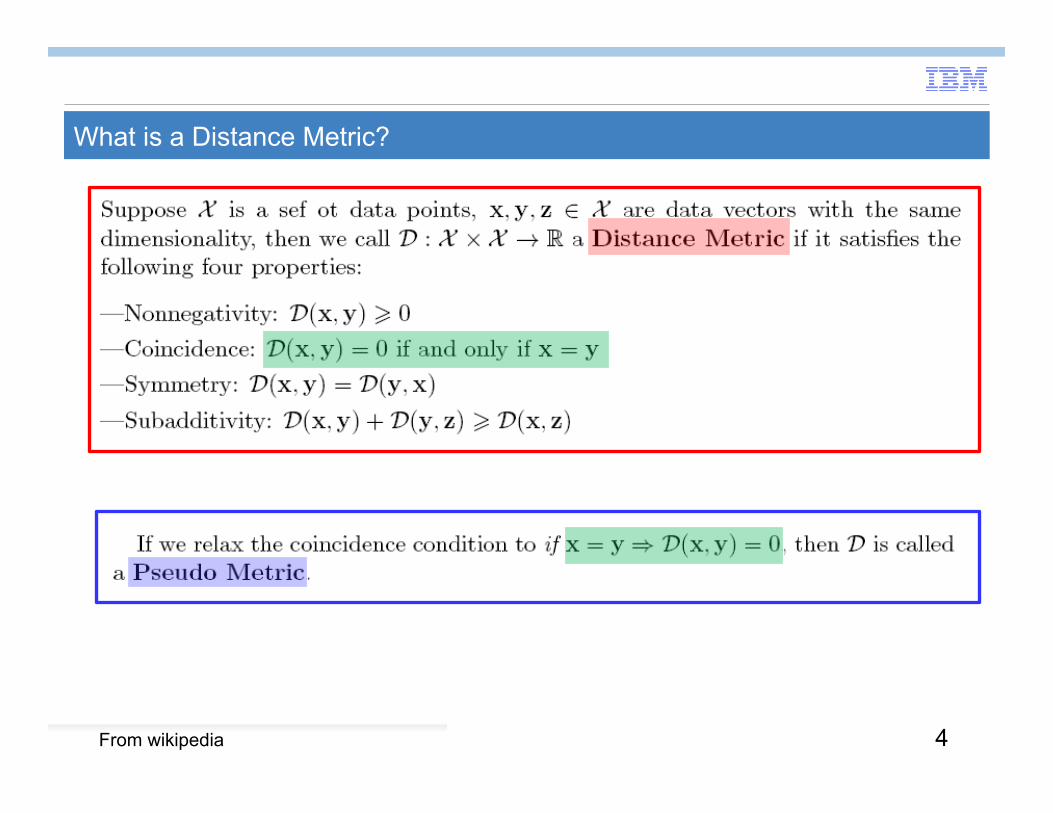
What is a Distance Metric?
From wikipedia
5
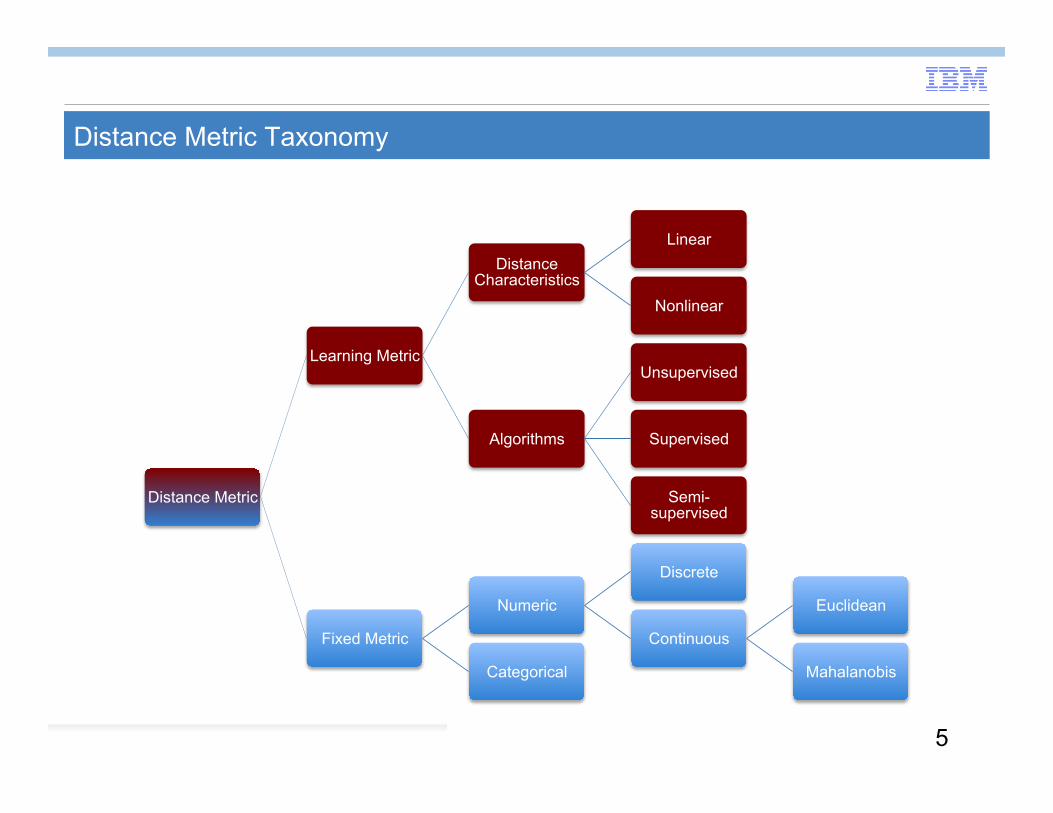
Distance Metric Taxonomy
Distance Metric
Learning Metric
Distance Characteristics
Linear
Nonlinear
Algorithms
Unsupervised
Supervised
Semi-supervised
Fixed Metric
Numeric
Discrete
Continuous
Euclidean
Mahalanobis Categorical
6
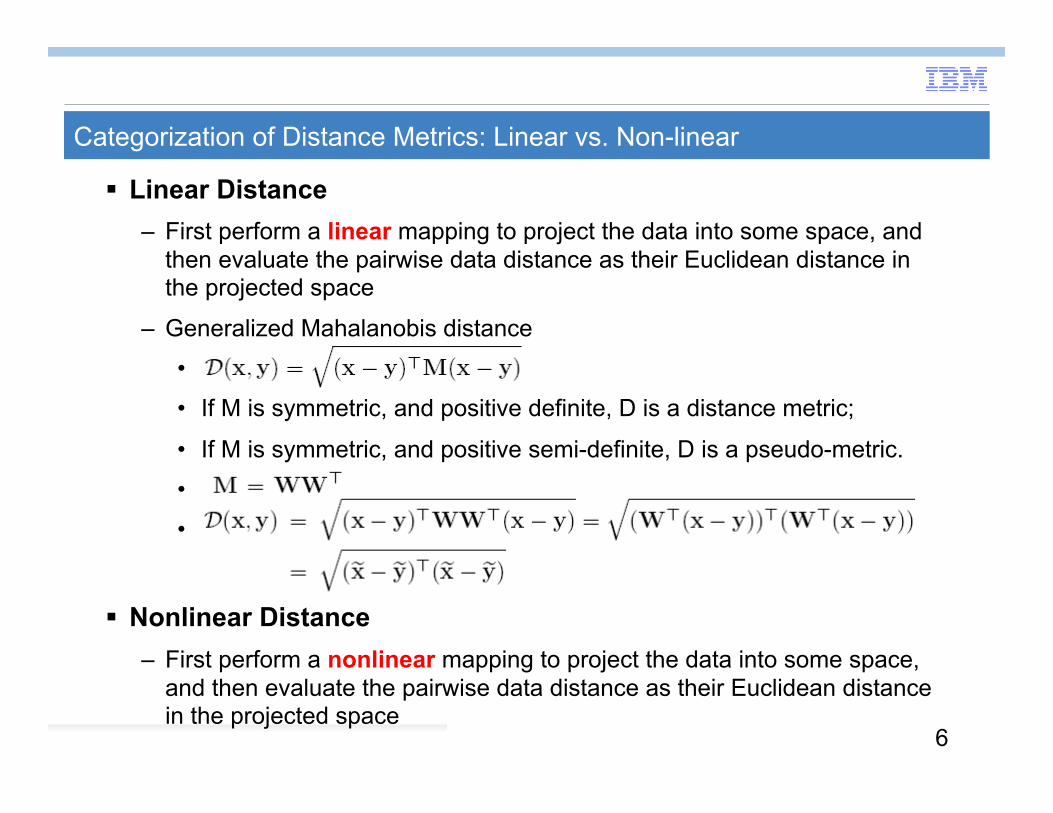
Categorization of Distance Metrics: Linear vs. Non-linear
Linear Distance – First perform a linear mapping to project the data into some space, and
then evaluate the pairwise data distance as their Euclidean distance in the projected space
– Generalized Mahalanobis distance
•
• If M is symmetric, and positive definite, D is a distance metric;
• If M is symmetric, and positive semi-definite, D is a pseudo-metric.
•
•
Nonlinear Distance – First perform a nonlinear mapping to project the data into some space,
and then evaluate the pairwise data distance as their Euclidean distance in the projected space
7
Categorization of Distance Metrics: Global vs. Local
Global Methods – The distance metric satisfies some global properties of the data set
• PCA: find a direction on which the variation of the whole data set is the largest
• LDA: find a direction where the data from the same classes are clustered while from different classes are separated
• …
Local Methods – The distance metric satisfies some local properties of the data set
• LLE: find the low dimensional embeddings such that the local neighborhood structure is preserved
• LSML: find the projection such that the local neighbors of different classes are separated
• ….
8
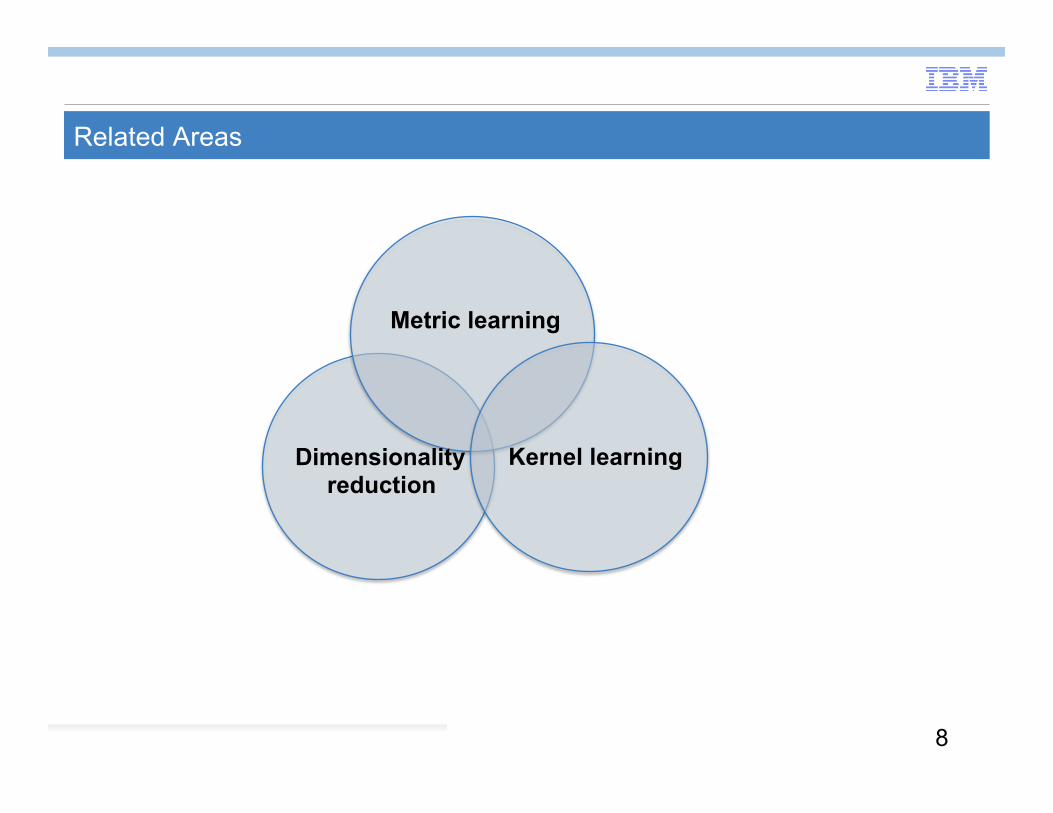
Related Areas
Metric learning
Dimensionality reduction
Kernel learning
9
Related area 1: Dimensionality reduction
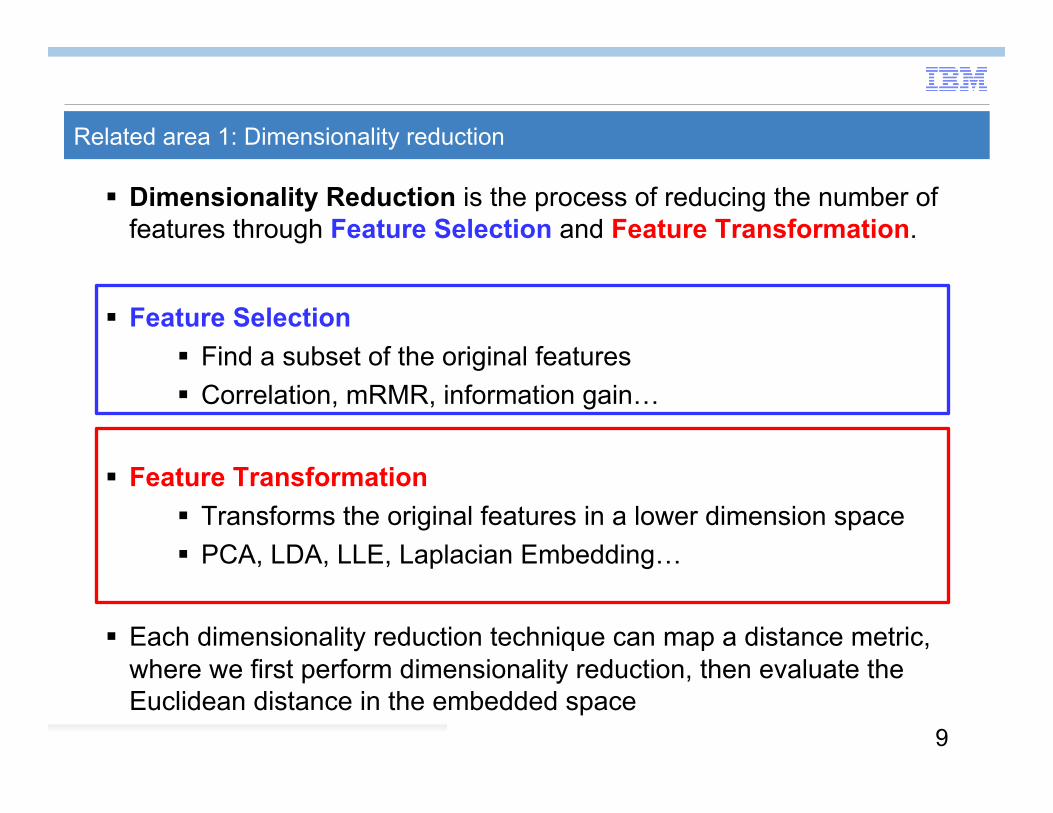
Dimensionality Reduction is the process of reducing the number of features through Feature Selection and Feature Transformation.
Feature Selection Find a subset of the original features Correlation, mRMR, information gain…
Feature Transformation Transforms the original features in a lower dimension space PCA, LDA, LLE, Laplacian Embedding…
Each dimensionality reduction technique can map a distance metric, where we first perform dimensionality reduction, then evaluate the Euclidean distance in the embedded space
10
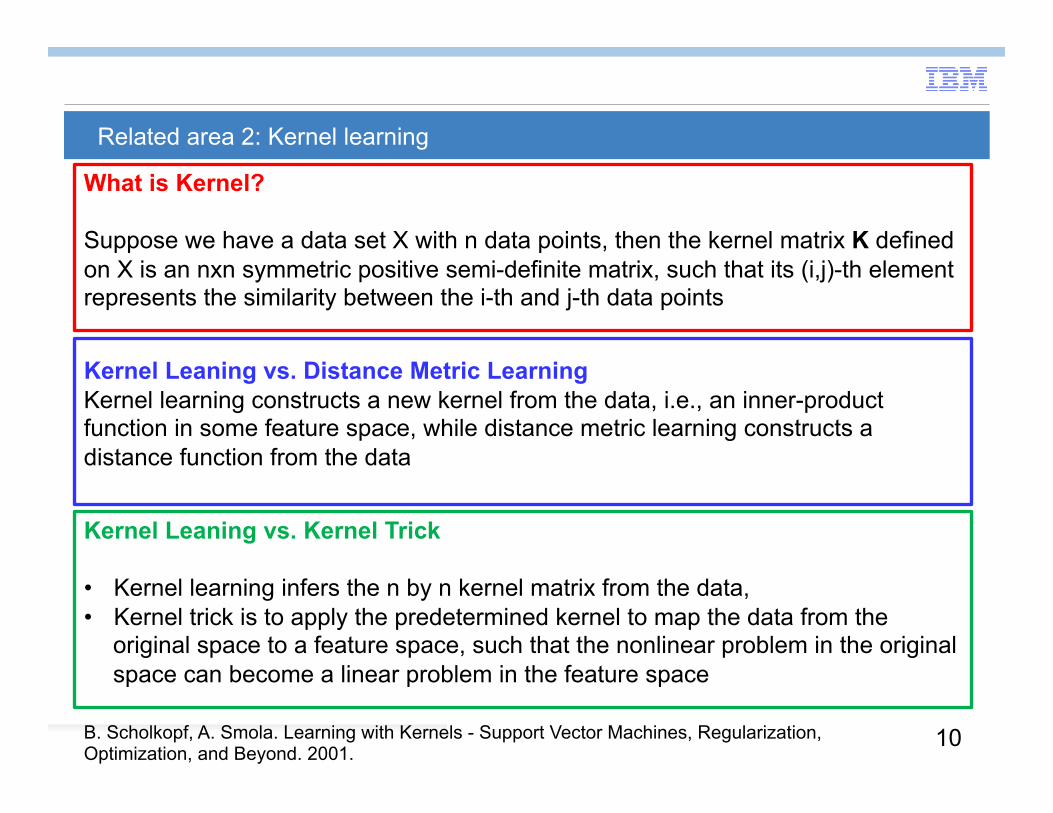
Related area 2: Kernel learning What is Kernel? Suppose we have a data set X with n data points, then the kernel matrix K defined on X is an nxn symmetric positive semi-definite matrix, such that its (i,j)-th element represents the similarity between the i-th and j-th data points
Kernel Leaning vs. Distance Metric Learning Kernel learning constructs a new kernel from the data, i.e., an inner-product function in some feature space, while distance metric learning constructs a distance function from the data
Kernel Leaning vs. Kernel Trick • Kernel learning infers the n by n kernel matrix from the data, • Kernel trick is to apply the predetermined kernel to map the data from the
original space to a feature space, such that the nonlinear problem in the original space can become a linear problem in the feature space
B. Scholkopf, A. Smola. Learning with Kernels - Support Vector Machines, Regularization, Optimization, and Beyond. 2001.

11
Different Types of Metric Learning
Unsupervised Supervised Semi-Supervised
Nonlinear
Linear PCA UMMP LPP
Kernelization LE LLE
ISOMAP SNE
LDA MMDA Eric RCA ITML
NCA ANMM LMNN
Kernelization
CMM LRML
Kernelization SSDR
• Red means local methods • Blue means global methods
12
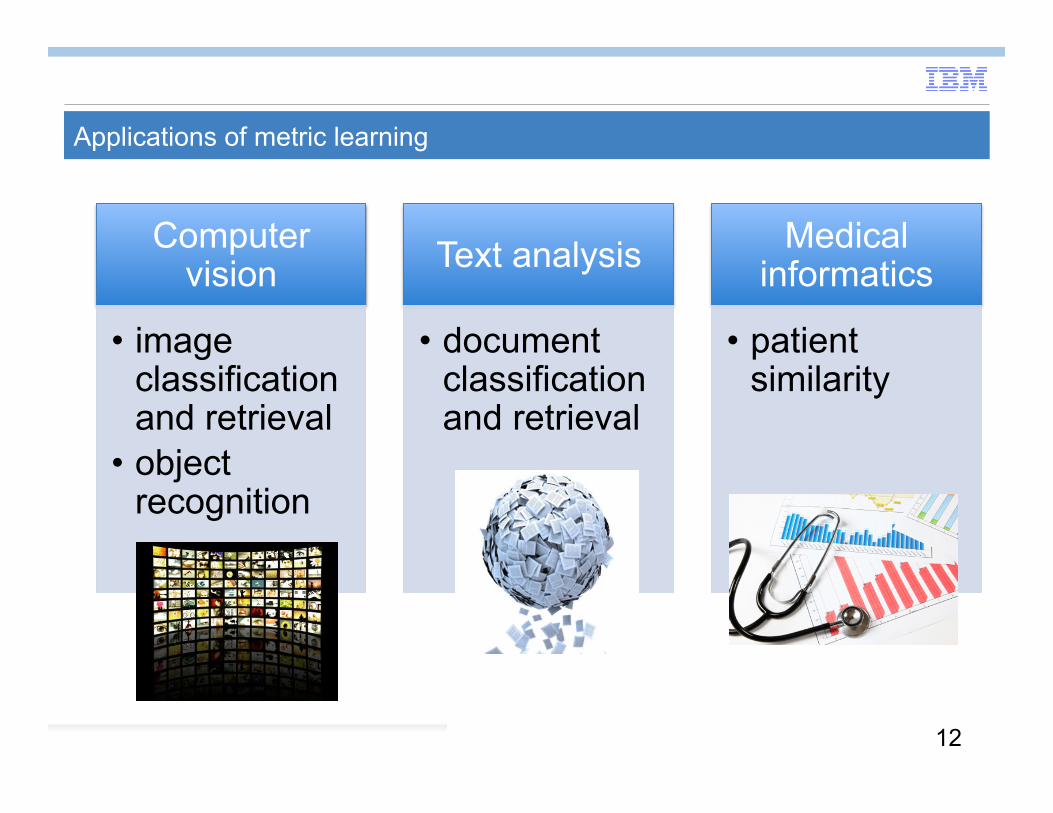
Applications of metric learning
Computer vision
• image classification and retrieval
• object recognition
Text analysis
• document classification and retrieval
Medical informatics
• patient similarity
13
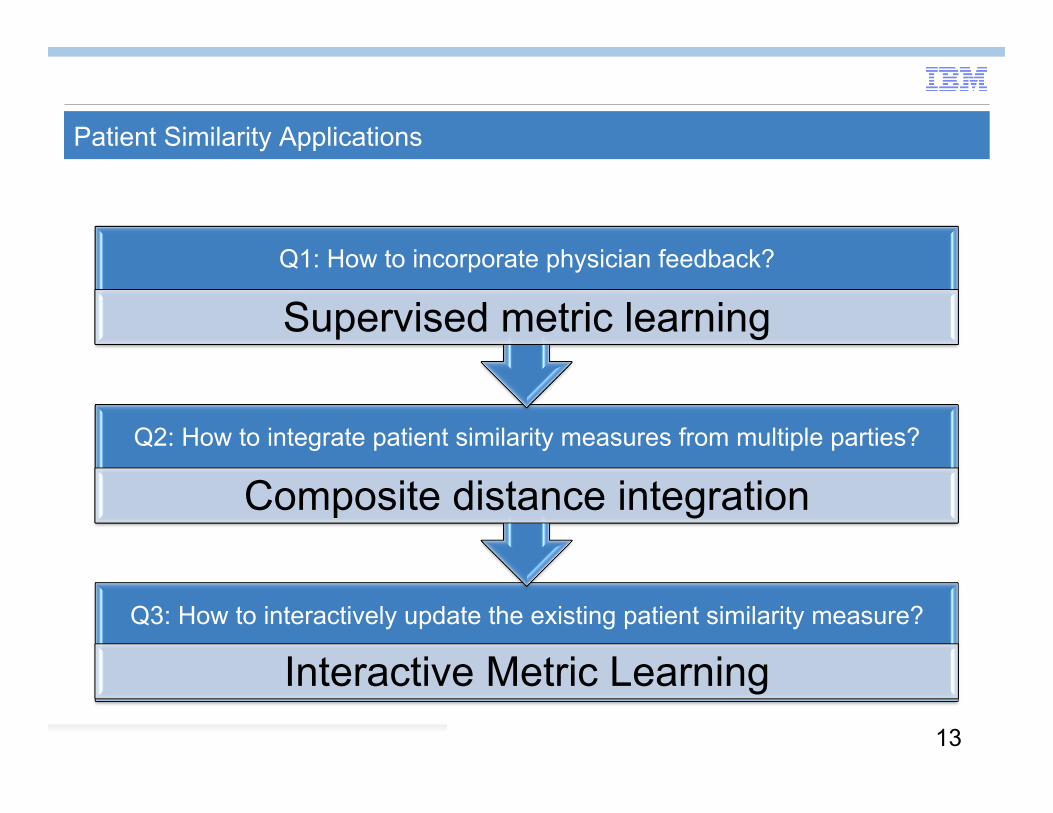
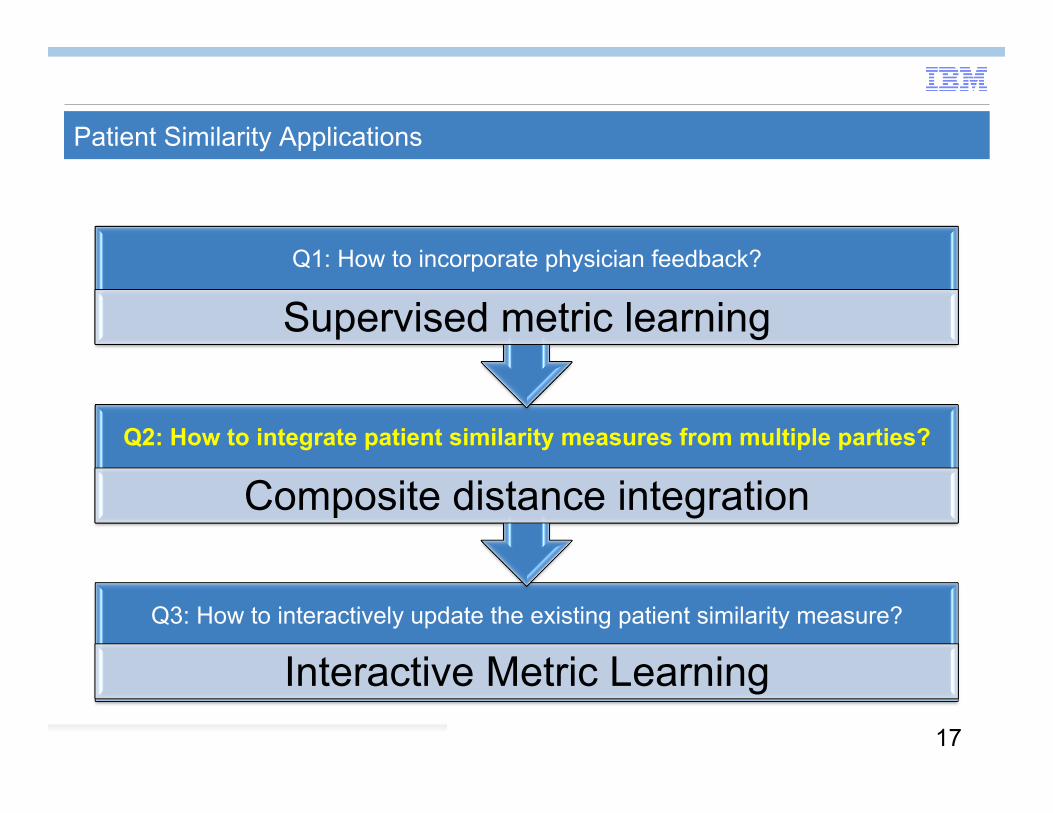
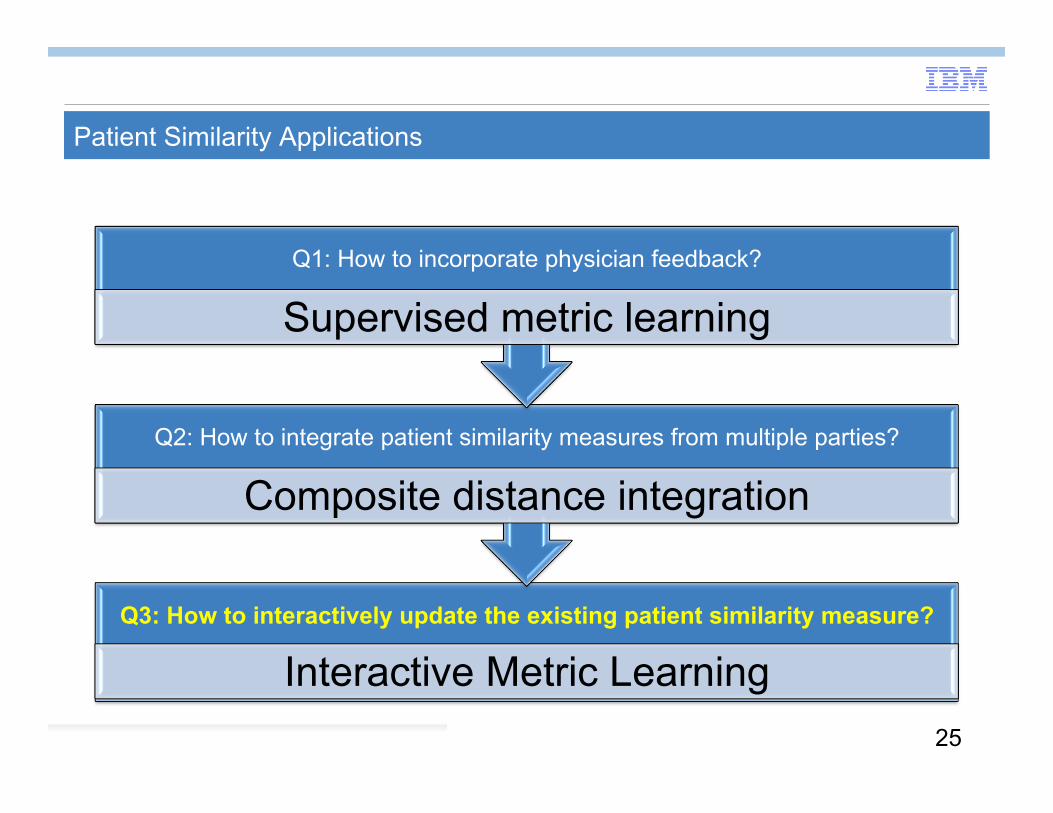
Patient Similarity Applications
Q3: How to interactively update the existing patient similarity measure?
Interactive Metric Learning
Q2: How to integrate patient similarity measures from multiple parties?
Composite distance integration
Q1: How to incorporate physician feedback?
Supervised metric learning
14
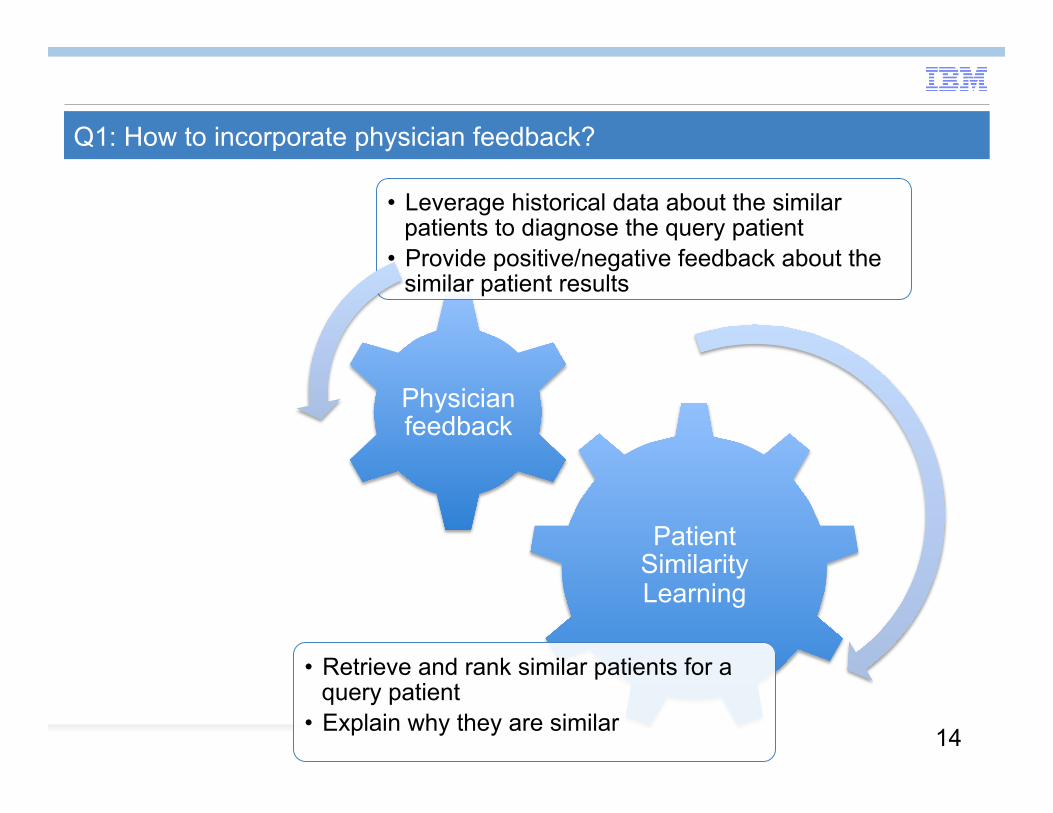
Q1: How to incorporate physician feedback?
Patient Similarity Learning
• Retrieve and rank similar patients for a query patient
• Explain why they are similar
Physician feedback
• Leverage historical data about the similar patients to diagnose the query patient
• Provide positive/negative feedback about the similar patient results
15
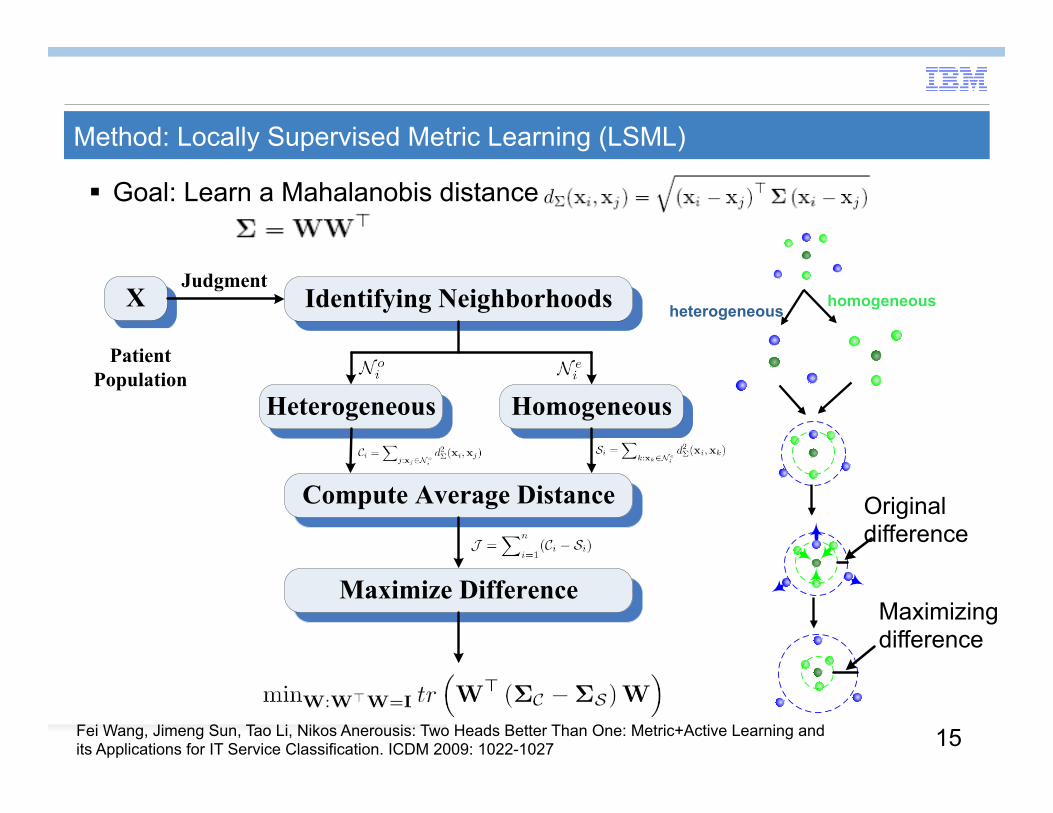
Method: Locally Supervised Metric Learning (LSML)
Goal: Learn a Mahalanobis distance
Identifying Neighborhoods
Heterogeneous Homogeneous
Compute Average Distance
Maximize Difference
JudgmentX
Patient Population
heterogeneous homogeneous
Original difference
Maximizing difference
Fei Wang, Jimeng Sun, Tao Li, Nikos Anerousis: Two Heads Better Than One: Metric+Active Learning and its Applications for IT Service Classification. ICDM 2009: 1022-1027
16
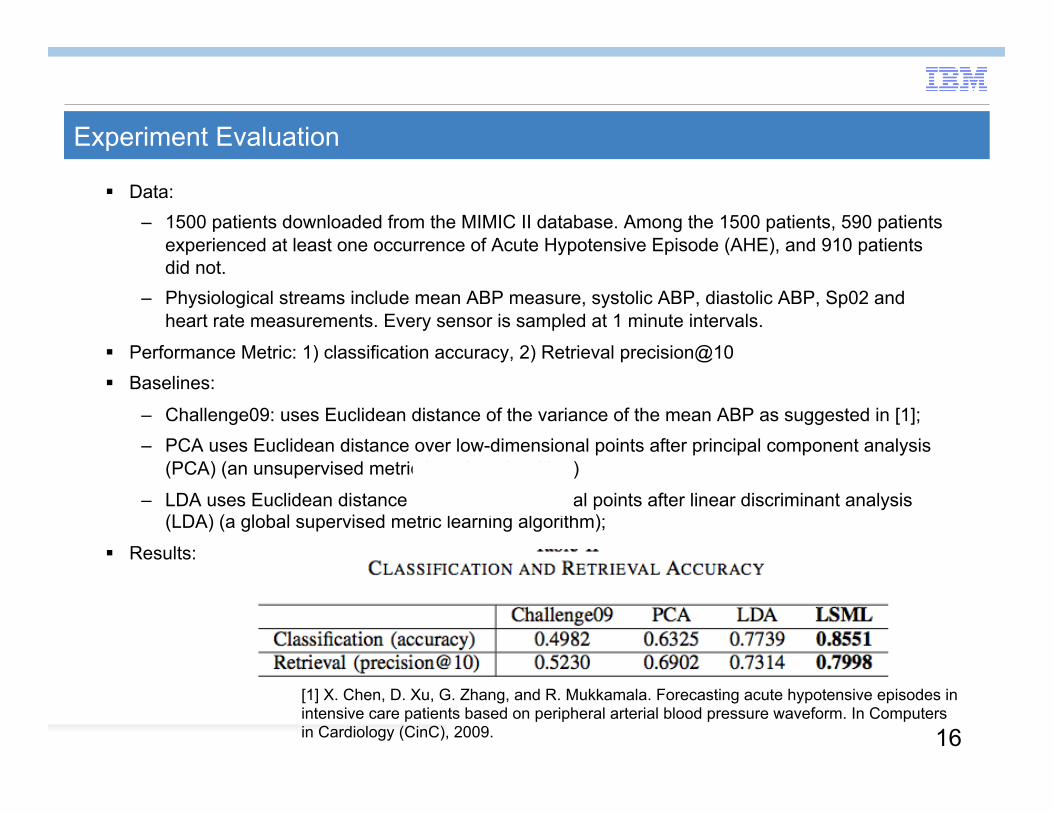
Experiment Evaluation
Data: – 1500 patients downloaded from the MIMIC II database. Among the 1500 patients, 590 patients
experienced at least one occurrence of Acute Hypotensive Episode (AHE), and 910 patients did not.
– Physiological streams include mean ABP measure, systolic ABP, diastolic ABP, Sp02 and heart rate measurements. Every sensor is sampled at 1 minute intervals.
Performance Metric: 1) classification accuracy, 2) Retrieval precision@10 Baselines:
– Challenge09: uses Euclidean distance of the variance of the mean ABP as suggested in [1]; – PCA uses Euclidean distance over low-dimensional points after principal component analysis
(PCA) (an unsupervised metric learning algorithm)
– LDA uses Euclidean distance over low-dimensional points after linear discriminant analysis (LDA) (a global supervised metric learning algorithm);
Results:
[1] X. Chen, D. Xu, G. Zhang, and R. Mukkamala. Forecasting acute hypotensive episodes in intensive care patients based on peripheral arterial blood pressure waveform. In Computers in Cardiology (CinC), 2009.
17
Patient Similarity Applications
Q3: How to interactively update the existing patient similarity measure?
Interactive Metric Learning
Q2: How to integrate patient similarity measures from multiple parties?
Composite distance integration
Q1: How to incorporate physician feedback?
Supervised metric learning
18
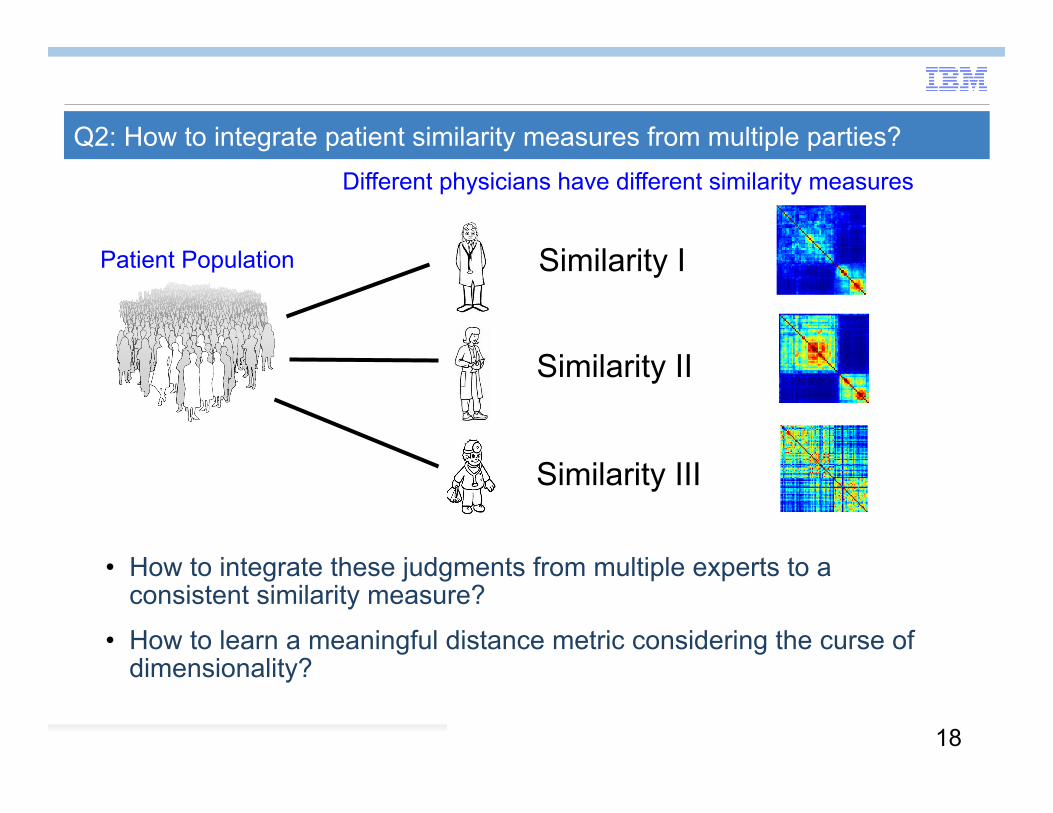
Q2: How to integrate patient similarity measures from multiple parties?
Similarity I
Similarity II
Similarity III
Patient Population
Different physicians have different similarity measures
• How to integrate these judgments from multiple experts to a consistent similarity measure?
• How to learn a meaningful distance metric considering the curse of dimensionality?
19
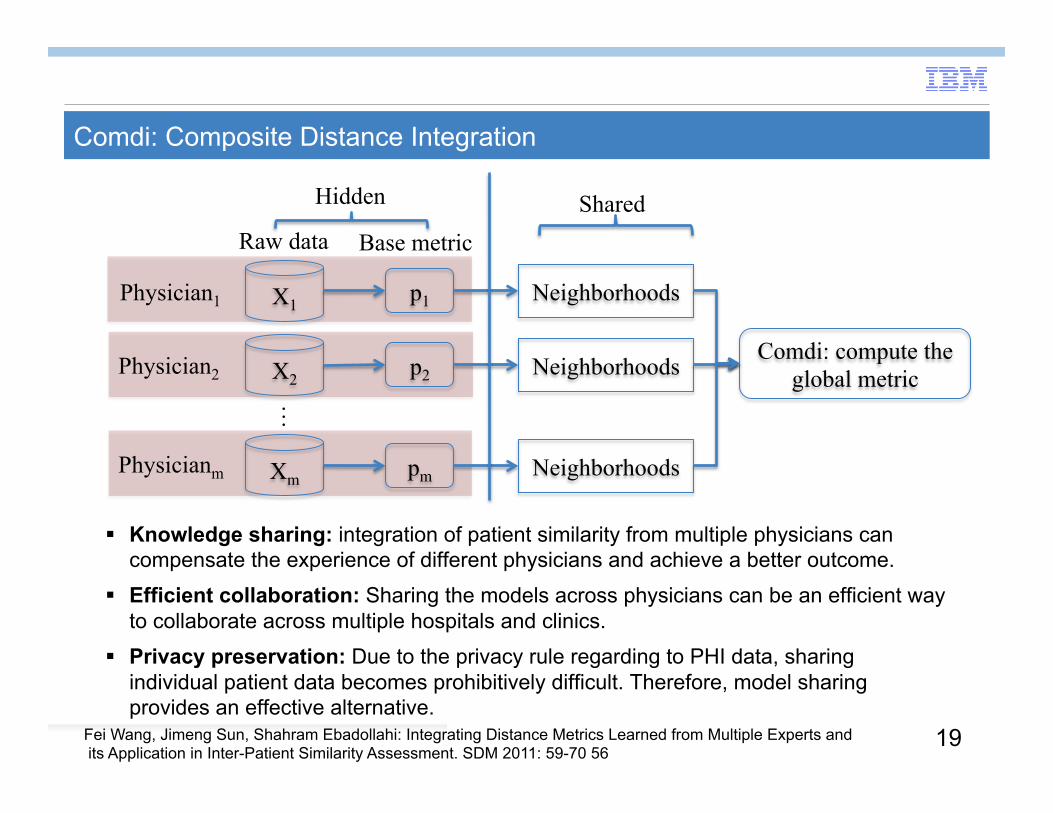
Comdi: Composite Distance Integration
Knowledge sharing: integration of patient similarity from multiple physicians can compensate the experience of different physicians and achieve a better outcome.
Efficient collaboration: Sharing the models across physicians can be an efficient way to collaborate across multiple hospitals and clinics.
Privacy preservation: Due to the privacy rule regarding to PHI data, sharing individual patient data becomes prohibitively difficult. Therefore, model sharing provides an effective alternative.
Physicianm
Physician2
Physician1 X1
X2
Xm
…
p1
p2
pm
Neighborhoods
Neighborhoods
Neighborhoods
Comdi: compute the global metric
Base metric Raw data Shared Hidden
Fei Wang, Jimeng Sun, Shahram Ebadollahi: Integrating Distance Metrics Learned from Multiple Experts and its Application in Inter-Patient Similarity Assessment. SDM 2011: 59-70 56
20
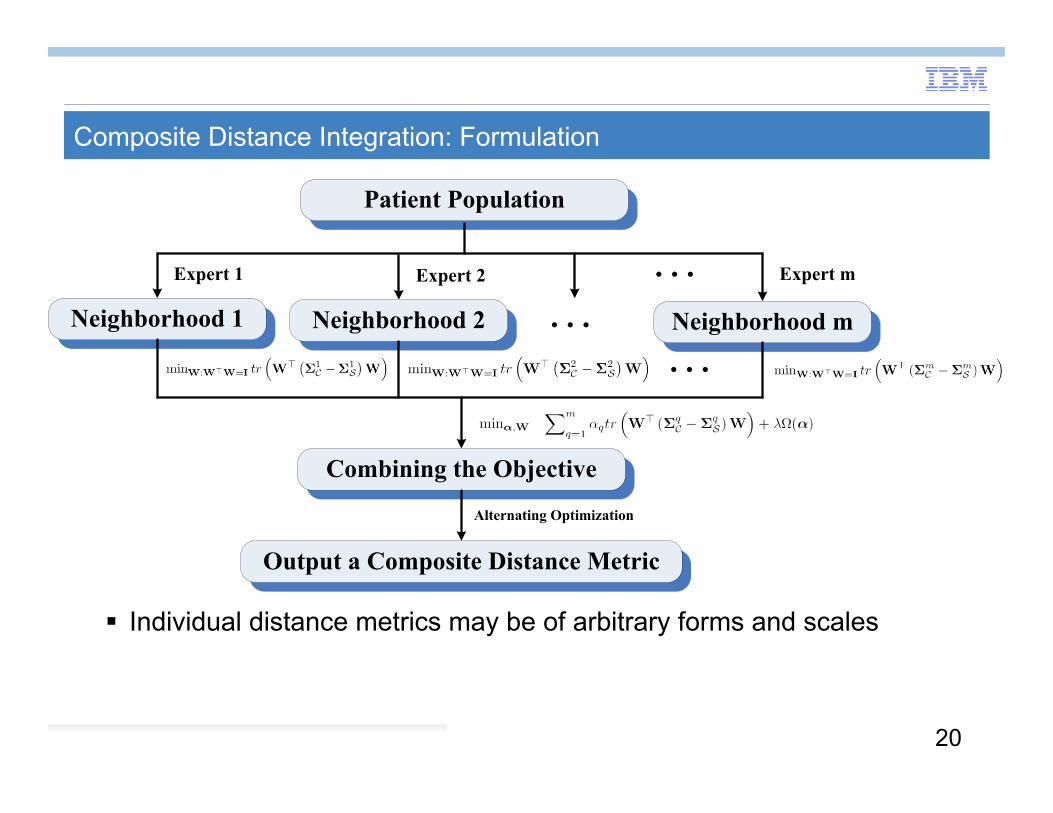
Composite Distance Integration: Formulation
Individual distance metrics may be of arbitrary forms and scales
Patient Population
Neighborhood 1 Neighborhood m
Expert 1 Expert m
Neighborhood 2
Expert 2 . . .. . .
. . .
Combining the Objective
Output a Composite Distance Metric
Alternating Optimization
21
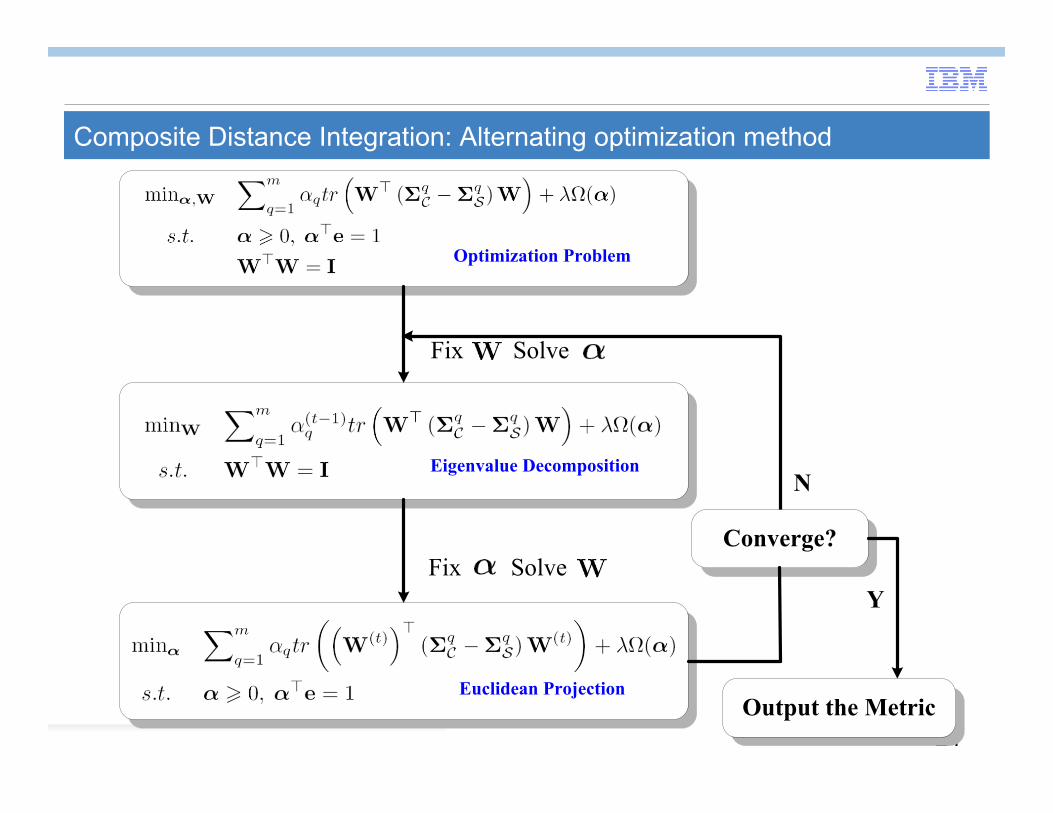
Composite Distance Integration: Alternating optimization method
Fix Solve
Optimization Problem
Eigenvalue Decomposition
Euclidean Projection
Fix SolveConverge?
N
Output the Metric
Y
22
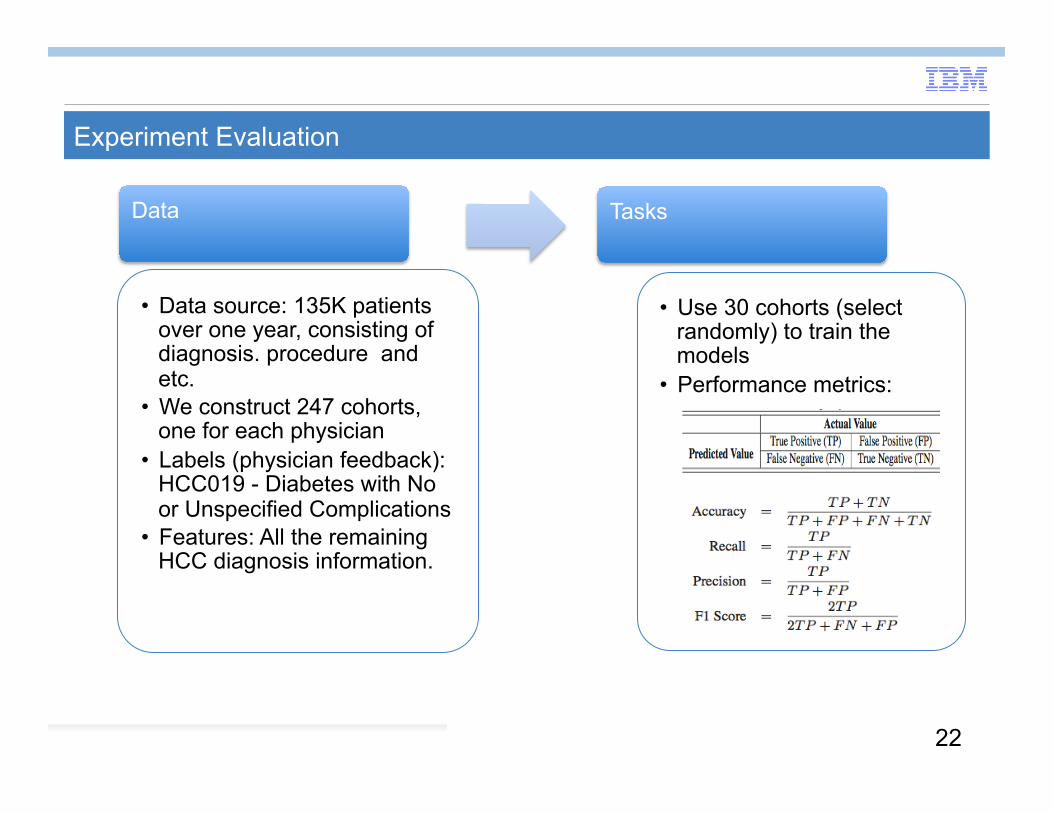
Experiment Evaluation
Data
• Data source: 135K patients over one year, consisting of diagnosis. procedure and etc.
• We construct 247 cohorts, one for each physician
• Labels (physician feedback): HCC019 - Diabetes with No or Unspecified Complications
• Features: All the remaining HCC diagnosis information.
Tasks
• Use 30 cohorts (select randomly) to train the models
• Performance metrics:
23
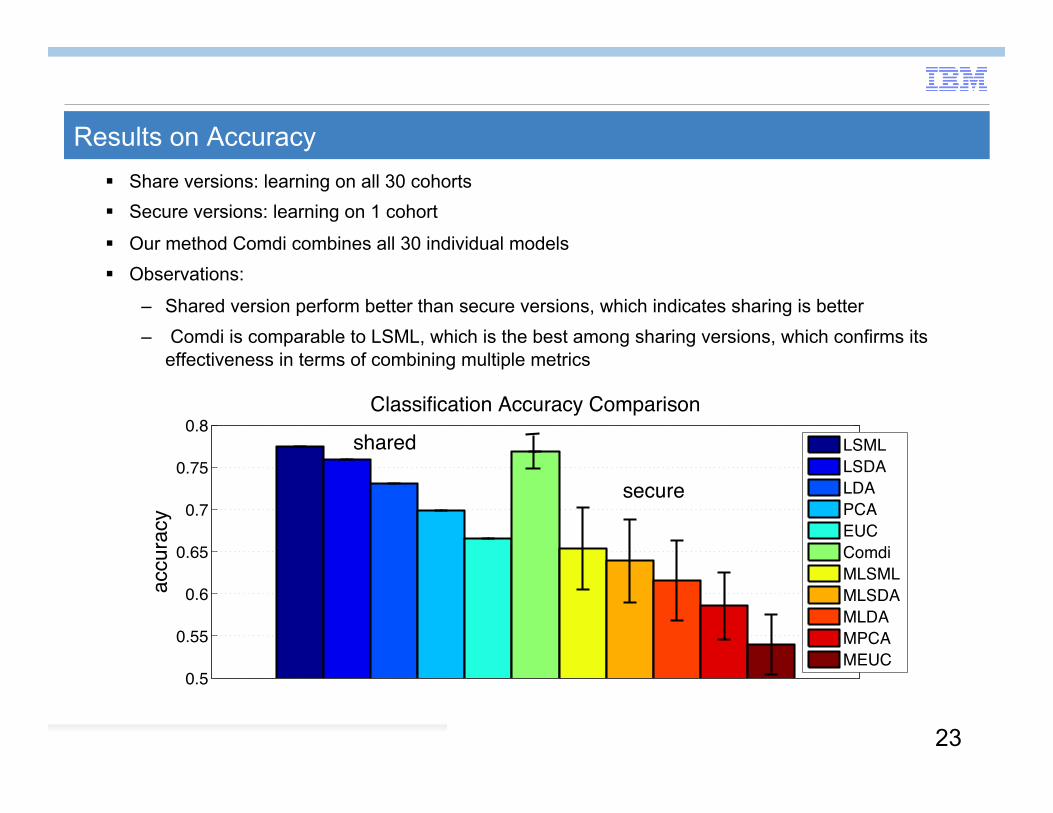
Results on Accuracy Share versions: learning on all 30 cohorts Secure versions: learning on 1 cohort
Our method Comdi combines all 30 individual models Observations:
– Shared version perform better than secure versions, which indicates sharing is better – Comdi is comparable to LSML, which is the best among sharing versions, which confirms its
effectiveness in terms of combining multiple metrics
0.5
0.55
0.6
0.65
0.7
0.75
0.8
accu
racy
Classification Accuracy Comparison
LSMLLSDALDAPCAEUCComdiMLSMLMLSDAMLDAMPCAMEUC
shared
secure
24
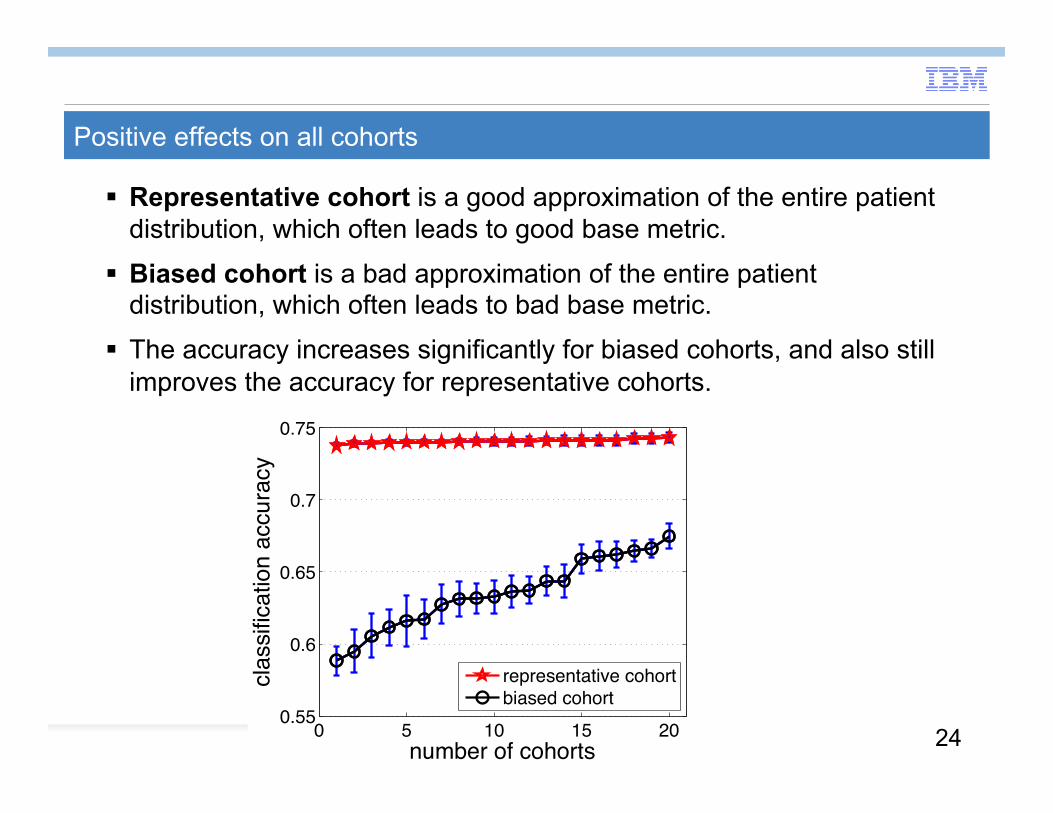
Positive effects on all cohorts
Representative cohort is a good approximation of the entire patient distribution, which often leads to good base metric.
Biased cohort is a bad approximation of the entire patient distribution, which often leads to bad base metric.
The accuracy increases significantly for biased cohorts, and also still improves the accuracy for representative cohorts.
0 5 10 15 200.55
0.6
0.65
0.7
0.75
number of cohorts
clas
sific
atio
n ac
cura
cy
representative cohortbiased cohort
25
Patient Similarity Applications
Q3: How to interactively update the existing patient similarity measure?
Interactive Metric Learning
Q2: How to integrate patient similarity measures from multiple parties?
Composite distance integration
Q1: How to incorporate physician feedback?
Supervised metric learning
26
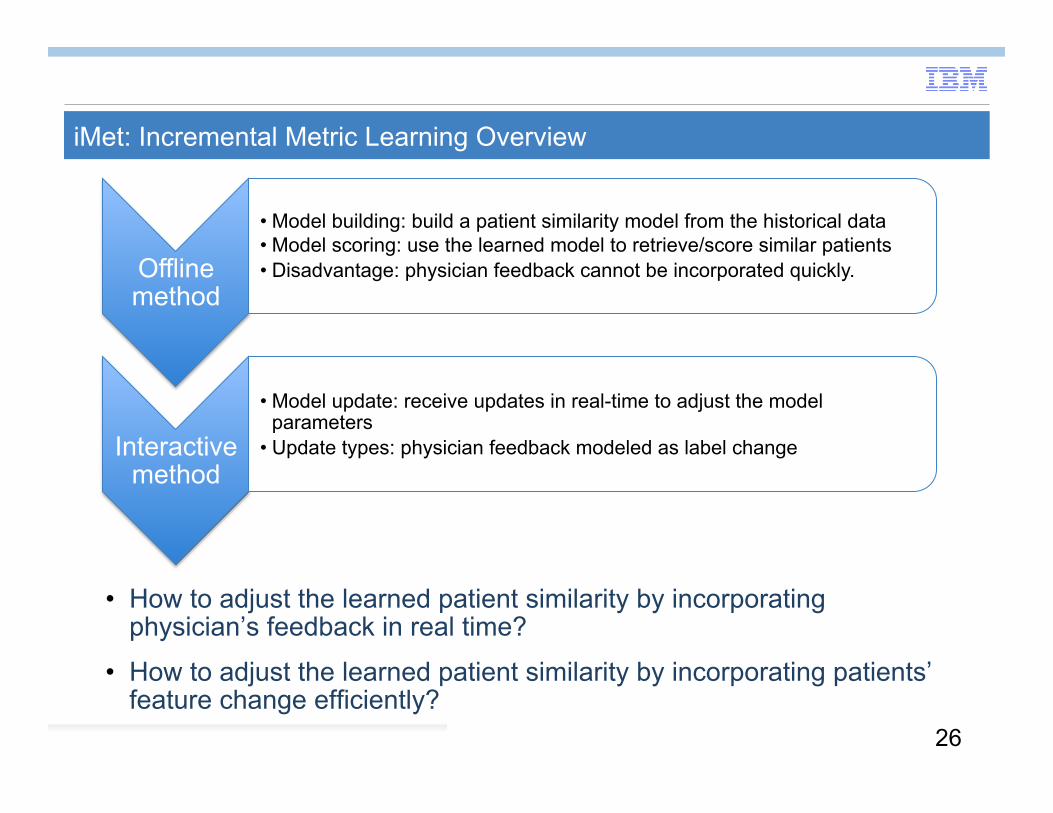
iMet: Incremental Metric Learning Overview
• How to adjust the learned patient similarity by incorporating physician’s feedback in real time?
• How to adjust the learned patient similarity by incorporating patients’ feature change efficiently?
Offline method
• Model building: build a patient similarity model from the historical data • Model scoring: use the learned model to retrieve/score similar patients • Disadvantage: physician feedback cannot be incorporated quickly.
Interactive method
• Model update: receive updates in real-time to adjust the model parameters
• Update types: physician feedback modeled as label change
27
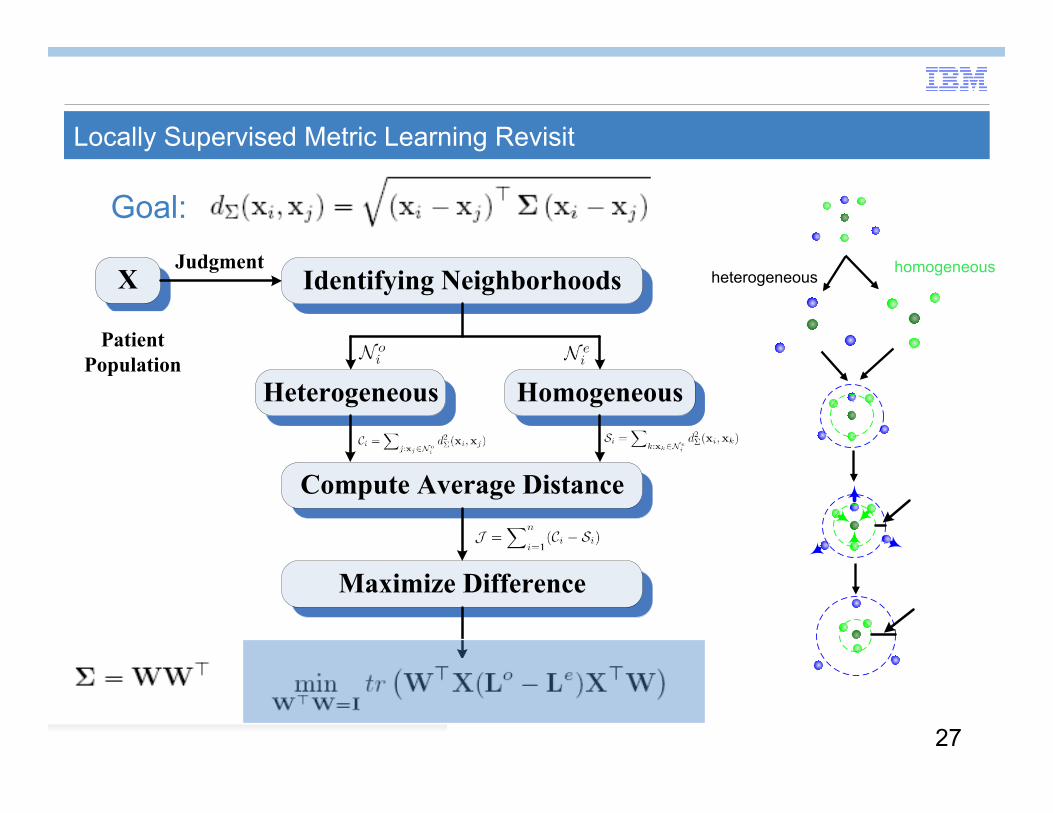
Locally Supervised Metric Learning Revisit
Identifying Neighborhoods
Heterogeneous Homogeneous
Compute Average Distance
Maximize Difference
JudgmentX
Patient Population
heterogeneous homogeneous
Goal:
28
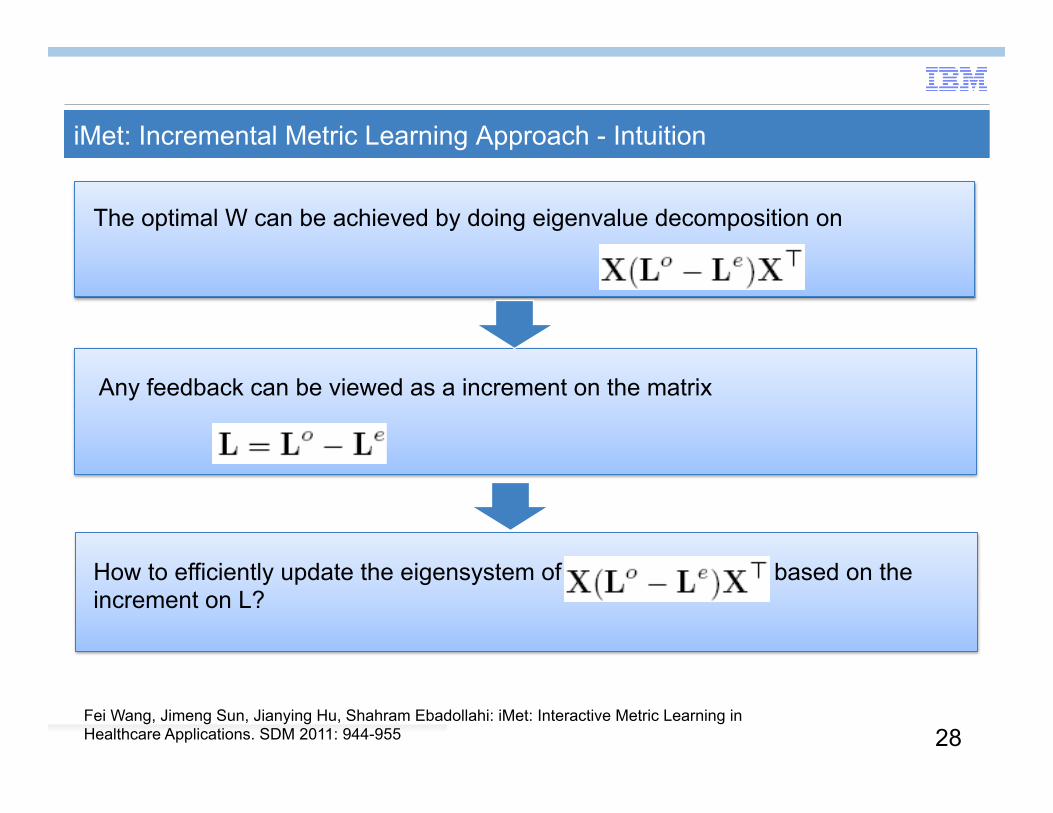
iMet: Incremental Metric Learning Approach - Intuition
Any feedback can be viewed as a increment on the matrix
The optimal W can be achieved by doing eigenvalue decomposition on
How to efficiently update the eigensystem of based on the increment on L?
Fei Wang, Jimeng Sun, Jianying Hu, Shahram Ebadollahi: iMet: Interactive Metric Learning in Healthcare Applications. SDM 2011: 944-955
29
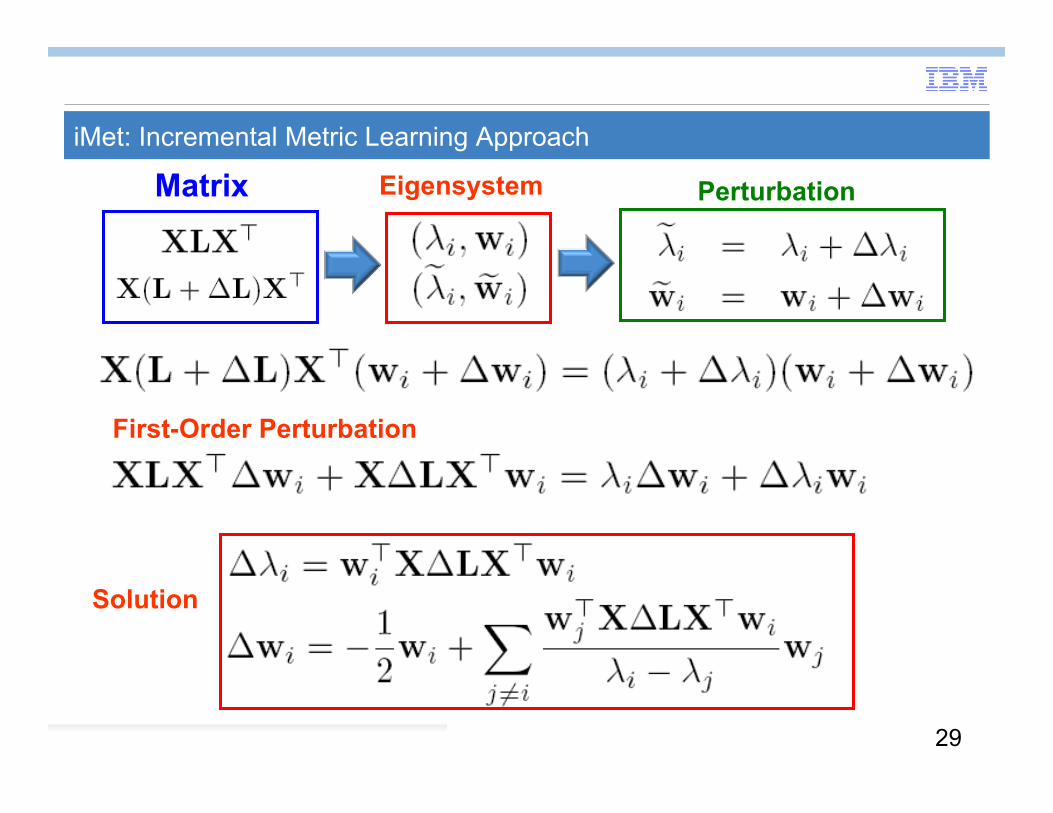
iMet: Incremental Metric Learning Approach
Matrix
First-Order Perturbation
Solution
Eigensystem Perturbation
30 0
510
1520
25
0
20
40
0.7
0.71
0.72
0.73
number of feedback roundsposition
prec
isio
n
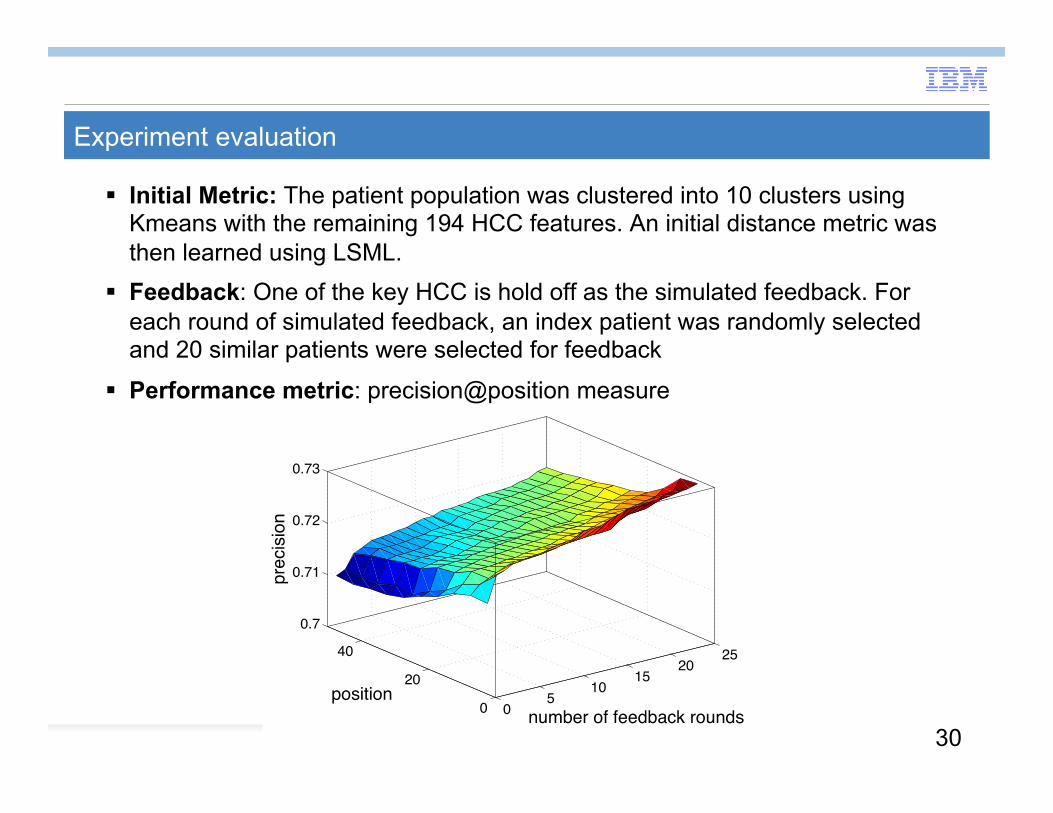
Experiment evaluation
Initial Metric: The patient population was clustered into 10 clusters using Kmeans with the remaining 194 HCC features. An initial distance metric was then learned using LSML.
Feedback: One of the key HCC is hold off as the simulated feedback. For each round of simulated feedback, an index patient was randomly selected and 20 similar patients were selected for feedback
Performance metric: precision@position measure
31
Part I Summary
Definition of distance metric learning Taxonomy of distance metric learning
Related areas
– Dimensionality reduction – Kernel learning
Patient similarity application
– Locally supervised metric learning – Multiple metric integration
– Interactive metric learning