distance estimation and positioning based on bluetooth low ...859549/fulltext01.pdf · abstract...
TRANSCRIPT

Distance Estimation and Positioning Based on Bluetooth Low Energy Technology
JOHAN LARSSON
KTH ROYAL INSTITUTE OF TECHNOLOGY
I N F O R M A T I O N A N D C O M M U N I C A T I O N T E C H N O L O G Y

Distance estimation and positioning based on Bluetooth lowenergy technology
Master of Science Thesisby Johan Larsson
Kista 2015
Examiner SupervisorMark Smith, KTH Patrik Hillbo, Syntronic
AbstractThis thesis deals with location determining, also known as posi-
tioning, using Bluetooth Low energy radio. The goal is to imple-ment a low power low cost indoor positioning system which utilizeexisting hardware. Two main methods are investigated and theirviability assessed.Previous efforts with indoor positioning systems concentrate on sta-tistical fingerprinting methods, mainly using 802.11 (WLAN) as theplatform. Some efforts have been made with purely signal strengthbased positioning, but indoor environments have shown to workunfavorably for these kinds of methods.

Contents
List of Figures 2
List of Acronyms 5
1 Introduction 61.1 Introduction . . . . . . . . . . . . . . . . . . . . . . . . . . . . . . . . . 61.2 Background . . . . . . . . . . . . . . . . . . . . . . . . . . . . . . . . . 61.3 Motivation . . . . . . . . . . . . . . . . . . . . . . . . . . . . . . . . . . 71.4 Goals . . . . . . . . . . . . . . . . . . . . . . . . . . . . . . . . . . . . . 81.5 Organization . . . . . . . . . . . . . . . . . . . . . . . . . . . . . . . . 8
2 Positioning and radio theory 92.1 Bluetooth Low Energy . . . . . . . . . . . . . . . . . . . . . . . . . . . 9
2.1.1 Radio interface . . . . . . . . . . . . . . . . . . . . . . . . . . . 102.1.2 BLE and positioning . . . . . . . . . . . . . . . . . . . . . . . . 11
2.2 Positioning concepts . . . . . . . . . . . . . . . . . . . . . . . . . . . . 122.2.1 Proximity . . . . . . . . . . . . . . . . . . . . . . . . . . . . . . 122.2.2 Ranging . . . . . . . . . . . . . . . . . . . . . . . . . . . . . . . 122.2.3 Angulation . . . . . . . . . . . . . . . . . . . . . . . . . . . . . 132.2.4 Lateration . . . . . . . . . . . . . . . . . . . . . . . . . . . . . . 13
2.3 Fingerprinting . . . . . . . . . . . . . . . . . . . . . . . . . . . . . . . . 152.3.1 Beacon distance considerations . . . . . . . . . . . . . . . . . . 17
2.4 Multipath fading . . . . . . . . . . . . . . . . . . . . . . . . . . . . . . 172.5 Available positioning systems . . . . . . . . . . . . . . . . . . . . . . . 18
3 Implementation 193.1 Hardware platform . . . . . . . . . . . . . . . . . . . . . . . . . . . . . 193.2 Software . . . . . . . . . . . . . . . . . . . . . . . . . . . . . . . . . . . 19
3.2.1 Receiver . . . . . . . . . . . . . . . . . . . . . . . . . . . . . . . 193.2.2 Beacon . . . . . . . . . . . . . . . . . . . . . . . . . . . . . . . . 20
3.3 Algorithm . . . . . . . . . . . . . . . . . . . . . . . . . . . . . . . . . . 20
4 Test setup 224.1 Ranging . . . . . . . . . . . . . . . . . . . . . . . . . . . . . . . . . . . 224.2 Fingerprinting . . . . . . . . . . . . . . . . . . . . . . . . . . . . . . . . 22
4.2.1 Fingerprint density calculation . . . . . . . . . . . . . . . . . . . 23
5 Evaluation 255.1 RSSI Distribution . . . . . . . . . . . . . . . . . . . . . . . . . . . . . . 255.2 Fingerprinting accuracy . . . . . . . . . . . . . . . . . . . . . . . . . . 26
5.2.1 Fingerprinting - Nearest neighbor . . . . . . . . . . . . . . . . . 27
6 Conclusion 29

CONTENTS 2
7 Discussion 307.1 Future works and use of BLE for positioning . . . . . . . . . . . . . . . 30
7.1.1 Algorithm tuning . . . . . . . . . . . . . . . . . . . . . . . . . . 307.1.2 Beacon placement strategy and density . . . . . . . . . . . . . . 307.1.3 Determine useful fingerprint density . . . . . . . . . . . . . . . . 30
7.2 BLE Proximity based positioning . . . . . . . . . . . . . . . . . . . . . 30

List of Figures
2.1 Major components of a Bluetooth 4.0 dual mode chipset . . . . . . . . . . . 92.2 Channel configuration of BLE . . . . . . . . . . . . . . . . . . . . . . . . 102.3 Principle of triangulation . . . . . . . . . . . . . . . . . . . . . . . . . . . 132.4 Trilateration based locationing system . . . . . . . . . . . . . . . . . . . . 14
4.1 Drawing of area used for measurements. Each fingerprint is marked with a reddot. The distance between the points are 1m . . . . . . . . . . . . . . . . . 23
5.1 Distribution of RSSI readings from CSR1000 . . . . . . . . . . . . . . . . . 255.2 Distribution of RSSI readings from TI keyFOB . . . . . . . . . . . . . . . 265.3 Distribution of RSSI readings from a Bluegiga beacon . . . . . . . . . . . . 265.4 Distribution of RSSI readings from a Bluegiga beacon, second series . . . . . 27

LIST OF FIGURES 4
LIST OF FIGURES 5
GPS Global Positioning SystemTOF Time Of FlightTOA Time Of ArrivalTDOA Time Difference Of ArrivalBLE Bluetooth Low EnergyRSSI Received signal Strength IndicationUWB Ultra WidebandGSM Global System for Mobile CommunicationsISM Industrial, Scientific and MedicalDQPSK Differential Quadrature Phase Shift Keying8DPSK 8-way Differential Phase Shift KeyingBR Basic RateEDR Enhanced Data RateIEEE Institute of Electrical and Electronics EngineersGFSK Gaussian Frequency Shift Keying

Chapter 1
Introduction
1.1 Introduction
As cost of low power radio systems steadily decreases, their use in both cost and per-formance sensitive applications become more attractive. One such application is po-sitioning. The problem of positioning has largely been solved for outdoor situations,with systems such as the Global Positioning System(GPS)[1]. Indoors however, thesituation is another as GPS signals generally don’t penetrate buildings. In this thesis,the possible use of Bluetooth Low Energy(BLE)[2] to position cargo and similar slowmoving or semi static devices indoors will be studied. The thesis will be conducted atSyntronic Software Innovations AB(SSI) and based on work of implementing an indoorpositioning system.
1.2 Background
Plenty of work has already been done regarding indoor positioning, most of it is howeverfocused on IEEE 802.11[3], more commonly known as WiFi. While many successful re-sults have been achieved, either they rely on a radio standard that is not low power(suchas 802.11) or they rely on non commodity hardware as is the case of Motetrack[4] or Ul-tra Wideband(UWB)[5] based systems. For Bluetooth, much of the initial work showedlittle promise[6] [7], as many parts of the standard work unfavorably for use in position-ing. The two largest problems are the accuracy of the clock and the implementationof the Received Signal Strength Indication(RSSI) value. The clock allows for a 1μsdeviation according to the specification [2], this makes the expected accuracy very lowand no article investigating the use of time based positioning was found at the timeof writing. The RSSI problem seems to relate to both hardware implementation andspecification. One study [6] found the correlation between distance and RSSI to bepoor, while [7] found it usable but with limited accuracy.
Other studies focused on the concept of fingerprinting. The concept uses RSSI, butnot to estimate distance. Rather, the whole facility of interest is covered with beaconsthat constantly advertise their presence. The device to be positioned then reads thesignal strength of all received advertisements, and compares them to a pre-compileddatabase of locations, selecting the best match. Using fingerprinting techniques, accu-racy of less than 3m can be achieved with 80% precision [8]. Even though some papersseem conclusive that fingerprinting is the best choice for Bluetooth positioning, it isimportant not to rule out other methods if performance can be made good enough.They also focus on Bluetooth, not BLE, which might have different properties makingit more useful for other methods such as RSSI based ones. No studies using BLE werefound.

1.3 Motivation 7
1.3 Motivation
Several competing competing commercial indoor positioning systems exist on the mar-ket, but there is no clear standard. The vendors are usually not specific when describingtheir product and it is often not clear what kind of method is used or what accuracyis to be expected. Most of them however indicate they are utilizing 802.11-standards,making them inherently not low power. The common denominator for all these arethat they focus on positioning people, either for navigational purposes or location spe-cific information such as commercial offers at retail locations or tour information atmuseums.
Table 1.1 shows a small selection of positioning methods available for indoor use,with GPS as a reference. The numbers are rough and systems based on similar designsmay vary in both power consumption and accuracy. The power figures quoted are whenactive and not directly comparable between each other. As some technologies allow forvery short bursts of activity, the average power will be considerably less than a systemwith similar active state power but long setup times.
What can be found is that there is a gap for something with sub 10m accuracy thatis truly low power. Two options look particularly promising, UWB and BLE basedsystems. Both should be able to fill the role for indoor positioning, albeit with differentcost and accuracy expectations. For this thesis, the focus is solely on BLE.
BLE is expected to grow rapidly as it is deployed in mobile phones and wearableelectronics. This promises many benefits from economy of scale, such as low cost andhigh availability of devices. It will probably not be able to compete with UWB foraccuracy and resolution[5] but considering cost and availability BLE looks to get amore widespread use.
System Target area Active power usage AccuracyGPS and similar satellite based Outdoor 50-200mW 3-15m[1]Cellular proximity Both 50mW 300-3500m802.11 Fingerprinting Indoor 50-300mW 3-10m[8]802.11 Time differential lateration Indoor 50-300mW 30cmUWB Time differential lateration Indoor 50-60mW 30cmBLE proximity Indoor <10mW 10-50mBluetooth RSSI Indoor <40mW 5-10mBluetooth Fingerprinting Indoor <40mW 3-10m
Table 1.1: Small overview of positioning technologies using radio

1.4 Goals 8
1.4 Goals
The goal of this thesis project is to study the viability of using BLE for indoor posi-tioning for static or slow moving objects. The central questions for the project are:
• What or which methods are suitable for implementation using BLE?
• What are the relative strengths and drawbacks of the methods?
• How can indoor positioning with BLE be further improved upon?
At the end of this project a functioning prototype positioning system is expected tohave been implemented and evaluated. The system is expected to be able to reproducesome of the results found by others. The system should implement fingerprinting as itis the most complex signal strength based method commonly deployed. During devel-opment, measurements and tests mirroring other methods will be performed, coveringthe major positioning methods. The results will be analyzed according to it’s accu-racy, expected power usage for a large scale system and required beacon density for thedesired accuracy. Problems faced during implementation and evaluation will also bediscussed if they are relevant to the systems viability for deployment.
The system is expected to be able to position a device at a resolution of 5m andoffer a battery life of at least a year for battery powered nodes, using low cost batteries.
1.5 Organization
• Chapter 2 introduces both common and project specific concepts used when dis-cussing and implementing positioning
• Chapter 3 explains the implementation of the positioning system
• Chapter 4 describes the tests performed and how they are set up
• Chapter 5 presents the results from fingerprinting and ranging measurements.Also offers some discussion about their implications
• Chapter 6 summarizes the results and discuses future work and areas of interest
• Chapter 7 offers discussion about BLE based positioning and it’s applications

Chapter 2
Positioning and radio theory
This chapter introduces the relevant parts of the Bluetooth 4.0 standard, as well assome radio concepts useful for understanding positioning with it’s possibilities andlimitations.
2.1 Bluetooth Low Energy
Introduced in the Bluetooth 4.0 standard, BLE is a low power radio standard fromBluetooth Special Interests Group. While maintaining Bluetooth as part of its name,it’s not fully backwards compatible with Bluetooth 3 and earlier. With Bluetooth4.0, the standard specifies two different radio interfaces, one that is compatible withthe older standard, also known as Basic Data Rate(BR) or Enhanced Data Rate(EDR).The other radio interface is the one used for BLE. The specification allows for Bluetooth4.0 devices to be dual mode, as well as single mode with support for either BR/EDRor BLE.
Figure 2.1: Major components of a Bluetooth 4.0 dual mode chipset

2.1 Bluetooth Low Energy 10
2.1.1 Radio interface
One of the largest deviations from the old[9] Bluetooth standard is the radio interface.BLE is still in the 2.4 GHz ISM band, but instead of being split up into 79 channels 1MHz wide, BLE uses 40 channels each one 2MHz wide. To reduce scanning time theallowed broadcast channels are reduced to three, as illustrated in figure 2.1.
0 5 10 15 20 25 30 35Channel
BLE channel layoutData
Announce
Figure 2.2: Channel configuration of BLE
The modulation scheme used is Gaussian Frequency Shift Keying(GFSK), the sameas used in the low speed data mode of Bluetooth. However, the channel bandwidthdiffers, making interoperability impossible at the physical layer.
BLE is also capable of waking from sleep mode, sending a packet and then goingback to sleep quicker than higher speed Bluetooth. Where BLE uses roughly 6ms, olderstandards would use more than 100 ms. Not only does this affect scanning time, it alsoserves as an optimization for battery life when sending small amounts of data.

2.1 Bluetooth Low Energy 11
2.1.2 BLE and positioning
The way that services are exposed on BLE devices is new and several profiles forservices are included in the standard itself. This includes two service profiles relatingto positioning, Find Me Profile(FMP) and Proximity Profile(PXP).
FMP is the "Find Me Profile", with the goal to make devices easier to locate iflost. It works by having two devices, one is the locator and the other is the target tobe found. The target takes the role as server, meaning it listens for requests from thelocator. When a request arrives, an alert of some kind is activated on the target device.The alert is in most cases a visual or auditory signal to make the device easier to find.It could also be used to trigger a broadcast or an attempt for the device to positionitself and report back with the estimated position. This opens for the possibility to useit in ways not exactly as intended, but as part of a positioning system.
PXP or the Proximity Profile is the other location based service included in thestandard. It defines the behavior of a device when it loses or establishes a connectionwith another device. There’s also the possibility to take action on crossing a pre deter-mined path loss/RSSI value. This service is more interesting for a positioning system,but it relies on the devices establishing connections. This means that both PXP andFMP suffer the same problem, the device to be found needs to constantly listen to bea functional part of the system. Both profiles might be useful in applications wherebattery life is not as important or regular recharging of the batteries can be expected.
There is also a commercial product/system called iBeacon from Apple computer,that aims to provide locationing service with compatible devices. This is not a standardprofile, but many mobile phones and computers are expected to support it. This is atwo way system, in some ways very similar to PXP. The beacons are expected tobe able to respond and provide some data to a local application at the device beingpositioned. With this data delivery functionality and requirements of special softwareon the devices, this system is wider in scope than a low power positioning system.The target market has been specified as commercial services for improved shoppingexperience. As such, it is a positioning system albeit too big to consider for a lowpower purely positioning service. However, if it gains traction this will likely bringdown the prices of BLE modules, indirectly benefiting other systems as well.
One consideration with practically all BLE enabled devices is the directionality ofthe antenna. Small devices utilize chip antennas and they exhibit non isotropic radiationpatterns. Connecting an external antenna to such devices will likely not be an optionin the majority of positioning scenarios due to size constraints. Part of the problemsarising from antenna directionality could be compensated for by using relative signalstrengths instead of absolute ones when using multiple signal strengths to determineposition.
2.2 Positioning concepts 12
2.2 Positioning concepts
There are several important core concepts when discussing positioning and a briefintroduction to them follows.
2.2.1 Proximity
The simplest form of positioning is to check whether or not the object to be positionedis present in radio coverage, with no regard to RSSI or time of arrival. The resolutionoffered is the same as the radio coverage, as it would only be able to differentiatebetween two states, present and not present. To increase accuracy it is possible tocombine several radios at different positions and to utilize the overlap of their coverageareas to determine the most likely position of the object.
2.2.2 Ranging
Ranging is the process of determining the distance between two objects, without anyregard to angle. It is also the base used for lateration(described in the next section).Several methods to accomplish this exists and the two most common in radio rangingare based on either received signal strength or time of flight. In free space, the relationbetween signal strength and distance can be expressed as
d = 20(RSSI+a)
Where a is an offset based on the maximum received signal strength for the system.However, for indoor use, this expression is at best a poor approximation as indoorenvironments are filled with obstacles such as walls and furniture. the obstacles arethe source of multipath effects that makes the relation between distance and RSSIcomplicated, making accuracy low[6]. Using time of flight based methods have provenmore useful for indoor ranging[10][5][11] as multipath effects interfering with signalstrength have less effect on measurements. The trade off is the cost of implementation,RSSI is a measurement that is integrated in virtually all modern radio controllers, butaccurate time measurements require specialized hardware[10][5] as many popular radiocontrollers do not offer an accurate timestamping function[2], or even an accurate clockrequired in the hardware. BLE is one of the standards that lack accurate timestamping.

2.2 Positioning concepts 13
2.2.3 Angulation
Angulation is the process of determining where an object is using the angle of incomingsignals. To do so, some level of directionality in the transmitter and/or receiver isneeded, such as directional antennas or antenna arrays. For the simple case of onemeasurement, no distance information can be gained. With two measurements fromobjects with known coordinates the location of the third object can be found. This isreferred to as triangulation. Illustrated in the figure below
Figure 2.3: Principle of triangulation
2.2.4 Lateration
Lateration is the determining of one objects position using several range measurements.If the range measurements are done from several known positions, each measurementcan be seen as a circle or sphere of possible positions at the measured range. Combiningseveral such measurements and calculating the intersection of the measurements yieldsa position. The principle is illustrated below with three beacons, all at different distancefrom the object.

2.2 Positioning concepts 14
Figure 2.4: Trilateration based locationing system
2.3 Fingerprinting 15
2.3 Fingerprinting
Fingerprinting is a method based on using primarily RSSI data to identify the currentlocation using pre-recorded data. The data consists of RSSI readings of different radiosignals available in the area. The readings are done in the mobile device, the bea-cons don’t need to be aware of any mobile device. In practice these signals consist ofbase station announcements from cellular networks or WiFi as well as broadcasts frombeacons deployed for the purpose of enabling fingerprinting.
For indoor cases it is not practical to utilize external sources such as cellular net-works. Even though it might seem attractive not needing to deploy any infrastructurefor a positioning system, as the cellular networks are under the control of telecom opera-tors there is no guarantee that the cell configuration would stay the same for any periodof time making the recorded fingerprints obsolete at unpredictable intervals. Cellularnetworks also cover large areas, making the fluctuations in RSSI not as prominent asother shorter range radio systems. The smaller variations in values makes it harder toseparate fingerprints from each other with high confidence.
WiFi already exists in many indoor locations and is a prime candidate for finger-printing. It has indeed been extensively studied[3] and deployed, but the usefulness ofWiFi-based systems have been limited by the size and cost of WiFi radios. WiFi fin-gerprinting has proven successful and is used for fingerprinting both as separate smallercommercial systems and as parts of larger systems in the case of Google Maps. Thereare also non commercial alternatives available such as RedPin.
If WiFi is not an option, an alternative that have had some success is to installspecial beacons specifically used for generating signals used for fingerprinting. Thebenefit of doing so is the added possibility to choose a radio technology, making itpossible to tailor the system to a locations specific needs. These could be frequencyinteroperability restrictions, range, power consumption or many other parameters. Thisis where new low power radio standards become relevant, it is possible to deploy cheapand low power units to make up the fingerprint map. At the same time, they wouldoffer the possibility to operate in a true low power mode, enabling them to run on smallbattery cells for years. This is of high importance for maintenance, as it could otherwisebecome a significant part of the systems total cost. Other benefits of the low powernature includes freedom of placement and lower installation cost, as no extra wiring isneeded saving both material and labor costs.

2.3 Fingerprinting 16

2.4 Multipath fading 17
2.3.1 Beacon distance considerations
If beacons are placed dense to achieve a higher data content in the fingerprints, theyalso start to provide the less unique information thus adding extra hardware but noextra benefit. Considering the extreme, where two beacons are placed on top of eachother, the signal strength would be identical to any receiver within their coverage.Calculating the amount of redundant information would be possible if the radio signalpropagation indoor could be easily modelled, however, this is not the case as has beenshowed several times before[7][6][3][12]. Therefore, this issue is not considered whendesigning the experiments to evaluate a fingerprinting system, but taken into accountwhen evaluating it as a possible problem source.
2.4 Multipath fading
Multipath, or more accurately multipath propagation effects, make up one of the biggestproblems for indoor radio communications. Multipath effects are caused by the samesignal arriving from multiple directions at the same time. Because every path the signalpropagates have different channel characteristics, it might interfere with another copyof itself at the receiver, both in a constructive and destructive way. Another name fordestructive interference is fading. The different paths originate from the environmentsphysical layout and materials, making the effects complicated to model as even smallchanges in dimensions or a change of material will have a large impact on the pathschannel properties.
The effect is further amplified when the environment consists of objects that are notstatic, such as people, pallets and packets. Such dynamic environments cause severalproblems when modelling them. One is that a signal might have it’s line of sight blockedby some object, attenuating the most direct path’s signal. Other more subtle problemsare the different characteristics of fading introduced for different kinds of obstacles.Some materials are prone to reflecting radio waves, while others simply attenuate it.As it is virtually impossible to identify a material and determine its properties in realtime, multipath effects are better compensated for in a statistical sense.
To overcome this problem, simplifications are generally used and no effort to accu-rately model the radio environment is made. The effects should be most pronouncedwhen using RSSI based systems, but they also affect TOF based ones, albeit not asgreatly[11]
2.5 Available positioning systems 18
2.5 Available positioning systems
As can be seen in 1.1, even when looking at a small group of available positioningsystems their accuracy varies by orders of magnitude. Positioning is also not limited toradio based systems, acoustic and optical ones are available as well

Chapter 3
Implementation
3.1 Hardware platform
Common for all tests and experiments performed are the hardware platforms used. Amix of hardware from two vendors was used, Texas Instruments(TI) and CambridgeSilicon Radio(CSR). A total of six beacons and one receiver were used. The TI beaconsare based of the CC2541[13] chipset and the additional CSR beacons are based onCSR1000[14]. The TI beacons consisted of one CC2540-KEYFOB[15] reference modulefrom TI themselves and three BLE112 [16] modules from BlueGiga. The TI modulewas pre-assembled and used as is, the BlueGiga ones however were slightly modified,adding larger battery and a breakout for the programming connector. The two CSRmodules have part number CSR1010 and was used as is. The modifications done tothe BLE112 modules adds significant amounts of metal in the form of batteries. Thishas a high probability of changing the antenna characteristics, both directionality andattenuation. As the exact characteristic of the antenna is not part of this study, theimpact of any such effects are not taken into further consideration.
To receive the signals a TI CC2540 USB Evaluation Module Kit based on theCC2540 chipset was used. The receiver was connected to a personal computer viaan USB extension cord to give flexibility in beacon placement, as well as moving itaway from the laptop which otherwise might act as an RF shield.
3.2 Software
3.2.1 Receiver
The main part of the software resides in the the receiver controller. The receiver itselfruns a very small C-program that passes raw BLE packets between the computer itis attached to and the BLE host controller. The controller program acts as a virtualserial port, which the program on the computer interfaces with. Packets are sent asraw streams of data and needs to be decoded in software before being useful.
To maximize code recycling a small library was written to handle the basic functionsneeded in all the experiments, such as initializing the host controller, initializing theradio and enabling/disabling of scanning. Limited support to properly encode anddecode packets were added, but was quickly abandoned as it proved time consumingand there was no real benefit for the kind of positioning system implemented here. Thelibrary also contains classes to handle fingerprints, fingerprint maps and beacons.
The fingerprint map contains an array of fingerprint objects and the means to com-pare them for likeness. This class might be considered a singleton, as it only makessense to have one map active at any one time.

3.3 Algorithm 20
The fingerprint object contains the RSSI readings of the broadcast signals from thebeacons used while creating it. The beacon is stored with its name and its broadcastID. The broadcast ID is simply a small message sent with each broadcast as to identifythe beacon. Using a user selectable key like this rather than something unique like thedevice Universal Unique IDentifier (UUID) or serial number should make it easier toreplace failing beacons in the field.
For the initialization part, a so called magic packet has to be sent to the BLEcontroller for it to wake up. This was not documented in the Bluetooth standardsdocument, as it is left as a vendor specific procedure. It was not fully documented inthe development manual for the CC2540 chipset either, instead it suggested the use ofthe pre-compiled BLE-stack. As the BLE-controller already was loaded with the serialpass through firmware, this was not an option. Therefore, a sample program from TIwas loaded and the serial port monitored. The initialization procedure was capturedto a file as a byte stream. Looking at the stream and comparing with the developersdocumentation the initialization packages were extracted and inserted as part of thelibrary. As this was done without any regard to parameters sent, it is not known ifthe radio is operating in the same mode or with the same parameters as it would if ithad been initialized by the BLE software stack provided for use in production code.As the communications worked, no further investigation of the initialization procedurewas performed and no problems were found that could be traced back to it.
One central part that was common to all of the experiments was the decoding ofannounce packets. These packets were sent from the beacons and the library extractedthe beacon name as well as RSSI value. These were the only values used in the majorityof the experiments. As such, any impact of errors during initialization should impactall the experiments in an equal way.
3.2.2 Beacon
The beacons run a program that continuously broadcast their ID and then sleeps for500 ms. The broadcast was intended to only be sent on the lowest of the three availablechannels. Because of the different hardware platforms used, the exact same programcould not be used for all beacons, instead three different programs were written. Asthe complexity of the programs are low, this should not affect the overall system per-formance.
The idea behind the decision to use only one announce channel is to minimize thespread caused by slight variations in channel properties for different frequencies. Thisalso lowers the fingerprint complexity, as each beacon otherwise must be consideredthree times, one for each frequency.
3.3 Algorithm
The first positioning algorithm implemented was a naive approach, simply selectingthe fingerprinted location that had the least Manhattan-distance from the currently

3.3 Algorithm 21
measured one. The Manhattan-distance is calculated according to:
d =n∑
i=0
|mn − fn|
Where mn is the currently measured RSSI value and fn is the stored RSSI value from thetime of fingerprint mapping. During mapping, 120 values were collected using 6 beacons,meaning an average of 20 values per beacon was used to calculate the average RSSI.To achieve lower response time when positioning, each point is measured collecting24 values, or 4 per beacon, before reporting an estimated position and restarting datacollection. Each measurement is then saved as a fingerprint, making it simple to retrieveit at a later moment and to try different algorithms or distance methods, such as usingthe Pythagorean formula to calculate distance instead of the Manhattan distance.

Chapter 4
Test setup
All measurements were carried out within an indoor office landscape environment withlarge open spaces and no individual offices. The beacons were placed around the perime-ter of the area chosen for the experiment. The receiver was connected to a laptop andput on a rolling table cart, to ensure that the height would remain unchanged during allmeasurements. As the setup consisted of a laptop it means it was also battery poweredenabling free movement and removing any error introduced by needing to also move apower adapter around.
The whole area to be mapped was measured in a 1m x 1m grid, the same distancethe fingerprints were indexed with, with each intersection marked with a sticker forreference. These stickers were lined up with a marker placed on the rolling cart foreach measurement. The stickers remained for the whole duration of the fingerprintmeasurements to make sure the same reference was used both for mapping and forpositioning.
4.1 Ranging
The first group of tests are the ranging tests to evaluate the RSSI-distance relationshipfor the equipment and environment selected. They also form the foundation for theapproximation of fingerprint density, described in 4.2.1. The setup had the receiverconnected to both a laptop on the rolling table cart and to stationary computer withthe transmitter put on the cart. In both cases, precautions were taken to ensure that theradio environment remained undisturbed during the experiment. That meant ensuringno other persons moving in the area of the experiment and completing whole runs ofmeasurements to not be impacted by furniture rearrangement.
4.2 Fingerprinting
The fingerprinting tests were performed in a small part of an office building. A gridwith a point distance of 1m was measured and marked in the area as illustrated infig 4.1. All points were then mapped, or fingerprinted, in four major directions. Eachfingerprint consists of 120 measurements, 20 per beacon. This value is then averagedand saved together with coordinate and direction for later use.

4.2 Fingerprinting 23
Figure 4.1: Drawing of area used for measurements. Each fingerprint is marked with a reddot. The distance between the points are 1m
4.2.1 Fingerprint density calculation
To determine the highest density of unique fingerprint nodes in a radio map, it is usefulto estimate the amount of information contained in the RSSI readings that make upa fingerprint. Determining this would be of use when one is deploying or consideringdeploying a fingerprinting positioning system. It would give the minimum number ofbeacons needed, ensuring that hardware and installation costs are kept low, as wellas keeping the size of the radio map small. The size of the map becomes especiallyimportant if the device running the fingerprinting algorithm has limited processingpower and memory. Other benefits of having an estimate is to help determine if afingerprinting solutions is feasible at all for some applications, given accuracy, reliabilityand cost constraints.
The limit in information obtainable from the RSSI readings stem from severalsources, such as random noise during measurements, limited discoverable range andexternal RF interference. As the RSSI reading is not a central function in neither Blue-tooth classic or BLE, none of the manufacturers specify the expected resolution of thereading or the noise associated with the readings. With no data on the expected errorand resolution of this value from the vendor, an approximation of the resolution anderror based on measurements needs to be performed. These measurements are takenfrom the ranging tests.
The standard deviation of the RSSI measurement is calculated from several mea-surements, using different transmitters at different distances. For each transmitter anddistance several measurements are to be taken. From these measurements the aver-age and approximate standard deviation should be calculated. If the behavior of thereadings appear normal distributed, this model can be used to calculate a theoreticalmaximum density of fingerprints. This would be of use when installing such a system,

4.2 Fingerprinting 24
as the hardware cost would be known and the accuracy could be estimated. The pro-posed method for calculating maximum density is iterative, starting with the lowestvalue:
q0 − s0 = RSSImin
Where RSSImin is the lowest RSSI reading possible. q0 is the center of the first rangethat covers the lowest value of the available RSSI measurement range. The followingranges would be chosen as:
qn+1 = qn + 2sn + 2sn+1
This means that the center of the next range would be chosen to not overlap with theprevious range. This is repeated until the whole RSSI range is covered.

Chapter 5
Evaluation
5.1 RSSI Distribution
The first series of results were used to determine the distribution of the errors in RSSIreadings. The theoretical work on RSSI resolution has been based on the assumptionthat the error was normal distributed, but, as can be seen and shown from the resultsthat is not the case. Each set of measurements consisted of a total of 1000 readings.The beacon was placed at a fixed distance from the receiver and no moving objectswere present within 20m during the measurements.
0
50
100
150
200
250
300
350
-70 -65 -60 -55 -50 -45 -40
Num
ber o
f rea
ding
s
RSSI/dBm
RSSI readings CSR
Figure 5.1: Distribution of RSSI readings from CSR1000
Visual inspection of the distribution indicates that it is not normal distributed. Thethree distinct readings in each measurement indicate that the distribution is not causedprimarily by random noise. Even though the transmitters should only have transmittedat one frequency, they all transmitted at all three of the available broadcast channels.Since the channels differ in frequency, the channel properties, in this case attenuation,is clearly visible. This theory was further investigated and confirmed by looking at theindividual data packets, all broadcasts channels were used. The varying channels dohave implications for the fingerprinting system, as the readings are split between threedifferent values where just one was expected.
The cause of the unwanted transmission was not further investigated and as thereare three different programs controlling the beacons involved, it is not clear if this isa hardware limitation or a software bug. The cause might be different on the threeplatforms used.
The results also meant that the idea of dividing the RSSI range into smaller rangesto calculate the fingerprint density and information carried in the measurements was
5.2 Fingerprinting accuracy 26
0
100
200
300
400
500
600
-70 -65 -60 -55 -50 -45 -40
Num
ber o
f rea
ding
s
RSSI/dBm
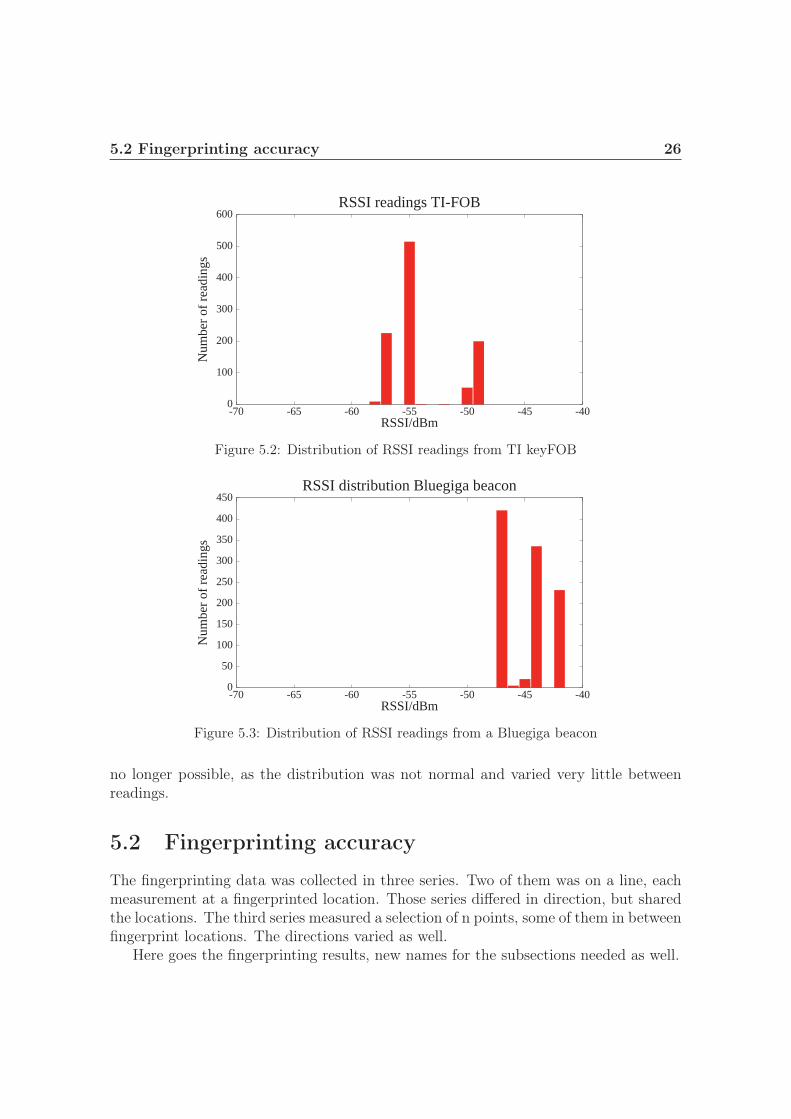
RSSI readings TI-FOB
Figure 5.2: Distribution of RSSI readings from TI keyFOB
0
50
100
150
200
250
300
350
400
450
-70 -65 -60 -55 -50 -45 -40
Num
ber o
f rea
ding
s
RSSI/dBm
RSSI distribution Bluegiga beacon
Figure 5.3: Distribution of RSSI readings from a Bluegiga beacon
no longer possible, as the distribution was not normal and varied very little betweenreadings.
5.2 Fingerprinting accuracy
The fingerprinting data was collected in three series. Two of them was on a line, eachmeasurement at a fingerprinted location. Those series differed in direction, but sharedthe locations. The third series measured a selection of n points, some of them in betweenfingerprint locations. The directions varied as well.
Here goes the fingerprinting results, new names for the subsections needed as well.

5.2 Fingerprinting accuracy 27
0
50
100
150
200
250
300
350
400
450
-70 -65 -60 -55 -50 -45 -40
Num
ber o
f rea
ding
s
RSSI/dBm
RSSI distribution Bluegiga beacon second series
Figure 5.4: Distribution of RSSI readings from a Bluegiga beacon, second series
5.2.1 Fingerprinting - Nearest neighbor
In the most basic form, the system creates a fingerprint at the current position andthen compares it to the ones stored in the fingerprint map. The one with the leastmanhattan distance, as described in x.x, is then chosen as the estimate. For a perfectsystem, the maximum error in position is the grid size of the fingerprint map dividedby sqrt(2).
Three runs of tests were made. The first two runs consisted of the cart orientedin one direction and moved in a straight line while maintaining the same direction.Stops were made every 1m and 0.5m respectively. The last run was at four randomlychosen points in the grid. At each point, all four directions were tested. The resultsare summarized in the table below.
Test n Dir. hit Pos. hit Dir + Pos hit Avg pos. error Avg FP scoreLine 1 13 31% 23% 15% 1.3m 14Line 2 14 21% 36% 7% 1.4m 3Points 16 57% 14% 14% 1.9m 9
Table 5.1: Results from nearest neighbor tests
Where n is the sample size of the test, "Dir. hit" is the percentage of correctdirectional estimates, "Pos. hit" the percentage of correct position estimate and "Dir+ Pos hit" the combination of the two. Average positioning error expressed in metersfollows, as well as the average fingerprint score. Lower score means a more likelymatch was found, as described in 3.3. The positional hit rate is counted as either acomplete hit or a miss. A hit would be a fingerprint within 1/sqrt(2) m from the realposition. The reason for using this tolerance is that the line 2 test was performed with0.5m increments, putting half of the measurements between valid positions. For the

5.2 Fingerprinting accuracy 28
directional accuracy, as only four possibilities exist, only exact matches count. Lastlythere is the fingerprint score. The score is the calculated as the manhattan distancebetween the real position and the best matching fingerprint. Lower score indicatesbetter accuracy.
The average position error is lower than expected, but as the sample size is low, thenumbers should only be taken as indication as to possible performance. The conditionswere made as close to ideal as possible, no persons or moving objects were permittedin the area close to the measurements. The cart was also fixed in it’s layout andoperated by the same person during all the tests as to not change the characteristicsof the receiver. All this was done to make the experiments repeatable and have fewerunknowns, at the cost of similarity to a realistic scenario.
Not only do the accuracy results seem promising, the frequency dependence observedin the results presented in section 5.1 does not seem to impact the performance of thefingerprinting system too much. The results in 5.4 showed that a 10dB differencebetween the strongest and weakest channel was possible. With only 4 measurementsduring the test runs these differences could possibly make a big impact on the fingerprintscore, which is the sole determining factor for estimated position.

Chapter 6
Conclusion
The results as presented in the previous chapter indicates that fingerprinting is viablefor indoor positioning using BLE. Success was shown in a limited indoor area, althoughwith some caveats.
The data suggests that BLE is suitable for simple positioning systems where accu-racy is of low priority and low power consumption and low implementation cost is ofhigher importance. This is reflected in the commercial offerings that exist in the area,such as iBeacon. Such systems are expected to offer functionality similar to proximitybased ones, albeit with limited ranging functionality.
With of the shelf hardware a fingerprinting system was constructed. The systemas implemented worked and did provide the desired accuracy for a limited set of tests.The results are better than a purely ranging based solution and should with someimprovements be able to perform similarly to WiFi based fingerprinting systems, withthe potential of a lower power consumption.
Detailed power consumption could not be measured with the equipment available,but is estimated that with two AA cells rated at about 3Wh each the battery life forthe beacons in a fingerprinting solution should measure in years.

Chapter 7
Discussion
7.1 Future works and use of BLE for positioning
There are several points for improvement in a BLE positioning system. For a finger-printing system, the main points of improvement are
7.1.1 Algorithm tuning
Fine tune the algorithm for fingerprint comparison and classification or change it com-pletely. During this project a simple method to compare fingerprints was used, whileit has been shown[8] that more advanced methods yield better results.
7.1.2 Beacon placement strategy and density
Determine how dense beacons need to be placed for best performance. There is apossibility that too many beacons in a small area only adds to noisy measurements anddegrades performance. It would also need to be clear before a commercial deploymentto be able to calculate cost and power consumption of a full scale system. This needs tobe done for different radio environments to get enough spread of the data, to determineworst case and best case scenarios.
7.1.3 Determine useful fingerprint density
Determine the practical density of fingerprint locations to be mapped. Too many fin-gerprints adds more data but might not necessarily increase accuracy but only increaseimplementation cost and the size of the fingerprint database.
7.2 BLE Proximity based positioning
There are however many downsides for fingerprinting at a larger scale. The extra accu-racy gained might not be needed and simpler proximity or ranging-based systems couldbe used instead lower the cost of a complete system. The implementation cost of finger-print is directly proportional to the area covered given a fixed density of fingerprints.This suggests that a pure fingerprinting system rarely would be the first choice forindoor positioning. However, utilizing some of the concepts from fingerprinting mighthelp improve other solutions.
One such possibility is to utilize an overlapping quantized ranging model, where theRSSI from several beacons are utilized to determine the users location, similar to anoverlapping proximity system, but using the fact that RSSI can be mapped to distance,

7.2 BLE Proximity based positioning 31
albeit with low accuracy. Such a system would have practically no extra cost comparedto a purely proximity based one, but still provide accuracy that could be good enough ifthe position only needs to be determined at room level or similar. This kind of systemcould also be used as a simple fingerprinting system later on, if the extra accuracyis needed. It could also be used as a hybrid system, where most of the locations aredetermined by the simple overlap, but some problematic locations are manually mappedand stored ahead of use as to improve accuracy.

Bibliography
[1] Department of Defense. Global Positioning System standard positioning serviceperformance standard, fourth edition, 2008.
[2] Bluetooth Special Interests Group. Bluetooth Core Specification Version 4.0, firstedition, 2010.
[3] Mikkel Baun Kjærgaard. Indoor positioning with radio location fingerprinting.arXiv preprint arXiv:1004.4759, 2010.
[4] Konrad Lorincz and Matt Welsh. Motetrack: A robust, decentralized approachto rf-based location tracking. In Location-and Context-Awareness, pages 63–82.Springer, 2005.
[5] Cemin Zhang, Michael Kuhn, Brandon Merkl, Mohamed Mahfouz, and Aly EFathy. Development of an uwb indoor 3d positioning radar with millimeter accu-racy. In Microwave Symposium Digest, 2006. IEEE MTT-S International, pages106–109. IEEE, 2006.
[6] Josef Hallberg, Marcus Nilsson, and Kåre Synnes. Positioning with bluetooth. InTelecommunications, 2003. ICT 2003. 10th International Conference on, volume 2,pages 954–958. IEEE, 2003.
[7] Antti Kotanen, Marko Hannikainen, Helena Leppakoski, and Timo D Hamalainen.Experiments on local positioning with bluetooth. In Information Technology: Cod-ing and Computing [Computers and Communications], 2003. Proceedings. ITCC2003. International Conference on, pages 297–303. IEEE, 2003.
[8] Anja Bekkelien, Michel Deriaz, and Stéphane Marchand-Maillet. Bluetooth indoorpositioning. Master’s thesis, University of Geneva, 2012.
[9] Bluetooth Special Interests Group. Bluetooth Core Soecification Version 3.0, firstedition, 2009.
[10] Lin Ji. Increasing accuracy of location determination: Exploiting phase changereconstruction and timing measurements. Master’s thesis, Royal Institute of Tech-nology, 2007.
[11] Ye et al. Experimental impulse radio ieee 802.15.4a uwb based wireless sensorlocalization technology. ISSC 2011, 2011.
[12] Alan Bensky. Wireless positioning technologies and applications. Artech HouseO,Norwood, MA, 2008.
[13] TI. Texas Instruments CC2541 Data sheet, revision d edition, 2012.
[14] Bluegiga. BLE112 Data sheet, fourth edition, 2014.

BIBLIOGRAPHY 33
[15] TI. Texas Instruments CC2540 Data sheet, revision f edition, 2013.
[16] Bluegiga. BLE112 Data sheet, fourth edition, 2014.

TRITA-ICT-EX-2015:27
www.kth.se