distance education at maryland colleges and universities
TRANSCRIPT

October 2007

MARYLAND HIGHER EDUCATION COMMISSION
Kevin M. O'Keefe, Chairman
Donald J. Slowinski, Sr., Vice Chairman
Victor E. Bernson, Jr.
Joann A. Boughman
Anne Osborn Emery
Anwer Hasan
Joshua L. Michael
James G. Morgan
Nhora Barrera Murphy
Emmett Paige, Jr.
Chung K. Pak
Paul L. Saval
James E. Lyons, Sr. Secretary of Higher Education
Martin 09Malley Anthony G. Brown Governor Lt. Governor

Introduction
This report discusses distance education (DE) activities of Maryland colleges and universities during calendar year 2006, as reported by the institutions. This data was collected in spring 2007 as a part of the regular postsecondary education data collection of the Maryland Higher Education Commission. Out-of-state institutions operating in the State were not included. "Distance education," as used here, refers to education or training delivered off-campus via electronic technologies, including video, audio, and computer-based instruction, where the students and the instructor are separated by physical distance and/or time. At least 50 percent of the instruction,interaction must occur utilizing a distance learning technology in order to be included in this collection. Distance education, by this definition, does not include courses conducted exclusively via traditional print-based correspondence or courses in which the instructor travels to a remote site to deliver instruction in person for all class meetings.
In the fall of 2006, an intersegmental workgroup convened to redesign the Distance Education Survey. The instrument was streamlined, definitions tightened, and the timeframe of the data collected was changed to cover a calendar year as opposed to previous academic year. These changes were adopted in order to bring the Maryland Higher Education Commission's survey into alignment with the data requirements of the Southern Regional Education Board's annual data collection and to reduce the reporting requirements for institutions.
In previous collection years, the Distance Education Survey was based on an academic year timeframe, including the fall of a given year and the spring of the subsequent calendar year. All data was reported as aggregated information of these two terms. Winter and/or summer term activity was not included in these collections. As a result, enrollments in the previous survey reflect fall and spring counts only; those in the current survey represent winter, spring, summer and fall counts. In addition, in past data collections, the course count was not unduplicated. The course count consisted of the sum of two unduplicated terms. An example will illustrate this point. In the prior survey, if English 101 were offered once in the fall and once in the spring, it would have counted as two different courses even though it were the same course offered in two different terms. In the current survey, English 101 would count as a single course regardless of the number of terms it were offered. These changes made in the survey form make comparisons with data collected in prior years inappropriate because the frame of reference was altered markedly. However, the current instrument is now being administered on an annual, rather than biennial basis and, as a result, trend data will be presented again in future reports.
It is important to note that distance education is not for everyone. Certain institutions have made a policy decision that the provision of distance learning is not appropriate to their mission. In other cases, faculty members have decided that their discipline does not lend itself to distance learning.
-- Principal author: Pat Pscherer

I* Credit-Bearing Activity Measures
Credit Courses Offered by Distance Education Technologies
Courses: In CY 2006, Maryland colleges and universities offered 3,456 credit-bearing distance education courses. More than two-thirds of these (2,381 or 69 percent) were at the undergraduate level. Seventy percent of the credit-bearing undergraduate courses were at a community college, 28 percent at a public four-year campus, and three percent at a four-year independent institution. Of the 1,075 graduate courses available by distance education, 72 percent were offered at a public institution and 28 percent at an independent college or university.
More than two-thirds (69 percent) of Maryland degree-granting institutions offered at least one course delivered via a distance education technology. As shown in Table 1, each of Maryland's 16 community colleges offered credit-bearing DE courses. Eight of the community colleges offered over 100 different courses via distance education technologies, the largest number provided by Anne Arundel Community College (1 99 courses), College of Southern Maryland (1 87 courses), and Community College of Baltimore County (1 78 courses). Eleven of the 13 public four-year campuses (all of which were campuses of the University System of Maryland) offered credit-bearing DE courses. University of Maryland University College (UMUC), which specializes in online education aimed at adult students, led by far with 660 credit-bearing DE courses, over three times more than any other institution in the State and nearly 20 percent of the State total. Only two of the other public four-year institutions offered more than 100 credit- bearing DE courses: Towson (209) and University of Maryland College Park (UMCP) (135). Fourteen independent colleges and universities offered credit-bearing DE courses. Johns Hopkins University (146 courses) and Capitol College (68 courses) accounted for almost 60 percent of the credit-bearing DE courses offered by independent institutions in CY 2006.
Table 1. Distance Education Credit-bearing Courses: Calendar Year 2006
Coll. of So. MD
Howard
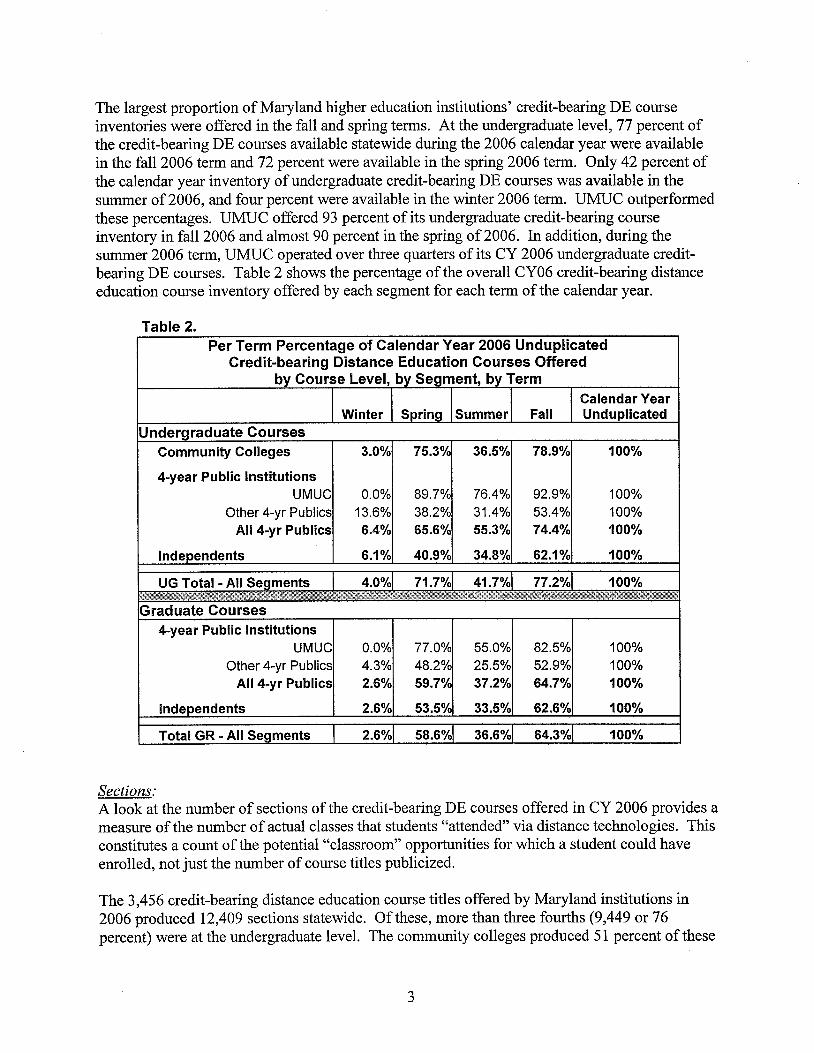
The largest proportion of Maryland higher education institutions' credit-bearing DE course inventories were offered in the fall and spring terms. At the undergraduate level, 77 percent of the credit-bearing DE courses available statewide during the 2006 calendar year were available in the fall 2006 term and 72 percent were available in the spring 2006 term. Only 42 percent of the calendar year inventory of undergraduate credit-bearing DE courses was available in the summer of 2006, and four percent were available in the winter 2006 term. UMUC outperformed these percentages. UMUC offered 93 percent of its undergraduate credit-bearing course inventory in fall 2006 and almost 90 percent in the spring of 2006. In addition, during the summer 2006 term, UMUC operated over three quarters of its CY 2006 undergraduate credit- bearing DE courses. Table 2 shows the percentage of the overall CY06 credit-bearing distance education course inventory offered by each segment for each term of the calendar year.
Table 2. Per Term Percentage of Calendar Year 2006 Unduplicated
Credit-bearing Distance Education Courses Offered by Course Level, by Segment, by Term
I Calendar Year I Winter I Spring l~ummer l Fall 1 Unduplicated
Undergraduate Courses Community Colleges 3.00~1 75 .3~1 36.5%1 78.9%1 100%
4-year Public Institutions UMUC 0.0% 89.7% 76.4% 92.9% 100%
Other 4-yr Publics 13.6% 38.2% 31.4% 53.4% 100% All 4-yr Publics 6.4% 65.6% 55.3% 74.4% 100%
Independents 6.1%1 40.9%1 34.8%1 62.1%1 100%
Independents 100%
Total GR - All Segments 1 2.6%1 58.6%( 36.6%1 64.3%( 100%
Sections: A look at the number of sections of the credit-bearing DE courses offered in CY 2006 provides a measure of the number of actual classes that students "attended" via distance technologies. This constitutes a count of the potential "classroom" opportunities for which a student could have enrolled, not just the number of course titles publicized.
The 3,456 credit-bearing distance education course titles offered by Maryland institutions in 2006 produced 12,409 sections statewide. Of these, more than three fourths (9,449 or 76 percent) were at the undergraduate level. The community colleges produced 5 1percent of these

sections, and the public four-year institutions represented nearly all of the rest. UMUC's offerings accounted for 87 percent of the undergraduate sections provided by the four-year public segment and 4 1 percent of all of the undergraduate sections available statewide. Maryland institutions offered 2,960 sections of graduate level credit-bearing courses by distance education, 83 percent of which were at a public four-year college or university. A large majority (79 percent) of the sections at the public four-year institutions were at two institutions: UMUC and Towson. Of the 640 distance education sections at the independent campuses, 79 percent were available at the graduate level. The vast majority of these were at Capitol College, Johns Hopkins University, and Goucher College. Table 3 provides the section count of credit-bearing DE courses available in CY06 by segment and institution.
On average, most institutions offer one to two sections of their credit-bearing DE courses per term and two to three sections on average over the course of the calendar year. This is true both at the undergraduate and graduate course level. A notable exception is UMUC. UMUC's large credit-bearing course inventory and section counts produce, at the undergraduate level, an ,
average of five sections per course in the fall and spring and three sections in the summer. Over the calendar year, UMUC's average number of undergraduate sections is 11.

Table 4. Average Number of Sections Per
Credit-bearing Distance Education Course by Course Level, by Segment, by Term
Calendar Winter Spring Summer Fall Year
Undergraduate Sections Community Colleges 1 2 2 2 3
4-year Public Institutions UMUC -- 5 3 5 11
Graduate Sections 4-year Public Institutions
UMUC -- 2 2 2 5 Other 4-yr Publics 1 2 2 1 2
All 4-yr Publics 1 2 2 2 3
Independents I 2 1 2 2
Total GR - All Segments I 1 2 2 2 3
Credit Enrollment in Distance Learning Courses
The Commission's survey collects both duplicated enrollments (hereafter referred to as "enrollments") and unduplicated enrollments (described as "headcount"). Enrollments represent the number of student course registrations. For example, if a student registers for two courses in the spring of a given calendar year and three courses in the subsequent fall term, it is tallied as five enrollments in that calendar year. Headcount in distance education courses provides a student profile. Headcount represents the number of students taking DE courses; enrollment reflects their registrations in DE courses.
Enrollments: In calendar vear 2006, students amassed almost 233,000 enrollments in credit-bearing distance education courses from Maryland institutions. More than three-quarters of these enrollments, accounting for just over 180,000 registrations, were at the undergraduate level, while graduate- level credit-bearing DE enrollments approached 53,000. Thirty-nine percent of the undergraduate credit-bearing distance education enrollments were registrations at Maryland's community colleges. The community colleges with the largest credit-bearing DE enrollments were Anne Arundel Community College, Community College of Baltimore County, Montgomery College, Prince George's Community College, and the College of Southern Maryland (8,074). The four-year public institutions generated 60 percent of the undergraduate enrollments and 66 percent of the total enrollments in credit-bearing DE courses. These figures

II
II I 1
are due chiefly to distance education enrollments at UMUC. UMUC accounted for 54 percent of the undergraduate statewide DE enrollments and almost 57 percent of ALL credit-bearing DE enrollments at Maryland institutions in CY 2006. The independent institutions contributed less than one percent of the undergraduate enrollments and 4 percent of total enrollments in calendar year 2006, with nearly three-fourth (73 percent) of these registrations originating at Johns Hopkins University and Capitol College. Table 5 presents the enrollment counts in credit-bearing distance education courses in CY06 by segment and institution.
Table 5.
Anne Arundel 1 10,661 @4 Coppi Carroll Cecil Coll. of So. MD Chesapeake Balt. Co. Balt. City Frederick Garrett Hagerstown Harford Howard Montgomery Prince George's
All CC's wor-wic
1 9,226 11 8,312 1831 1 70.430 k # jA11 4-1 1 , I 82 1k&j
vr Public 108.458 44.874
Average Class Size: By dividing the number of enrollments by the number of credit-bearing DE sections, an average class size can be generated. The average undergraduate class size for all higher education segments for the calendar year was 19. Smaller classes were found at community colleges and independent institutions and larger ones at public four-year campuses. At both the undergraduate and graduate course level, UMUC had more students per class. Table 6 presents the average class size for credit bearing DE courses by the courses' level, by segment and by term.

Table 6. Average Class Size in Credit-bearing Distance Education Courses
by Course Level, by Segment, by Term Calendar
Winter Spring Summer Fall Year Underaraduate Sections
4-year Public lnstitutions
Graduate Sections 4-year Public lnstitutions
UMUC Other 4-yr Publics
All 4-yr Publics
Independents
-- 12 12
2
23 11 18
I 0
22 12 18
14
23 11 19
9
23 11 18
I 0
Headcount: Statewide, a quarter of the undergraduates at a Maryland institution took at least one course via a distance education technology in calendar year 2006. There were sharp differences among the various higher education sectors. More than one-fifth of community college students (21 percent) and 16 percent of undergraduates at the public four year campuses outside of UMUC took at least one DE course. At UMUC, 92 percent of the undergraduates took at least one DE course during calendar year, and 73 percent of their undergraduates took only distance courses. Four percent of the undergraduates at the independent colleges and universities had at least one DE course. Statewide, at the graduate level, nearly one-third (3 1 percent) of students enrolled in at least one distance education course. This included 20 percent of the students at the public four-year campuses excluding UMUC and 1 1 percent of those at the independent institutions. In contrast, 95 percent of UMUC's graduate students took at least one DE course, and more than 8 in 10 took only distance courses. Table 7 provides a headcount profile detailing the course enrollment pattern of students in CY 2006 by student level, segment and enrollment pattern.

Table 7. Undu~licatedCalendar Year 2006 Student Headcount Profile
by Student Level, by Segment, by Enrollment Pattern Traditional Traditional &
(Only) Distance Only Distance Mixed Undergraduate Students
Community Colleges 78.9% 6.3% 14.9%
4-year Public lnstitutions UMUC 7.9% 72.9% 19.2%
Other 4-yr Publics 83.6% 0.2% 16.2% All 4-yr Publics 62.4% 20.6% 17.0%
Independents 96.4% 0.4% 3.2%
Graduate Students $-year Public lnstitutions
UMUC 4.8% 81.2% 14.0% Other 4-yr Publics 79.7% 3.7% 16.6%
All 4-yr Publics 48.9% 35.6% 15.5%
independents 88.9% 8.6% 2.5%
GR Total - All Segments 68.7% 22.2% 9.0%
For both undergraduate and graduate students, summer was the most popular time to take at least one course via distance learning for the largest percentage of students. During the summer, many students are not physically on campus and find it more flexible and convenient to take a class by distance learning. Table 8 provides the percent of calendar year 2006 students enrolled in at least one DE course during a specific term.
Table 8. Percent of Unduplicated Student Headcount Enrolled in
At Least One Distance Education Course, CY 2006 By Student Level, by Segment, by Term
Calendar Year Winter Spring Summer Fall Unduplicated
Undergraduate Courses Community Colleges 18.3% 17.6% 21.2% 17.2% 21.2%
4-year Public lnstitutions UMUC -- 87.5% 86.9% 89.7% 92.1%
Other 4-yr Publics 6.6% 8.3% 8.2% 9.3% 16.4% All 4-yr Publics 6.6% 23.7% 33.7% 26.1% 29.4%
independents 9.2% 2.1% 5.0% 2.5% 3.6%
UG Total -A l l Segments I 10.0% 1 18.8% 1 25.0% 19.7% 1 24.8%

I
Table 8. Icont'd) 1 Percent of Unduplicated Student Headcount Enrolled in
At Least One bistance Education Course, CY 2006 By Student Level, by Segment, by Term
I Calendar Year I Winter I Spring l~ummer l Fall I Unduplicated Graduate Courses
4-year Public Institutions UMUC -- 90.4% 92.1% 92.3% 95.2%
Other 4-yr Publics 6.2% 12.6% 21.9% 12.1% 20.3% AII 4-yr Publics 6.2% 33.0% 49.5% 35.1% 37.3%
Independents 0.3% 9.2% 12.4% 10.1% 11.1%
GR Total - All Segments 1 4.3% 1 27.7% 1 38.6% 1 29.5% 1 31.2%
Student Credit Hours (Credit Courses onlv): Credit-bearing distance education courses accounted for 673,291 credit hours of enrollment, approximately 8 percent of the total credit hours generated at Maryland post-secondary institutions in CY06. Almost 10 percent of Maryland's community colleges' total calendar year credit hours originated from DE courses. While undergraduate distance education at UMUC accounted for almost 80 percent of their total credit hours, that percentage was less than 2 percent at the remainder of the State's public four-year institutions and less than one percent at the independent campuses.
About 78 percent of the total distance education credit hours were generated by courses at the undergraduate level. An overwhelming majority of the State's total undergraduate DE credit hours was generated at UMUC (52 percent) or the community colleges (40 percent). At the graduate course level, UMUC was responsible for 63 percent of the total credit hours enrolled in distance education courses, compared to 20 percent for all of the other public four-year institutions combined and 17 percent for the independent campuses. Table 9 provides the total number of credit hours in distance education courses by segment and by course level.
Table 9. CY 2006 Total Credit Hours of Enrollment All Distance Education Delivery Methods
By Segment, by Course Level
Community Colleges Undergraduate
21 1,721 Graduate
---
4-Year Publics
Other 4-yr publics All 4-year publics
UMUC 271,320 37,437
308,757
93,358 29,801
123,159
Independents 4,229 25,425
Total 524,7071 148,584
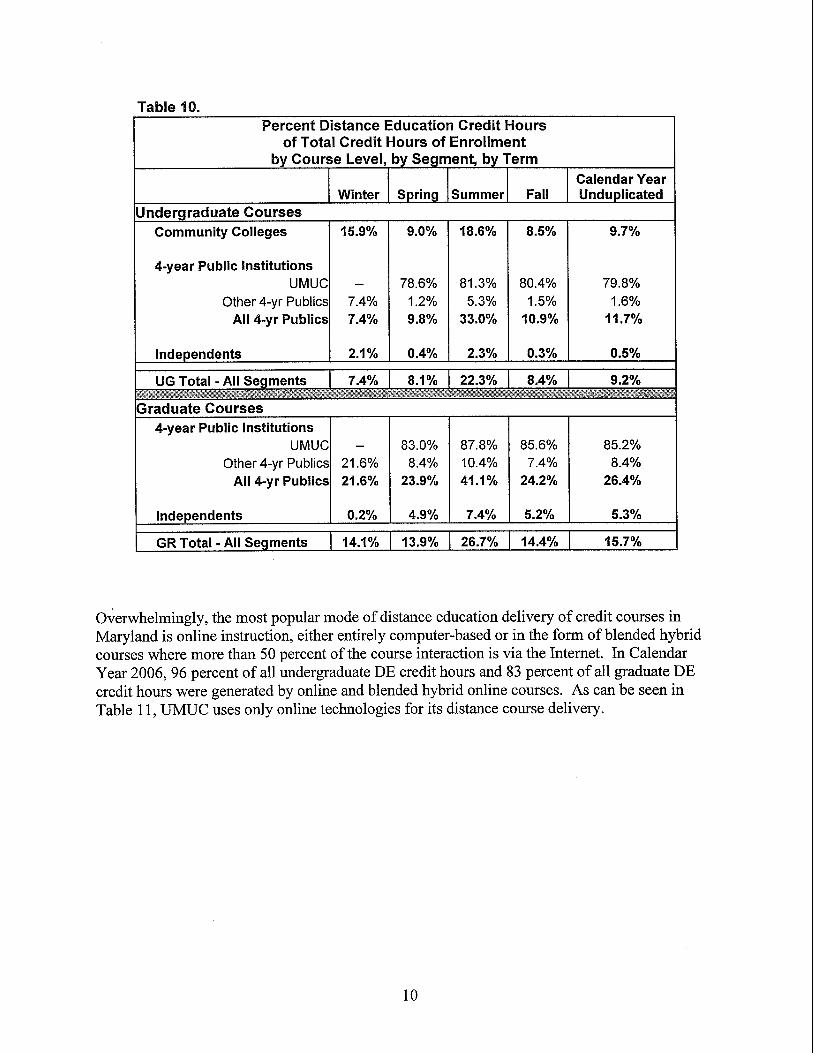
Table 110.
4-year Public Institutions
GR Total -All Segments 1 14.1% ( 13.9% 1 26.7% 1 14.4% 1 15.7%
Overwhelmingly, the most popular mode of distance education delivery of credit courses in Maryland is online instruction, either entirely computer-based or in the form of blended hybrid courses where more than 50 percent of the course interaction is via the Internet. In Calendar Year 2006,96 percent of all undergraduate DE credit hours and 83 percent of all graduate DE credit hours were generated by online and blended hybrid online courses. As can be seen in Table 1 1, UMUC uses only online technologies for its distance course delivery.

Table d I. Percent of Distance Education Credit Hours
of All Distance Education Credit Hours by Course Level, by Segment, by Delivery Method
Site-to-Site, All other Online and
Blended Hybrid 2-way
AudioNideo technology-mediated DE
Undergraduate Students Community Colleges 90.4% 3.9% 5.7%
4-year Public Institutions UMUC 100% 0% 0%
Other4-yrPublics 94.2% 0.7% 5.1%
Credit Degree Programs
Seventeen Maryland colleges and universities offered a total of 108 degree programs entirely via distance education, 36 of which were available exclusively via DE. Eight of Maryland's 16 community colleges offered degree programs entirely in the DE format while five public four- year institutions and four independent institutions offered degree programs entirely via distance education.
Of the DE degree programs offered by Maryland campuses in CY06'42 percent were at the associate's level, 22 percent at the bachelor's level, 34 percent at the master's level, and 2 percent at the doctoral level. Almost two-thirds of all bachelor's or graduate leveledegree programs in Maryland available entirely by distance education were offered by UMUC. Table 12 displays the number of degree programs available entirely via distance education from Maryland post-secondary institutions.

Table 12. Degree Programs Offered Entirely via Distance Education
Calendar Year 2006 by Degree Level, by Segment Community Other Public Total Degree
Colleges UMUC 4-years Independents Programs Associate 45 45 Bachelor's 21 2 1 24 Master's 19 8 10 37 Doctorate 1 1 2 Total 45 4 1 11 11 108
II. Non-Credit Activity Measures
In the calendar year 2006, the only institutions in Maryland that offered non-credit courses via distance education technologies were the community colleges. All but Anne Arundel Community College offered non-credit distance education courses. Combined, the community colleges offered over 4,000 sections of almost 1,500 course titles and recorded almost 6,500 registrations in non-credit DE courses. The average class size was between one and 2 students per section. Many of these courses are self-paced; the performance of students in many of them is evaluated by computer and without the involvement of an instructor.
1Wor-Wic 105 219 265
2All CC's 1,461 4,108 6,452