dissertation becker
TRANSCRIPT

University of Bayreuth
Chair of Environmental Chemistry and Ecotoxicology
Perfluorooctanoic Acid (PFOA) and Perfluorooctane Sulfonate (PFOS)
in an Aquatic Ecosystem - Distribution and Fate
Dissertation
Faculty of Biology, Chemistry and Geosciences
University of Bayreuth
Anna Maria Becker
Bayreuth, 2008

Die vorliegende Arbeit wurde in der Zeit vom 15.11.2004 bis 30.06.2008 in der Forschungs-
stelle Umweltchemie und Ökotoxikologie unter der Betreuung von Herrn Prof. Hartmut Frank
angefertigt.
Vollständiger Abdruck der, von der Fakultät für Biologie, Chemie und Geowissenschaften der
Universität Bayreuth genehmigten Dissertation zur Erlangung des akademischen Grades eines
Doktors der Naturwissenschaften (Dr. rer. nat.).
Promotionsgesuch eingerichtet am: 02.10.2008
Tag des wissenschaftilichen Kolloquiums: 03.12.2008
Prüfungsausschuss:
Prof. Hartmut Frank (1. Gutachter)
Prof. Stefan Peiffer (2. Gutachter)
Prof. Cornelius Zetzsch (Vorsitz)
Prof. Helmut Alt
Prof. Karlheinz Seifert

For Alex
Acknowledgements
I would like to thank Prof. Dr. Hartmut Frank for giving me the opportunity to work at the
Chair of Environmental Chemistry and Ecotoxicology with such a challenging and exciting
topic as perfluorinated surfactants. His guidance and stimulating remarks were of great help
through the whole project.
Special thanks are directed to Dr. Silke Gerstmann for her engagement, support and scientific
discussions. She helped me realise what I am capable of and made sure I never forget it.
I am very grateful to Dr. Radomir Čabala for his assistance and tips related to the instrument.
I am thankful to Benjamin Schmidt for his active support in the laboratory and during sam-
pling campaigns.
Many thanks to Irmgard Lauterbach, Dr. Kamila Jakubowska-Świtaj, Dr. Franziska Knabe,
Monika Weckert, Joanna Znaleziona, Magdalena Suchan, Katja Bäuml, Michael Heyers,
Stefan Will, Agnes Bednorz and other colleagues from the Chair of Environmental Chemistry
and Ecotoxicology for their support and good working atmosphere.
Financial support of the Bayerische Forschungsstiftung is acknowledged.
I would like to express my gratitude to Dr. Klupp and the employees of the Bavarian Fishery
Association and of the waste water treatment plant of Bayreuth for their cooperation.
Last but not least I could not forget to thank my husband and parents for their constant sup-
port and belief in me.

Table of Content
Table of Content
Table of Content ...................................................................................................................... I
List of Publications and Author’s Contribution................................................................ III
List of Abbreviations..............................................................................................................V
List of Tables........................................................................................................................VII
List of Figures .................................................................................................................... VIII
Summary ............................................................................................................................... IX
Zusammenfassung ................................................................................................................ XI
1 Introduction .....................................................................................................................1
1.1 Perfluorinated Surfactants (PFSs) – Background, Production and Use ........................1
1.2 Physico-Chemical Properties of PFOA and PFOS........................................................3
1.3 Sources of PFOA and PFOS in the Environment..........................................................4
1.4 Environmental Concentrations of PFOA and PFOS .....................................................4
1.4.1 Air and Precipitation...............................................................................................5
1.4.2 Aquatic Samples ......................................................................................................6
1.4.3 Solid Matrices..........................................................................................................8
1.4.4 Biota ......................................................................................................................10
1.4.4.1 Concentrations in Biological Samples.........................................................10
1.4.4.2 Temporal Trends .........................................................................................13
1.4.5 Humans..................................................................................................................14
1.5 Toxicity........................................................................................................................16
1.5.1 Bioaccumulation and Biomagnification Potential ................................................16
1.5.2 Ecotoxicity .............................................................................................................18
1.5.3 Human Toxicity and Health Risk Assessment........................................................19
1.6 Analytical Methods for PFOA and PFOS Determination ...........................................21
1.6.1 Historical Analytical Methods...............................................................................21
1.6.2 Analysis of Air Samples .........................................................................................22
1.6.3 Analysis of Aqueous Samples ................................................................................23
1.6.4 Analysis of Solid Matrices .....................................................................................24
1.6.5 Analysis of Biota and Human Samples..................................................................25
2 Aim of the Work ............................................................................................................27
I
Table of Content
3 Optimised Analytical Procedures ................................................................................28
3.1 Sample Preparation Procedures ...................................................................................28
3.1.1 River and Waste Water ..........................................................................................28
3.1.2 Sludge and Sediment..............................................................................................28
3.1.3 Fish ........................................................................................................................29
3.2 HPLC-ESI-MS/MS......................................................................................................29
3.3 Quantification ..............................................................................................................29
3.4 Sampling Campaigns...................................................................................................30
3.4.1 River Water, Waste Water and Sludge ..................................................................30
3.4.2 Sediment ................................................................................................................30
3.4.3 Fish ........................................................................................................................30
4 Results and Discussion ..................................................................................................32
4.1 Optimisation of Analytical Protocols ..........................................................................32
4.2 River, Waste Water and Sludge...................................................................................33
4.2.1 River waters...........................................................................................................33
4.2.2 Liquid and solid wastes .........................................................................................34
4.3 Sediments ....................................................................................................................35
4.4 Fish ..............................................................................................................................36
5 Conclusions and Recommendations ............................................................................38
6 Publication I ...................................................................................................................40
7 Publication II .................................................................................................................45
8 Publication III ................................................................................................................52
9 Publication IV ................................................................................................................63
10 Publication V..................................................................................................................66
Bibliography....................................................................................................................... XIII
Ehrenwörtliche Erklärung .............................................................................................XXXI
II

List of Publications and Author’s Contribution
List of Publications and Author’s Contribution
The following cumulative doctoral thesis “Perfluorooctanoic Acid (PFOA) and Perfluorooc-
tane Sulfonate (PFOS) in an Aquatic Ecosystem - Distribution and Fate” is based on the sci-
entific publications listed below. Three of them are published and two others have been sub-
mitted for publication. Author’s contribution to each of them is given below.
Publication I
Weremiuk, A.M., Gerstmann, S., Frank, H. 2006. Quantitative Determination of Perfluori-
nated Surfactants in Water by LC-ESI-MS/MS. J. Sep. Sci. 29, 2251 – 2255.
Own contribution: idea (50 %), field work (80 %), laboratory work and data evaluation
(70 %), writing (70 %).
Publication II
Becker, A.M., Gerstmann, S., Frank, H. 2008. Perfluorooctane Surfactants in Waste Waters,
the Major Source of River Pollution. Chemosphere, 72, 115-121.
Own contribution: idea (70 %), field work (80 %), laboratory work and data evaluation
(85 %), writing (70 %).
Publication III
Becker, A.M., Suchan, M., Gerstmann, S., Frank, H. 2008. Perfluorooctanoic Acid and Per-
fluorooctane Sulfonate Released from a Waste Water Treatment Plant in Bavaria, Germany.
Submitted for publication to Environ. Sci. Poll. Res..
Own contribution: idea (90 %), field and laboratory work (30 %), data evaluation (50 %),
writing (80 %).
III

List of Publications and Author’s Contribution
Publication IV
Becker, A.M., Gerstmann, S., Frank, H. 2008. Perfluorooctanoic Acid and Perfluorooctane
Sulfonate in the Sediment of the Roter Main River, Bayreuth. Environ. Poll. In Press.
Own contribution: idea (80 %), field work (70 %), laboratory work and data evaluation
(90 %), writing (80 %).
Publication V
Becker, A.M., Gerstmann, S., Frank, H. 2008. Perfluorooctanoic Acid and Perfluorooctane
Sulfonate in Two Fish Species Collected from the Roter Main River, Bayreuth, Germany.
Submitted to Bull. Environ. Contam. Toxicol.
Own contribution: idea (80 %), field work (20 %), laboratory work and data evaluation
(90 %), writing (80 %).
IV

List of Abbreviations
List of Abbreviations
APPI-MS – atmospheric pressure photoionisation mass spectrometry
API – atmospheric pressure chemical ionisation
ASE – accelerated solvent extraction
BLfU – Bayerischer Landesamt für Umwelt, Bavarian State Office for Environment
dw – dry weight
EFC – electrochemical fluorination
ESI-MS/MS – electrospray ionisation coupled to tandem mass spectrometry detection
FTOHs – fluorotelomer alcohols
GC-ECD – gas chromatography coupled with electron capture detection
GFF – glass fibre filter
HPLC – high performance liquid chromatography
LC – liquid chromatography
LC-MS – liquid chromatography coupled to mass spectrometry
LOD – limit of detection
LOQ – limit of quantification
MeOH – methanol
na – not analysed
nd – not detected
NMR – nuclear magnetic resonance
NY – New York State
OECD – Organisation for Economic Co-Operation and Development
PFOA – perfluorooctanoic acid/ perfluorooctanoate
PFOS – perfluorooctane sulfonate
PFCs – perfluorocarboxylates
PFSs – perfluorinated surfactants
PFE – pressurised fluid extraction
POSF – perfluorooctanesulfonyl fluoride
PTFE – polytetrafluoroethylen
SPE – solid phase extraction
SPME – solid phase microextraction
TOF – time-of-flight
TOC – total organic carbon
V

List of Abbreviations
UK – United Kingdom
USA – United States of America
ww – wet weight
WWTP – waste water treatment plant
VI

List of Tables
List of Tables
Table 1. Physical and chemical properties of PFOA and PFOS................................................4
Table 2. PFOA and PFOS levels in air [pg/m3] and precipitation [ng/L]..................................6
Table 3. PFOA and PFOS levels in aquatic samples [ng/L]......................................................7
Table 4. PFOA and PFOS levels in solid matrices [µg/kg]. ......................................................9
Table 5. PFOA and PFOS levels in food samples [µg/kg ww]. ..............................................10
Table 6. PFOA and PFOS levels in biota [µg/kg wet weight, µg/kg dry weight or µg/L*].§ ..11
Table 7. PFOA and PFOS levels in humans [µg/L or µg/kg wet weight*]. ............................15
Table 8. A literature overview of BAF, BCFs, BMFs, and TMF. ...........................................17
Table 9. Recoveries [%] of the extraction procedures employed during the study. ................32
Table 10. LOQs of the extraction procedures employed during the study. .............................33
VII

List of Figures
List of Figures
Figure 1. Electrochemical Fluorination Process........................................................................2
Figure 2. Telomerisation Process. .............................................................................................2
Figure 3. Structural formulae of PFOA and PFOS....................................................................3
Figure 4. Temporal trend of PFOS in guillemot eggs, Baltic Sea, 1968 – 2003. ....................13
VIII

Summary
Summary
Perfluorooctanoate (PFOA) and perfluorooctane sulfonate (PFOS) belong to the fam-
ily of perfluorinated surfactants (PFSs). They are widely distributed and persistent in the envi-
ronment. For over 50 years, they have been used in numerous applications including paper
and textile treatment, production of fluoropolymers, cosmetics and insecticides formulations,
and fire fighting foams. They can enter the environment via direct and indirect emission
sources such as manufacturing processes, use of commercial products containing PFSs, re-
lease of waste waters or degradation of precursor substances.
Due to their physical-chemical properties, i.e. relatively good solubility, low volatility
and stability under environmental conditions, water bodies are important sinks for these
chemicals. The aim of this doctoral thesis was to elucidate sources, distribution and fate of
PFOA and PFOS in an aquatic ecosystem that is not directly affected by fluorochemical pro-
duction activity. The presented study was mainly focused on the river Roter Main, Bayreuth,
Germany, and gives a good picture of the behaviour of PFOA and PFOS in such an aquatic
ecosystem.
In order to achieve the main goal, suitable analytical procedures for reliable quantifi-
cation of trace amounts of the target analytes in different environmental matrices such as wa-
ter, liquid and solid wastes, sediments, biological tissues, were developed or optimised. Each
method included a solid-phase extraction step for analytes’ preconcentration and removal of
interfering matrix, followed by quantitative determination via high performance liquid chro-
matography coupled to electrospray ionisation tandem mass spectrometery (HLPC-ESI-MS).
Due to the possibility of ionisation suppression, isotope dilution or standard addition method
was applied.
Analysis of waste waters collected from four different waste water treatment plants
(WWTPs) located in Upper Franconia, Bavaria, Germany, showed that the largest plant
(Bayreuth) receiving waste waters of mostly commercial and industrial origin released the
highest amount of PFOA and PFOS, whereas the smallest plant (Himmelkron) treating waste
waters of only domestic source released the least. The monitoring of waste waters from the
WWTP Bayreuth enabled to estimate the typical mass flows of PFOA and PFOS into river
waters as about 1 and 5 g/day, respectively, showing that a plant of a medium-size, moder-
ately industrialised city can be a major source of river pollution.
IX

Summary
Detailed investigation of PFOA and PFOS concentrations in liquid and solid wastes
collected at different stages of the treatment process showed additional fluxes of these com-
pounds inside the plant, likely due to the decomposition of their precursors.
Analysis of sediments collected from the river receiving treated waste waters showed a
significant increase in concentrations of both analytes downstream the outlet of the plant (up
to 3- and 4-fold for PFOA and PFOS, respectively). PFOS concentrations were up to 40-fold
higher in sediments than in river water, showing its higher adsorption potential in comparison
to PFOA (max. sediment/water = 6).
Once in the river, PFOS, and to a lower extent PFOA, can bioaccumulate in aquatic
organisms. Although partially removed from water, they are still bioavailable for benthic or-
ganisms inhabiting the river thus entering the food chain. This was reflected in higher levels
found in river goby - in comparison to chub - feeding on invertebrates living in the sediment.
At the starting point of this doctoral thesis little information was available about envi-
ronmental contamination with PFOA and PFOS in Germany, and it is the first study per-
formed in Bavaria giving such a detailed picture of sources and fate of PFSs in a river ecosys-
tem.
X

Zusammenfassung
Zusammenfassung
Perfluorooctanoat (PFOA) und Perfluorooctansulfonat (PFOS) sind perfluorierte Ten-
side (PFT), die in der Umwelt weit verbreitet und persistent sind. Seit über 50 Jahren werden
sie vielfältig verwendet, z.B. zur Oberflächenbehandlung von Papier und Textilien, zur Pro-
duktion von Fluorpolymeren, in kosmetischen Produkten, in Insektiziden und zur Bildung
stabiler Schäume z.B. in Löschmitteln. Sie können auf direktem und indirektem Weg in die
Umwelt gelangen: aus Produktionsprozessen, bei der Verwendung kommerzieller, PFT-
enthaltender Produkte, über Abwasser oder durch die Zersetzung von Vorläufer-
Verbindungen.
Ihre physikalischen und chemischen Eigenschaften, ihre relativ gute Löslichkeit, nied-
rige Flüchtigkeit und Stabilität unter Umweltbedingungen, machen Gewässer zu wichtigen
Senken für diese Verbindungen. Ziel der vorliegenden Doktorarbeit war es, Quellen, Vertei-
lung und Verhalten von PFOA und PFOS in einem aquatischen Ökosystem zu untersuchen,
an dem keine Fluorchemikalien produziert werden. Die vorliegende Studie konzentrierte sich
hauptsächlich auf den Roten Main, Bayreuth, Deutschland, und gibt einen Einblick in das
Verhalten von PFOA und PFOS in einem typischen Fluss-Ökosystem.
Um das Hauptziel zu erreichen, wurden geeignete analytische Verfahren zur zuverläs-
sigen Quantifizierung der Zielverbindungen im Spurenbereich in den verschiedenen Um-
weltmatrices, Wasser, Abwasser, Klärschlamm, Sediment, tierische Gewebeproben, entwi-
ckelt oder optimiert. Alle Methoden beinhalten eine Festphasen-Extraktion zur Aufkonzent-
rierung der Analyten und zum Entfernen störender Matrix; die Quantifizierung erfolgte mit-
tels Hochleistungs-Flüssigchromatographie und Elektrospray-Ionisations-Tandem-Massen-
spektrometrie (LC-ESI-MS/MS). Zur Korrektur der möglichen Ionisations-Unterdrückung
wurde die Isotopen-Verdünnungs-Technik oder die Standard-Additions-Methode verwendet.
Abwässer vier verschiedener Kläranlagen in Oberfranken, Bayern, Deutschland, wur-
den untersucht. Die größte Anlage (Bayreuth), in der überwiegend kommerzielle und indus-
trielle Abwässer geklärt werden, trägt die höchsten Mengen von PFOA und PFOS in den Vor-
fluter ein, die kleinste Anlage (Himmelkron), in der nur häusliches Abwasser geklärt wird,
trägt die geringsten Mengen ein. Für die Kläranlage Bayreuth wurden die täglichen Massen-
frachten von PFOA und PFOS bestimmt, die in den Roten Main gelangen, sie betrugen ca.
1 g/Tag PFOA und 5 g/Tag PFOS. Außerdem können PFOA und PFOS während des Klär-
prozess aus Vorläufer-Verbindungen gebildet werden und sich zwischen wässrigen und festen
XI

Zusammenfassung
Stoffströmen verteilen. Abwässer aus kommunalen Kläranlagen können also eine Hauptquelle
der Umweltverschmutzung an PFOA und PFOS sein.
Die Analyse von Sedimenten des Vorfluters zeigte eine signifikante Zunahme beider
Analyten flussabwärts des Auslaufs der Kläranlage (3-fach für PFOA, 4-fach für PFOS).
PFOS-Konzentrationen in Sedimenten waren bis zu 40-mal höher als im Flusswasser, daran
zeigt sich sein, im Vergleich zu PFOA, höheres Adsorptionspotential (PFOA: max. Sedi-
ment/Wasser = 6).
Einmal im Vorfluter reichern sich PFOS und – in geringerem Maße – PFOA in der
Biota dieses Lebensraumes an. Auch adsorbiert ans Sediment sind sie für bentische Organis-
men bioverfügbar, wie die höhere Belastung der Gründlinge – im Vergleich zu Döbeln –
zeigt, die am Grund der Gewässer leben und sich von Invertebraten ernähren, die sie aus dem
Bodensediment filtrieren.
Zu Beginn dieser Doktorarbeit gab es nur wenige Informationen zur Umweltbelastung
mit PFOA und PFOS in Deutschland; dies ist die erste Studie, die sich detailliert mit Quellen
und Verhalten dieser Verbindung in einem aquatischen Ökosystem in Bayern beschäftigt.
XII

Introduction
1 Introduction
1.1 Perfluorinated Surfactants (PFSs) – Background, Production and Use
Perfluorooctanoic acid (PFOA) and perfluorooctane sulfonate (PFOS) belong to the
wide group of chemicals called perfluorinated surfactants (PFSs). Recently, they have re-
ceived a lot of attention due to their wide distribution in the environment (chapter 1.4). The
presence of strong C-F bonds makes them chemically and thermally very stable, resistant to
hydrolysis, photolysis, microbial degradation or metabolism (Kissa, 2001) resulting, on the
one hand, in their suitability for industrial and commercial applications and on the other hand,
in their persistence in the environment.
PFSs are fully anthropogenic; since the late 1940s they have been synthesised either
via electrochemical fluorination (ECF) or telomerisation (Schulz et al., 2003). Commercial
production of PFOA and PFOS in the United States has almost entirely been based on ECF
(Figure 1) (Schultz et al., 2003). During this inexpensive process, a mixture of isomers and
homologues with even and odd numbers of carbon atoms in the chain is obtained; about 30 %
of the products are branched (Giesy & Kannan, 2002). Perfluorooctanesulfonyl fluoride
(POSF) is the basic unit of the whole group of perfluoroalkyl sulfonate derivatives, as the
POSF-based polymers degrade ultimately to PFOS (Giesy & Kannan, 2002). The telomerisa-
tion process is used for the production of perfluoroalkyl carboxylates (PFCs) and fluorote-
lomer alcohols (FTOHs) yielding exclusively linear products of even numbers of carbon at-
oms (Figure 2) (Kissa, 2001). FTOHs are volatile and can degrade to PFOA.
Production volumes of these chemicals are difficult to estimate. According to Preven-
douros et al. (2006), estimated total global production of PFCs was 4400 – 8000 tons between
1975 – 2004. In 2005, the Organisation for Economic Co-Operation and Development
(OECD) published results of a survey conducted in 2003 on the production of perfluorinated
chemicals, based on responses received from 10 OECD-member countries (OECD, 2005),
stating total volumes imported and/or manufactured in the OECD were between 100 and
200 tons/a for PFOA and related chemicals and 30 tons/a for PFOS and related chemicals. At
the end of the last decade, the total global capacity for the production of perfluoroalkylated
substances by ECF process was estimated to be 4650 metric tons/year (UK Stage 4 Final Re-
port, 2004).
As the PFSs can lower the surface tension of water more efficiently than hydrocarbon-
based surfactants and are applicable under conditions that would be too severe for conven-
tional surfactants they have been used in numerous applications including treatment of textiles
1

Introduction
Figure 1. Electrochemical Fluorination Process.
Figure 2. Telomerisation Process.
+ 9 H2
+ H2O – HF
Production of PFOA (a) and PFOS (b) by Electrochemical Fluorination (EFC)
C7H15COCla)
C7F15COF + 7 H2 + HCl
+ 16 HF
+ H2O
C7F15COOH + HF
b)C8H17SH
+ O2
C8F17SO2F
+ 18 HF
CH2CH3
CH2CH2OH+ HN
PFOA
C8F17SO3-
PFOS
C8F17SO2NCH2CH3
CH2CH2OHH+
Perfluorooctane sulfonamido ethanol
Sales products, i.e. perfluoroalkylsulfonamide acrylates, perfluoroalkylsulfonamide ethoxylates, N-alkyl perfluorolkyl sulfonamide phosphates
Electric current: 5 – 7 V Temperature: 0 °C Anode: Ni Catode: Fe or Ni
Telomerisation
CF2 = CF2
F(CF2CF2)nI
F(CF2CF2)nCH2CH2I
F(CF2CF2)nCH2CH2OH
Sales products,
Fluorotelomer alcohols (FTOH)
Fluorotelomer iodide
Perfluoroalkyl iodide
Tetrafluoroethylen
i.e. PFOA, PFCs, perflurinatednoionic surfactants or phosphates
+
+ OH-
– I-
Telomerisation
CF2 = CF2
F(CF2CF2)nI
F(CF2CF2)nCH2CH2I
F(CF2CF2)nCH2CH2OH
Sales products,
Fluorotelomer alcohols (FTOH)
Fluorotelomer iodide
Perfluoroalkyl iodide
Tetrafluoroethylen
i.e. PFOA, PFCs, perflurinatednoionic surfactants or phosphates
+
+ OH-
– I-
2

Introduction
and paper, formulation of cosmetics and insecticides, production of fluoropolymers, for fire
fighting foams, as industrial surfactants, additives, and coatings (Kissa, 2001). Currently,
PFOS and related chemicals are used in fire fighting foams, aircraft hydraulic fluids, chro-
mium plating and as anti-reflective or photoresist agents in semiconductor photolithography
and as anti-static, surfactant or adhesion-control agents in photographic processes (OECD,
2005). Products containing PFOA have also been used in the industrial sector for metal coat-
ings, textile treatment, as additive for resins, for aqueous dispersion, or for glass fibre impreg-
nation (OECD, 2005).
1.2 Physico-Chemical Properties of PFOA and PFOS
PFOA and PFOS are synthetic organic chemicals consisting of a fully fluorinated car-
bon chain and a carboxylic group or sulfonate group, respectively (Figure 3).
F
F
FF
FF
FF
FF
FF
FF
FCOO- F
F
FF
FF
FF
FF
FF
FF
F
SO3-
F
F
PFOA PFOS
F
F
FF
FF
FF
FF
FF
FF
FCOO- F
F
FF
FF
FF
FF
FF
FF
F
SO3-
F
F
PFOA PFOS
Figure 3. Structural formulae of PFOA and PFOS.
They do not occur naturally in the environment, and due to their low pKa values, they
are present in solutions as anions at pH 7 (Table 1). For PFOA both forms, the free acid and
the anion, are present in the environment whereas PFOS only occurs in its anionic form.
PFOA and PFOS form multiple layers in octanol/water mixtures, making determina-
tion of the octanol-water partition coefficient (Kow) extremely difficult (Environment Agency,
2004; Prevendouros et al., 2006); it is also believed that the Kow in this case does not allow to
estimate the environmental partitioning of these compounds (Ellis et al., 2002).
Henry’s law constant is expected to be very low for perfluorooctanoate and relatively
high for the acid form of PFOA, so its volatilisation from water is pH dependant. PFOA and
PFOS are not expected to be volatilised significantly at environmental conditions; therefore
they will be bound to particles in the atmosphere (Prevendouros et al., 2006; OECD, 2002).
3

Introduction
Table 1. Physical and chemical properties of PFOA and PFOS.
PFOA 1) PFOS 2)
Molecular weight, g/moL 414.07 538.2 Vapour pressure at 25 °C, Pa 4.2 3.31 x 10⁻⁴
Solubility in pure water at 25 °C, mg/L 9500 3) 680 Melting point, °C 45 – 50 > 400 Boiling point, °C 189 – 192 not measurable pK 2 – 3 - 3.27 (calculated) a
1) free acid (Prevendouros et al., 2006; Boit, 1975); 2) potassium salt (OECD, 2002; Environment Agency, 2004); 3) solubility of the perfluorooctanoate.
In general, the limited amount of relevant physico-chemical property data makes the
application of classical methods for estimating the partitioning of these analytes in the envi-
ronment difficult.
1.3 Sources of PFOA and PFOS in the Environment
PFOA and PFOS have been reported to enter the environment directly during their
production, and during manufacturing, processing and dispersion of fluoropolymers (Hansen
et al., 2002; Prevendouros et al., 2006), production and use of fire fighting foams (Moody &
Field, 1999; Moody et al., 2002; Hansen et al., 2002; Moody et al., 2003; Prevendouros et al.,
2006) and commercial products (Boulanger et al., 2005 a) containing PFSs. Also industrial
and commercial waste waters have been suggested as likely sources (3M, 2001; Boulanger et
al., 2005 a; Schultz et al., 2006 a, b; Sinclair & Kannan, 2006; Loganathan et al., 2007).
Another possible source of PFOA and PFOS is the atmospheric degradation of volatile
precursors that are widely distributed (Martin et al., 2002; Stock et al., 2004; Shoeib et al.,
2005, Jahnke et al., 2007 a, b, c). FTOHs have been observed to undergo atmospheric oxida-
tion (Hurley et al., 2004; Ellis et al., 2004; Young et al., 2007) as well as metabolic (Hagen et
al., 1981) or microbial (Lange, 2002; Diglasan et al., 2004) degradation to form perfluorocar-
boxylic acids. Similarly, atmospheric (D’eon et al., 2006; Martin et al., 2006) or microbial
degradation (Lange, 2000) of perfluorooctane sulfonamido ethanols is likely to yield PFOS.
1.4 Environmental Concentrations of PFOA and PFOS
Over the years, researchers investigating the environmental fate of halogenated com-
pounds have mostly focused on brominated or chlorinated compounds. Fluorinated chemicals
received less attention because their analysis was more complicated, they were believed to
have less impact on wildlife or humans, and there were no or very little regulations. In 1976,
4

Introduction
Donald Taves from the University of Rochester in New York speculated about widespread
contamination of human tissues with trace amounts of organic fluorocompounds originating
from commercial products (Renner, 2001). Before perfluorinated surfactants became of inter-
est another chemical - trifluoroacetate (TFA) – gained the attention of researchers. This at-
mospheric degradation product of partially fluorinated ethanes introduced as alternatives for
banned chlorofluorocarbons used in refrigeration was shown to be persistent in the hydro-
sphere and accumulate in higher plants, i.e. conifers (Frank et al. 1995, Frank et al. 1996,
Frank & Jordan 1999, Liekens et al. 1997). Later on, the fluorinated compounds, PFOA and
PFOS were the first PFSs to receive a lot of attention as they were shown to be persistent in
the environment, and the latter was shown to be bioaccumulative and toxic (Schultz et al.,
2003). In the year 2000, growing concern about this class of chemicals resulted in the an-
nouncement of the largest producer, 3M company, to phase out the production of PFOS
(Renner et al., 2001). Since then, a number of papers reporting environmental concentrations
of PFOA and PFOS have been published. The following paragraphs give an overview of the
levels of these two analytes in different environmental compartments.
1.4.1 Air and Precipitation
As mentioned before (chapter 1.2), PFOA and PFOS have relatively good water solu-
bility and tend to stay in the aqueous phase as well as to bind to particles present in the at-
mosphere; these properties are reflected in still limited data on their concentration in the gas-
phase of the atmosphere (Table 2).
Only lately, Kim and Kannan (2007) published concentrations of PFOA and PFOS in
the gas-phase of air samples collected at Albany, USA. Both analytes were present in the par-
ticulate phase of air samples collected in the USA, Germany and Canada (Jahnke et al., 2007;
Kim & Kannan, 2007; Stock et al., 2007) in the range of pg/m3, the highest concentrations
were observed in Kyoto, Japan (Harada et al., 2005 c).
Much higher levels (ng/L) of these two analytes have been reported for rain and snow
in the USA and Canada, and even in Arctic snow (Loewen et al., 2005; Scott et al., 2006 b;
Kim & Kannan, 2007; Young et al. 2007).
5

Introduction
Table 2. PFOA and PFOS levels in air [pg/m3] and precipitation [ng/L]; (G) - gas phase, (P) - particulate phase, na - not analysed, nd - not detected.
Sample Location PFOA PFOS Reference
Air (G) Albany, NY, <01.890 – 006.530 <00.940 – 003.000 Kim & Kannan, 2007 USA
Air (P) Albany, NY, <00.760 – 004.190 <00.350 – 001.160 Kim & Kannan, 2007 USA
Air (P) Kyoto, Japan na <00.600 – 005.300 Sasaki et al., 2003 Air (P) Kyoto, Japan <72.000 – 880.000 <20.000 – 170.000 Harada et a., 2005 c Air (P) Hamburg, <00.200 – 002.600 <00.400 – 001.600 Jahnke et al., 2007 d
Germany Air (P) Cornwallis Island, <1.400 – 02.600 <05.9000 Stock et al., 2007
Canada Rain Albany, NY, <00.750 – 007.270 <<0.250 – <<1.510 Kim & Kannan, 2007
USA Rain Turkey Lakes, <00.500 – 003.100 na Scott et al., 2006 a
Canada Rain North East <00.100 – 089.000 na Scott et al., 2006 b
Canada Rain Winnipeg, nd <<0.590 ± <<0.040 Loewen et al., 2005
Canada Snow Albany, NY, <00.750 – 019.600 <<0.250 – <<1.930 Kim & Kannan, 2007
USA Snow Arctic <00.012 – 000.147 <<0.003 – <<0.086 Young et al., 2007
1.4.2 Aquatic Samples
Up to now, PFOA and PFOS concentrations have been measured in tap water, ground
water, surface run-off from a location of fire-fighting activity, precipitation (1.4.1), fresh-,
salt-, and waste water. An overview of these data is given in Table 3.
So far, the most detailed studies of their concentrations in tap water have been pub-
lished in Germany (Skutlarek et al., 2006; Brunner, 2007). The maximum PFOA concentra-
tion was observed in the river Ruhr, caused by inappropriate disposal of PFS-containing waste
that resulted in contamination of the drinking water in the region (Skutlarek et al., 2006). Ele-
vated PFOA values in tap water registered in the Altötting District could be traced back to
waste waters from a fluorination process released to the local river (Brunner et al., 2007). The
maximum levels observed in drinking water in Osaka City, Japan, were lower than the maxi-
mum concentrations mentioned above (Saito et al., 2004).The earliest publication on PFSs in
the environment revealed very high PFOA concentrations (up to µg/L) in ground waters at the
Naval Air Station and the Tyndal Air Force Base, USA, that followed a fire fighting activity
(Moody & Field, 1999). A few years later, similar contamination of ground water resulting
6

Introduction
Ref
eren
ce
Saito
et a
l., 2
004
Skut
lare
k et
al.,
200
6 B
runn
er, 2
007
Moo
dy &
Fie
ld, 1
999
Moo
dy e
t al.,
200
3 K
im &
Kan
nan,
200
7 H
anse
n et
al.,
200
2 Sa
ito e
t al.,
200
4 Se
nthi
lkum
ar e
t al.,
200
7 Sk
utla
rek
et a
l., 2
006
Nak
ayam
a et
al.,
200
7 M
clac
hlan
et a
l., 2
007
So e
t al.,
200
7 M
cLac
hlan
et a
l., 2
007
Stoc
k et
al.,
200
7 K
im &
Kan
nan,
200
7 So
et a
l., 2
004
Saito
et a
l., 2
004
Yam
ashi
ta e
t al.,
200
5 Y
amas
hita
et a
l., 2
005
Hou
de e
t al.,
200
6 a
Hou
de e
t al.,
200
6 a
Hou
de e
t al.,
200
6 a
Schu
ltz e
t al.,
200
6 a
Sinc
lair
& K
anna
n, 2
006
Schu
ltz e
t al.,
200
6 b
Loga
nath
an e
t al.,
200
7 Lo
gana
than
et a
l., 2
007
12.0
00
22.0
00
4.00
0 11
0000
.000
14
.600
14
4.00
0 37
.000
10
.000
19
3.00
0 13
2.00
0 99
.000
90
.000
9.
300
730.
000
28.0
00
0.07
8 0.
073
15.0
00
1.10
0 13
.000
40
0.00
0 68
.000
34
.000
99
3.00
0 77
.000
– – – – – – – – – – – – – – – – – ± ± ± – – – – –
PFO
S nd
0000
<2
.000
<1
.000
na
.000
80
00.0
00
<0.2
50
16.8
00
0.24
0 <5
.200
<2
.000
30
.000
na
.000
0.
150
na.0
00
0.90
0 nd
0.04
0 0.
610
0.00
1 0.
009
12.0
00
0.90
0 30
.000
1.
100
3.00
0 6.
100
7.00
0 <2
.500
40.0
00
519.
000
230.
000
6570
.000
10
5000
.000
29
.300
59
8.00
0 45
6.00
0 11
0.00
0 36
40.0
00
287.
000
260.
000
3.80
0 16
.000
15
.800
32
0.00
0 44
8.00
0 0.
142
0.43
9 13
.000
9.
200
26.0
00
97.0
00
1050
.000
24
.000
33
4.00
0 14
1.00
0
– – – – – – – – – – – – , – – – – – – ± ± ± – – – – –
PFO
A
<00.
700
<02.
000
<01.
000
nd.0
00
nd.0
00
<00.
510
<25.
000
<00.
100
<07.
900
<02.
000
<12.
600
<00.
650
<00.
850
<03.
000
<00.
500
<03.
720
<00.
240
<01.
900
<00.
015
<00.
100
<09.
500
<03.
600
<59.
000
<02.
500
<58.
000
<04.
400
<08.
300
<01.
000
Loc
atio
n O
saka
and
Toh
oku
area
, Jap
an
Ruh
r, G
erm
any
Altö
tting
Dis
trict
, Ger
man
y N
aval
Air
Stat
ion
Fallo
n, T
ynda
ll A
ir Fo
rce
Bas
e A
ir Fo
rce
Bas
e, M
ichi
gan,
USA
A
lban
y, N
ew Y
ork,
USA
Te
nnes
see
Riv
er, D
ecat
ur, U
SA
Japa
n K
yoto
are
a, Ja
pan
Moe
hne,
Ruh
r, G
erm
any
Cap
e Fe
ar B
asin
, Nor
th C
arol
ina,
USA
D
eläl
ven.
Vin
delä
lven
, Kal
ix Ä
lv, S
wed
en
Pear
l and
Yan
gtze
Riv
er, C
hina
O
der,
Vis
tula
, Pol
and
Can
adia
n A
rctic
A
lban
y, N
ew Y
ork,
USA
H
ong
Kon
g, S
outh
Chi
na
Japa
n Pa
cific
Oce
an
Atla
ntic
Oce
an
Cha
rlest
on, U
SA
Sara
sota
Bay
, USA
W
WTP
, Cha
rlest
on, U
SA
WW
TPs n
atio
nwid
e, U
SA
WW
TPs,
New
Yor
k St
ate,
USA
Pa
cific
Nor
thw
est,
USA
W
WTP
Ken
tuck
y, U
SA
WW
TP G
eorg
ia, U
SA
Tab
le 3
. PFO
A a
nd P
FOS
leve
ls in
aqu
atic
sam
ples
[ng/
L];
*
- afte
r fire
figh
ting
activ
ity, n
d - n
ot d
etec
ted,
na
- not
ana
lyse
d.
Sam
ple
Tap
wat
er
Gro
und
wat
er *
Su
rfac
e ru
noff
R
iver
wat
er
Lake
wat
er
Sea
wat
er
Was
te w
ater
7

Introduction
from the use of fire fighting foams was reported by Moody et al. (2003).
The highest concentrations of PFOA and PFOS in river waters were observed in the
river Moehne (Germany) due to criminal disposal of contaminated wastes (Skutlarek et al.,
2006), followed by levels measured in the Tennessee River (USA) where the contamination
originated from a manufacturing plant (Hansen et al., 2002). High PFOA levels have also
been noted in Japan (Saito et al., 2004, Sethilkumar et al., 2007), China (So et al., 2007) and
in North Carolina, USA (Nakayama et al., 2007). In comparison, Swedish and Polish rivers
showed only low levels of pollution with PFOA and PFOS (McLachlan et al., 2007). Moder-
ate levels of PFOA and PFOS have been determined in lakes of the Canadian Arctic (Stock et
al., 2007) or in lakes near Albany, NY, USA (Kim & Kannan, 2007).
Currently, low levels (pg/L) of PFOA and PFOS are found in salt water, e.g. Pacific
and Atlantic Ocean (Yamashita et al., 2005), with the highest concentrations at the coasts of
China and Japan (Saito et al., 2004; So et al., 2004).
Waste waters from various waste water treatment plants (WWTPs) in the USA have
been reported to contain concentrations ranging from 1 to over 1000 ng/L PFOA and from 1
to 1000 ng/L PFOS (Houde et al., 2006 a; Schultz et al., 2006 a, b; Sinclair & Kannan, 2006;
Loganathan et al., 2007).
1.4.3 Solid Matrices
Relatively low concentrations of PFOA and PFOS (Houde et al., 2006 a; Nakata et al.,
2006) were found in the marine sediment with the exception of the harbour of Barcelona,
Spain (Alzaga et al., 2005), where fire fighting foams were used.
Moderate levels of PFOA and PFOS have been determined in freshwater sediments
(stationary and river waters) in the USA and Japan (Higgins et al., 2006; Senthilkumar et al.,
2007). Elevated PFOS concentrations have been observed in sediment samples collected from
the Resolute Lake implying other sources than atmospheric deposition, namely contamination
by the outflow from a nearby lake receiving raw sewage and waste waters from the airport
(Stock et al., 2007). Levels of PFOA and PFOS in solid matrices other than biota and foods
are summarized in Table 4.
So far, the highest published concentrations of these analytes in solid matrices have
been found in dust collected from Japanese houses (Moriwaki et al., 2003) and in sludge sam-
ples collected at WWTPs in the USA and Germany (Higgins et al., 2006; Loganathan et al.,
2007; BLfU, 2007 a) reflecting their presence in waste waters and their partitioning between
water and sludge during the treatment process.
8

Introduction
Table 4. PFOA and PFOS levels in solid matrices [µg/kg]; ww - wet weight, dw - dry weight, na - not analysed, nd - not detected.
Sample Location PFOA PFOS Reference
Charleston Har-bour area, USA
0.20 ± 0.200 0.40 ± 0.50 Houde et al., 2006 a
Marine sediment, ww Sarasota Bay, USA 0.06 ± 0.020 0.20 ± 0.20 Houde et al.,
2006 a Tidal Flat, Ariake Sea, Japan
0.84 – 1.100 0.09 – 0.14 Nakata et al., 2006
Barcelona Har-bour, Spain
8.00 – 12.000 na Alzaga et al., 2005
San Francisco Bay Area, USA
nd – 0.625 nd – 3.07 Higgins et al., 2006
Still water sediment, Lakes Resolute,
Char, Amtituk, Canada
<0.30 – 7.500 0.02 – 85.00 Stock et al., dw 2007
Kyoto area rivers, Japan
<0.10 – 3.900 <0.33 – 6.40 Senthilkumar et al., 2007
River sediment, dw San Francisco Bay
Area, USA nd – 0.230 nd – 1.30 Higgins et al.,
2006 Vacuum Japan 69.00 – 3700.000 11.00 – 2500.00 Moriwaki et
al., 2003 cleaner dust, dw
San Francisco Bay Area, USA
nd – 29.400 14.40 – 2610.00 Higgins et al., 2006
Sludge (WWTP), dw Northwest <3.00 – 12.000 2.50 – 160.00 Schultz et al.,
2006 b. Pacific, USA Kentucky, USA 33.00 – 219.000 8.20 – 993.00 Loganathan et
al., 2007 Georgia, USA 7.00 – 130.000 <2.50 – 77.00 Loganathan et
al., 2007 Bavaria, Germany <2.00 – 230.000 <10.00 – 6720.00 BLfU, 2007
A specific and important group of solid matrices whose PFOA and PFOS levels has
been determined are food samples (Table 5). Although still scarce, these data are of high im-
portance because they help to estimate human exposure to these compounds.
PFOA concentrations in food samples (Gulkowska et al., 2006; Tittlemier et al., 2007;
Ericson et al., 2008) were mostly below the limit of quantification (LOQ); the highest PFOA
concentrations were found in microwave popcorn, probably resulting from packaging material
treated with fluorinated compounds, in roast beef from Canada (Tittlemier et al., 2007) , and
in sea food (Gulkowska et al., 2006). PFOS has been shown to have elevated concentrations
in sea food (Gulkowska et al., 2006) and in other animal-derived foods (Tittlemier et al.,
2007).
9

Introduction
Table 5. PFOA and PFOS levels in food samples [µg/kg ww]; Values in parentheses indicate that the concentration measured was above limit of detection (LOD) but below LOQ.
Sample Location PFOA PFOS Reference Gulkowska et al.,
2006 Seafood China <0.250 – 1.67 0.330 – 13.900
Beef steak <0.500 2.700 Roast beef 2.600 <0.600 Ground beef <0.400 2.100 Pizza (0.74) <1.000
Tittlemier et al., 2007 Canada
Microwave 3.600 (0.98) popcorn
1) <0.027 0.022 ± 0.006 Vegetables Pork2) <0.053 0.045 ± 0.029
3)Chicken <0.067 0.021 ± 0.001 Spain Ericson et al., 2008 Dairy products4) <0.040 0.121 ± 0.050 Whole milk 0.056 ± 0.002 <0.014
1) lettuce, tomato, green bean, spinach; 2) sausage, hot dog, steak, hamburger, ham;
3) breast, thights, sausage; 4) cheese, yoghurt, cream caramel, custard.
1.4.4 Biota
1.4.4.1 Concentrations in Biological Samples
A summary of PFOA and PFOS concentrations in biota is given in Table 6. So far,
biological samples seem to be the best examined ones for this class of chemicals. Data of wild
life samples from all trophic levels can be found in the literature, starting from benthic algae
from two rivers in the USA (Kannan et al., 2005) up to predators such as polar bears inhabit-
ing Greenland (Bossi et al., 2005 a).
The first report on the global distribution of PFOS in wildlife was published by Giesy
& Kannan (2001). Their study contained a wide range of organisms including fish, birds, and
mammals from North America, Europe, the Arctic, and the North Pacific Ocean, showing that
animals from industrialised regions were higher contaminated than those from remote loca-
tions.
Houde et al. (2006 a) reported low levels of PFOA and PFOS in zooplankton collected
from Sarasota Bay, USA. Several studies published between 2002 and 2006 focused on inver-
tebrates (Kannan et al., 2002; Martin et al., 2004; Nakata et al., 2006; So et al., 2006). Lug-
worm inhabiting the tidal flat of the Ariake Sea, Japan, was the only organism showing higher
concentrations of PFOA than of PFOS (Houde et al., 2006).
10

Introduction
Ref
eren
ce
Kan
nan
et a
l., 2
005
Hou
de e
t al.,
200
6 a
Nak
ata
et a
l., 2
006
Mar
tin e
t al.,
200
4 K
anna
n e
t al.,
200
2 a
So e
t al.,
200
6 a
Nak
ata
et a
l., 2
006
Kan
nan
et a
l., 2
005
Kan
nan
et a
l., 2
005
BLf
U, 2
007
b Si
ncla
ir et
al.
2006
Se
nthi
lkum
ar e
t al.,
200
7 H
off e
t al.,
200
5 G
iesy
& K
anna
n, 2
001
Kel
ler e
t al.,
200
5 Si
ncla
ir et
al.
2006
Ta
o et
al.,
200
6 H
oude
et a
l., 2
006
a V
an D
e V
ijver
et a
l., 2
006
Ishi
bash
i et a
l., 2
008
Bos
si e
t al.,
200
5 a
Kan
nan
et a
l., 2
005
Kan
nan
et a
l., 2
006
Bos
si e
t al.,
200
5 a
Tao
et a
l., 2
006
Dai
et a
l., 2
006
3.10
0.
07
1.30
28
0.00
12
25.0
0 3.
80
75.0
0 29
7.00
6.
10
142.
00
9031
.00
97.0
0 71
5.00
21
.00
914.
00
1790
.00
5950
0.00
88
4.00
3.
52
38.0
0 74
.00
1325
.00
290.
00
± – – – – – – – – – – – – – – – – – – – – – –
PFO
S 2.40
0.
20
<0.3
0 13
.00
<42.
00
0.64
<0
.30
49.0
0 59
.00
1.60
10
.00
1.60
17
.00
1.40
14
6.00
<0
.50
340.
00
33.0
0 28
.00
1280
.00
<1.0
0 <0
.08
2.60
0.
76
1245
.00
<35.
00
0.
5 98
.0
90.0
4.
3 11
.0
15.0
7.
7
8.1
7.8
43.0
3.
3 14
7.0
3.9
8.2
± – – – – – – – – – – – – –
PFO
A
<0.2
0 0.
30
70.0
0 2.
50
na
<1.2
0 <3
.00
<18.
00
<36.
00
<0.5
0 <1
.50
10.0
0 na
<72.
00
0.50
<7
.50
<0.6
0 3.
40
na
nd
<2.0
0 <5
.00 na
<1.5
0 0.
32
<12.
0 or µ
g/L*
];
Loc
atio
n R
iver
s: R
aisi
n, S
t. C
lair,
Cal
umne
t, U
SA
Sara
sota
Bay
, USA
Ti
dal F
lat o
f Aria
ke S
ea, J
apan
G
reat
Lak
es, U
SA
Gul
f of M
exic
o, C
hesa
peak
e B
ay, U
SA
Sout
h C
hina
, Jap
an
Tida
l Fla
t of A
riake
Sea
, Jap
an
Lake
Sup
erio
r, M
ichi
gan,
USA
Sa
gina
w B
ay, M
ichi
gan,
USA
R
iver
s Alz
, Mai
n, G
erm
any
New
Yor
k St
ate,
USA
K
yush
u Pr
efec
ture
, Jap
an
Flan
ders
, Bel
gium
M
ichi
gan,
USA
So
uthe
aste
rn C
oast
, USA
N
iaga
ra R
iver
, New
Yor
k, U
SA
Sout
hern
Oce
an
Cha
rlest
on, S
aras
ota
Bay
, USA
B
lack
Sea
, Ukr
aine
Fa
roe
Isla
nd, D
enm
ark
Lala
maz
oo R
iver
wat
ersh
ed, U
SA
Cal
iforn
ia C
oast
, USA
A
ntar
ctic
B
aika
l, R
ussi
a C
hina
G
reen
land
, Den
mar
k
Tab
le 6
. PFO
A a
nd P
FOS
leve
ls in
bio
ta [µ
g/kg
wet
wei
ght, µg
/kg
dry
wei
ght§
na
- not
ana
lyse
d, n
d - n
ot d
etec
ted.
Long
finn
ed p
ilot w
hale
(liv
er)
Bot
tleno
se d
olph
ins (
plas
ma)
*
Mys
is, D
ipor
eia
(who
le b
ody)
Elep
hant
seal
(who
le b
lood
)*
Spec
ies (
Sam
ple
type
) B
enth
ic a
lgae
Zo
opla
nkto
n Lu
gwor
m (w
hole
bod
y)
Oys
ter (
who
le b
ody)
§
Oys
ter (
who
le b
ody)
C
lam
(sof
t tis
sue)
B
row
n tro
ut (e
ggs)
C
arp
(mus
cles
) C
hub
(mus
cles
) Sm
allm
outh
bas
s (liv
er)
Jack
mac
kere
l (liv
er)
Eel (
liver
) G
reen
frog
s (liv
er)
Sea
turtl
e (p
lasm
a)*
Com
mon
mer
gans
er (l
iver
)
Har
bour
por
pois
e (li
ver)
Bai
kal S
eal (
liver
)
Alb
atro
ss (l
iver
)
Min
k (li
ver)
Se
a ot
ter (
liver
s)
Pand
a (s
erum
)*
Pola
r bea
r (liv
er)
11

Introduction
Relatively high concentrations of whereas have been measured in mysis and diporeia from the
Great Lakes, USA (Martin et al., 2004).Oysters and clams collected in Japan (Nakata et al.,
2006; So et al., 2006 a), were only slightly burdened oysters collected from the Gulf of Mex-
ico, and Chesapeake Bay, USA, had very high concentrations of PFOS (Kannan et al.,
2002 a).
In several studies the attention was directed to fish species inhabiting fresh- and salt-
water basins; some examples from the literature are presented in Table 6. The highest PFOA
concentrations were measured in muscle tissue of chub from the river Alz in Germany (BLfU,
2007 b) having also a high water concentration (up to 7.5 µg/L of PFOA, BLfU, 2007 c). The
lowest PFOS levels in fish, were found in liver of jack mackerel from Kyushu Prefecture,
Japan (Senthilkumar et al., 2007) and in muscle tissue of chub from the rivers Alz and Main,
Germany (BLfU, 2007 b), the highest in liver tissue of eel collected in the Ieperlee Canal at
Boezinge, Flanders, Belgium (Hoff et al., 2005), an industrialised area with no production
sites for fluorochemicals. Relatively high concentrations of PFOS were measured in eggs of
brown trout from Lake Superior, Michigan, USA (Kannan et al. 2005).
The only amphibian species analysed for PFSs’ is green frog in whose liver up to
290 µg/kg PFOS were found (Giesy & Kannan, 2001). In sea turtles from the southeastern
coast of the USA PFOA and PFOS concentrations in their plasma ranged from 0.5 – 8 and
1.4 – 100 µg/L, respectively (Keller et al., 2005).
Fish-eating birds are another group of animals to which a lot of attention has been
paid; to estimate their contamination with PFSs, typical concentrations in liver of common
merganser and albatross are given in Table 6 (Sinclair et al., 2006; Tao et al., 2006).
Studies on marine and terrestrial mammals have also been conducted, showing that
plasma and liver levels of PFOA and PFOS cover a wide range (Table 6). The highest PFOA
concentration was found in sea otters from the California Coast, USA (Kannan et al., 2005).
Relatively high PFOA concentrations have also been determined in the plasma of bottlenose
dolphins from the Niagara River, NY, USA (Houde et al., 2006 a). PFOS concentrations in
mammals were mostly much higher than those of PFOA. The lowest PFOS concentrations in
mammals listed in Table 6, were found in whole blood of elephant seal from Antarctica (Tao
et al., 2006), liver of long finned pilot whale from Denmark (Bossi et al., 2005 a), liver of
Baikal seal, Russia (Ishibashi et al., 2008), or blood plasma of Chinese pandas (Dai et al.,
2006), the highest PFOS concentrations in liver of mink from the Kalamazoo River water-
shed, USA (Kannan et al., 2005).
12

Introduction
1.4.4.2 Temporal Trends
A number of studies on the temporal trends of PFSs have been conducted in the last
few years. As the first one Kannan et al. (2002 b) reported PFOS concentrations in livers of
sea eagles collected between 1979 and 1999 from inland and coastal regions of eastern Ger-
many and Poland. Although concentrations increased from the 1970s and 1980s (25 µg/kg
ww) to the 1990s (40 µg/kg ww), no clear temporal trend could be observed. Martin et al.
(2004) found an increase in PFOS concentrations (4-fold) in trouts from the Lake Ontario
over the whole collection period (1980 – 2001).
A study on PFOS concentration in guillemot eggs from the Baltic Sea between 1968
and 2003 showed a significant increase, on average 7 – 11 % per year (Holström et al., 2005).
A sharp peak was observed in 1997 followed by a decrease until 2002 (Figure 4).
Figure 4. Temporal trend of PFOS in guillemot eggs, Baltic Sea, 1968 – 2003
(Holström et al., 2005).
An increasing trend of PFOS concentrations in liver tissue of ringed seals in central-
east Greenland collected between 1986 and 2003 has been described by Bossi et al. (2005 b).
Smithwick et al. (2006) reported a statistically significant increase in PFOA concentrations in
polar bear liver tissue in one of two groups investigated, whereas PFOS increased signifi-
cantly in both groups.
Eggs of herring gulls from two coastal colonies in Northern Norway collected between
1983 and 2003 (Verreault et al., 2007) showed a 2-fold-increase in PFOS from 1983 to 1993,
remaining constant until 2003. Lately, Ishibashi et al. (2008) presented a comparison of PFOS
13

Introduction
liver concentrations in Baikal seals collected in 1992 and 2005 (Ishibashi et al., 2008) show-
ing a 2.4-fold increase.
1.4.5 Humans
Table 7 gives some examples of PFOA and PFOS levels in humans. For obvious rea-
sons most of the studies report blood levels of these analytes; lately however, also other data
have become available, i.e. in cord blood, breast milk, or liver.
Data for human plasma samples (Fromme et al., 2007) collected from adults in south-
ern Bavaria, Germany, in 2005, suggest that the current exposure of the population in this
region is lower than in the USA (Olsen et al, 2003; Kannan et al., 2004).
PFOS was the predominant contaminant among 10 PFSs in blood serum samples from
85 voluntary donors from local universities and hospitals of nine cities in China, its concen-
tration being significantly higher in the male group (Yeung et al., 2006).
Kannan et al. (2004) conducted a study on human blood samples collected in several
countries, showing that after PFOS, PFOA was the most abundant PFSs, with the highest con-
centrations observed in Korea and USA, moderate in Poland, and relatively low in Colombia,
Brazil, Italy, Belgium, India, Malaysia, and Japan. PFOS predominated in samples from the
USA, Poland and Korea, was moderate in Belgium, Malaysia, Brazil, Colombia, and Japan,
and the lowest in India. Kärmann et al. (2006 a) showed that blood of Swedish people is
equally burdened with low levels of PFOA and medium levels of PFOS. Pooled serum sam-
ples from 3802 male and female Australian residents living in urban (around Sydney) and
rural (outside major metropolitan centres) areas in 2002 – 2003 showed a positive relation
between age and increasing PFOS concentration (Kärrman et al., 2006 b). The male group had
higher PFOA and PFOS levels but no substantial difference was found between rural and ur-
ban population.
An investigation of PFOA and PFOS levels in blood of four subpopulations: dockers,
farmers, individuals declaring high intake of Baltic Sea fish, general sector of the citizens of
the Gulf of Gdansk and the Baltic Sea, Poland, showed that Baltic fish adds to the human
body burden with PFOS and to a lesser extent with PFOA (Falandysz et al. 2006).
Between 2004 and 2005, PFOA and PFOS were detected in >99 % of cord serum
samples of 299 singletons delivered in Baltimore, USA, suggesting that in utero exposure to
these compounds is ubiquitous in this population of babies (Apelberg et al., 2007). A similar
observation but only with regard to PFOS was made for cord serum samples of Japanese fe-
tuses (Inoue et al., 2004).
14

Introduction
Kär
rman
et a
l., 2
006
b
Kär
rman
et a
l., 2
006
a
Fala
ndys
z et
al.,
200
6
Ref
eren
ce
From
me
et a
l., 2
007
Yeu
ng e
t al.,
200
6 K
anna
n et
al.,
200
4 O
lsen
et a
l., 2
003,
K
anna
n et
al.,
200
4
Inou
e et
al.,
200
4 A
pelb
erg
et a
l., 2
007
Ols
en e
t al.,
200
3
So e
t al.,
200
6 b
Tao
et a
l., 2
008
055.
00
310.
00
014.
00
035.
00
010.
00
116.
00
027.
00
003.
10
018.
80
092.
00
040.
00
164.
00
103.
00
025.
00
024.
00
025.
00
084.
00
046.
00
034.
10
035.
00
000.
36
000.
16
057.
00
– – – – – – – – – – – – – – – – – – – – – – –
2.10
32
.00
4.60
4.
60
<1.0
0 16
.00
4.50
<1
.00
6.20
3.
00
4.10
<1
.30
2.70
5.
50
5.20
6.
60
14.0
0 6.
70
14.8
0
PFO
S
nd
nd
0.05
<0
.03
<4.5
0
019.
00
012.
00
040.
00
013.
00
256.
00
012.
30
088.
00
009.
90
008.
50
005.
80
006.
20
008.
70
005.
20
005.
10
03.5
0 00
5.30
00
7.10
00
0.21
00
0.62
04
7.00
– – – – – – – – – – – – – – – – – – – –
PFO
A
0.50
- 3.
70
<20.
00
<3.0
0 9.
70
<1.0
0 <3
.00
<10.
00
<15.
00
<6.8
0 <3
.00
5.00
6.
70
1.20
1.
20
1.70
1.
30
2.10
1.60
0.
30
0.05
<0
.03
<18.
00
Loc
atio
n G
erm
any
Chi
na
Col
ombi
a B
razi
l Ita
ly
Pola
nd
Bel
gium
In
dia
Mal
aysi
a K
orea
Ja
pan
USA
A
ustra
lia
Aus
tralia
G
dans
k, P
olan
d Sw
eden
Ja
pan
USA
C
hina
U
SA
USA
Gro
up
adul
t M,F
ad
ult M
,F
Red
Cro
ss d
onor
s, M
, F
rura
l, M
, F
urba
n, M
, F
dock
ers,
M
farm
ers,
M,F
fis
h-di
sh fa
ns, M
, F
refe
renc
e, M
, F
dono
rs, M
, F
trans
plan
t don
ors
Tab
le 7
. PFO
A a
nd P
FOS
leve
ls in
hum
ans [
µg/L
or µ
g/kg
wet
wei
ght*
];
P
- pl
asm
a, S
- se
rum
, M -
mal
es, F
- fe
mal
es, W
– w
hole
, nd
- not
det
ecte
d.
Bre
ast m
ilk
Cor
d bl
ood
Blo
od (W
)
Blo
od (S
) B
lood
(P)
Sam
ple
Live
r*
15

Introduction
So et al. (2006) analysed samples of breast milk from 19 mothers from Zhoushan,
China, finding PFOA and PFOS to be the most abundant PFSs. No statistically significant
correlation between their concentration and infants’ weight was found. Breast milk samples
from mothers in Massachusetts, USA (Tao et al., 2008), showed generally lower concentra-
tions than those from China. PFOA concentrations in the milk of mothers nursing for the first
time were significantly higher than those of mothers that had previously nursed (Tao et al.
2008).
A study including 30 samples of human liver donor tissue from the USA showed that
PFOA was mostly below <18 µg/kg, PFOS was below <4.5 µg/kg in 50 % of samples (Olsen
et al., 2003).
Generally, in all studies described above PFOS was the predominant contaminant, and
it was usually higher in males than in females. No clear conclusions or correlation between
PFSs levels and age, region (urban – rural) or daily intake of these compounds by infants
could be drawn, so further investigations are needed.
1.5 Toxicity
1.5.1 Bioaccumulation and Biomagnification Potential
Several studies enabling calculation of bioaccumulation (BAFs), bioconcentration
(BCFs), or biomagnification factors (BMFs) have been conducted. A short summary is given
in Table 8.
The highest BCF for PFOS was evaluated for liver of common shiner from Etobicoke
Creek, Canada, after an accidental spill of fire-fighting foam (Moody et al., 2002). The au-
thors suggested that this value could be influenced by the presence of precursors that were not
determined in water but could be possibly degraded to PFOS in fish liver.
BCF calculated for turtles inhabiting the Ai River system, Japan, based on PFOA and
PFOS concentrations in their sera and in the surface water were 3.2 and 10.9 (geometric
mean), respectively (Morikawa et al., 2006), suggesting a higher bioconcentration potential of
PFOS.
Kannan et al. (2005) reported BCFs of 1000 for PFOS in benthic, algae, amphipods,
and zebra mussels and of 2400 in round gobies (whole body) in relation to surface water of
the Great Lakes, USA, whereas PFOA was not detected in the tissue of any benthic organism,
despite its presence in water.
16
Introduction
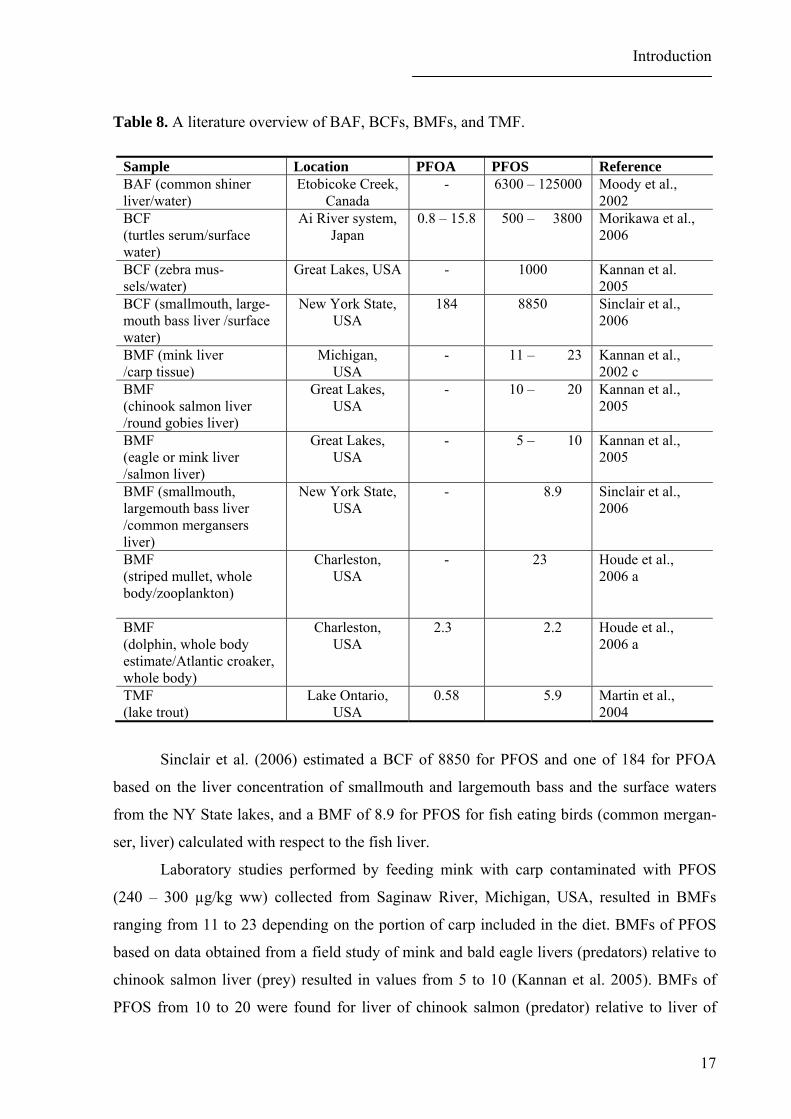
Table 8. A literature overview of BAF, BCFs, BMFs, and TMF.
Sample Location PFOA PFOS Reference BAF (common shiner liver/water)
Etobicoke Creek, - 6300 – 125000 Moody et al., 2002 Canada
BCF Ai River system, Japan
0.8 – 15.8 0500 – 003800 Morikawa et al., 2006 (turtles serum/surface
water) BCF (zebra mus-sels/water)
Great Lakes, USA - 1000.0 Kannan et al. 2005
BCF (smallmouth, large-mouth bass liver /surface water)
New York State, USA
184 8850.0 Sinclair et al., 2006
BMF (mink liver Michigan, - 0011 – 000023 Kannan et al., 2002 c /carp tissue) USA
BMF Great Lakes, - 0010 – 000020 Kannan et al., 2005 (chinook salmon liver
/round gobies liver) USA
BMF Great Lakes, - 0005 – 000010 Kannan et al., 2005 (eagle or mink liver
/salmon liver) USA
BMF (smallmouth, largemouth bass liver /common mergansers liver)
New York State, USA
- 00008.9 Sinclair et al., 2006
Charleston, - 0023.0 Houde et al., 2006 a
BMF USA (striped mullet, whole
body/zooplankton) BMF Charleston, 2.30 00002.2 Houde et al.,
2006 a (dolphin, whole body estimate/Atlantic croaker, whole body)
USA
TMF Lake Ontario, 0.58 00005.9 Martin et al., 2004 (lake trout) USA
Sinclair et al. (2006) estimated a BCF of 8850 for PFOS and one of 184 for PFOA
based on the liver concentration of smallmouth and largemouth bass and the surface waters
from the NY State lakes, and a BMF of 8.9 for PFOS for fish eating birds (common mergan-
ser, liver) calculated with respect to the fish liver.
Laboratory studies performed by feeding mink with carp contaminated with PFOS
(240 – 300 µg/kg ww) collected from Saginaw River, Michigan, USA, resulted in BMFs
ranging from 11 to 23 depending on the portion of carp included in the diet. BMFs of PFOS
based on data obtained from a field study of mink and bald eagle livers (predators) relative to
chinook salmon liver (prey) resulted in values from 5 to 10 (Kannan et al. 2005). BMFs of
PFOS from 10 to 20 were found for liver of chinook salmon (predator) relative to liver of
17

Introduction
river goby (prey). Houde et al. (2006 a) concluded that there is no agreement between BAFs
and BMFs from laboratory and field studies.
Trophic magnification factors (TMFs) calculated for PFOA and PFOS in lake trout
from a food web from Lake Ontario, USA, were 0.58 and 5.9, respectively, showing that bio-
accumulation occurred at the top of the food web for PFOS but not for PFOA (Martin et al.,
2004).
1.5.2 Ecotoxicity
A wide range of toxicological studies with PFOA and PFOS have been performed on
animals during the last 15 years.
PFOA was suggested to act as hepatocarcinogen through peroxisome proliferation (i.e.
rats fed with 0.01 % w/w PFOA; Kawashima et al., 1995; Kennedy et al. 2004; Kudo et al.,
2005) and/or at the level of gap junctions (at 350 µM in rats; Upham et al., 1998) and its half-
life in male and female rats was calculated to be 5.6 and 0.08 days, respectively (Ohmori et
al., 2003).
PFOS was shown to produce cumulative toxicity in rats and primates (i.e. ≥0.2 %
PFOS in diet), possibly caused by changes in fatty acid transport and metabolism, membrane
function, peroxisome proliferation, and mitochondrial biogenetics (Haughom & Spydevold
1992, Schulz et al., 2003), and to affect the neuroendocrine system in these animals (injection
of 10 mg/kg body weight; Austin et al., 2003). LD50 for juvenile mallards fed with PFOS in
their diet for 5 days was determined to be 750 mg PFOS/kg body weight (Newsted et al.,
2006), and its half-lifes in mallard blood serum and liver were estimated to be 6.9 and 17.5
days, respectively. According to Austin at al. (2003) subchronic exposure of rats to PFOS (at
10 mg/kg body weight) leads to significant weight loss accompanied by hepatotoxicity and
reduction of serum cholesterol and thyroid hormones.
Few researchers tried to evaluate if toxic effects observed in laboratory animals may
also be the ultimate outcome for wild life exposed to reported environmental concentrations.
For example, Hoff et al. (2003) reported that PFOS levels observed in tissues of wild life
populations (i.e. 300 µg/kg in muscle of carp or 2.6 mg/kg in eagle plasma; Giesy & Kannan
2001) could induce a clear rise in serum transaminase levels thus indicating a disruption of
hepatocyte membrane integrity. In another study, a positive correlation between PFOS liver
concentration (0.5 – 180 mg/kg ww) and increased liver weight, and liver microsomal lipid
peroxidation levels and a negative one with the serum alanine aminotransferase activity was
observed for wood-mice (Hoff et al., 2004). Lately, a significant positive correlation between
18

Introduction
PFOS hepatic concentration measured in carp and eel (0.011 – 9 mg/kg) collected in Flanders,
Belgium, and the serum alanine aminotransferase activity, and a negative correlation between
serum protein content and serum electrolyte concentrations (carp) were reported (Hoff et al.,
2005).
Both analytes were shown to be transferred from mothers to young rodents (mice, rats)
during pregnancy or/and lactation (i.e. at 0.8 mg/kg/day dietary administration; Hoff et al.,
2004, Hinderliter et al, 2005, Luebker et al., 2005). Moreover, Luebker et al. (2005) showed
that late-stage fetal development may be affected in rat pups exposed in utero to PFOS (die-
tary administration 0.8 mg/kg/day) and may contribute to the observed increased mortality.
Exposure to either of the analytes affected a number of genes in 6-week-old chickens (PFOA
at ≥ 0.1 g/L, PFOS at 0.02 g/L; Yeung et al., 2007).
Harada et al. (2005 a) reported that both PFOA and PFOS (>5 mg/L) may change
membrane surface potential, thereby having an impact on calcium channels. This is in good
agreement with the suggestion of Hu et al. (2003) that PFOS (≥5 mg/L) can cause alterations
in cell membrane properties.
Additionally, precursors of both analytes can be converted into PFOA and PFOS in
vivo, such adding to the total burden of these compounds, i.e. the telomere alcohol 8:2.
(C F8 17-C H OH) is transformed into PFOA (Kudo et al., 2005). 2 4
1.5.3 Human Toxicity and Health Risk Assessment
Little is known about human toxicity of PFOA and PFOS, and it is uncertain if the
effects observed in animals also occur in humans. For example, Burris et al. (2002) reported
the estimated half-life serum elimination of PFOA in humans to be approximately 4 years,
Olsen et al. (2005) gave half-life values of 3.8 and 5.4 years for PFOA and PFOS, respec-
tively, based on an investigation performed on 26 pentioners from two fluorochemical manu-
facturing plants, whereas experiments performed on rats resulted in half life values of only up
to 5.6 days for PFOA (Ohmori et al., 2003) and 7.5 days for PFOS (OECD, 2002).
The renal clearance of PFOA and PFOS measured in young (20 – 40 years) and old
(>60 years) people that had lived in Kyoto more than 10 years suggested that no active excre-
tion of these compounds takes place (Harada et al., 2005 b).
A mortality study performed on workers employed in jobs posing high exposure risk
showed an increased number of deaths from bladder cancer; however, doubts remain if this
could be attributed to fluorochemical exposure and/or to non-occupational exposures (Alex-
ander et al., 2003).
19

Introduction
It is certain that human beings are exposed to PFSs via a number of different path-
ways: starting form the in utero exposure, breast feeding, drinking water, contaminated food
up to inhalation of contaminated dust or use of PFS-treated articles, or occupational exposure.
Therefore, studies were undertaken to estimate overall human exposure to these compounds
and ultimately gain a deeper insight into the potential toxicity of PFOA and PFOS to human
beings.
Sasaki et al. (2003) estimated the daily intake of PFOS via inhalation of outdoor dust
particles to be up to 100 pg/day, in Oyamazaki, Japan, suggesting that human exposure to
PFOS from outdoor air is almost negligible. In contrast, Harada et al. (2006) reported much
higher contamination of air with PFOA in Oyamazaki, Kyoto, Japan, ranging from 72 to
879 pg/m3 resulting in the considerably higher daily intake of 3.4 ng. Moriwaki et al. (2003)
analysed dust from Japanese homes (Table 4, Page 10) concluding that humans may be
chronically exposed to these compounds through absorption of indoor dust. Saito et al. (2004)
revealed that more than one million inhabitants of Osaka have been exposed to PFOA through
drinking water (10.8 ng/day, assuming a daily water intake of 2 L).
A positive correlation between PFOS concentration in maternal blood and cord blood
was shown by Shoeib et al. (2004) supporting the assumption that the human fetus is exposed
to this compound during pregnancy, however, PFOS does not pass completely into the fetal
circulation and it is not known to cause any adverse effects. In 2006 (b), So et al. reported the
daily intake of PFOA and PFOS through mothers’ breast milk to be 0.017 and 0.03 µg/kg/day,
respectively, in Zhoushan, China suggesting a potential risk of PFOS to some infants.
Washburn et al. (2005) analysed the PFOA content of selected consumer articles con-
taining fluoropolymers or fluorotelomer-based products (mill-treated carpets, apparel, treated
non-woven medical garments, non-stick cookware, and thread seal tape) showing that the
aggregated exposure to consumer articles increases serum concentrations from 0.05 to 0.25
ppb for adolescents and adults. The same range as observed in professionals involved in in-
stallation, application, or maintenance of such articles. In general, neither use of the said arti-
cles nor professional exposure (installation, application, or maintenance of such articles) were
considered to have the potential of causing adverse health effects.
Based on a dietary survey in Zhoushan, China, and sea food analyses, the average
daily intake of PFOA and PFOS from sea food was estimated to be below the benchmark
dose, e.g. from 0.00001 (mollusc) to 0.0002 µg/kg/day (fish) for PFOA, and from 0.00005
(mollusc) to 0.003 µg/kg/day (fish) for PFOS (Gulkowska et al., 2006). Faladysz et al. (2006)
20

Introduction
indicated that fish from the Baltic Coast is an important source of PFOS and to a lesser extent
of PFOA for the Polish people.
An analysis of composite food group samples from the 2004 Total Diet Study of the
UK consumers, concluded a daily intake of 0.07 µg/kg bodyweight PFOA and 0.1 µg/kg
bodyweight PFOS, results not raising any immediate toxicological concerns (U.K. Food Stan-
dard Agency, 2006). A food intake of PFOA and PFOS of 1.1 ng/kg bodyweight/day has been
reported for the population of Tarragona County, Catalonia, Spain (Ericson et al., 2008). Food
composite samples collected between1992 and 2004 as part of the Canadian total diet study
resulted in a much higher estimated daily dietary intake of total perfluorocarboxylates and
PFOS (250 ng/day; 4 ng/kg body weight), suggesting that food is a more important source for
Canadians than air, water, dust, treated carpeting, and apparel (Tittlemier et al., 2007). The
differences between the three studies might be due to different eating habits reflected by dif-
ferent food included in the respective studies.
1.6 Analytical Methods for PFOA and PFOS Determination
1.6.1 Historical Analytical Methods
Due to their relatively low volatility, good solubility in water and lack of chromopho-
res the analysis of PFSs is a challenging task. The total fluorine content can be determined
applying a non-destructive or a destructive method. One of the first methods used to deter-
mine the total organofluorine content was neutron activation and X-ray fluorescence (Giesy &
Kannan, 2002); unfortunately, these techniques are characterised by low sensitivity and do not
provide structure-specific information.
Total organic fluorine in environmental and biological samples was also analysed by
oxyhydrogen flame combustion followed by determination by fluoride ion-selective electrode
(Sweetsner, 1956; Kissa, 1986). Besides being non-specific the method requires rigorous con-
ditions for quantitative mineralization and has a possible laboratory safety hazard due to the
explosive mixture of oxygen and hydrogen.
The methylene blue active substance test, has been used to detect fluorinated surfac-
tants in ground water samples (Levine et al., 1997) but it does not allow to differentiate be-
tween hydrocarbon and fluorocarbon surfactants.
For the first time, the use of gas chromatography (GC) coupled with electron capture
detection (ECD) for PFOA determination was described by Belisle & Hagen (1980). Later,
Ylien et al. (1985) and Moody & Field (1999) described methods employing GC followed by
21

Introduction
mass spectrometric detection (MS). Unfortunately, all those methods demand a derivatisation
step and are unsuitable for perfluoroalkyl sulfonates whose methyl esters are unstable.
Moody et al. (2001) described nuclear magnetic resonance (19F NMR) for the quantita-
tive determination of PFSs in water samples based on the terminal CF3 group. Due to the fact
that this group is common to all fluoroalkyl chemicals it is not clear whether quantification of
individual PFSs in a mixture is possible.
Strauss et al. (2002) described the use of attenuated total reflectance-Fourier transfor-
mation infrared spectroscopy for PFOS determination in aqueous samples without sample
pre-treatment.
In 1998, Ohya et al. described a method for quantitative determination of PFOA
among other perfluorinated carboxylic acids in biological samples by HPLC coupled to a
fluorescence detector. Unfortunately, this method has limited specificity due to matrix inter-
ferences.
Hansen et al. (2001) reported quantitative, compound-specific analysis of low levels of
PFSs in biological samples by HPLC electrospray ionisation tandem mass spectrometry (ESI-
MS/MS) that did not require a derivatisation step. Since then, this method has been estab-
lished as the most common one to determine PFSs in environmental samples. Preconcentra-
tion and removal of matrix to avoid interferences are needed for most environmental samples
but the method’s great advantage of enabling differentiation between various PFSs compen-
sates for that. Methods applied for PFOA and PFOS determination in different environmental
matrices are introduced in the following subchapters.
1.6.2 Analysis of Air Samples
PFOA and PFOS are mostly present in their anionic form in the environment having
rather low volatility. Therefore, most publications on this topic refer to the analysis of PFOA
and PFOS concentrations in particulate matter.
A method to determine PFOS in air-borne particulate matter in high-volume air sam-
ples (1400 m3) employing enrichment on a quartz membrane filter, preconcentration and pre-
cleaning of the extract on Presp-C Agri columns (250 mg, Wako Pure Chemicals, Osaka Ja-
pan) equipped with membrane filter cartridges (pour size 0.45µm) followed by HPLC-MS
was first published by Sasaki et al. (2003). Later, the same method was applied also for PFOA
determination in air-borne particulate matter (Harada et al., 2005 c). Mean recoveries of the
method were 89 % (LOQ: 0.46 ng) for PFOA and 97 % for PFOS (LOQ: 0.3 ng). Berger at al.
(2005) described a method for determination of both ionic surfactants, i.e. PFOA and PFOS,
22

Introduction
present in particulate matter, employing enrichment on glass-fibre filters, extraction with
MeOH and analysis by HPLC coupled to negative mode ESI time-of-flight (TOF) high reso-
lution MS. LOQs calculated for each sample batch ranged between 0.45 and 56 pg/m3.
Kaiser et al. (2005) described a method for PFOA analysis in occupationally exposed
low-volume (480 L) air samples (ambient air collected around a manufacturing facility) utilis-
ing Occupational Safety and Health Administration Versatile Samplers equipped with glass-
fibre filters and polystyrene resin sorbents, methanol (MeOH) as extraction solvent, and de-
termination by HPLC-MS was described Due to its validation for a high concentration range
(0.5 – 47 µg/m3) this method is not suitable for environmental air samples. Applying the same
sampling setup with the addition of a high-volume cascade impactor Barton et al. (2006)
reached a LOQ of 70 ng
1.6.3 Analysis of Aqueous Samples
In 2001, Moody et al. published an analytical technique for the determination of PFSs,
among others PFOA and PFOS, employing solid phase extraction (SPE) preconcentration and
precleaning step and determination by HPLC coupled to negative ESI-MS/MS, operating in a
multiple reaction (MRM) mode for increased sensitivity. The percent recoveries for PFOA
and PFOS were 93 % and 68 %. Relatively high LOQs (PFOA: 1.0 µg/L, PFOS 1.7 µg/L, for
100-mL sample) were suitable for the samples analysed as they were highly contaminated (in
mg/L) due to the use of fire fighting foams.
Herbert et al. (2002) reported a method suitable for PFOS determination at sub-ppm
concentrations in water samples applying direct injection of a sample acetonitrile (AcN) mix-
ture (1:1) to ESI-MS operated in the negative mode. Due to a rather high LOD 5 µg/L the
method is useful for samples containing less complex matrices and for cases in which less
precise determination of PFOS concentration is acceptable.
Yamashita et al. (2004) were the first to address a background contamination problem
during PFSs analysis when describing a method for parts-per-quadrillion PFSs levels deter-
mination in seawater. The presented method was similar to those applied previously to fresh
water samples (Hansen et al., 2002; and Taniyasu et al., 2003) and included SPE as sample
preparation step and quantification by HPLC-ESI-MS/MS. Tseng et al. (2005) employed a
sample preconcentration procedure similar to that described by Moody et al. (2001) and
HPLC ion trap negative ESI-MS for determination of PFSs in water samples reaching LOQs
of 2 and 0.5 ng/L for PFOA and PFOS, respectively.
23
Introduction
An automated on-line extraction method using turbulent flow chromatography fol-
lowed by HPLC coupled to atmospheric pressure photoionisation mass spectrometry (APPI-
MS) for PFOS determination in river water samples was described by Takino et al. (2003).
The APPI technique showed its advantage over ESI because no matrix effects were observed.
On-line enrichment of PFOS from river water samples resulted in significant reduction of
sample preparation time, but the achieved LOQ of 18 ng/L was relatively high.
Sinclair & Kannan (2006) published a method for waste water samples analysis simi-
lar to that described by Taniyasu et al. (2003) reaching LOQs of 2.5 ng/L for both PFOA and
PFOS. Later, a large-volume-injection LC-ESI-MS/MS was successfully used for waste water
samples analysis by Schulz et al. (2006 a) (LOQ = 0.5 ng/L for both analytes). Determination
of PFSs in waste- and river water samples by mixed hemimicelle-based SPE before HPLC-
ESI-MS/MS was presented by Zhao et al. (2007). LODs were 0.07 and 0.2 ng/L for PFOA
and PFOS, respectively, and the method was found to be appropriate for PFSs analysis.
Rain water sample analysis utilising a preconcentration step on tubes filled with C18
silica gel followed by HPLC-ESI-MS/MS accomplishing LOD of 7.2 ng/L for PFOA and
0.4 ng/L for PFOS was presented by Loewen et al. (2005). Scott et al. (2006 a) reported a
method for the determination of C -C2 9 perfluorocarboxylates in rain samples by preparing the
2,4-difluoroanilides of the acids and analysing by GC-MS avoiding SPE procedure, LODs
were 0.5 ng/L.
1.6.4 Analysis of Solid Matrices
The first study reporting an analytical method for PFOA and PFOS in solid matrices
other than biological ones was published by Moriwaki et al. (2003). Dust samples collected in
Japanese homes were extracted with MeOH by ultrasonic agitation, and the filtrated extract
(cellulose acetate filter) was analysed by HPLC-ESI-MS/MS. LODs were 50 and 10 µg/kg for
PFOA and PFOS, respectively, and were sufficient for dust samples analysis.
Larsen et al. (2005) compared pressurised solvent and reflux extraction methods em-
ploying five different solvents (AcN, chloroform, ethanol, MeOH, and water) for the determi-
nation of PFOA in polytetrafluoroethylene (PTFE) polymers using HPLC-ESI-MS/MS. Pres-
surised solvent extraction with ethanol, water, or MeOH turned out to be the best choice for
this purpose (recoveries: 80 – 120 %).
Powley et al. (2005 a) extracted PFOA from the surface of commercial cookware
heated up with water under simulated cooking conditions followed by a SPE step. Addition-
ally, rectangular pieces of pans (1.5 x 7.5 cm) were extracted by ASE with a water/ethanol
24

Introduction
mixture. All extracts were analysed by HPLC-ESI-MS/MS and the LODs were 10 ng/m2 for
both extraction methods.
Begley et al. (2005) extracted PFOA from materials being in direct contact with food
such as PTFE-coated cookware or paper by either shaking with MeOH (50 °C, PTFE) or
sonication with ethanol/water mixture (50:50 %). Extracts were subjected to HPLC-ESI-
MS/MS analysis. A similar procedure was applied by Stadallius et al. (2006) to extract PFOA
from paper and textile samples and a LOD of 1 µg/kg for paper and of 2 µg/kg for textile
samples was achieved.
Matrix-free analytical methods for the determination of perfluorinated carboxylic ac-
ids in soil, sediment and sludge were presented by Powley et al. (2005 b). First, a sodium hy-
droxide (NaOH) solution was added to soil/sediment/sludge sample, analytes were extracted
by shaking with AcN. Extracts were neutralised and purified by addition of graphitised car-
bon, acidified (acetic acid), centrifuged, and injected into a HPLC-ESI-MS/MS system. The
LOQ for PFOA for each matrix was 1 µg/kg and recoveries were consistently and reproduci-
bly quantitative. Another method, comprising liquid solvent extraction (aqueous acetic acid
and MeOH), cleanup via SPE, and injection of the extracts with added internal standards into
HPLC-ESI-MS/MS, enabling quantitative determination of PFSs, including both PFOA and
PFOS, in sediment and sludge was reported by Higgins et al. (2005). LODs of the method
were analyte and matrix dependent coming to 0.01 (sediment) and 1.0 µg/kg (sludge) for
PFOA and 0.1 (sediment) and 0.9 µg/kg (sludge) for PFOS.
1.6.5 Analysis of Biota and Human Samples
A method described by Hansen et al. (2001) is the first one allowing simultaneous
determination of the two analytes PFOA and PFOS, as well as other PFSs in biological ma-
trixes such as serum and liver tissue and it is still the most commonly used one. It employs,
use of an ion-pairing reagent (tetrabutylammonium hydrogen sulphate) followed by extraction
with methyl tert-butyl ether, and determination via HPLC-ESI-MS/MS. LODs obtained for
sera and liver were 1.0 µg/L and 5.0 µg/kg, respectively, for PFOA and 1.7 µg/kg and
8.5 µg/kg for PFOS. Later, Sottani et al. (2002) combined the same extraction method with
HPLC atmospheric pressure ionisation tandem mass spectrometry (API-MS/MS) to determine
PFOA in human serum but obtained a higher LOD of 10 µg/L.
Kannan et al. (2005) analysed samples of fish, mussels, amphipods, and algae by sol-
vent extraction (AcN), followed by SPE and HPLC-ESI-MS/MS determination, obtaining
LOQs ranging from 1 to 10 µg/kg ww. Later, So et al. (2006) also used SPE as a preconcen-
25

Introduction
tration and clean-up step after alkaline digestion of mussels and oysters tissues. These meth-
ods, in comparison to the one described by Hansen et al. (2001), reduce matrix interferences
to a great extend.
A time and cost efficient screening method for the analysis of PFSs in biota samples
based on the extraction of target compounds from homogenised samples into a solvent mix-
ture used as mobile phase in HPLC, i.e. MeOH/aqueous ammonium acetate (50:50) and de-
termination by HPLC-TOF-MS was reported by Berger & Haukås (2005). This method
showed LODs of 1.3 and 0.3 µg/kg ww for PFOA and PFOS, respectively.
An automated SPE clean up followed by HPLC-ESI-MS/MS was developed by Kuk-
lenyik et al. (2004) for measuring trace levels of 13 PFSs in serum and milk. LODs were 0.1
(PFOA) and 0.4 µg/L (PFOS) for serum analysis and 0.2 (PFOA) and 0.3 µg/L (PFOS) for
milk samples. So et al. (2006) modified this method by using weak-anion exchange SPE ex-
traction and applied it to human milk samples achieving LOQs of to 21 and 1 ng/L for PFOA
and PFOS, respectively.
Determination of PFOA and PFOS in human plasma after protein precipitation with
AcN by large volume injection capillary column switching LC coupled to ESI-MS was pre-
sented by Holm et al. (2004). Advantages of this method were a simplified sample preparation
procedure, its speed (separation and detection within 10 minutes), and low LODs of 0.2 and
0.5 µg/L for PFOA and PFOS, respectively, in untreated plasma.
26

Aim of the Work
2 Aim of the Work
The aim of this doctoral thesis was to find the sources of PFOA and PFOS to river
ecosystems that are not directly affected by fluorochemical activity, to determine their distri-
bution pattern, and their fate in such an ecosystem. In order to achieve the aim reliable ana-
lytical methods for the analysis of PFOA and PFOS in different environmental samples are
necessary. A sample extraction including analytes’ preconcentration step and removal of ma-
trix interferences followed by HPLC-ESI-MS/MS is a method that is typically used for PFOA
and PFOS determination in different environmental samples (see paragraph 1.6). While de-
veloping or optimising such analytical protocols, special attention has to be paid to possible
contamination sources during sample preparation and to matrix interferences disturbing ioni-
sation efficiency that might result in falsification of results (Publication I).
The release of treated waste water has been identified as a possible source of PFSs to
aquatic ecosystems (Boulanger et al., 2005; Schultz et al., 2006 a; Sinclair & Kannan, 2006;
Schultz et al., 2006 b). However, prior to this doctoral thesis no such data have been pub-
lished in peer-reviewed literature for Germany or Europe. The mass flows of the analytes
from a typical waste water treatment plant in Germany were assessed, and the fate/behaviour
of the target analytes during the waste water treatment was investigated (Publications II and
III).
Once released to aquatic ecosystems, PFOA and PFOS cannot be decomposed under
environmental conditions and will partition between different compartments such as water,
sediment and may bioaccumulate in living organism. To provide a better understanding of
their fate in such systems, of the extent to which they can adsorb on sediment or bioaccumu-
late in biota, a detailed study on the example of the Roter Main River (Publication II & III),
its sediments (Publication IV) and fishes (Publication V) was performed.
27

Optimised Analytical Procedures
3 Optimised Analytical Procedures
3.1 Sample Preparation Procedures
3.1.1 River and Waste Water
River and waste water samples, collected in 2-L polypropylene (PP)-bottles were
transferred into 250-mL PP-bottles, centrifuged (12000 rpm, 10 min, 20 °C, High-
Performance Centrifuge, Avanti J-25, Beckman, USA) and filtered (5971/2, Schleicher &
Schuell, Dassel, Germany). Next, SPE was performed according to the optimised method de-
scribed in detail in Publication I (river water, 500 mL) and Publication II (waste water,
250 mL). Samples were stored at 4 °C in the dark not longer than two weeks, and allowed to
reach room temperature prior to analysis.
SPE was performed on C18-cartridges (200 mg, 6 mL, Oasis HLB Waters Corp., Mil-
ford, USA) preconditioned with deionised water and MeOH. Waste-water-loaded cartridges
were washed with deionised water/MeOH, dried under vacuum, and analytes were eluted with
MeOH into 5-mL PP-tubes. Extracts were dried under a gentle nitrogen stream, residues were
dissolved in 500 µL each of a mixture of aqueous ammonium acetate/AcN, solutions were
filtered (membrane filters, 0.45 µm, Roth, Karlsruhe, Germany) and transferred to PP-snap
ring vials (0.75 mL, Supelco, Bellefonte, USA) with polyethylene caps (NeoLab, Heidelberg,
Germany) for analysis.
If isotope dilution technique was applied, 13C-labelled PFOA and PFOS standards
were added to the samples after the filtration step but before preconcentration with SPE as
described in Publication III.
3.1.2 Sludge and Sediment
Dewatered sludge, grit and sediment samples were freeze-dried in aluminium boxes
precleaned with hexane and MeOH. Sludge was ground with mortar and pestle, transferred to
PP-bottles and stored at room temperature until analysis, whereas sediment and grit were
sieved (mesh size 0.63 and 2 mm, respectively).
Such prepared solid samples (100 mg of sludge, 1 g of grit or sediment) were extracted
in triplicate according to the method described previously by Higgins et al. (2005) which was
slightly modified as described in Publication II (sludge, grit) and Publication IV (sediment).
Shortly, the method involves sonication of the homogenised sample at elevated temperature
(60 °C) with diluted acetic acid (1 %), followed by sonication with a mixture of MeOH and
28
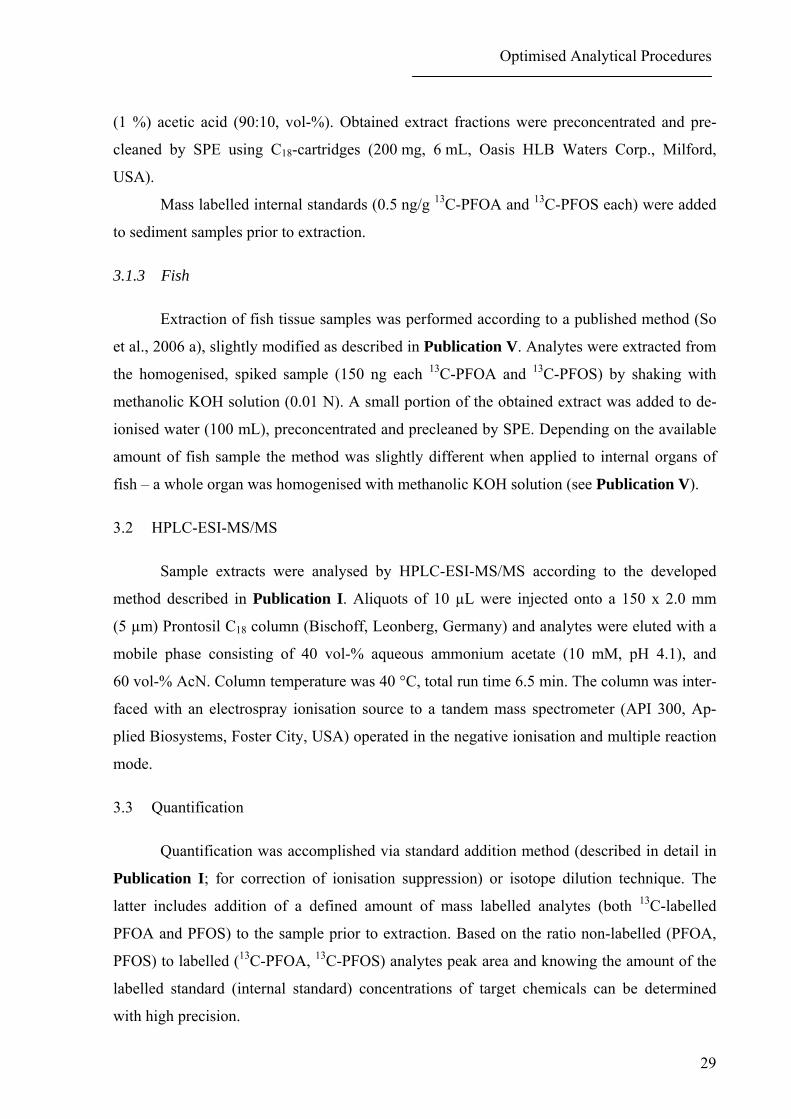
Optimised Analytical Procedures
(1 %) acetic acid (90:10, vol-%). Obtained extract fractions were preconcentrated and pre-
cleaned by SPE using C18-cartridges (200 mg, 6 mL, Oasis HLB Waters Corp., Milford,
USA).
Mass labelled internal standards (0.5 ng/g 13 13C-PFOA and C-PFOS each) were added
to sediment samples prior to extraction.
3.1.3 Fish
Extraction of fish tissue samples was performed according to a published method (So
et al., 2006 a), slightly modified as described in Publication V. Analytes were extracted from
the homogenised, spiked sample (150 ng each 13 13C-PFOA and C-PFOS) by shaking with
methanolic KOH solution (0.01 N). A small portion of the obtained extract was added to de-
ionised water (100 mL), preconcentrated and precleaned by SPE. Depending on the available
amount of fish sample the method was slightly different when applied to internal organs of
fish – a whole organ was homogenised with methanolic KOH solution (see Publication V).
3.2 HPLC-ESI-MS/MS
Sample extracts were analysed by HPLC-ESI-MS/MS according to the developed
method described in Publication I. Aliquots of 10 µL were injected onto a 150 x 2.0 mm
(5 µm) Prontosil C18 column (Bischoff, Leonberg, Germany) and analytes were eluted with a
mobile phase consisting of 40 vol-% aqueous ammonium acetate (10 mM, pH 4.1), and
60 vol-% AcN. Column temperature was 40 °C, total run time 6.5 min. The column was inter-
faced with an electrospray ionisation source to a tandem mass spectrometer (API 300, Ap-
plied Biosystems, Foster City, USA) operated in the negative ionisation and multiple reaction
mode.
3.3 Quantification
Quantification was accomplished via standard addition method (described in detail in
Publication I; for correction of ionisation suppression) or isotope dilution technique. The
latter includes addition of a defined amount of mass labelled analytes (both 13C-labelled
PFOA and PFOS) to the sample prior to extraction. Based on the ratio non-labelled (PFOA,
PFOS) to labelled (13 13C-PFOA, C-PFOS) analytes peak area and knowing the amount of the
labelled standard (internal standard) concentrations of target chemicals can be determined
with high precision.
29

Optimised Analytical Procedures
3.4 Sampling Campaigns
3.4.1 River Water, Waste Water and Sludge
During this doctoral work, two studies on surface and waste waters were performed.
During the first study, concentrations of PFOA and PFOS were investigated within 4 different
WWTPs, located in Upper Franconia, Bavaria, Germany, and in the respective rivers receiv-
ing treated waters. Waste water samples were collected at different steps of the treatment
process employed in the following plants Bayreuth, Kulmbach, Himmelkron, and Ramsen-
thal. At the same time, surface water samples upstream and downstream the outlet of the
plants were taken from rivers Roter Main (WWTP Bayreuth), Weißer Main (WWTPs Kulm-
bach and Himmelkron), and Trebgast (WWTP Ramsenthal). A detailed description of the
plants (average daily flow, number of inhabitants, waste water origin, and waste water treat-
ment), the rivers (average daily flow) and the sampling campaign is given in Publication II.
The second study focused on the WWTP Bayreuth that showed the highest mass load-
ings of PFOA and PFOS of the 4 WWTPs included in the first study and is a source of the
Roter Main contamination with PFOA and PFOS. In order to better assess the average mass
loading from the plant, waste waters were monitored for PFOA and PFOS from 14 March to
14 June 2007 every other week on Wednesday and Friday at 10 a.m.. Between 11 and 15 June
2007 at 8 a.m. and 2 p.m. river water samples were collected 1 km downstream the plant
twice a day. A detailed description of this sampling is given in Publication III.
3.4.2 Sediment
On 19 October 2006, sediment samples from the Roter Main were collected at four
different locations: a) 1 km upstream, b) 50 m downstream, c) 500 m downstream, and d) 1
km downstream the WWTP. At each location, 11 individual samples from the upper sediment
(~ 15 cm) were collected with a PP-tube (Ø = 10 cm) and transferred into 250-mL PP-bottles.
Water samples (n = 3) were also collected at each location. Details of the sampling campaigns
are presented in Publication IV.
3.4.3 Fish
On 28 August 2007, two fish species, i.e. chub (Leuciscus cephalus) (n = 6) and river
goby (Gobio gobio) (n = 5), were collected from the river Roter Main approximately 3 km
downstream the WWTP Bayreuth. The fish was caught by electro-fishing performed by the
30

Optimised Analytical Procedures
employees of the Bavarian Fishery Association. Collected species represented two different
fish families having different feeding strategies: chub feeds on water insects, larvae, snails,
mussels and worms, and reaches a size up to 40 cm, whereas goby is a bottom-feeding fish
that can reach up to 15 cm.
Caught fishes were immediately cooled and transported to the laboratory for further
analysis. Chubs were dissected and heart, liver, kidneys, gonads, and muscle tissue were
stored separately; only muscles and inner organs were separated of the river goby due to its
small size. Details about the collected fish including their size, weight as well as weight of
inner organs, and storing procedure are provided in Publication V.
31

Results and Discussion
4 Results and Discussion
4.1 Optimisation of Analytical Protocols
Elucidating possible sources of sample contamination with PFOA and PFOS during
the whole analytical protocol, including sampling, sample preparation, and measurement was
a very important step at the beginning of the work (Publication I). As PFOA and PFOS are
widely used, i.e. for production of laboratory equipment (Yamashita et al., 2004), use of such
equipment i.e. Teflon tubing or caps with Teflon septum was avoided. Although Yamashita et
al. (2004) reported contamination of some nylon filters, no traces of the analytes were found
on paper and nylon filters used for sample or extract filtration in the present doctoral thesis.
Tests of solvents used in different analytical protocols showed traces of PFOA (2 ng/L) in
MeOH but in no other solvent used; all of them were free of PFOS. To avoid contamination
from needles, valves or adapters employed during the SPE procedure a meticulous cleaning
procedure was developed (experimental section of Publication I). In comparison to tap, bidis-
tilled or Millipore water, deionised water had a low stable concentration of PFOA (0.22 ±
0.05 ng/L) and was chosen whenever water was necessary, i.e. for cartridge conditioning or as
a solvent for different solutions.
Methods of PFOA and PFOS determination in different environmental matrices such
as surface or waste water, sludge, sediment, fish tissues, employing sample extraction,
preconcentration and precleaning step followed by HPLC-ESI-MS/MS determination, were
developed and/or optimised. Background contamination with the target analytes of each of the
employed procedures was carefully evaluated. Procedural blanks for river (500 mL) and waste
(250 mL) water samples contained 0.03 and 0.06 ng/L PFOA, respectively (Publication I,
Publication II), whereas for sludge (Publication II), sediment (Publication IV) and fish
tissues (Publication V) they were below LOD.
Table 9. Recoveries [%] of the extraction procedures employed during the study.
Sample type Recovery Reference PFOA PFOS River and waste water 79 ± 08 074 ± 06 Publication II Sediment 73 ± 09 101 ± 10 Publication IV Sludge 95 ± 08 079 ± 07 Publication II Fish 88 ± 10 086 ± 10 Publication V
32

Results and Discussion
Table 10. LOQs of the extraction procedures employed during the study.
Sample type, sample size LOQ Reference PFOA PFOS River water, 500 mL 0.060 ng/L 0.120 ng/L Publication II Waste water, 250 mL 0.120 ng/L 0.240 ng/L Publication II Sediment, 1 g 0.025 µg/kg 0.050 µg/kg Publication IV Sludge, 100 mg 0.24. µg/kg 0.60. µg/kg Publication II Fish, (0.16 – 7 g) 0.5 – 9 µg/kg 01.0 – 18 µg/kg Publication V
Recoveries and LOQs of extraction procedures applied to particular sample types ana-
lysed during the study are listed in Tables 9 and 10.
An important aspect while using HPLC-ESI-MS/MS for the determination of trace
analytes is a possible ionisation suppression by coeluting matrix components (Publication I).
Therefore, to obtain reliable results, all sample preparation procedures used during this doc-
toral study included a SPE step, designed not only for analyte preconcentration but also for
matrix removal; and either standard addition method (i.e. Publication II) or isotope dilution
technique (Publications III-V) were employed for quantification.
4.2 River, Waste Water and Sludge
Results of surface water samples collected from three rivers (Roter Main, Weißer
Main, Trebgast) and waste waters from 4 different WWTPs (Bayreuth, Kulmbach,
Himmelkron, Ramsenthal) have been presented in Publication II. The same publication in-
cludes also the results for sludge samples collected from the WWTP Bayreuth and the de-
tailed study of mass flows of the analytes through this plant during the treatment process.
Publication III focused only on the WWTP of Bayreuth and the Roter Main. Results ob-
tained during both studies are summarized below.
4.2.1 River waters
PFOA was found above LOD (0.03 ng/L) in almost all river samples (exceptions:
samples collected upstream of the WWTP Bayreuth, Roter Main, March 2007). In all rivers
concentrations were relatively low upstream and increased downstream behind the outlets of
plants. Its presence upstream of the direct source in the studied cases mainly rural areas might
be due to its former use in plant protection formulations, atmospheric deposition, and other
small WWTPs located on the tributaries entering the river.
33

Results and Discussion
The highest PFOA concentrations in river waters were measured downstream the
WWTP Bayreuth in the Roter Main, on average 9 ± 4 ng/L (April 2005 – June 2007). PFOA
concentrations found in this river during the whole study period (<0.06 – 18 ng/L) are compa-
rable to those reported for the Guangzhou River, China (So et al., 2007), but much lower than
concentrations found in he rivers Yangtze, China (260 ng/L, So et al., 2007), Tennessee, USA
(140 – 600 ng/L, Hansen et al., 2002), or Moehne, Germany (3640 ng/L, Skutlarek et al.,
2006).
PFOS was detected in all but one river water sample (Weißer Main, upstream the
WWTP Himmelkron), its highest values were observed downstream the WWTP Bayreuth
Roter Main. In all rivers an increase in PFOS concentration in river water downstream the
respective WWTP was observed, although these values were slightly lower than expected
when assuming full mixing of river and waste waters. Between April 2005 and June 2007, the
average PFOS concentration in the Roter Main 1 km downstream the plant of Bayreuth was
31 ± 18 ng/L. PFOS concentrations (<0.12 – 35 ng/L) found in Roter Main during the re-
search period (April 2005 – June 2007) were higher than those reported for the North Ameri-
can rivers Hudson (1.5 – 3.4 ng/L), Niagara (3.3 – 6.7 ng/L, Sinclair et al, 2006), St. Clair
(1.9 – 3.9 ng/L) or Rising (3.5 ng/L, Kannan et al., 2005), comparable to those found in Ruhr,
Germany (2.5 – 43 ng/L, Skutlarek et al., 2006) or in Guangzhou, China (0.9 – 100 ng/L, So
et al., 2007), but lower than those in the rivers Tama, Japan (157 ng/L, Saito et al., 2003), or
Moehne, Germany (193 ng/L, Skutlarek et al., 2006).
Monitoring of the Roter Main revealed an increase in mass flows of both analytes
within its waters up to 80 % from morning to early evening (on 11, 13, and 14 June). The
mass flow of PFOA and PFOS followed the same pattern suggesting the same origin.
4.2.2 Liquid and solid wastes
PFOA was found above LOQ (0.06 ng/L) in all waste water samples collected from 4
different WWTPs in Upper Franconia, Germany (Publication II, table 2) with the highest
concentrations determined in the effluent of the biggest plant serving the highest number of
inhabitants (WWTP Bayreuth; 20 – 250 ng/L; Publication I and II). It was also found in all
solid wastes collected from this plant (Publication II, table 3), with the highest concentration
in waste activated and sewage sludge.
The highest PFOS concentrations were found in waste waters of the same WWTP
(14 – 400 ng/L, Publication I and II), the highest values were measured in the primary treat-
ment tank in March 2007. Its concentrations in solids were up to 120 µg/kg, and up to 7-fold
34
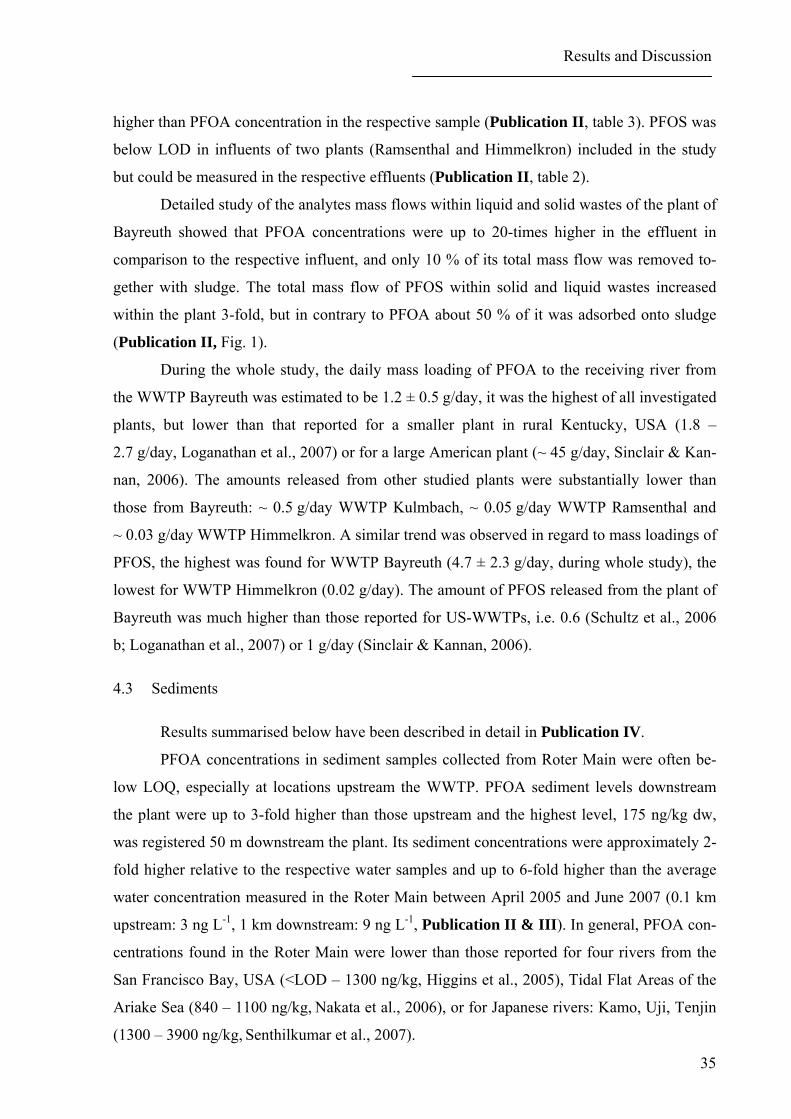
Results and Discussion
higher than PFOA concentration in the respective sample (Publication II, table 3). PFOS was
below LOD in influents of two plants (Ramsenthal and Himmelkron) included in the study
but could be measured in the respective effluents (Publication II, table 2).
Detailed study of the analytes mass flows within liquid and solid wastes of the plant of
Bayreuth showed that PFOA concentrations were up to 20-times higher in the effluent in
comparison to the respective influent, and only 10 % of its total mass flow was removed to-
gether with sludge. The total mass flow of PFOS within solid and liquid wastes increased
within the plant 3-fold, but in contrary to PFOA about 50 % of it was adsorbed onto sludge
(Publication II, Fig. 1).
During the whole study, the daily mass loading of PFOA to the receiving river from
the WWTP Bayreuth was estimated to be 1.2 ± 0.5 g/day, it was the highest of all investigated
plants, but lower than that reported for a smaller plant in rural Kentucky, USA (1.8 –
2.7 g/day, Loganathan et al., 2007) or for a large American plant (~ 45 g/day, Sinclair & Kan-
nan, 2006). The amounts released from other studied plants were substantially lower than
those from Bayreuth: ~ 0.5 g/day WWTP Kulmbach, ~ 0.05 g/day WWTP Ramsenthal and
~ 0.03 g/day WWTP Himmelkron. A similar trend was observed in regard to mass loadings of
PFOS, the highest was found for WWTP Bayreuth (4.7 ± 2.3 g/day, during whole study), the
lowest for WWTP Himmelkron (0.02 g/day). The amount of PFOS released from the plant of
Bayreuth was much higher than those reported for US-WWTPs, i.e. 0.6 (Schultz et al., 2006
b; Loganathan et al., 2007) or 1 g/day (Sinclair & Kannan, 2006).
4.3 Sediments
Results summarised below have been described in detail in Publication IV.
PFOA concentrations in sediment samples collected from Roter Main were often be-
low LOQ, especially at locations upstream the WWTP. PFOA sediment levels downstream
the plant were up to 3-fold higher than those upstream and the highest level, 175 ng/kg dw,
was registered 50 m downstream the plant. Its sediment concentrations were approximately 2-
fold higher relative to the respective water samples and up to 6-fold higher than the average
water concentration measured in the Roter Main between April 2005 and June 2007 (0.1 km
upstream: 3 ng L-1, 1 km downstream: 9 ng L-1, Publication II & III). In general, PFOA con-
centrations found in the Roter Main were lower than those reported for four rivers from the
San Francisco Bay, USA (<LOD – 1300 ng/kg, Higgins et al., 2005), Tidal Flat Areas of the
Ariake Sea (840 – 1100 ng/kg, Nakata et al., 2006), or for Japanese rivers: Kamo, Uji, Tenjin
(1300 – 3900 ng/kg, Senthilkumar et al., 2007).
35

Results and Discussion
PFOS sediment concentrations were up to 17-fold higher than those of PFOA in the
respective sediment sample, and 20- to 40-fold higher than in the respective water sample or
than in the average water concentration determined in the river water between April 2005 and
June 2007 (0.1 km upstream: 2.0 ng/L, 1 km downstream: 30 ng/L, Publication II & III),
which is due to its stronger adsorption potential. PFOS sediment concentration increased after
the outlet of the plant up to 4-fold and was comparable to those of the Ariake Sea (90 –
140 ng/kg, Nakata et al., 2006) or of rivers from the San Francisco Bay (160 – 230 ng/kg,
Higgins et al., 2005) but lower than reported for the rivers Tenjin or Osaka in Japan (3800 –
11000 ng/kg, Senthilkumar et al., 2007).
No correlation between the level of either analyte and the total organic content (TOC)
was observed, although such a correlation has been suggested (Higgins & Luthy, 2006). John-
son et al. (2007) suggested that adsorption of these PFSs to sediments with low TOC content
is partially controlled by electrostatics, and thus their fate and transport in an aquatic system
can also be influenced by inorganic materials, as well as pH of water and sediment.
4.4 Fish
PFOA concentrations in different tissues of the chubs were in most cases below LOQ,
only in gonads it was found more frequently (in four out of six; <0.4 µg/kg ww up to
9.7 µg/kg ww). PFOA concentrations in river gobies were generally higher, up to 3.0 µg/kg
ww in inner organs, and up to 9.8 µg/kg ww in muscles.
Overall, PFOA concentrations measured in fish collected from the Roter Main were
lower than in eel, barb, carp, nase, or greyling (muscles: 6.4 – 53 µg/kg ww, livers: 2.6 –
840 µg/kg ww, BLfU, 2007 b) collected from the highly contaminated river Alz, Germany
(up to 7.5 µg/L of PFOA, BLfU, 2007 c) but higher than in largemouth or smallmouth bass
from the River Raisin, St. Clair and Calumet, USA (muscle <2 µg/kg ww, Kannan et al.,
2005), in trout from Lake Ontario (whole body: 1µg/kg ww, Martin et al., 2004), or in white
fish purchased on a Catalan market in Spain (muscles: <0.065 µg/kg ww, Ericson et al.,
2008).
PFOS concentrations measured in the caught fish were higher than those of PFOA,
and ranged from 7.5 µg/kg ww (muscles) up to 250 µg/kg ww (gonads) in chubs, and from
69 µg/kg ww (muscles) up to 406 µg/kg ww (inner organs) in gobies, probably due to its
higher water and sediment concentrations (25 ng/L and 240 ng/kg, respectively).
Average PFOS concentrations in different tissues of chub were highest in liver, and
kidneys, followed by gonads and heart; lowest values were measured in muscles. This is in a
36

Results and Discussion
good agreement with previously published data showing that PFOS accumulates mainly in
liver (Giesy et al., 2001; Kannan et al., 2005), kidneys (Martin et al., 2004; Van de Vijver et
al., 2005) and gonads (Martin et al., 2003). Concentrations found in chub liver are comparable
to those of smallmouth bass from New York State lakes (10 – 140 µg/kg ww, Sinclair et al.,
2006), chinook salmon (30 – 170 µg/kg ww) or whitefish (33 – 81 µg/kg ww) of the Great
Lakes (Kannan et al., 2005) but lower than those in eel, perch, roach from rivers Main and
Alz (liver: 15 – 4300 µg/kg ww, BLfU, 2007 b) or in carp or gibel carp from Flanders, Bel-
gium (10 – 9030 µg/kg ww, Hoff et al., 2005). PFOS muscles concentrations were similar to
those found in fish from other Bavarian rivers (BLfU, 2007 b).
PFOS levels in river goby were 3- to 4-times higher than in chub, in average in muscle
tissues 80 ± 17 µg/kg ww and in combined inner organs (liver, kidneys, heart, gonads, intes-
tines) 300 ± 80 µg/kg ww. According to Higgins et al. (2006), PFSs are readily bioavailable
in sediments, this is in a good agreement with the fact that PFOS-concentrations were higher
in river gobies, feeding mainly on invertebrates living in the sediment that was shown to con-
tain PFOS levels 22-fold higher than water.
BAF for PFOA between muscle tissue of river gobies and its concentrations in the
river was calculated to be 740, it was higher than that reported for rainbow trout exposed to
this chemical under laboratory conditions by Martin et al. (2007, BAF = 4). BAFs of PFOS
calculated for chubs’ livers or river gobies’ inner organs relative to the average water concen-
tration (median Roter Main, 1 km downstream the plant, March - June 2007 = 27 ng/L) were
4650 and 10900, respectively. BAFs are in a good agreement with those calculated for coastal
fish from Japan (8540, Taniyasu et al., 2003) or the Niagara River, USA (8850, Houde et al.,
2006).
37
Conclusions and Recommedations
5 Conclusions and Recommendations
In order to obtain reliable data while analysing traces of PFSs, such as PFOA and
PFOS, potential sources of background contamination must be elucidated and eliminated or at
least minimised when elimination is not possible. Using HPLC-ESI-MS/MS for determina-
tion, special attention has to be paid to possible interferences arising from co-eluting sample
matrix. Thus, employed analytical procedures should be designed to ensure effective removal
of such interferences, furthermore, suitable quantification methods, such as isotope dilution
technique or standard addition, have to be employed.
Data obtained during the present study showed that at sites without direct fluoropro-
duction activity, treated waste waters are a major source of river pollution with PFOA and
PFOS. The highest release of both analytes from 4 Upper-Franconian WWTPs was observed
for the plant serving the largest population, having the highest average daily flow, and treating
waste waters mostly of industrial and commercial origin. The lowest mass loading of PFOA
and PFOA was observed for the smallest plant treating waste waters of only domestic source.
Degradation of their precursors during the waste water treatment process pose an additional
flux of PFOA and PFOS inside the plants, while PFOA passes a plant almost undiminished to
enter receiving waters, almost a half of PFOS is adsorbed onto sludge. Monitoring of waste
waters released from the plant of Bayreuth enabled to estimate the average daily release from
this facility to be 1.2 ± 0.5 g PFOA and 4.7 ± 2.3 g PFOS.
Once released to the river, PFOA and PFOS partition into the sediment, which is re-
flected in their higher concentrations registered downstream the plant, with the latter showing
the higher adsorption potential. Even adsorbed on sediments, they are still bioavailable for the
biota inhabitating the given ecosystem, which in turn is reflected in their higher levels found
in the fish species feeding on the invertebrates sucked up from the sediment.
PFOS released from the WWTP, present in waters and sediments of the river, is bioac-
cumulated in aquatic organisms, its tissue distribution in fish follows the pattern: liver > kid-
neys > gonads, heart >> muscles. PFOA has a lower bioaccumulation potential.
In order to get a wider perspective of PFS’s sources, fate and distribution in an envi-
ronment as the Roter Main, optimisation of the presented analytical methods to enable inves-
tigation of a broader spectra of analytes, such as precursors of PFOA and PFOS, longer and
shorter chain PFSs is necessary. Analysis of such precursor chemicals could help better un-
derstand processes taking place during the waste water treatment resulting in an additional
flux of PFOA and PFOS.
38

Conclusions and Recommedations
Due to the fact that neither of the two analytes of interest can undergo degradation in
the environment, the best solution to avoid further contamination of the aquatic environment
would be prevention of their release. Tang et al. (2006, 2007) suggested that PFOS could be
removed from waste waters by reverse osmosis and/or nanofiltration. Application of this or
any other technique enabling removal of PFSs from waste waters, preferably before they
reach WWTP, should be further investigated.
Moreover, exposure experiments performed with the target analytes on aquatic organ-
isms at environmental concentrations would assist estimation of the extent of the problem that
living beings are facing due to PFSs’ release.
39
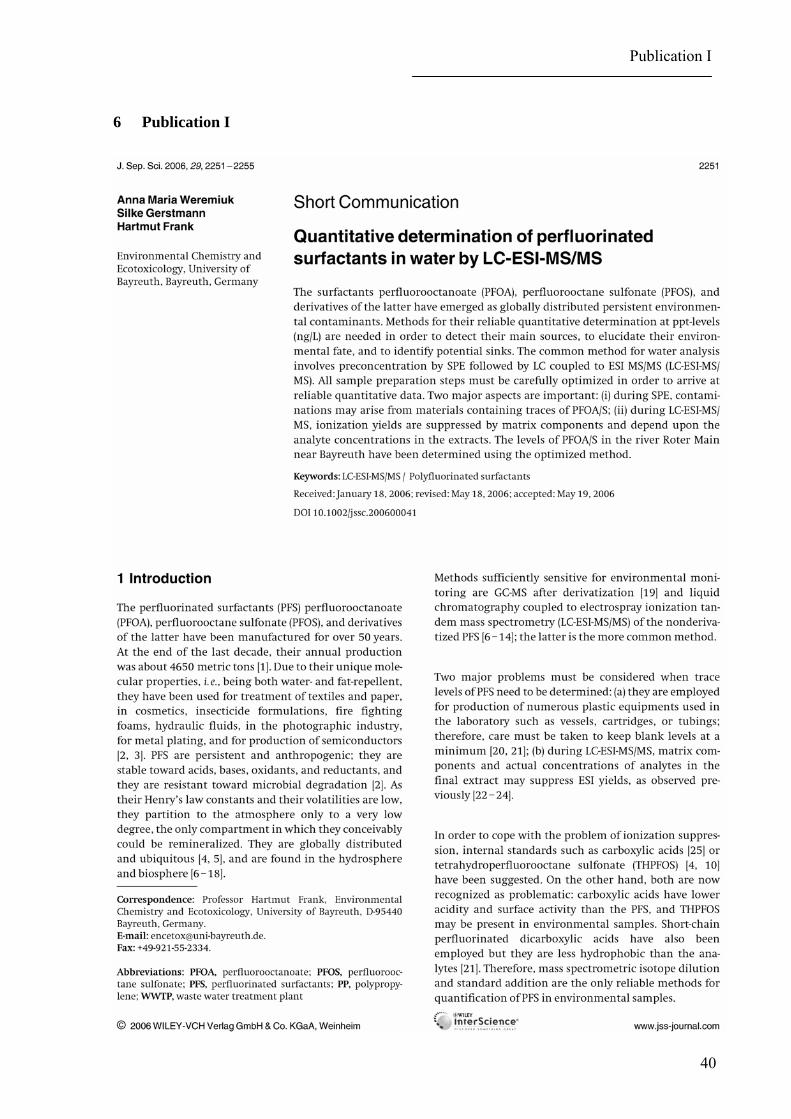
Publication I
6 Publication I
40
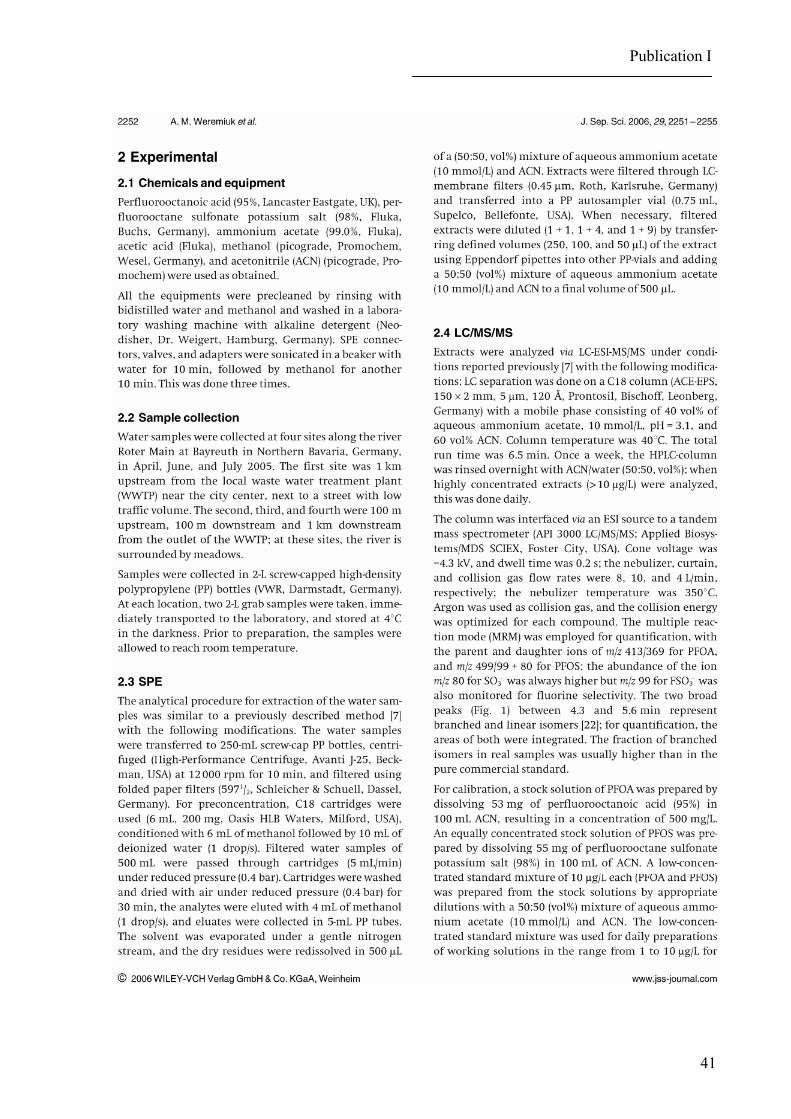
Publication I
41

Publication I
42

Publication I
43

Publication I
44

Publication II
7 Publication II
45

Publication II
46

Publication II
47
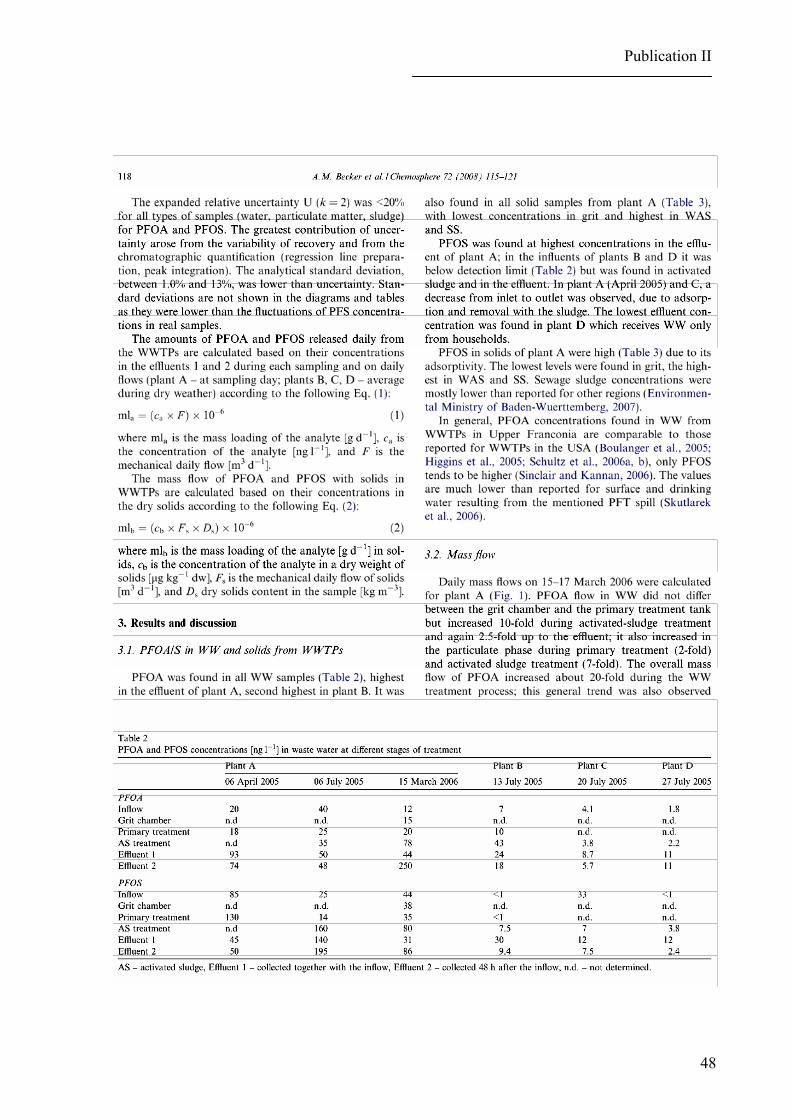
Publication II
48

Publication II
49

Publication II
50

Publication II
51

Publication III
8 Publication III
Perfluorooctanoic Acid and Perfluorooctane Sulfonate
Released from a Waste Water Treatment Plant in Bavaria, Germany
Anna M. Becker, Magdalena Suchan, Silke Gerstmann, Hartmut Frank
Abstract
Background, Aim and Scope:
Perfluorooctanoate (PFOA), perfluorooctane sulfonate (PFOS), and their precursors and de-
rivatives have been employed as surfactants and anti-adhesives. As PFOA and PFOS are envi-
ronmentally persistent, they have been detected, sometimes at high levels (e.g. 4.4 µg/L River
Möhne, Germany), in surface waters and in the aquatic food chain.
The discharge of municipal waste waters is one of the principal routes of PFOA and PFOS to
the aquatic environment. In a previous study, their concentration in grab samples collected
from the waste water treatment plant (WWTP) of Bayreuth, a city of 72 000 inhabitants in
Bavaria, Germany, during two periods showed significant differences. In order to estimate
representative released amounts, the surfactants were monitored every second week over a
period of three months. In a second campaign, river water receiving the WWTP-effluent was
sampled twice a day for 5 consecutive days.
Materials and Methods:
Quantitative analysis was done by stable-isotope dilution, pre-cleaning and pre-concentration
by solid phase extraction, and liquid chromatography followed by electrospray ionisa-
tion/tandem mass spectrometry.
Results:
The mass flows of PFOA and PFOS through the WWTP were determined. PFOA is fully dis-
charged into the river, while about half of PFOS is retained in the sewage sludge. The average
daily mass load of the river Roter Main by the WWTP of Bayreuth is about 1.2 ± 0.5 g PFOA
and 5 ± 2 g PFOS, with variations of up to 140 % within one day.
52

Publication III
Discussion:
In general, fluctuations in mass flow for both PFOA and PFOS followed a similar pattern
suggesting their release from sources where both substances are used in fixed ratio.
Conclusion:
Overall, the total annual release to the rivers of Germany may be in the range of several hun-
dred kilograms of PFOA and several tons of PFOS.
Recommendations and Perspectives:
The release from WWTPs is likely to contribute to high perfluorinated surfactant (PFS) levels
in fish; therefore, further ecotoxicological investigation with aquatic organisms is recom-
mended. As perspective, specific techniques for removal of PFSs from the waste water at the
point of origin need to be developed and implemented.
Keywords: HPLC-ESI-MS/MS; perfluorooctanoic acid; perfluorooctane sulfonate; river wa-
ter; waste water; perfluoroalkyl surfactants.
Introduction
Perfluoroalkyl surfactants (PFSs) have high thermal and chemical stability and unique physi-
cal and chemical properties. They are employed for a wide range of applications to serve as
liquid repellents for paper, leather, textiles, and carpets, as industrial surfactants, additives and
coatings, as constituents of fire fighting foams, and as anti-adhesives in the processing of
polymers (Kissa 2001). Thus, the application and use of PFS-containing products during
manufacturing processes constitute an important source of PFSs in the aquatic environment
(Dinglasan et al. 2004).
Perfluorooctanoate (PFOA) and perfluorooctane sulfonate (PFOS) are persistent (Preven-
douros et al. 2006) degradation products of industrially used PFTs (Lange 2001), PFOA also
of fluorootelomer alcohols (Dinglasan et al. 2004). PFOA and PFOS have been detected fre-
quently in river and lake water (0.1 - 10 ng/L of PFOA) (Prevendouros et al. 2006), sediments
(e.g, 0.4 µg/kg PFOA, and 3.8 µg/kg PFOS) (Higgins et al. 2005), sludge (5.6 µg/kg PFOA,
and up to 2600 µg/kg PFOS) (Higgins et al. 2005), Oysters (Matagorda Bay, USA, PFOS up
to 1.2 mg/kg wet weight) (Kannan et al. 2002), fish (0.5 µg/kg wet weight of PFOS in the
liver of eel, river Main near Bamberg, Bavaria, Germany) (Corinna 2006), reptiles (PFOS
53

Publication III
0.3 mg/kg wet weight in liver of green frogs, Michigan, USA) (Houde et al. 2006), and
mammals (PFOS up to 180 mg/kg wet weight in liver of mice inhabiting a fluorochemical
plant, Antwerp, Belgium) (Houde et al. 2006).
The discharge of municipal waste water is the one of the principal routes of PFOA and PFOS
to enter the aquatic environment (Boulanger et al. 2005, Schultz et al. 2006 a, b, Sinclair and
Kannan 2006, Loganathan et al. 2007) but strong fluctuations in mass flow were observed at
the middle-sized waste water treatment plant (WWTP) of Bayreuth (Upper Franconia, Bava-
ria, Germany) (Becker et al. 2008). In order to better estimate the typical amounts daily re-
leased, PFOA and PFOS were monitored in waste and river water every second week from 14
March to 15 June 2007, and twice a day from 11 to 15 June 2007.
1 Materials and Methods
1.1 Chemicals and Equipment
Perfluorooctanoic acid (95 %, Lancaster Eastgate, UK), [1, 2- 13C2]-perfluorooctanoic acid
(98 %, Perkin Elmer, Boston, USA), perfluorooctane sulfonate potassium salt (98 %, Fluka,
Buchs, Germany), [1, 2, 3, 4-13C4]-perfluorooctane sulfonate sodium salt (99 %, 50 μg/mL-
solution in MeOH, Campro Scientific, Berlin, Germany), acetic acid (100 %, Merck, Darm-
stadt, Germany), ammonium acetate (99.0 %, Fluka, Buchs, Germany), MeOH, and AcN (pi-
cograde, Promochem, Wesel, Germany) were used as obtained. The equipment was pre-
cleaned as described previously (Weremiuk et al. 2006); Teflon equipment was avoided.
1.2 Sample Collection
Grab water samples were collected in spring 2007 from the municipal WWTP of Bayreuth
(Upper Franconia, Bavaria, Germany) serving a population of 72 000 inhabitants and dis-
charging about 1670 m3/h into the river Roter Main, the latter having an average hourly flow
11 250 m3. The inflowing waste water first passes a mechanical stage for removal of big ob-
jects (bottles or branches), grit and sand, a primary sedimentation basin (~ 2 hour), a biologi-
cal treatment basin (~ 30 h), and another basin for clarification (~ 16 h) (Becker et al. 2008).
The treated waste water is discharged into the river approximately 48 hours after inflow.
From 14 March to 18 May 2007, grab water samples were collected every other week on
Wednesday (10:00 h) from the WWTP (4 x 250 mL) and the river (4 x 500 mL) with pre-
cleaned 500-mL PP-bottles. On each Friday at 10:00 h, i.e. forty eight hours after the first
54
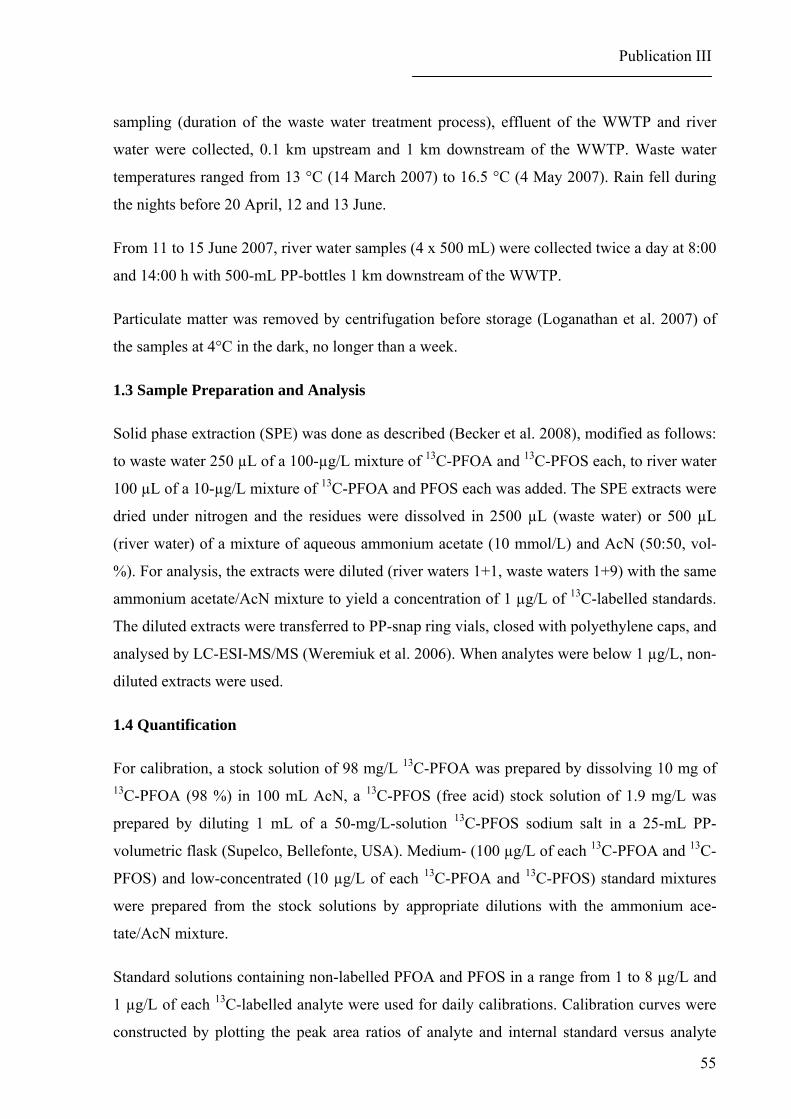
Publication III
sampling (duration of the waste water treatment process), effluent of the WWTP and river
water were collected, 0.1 km upstream and 1 km downstream of the WWTP. Waste water
temperatures ranged from 13 °C (14 March 2007) to 16.5 °C (4 May 2007). Rain fell during
the nights before 20 April, 12 and 13 June.
From 11 to 15 June 2007, river water samples (4 x 500 mL) were collected twice a day at 8:00
and 14:00 h with 500-mL PP-bottles 1 km downstream of the WWTP.
Particulate matter was removed by centrifugation before storage (Loganathan et al. 2007) of
the samples at 4°C in the dark, no longer than a week.
1.3 Sample Preparation and Analysis
Solid phase extraction (SPE) was done as described (Becker et al. 2008), modified as follows:
to waste water 250 µL of a 100-µg/L mixture of 13 13C-PFOA and C-PFOS each, to river water
100 µL of a 10-µg/L mixture of 13C-PFOA and PFOS each was added. The SPE extracts were
dried under nitrogen and the residues were dissolved in 2500 µL (waste water) or 500 µL
(river water) of a mixture of aqueous ammonium acetate (10 mmol/L) and AcN (50:50, vol-
%). For analysis, the extracts were diluted (river waters 1+1, waste waters 1+9) with the same
ammonium acetate/AcN mixture to yield a concentration of 1 µg/L of 13C-labelled standards.
The diluted extracts were transferred to PP-snap ring vials, closed with polyethylene caps, and
analysed by LC-ESI-MS/MS (Weremiuk et al. 2006). When analytes were below 1 µg/L, non-
diluted extracts were used.
1.4 Quantification
For calibration, a stock solution of 98 mg/L 13C-PFOA was prepared by dissolving 10 mg of 13C-PFOA (98 %) in 100 mL AcN, a 13C-PFOS (free acid) stock solution of 1.9 mg/L was
prepared by diluting 1 mL of a 50-mg/L-solution 13C-PFOS sodium salt in a 25-mL PP-
volumetric flask (Supelco, Bellefonte, USA). Medium- (100 µg/L of each 13 13C-PFOA and C-
PFOS) and low-concentrated (10 µg/L of each 13 13C-PFOA and C-PFOS) standard mixtures
were prepared from the stock solutions by appropriate dilutions with the ammonium ace-
tate/AcN mixture.
Standard solutions containing non-labelled PFOA and PFOS in a range from 1 to 8 µg/L and
1 µg/L of each 13C-labelled analyte were used for daily calibrations. Calibration curves were
constructed by plotting the peak area ratios of analyte and internal standard versus analyte
55

Publication III
concentrations. The regression coefficients were higher than 0.995. The limits of quantifica-
tion (LOQ, signal to noise ratio 7) for river and waste water were 0.06 and 0.12 ng/L PFOA
and 0.12 and 0.24 ng/L PFOS, respectively. Procedural blanks using deionised water were
0.015 ng PFOA; PFOS was below the limit of detection (signal to noise ratio 3).
The expanded relative uncertainty U (k = 2) was <20 % for PFOA and PFOS. The analytical
standard deviation, between 1 % and 15 %, was lower than uncertainty. Standard deviations
are not shown in the diagrams and the tables as they were much smaller than the variation of
concentrations in real samples.
The mass flows of PFOA and PFOS in the WWTP were calculated by:
(1) mfwa = (ca x Fw) x 10-3
where mfw is the mass flow of analyte in the waste waters [mg/h], ca a the concentration of
analyte [ng/L], and Fw the mechanical hourly flow [m3/h].
The mass flows in river water downstream the WWTP were calculated similarly by:
(2) mfra = (ca x F ) x 10-3R
where mfra is the mass flow of analyte [mg/h], ca the concentration of the analyte [ng/L], and
F the river water flow [m3/h]. R
2 Results
2.1 Waste Water
PFOA was found in all treated waste water samples (Tab. 1) in concentrations ranging from
20 to 73 ng/L, with an average of 44 ± 19 ng/L, similar to those reported for 2005 and 2006
(60 ± 20 ng/L, Becker et al. 2008). In the WWTP-effluent the mass flows of PFOA were 1.3-
to 4.5-fold higher than in the influent (Fig. 1a), ranging from 25 mg/h (16 May 2007) up to
84 mg/h (16 March 2007). Correlation to water flow through the WWTP or to water tempera-
ture was not observed.
Concentrations of PFOS (Fig. 1b) were about 10-fold higher than PFOA. Highest levels (300
– 390 ng/L) were found in the primary treatment stage in March and April 2007, lowest (60,
86 ng/L, respectively) in the influent and in the primary treatment stage in May 2007. The
56

Publication III
mass flow of PFOS through the WWTP was higher in March and April 2007 (Figure 1b),
ranging from 60 (inflow, 2 May 2007) to 640 mg/h (primary treatment, 18 April 2007). The
mass flow in the water phase decreased during the treatment process except for the samples of
2 and 4 May 2007 when effluent temperatures were relatively high (17 °C).
Figure 1. Mass flow of PFOA (a) and PFOS (b) in WWTP of Bayreuth in mg/h, 14 March –
18 May 2007. WW flow registered at the time of sampling.
2.2 River Water
PFOA in river water (Tab. 1) upstream the WWTP was below detection limit (16 and 30
March 2007) or between 1 and 2 ng/L (April and May 2007). The concentrations 1 km down-
stream the WWTP were as expected for complete mixing of river and waste water or slightly
lower. Between 11 and 15 June 2007 they were higher (11 ± 4 ng/L) than in the preceding
Table 1. PFOA and PFOS concentrations [ng/L] determined in the effluent of the WWTP and
the receiving river (Roter Main), and calculated values under assumption of complete mixing.
16 March 30 March 20 April 04 May 18 May River flow, m3/h 12 300 12 420 7 850 5 470 7 560
PFOA (ng/L) River – 0.1 km upstream < 0.06 < 0.06 2.0 1.0 1.2 Effluent 73.00 3900 49.00 38.00 20.00 River – 1 km downstream 08.00 4 6 6 3.1
Calculated 07.00 4 8 7.6 3.9
PFOS (ng/L) River – 0.1 km upstream < 0.12 1.0 1.0 1.0 1.5 Effluent 252.00 241 336 192 106 River – 1 km downstream 031.00 18 32 27 9.9
Calculated 024.00 25 44 34 16.4
57

Publication III
months (5.4 ± 1.9 ng/L), corresponding to the lower river flow during summer time. The total
mass flow in the river was not significantly different for the two periods: 50 ± 30 mg/h from
March to May, and 70 ± 20 mg/h in June (Fig. 2). The highest load was registered on Friday
morning, 15 June 2007 (96 mg/h), the lowest on Monday morning, 11 June (34 mg/h). On 11,
13, and 14 June, the mass flow increased from morning to early afternoon by up to 80 %.
PFOS concentrations in the river water upstream the WWTP (Tab. 1) were about 1 ng/L, on
16 and 30 March 2007 below quantification limit. Concentrations determined 1 km down-
stream were strongly raised by the WWTP-release, slightly lower than calculated for full mix-
ing of waste and river water; only in one case it was higher (16 March 2007). Concurrent with
those of PFOA, the highest mass load of PFOS (Fig. 2) was registered on Friday morning 15
June 2007 (96 mg/h), the lowest on Monday morning, 11 June (34 mg/h). On 11, 13, and 14
June, the mass flow increased from morning to early afternoon by up to 80 %.
0
3
6
9
12
15
0
100
200
300
400
8:00
14:0
0
8:00
14:0
0
8:00
14:0
0
8:00
14:0
0
8:00
14:0
0
rive
r wat
er fl
ow, x
100
0 m
3/h
mas
s flo
w, m
g/h
PFOA PFOS River Water f low
11/06 12/06 13/06 14/06 15/06Tuesday Wednesday Thursday FridayMondaySunday Monday Tuesday WednesdaySaturdayWW of
effluent on
Time
Figure 2. PFOA and PFOS mass flows [mg/h] in river water 1 km downstream the WWTP;
samples were collected daily at 8:00 and 14:00 h.
58

Publication III
3 Discussion
The mass flow of PFOA in waste water increased eightfold from inlet to outlet on 14 and 16
March 2007, and entailed an average release of 47 ± 23 mg/h PFOA (i.e 1.1 g/day) into the
river. This is in good agreement with previous findings (1.4 g/day) (Becker et al. 2008), lower
than reported for a plant in rural Kentucky in 2005 (1.8 to 2.7 g/day) serving a population of
15 000 inhabitants with a capacity of 20 000 m3/day (Loganathan et al. 2007), and much
lower than reported (~ 45 g/day) for a large US-plant (130 000 m3/day) (Sinclair and Kannan
2006).
The mass flow of PFOS in the water phase of a WWTP usually decreases to about half due to
adsorption on sewage sludge, influenced by numerous factors such as rate of formation from
precursors, relative amounts of sludge, temperature, relative flows etc. (Schultz et al. 2006 a,
b, Sinclair and Kannan 2006). The average release of PFOS into the river was calculated as
240 ± 90 mg/h (~ 6 g/day), higher than in summer 2005 (3.3 g/day) (Becker et al. 2008) or
reported for US-WWTPs, i.e. 0.6 (Schultz et al. 2006 b, Loganathan et al. 2007) to 1 g/day
(Sinclair and Kannan 2006).
In general, fluctuations in mass flow for PFOA and PFOS follow a similar pattern suggesting
their release from sources where both substances are used in fixed ratio, most likely as an
anti-adhesive additive in certain technical applications.
Overall, the concentrations of PFOA in the river Roter Main receiving treated waste water
ranged from 3 – 18 ng/L, comparable to typical concentrations determined in the river Ruhr,
Germany (<LOD – 7.5 ng/L) (Lange 2004) or in the river Guangzhou, China (0.85 – 13 ng/L)
[17], but much lower than the concentrations in the rivers Yangtze (260 ng/L) (so et al.
2007), Tennessee, USA (140 – 600 ng/L) (Hansen et al. 2002), or Moehne, Germany
(3640 ng/L) (Skutlarek et al. 2006). The presence of low concentrations of PFOA upstream
the WWTP (<0.06 – 2 ng/L) might result from atmospheric deposition, run-off in the water-
shed, and from small WWTPs located on tributaries entering the river upstream of the sam-
pling point.
The concentrations of PFOS (10 – 76 ng/L) are comparable to those found in the Ruhr (2.5 –
43 ng/L) (Lange 2004), the river Guangzhou in China (0.9 – 100 ng/L) (So et al. 2007), lower
than the concentrations in the river Tama in Japan (157 ng/L) (Saito et al. 2003), the river
59

Publication III
Yangtze, China (So et al. 2007), or the river Moehne, Germany (193 ng/L), but higher than in
the US-rivers Hudson (1.5 – 3.4 ng/L), Niagara (3.3 – 6.7 ng/L) (Sinclair et al. 2006), St.
Clair (1.9 – 3.9 ng/L), or Rising (3.5 ng/L) (Kannan et al. 2005).
4 Conclusions
The reported data together with those from a previous study (Becker et al. 2008) present evi-
dence that the average daily mass load from the treated waste water of Bayreuth into the river
Roter Main is about 1.2 ± 0.5 g PFOA and 5 ± 2 g PFOS; large fluctuations are obvious and
may depend on industrial activity schemes. Additional releases from WWTPs further down-
stream are likely to contribute to high PFS-levels in fish (Corinna 2006). Overall, the total
annual release to the rivers of Germany may be in the range of several hundred kilograms of
PFOA and several tons of PFOS.
5 Recommendations and Perspectives
Once released to the aquatic environment PFOA and PFOS due to their persistence are likely
to adsorb on sediments or bioaccumulate in biota inhabiting such water bodies. To assess the
impact such mass loading of PFSs from WWTPs can have on aquatic ecosystems, further in-
vestigations including sediments, benthic organisms and fish is recommended. In order to
obtain a more complete picture of the persistent PFSs released to the Roter Main with waste
waters, determination of a wider range of compounds is needed.
Acknowledgments
We would like to acknowledge Bayerische Forschungsstiftung for financial support. We
thank the Bureau of Water Management of Hof and employees of WWTP of Bayreuth for
their cooperation.
List of References
Becker AM, Gerstmann S; Frank H.: Perfluorooctane surfactants in waste waters, the major
source of river pollution. Chemosphere (in press)
Boulanger B, Vargo JD, Schnoor JL, Hornbuckle KC (2005): Evaluation of perfluorooctane
surfactants in wastewater treatment system and in a commercial surface protection
product. Environ Sci Technol 39:5524-5530
60

Publication III
Corinna H. Greenpeace e.V., Press release published online 9/2006 http://www.green
peace.de/fileadmin/gpd/user_upload/themen/umweltgifte/greenpeace_chemie_im_aal.
Dinglasan M, Ye Y, Edwards E, Mabury S (2004): Fluorotelomer alcohol yields poly and
perfluorinated acids. Environ Sci Technol 38:2857-2664
Hansen KJ, Johnson HO, Eldridge JS, Butenhoff JL, Dick LA (2002): Quantitative charac-
terization of trace levels of PFOS and PFOA in the Tennessee River. Environ Sci
Technol 36:3316-3321
Higgins CP, Field JA, Criddle CS, Luthy RG (2005): Quantitative determination of perfluoro
chemicals in sediments and domestic sludge. Environ Sci Technol 39:3946-3956
Houde M, Martin JW, Letcher RJ, Solomon KR, Muir DCG (2006): Biological monitoring of
perfluoroalkyl substances: a rewiev. Environ Sci Technol 40:3463-3473
Kannan K, Hansen KJ, Wade TL, Giesy JP (2002): Perfluorooctane sulfonate in oysters,
Crassostrea virginica, from the Gulf of Mexico and Chesapeake Bay, USA. Arch En-
viron Contam Toxicol 42:313-318
Kannan K, Tao L, Sinclair E, Pastva SD, Jude DJ, Giesy JP (2005): Perfluorinated com-
pounds in aquatic organisms of various trophic levels in Great Lakes food chain. Ar-
chiv Environ Contam Toxicol 48:559-556
Kissa E (2001): Fluorinated surfactants and repellents. New York: Marcel Dekker, Inc.
Lange C (2001): The 18-day aerobic biodegradation study of perfluorooctanesulfonyl-based
chemistries; 3M, Docket AR-226-E01-0415; U.S. Environmental Protection Agency:
Washington, DC
Lange, F. (2004): Rückstände perfluorierter Verbindungen auch in deutschen Gewässern.
TZW aktuell(15):2
Loganathan BG, Sajwan KS, Sinclair E, Kumar KS, Kannan K (2007): Perfluoroalkyl sul
fonates and perfluorocarboxylates in two wastewater treatment facilities in Kentucky
and Georgia. Water Research 41:4611-4620
61

Publication III
Prevedouros K, Cousins JT, Buck RC, Korzeniowski SH (2006): Sources fate and transport of
perfluorocarboxylates. Environ Sci Technol 40:32-44
Saito N, Sasaki K, Nakatome K, Harada K, Yoshinaga T, Koizumi A (2003): Perfluorooctane
sulfonate concentrations in surface water in Japan. Arch Environ Contam Toxicol
45:149-158
Schultz MM, Barofsky DF, Field JA (2006 a): Quantitative determination of fluorinated alkyl
substances by large-volume- injection liquid chromatography tandem mass spectrome-
try – characterization of municipal wastewaters. Environ Sci Technol 40:289-295
Schultz MM, Higgins CP, Huset CA, Luthy RG, Barofsky DF, Field JA (2006 b): Fluoro-.
chemical mass flow in a municipal wastewater treatment facility. Environ Sci Technol
40:7350-7357
Sinclair E, Kannan K (2006): Mass loading and fate of perfluoroalkyl surfactants in wastewa-
ter treatment plants. Environ Sci Technol 40:1408-1414
Sinclair E, Mayack DT, Roblee K, Yamashita N, Kannan K (2006): Perfluorinated com-
pounds in aquatic organisms at various trophic levels in a Great Lakes food chain.
Archiv Environ Contam Toxicol 50:398-410
Skutlarek D, Exner M, Färber H (2006): Perfluorinated surfactants (PS) in surface and drink-
ing waters. Environ Sci Pollut Res 13:299-307
So MK, Miyake WY, Yeung WY; Ho YM, Taniyasu S, Rostkowski P, Yamashita N, Zhou
BS, Shi XJ, Wang JX, Giesy JP, Yu H, Lam PKS (2007): Perfluorinated compounds
in the Pearl River and Yangtze River of China. Chemosphere 68:2085-2095
Weremiuk AM, Gerstmann S, Frank H (2006): Quantitative determination of perfluorinated
surfactants in water by LC-ESI-MS/MS. J Sep Sci 29,2251-2255
62

Publication IV
9 Publication IV
63
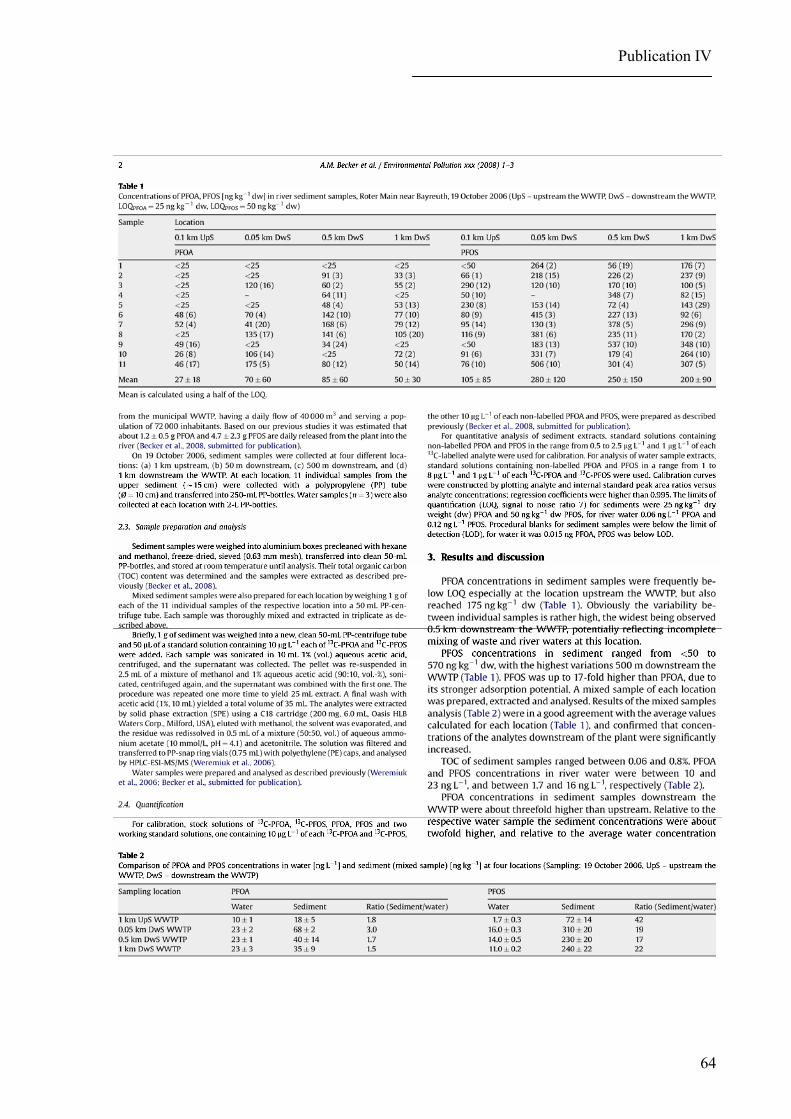
Publication IV
64

Publication IV
65

Publication V
10 Publication V
Perfluorooctanoic Acid and Perfluorooctane Sulfonate in Two Fish Species
Collected from the Roter Main River, Bayreuth, Germany
Anna M. Becker, Silke Gerstmann, Hartmut Frank
Abstract
Perfluorooctanoic acid (PFOA) and perfluorooctane sulfonate (PFOS) are widely distributed
in the environment. The discharge of municipal waste waters has been recognised as one of
the major routes of introduction into aquatic ecosystems. The present study deals with the
estimation of the accumulation potential of PFOA and PFOS in two fish species with different
feeding strategies, i.e. chub (Leuciscus cephalus) and river goby (Gobio gobio), inhabiting a
river receiving treated waste waters from a municipal waste water treatment plant (WWTP).
PFOS was detected in chub (7 - 250 µg kg-1 wet weight) and river goby (70 - 400 µg kg-1 wet
weight) with bioaccumulation factors (BAFs) of 4600 and 11 000. The high BAF in the bot-
tom-feeding river goby shows that river sediments with their high PFOS-concentrations rela-
tive to the free water phase play an important role in food chain transfer of PFOS. The tissue
distribution of PFOS was as follows: liver > kidneys > heart, gonads >> muscles. PFOA con-
centrations in both fish were low and in chub mostly below LOQ.
Keywords: perfluorooctanoic acid, perfluorooctane sulfonate, fish, aquatic environment
66

Publication V
Introduction
Perfluorinated surfactants (PFSs) such as perfluorooctanoic acid (PFOA) and perfluorooctane
sulfonate (PFOS) have been the subject of many recent investigations (Houde et al. 2006,
Prevendouros et al. 2006). PFOA, PFOS and their derivatives have been widely used in con-
sumer products and industrial applications because of their chemical and thermal stability, and
their water- and fat-repellent properties (Kissa 2001).
PFSs enter the environment in various ways, mainly via waste waters (Becker et al. 2008 a, b,
Boulanger et al. 2005, Schulz et al. 2006 a, b; Sinclair and Kannan 2006) from industries in
which these compounds are used as anti-static agents for surface treatment, moulding or ex-
trusion, as components of fire fighting foams, or as abiotic or biotic degradation products of
precursors (Prevendouros et al. 2006) during waste water treatment. Their persistence and
potential bioaccumulation have resulted in their ubiquitous distribution in the environment, in
wildlife and in humans (Giesy et al. 2001, Kannan et al. 2005; Houde et al. 2006, Preven-
douros et al. 2006, Becker et al. 2008 a, b).
PFOA and PFOS have been detected in freshwater fish in the United States (Kannan et al.
2005, Furdui et al. 2007, Moody et al. 2002, Sinclair et al. 2006), in Canada (Tittlemier et al.
2007, Martin et al. 2004), in Japan (Taniyasu et al. 2003), in Belgium (Hoff et al. 2005), and
in Germany (Federal Office for Environment 2007 a).
-1 Hepatic PFOS concentrations in eel and carp (17 – 9030 and 11 – 1820 µg kg wet weight,
respectively) were shown to be positively correlated to serum alanine aminotransferase activ-
ity and negatively to serum protein content and serum electrolyte concentrations (Hoff et al.
2005). Recently, fish have been identified as a source of PFSs in humans on the Baltic Coast
(Falandysz et al. 2006).
The aim of the present study was a) to assess the accumulation potential of PFOA and PFOS
in two fish species with different feeding strategies inhabiting a river with a well quantified
source, i.e. a municipal waste water treatment plant (WWTP) (Becker et al. 2008 a, b), and b)
to determine their tissue distribution.
67

Publication V
1 Materials and Methods
1.1 Chemicals and Equipment
PFOA (95 %, Lancaster, Eastgate, UK), [1, 2- 13C2]-PFOA (98 %, Perkin Elmer, Boston,
USA), perfluorooctane sulfonate potassium salt (98 %, Fluka, Buchs, Germany), [1, 2, 3, 4-13C4]-perfluorooctane sulfonate sodium salt (99 %, 50 µg/mL-solution in MeOH, Campro
Scientific, Berlin, Germany), acetic acid (100 %, Merck, Darmstadt, Germany), ammonium
acetate (99.0 %, Fluka, Buchs, Germany), potassium hydroxide (KOH, analytical grade, Roth,
Karlsruhe, Germany), MeOH, and AcN (picograde, Promochem, Wesel, Germany) were used
as obtained. The equipment was pre-cleaned as described previously (Weremiuk et al. 2006);
Teflon equipment was avoided.
1.2 Sample Collection
On 28 August 2007, two fish species, i.e. chub (Leuciscus cephalus) (n = 6) and river goby
(Gobio gobio) (n = 5), were caught in the river Roter Main by electro-fishing by the employ-
ees of the Bavarian Fishery Association. The sampling site was located approximately 3 km
downstream the WWTP of Bayreuth, Upper Franconia, Germany. The river has an average
daily flow of 270 000 m3 and receives a daily average of 40 000 m3 treated waste water of
industrial, commercial, and domestic origin from a population of 72 000 inhabitants. The
daily loading of the river with the WWTP-effluent is 1.2 ± 0.5 g PFOA and 4.7 ± 0.5 g PFOS
(Becker et al. 2008 a, b).
The chub is a freshwater fish of the family Cyprinidae which lives in rivers with slow and
moderately fast flowing waters, in canals and still waters of various kinds, breeding in flow-
ing waters, with a spawning season from April to June. It feeds on water insects, larvae,
snails, mussels, worms, and small fishes, reaches a size of 30 to 40 cm, and can be found all
over Europe except Scotland, Ireland and Northern Scandinavia. The river goby is a bottom-
feeding fish of the Gobiidae family widespread throughout Europe, sifting through mud and
silt of fast to moderately flowing rivers, sucking up invertebrates. It rarely exceeds 15 cm and
spawns between Mai and end of June.
The caught fish were cooled immediately and transported in PP-bags to the laboratory. The
chubs were dissected; heart, liver, kidneys, gonads, and muscle tissue were stored separately
68

Publication V
in 50-mL PP-centrifuge tubes at -20 °C. Of the river Goby, due to the small size, only muscles
and inner organs were separated (table 1).
Table 1. Animal size and weights of organs/tissues taken for analysis, Roter Main, 27 Aug.
2007.
Chub (Leuciscus cephalus) Subsample weight, g Fish Length,
cm Weight,
g Age,
a Liver Kidneys Gonads Heart Muscles
1 26 172.5 4 2.77 0.22 3.71 0.21 1.00 2 25 161.1 4 1.80 0.16 3.23 0.17 1.00 3 22 110.8 4 1.51 0.21 1.63 0.18 1.00 4 24 129.2 4 1.07 0.73 1.43 0.17 1.00 5 24 129.7 4 2.31 1.10 2.27 0.20 1.00 6 32 367.5 4 4.55 2.48 7.13 0.49 1.00
River Goby (Gobio gobio) Subsample weight, g Fish Length,
cm Weight,
g Age,
a Organs Muscles
1 13.0 19.05 3 2.44 5.50 2 13.0 22.05 3 2.12 4.63 3 14.5 23.85 3 2.18 4.77 4 12.0 13.40 3 1.74 3.34 5 13.5 17.00 3 1.67 3.51
1.3 Sample Preparation and Analysis
The tissue samples were extracted according to a slightly modified, published method (So et
al. 2006). For example, 5 g thawed muscle tissue was homogenised in a 50-mL PP-bottle with
a mechanical homogeniser (Ultra-Turrax, Janke & Kankel GmbH, Staufen, Germany) without
addition of solvent. After homogenisation of the tissue of one fish, the homogeniser was thor-
oughly washed with tap water, bidistilled water, and MeOH; the washes were discarded. Each
sample was extracted in triplicate: 1.0 g homogenate was weighed into a new 50-mL PP-
centrifuge tube and 150 µL standard solution containing 100 µg L-1 each of 13C-PFOA and 13C-PFOS was added. After addition of 30 mL methanolic KOH solution (0.01 N), the mix-
ture was shaken at room temperature for 16 h (22 rpm, Shaker, GFL 3040, Burgwegel, Ger-
many) and centrifuged (High-Performance Centrifuge, Avanti J-25, Beckman, USA,
3000 rpm, 20 °C, 10 min); 2 mL of the supernatant was transferred to a 250-mL PP-bottle,
diluted with 100 mL deionised water and mixed thoroughly. The analytes were preconcen-
trated and precleaned by solid phase extraction (SPE).
69
Publication V
The organs (table 1) were mechanically homogenised with 5 mL each of methanolic KOH
solution (0.01 N) in a 50-mL PP-bottle. Residues of the sample sticking to the homogeniser
were recovered by washing it five times with 5 mL methanolic KOH solution each, combin-
ing the washes with the homogenised sample. Between samples, the homogeniser was cleaned
as above. Standard solution, 150 µL, containing 100 µg L-1 each of 13 13C-PFOA and C-PFOS,
was added to each 30-mL sample of tissue homogenate, and the mixture was shaken at room
temperature for 16 h (22 rpm). Upon centrifugation (3000 rpm, 20 °C, 10 min), 2 mL each of
the supernatant were transferred to three 250-mL PP-bottles containing 100 mL deionised
water; the bottles were thoroughly shaken.
The analytes were preconcentrated by SPE as previously described (Weremiuk et al. 2006)
but without applying vacuum and omitting the washing of the cartridge to avoid losses.
Analysis and quantification was done by HPLC-ESI-MS/MS (Weremiuk et al. 2006).
1.4 Quantification
For calibration, stock solutions of 13 13C-PFOA, C-PFOS, PFOA, PFOS and three working
standard solutions containing: a) 100 µg L-1 each of both 13 13C-PFOA and C-PFOS,
b) 20 µg L-1 each of both labelled standards, and c) 10 µg L-1 each of both non-labelled stan-
dards, were prepared as described previously (Becker et al. 2008 a).
For quantitative analysis, standard solutions containing non-labelled PFOA and PFOS in the
range from 0.5 to 15 µg L-1, and 2 µg L-1 13 each of both C-labelled standards were used for
calibration.
Calibration curves were constructed by plotting analyte and internal standard peak area ratios
versus analyte concentrations; regression coefficients were higher than 0.995.
Recoveries from fish samples relative to the 13C-labelled standard were 88 % (± 10 % rsd) for
PFOA and 86 % (± 10 % rsd) for PFOS.
The limits of quantification (LOQ, signal to noise ratio 7) for PFOA and PFOS were 1.5 and
3 ng, respectively, divided by the sample weight. Procedural blanks consisting of 50-mL PP-
tubes filled with 30 mL methanolic KOH solution and spiked with 150 µL of a standard solu-
tion containing 100 µg L-1 each of 13C-PFOA and 13C-PFOS were below the limit of detection
(LOD).
70

Publication V
2 Results and Discussion
PFOA-concentrations in the different organs of the chubs were above LOQ (table 2) only oc-
casionally, i.e. in the heart of chub 1, the liver of chub 6, the kidneys of chubs 2 and 3, and the
gonads of chubs 2, 4, 5, 6. PFOA concentrations in the river gobies were generally higher and
ranged from < 0.6 to 3.0 µg kg-1 wet weight (ww) in the organs, and from 2.0 and 9.8 µg kg-1
ww in the muscles (table 3).
Table 2. Concentrations of PFOA and PFOS [µg kg-1 ww] in chub tissue.
Fish Liver Kidneys Gonads Heart Muscles PFOA
1 < 0.5 < 6.8 < 0.4 021 ± 0.7 < 1.5 2 < 0.8 206,0 ± 18 9.7 ± 0.5 < 9 < 1.5 3 < 1.0 008.2 ± 01 < 0.9 < 8 < 1.5 4 < 1.4 < 2.1 5.8 ± 0.4 < 9 < 1.5 5 < 0.7 < 1.3 2.0 ± 0.1 < 8 < 1.5 6 3.6 ± 0.2 < 0.6 2.7 ± 0.2 < 3 < 1.5
PFOS *1 110 ± 12 066 ± 08 052 ± 01 023 ± 03 07.5 ± 0.5 *2 120 ± 09 083 ± 01 066 ± 02 049 ± 01 14.5 ± 0.5 *3 113 ± 01 102 ± 08 056 ± 02 103 ± 01 14.6 ± 0.5 *4 152 ± 13 137 ± 06 067 ± 08 066 ± 03 11.3 ± 0.9 *5 117 ± 09 133 ± 04 057 ± 03 059 ± 05 15.6 ± 0.6 *6 123 ± 12 100 ± 01 247 ± 15 040 ± 01 12.2 ± 0.7 *Mean 123 ± 15 103 ± 28 060 ± 07 057 ± 27 13.0 ± 3.0
* Outlier, not included in mean calculation.
-1Table 3. Concentrations of PFOA and PFOS [µg kg ww] of the inner organs and muscles of
river goby.
PFOA PFOS Fish In. organs Muscles In. organs Muscles
1 < 0.6* 4.5 ± 0.3 290 ± 09 69 ± 6 2 2.4 ± 0.3 7.8 ± 0.1 230 ± 16 76 ± 5 3 3.0 ± 0.2 9.8 ± 0.5 345 ± 40 65 ± 4 4 1.2 ± 0.2 2.0 ± 0.4 205 ± 02 85 ± 6 5 < 0.9* 5.2 ± 0.8 406 ± 40 108 ± 9 Mean 1.5 ± 1.2 5.9 ± 0.8 295 ± 80 80 ± 17
* Mean is calculated using half of these values (LOQs).
Overall, PFOA concentrations found in both species were lower than in the liver of jack
mackerel purchased on a Japanese market originating from a fish farm (Senthilkumar et al.
2007), or in muscles (6.4 – 53 µg kg-1 -1) or livers (2.6 – 840 µg kg ) of eel, barb, carp, nase,
71
Publication V
greyling from the river Alz (Federal Office for Environment 2007 a) where PFOA water con-
centration was up to 7.5 µg L-1 (Federal Office for Environment 2007 b); they were higher
than in muscle tissue of largemouth bass or smallmouth bass from the River Raisin, St. Clair
and Calumet (<2 µg kg-1) (Kannan et al. 2005), in whole body homogenate of trout from Lake
Ontario (1 ± 0.1 µg kg-1, Martin et al. 2004), or in muscles of white fish purchased on a Cata-
lan market (< 0.065 µg kg-1, Ericson et al. 2008).
Relative to the PFOA concentrations in the river (median March – June 2007: 8 ng L-1,
Becker et al. 2008 a), a bioaccumulation factor (BAF) of 740 was calculated for the muscle
tissue of river gobies. Martin et al. (2007) reported a BAF of 4 for rainbow trout exposed to
PFOA under laboratory conditions, but Houde et al. (2006) pointed out that there is no
agreement between laboratory and field BAFs for PFSs.
-1Higher concentrations of PFOS in river water (median March – June 2007: 25 ng L , Becker
et al. 2008 a) and sediment (October 2006, mixed sample collected 1 km downstream the
WWTP: 240 ng kg-1 dry weight, Becker et al. 2008 c) led to higher levels in the caught fish
(table 2), especially in liver (123 ± 15 µg kg-1 ww), kidneys (100 ± 30 µg kg-1 ww), gonads
(52 ± 1 µg kg-1 ww) and heart (57 ± 27 µg kg-1 ww); lowest values (13 ± 3 µg kg-1 ww) were
in muscle tissue. These results are in agreement with previous findings showing that PFOS
accumulates in liver (Giesy et al. 2001, Kannan et al. 2005), kidneys (Martin et al. 2005, Van
de Vijver et al. 2005) and gonads (Martin et al. 2003).
River gobies were quite small, and therefore only muscle and combined inner organs (liver,
kidneys, heart, gonads, intestines) were analysed. PFOS levels were between 65 and 108 µg
kg-1 ww (average: 80 ± 17 µg kg-1 -1 ww), in pooled organs between 205 and 406 µg kg ww
(average: 300 ± 80 µg kg-1 ww, n = 5). Obviously, the PFOS-concentrations in river goby
muscles are about 6-times those of chub, reflecting the fact that the former feed mainly on
benthic invertebrates living in the sediment with relatively high PFOS concentrations (Octo-
ber 2006, mixed sample collected 1 km downstream the WWTP: 35 ± 9 ng kg-1; sedi-
ment/water concentration ratio = 22, Becker et al. 2008 c). Higgins et al. (2006) suggested
that PFSs in sediments are readily bioavailable and can be bioaccumulated from the sediment.
PFOS concentrations in the liver of chub of the Roter Main are similar to those in smallmouth
bass liver from New York State lakes (10 – 140 µg kg-1, Sinclair et al. 2006), chinook salmon
(30 – 170 µg kg-1 -1) or whitefish (33 – 81 µg kg ) of the Great Lakes (Kannan et al. 2005) but
72

Publication V
-1lower than in the livers of eel, perch, roach from the river Main or Alz (15 – 4300 µg kg )
(Federal Office for Environment 2007 a) or in carp or gibel carp from Flanders (Belgium) (10
– 9030 µg kg-1, Hoff et al. 2005). Concentrations in muscles were comparable to those in fish
from other Bavarian rivers (Federal Office for Environment 2007 a).
A comparison the PFOS-concentrations in chubs’ livers or pooled organs of river gobies (123
or 295 µg kg-1 ww, respectively) with the average water concentration of 27 ng L-1 (Roter
Main, 1 km downstream the WWTP, March - June 2007; Becker et al. 2008 a) resulted in a
liver-based BAF of 4600 for chub and 11 000 for river goby; it is assumed that the liver-BAF
of the latter species would even be higher if it were analysed separately. The values are in
good agreement with those determined for coastal fish from Japan (8540, Taniyasu et al.,
2003) or the Niagara River (8850, Houde et al. 2006).
3 Conclusions
PFOS was detected in all chub and river goby samples of the Roter Main downstream the
WWTP of Bayreuth. In chub the concentrations were highest in liver, lowest in muscles.
PFOA concentrations were about five-fold lower. In the bottom-feeding river goby both PFSs
were higher than in chub, due to their different food sources.
This study shows that PFOS released to the river from a municipal WWTP is accumu-
lated in the liver of exposed fish by factor of 104 3or higher, PFOA by a factor of less than 10 .
Acknowledgments
Financial support of the Bayerische Forschungsstiftung is acknowledged. We appreciate the
cooperation of Dr. Klupp and the employees of the Bavarian Fishery Association.
References
Becker AM, Suchan M, Gerstmann S, Frank H (2008 a) Perfluorooctanoic Acid and Per-
fluorooctane Sulfonate Released from a Waste Water Treatment Plant in Bavaria,
Germany. Submitted for publication to Environ Sci Poll
Becker AM, Gerstmann S, Frank H. (2008 b) Perfluorooctane Surfactants in Waste Waters,
the Major Source of Hydrosphere Pollution. Chemosphere, 72, 115-121
73

Publication V
Becker AM, Gerstmann S, Frank H. (2008 c) Perfluorooctanoic Acid and Perfluorooctane
Sulfonate in the Sediment of the Roter Main River, Bayreuth, Germany. Submitted for
publication to Environ Poll
Boulanger B, Vargo JD, Schnoor JL, Hornbuckle KC (2005) Evaluation of Perfluorooctane
Surfactants in Wastewater Treatment System and in Commercial Surface Protection
Product. Environ Sci Technol 39:5524-5530
Ericson I, Marti-Cid R, Nadal M, Van Bavel B, Lindstrom G, Domingo JL (2008) Human
Exposure to Perfluorinated Chemicals Through the Diet: Intake of Perfluorinated
Compounds in Foods from the Catalan (Spain) Market. J Agric Food Chem, In Press
Falandysz J; Taniyasu S, Gulkowska A, Yamashita N, Schulte-Oehlmann U (2006) Is Fish a
Major Source of Fluorinated Surfactants and Repellents in Humans Living on the Bal
tic Coast? Environ Sci Technol 40:748-751
Federal Office for Environment (2007 a) http://www.lfu.bayern.de/ analytik_stoffe/fachin-
formationen/analytik_org_stoffe_perfluorierte_tenside/doc/ergebnisse_fischuntersu-
chungen.pdf
Federal Office for Environment (2007 b) http://www.lfu.bayern.de/analytik_stoffe/fachin-
formationen/analytik_org_stoffe_perfluorierte_tenside/doc/pft_befunde_oberflaechen-
gewaesser.pdf
Furdui VI, Stock NL, Ellis DA, Butt CM, Whittle DM, Crozier PW, Reiner E,J, Muir
DCG, Mabury SA (2007) Spatial Distribution of Perfluoroalkyl Contaminants in
Lake Trout from the Great Lakes. Environ Sci Technol 41:1554-1559
Giesy JP, Kannan K (2001) Global Distribution of Perfluorooctane Sulfonate in Wildlife. En-
viron Sci Technol 35:1339-1342
Hoff PT, Van Camenhout C, Van de Vijver K, Covaci A, Bervoets L, Moens L, Huyskens G,
Goemans G, Belpaire C, Blust R, De Coen W (2005) Perfluorooctane Sulfonic Acid
and Halogen Pollutants in Liver of Three Freshwater Fish Species in Flanders (Bel-
gium): Relationship with Biochemical and Organismal Effects. Environ Poll 137:324-
333
74

Publication V
Houde M, Martin JW, Letcher RJ, Solomon KR, Muir DCG (2006) Biological Monitoring of
Perfluoroalkyl Substances: A Review. Environ Sci Technol 40:3463-3470
Kannan K, Tao L, Sinclair E, Pastva SD, Jude DJ, Giesy JP (2005) Perfluorinated
Compounds in Aquatic Organisms at Variuos Trophic Levels in a Great Lakes Food
Chain. Arch Environ Contam Toxicol 48:559-566
Kissa E (2001) Fluorinated Surfactants and Repellents, 2nd ed.; Marcel Dekker: New York.
Martin JW, Mabury SA, Solomon KR, Muir DCG (2003) Bioconcentration and Tissue Distri-
bution of Perfluorinated Acids in Rainbow Trouts (Oncorhyncus Mykiss). Environ Sci
Technol 22:196-204
Martin JW, Whittle DM, Muir DCG, Mabury SA (2004) Perfluoroalkyl Contaminants in
a Food Web from Lake Ontario. Environ Sci Technol 38:5379-5385
Moody CA, Martin JW, Kwan WC, Muir DCG, Mabury SA (2002) Monitoring Perfluori-
nated Surfactants in Biota and Surface Water Samples Following an Accidental Re-
lease of Fire-Fighting Foam into Etobicoke Creek. Environ Sci Technol, 36:545-551
Prevendouros K, Cousins IT, Buck RC, Korzeniowski SH (2006) Sources, Fate and
Transport of Perfluoroocarboxylates. Environ Sci Technol 40:32-44
Schultz MM, Barofsky DF, Field JA (2006 a) Quantitative Determination of Fluorinated Al-
kyl Substances by Large-Volume-Injection Liquid Chromatography Tandem Mass
Spectrometry – Characterization of Municipal Wastewaters. Environ Sci Technol
40:289-295
Schultz MM, Higgins CP, Huset CA, Luthy. G, Barofsky DF, Field JA (2006 b) Fluoro-
chemical Mass Flow in a Municipal Wastewater Treatment Facility. Environ Sci
Technol 40:7350-7357
Senthilkumar K, Ohi E, Sajwan K, Takasuga T, Kannan K (2007) Perfluorinated
Compounds in River Water, River Sediment, Market Fish, and Wildlife Samples from
Japan. Bull Environ Contam Toxicol 79:427-431
Sinclair E, Kannan K (2006) Mass Loading and Fate of Perfluoroalkyl Surfactants in Waste-
water Treatment Plants. Environ Sci Technol 40:1408-1414
75

Publication V
Sinclair E, Mayack DT, Roblee K, Yamashita N, Kannan K (2006) Occurrence of Perfluoro-
alkyl Surfactants in Water, Fish, and Birds from New York State. Arch Environ Con-
tam Toxicol 50:398-410
So MK, Taniyasu S, Lam PKS, Zheng GJ, Giesy JP, Yamashita N (2006) Alkaline Digestion
and Solid Phase Extraction Method for Perfluorinated Compounds in Mussels and
Oysters from South China and Japan. Archiv Environ Contam Toxicol 50:240-248
Taniyasu S, Kannan K, Horii Y, Hanari N, Yamashita N (2003) A Survey of Perfluorooctane
Sulfonate and Related Perfluorinated Organic Compounds in Water, Fish, Birds, and
Humans from Japan. Environ Sci Technol 37:2634-2639
Tittlemier SA, Pepper K, Seymour C, Moisey J, Bronson R, Cao XL, Debeka RW
(2007) Dietary Exposure of Canadians to Perfluorinated Carboxylates and Per-
fluorooctane Sulfonate via Consumption of Meat, Fish, Fast Foods, and Food Items
Prepared in Their Packaging. J Agric Food Chem 55:3203-3210
Weremiuk AM, Gerstmann S, Frank H (2006) Quantitative Determination of Perfluorinated
Surfactants in Water by LC-ESI-MS/MS. J Sep Sci 29:2251-2255
Van de Vijver KI, Hoff P, Das K, Brasseur GD, Van Dongen W, Esmans EL, Reijnders P,
Blust R, de Coen W (2005) Tissue Distribution of Perfluorinated Chemicals in Har-
bour Seals (Phoca Vitulina) from the Dutch Wadden Sea. Environ Sci Technol
39:6978-6984
76
Bibliography
Bibliography
3M, 2001. Executive Summary: Environmental Monitoring - Multi-City Study Water, Sludge,
Sediment, POTW Effluent and Landfill Leachate Samples. US EPA Administrative
Record AR226-1030a111.
Alexander, B.H., Olsen, G.W., Burris, J.M., Mandel, J.H., Mandel, J.S. 2003. Mortality of
Employees of Perfluorooctenesulphonyl Fluoride Manufacturing Facility. Occup. En-
viron. Med. 60, 722-729.
Alzaga, R., Salgado-Petinal, C., Jover, E., Bayona, J.M. 2005. Development of a Procedure
for the Determination of Perfluorocarboxylic Acids in Sediments by Pressurized Fluid
Extraction, Headspace Solid-Phase Microextraction Followed by Gas Chromatograph-
ic-Mass Spectrometric Determination. J. Chrom. A 1083, 1-6.
Apelberg, B.J., Goldman, L.R., Calafat, A.M., Herbstman, J.B., Kuklenyik, Z., Heidler, J.,
Needham, L.L., Halden, R.U., Witter, F.R. 2007. Determinants of Fetal Exposure to
Polyfluoroalkyl Compounds in Baltimore, Maryland. Environ. Sci. Technol. 41, 3891-
3897.
Austin, M.E., Kasturi, B.S., Barber, M., Kannan, K., MohanKumar, P.S., MohanKumar,
S.M.J. 2003. Neuroendocrine Effects of Perfluorooctane Sulfonate in Rats. Environ.
Health Persp. 11, 1485-1489.
Barton, C.A., Butler, L.E., Zarzecki, C.J., Flaherty, J., Kaiser, M. 2006. Characterizing Per-
fluorooctane in Ambient Air Near the Fence Line of a Manufacturing Facility: Com-
paring Modeled and Monitored Values. J. Air & Waste Manage. Assoc. 56, 48-55.
BLfU 2007 a. Bayerischer Landesamt für Umwelt. Ergebnisse der Klärschlamm Untersu-
chungen, Stand 20.11.2007. http://www.lfu.bayern.de/analytik_stoffe/fachinforma-
tionen/Analytik_org_stoffe_perfluorierte_tenside/doc/ergebnisse_klaerschlammunter-
suchungen.pdf
BLfU 2007 b. Bayerischer Landesamt für Umwelt. Ergebnisse der Fischuntersuchungen.
http://www.lfu.bayern.de/analytik_stoffe/fachinformationen/analytik_org_stoffe_per-
fluorierte_tenside/doc/ergebnisse_fischuntersuchungen.pdf.
XIII

Bibliography
BLfU 2007 c. Bayerischer Landesamt für Umwelt. Sonderuntersuchung von 20 Bayer. Ober-
fläche Wässern. http://www.lfu.bayern.de/analytik_stoffe/fachinformationen/analytik
_org_ stoffe_perfluorierte_tenside/doc/pft_befunde_oberflaechengewaesser.pdf
Begley, T.H., White, K., Honigfort, P., Twarowski, M.L., Neches, R., Walker, R.A. 2005.
Perfluorochemicals: Potential Sources of and Migration from Food Packaging. Food
Additiv. Contam. 22, 1023-1031.
Belisle, J., Hagen, D.F. 1980. A Method for the Determination of Perfluorooctanoic Acid in
Blood and Other Biological Samples. Anal. Biochem. 101, 369-376.
Berger, U., Langlois, I., Oehme, M., Kallenborn, R. 2004. Comparison of Three Types of
Mass Spectrometers for HPLC/MS Analysis of Perfluoroalkylated Substances and
Fluorotelomer Alcohols. Eur. J. Mass Spec. 10, 579-588.
Berger, U., Haukås, M. 2005. Validation of a Screening Method Based on Liquid Chromato-
graphy Coupled to High-Resolution Mass Spectrometry for Analysis of Perfluoroalky-
lated Substances in Biota. J. Chrom. A 1081, 210-217.
Bossi, R., Riget, F.F., Dietz, R., Sonne, C, Fauser, P., Dam, M., Vorkamp, K., 2005 a. Prelim-
inary Screening of Perfluorooctane Sulfonate (PFOS) and other Fluorochemicals in
Fish, Birds, and Marine Mammals from Greenland and the Faroe Islands. Environ.
Poll. 136, 323-329.
Bossi, R., Riget, F.F., Dietz, R. 2005 b. Temporal and Spatial Trends of Perfluorinated Com-
pounds in Ringed Seal (Phoca hispida) from Greenland. Environ. Sci. Technol. 39,
7416-7422.
Boulanger, B., Vargo, J.D., Schnoor, J.L., Hornbuckle, K.C., 2005 a. Evaluation of Perfluo-
rooctane Surfactants in Wastewater Treatment System and in a Commercial Surface
Protection Products. Environ. Sci. Technol. 39, 5524–5530.
Boulanger, B., Peck, A.M., Schnoor, J.L., Hornbuckle, K.C. 2005 b. Mass Budget of Perfluo-
rooctane Surfactants in Lake Ontario. Environ. Sci. Technol. 39, 74 – 79.
XIV

Bibliography
Brunner, E. Bayerisches Landesamt für Gesundheit und Lebensmittelsicherheit 2007. Per-
fluorierte Tenside im Trinkwasser. http://www.lgl.bayern.de/gesundheit/umweltme-
dizin/perfluorierte_tenside.htm
Burris, J.M., Lundberg, J.K., Olsen, G.W., Simpson, C., Mandel, J.H. 2002. Interim Report:
Determination of Serum Half-Life of Several Fluorochemicals. St. Paul, MN 3M
Company U.S. EPA Docket AR 226-1086. Washington DC U.S. Environmental Pro-
tection Agency.
Dai, J., Li, M., Jin, Y., Saito, N., Xu, M., Wei, F. Perfluorooctanesulfonate and Perfluorooc-
tanoate in Red Panda and Giant Panda from China. Environ. Sci. Technol. 40, 5647-
5652.
D’eon, J.C., Hurley, M.D., Wallington, T.J., Mabury, S.A. 2006. Atmospheric Chemistry of
N-Methyl Perfluorobutane Sulfonamidoethanol, C4F9SO2N(CH3)CH2CH2OH: Kinetics
and Mechanism of Reaction with OH. Environ. Sci. Technol. 40, 1862-1868.
Dinglasan, M.J.A., Ye, Y., Edwards, E.A., Mabury, S.A. Fluorotelomer Alcohol Biodegrada-
tion Yields Poly- and Perfluorinated Acids. Environ. Sci. Technol. 2004, 38, 2857-
2864.
Ellis, D.A., Martin, J.W., De Silva, A.O., Mabury, S.A., Hurley, M.D., Sulbaek Andersen,
M.P., Wallington, T. J. 2004. Degradation of Fluorotelomer Alcohols: A Likely At-
mospheric Source of Perfluorinated Carboxylic Acids. Environ. Sci. Technol., 38,
3316-3321.
Ericson, I., Marti-Cid, R., Nadal, M., Van Bavel, B., Lindstrom, G., Domnigo, J.L. 2008.
Human Exposure to Perfluorinated Chemicals through the Diet: Intake of Perfluori-
nated Compounds in Foods from the Catalan (Spain) Market. J. Agric. Food Chem.
56, 1787-1794.
Falandysz, J.; Taniyasu, S., Gulkowska, A., Yamashita, N., Schulte-Oehlmann, U. 2006. Is
Fish a Major Source of Fluorinated Surfactants and Repellents in Humans Living on
the Baltic Coast? Environ. Sci. Technol. 40, 748-751.
Frank, H., Renschen, D., Klein, A., Scholl, H. 1995. Trace Analysis of Airborne Haloacetates.
J. High Resol. Chromat. 18, 83-88.
XV

Bibliography
Frank, H., Klein, A., Renschen, D. 1996. Environmental Trifluoroacetate. Nature 382, 34.
Fromme, H.; Midash, O., Twardella, D., Angerer, J., Boehmer, S., Liebl, B. 2007. Occurrence
of Perfluorinated Substances in an Adult German Population in Southern Bavaria.
Int. Arch. Occup. Health 80, 313-319.
Giesy, J.P., Kannan, K. 2001. Global Distribution of Perfluorooctane Sulfonate in Wildlife.
Environ. Sci. Technol. 35, 1339-1342.
Giesy, J.P., Kannan, K. 2002. Perfluorochemical Surfactants in the Environment. Environ.
Sci. Technol. 36, 146A-152A.
Gulkowska, A., Jiang, Q., So. M.K., Taniyasu, S., Lam P.K.S., Yamashita, N. 2006, Persis-
tent Perfluorinated Acids in Seafood Collected from Two Cities of China. Environ.
Sci. Technol. 40 , 3736-3741.
Hagen, D.F., Belise, J., Johnson, J.D., Vankateswarlu, P. 1981. Charakterization of Flurinated
Metabolites by a Gas Chromatographic-Helium Microwave Plasma Detector – the
Biotransformation of 1H, 1H, 2H, 2H-Perfluorodecanol to Perfluorooctanoate. Anal.
Biochem. 118, 336-343.
Han, X., Snow, T.A., Kemper, R.A., Jepson, G.W. 2003. Binding of Perfluorooctanoic Acid
to Rat and Human Plasma Proteins. Chem. Res. Toxicol. 16, 775-781.
Hansen, K.J., Clemen, L.A., Ellefson, M.E., Johnson, H.O. 2001. Compound-Specific, Quan-
titative Characterisation of Organic Fluorochemicals in Biological Matrices. Environ.
Sci. Technol. 35, 766-770.
Hansen, K.J., Johnson, H.O., Eldridge, J.S., Butenhoff, J.L., Dick, L.A. 2002. Quantitative
Characterisation of Trace Levels of PFOS and PFOA in Tennessee River. Environ.
Sci. Technol. 36, 1681-1685.
Harada, K., Xu, F., Ono, K., Iijima, T., Koizumi, A. 2005 a. Effects of PFOS and PFOA on L-
type Ca2+ Currents in Guinea-Pig Venticular Mycocytes. Biochem. Biophys. Research
Commun. 329, 487-494.
XVI
Bibliography
Harada, K., Inoue, K., Morikawa, A., Yoshinaga, T., Saito, N., Koizumi, A. 2005 b. Renal
Clearance of Perfluorooctane Sulfonate and Perfluorooctanoate in Humans and Their
Species-Specific Excretion. Environ. Research 99, 253-261.
Harada, K., Nakanishi, S., Saito, N., Koizumi, A. 2005 c. Airborne Perfluorooctanoate May
Be a Substantial Source Contamination in Kyoto Area, Japan. Bull. Environ. Contam.
Toxicol. 74, 64-69.
Harada, K., Nakanishi, S., Sasaki, K., Furuyyama, K., Nakayama, S., Saito, N., Yamakawa,
K., Koizumi, A. 2006. Particle Size Distribution and Respiratory Deposition Estimates
of Airborne Perfluorooctanoate and Perfluorooctanesulfonate in Kyoto Area, Japan.
Bull. Environ. Contami. Toxicol. 76, 306-310.
Haughom, B., Spydevold, O. 1992. The Mechanism Underlying the Hypolipemic Effect of
Perfluorooctanoic Acid (PFOA), Perfluorooctane Sulfonic Acid (PFOSA) and Clofi-
bric Acid. Biochim. Biophys. Acta 1128, 65-72.
Herbert, G.N., Odom, M.A., Craig, P.S., Dick, D., L., Strauss, S.H. 2002. Method for the De-
termination of Sub-ppm Concentrations of Perfluoroalkylsulfonate Anions in Water. J.
Environ. Monit. 4, 90-95.
Higgins, C.P., Field, J.A., Criddle, C.S, Luthy. R.G. 2005. Quantitative Determination of
Perfluorochemicals in Sediments and Domestic Sludge. Environ. Sci. Technol. 39,
3946-3956.
Higgins, C.P., Luthy, R.G. 2006. Sorption of Perfluorinated Surfactants on Sediments. Envi-
ron. Sci. Technol. 40, 7251-7256.
Hinderliter, P.M., Mylchreest, E., Gannon, S.A., Butenhoff, J.L, Kennedy Jr., G.L. 2005. Per-
fluorooctanoate: Placental and Lactational Transport Pharmacokinetics in Rats. Tox-
icol. 211, 139-148.
Hoff, P.T., Van Dongen, W., Esmans, E.L., Blust, R., De Coen, W.M. 2003. Evaluation of the
Toxicological Effects of Perfluorooctane Sulfonic Acid in the Common Carp (Cypri-
nus carpio). Aquat. Toxicol. 62, 349-359.
XVII

Bibliography
Hoff, P.T., Scheirs, J., Van de Vijver, K., Van Dongen, W., Esmans, E.L., Blust, R., De Coen,
W. 2004. Biochemical Effect Evaluation of Perfluorooctane Sulfonic Acid-Conta-
minated Wood Mice (Apodemus sylvaticus). Environ. Health Perspect. 112, 681-686.
Hoff, P.T., Van Camenhout, C., Van de Vijver, K., Covaci, A., Bervoets, L., Moens, L., Huy-
skens, G., Goemans, G., Belpaire, C., Blust, R., De Coen, W. 2005. Perfluorooctane
Sulfonic Acid and Hallogen Pollutants in Liver of Three Freshwater Fish Species in
Flanders (Belgium): Relationship with Biochemical and Organismal Effects. Environ.
Poll. 137, 324-333.
Holm, A., Wilson, S.R., Molander, P.; Lundanes, E., Greibrokk, T. 2004. Determination of
Perfluorooctane Sulfonate and Perfluorooctanoic Acid in Human Plasma by Large
Volume Injection Capillary Column Switching Liquid Chromatography Coupled to
Electrospray Ionization Mass Spectrometry. J. Sep. Sci. 27, 1071-1079.
Holström, K.E., Järnberg, U., Bignert, A. 2005. Temporal Trends of PFOS and PFOA in Gil-
lemot Eggs from the Baltic Sea, 1968 – 2003. Environ. Sci. Technol. 39, 80-84.
Houde, M., Bujas, T.A.D., Small, J., Wells, R., Fair, P.A., Bossart, G.D., Solomon, K.R.,
Muir, D.C.G. 2006 a. Biomagnification of Perfluoroalkyl Compounds in the Bottle-
nose Dolphin (Tursiops trucatus) Food Web. Environ. Sci. Technol. 40, 4138-4144.
Hu, W.Y., Jones, P.D., DeCoen, W., King, L., Fraker, P., Newsted, J., Giesy, J.P. 2003. Alte-
rations in Cell Membrane Properties Caused by Perfluorinated Compounds. Comp.
Biochem. Phys C. 135, 77-88.
Hurley, M.D., Ball, J.C., Wallington, T.J., Sulbaek Andersen, M.P., Ellis, D.A., Martin, J.W.,
Mabury, S.A. 2004. Atmospheric Chemistry of Fluorinated alcohols: Reaction with Cl
Atoms and OH Radicals and Atmospheric Lifetimes. J. Phys. Chem. A, 108, 1973-
1979.
Ishibashi, H., Iwata, H., Kim, E.Y., Tao, L., Amano, M., Miyazaki, N., Tanabe, S., Batoev,
V.B., Petrov, E.A. 2008. Contamination and Effects of Perfluorochemicals in Baikal
Seal (Pusa sibirica). 1. Residue Level, Tissue Distribution, and Temporal Trend.
Environ. Sci. Technol. 42, 2302-2308.
XVIII

Bibliography
Jahnke, A., Ahrens, L., Ebinghaus, R., Berger, U., Berber, J.L., Temme, C. 2007 a. An Im-
proved Method for the Analysis of Volatile Polyfluorinated Alkyl Substances in Envi-
ronmental Air Samples. Anal. Bioanal. Chem. 387, 965-975.
Jahnke, A., Ahrens, L., Ebinghaus, R., Temme, C. 2007 b. Urban versus Remote Air Concen-
trations of Fluorotelomer Alcohols and Other Polyfluorinated Alkyl Substances in
Germany. Environ. Sci. Technol. 41, 754-752.
Jahnke, A., Berger, U., Ebinghaus, R., Temme, C. 2007 c. Latitudinal Gradient of Airborne
Polyfluorinated Alkyl Substances in the Marine Atmosphere Between Germany and
South Africa (53° N – 3° S). Environ. Sci Technol. 41, 3055-3061.
Jahnke, A., Huber, S., Temme, C., Kylin, H., Berger, U. 2007 d. Development and Applica-
tion of a Simplified Sampling Method for Volatile Perfluorinated Alkyl Substances in
Indoor and Environmental Air. J. Chrom. A 1164, 1-9.
Johnson, R.L., Anschutz, A.J., Smolen, J.M., Simcik, M.F., Penn, R.L. 2007. The Adsorption
of Perfluorooctane Sulfonate onto Sand, Clay and Iron Oxide Surfaces. J. Chem. Eng.
Data 52, 1165-1170.
Jones, P.D., Hu, W., De Coen, W., Newsted, J.L., Giesy, J.P. 2003. Binding of Perfluorinated
Fatty Acids to Serum Proteins. Environ. Toxicol. Chem. 22, 2639-2649.
Jordan, A., Frank, H. 1999. Triflurooacetate in the Environment. Evidence for Sources Other
than HFC/HCFCs. Environ. Sci. Technol. 33, 522-527.
Kaiser, M.A., Larsen, B.S., Dawson, B.J., Kurtz, K., Lieckfield, R., Miller, J.R., Flaherty, J.
2005. Method for the Determination of Perfluorooctanoic Acid in Air Samples Using
Liquid Chromatography with Mass Spectrometry. J. Occup. Environ. Hyg. 2, 307-313.
Kannan, K., Hansen, K.J., Wade, T.L., Giesy, J.P. 2002 a. Perfluorooctane Sulfonate in Oys-
ters, Crassostrea virginica, from Gulf of Mexico and the Chesapeake Bay, USA. Arch.
Environ. Contam. Toxicol. 42, 313-318.
Kannan, K., Corsolini, S., Falandysz, J., Oehme, G., Focardi, S., Giesy, J.P. 2002 b. Perfluo-
rooctanesulfonate and Realted Fluorinated Hydrocarbons in Marine Mammals, Fishes,
and Birds from Coasts of the Baltic and Mediterranean Seas. Environ. Sci. Technol.
36, 3210-3216.
XIX

Bibliography
Kannan, K., Newsted, J., Halbrock, R.S., Giesy, J.P. 2002 c. Perfluorooctanesulfonate and
Related Fluorinated Hydrocarbons in Mink and River Otters from the United States.
Environ. Sci. Technol. 36, 2566-2571.
Kannan, K., Corsolini, S., Falandysz, J., Fillmann, G., Kumar, K.S., Loghanathan, B.G.,
Mohd, M.A., Olivero, J., Van Wouwe, N., Yang, J.H., Aldous, K.M. 2004. Perfluo-
rooctanesulfonate and Related Fluorochemicals in Human Blood from Several
Countries. Environ. Sci. Technol. 38, 4489-4495.
Kannan, K., Tao, L., Sinclair, E., Pastva, S.D., Jude, D.J., Giesy, J.P. 2005. Perfluorinated
Compounds in Aquatic Organisms at Various Trophic Levels in a Great Lakes Food
Chain. Arch. Environ. Contam. Toxicol. 48, 559-556.
Kannan, K., Perrotta, E., Thomas, N.J. 2006. Association Between Perfluorinated Compounds
and Pathological Conditions in Southern Sea Others. Environ. Sci. Technol. 40, 4943-
4948.
Kärrmann, A., Van Bavel, B., Järnberg, U., Hardell, L., Linström, G. 2005. Development of a
Solid-Phase Extraction-HPLC/Single-Quadrupole MS Method for Quantification of
Perfluorochemicals in Whole Blood. Anal. Chem. 77, 864-870.
Kärrman, A., Van Bavel, B., Järnberg, U., Hardell, L., Lindström, G. 2006 a. Perfluorinated
Chemicals in Relation to Other Persistent Organic Pollutants in Human Blood. Che-
mosphere 64, 1582-1591.
Kärrman, A., Mueller, J., Van Bavel, B., Harden, F., Toms, L.M.L., Lindström, G. 2006 b.
Levels of 12 Perfluorinated Chemicals in Pooled Australian Serum, Collected 2002 –
2003 in Relation to Age, Gender, and Region. Environ. Sci. Technol. 40, 3742-3748.
Kawashima, Y., Kobayashi, H., Miura, H., Kozuka, H. 1995. Chracterization of Hepatic Res-
ponses of Rat to Administration of Perfluorooctanoic and Perfluorodecanoic Acids at
Low Levels. Toxicol. 99, 169-178.
Keller, J.M., Kannan, K., Taniyasu, S., Yamashita, N., Day, R.D., Arendt, M.D., Segars, A.L.,
Kucklick, J.R. 2005. Perfluorinated Compounds in the Plasma of Loggerhead and
Kemp’s Ridley Sea Turtles from the United States. Environ. Sci. Technol. 39, 9101-
9108.
XX
Bibliography
Kennedy Jr., G.L., Butenhoff, J.L., Olsen, G.W., O’Connor, J.C., Seacat, A.M., Perkins, R.G.,
Biegel, L.B., Murphy, S.R., Farrar, D.G. 2004. The Toxicology of Perfluorooctanoate.
Crit. Rev. Toxicol. 34, 351-384.
Kim, S.K., Kannan, K. 2007. Perfluorinated Acids in Air, Rain Snow, Surface Runoff, and
Lakes: Relative Importance of Pathways to Contamination of Urban Lakes. Environ.
Sci. Technol. 41, 8328-8334.
Kissa, E. 1986. Determination of Organofluorine in Air. Environ. Sci. Technol. 20, 1254-
1257.
Kissa, E., 2001. Fluorinated Surfactants and Repellents, Second Ed. Marcel Dekker, New
York.
Kudo, N., Iwase, Y., Okayachi, H., Yamakawa, Y., Kawashima, Y. 2005. Induction of He-
patic Proliferation by 8-2 Telomer Alcohol Feeding in Mice: Formation of Per-
fluorooctanoic Acid in the Liver. Toxicol. Sci. 86, 231-238.
Kuklenyik, Z., Reich, J.A., Tully, J.S., Needham, L.L., Calafat, A.M. 2004. Automated Solid-
Phase Extraction and Measurement of Perfluorinated Organic Acids and Amides in
Human Serum and Milk. Environ. Sci. Technol. 38, 3698-3704.
Lange, C.C., 2000. 3M Environmental Laboratory. The Aerobic Biodegradation of N-EtFOSE
Alcohol by the Microbial Activity Present in Municipal Wastewater Treatment
Sludge; Report CA058; U.S. Environmental Protection Agency Docket AR226-
1030a078.
Lange, C.C., 2002. 3M Environmental Laboratory. Biodegradation Screen Study for Telomer
Type Alcohols. Docket AR226-1149; U.S. Environmental Protection Agency: Wash-
ington, DC, November 6.
Larsen, B.S, Kaiser, M.A., Bothelho, M., Wooler, G.R., Buxton, L.W. 2005. Comparison of
Pressurized Solvent and Reflux Extraction Methods for the Determination of Perfluo-
rooctanoic Acid in Polyterafluoroethylene Polymers Using LC-MS-MS. Analyst 130,
59-62.
XXI

Bibliography
Levine, A.D., Libelo, E.L., Shelley, T., Mayfield, H., Stauffer, T.B. 1997. Biochemical As-
sessment of Natural Attenuation of JP-4-Contaminated Groundwater in the Presence
of Fluorinated Surfactants. Sci. Total. Environ. 208, 179-195.
Likens, G.E., Tartowski, S.L., Berger, T.W., Richey, D.G., Driscoll, C.T., Frank, H., Klein,
A. 1997. Transport and Fate of Trifluoroacetate in Upland Forrest and Wetland Eco-
systems. Proc. Natl. Acad. Sci. 94, 4499-4503.
Loewen, M., Halldorson, T., Wang, F., Tomy, G. 2005. Fluorotelomer Carboxylic Acids and
PFOS in Rainwater from an Urban Center in Canada. Environ. Sci. Technol. 39, 2944-
2951.
Longanathan, B.G., Sajwan, K.S., Sinclair, E., Kumar, S.S., Kannan, K. 2007. Perfluoroalkyl
Sulfonates and Perfluorocarboxylates in Two Wastewater Treatment Facilities in
Kentucky and Georgia. Water Research 41, 4611-4620.
Luebker, D.J., Hansen, K.J., Bass, N.M., Butenhoff, J.L., Seacat, A.M. 2002. Interactions of
Fluorochemicals with Rat Liver Fatty Acid-Binding Protein. Toxicol. 176, 175-185.
Luebker, D.J., York, R.G., Hansen, K.J., Moore, J.A., Butenhoff, J.L. 2005. Neonatal Mortali-
ty from In Utero Exposure to Perfluorooctanesulfonate (PFOS) in Sprague-Dawley
Rats: Dose-Response, and Biochemical and Pharmacokinetic Parameters. Toxicol.
215, 149-169.
Martin, J.W., Muir, D.C.G., Moody, C.A., Ellis, D.A., Kwan, W., Solomon, K.R., Mabury,
S.A. 2002. Collection of Airborne Fluorinated Organics and Analysis by Gas Chroma-
tography Chemical Ionization Mass Spectrometry. Anal. Chem. 74, 584-590.
Martin, J.W., Mabury, S.A., Solomon, K.R., Muir, D.C.G. 2003. Bioconcentration and Tissue
Distribution of Perfluorinated Acids in Rainbow Trouts (Oncorhyncus mykiss). Envi-
ron. Sci. Technol. 22, 196-204.
Martin, J.W., Whittle, D.M., Muir, D.C.G., Mabury, S.A. 2004. Perfluoroalkyl Contaminants
in a Food Web from Lake Ontario. Environ. Sci. Technol. 38, 5379-5385.
Martin, J.W., Ellis, D.A., Mabury, S.A., Hurley, M.D., Wallington,T.J. 2006. Atmospheric
Chemistry of Perfluoroalkanesulfonamides: Kinetic and Product Studies of the OH
XXII

Bibliography
and Cl Atom Initiated Oxidiation of N-ethyl Perfluorobutanesulfonamide. Environ.
Sci. Technol. 40, 864-872.
McLachlan, M.S., Holmstrom, K.E., Reth, M., Berger, U. 2007. Riverine Discharge of Per-
fluorinated Carboxylates from the European Continent. Environ. Sci. Technol. 41,
7260-7265.
Moody, C.A., Field, J.A. 1999. Determination of Perfluorocarboxylates in Groundwater Im-
pacted by Fire-Fighting Activity. Environ. Sci. Technol. 33, 2800-2806.
Moody, C.A., Kwan, W.C., Martin, J.W., Muir, D.C.G., Mabury, S.A. 2001. Determination of
Perfluorinated Surfactants in Surface Water Samples by Two Independent Analytical
Techniques: Liquid Chromatography/ Tandem Mass Spectrometry and 19F NMR.
Anal. Chem. 73, 2200-2206.
Moody, C.A., Martin, J.W., Kwan, W.C., Muir, D.C.G., Mabury, S.A. 2002. Monitoring Per-
fluorinated Surfactants in Biota and Surface Water Samples Following an Accidental
Release of Fire-Fighting Foam into Etobicoke Creek. Environ. Sci. Technol. 36, 545-
551.
Moody, C.A., Herbert, G., Strauss, S.H., Field, J.A. 2003. Occurrence and Persistence of
Perfluorooctanesulfonate and other Perfluorinated Surfactants in Groundwater at a
Fire Training Area at Wurtsmith Air Force Base, Michigan, USA. J. Environ. Monit.
5, 341-345.
Morikawa, A., Kamei, N., Harada, K., Inoue, K., Yoshinaga, T., Saito, N., Koizumi, A. 2006.
The Bioconcentration Factor of Perfluorooctane Sulfonate is Significantly Larger than
that of Perfluorooctanoate in Wild Turtles (Trachemys scripta elegans and Chinemys
reevesii): An Ai River Ecological Study in Japan. Ecotoxicol. Environ. Safety 65, 14-
21.
Moriwaki, H., Takata, Y., Arakawa, R. 2003. Concentrations of Pefluorooctane Sulfonate
(PFOS) and Perfluorooctanoic Acid (PFOA) in Vacuum Cleaner Dust Collected in
Japanese Homes. J. Environ. Monit. 5, 753-757.
Nakata, H., Kannan, K., Nasu, T., Cho, H.S., Takemura, A. 2006. Perfluorinated Contamnants
in Sediments and Aquatic Organisms Collected from the Shallow Water and Tidal Flat
XXIII

Bibliography
Areas of the Ariake Sea, Japan: Environmental Fate of Perfluorooctane Sulfonate in
Aquatic Ecosystems. Environ. Sci. Technol. 40, 4916-4921.
Nakayama, S., Strynar, M.J., Helfant, L., Egeghy, P., Ye, X., Lindstrom, A.B. 2007. Per fluo-
rinated Compounds in the Cape Fear Drainage Basin in North Carolina. Environ.
Sci. Technol. 41, 5271-5276.
Newsted, J.L., Beach, S.A., Gallagher, S.P., Giesy, J.P. 2006. Pharmacokinetics and Acute
Lethality of Perfluorooctanesulfonate (PFOS) to Juvenile Mallard and Northern
Bobwhite. Arch. Environ. Contam. Toxicol. 50, 411-420.
OECD 2002. Environment Directorate Organisation for Economic Co-Operation and Deve-
lopment, Joint Meeting of the Chemicals Committee and the Working Party on
Chemicals, Pesticides and Biotechnology. Co-Operation on Existing Chemicals. Haz-
ard Assessment of Perfluorooctanoate and its Salts. ENV/JM/RD(2002)17/FINAL,
http://www.oecd.org/dataoecd/23/18/2382880.pdf
OECD 2005. Environment, Health and Safety Publications Series on Risk Management No.
19. Results of Survey on Production and Use of PFOS, PFAS and PFOA, Related
Substances and Products/ Mixtures Containing These Substances. ENV/JM/
MONO(2005)1, http://www.olis.oecd.org/olis/2005doc.nsf/LinkTo/NT0000097A/$FI-
LE/JT00176885.PDF
Ohmori, K., Kudo, N., Katayama, K., Kawashima, Y. 2003. Comparison of the Toxicokine-
tics Between Perfluorocarboxylic Acids with Different Carbon Chain Length. Toxicol.
184, 135-140.
Ohya, T., Kudo, N., Suzuki, E., Kawashima, Y. 1998. Determination of Perfluorinated Car-
boxylic Acids in Biological Samples by High-Performance Liquid Chromatography.
J.Chrom. B. 720,1-7.
Olsen, G.W., Hansen, K.J., Stevenson, L.A., Burris, J.M., Mandel, J.H. 2003. Human Donor
Liver and Serum Concentrations of Perfluorooctanesulfonate and Other Perfluoro-
chemicals. Environ. Sci. Technol. 37, 888-891.
Olsen, G., Ehresman, D., Froehlich, J., Burris, J., Butenhoff, J. 2005. Poster Presented at the
International Symposium of Fluorinated Alkyl Organics in teh Environment, Toronto,
XXIV

Bibliography
Canada, 18-20 August, http://www.chem.utoronto.ca/symposium/fluoros/pdfs/TOX0-
17Olsen.pdf.
Powley, C.R., Michalczyk, M.J., Kaiser, M.A., Buxton, L.W. 2005 a. Determination of Per-
fluoroctanoic Acid (PFOA) Extractable from the Surface of Commercial Cookware
under Simulated Cooking Conditions by LC/MS/MS. Analyst 130, 1299-1302.
Powley, C.R., George, S.W., Ryan, T.W., Buck, R.C. 2005. Matrix Effect-Free Analytical
Methods for Determination of Perfluorinated Carboxylic Acids in Environmental Ma-
trixes. Anal. Chem. 77, 6353-6358.
Prevendouros, K., Cousins, J.T., Buck, R.C., Korzeniowski, S. 2004. Sources, Fate and
Transport of Pefluorocarboxylates. Environ. Sci. Techol. 40, 32-44.
Renner, R. 2001. Growing Concern Over Perfluorinated Chemicals. Environ. Sci. Technol.
35, 154A-160A.
Saito, N., Sasaki, K., Nakatome, K., Harada, K., Yoshinaga, T., Koizumi, A. 2003. Per-
fluorooctane Sulfonate Concentrations in Surface Water in Japan. Arch. Environ. Con-
tam. Toxicol. 45, 149-158.
Saito, N., Harada, K., Inoue, K., Sasaki, K., Yoshinaga, T., Koizumi, A. 2004. Perfluoroc-
tanoate and Perfluoroctane Sulfonate Concentrations in Surface Water in Japan.
J. Occup. Health 46, 49-59.
Sasaki, K.; Harada, K., Saito, N., Nakanishi, S., Tsuzuki, H., Koizumi, A. 2003. Impact of
Airborne Perfluorooctane Sulfonate on the Human Body Burden and the Ecological
System. Bull. Environ. Contam. Toxicol. 71, 408-413.
Schultz, M.M., Barofsky, D.F., Field, J.A. 2003. Fluorinated Alkyl Surfactants. Environ. Eng.
Sci. 20, 487-501.
Schultz, M.M., Barofsky, D.F., Field, J.A. 2006 a. Quantitative Determination of Fluorinated
Alkyl Substances by Large-Volume-Injection Liquid Chromatography Tandem Mass
Spectrometry – Characterization of Municipal Wastewaters. Environ. Sci. Technol. 40,
289-295.
XXV

Bibliography
Schultz, M.M., Higgins, C. P., Huset, C.A., Luthy, R. G., Barofsky, D.F., Field, J.A., 2006 b.
Fluorochemical Mass Flow in a Municipal Wastewater Treatment Facility. Environ.
Sci. Technol. 40, 7350 – 7357.
Scott, B.F., Moody, C.A., Spencer, C., Small, J.M., Muir, D.C.G. Mabury, S. 2006 a.
Analysis of Perfluorocarboxylic Acids/Anions in Surface Waters and Precipitation
Using GC-MS and Analysis of PFOA from Large-Volume Samples. Environ. Sci.
Technol. 40, 6405-6410.
Scott, B.F., Spencer, C., Mabury, S., Muir, D.C.G. 2006 b. Poly and Perfluorinated Carboxy-
lates in North American Precipitation. Environ. Sci. Technol. 40, 7167-7256.
Senthilkumar, K., Ohi, E., Sajwan, K., Takasuga, T., Kannan, K. 2007. Perfluorinated
Compounds in River Water, River Sediment, Market Fish, and Wildlife Samples from
Japan. Bull. Environ. Contam. Toxicol. 79, 427-431.
Shoeib, M., Harner, T., Wilford, B.H., Jones, K.C., Zhu, J. 2005. Perfluorinated Sulfonamides
in Indoor and Outdoor Air and Indoor Dust: Occurrence, Partitioning, and Human Ex-
posure. Environ. Sci. Technol. 39, 6599-6606.
Sottani, C., Minoia, C. 2002. Quantitative Determination of Perfluorooctanoic Acid Ammo-
nium Salt in Human Serum by High-Performance Liquid Chromatography with At-
mospheric Pressure Chemical Ionisation Tandem Mass Spectrometry. Rapid Commun.
Mass Spectrom. 16, 650-654.
Sinclair, E., Kannan, K., 2006 a. Mass Loading and Fate of Perfluoroalkyl Surfactants in
Wastewater Treatment Plants. Environ. Sci. Technol. 40, 1408-1414.
Sinclair, E., Mayack, D.T., Roblee, K., Yamashita, N., Kannan, K., 2006 b. Occurrence of
Perfluoroalkyl Surfactants in Water, Fish, and Birds from New York State. Arch.
Environ. Contam. Toxicol. 50, 398-410.
Skutlarek, D., Exner, M., Färber, H. 2006. Perfluorierte Tenside (PFT) in der Aquatischen
Umwelt und im Trinkwasser. Z. Umweltchem. Ökotox. 18, 151-154.
Smithwick, M., Norstrom, R.J., Mabury, S.A, Solomon, K., Evans, T.J., Stirling, I., Taylor,
M.K., Muir, D.C.G. 2006. Temporal Trends of Perfluoroalkyl Contaminants in Polar
XXVI

Bibliography
Bears (Ursus maritimus from Two Locations in the North American Arctic, 1972 –
2002. Environ. Sci. Technol. 40, 1139-1143.
So, M.K., Taniyasu, S. Yamashita, N., Giesy, J.P., Zheng, J., Fang, Z., Im, S.H., Lam, P.K.S.
2004. Perfluorinated Compounds in Coastal Waters of Hong Kong, South China, and
Korea. Environ. Sci. Technol. 38, 4065-4063.
So, M.K., Taniyasu, S., Lam, P.K.S., Zheng, G.J., Giesy, J.P., Yamashita, N. 2006 a. Alkaline
Digestion and Solid Phase Extraction Method for Perfluorinated Compounds in Mus-
sels and Oysters from South China and Japan. Archiv. Environ. Contam. Toxicol.
50, 240-248.
So, M.K., Yamashita, N., Taniyasu, S., Jiang, Q., Giesy, J.P., Chen, K., Lam, P.K.S. 2006 b.
Health Risks in Infants Associated with Exposure to Perfluorinated Compounds in
Human Breast Milk from Zhoushan China. Environ. Sci. Technol. 40, 2924-2929.
So, M.K., Miyake, Y., Yeung, W.Y., Ho, Y.M., Taniyasu, S., Rostkowski, P., Yamashita, N.,
Zhou, B.S., Shi, X.J., Wang, J.X., Giesy, J.P., Yu, H., Lam, P.K.S. 2007. Perfluorina-
ted Compounds in the Pearl River and Yangtze River of China. Chemosphere 68,
2085-2095.
Stadalius, M., Connolly, P., L’Empereur, K., Flaherty, J. M., Isemura, T., Kaiser, M.A.,
Knaup, W., Noguchi, M. 2006. A Method for the Low-Level (ng g-1) Determination of
Perfluorooctanoate in Paper and Textile by Liquid Chromatography with Tandem
Mass Spectrometry. J. Chrom. A 1123, 10-14.
Stock, N.L., Lau, F.K., Ellis, D.A., Martin, J.W., Muir, D.C.G. Mabury, S. A. 2004. Polyfluo-
rinated Telomer Alcohols and Sulfonamides in the North American Troposphere. En-
viron. Sci. Technol. 38, 991-996.
Stock, N.L., Furdui, V.I., Muir, D.C.G., Mabury, S.A. 2007. Perfluoroalkyl Contaminants in
the Canadian Arctic: Evidence of Atmospheric Transport and Local Contamination.
Environ. Sci. Technol. 41, 3529-3536.
Strauss, S.H., Odom, M.A., Herbert, G.N., Clapsaddle, B.J. 2002. ATR-FTIR Detection of
≤µg/L Aqueous Cyanide, Perchlorate, and PFOS. J. Am. Water Works Assoc. 94, 109-
115.
XXVII
Bibliography
Sweetser, P.B. 1956. Decomposition of Organic Fluorine Compounds by Wickbold Oxyhy-
drogen Flame Combustion Method. Anal. Chem. 28, 1766-1768.
Takino. M., Daishima, S., Nakahara, T. 2003. Determination of Perfluorooctane Sulfonate in
River Water by Liquid Chromatography/Atmospheric Pressure Photoionisation Mass
Spectrometry by Automated On-Line Extraction Using Turbulent Flow Chromatogra-
phy. Rapid Commun. Mass Spectrom. 17, 383-390.
Tang, C.Y., Fu, S., Robertson, A.P., Criddle, C.S., Leckie, J.O. 2006. Use of Reverse Osmo-
sis Membranes to Remove Perfluorooctane Sulfonate (PFOS) from Semiconductor
Wastewater. Environ. Sci, Technol. 40, 7343-7349.
Tang, C.Y., Fu, S., Criddle, C.S., Leckie, J.O. 2007. Effect of Flux (Transmembrane Pressure)
and Membrane Properties on Fouling and Rejection of Reverse Osmosis and Nanofil-
tration Membranes Treating Perfluorooctane Sulfonate Containing Wastewater. Envi-
ron. Sci. Technol. 41, 2008-2014.
Taniyasu, S., Kannan, K., Horii, Y., Hanari, N., Yamashita, N. 2003. A Survey of Perfluo-
rooctane Sulfonate and Related Perfluorinated Organic Compounds in Water, Fish,
Birds, and Humans from Japan. Environ. Sci. Technol. 37, 2634-2639.
Tao, L., Kanna. K., Kajiwara, N., Costa, M.N., Fillmann, G., Takahashi, S., Tanabe, S. 2006.
Perfluoroctanesulfonate and Related Fluorochemicals in Albatrosesses, Elephant
Seals, Penguins, and Polar Skuas from the Southern Ocean. Environ. Sci. Technol. 40,
7642-7648.
Tao, L., Kannan, K., Wong, C.M., Arcaro, K.F., Butenhoff 2008. Perfluorinated Compounds
in Human Milk from Massachusetts, USA. Environ. Sci. Technol. 42, 3096-3101.
Tittlemier, S.A., Pepper, K., Seymour, C., Moisey, J., Bronson, R., Cao, X.L., Debeka, R.W.
2007. Dietary Exposure of Canadians to Perfluorinated Carboxylates and Perluorooc-
tane Sulfonate via Consumption of Meat, Fish, Fast Foods, and Food Items Prepared
in Their Packaging. J. Agric. Food Chem. 55, 3203-3210.
Tseng, C.L., Liu, L.L., Chen, C.M., Ding, W.H. 2005. Analysis of Perfluorooctanesulfonate
and Related Fluorochemicals in Water and Biological Tissue Samples by Liquid
Chromatography-Ion Trap Mass Spectrometry. J. Chrom. A 1076, 16-26.
XXVIII

Bibliography
U.K. Standard Food Agency 2006. Fluorinated Chemicals: U.K. Dietary Intakes. Food Survey
Information Sheet 11/06, http://www.food.gov.uk/multimedia/pdfs/fsis1106.pdf
Upham, B.L., Deocampo, N.D., Wurl, B., Trosko, J.E. 1998. Inhibition of Gap Junctional
Intercellular Communication by Perfluorinated Fatty Acids is Dependent on the Chain
Length of the Fluorinated Tail. Int. J. Cancer 78, 491-495.
Van de Vijver, K.I., Hoff, P., Das, K., Brasseur, G.D., Van Dogen, W., Esmans, E.L., Reijn-
ders, P., Blust, R., de Coen, W., 2005. Tissue Distribution of Perfluorinated Chemicals
in Harbour Seals (Phoca Vitulina) from the Dutch Wadden Sea. Environ. Sci. Technol.
39, 6978-6984.
Van de Vijver, K.I., Holsbeek, L., Das, K., Blust, R., Joiris, Cl., De Coen,W. 2006. Occur-
rence of Perfluorooctane Sulfonate and Other Perfluorinated Alkylated Substances in
Harbor Porpoises from the Black Sea. Environ. Sci. Technol. 41, 315-320.
Verreault, J., Berger, U., Gabrielsen, G.W. 2007. Trends of Perfluorinated Alkyl Substances
in Herring Gull Eggs from Two Coastal Colonies in Northern Norway: 1983 – 2003.
Environ. Sci. Technol. 41, 6671-6677.
Wang, N., Szostek, B., Buck, R.C., Folsom, P.W., Sulecki, L.M., Capka, V., Gannon, J.T.
2005. Flurotelomer Alcohol Biodegradation – Direct Evidence that Perfluorinated
Carbon Chains Breakdown. Environ. Sci. Technol. 39, 7516-7528.
Washburn, S.T., Bingman, T.S., Braithwaite, S.K., Buck, R.C., Buxton, W., Clewell, H.J.,
Haroun, L.A., Kester, J.E., Rickard, R.W., Shipp, A.M. 2005. Exposure Assessment
and Risk Characterization for Perfluorooctanoate in Selected Consumer Articles. Envi-
ron. Sci. Technol. 39, 3904-3910.
Yamashita, N., Kannan, K., Taniyasu, S., Horii, Y., Okazawa, T., Petrick, G., Gamo, T. 2004.
Analysis of Perfluorinated Acids at Parts-Per-Quadrillion Levels in Seawater Using
Liquid Chromatography-Tandem Mass Spectrometry. Environ. Sci. Technol. 38, 5522-
5528.
Yamashita, N., Kannan, K., Taniyasu, S., Horii, Y., Petrick, G., Gamo, T. 2005. A Global
Survey of Perfluorinated Acids in Oceans. Marine Poll. 51, 658-668.
XXIX

Bibliography
Yeung, L.W.Y., So, M.K., Jiang, G., Taniyasu, S., Yamashita, N., Song, M., Wu, Y., Li, J.,
Giesy, J.P., Guruge, K.S., Lam, P.K.S. 2006. Perfluorooctanesulfonate and Related
Fluorochemicals in Human Blood Samples from China. Environ. Sci. Technol. 40,
715-720.
Yeung, L.W.Y., Guruge, K.S., Yamanaka, N., Miyazaki, S., Lam, P.K.S. 2007. Differential
Expression of Chicken Hepatic Genes Responsive to PFOA and PFOS. Toxicol. 237,
11-125.
Ylien, M., Hanhijärvi, H., Peura, P., Rämö, O. 1985. Quantitative Gas Chromatographic De-
termination of Perfluorooctanoic Acid as the Benzyl Esther in Plasma and Urine. Arch.
Environ. Contam. Toxicol. 14, 713-717.
Young, C.J., Furdui, V.I., Franklin, J., Koerner, R.M., Muir, D.C.G., Mabury, S.A. 2007.
Perfluorinated Acids in Arctic Snow: New Evidence for Atmospheric Formation.
Environ. Sci. Technol. 41, 3455-3461.
Zhao, X., Li, J., Shi, Y., Cai, Y., Mou, S., Jiang, G. 2007. Determination of Perfluorinated
Compounds in Wastewater and River Water Samples by Mixed Hemimicelle-Based
Solid-Phase Extraction before Liquid Chromatography-Electrospray Tandem Mass
Spectrometry Detection. J. Chrom. A 1154, 52-59.
XXX

Ehrenwörtliche Erklärung
Ehrenwörtliche Erklärung
Hiermit erkläre ich, dass ich die Arbeit selbst verfasst und keine anderen als die von mir an-
gegebenen Quellen und Hilfsmittel benutzt habe.
Ferner erkläre ich, dass ich weder an der Universität Bayreuth noch anderweitig versucht ha-
be, eine Dissertation einzureichen oder mich der Doktorprüfung zu unterziehen.
( Anna Maria Becker )
XXXI