dissection of the impact of tissue context on anti-cancer ...compound imposed by combinatorial...
TRANSCRIPT

Dissection of the impact of tissue context on anti-cancer drug activity
through the use of high dimensional combinatorial microenvironment
analysis
By
Chun-Han Lin
A dissertation submitted in partial satisfaction of the
requirements for the degree of
Doctor of Philosophy
in
Comparative Biochemistry
in the
Graduate Division
of the
University of California, Berkeley
Committee in charge:
Dr. Mark LaBarge, Co-chair
Professor Andreas Stahl, Co-chair
Professor Fenyong Liu
Professor Gertrude Case Buehring
Spring 2016


! 1!
Abstract
Dissection of the impact of tissue context on anti-cancer drug activity
through the use of high dimensional combinatorial microenvironment
analysis
by
Chun-Han Lin
Doctor of Philosophy in Comparative Biochemistry
University of California at Berkeley
Dr. Mark LaBarge, Co-chair
Professor Andreas Stahl, Co-chair
Breast cancer alone accounts for 29 % of all new cancer diagnoses and is the
second leading cause of cancer related death. Improvement in early detection
and the understanding of oncogenic drivers connected to malignant
transformation and cancer progression has lead to an overall decrease in breast
cancer related mortality1. However, therapeutic durability remains a problem for
both chemotherapies and pathway-targeted drugs. Furthermore, the poor
translation from pre-clinical screening results to clinical outcomes impedes
therapeutic development.
Genomic heterogeneity and other cell intrinsic mechanisms are commonly
examined as a major source of therapeutic failure. Using a reductionist approach,
I examined the hypothesis that the tissue microenvironment is a potent modulator

! 2!
of drug activity and therapeutic response. I first tested the hypothesis that matrix
rigidity of microenvironments can modulate the efficacy of the targeted-
therapeutic small molecule, lapatinib, in HER2-amplified breast cancer cell lines.
The anti-proliferative effect of lapatinib was inversely proportional to the elastic
modulus of the adhesive substrates. The modulus-dependent lapatinib
responses were eliminated with treatment of mechanosensing inhibitors, Y27632
and blebbistatin. Knockdown of the hippo pathway mechanotransducer, YAP,
eliminated the modulus-dependent lapatinib responses, and pharmacological
inhibition of YAP phenocopied the effect of YAP knockdown. Reduction of YAP in
vivo in mice also slowed the growth of implanted HER2-amplified tumors, these
showing a trend of increasing sensitivity to lapatinib as YAP decreased. Thus, I
addressed the role of stiffness in resistance to, and efficacy of, a HER2 pathway-
targeted therapeutic via the mechanotransduction arm of the hippo pathway.
In order to dissect and investigate the microenvironmental impact on drug
responses, we developed the MicroEnvironmental microarray, (MEArray)
platform. The method allows for simultaneous control of the molecular
composition and the elastic modulus. Utilizing the MEArray, I further tested the
hypothesis that in addition to matrix rigidity, molecular composition can modulate
lapatinib responses. I systematically quantified the microenvironmental impact on
cellular morphological changes and the lapatinib responses. The results were
consistent with our previous report that matrix rigidity conferred lapatinib
resistance. I also identified that cells adhered to fibronectin showed higher

! 3!
lapatinib resistance independent of stiffness. The validations showed that
fibronectin conferred nuclear YAP translocation, which may explain partly the
mechanism of the lapatinib resistance. Further studies for elucidation of
fibronectin-induced lapatinib resistance are needed. However, simultaneous
modulation of stiffness and molecular composition revealed a continuum of drug
responses resulting from cell-microenvironment interactions.

! i!
Dedication
To
My Mother
My Sisters
My Brother
My Father
And
My Wife
I LOVE YOU ALL.

! ii!
Acknowledgements
I want to thank my whole family, who support me pursuing my PhD. I also want to
thank all the past and the present members of the LaBarge lab for their help. This
work was supported in part by Government Scholarship for Overseas Study from
Ministry of Education, Taiwan (R.O.C).

! iii!
Table of Contents
CHAPTER 1: INTRODUCTION 1 1.1. BREAST CANCER AND THE CHALLENGES OF THERAPEUTIC DURABILITY. 1 1.2. THE MECHANISMS OF LAPATINIB RESISTANCE IN HER2 OVEREXPRESSION BREAST CANCERS. 2 1.3. THE ROLE OF MECHANOSENSING PATHWAY AND YAP (YES-ASSOCIATED PROTEIN 1)/TAZ (PDZ BINDING MOTIF) IN BREAST CANCER AND THERAPEUTIC RESPONSES. 3 1.4. A FAILURE TO PREDICT EFFICACY. 6 1.5. TUMORS ARE HETEROGENEOUS “ORGANS”, AND TUMOR MICROENVIRONMENTS ARE IMPORTANT DETERMINANTS IN THERAPEUTIC RESPONSES. 7 1.6. DECONSTRUCTING TUMOR MICROENVIRONMENTS INTO EXPERIMENTALLY TRACTABLE COMBINATIONS. 9 1.7. COMBINATORIAL MICROENVIRONMENT PLATFORMS MIMIC DIVERSE AND DEFINED MICROENVIRONMENTS AND MEET HIGHER THROUGHPUT ABILITY. 12 1.8. SUMMARY. 13
CHAPTER 2: MATERIALS AND METHODS 15 2.1. CELL CULTURE AND DRUG TREATMENT. 15 2.2. TUNABLE ELASTIC MODULUS CELL CULTURE SUBSTRATE FABRICATION. 16 2.3. PROLIFERATION ASSAY 16 2.4. TRANSFECTION. 17 2.5. IMMUNOFLUORESCENCE STAINING. 17 2.6. REAL-TIME PCR. 18 2.7. FLOW CYTOMETRY. 19 2.8. AREG ELISA. 19 2.9. ANIMAL EXPERIMENT. 19 2.10. HUMAN PHOSPHO-RECEPTOR TYROSINE KINASE (RTK) ARRAY. 20 2.11. MICROENVIRONMENT MICROARRAY (MEARRAY). 20 2.11.1. PRINTING SUBSTRATE PREPARATION. 20 2.11.2. PROTEIN MASTER PLATE PREPARATION. 21 2.11.3. MEARRAY PRINTING. 21 2.11.4. CULTURING CELLS ON MEARRAY. 22 2.11.5. DATA ANALYSIS. 22 2.11.6. VALIDATIONS OF CANDIDATES. 23 2.12. STATISTICS. 23
CHAPTER 3: RESULTS 24 3.1. MICROENVIRONMENT RIGIDITY MODULATES RESPONSES TO THE HER2 RECEPTOR TYROSINE KINASE INHIBITOR LAPATINIB VIA YAP AND TAZ TRANSCRIPTION FACTORS. 24 3.1.1. RATIONALE. 24 3.1.2. SUMMARY. 24 3.1.3. SUBSTRATE ELASTIC MODULUS IS A MODIFIER OF LAPATINIB RESPONSES IN HER2-AMPLIFIED BREAST CANCER CELLS. 25 3.1.4. ACTINOMYOSIN NETWORK IS INVOLVED IN MODULUS-DEPENDENT LAPATINIB RESPONSES. 27 3.1.5. YAP AND TAZ ARE REQUIRED FOR THE MODULUS-DEPENDENT LAPATINIB RESPONSES. 27 3.1.6. YAP KNOCKDOWN IN VIVO INCREASED SENSITIVITY TO LAPATINIB TREATMENT. 28
! iv!
3.1.7. MODULUS-DEPENDENT LAPATINIB RESPONSES ARE DRIVEN BY MULTIPLE FACTORS. 29 3.2. FABRICATION AND USE OF MICROENVIRONMENT MICROARRAYS (MEARRAYS). 31 3.2.1. RATIONALE. 31 3.2.2. SUMMARY. 31 3.2.3. A FLOW CHART OF THE MEARRAY PROCEDURE. 32 3.2.4. VERIFICATION OF REPRESENTATIVE RESULTS. 32 3.3. A CONTINUUM OF THERAPEUTIC RESPONSES TO A SINGLE PATHWAY-TARGETED COMPOUND IMPOSED BY COMBINATORIAL MICROENVIRONMENTS. 34 3.3.1. RATIONALE. 34 3.3.2. SUMMARY. 35 3.3.3. BOTH MOLECULAR COMPOSITIONS AND MATRIX RIGIDITY ALTER MORPHOLOGICAL FEATURES. 35 3.3.4. BOTH MOLECULAR COMPOSITIONS AND MATRIX RIGIDITY IMPACT LAPATINIB RESPONSES. 37 3.3.5. A SYSTEMATIC ANALYSIS FOR IMPACT OF INDIVIDUAL MICROENVIRONMENTAL PROPERTY AS WELL AS THE PAIR-WISE INTERACTIONS OF SINGLE PROPERTY TO LAPATINIB RESPONSES. 38 3.3.6. THE LOWER PHER2/HER2 STATUS WAS CORRELATED WITH HIGHER LAPATINIB RESISTANCE. 39 3.3.7. FIBRONECTIN CONFERRED LAPATINIB RESISTANCE IN HCC1569. 40
CHAPTER 4: DISCUSSION 42 4.1. THE MECHANOSENSING PATHWAY AND YAP ARE APPEALING THERAPEUTIC TARGETS. 42 4.2. APPLICATIONS OF MEARRAYS. 45 4.3. SELECTING THE PRINTING SUBSTRATE: IT DEPENDS ON THE BIOLOGICAL QUESTIONS BEING ASKED. 46 4.4. MEARRAY DATA ANALYSIS: SEEING THE FOREST FOR THE TREES. 48 4.4.1. DATA NORMALIZATION. 49 4.4.2. STATISTICAL CONSIDERATIONS. 50 4.4.3. DIMENSION REDUCTION AND DATA VISUALIZATION. 52 4.5. ECM PROTEINS HAVE MAJOR IMPACT ON LAPATINIB RESPONSES. 54 4.6. THE EFFECTS FROM OTHER RECOMBINANT PROTEINS. 55
CHAPTER 5: CONCLUSIONS 57 5.1. CONCLUSIONS 57
CHAPTER 6: REFERENCE: 59
CHAPTER 7: FIGURES AND FIGURE LEGENDS 68 FIGURE 1. SUBSTRATA ELASTIC MODULUS IS A MODIFIER OF LAPATINIB RESPONSES IN HER2-AMPLIFIED CANCER CELLS. 69 FIGURE 2. INHIBITION OF ROCK1/2 AND MYOSIN II INCREASES RESISTANCE TO LAPATINIB ON COMPLIANT SUBSTRATA BUT HAS NO EFFECT IN 3D MATRIGEL. 71 FIGURE 3. YAP AND TAZ ARE REQUIRED FOR THE MODULUS-DEPENDENT LAPATINIB RESPONSES. 73 FIGURE 5. YAP-DEPENDENT AMPHIREGULIN PROTEIN REGULATION IS INVOLVED IN THE MODULUS-DEPENDENT LAPATINIB RESPONSES. 77 FIGURE 6. KNOCKDOWN EFFICIENCY IN SIRNA EXPERIMENTS. 79 FIGURE 7. VERTEPORFIN HAS A SYNERGISTIC EFFECT WITH LAPATINIB. 81

! v!
FIGURE 8. CORRELATION BETWEEN YAP GENE EXPRESSION WITH EXPRESSION OF A NUMBER OF HIPPO AND HER-RELATED GENES IN THE TCGA DATASET. 83 FIGURE 9. RESPONSES TO CHANGES IN MICROENVIRONMENTAL STIFFNESS FOR 49 DIFFERENT RECEPTOR TYROSINE KINASES (RTK). 85 FIGURE 10. A FLOW CHART OF THE MEARRAY PROCEDURE. 87 FIGURE 11. DEPOSITION AND RELATIVE ABUNDANCE OF PRINTED PROTEINS CAN BE VERIFIED WITH IMMUNOSTAINING PRIOR TO CELL ATTACHMENT. 89 FIGURE 12. DEPOSITION AND RELATIVE ABUNDANCE OF PRINTED PROTEINS CAN BE VERIFIED WITH IMMUNOSTAINING PRIOR TO CELL ATTACHMENT. 91 FIGURE 13. DEPOSITION AND RELATIVE ABUNDANCE OF PRINTED PROTEINS CAN BE VERIFIED WITH IMMUNOSTAINING PRIOR TO CELL ATTACHMENT. 93 FIGURE 14. AN EXAMPLE OF AN MEARRAY ANALYSIS USING CHANGES IN KERATIN EXPRESSION IN A MULTIPOTENT PROGENITOR CELL LINE AS A FUNCTIONS OF TIME AND MICROENVIRONMENT. 95 FIGURE 15. AN EXAMPLE OF AN MEARRAY SCAN ACQUIRED USING A TILED ACQUISITION MODE ON A LASER SCANNING CONFOCAL MICROSCOPE. 97 FIGURE 16. BOTH MOLECULAR COMPOSITIONS AND MATRIX RIGIDITY ALTER MORPHOLOGICAL FEATURES. 99 FIGURE 17. THE NUMBER OF NEIGHBOR CELLS AND CELLULAR MORPHOLOGY WERE HIGHLY IMPACTED BY MICROENVIRONMENTS. 101 FIGURE 19. A SYSTEMATIC ANALYSIS OF THE MICROENVIRONMENTAL IMPACT ON DRUG RESPONSES. 105 FIGURE 20. THE PHER2/HER2 STATUS IS AFFECTED BY MICROENVIRONMENT AND CONTRIBUTES TO LAPATINIB INHIBITION. 107 FIGURE 21. FIBRONECTIN CONFERRED LAPATINIB RESISTANCE. 109 FIGURE 22. EXAMPLE OF MEARRAY PLATFORMS. 111 TABLE 1. SOFTWARE FOR PROCESSING MICROARRAY DATA. 113 TABLE 2 DATA ANALYSIS AND VISUALIZATION TECHNIQUES USED WITH MEARRAY-TYPE DATA. 114
CHAPTER 8: APPENDICES 115 ABBREVIATIONS 115

! 1!
Chapter 1: Introduction
1.1. Breast cancer and the challenges of therapeutic durability.
Cancer is the second leading cause of death in United States and it is also a
general public health problem worldwide1. Depending upon the tumor
characteristics, and patient preference, the standard treatments for breast cancer
include surgery, radiation, chemotherapy, immune therapy, hormone therapy,
and pathway-targeted therapy2. For early breast cancer, breast-conserving
surgery followed by radiation provides long-term survival similar to mastectomy2.
Once the tumors progress to later stages, chemotherapy and targeted therapy
may provide additional defense against the primary tumor and prevent
metastasis. Molecular subtypes of breast cancer have been investigated and
used for planning treatments and developing new therapies. Depending upon the
gene expression profiles of breast cancers, there are several major subtypes,
including luminal A, luminal B, HER2 over expression, triple negative basal-like,
and normal-like3. Based on clinical applications, breast cancers can be classified
into three subtypes; estrogen receptor (ER) positive, HER2 positive, and “triple
negative” breast cancers that do not expression estrogen, progesterone, or
HER2 receptors3. Current major treatment strategies target only these three
major subtypes. However, breast cancer is highly heterogeneous and the anti-
cancer drug responsiveness varies among patients in the same subtype. Even in
one patient, primary and recurrent tumors also respond differently to the same
therapy4. Drug responses are influenced by multiple factors, such as the genetic

! 2!
background, drug accessibility, and tumor microenvironment. It has been shown
that the efficacy of anti-cancer drugs are lost during the transition from in vitro
drug screening to in vivo animal models5. Also, it has been shown that
conventional monolayer cultures are not representative of physiologic conditions6.
This lack of similarity to physiologic conditions may explain why during drug
development, only a small percentage of leading candidate compounds enter
animal model testing, and even fewer enter clinical trials. In order to improve the
rate of successful translation from pre-clinical to clinical, the impact of tumor
microenvironment to therapeutic efficacy needs to be considered.
1.2. The mechanisms of lapatinib resistance in HER2 overexpression
breast cancers.
Human epidermal growth factor receptor 2 (HER2)-positive breast cancers
account for about 15-20% of breast cancers, have poor prognosis, and are less
responsive to hormone treatment than HER2(-) breast cancers3, 7. Although
HER2-targeted therapies are one of the success stories in breast cancer
treatment8, generating a durable drug response remains a challenge9.
Trastuzumab, one of the major HER2-targeted therapies, is considered standard
treatment for HER2(+) breast cancer and may be given together with
chemotherapy to improve outcome10. Unfortunately, resistance to trastuzumab
often occurs11. The tyrosine kinase inhibitor lapatinib is a potent inhibitor of
catalytic activity of both epidermal growth factor receptor (EGFR) and HER212;
and lapatinib is often given as one of the options for overcoming trastuzumab
resistance11. Most tumor cells with elevated HER2 levels show high sensitivity to

! 3!
growth inhibition by lapatinib, but resistance often develops13.
Several mechanisms of lapatinib resistance have been reported, including
compensatory activation of parts of the HER network. Compensatory up-
regulation of HER3 activation, driven by Akt (Protein kinase B) activity, confers
resistance to lapatinib in HER2-amplified breast cancer cell lines14. Incomplete
inhibition of EGFR results in heregulin-driven feedback that sustains EGFR
activation, which contributes to lapatinib resistance in HER2(+) breast cancers15.
Other mechanisms include activation of other redundant survival pathways; for
example, up-regulation of the membrane tyrosine kinase AXL (Ark and Ufo)
sustains PI3K/Akt signaling, conferring lapatinib resistance16. Hepatocyte growth
factor (HGF) activation of hepatocyte growth factor receptor (MET) also is
associated with resistance to lapatinib in HER2(+) gastric cancers17. These
studies suggest that the activation of redundant survival pathways can be
induced, either intrinsically, or extrinsically, by microenvironmental factors, such
as growth factors.
1.3. The role of mechanosensing pathway and YAP (Yes-associated
protein 1)/TAZ (PDZ binding motif) in breast cancer and therapeutic
responses.
Compared to the well-known molecular compositions of microenvironment, such
as growth factors and cytokines, the mechanical properties of microenvironment
are less well studied. Stiffness of culture substrate has been shown to alter cell
proliferation, morphology, and cell fate decisions in multipotent progenitors18-20.
In clinical applications, it’s known that tumors can be diagnosed by palpation due
! 4!
to the hardness of tumor compared to adjacent normal tissue. Perhaps
accordingly, breast cancer cell lines exhibit increasingly malignant and invasive
behavior in matrices that are stiffer than normal breast tissue21.
The biophysical properties of tumors change during progression, which also
impacts tumor cell functions. So in addition to redundant signaling pathways,
using integrin-blocking antibodies to alter how tumor cells perceived their
microenvironments was shown to modulate the efficiency of cytotoxic agents22.
Use of an in vitro approach, which compared responses of a number of HER2-
targeted therapeutics (including lapatinib) in multiple HER2-amplified cell lines,
revealed that cells were more sensitive to lapatinib in 3-D Matrigel, when
compared to 2-D cultures using tissue culture plastic (TCP)23. Even in the
relatively simplified 3-D Matrigel cultures, there are multiple chemical and
physical properties that contribute to those microenvironment-dependent drug
responses. Accumulating evidences suggest that microenvironment rigidity can
promote tumor progression and survival through activation of growth factor
signaling pathways, by enhancing integrin clustering and focal adhesion
assembly24, 25, or through modulation of microRNA expression26. The impact of
tissue stiffness to chemotherapeutic response has been reported in a model of
hepatocarcinoma, in which the cells proliferated more slowly on softer surfaces
and were thus less susceptible to the cytotoxic agents27. The underlying
molecular mechanisms of how cells sense and respond to the stiffness of
microenvironment are still not completely understood. Moreover, it is not clear
whether stiffness also alters the response of pathway targeted-drug therapies
! 5!
that are less reliant upon proliferation for efficacy.
The Hippo signaling pathway was discovered in Drosophila melanogaster; it
controls organ size by regulation of cell proliferation28. The control of tissue
growth requires a proper kinase cascade of the Hippo pathway, composing by
components such as Sav1, NF2, MST1/2, LATS1/2, YAP/TAZ, and other kinases
in mammalian cells29. Hippo pathway is conserved in mammals as well, and is
more complex than that of Drosophila. It was linked to human cancer for the first
time in 200230. An increasing number of studies have provided evidence to
suggest that Hippo pathway perturbation and altered expression of subsets of
Hippo pathway components can contribute to tumorigenesis31. The Hippo
pathway is regulated by various signals, such as cell-cell contact32, 33, cellular
energy stress34, and mechanical cues35. Under physiological or pathological
conditions, these various microenvironmental signals may regulate many cellular
functions, including cell fate decision, proliferation, and tumor progression, by
regulating YAP/TAZ activation36. Breast cancer transformation has been shown
to accompany by an increase in collagen decompositions; and the more
aggressive breast cancer subtypes have been correlated with higher nuclear
(activated) YAP and highest stiffness37. Although YAP has recently been shown
to function as both proto-oncogene and tumor suppressor depending on the
cellular context, a the comprehensive understanding of this complicated network
of the YAP pathway needs further study to be elucidated38. The connection
between mechanosensing pathway and Hippo pathway has already been shown
to play important role in tumor progress38 and therapeutic responses39. As such,

! 6!
YAP/TAZ have become appealing therapeutic targets as alternative or combined
treatments with current therapeutic strategies40.
1.4. A failure to predict efficacy.
In anti-cancer drug development, a lackluster ability to predict how molecules will
perform in humans based on pre-clinical drug screening delays the progress of
drug discovery. In the last few decades tremendous resources have been
invested in translating pre-clinical anti-cancer compounds into drugs approved for
clinical use .However, most drugs never end up being approved for clinical use,
which further elevates the cost of development, and make drugs less affordable41.
Advancements in cell and molecular biology, and engineering have
reinvented modern pharmacology, which tries to identify compounds with
potentially selective activity against tumors in cell-based high-throughput
screening (HTS), and then further validate the drug efficacy in animal model
systems, of which rodents are the most popular. These candidates often show
promising effects in lower animals, but show much less success in humans.
Unfortunately, almost 70% of new drugs fail at phase II trial because they meet
safety standards established in phase I trials, but exhibit no efficacy in phase II42.
Studies have started to address the possible mechanisms involving the different
expressed genomes of mice and men, and there are other significant differences
that arise at the level of physiology and tissue architecture that can impact drug
responses as well23.
The tumor microenvironment, i.e. the sum of cell-cell, cell-ECM, cell-soluble
factor interactions and the physical properties and geometry, has been shown to

! 7!
alter cancer progression, drug responses, and a number of other tumor
properties43, 44. Thus, an important challenge that is being undertaken in drug
development is to identify pre-clinical screening modalities that take
microenvironment into account and that are generally more reflective of the
biology of human tissues, in order to provide a more predictable clinical outcome.
1.5. Tumors are heterogeneous “organs”, and tumor microenvironments
are important determinants in therapeutic responses.
The natural inter- and intra- tumor heterogeneity is thought to be a major
component of drug resistance. Our knowledge of the molecular underpinnings of
tumor biology has accelerated remarkably over the past two decades. The
Cancer Genome Atlas (TCGA) program has identified a broad range of recurrent
gene mutations and structural rearrangements that putatively drive tumor genesis,
and a number of drugs have been selected to target protein changes resulting
from those specific gene mutations. Many of these pathway-targeted anti-cancer
agents successfully inhibit the growth of tumor cells in the lab setting, and even
show efficacy in rodent models, but there is a lack of activity in actual humans45.
More recently a nuanced view of tumors has begun to emerge viz. that they are
not just a homogeneous expansion of neoplastic cells, but instead are abnormal
organs, comprising multiple cell types and dynamic extracellular matrix (ECM)46.
These “organs” interact with the body via unique vascular systems and changes
in immune homeostasis that lead to evasion of immune responses as well as
cancer treatments47. The combinations of ECM, growth factors, cytokines, tensile
force, and oxygen tension contribute to control the malignant progression,

! 8!
metastasis, and drug responses44, 48-50.
The cancer stem cell (CSC) hypothesis offers attractive explanations for
generation of heterogeneity within tumors, metastatic dissemination, and
resistance to therapy. The underlying logic is modeled on normal developmental
hierarchies that are delineated for a number of adult tissues. Undifferentiated
stem cells give rise to less potent progenitors, which produce the most
specialized cells of a given tissue. Analogously, only CSCs are thought capable
of self-renewal, of initiating tumors at primary and distant locations, and of giving
rise to more differentiated daughters that are incapable of reestablishing the
tumor. Normal stem cell activity is maintained in niches; therefore, employing the
same logic used for developmental hierarchies, niches that maintain CSCs,
should also exist (reviewed in refs. 51-53). Niches are specialized
microenvironments, wherein stem cells reside (reviewed in refs. 54, 55), which
exert control over cell function. It was shown that progenitors both in skin and
skeletal muscle could adopt residency in vacated stem cell niches, where they
reacquired stem cell traits56-58. Impressively, testis and neural stem cells from
male mice were shown to give rise to lactating mammary glands when
transplanted into the mammary fat pad59, 60. And in true reductionist models that
used defined microenvironments, embryonic and adult stem and progenitor cell
fate decisions were shown to be quantifiably flexible in response to combinatorial
microenvironments61-64. The ability of the niche to determine the functional
spectrum of stem cell activities led us to hypothesize that stem cell niche
microenvironments beget stem cell functions65. Due to their role in maintaining

! 9!
stem cell activity, disrupting CSC-niche interactions may be crucial for
overcoming barriers to therapeutic resistance66. Thus, understanding the
interactions between tumor microenvironments and cancer cells is important for
the identification of drug controllable mechanisms (e.g. proliferation,
differentiation, and quiescence, etc.) regulated by tumor microenvironment and
for improving drug efficacy in humans.
1.6. Deconstructing tumor microenvironments into experimentally
tractable combinations.
Tissues are collections of cells and ECM organized into unique spatial
configurations that collectively carry out specialized functions. Remarkably,
tissues with an intact architecture can maintain many basic functions in spite of
the presence of gene mutations that cause dysfunctions when introduced into
cells on tissue culture plastic67. Studies showing that wound-healing
microenvironments unleash malignant potential demonstrated the principle that
tissue architecture explains the resilience of normal function in the face of
mutations and other external perturbations68. Organized asymmetry is therefore
an important basic feature of tissues; there must be distinctive topologies on
which receptors assemble in order to correctly integrate the signaling patterns
associated with tissue-specific functions. Tumor microenvironments should also
possess combinatorial signaling asymmetries, though the microenvironments
may be less obviously organized. One hypothesis is that the normal and tumor
microenvironments integrate the signaling apparatuses differently, and thus
therapeutic targets could be identified to selectively harm the tumor cells, and
! 10!
microenvironment composition will be a determinant of drug efficacy. Those
potential differences in signal integration can be revealed by technologies that
recapitulate in vivo microenvironments, using defined physical, geometric, and
molecular elements, and allowing one to assess the contribution of each property
to emergent properties of tissues.
The complexity of microenvironments is a major impediment to understanding
their impacts on cells. A majority of our understanding of biological mechanisms
in human cells has been built upon the studies on two-dimensional plastic plates
or dishes. Since the first human cell line, HeLa, was established on cell culture
dishes, 2D cell culture has been a mainstay of biological research. However, as
the dominant nature of the microenvironment over physiological processes has
become increasingly appreciated, engineered 2D and 3D culture platforms that
better recapitulate the molecular and physical nuances of the microenvironment
in vivo are being developed.
It is an oversimplification to distinguish 2D and 3D culture platforms by
dimensionality, the details of the culture microenvironments need to be
considered and delineated with care to understand how each property effects cell
physiology. Although 2D tissue culture plastic has been used extensively for
biological research, they are far from physiological representations of tissues. In
addition to the synthetic polymer composition of the plastic, cells in conventional
2D culture systems adhere to surfaces that are non-physiologically rigid (>2
GigaPascals Young’s Elastic Modulus (GPa)) as opposed to the rigidity of normal
tissue (Hundreds of Pa in soft tissues to tens of thousands of Pa for stiffer tissues
! 11!
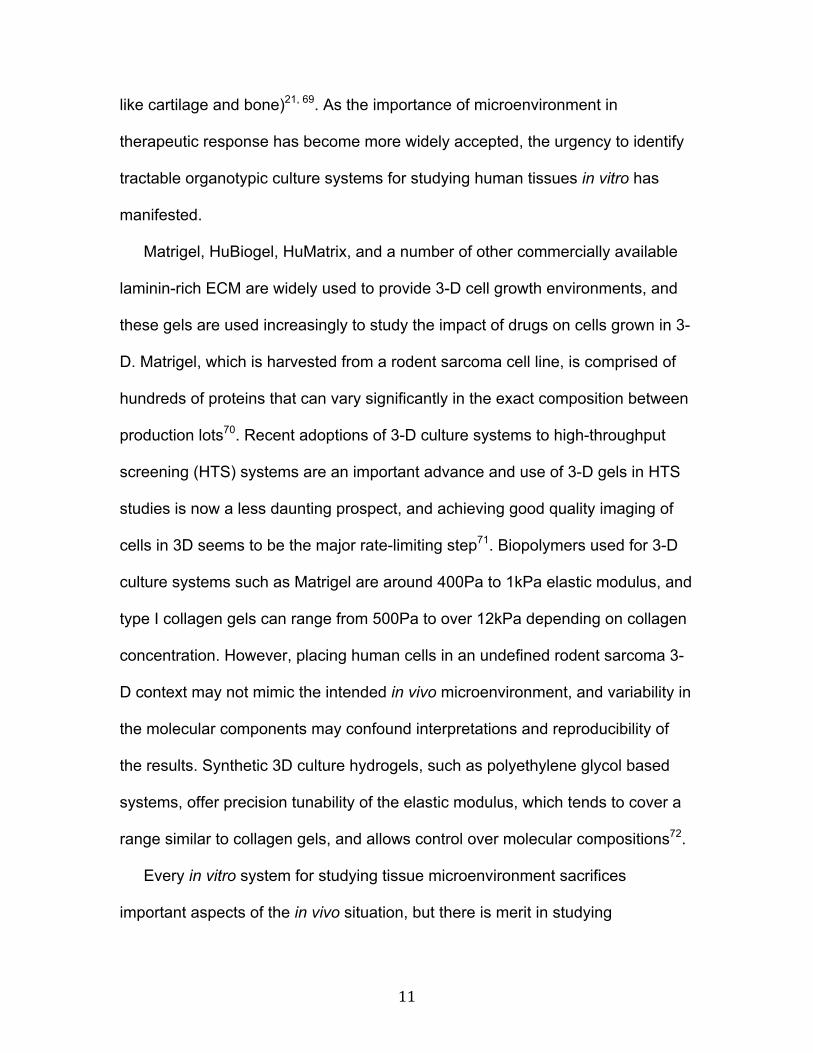
like cartilage and bone)21, 69. As the importance of microenvironment in
therapeutic response has become more widely accepted, the urgency to identify
tractable organotypic culture systems for studying human tissues in vitro has
manifested.
Matrigel, HuBiogel, HuMatrix, and a number of other commercially available
laminin-rich ECM are widely used to provide 3-D cell growth environments, and
these gels are used increasingly to study the impact of drugs on cells grown in 3-
D. Matrigel, which is harvested from a rodent sarcoma cell line, is comprised of
hundreds of proteins that can vary significantly in the exact composition between
production lots70. Recent adoptions of 3-D culture systems to high-throughput
screening (HTS) systems are an important advance and use of 3-D gels in HTS
studies is now a less daunting prospect, and achieving good quality imaging of
cells in 3D seems to be the major rate-limiting step71. Biopolymers used for 3-D
culture systems such as Matrigel are around 400Pa to 1kPa elastic modulus, and
type I collagen gels can range from 500Pa to over 12kPa depending on collagen
concentration. However, placing human cells in an undefined rodent sarcoma 3-
D context may not mimic the intended in vivo microenvironment, and variability in
the molecular components may confound interpretations and reproducibility of
the results. Synthetic 3D culture hydrogels, such as polyethylene glycol based
systems, offer precision tunability of the elastic modulus, which tends to cover a
range similar to collagen gels, and allows control over molecular compositions72.
Every in vitro system for studying tissue microenvironment sacrifices
important aspects of the in vivo situation, but there is merit in studying
! 12!
microenvironmental properties in isolation. Although engineered and biopolymer-
derived systems necessarily over simplify tumor microenvironments, they can
reveal important mechanistic elements of cellular responses by winnowing down
the possible candidate pathways involved in a given functional response. The
microenvironment can be dissected into biophysical (e.g. rigidity, shear force),
biochemical (e.g. ECM, growth factors, cytokines), and architecture (e.g.
dimension and geometry.), and each property plays a role in regulating cellular
functions. For instance, by isolating and normal mammary epithelial cells in the
context of matrix rigidity, in isolation from many other microenvironment
properties, we discovered age-dependent regulation of the mechanotransducing
YAP/TAZ transcription factors73. That we focused on mechanobiology from the
outset made it possible to test hypotheses that revolved around pathways known
to be involved in mechanobiology, and it revealed important information about
age-related functional changes that also happen in vivo. Similarly, by using
engineered polymer surfaces, we showed that substrate rigidity is a determinant
HER2-targeted therapeutic efficacy via YAP/TAZ signaling pathway, both in vitro
and in vivo39. While the microenvironments are deconstructed and different
properties are studied individually or in defined combinations, the knowledge that
we accrue over time allow us to form a portrait that models, and possibly explains,
microenvironment affects on cellular functions.
1.7. Combinatorial microenvironment platforms mimic diverse and
defined microenvironments and meet higher throughput ability.
Established human cell lines and primary cells propagated in 2D culture are

! 13!
amenable to high-throughput experimentation. Potentially powerful tools for
performing drug design in microenvironmental contexts are being developed by
merging together the flexibility of functional cell-based screening with the highly
parallel nature of microarray-type experiments. A microarray is a device that
contains thousands of functionalized probes immobilized on a substrate.
Microarray-type tools provide both complexity and high throughput ability, and
are used to explore diversity in various biological systems. Broadly speaking the
technology can be classified into protein arrays, gene chips, or carbohydrate
microarrays, depending upon what probes are immobilized on the substrate74. An
interesting innovation in this technology space has been to fabricate microarrays
on 2D and 3D substrata, printing proteins that support adhesion of cultured cells.
These types of combinatorial microenvironment microarrays (MEArrays) facilitate
highly parallel cell-based functional screening. Indeed, Using different ECM and
growth factor, pathway-blocking or –activating antibodies in various combinations
as printed probes, enables molecular dissection of more complicated 3D
microenvironments (Figure 22; reviewed in refs. 61-64, 72, 75.)
1.8. Summary.
In order to understand how microenvironment can modulate drug responses, we
(LaBarge laboratory) has developed an MEArray platform in which combinatorial
microenvironments can be controlled, and microenvironmental impact to cellular
functions can be measured. My first work was to test the hypothesis that matrix
rigidity is one of the determinants for lapatinib responses. Then I adapted and
developed the MEArray with PA gels incorporated. Finally, I applied the MEArray

! 14!
platform and demonstrated that MEArray is a feasible tool for testing our
hypothesis that microenvironment is important to modulate therapeutic
responses and needs to be considered in therapeutic designs.

! 15!
Chapter 2: Materials and methods
2.1. Cell culture and drug treatment.
HCC1569 (American Type Culture Collection; Manassas, VA, USA) and BT549
breast cancer cell lines (gift from Dr. Joe W. Gray; Oregon Health & Science
University, Portland, OR, USA) were maintained in RPMI1640 (invitrogen,
Carlsbad, CA, USA) with 10% fetal bovine serum (FBS; Gemini Bio-Products,
West Sacramento, CA, USA), and 1% Penicillin/Streptomycin/Glutamine
(invitrogen, Carlsbad, CA, USA). Human mammary progenitor-derived cell line,
D920 cells, at passage 63 were cultured in H14 medium on Vitrogen-coated
(Cohesion) flasks for no more than 8 additional passages before starting from a
fresh vial62. For drug treatment in 2D cultures, cells were cultured in 24-well
plates with RPMI1640 with 1% FBS and 1% Penicillin/Streptomycin/Glutamine
for 48 h after initial adhesion, and were then treated with lapatinib (1.5µM, LC
Laboratories, Woburn, MA, USA) for an additional 48 h. For drug treatment in 3D
cultures, cells were cultured in 24-well plates coated with Matrigel (BD
Biosciences, San Jose, CA, USA) following the so called ‘on top’ protocol
adapted from Lee, GY et al.76, using a 5% Matrigel drip (cells were cultured on
top on the drip of the Matrigel), then drugs or control were added on day 4 after
cell plating for an additional 48 h. Other pharmaceutical and recombinant protein
modulators were added concurrently with lapatinib: i.e. Verteporfin (VP, Sigma-
Aldrich, St. Louis, MO, USA), was added at 0.2, 2, and 10 µg/mL; recombinant
human amphiregulin (AREG, Sigma-Aldrich, St. Louis, MO, USA) at 5 ng/mL;
! 16!
erlotinib at 1.5 µM; Blebbistatin (Bleb, Sigma-Aldrich, St. Louis, MO, USA) at 10
µM; and y27632 (Sigma-Aldrich, St. Louis, MO, USA) at 10 µM.
2.2. Tunable elastic modulus cell culture substrate fabrication.
Polyacryamide (PA) gels were polymerized on 12mm diameter coverslips etched
with 0.1M NaOH, adapted from Tse, JR et al.77. 3% of acrylamide and 0.06% of
bis-acrylamide were used to generate 400 (Elastic(Pascal) PA gels; 4% of
acrylamide and 0.15% of bis-acrylamide were used to generate 2500 Pa PA gels.
Sulfo-SANPAH (sulfosuccinimidyl 6-(4'-azido-2'-
nitrophenylamino)hexanoate)(0.5 mM, ProteoChem, Loves Park, IL, USA)
was added on PA gels and activated by UV light exposure for 10 min. PA gels
were washed with HEPES buffer and then incubated with type 1 collagen (calf
skin, Sigma-Aldrich, St. Louis, MO, USA) at RT for 2 h (0.1mg/mL in 50mM
HEPES, Sigma-Aldrich, St. Louis, MO, USA). Gels were rinsed with copious
amounts of PBS prior to placing them in 24-well plates treated with polyHEMA
(0.133mL at 12mg/mL in 95% EtOH, Sigma-Aldrich, St. Louis, MO, USA) for cell
culture.
2.3. Proliferation assay
5-ethynyl-2’-deoxyuridine (EdU) incorporation and staining were performed
according to the manufacturer’s protocol (invitrogen, Carlsbad, CA, USA). Nuclei
were stained with Hoechst 33342. Images were captured with Zeiss 710 LSM
(Carl Zeiss) confocal microscope, and images were segmented, and analyzed

! 17!
with Image J (NIH) and CellProfiler, an open source image analysis software78.
Drug response values are expressed as a relative incorporation of EdU,
expressed as a percentage of EdU incorporation relative to control cells in DMSO
only.
2.4. Transfection.
Cells were transfected with YAP, WWTR1 (TAZ), AREG, or non-silencing control
siRNA (NSC) (SMARTpool: ON-TARGET plus, GE Dharmacon, Lafayette, CO,
USA) with a FITC label (siGLO Green Transfection Indicator, GE Dharmacon,
Lafayette, CO, USA), using DharmaFECT 2 Transfection Reagent (GE
Dharmacon, Lafayette, CO, USA) according to the manufacturer’s protocol, 72 h
prior to assay performance.
2.5. Immunofluorescence staining.
Cells were fixed in 4% PFA (paraformaldehyde) at RT (room temperature) for 10
min; and for MEArray, cells were fixed in Methanol/Acetone (1:1) at -20 °C for 20
min. Cells were then blocked with PBS, 5% normal goat serum, and 0.1% Triton
X-100 at RT for 30 min, then incubated with primary antibodies over night at 4°C.
The primary antibodies I used were anti-YAP (1:100, Santa Cruz, Dallas, TX,
USA), anti-TAZ (1:200, Cell Signaling Technology, Beverly, MA, USA), anti-
HER2-alexa647 (1:100, Biolegend, San Diego, CA, USA), or anti-pHER2-
1221/1222 (1:100, Cell Signaling Technology, Beverly, MA, USA). Primary
antibodies were visualized with fluorescent secondary antibodies raised in goats
(1:500, invitrogen, Carlsbad, CA, USA) together with Hoechst 33342 (1:200,

! 18!
Sigma-Aldrich, St. Louis, MO, USA) incubated at RT for 2 h. Images were
captured with a Zeiss 710 LSM confocal microscope (Carl Zeiss). Cell
segmentation and single cell fluorescence intensities were analyzed with Matlab
script adapted from73 or CellProfiler78. For quantification of YAP/TAZ localization,
the (N/C) ratios of mean fluorescence intensity in the (C)ytoplasmic and
(N)uclear compartments of segmented cells were used. The cutoffs of log2 ratios
were used to establish the three classes: C > N ( X < -0.074), N = C (-0.074 < X
< 0.074), and N > C (X > 0.074).
2.6. Real-Time PCR.
Total RNA was extracted with Trizol (invitrogen, Carlsbad, CA, USA) and purified
by RNeasy prep (Qiagen, Valencia, CA, USA). cDNA was synthesized with
SuperScript III RT (invitrogen, Carlsbad, CA, USA). Transcripts levels were
measured by quantitative real-time PCR (qRT-PCR) with iTaq SYBR Green
Supermix (BioRad Laboratories, Hercules, CA, USA) and Light Cycler480
(Roche, Indianapolis, IN, USA). Primers sequences were: YAP 5’-
AGCCAGTTGCAGTTTTCAGG-3’ and 5’-AGCAGCAATGGACAAGGAAG-3’;
TAZ(WWTR1) 5’-GGAGAAAACGCAGGACAAAC-3’ and 5’-
TCATTGAAGAGGGGGATCAG-3’; AREG 5’-GTGGTGCTGTCGCTCTTGATA-3’
and 5’-ACTCACAGGGGAAATCTCACT-3’; GAPDH 5’-
AAGGTGAAGGTCGGAGTCAAC-3’ and 5’-GGGGTCATTGATGGCAACAATA-3’.

! 19!
2.7. Flow Cytometry.
Cells were collected via EDTA-PBS (0.4%EDTA) treatment without trypsin on ice.
After washing with PBS, cells were blocked with PBS containing 2% bovine
serum albumin, 5% normal goat serum, and 5mM EDTA, on ice for 30 min. Cells
were incubated with the primary antibody anti-AREG (1:100, R&D Systems,
Minneapolis, MN, USA) on ice for 30 min, washed with PBS, then treated with
the secondary antibody on ice for 15 min. After 2 PBS washs, the level of AREG
bound on cell membrane was measured with a FACSCalibur (Bekton-Dickenson).
2.8. AREG ELISA.
The intracellular AREG protein level was measured according to the
manufacturer’s protocol (Abcam, Cambridge, MA, USA), after 72 h in HCC1569
cells cultured on 2D TCP and 400 Pa PA gel with YAP knockdown by siRNA.
2.9. Animal experiment.
Six-week old female nu-/- mice were obtained from Taconic (Germantown, NY,
USA) and housed five per cage with chow and water ad libitum in a controlled
animal barrier. After 1 week, animals were injected s.c. into the upper flank with
3.5 to 5 million shRNA YAP HCC1569 cells. On Day 13 after tumor injection,
when the average tumor volume was 150-200mm3, IPTG and lapatinib treatment
were administered for 2 weeks. IPTG (Sigma-Aldrich, St. Louis, MO, USA) was
mixed into the drinking water at 10mM/1% glucose in light-protected bottles and
changed every 2-3 days. Lapatinib was administered at 75 mg/kg/day body
weight divided into twice daily dosing by oral gavage. Tumor dimensions (width,

! 20!
height, and depth) were measured biweekly. At the time of sacrifice, animals
were euthanized, and tumors were harvested and either immediately snap frozen
or fixed in formalin. Animals were monitored for toxicity by measuring weight,
assessing overall activity, and performing necropsy. All experimental procedures
were followed according to the UCSF Animal Welfare Committee’s approved
policies and guidelines.
2.10. Human Phospho-Receptor Tyrosine Kinase (RTK) Array.
HCC1569 were cultured on 400 Pa and 40 kPa PA gel for 48 h, treated with
lapatinib (1.5 µM) or DMSO, and then harvested at 1 h or 48 h after lapatinib
treatment. The phosphorylations of 49 different RTKs were measured according
to the manufacturer’s protocol (Cat # ARY001B, Lot # 1323072, R&D Systems,
Minneapolis, MN, USA).
2.11. Microenvironment microarray (MEArray).
The details of the MEArray preparation are described in our previous work64. The
protocol includes the printing substrata preparation, protein master plate
preparation, MEArray printing, and culturing cells on MEArray.
2.11.1. Printing substrate preparation.
For etching the slides, the slides were placed on heat block at 80°C, 1 mL NaOH
was added on each slide, and allowed to evaporate completely. For providing
cross-linkages between slides and PA gels, 250 µL of 3-
Aminopropyltriethoxysilane (APES) was added on each slide for 5 min in the
fume hood, slides were washed with H2O thoroughly, and then slides were

! 21!
placed in a 15 mL dish containing 25 mL of 0.5 % Glutaraldehyde in PBS for 30
min for activating the APES. 2500 Pa and 40 kPa polyacrylamide (PA) gels were
prepared according to the recipe of the protocol and 350 µL of PA gel solution
was applied on each slide. Let the gels polymerized for 90 min, wash the gel
slides in H2O at 4°C overnight, and then the gel slides were ready to be used for
printing MEArray.
2.11.2. Protein master plate preparation.
Master plate for MEArray was prepared according to the protocol as Lin et al.64.
Fibronectin (Sigma-Aldrich, St. Louis, MO, USA), type I collagen (Sigma-Aldrich,
St. Louis, MO, USA), type IV collagen (EMD Millipore, Hayward, CA, USA), and
laminin 1 (Sigma-Aldrich, St.Louis, MO, USA) were used as major ECM for
supporting cell adhesion. Epidermal growth factor (EGF, Sigma-Aldrich, St. Louis,
MO, USA), growth arrest-specific 6 (Gas6, R&D Systems, Minneapolis, MN,
USA), interleukin 6 (IL6, Biolegend, San Diego, CA, USA), interleukin 8 (IL8,
Biolegend, San Diego, CA, USA), amphiregulin (AREG, R&D Systems,
Minneapolis, MN, USA), hepatocyte growth factor (HGF, R&D Systems,
Minneapolis, MN, USA), and transforming growth factor beta (TGFB1, Biolegend,
San Diego, CA, USA) were used combined with major ECM. Combinatorial
microenvironments were prepared in 384-well plates in printing buffer (100 mM
acetic acid, 20 % glycerol, 0.05 % Triton-X-100, pH3.8).
2.11.3. MEArray printing.
The quill pin printer, SpotBot III (Arrayit Corporation, Sunnyvale, CA, USA), was
used for printing MEArray. In order to reach statistical power, 30 replicated spots

! 22!
were printed for each combinatorial microenvironment on each slide. In total
1920 features were printed on each gel slide and spaced 350 µM apart.
2.11.4. Culturing cells on MEArray.
Gel slides with printed combinatorial microenvironments were placed in 4-well
plates with PBS containing 1 % Penicillin/Streptomycin/Glutamine and 0.1 %
Fungizone (Thermo Fisher, Waltham, MA, USA) for sterilization for 1 hr. The
PBS was then replaced with complete medium, RPMI1640 supplemented with 10
% FBS and 1 % Penicillin/Streptomycin/Glutamine. For improving adhesion, the
cells were added at a final concentration of 5 x 10⁵ per well, 106 cells mL-1, for 10
min, and then 4 mL complete medium was added for further adhesion for 2 hr.
The unbound cells were then washed away with PBS.
2.11.5. Data analysis.
Images were thresholded, segmented, analyzed by CellProfiler78. The analysis of
the fluorescence information and cellular morphological parameters were
conducted in R79. The fluorescence intensity (488 nm) was determined for
quantification of EdU incorporation ratio, and fluorescence intensities of pHER2
(568 nm) and HER2 (647 nm) were determined for assessing pHER2 and HER2
protein level. PCA and ViSNE analysis were performed for pattern clustering and
dimension reduction80, 81. GLM analysis and the post-hoc analysis was performed
in R package phia82 to test the significance of lapatinib responses among various
combinatorial microenvironments72.

! 23!
2.11.6. Validations of candidates.
The microenvironments that showed significant impact to lapatinib responses
were validated on PA gel coverslips as previous described in materials and
methods 2.2.
2.12. Statistics.
Significance was considered p < 0.05 or better using T-tests and Pearsons
correlations. Those tests and area under the curve calculations were performed
with Prism (Graphpad). * p < 0.05, ** p < 0.01, *** p < 0.001.

! 24!
Chapter 3: Results
3.1. Microenvironment rigidity modulates responses to the HER2
receptor tyrosine kinase inhibitor lapatinib via YAP and TAZ
transcription factors.
3.1.1. Rationale.
Microenvironment rigidity can promote tumor progression and survival through
activation of growth factor signaling pathways, by enhancing integrin clustering
and focal adhesion assembly24, 25, or through modulation of microRNA
expression26. For instance, the distinct drug responses have been observed
between different culture microenvironment, 2D vs. 3D23. One of the obvious
differences between 2D and 3D is the matrix rigidity, where the stiffness of plastic
(2D) is more than 2 GPa and Matrigel (3D) is 400 Pa. Thus, I hypothesized that
matrix rigidity is one of the major factor altering drug responses.
3.1.2. Summary.
I examined whether matrix rigidity impacted lapatinib responses in HER2-
amplified breast cancer cells, using polyacrylamide (PA) hydrogel-based culture
substrata that enabled control over the Young’s elastic modulus (E[Pa]). The
Hippo pathway mechanotransducers TAZ and YAP83, which are also oncogenes
84, were required for the modulus-dependent responses in vitro, and
downregulation of YAP in vivo slowed HER2-amplified tumor growth and
improved sensitivity to lapatinib. YAP and TAZ did not mediate resistance by
redundant activation of other HER family receptors. Our results suggest that rigid

! 25!
microenvironments can modulate lapatinib resistance in HER2-amplified breast
cancer cells via a YAP/TAZ-dependent mechanism.
3.1.3. Substrate elastic modulus is a modifier of lapatinib responses
in HER2-amplified breast cancer cells.
To facilitate further investigation of microenvironment-directed drug responses,
we identified a breast cancer cell line and pathway-targeted drug combination
that offered a potentially wide dynamic range of response. Previous work
demonstrated that the use of 2-D TCP versus 3-D Matrigel culture
microenvironments modulated the anti-proliferative responses of four different
HER2-targeted therapeutics that were used to treat four different HER2-amplified
breast cancer cell lines. The combination of HCC1569 cells, a basal A subtype
cell line85, and lapatinib demonstrated the optimal differential response between
TCP and 3-D23. First, our analysis methodology was validated by showing that
HER2-amplified HCC1569 breast cancer cells conformed to previous findings, i.e.
that they are more sensitive to the anti-proliferative effect of lapatinib in 3-D
Matrigel compared to cells on 2-D TCP23. After plating on type 1 collagen-coated
2-D TCP or in 5% “ontop” 3-D Matrigel, cells were treated with DMSO or 1.5 µM
lapatinib, a dose that was comparable to the average concentration in patient
blood serum86. The magnitude of the anti-proliferative effect of lapatinib was
determined by measuring 5-ethynyl-2’-deoxyuridine (EdU) incorporation into
nuclear DNA, as a proxy for cell proliferation. Cells in 3-D were more sensitive to
lapatinib compared to on TCP, with 21±2.6% and 69±9.7% EdU incorporation,
respectively (Figure 1, A and B). Proliferation of the HER2-negative cell line

! 26!
BT549 was not affected by lapatinib treatment (Figure 1, A and B). The
differential anti-proliferative response between TCP and 3-D is partly explained
by the distinct molecular compositions of the two culture microenvironments;
indeed, it is already known that the increased sensitivity in 3-D is due partly to b1
integrin-mediated ECM adhesion23. However, there are other potential
microenvironment characteristics that bear scrutiny in this drug response context.
One of the major differences between TCP and 3-D Matrigel is the rigidity
of the culture substrata. Thus, the hypothesis that rigidity is a modulator of
responses to lapatinib, in the HER2-amplified breast cancer cells was examined.
The Young’s elastic modulus (E[Pa]scals) of Matrigel has been estimated at 400
Pa87, on a par with normal breast tissue21. In contrast, the elastic modulus of
TCP is in excess of 2 GigaPa (GPa)69, 88, which is well outside the physiological
range89. To examine the role played by matrix rigidity in lapatinib responses, cell
culture substrata were fabricated from PA gels, tuned to 400±160 Pa and coated
with a type 1 collagen to support cell adhesion. HCC1569 were more sensitive to
lapatinib on 400Pa PA gels compared to those on TCP coated with type 1
collagen, with 50±4.5% and 69±4.5% EdU incorporation, respectively (Figure 1,
C and D); BT549 were not affected either by lapatinib or changes in rigidity
(Figure 1, C and D). The half-maximal inhibitory concentration (IC50) of lapatinib
was 3-fold lower on 400 Pa PA gels compared to TCP, 0.9 µM and 2.7 µM,
respectively (Figure 1E). Thus, HCC1569 responded to lapatinib in an elastic
modulus-dependent manner, showing greater resistance to the anti-proliferative
effect of lapatinib on rigid matrices.

! 27!
3.1.4. Actinomyosin network is involved in modulus-dependent
lapatinib responses.
Cells sense the mechanical cues of microenvironment via mechanosensing-
related pathways, such as Rho/ROCK signaling pathway, stretch activated
channel, and force-induced protein unfolding90. To test the hypothesis that
mechanosensing pathway plays a role in modulus-dependent lapatinib
responses, I perturbed Rho/ROCK signaling pathway with inhibitors against
different downstream factors in HCC1569 cells grown on 400 Pa gels, Matrigel,
or TC dishes in the presence of lapatinib. Inhibitors of myosin II (Blebbistatin),
and ROCK1/2 (Y27632) were used individually and together with lapatinib. These
inhibitors eliminated modulus-dependent lapatinib resistance between TC dishes
and 400 Pa gels (Figure 2, A and B). However, the inhibitors showed no
significant effect between TC dishes and Matrigel, with lapatinib treatment
(Figure 2, C and D). These results suggested that mechanosensing pathway,
Rho/ROCK signaling pathway was involved in modulus-dependent lapatinib
responses, but other molecular compositions in Matrigel also contributed to
lapatinib responses. To identify the molecular compositions in Matrigel that
modulate lapatinib responses, more studies, tools, such as MEArray, and proper
statistical analysis are needed.
3.1.5. YAP and TAZ are required for the modulus-dependent
lapatinib responses.
YAP and TAZ are Hippo pathway transcriptional co-activators that interact with
the Rho/Rock pathway83, and play an important role in transducing information
! 28!
about substrate rigidity from the plasma membrane into the nucleus, where a
transcriptional response is generated35. Consistent with their role in
mechanotransduction, YAP and TAZ relocated from the cytoplasm into the
nucleus as substrata stiffness increased (Figure 3, A and B). The effect of YAP
and TAZ knockdown by siRNA on modulus-dependent responses to lapatinib
was accessed. Both YAP and TAZ knockdown (Figure 6A) eliminated the
modulus-dependent lapatinib resistance on TCP (Figure 3C). Disruption of the
TEAD-YAP interaction with the 2 µg/mL of the inhibitor verteporfin91 phenocopied
the effect of YAP knockdown (Figure 3D). Indeed, increasing concentrations of
verteporfin diminished the effect of modulus-dependent lapatinib resistance in a
synergistic manner with lapatinib (Figure 7). YAP and TAZ were thus shown to
be necessary for generating the modulus-dependent lapatinib resistance.
3.1.6. YAP knockdown in vivo increased sensitivity to lapatinib
treatment.
To test whether YAP similarly played a role in lapatinib responses in vivo, we
used Isopropyl β-D-1-thiogalactopyranoside (IPTG)-induced shRNA to knock
down YAP in HCC1569 cells that were implanted in mice. Tumor volume was
measured during the course of lapatinib treatment (Figure 4). Mice that neither
received IPTG nor lapatinib (group A) had the maximum tumor volume (mean of
volume, 1280 mm3) by day 23. Mice treated with IPTG (group B) had significantly
decreased (p < 0.05) tumor volume (mean of volume, 770 mm3) compared to
group A. Both lapatinib treatment groups, either with (group D) or without IPTG
treatment (group C), had much smaller tumor volumes compared to groups A

! 29!
and B. Group D, which received lapatinib and had reduced YAP levels, had the
smallest tumor volumes (mean of volume, 192 mm3), even compared to group C
(mean of volume, 269 mm3); however, that difference was not statistically
significant. These data demonstrate that YAP knockdown was sufficient to
reduce growth of HER2-amplified cell lines in vivo, and they suggest that YAP
knockdown and lapatinib together may have some synergistic benefit. More
comprehensive animal studies are required, however, to clarify the independent
versus synergistic effects.
3.1.7. Modulus-dependent lapatinib responses are driven by multiple
factors.
We sought to delineate other components of the molecular circuitry that enabled
YAP to mediate the modulus-dependent response to lapatinib. Analysis of breast
cancer data from The Cancer Genome Atlas data3 showed that YAP mRNA
expression correlated positively with expression of two known YAP targets CTGF,
as well as with AREG92, which is an EGFR ligand that has been attributed with
multiple roles related to tumor invasion and drug resistance93, 94(Figure 8). HER2
(encoded by ERBB2 gene) mRNA expression positively correlated with
amphiregulin (AREG), inversely correlated with EGFR and ERBB3 mRNA levels.
Taken together, higher AREG expression correlated with YAP and HER2
expression in breast cancers.
AREG, which has been shown to mediate EGFR-HER3 heterodimer
formation and activate the ERK-Akt signaling pathway95, and HER3-mediated
PI3K/Akt activity was correlated with lapatinib resistance in HER2-amplified

! 30!
breast cancer cells96 was further examined. Paracrine AREG signaling in
colorectal cancer cells also was shown to sustain ERK signaling and confer
resistance to EGFR inhibitors97.
AREG mRNA levels in HCC1569 cells showed a modestly increasing
trend as the culture substrate rigidity was increased (Figure 5A), but cell
membrane surface AREG protein level increased only about 4% (Figure 5B). To
mimic the presence of a paracrine source of AREG, exogenous recombinant
AREG (5 ng/mL) was added to cells, which caused increased nuclear YAP
localization, even on compliant 400Pa surfaces (Figure 5C), and on compliant
surfaces conferred lapatinib resistance to cells (Figure 5D). Simultaneous
addition of exogenous AREG and the EGFR receptor inhibitor, erlotinib, reduced
the resistance phenotype, demonstrating that exogenous AREG was exerting its
effect partly through EGFR (Figure 5D). Knockdown of AREG by siRNA (siAREG)
did not affect other ligands of EGFR, such as EGF or TGF-α, nor did it affect the
receptors EGFR or HER2 (Figure 6B). YAP knockdown with siRNA decreased
AREG expression 25%, suggesting that YAP modulates AREG (Figure 5E).
These data together suggest that AREG is putatively involved in the modulus-
dependent lapatinib responses. However, direct targeting of AREG via siAREG
showed no significant effect on modulus-dependent lapatinib responses (Figure
5F). Because AREG was reported to cause activation of HER395, we examined
modulus-dependent changes in HER3 phosphorylation, as well as from 49 other
receptor tyrosine kinases, at 1 h and 48 h after attachment, Without lapatinib
treatment, HER2 showed a higher phosphorylation on compliant substrata (400

! 31!
Pa) within the first hour and increased phosphorylation after 48 h. However,
consistent with the notion that AREG was not playing a significant role in
modulus-dependent responses, HER3 was unchanged within the first hour and
was decreased by 48 h (Figure 9). With lapatinib treatment, both HER2 and
HER3 showed a decreased phosphorylation within 1 h, and then HER3 showed a
subtle increased phosphorylation by 48 h on stiffer substrata (40 kPa). Taken all
together, modulus-dependent lapatinib resistance cannot be explained from a
single YAP-AREG circuit.
3.2. Fabrication and Use of MicroEnvironment microArrays (MEArrays).
3.2.1. Rationale.
Matrix rigidity, molecular composition, and architecture of microenvironment can
contribute to modulate cellular functions individually, and the impact of
interactions among these individual elements to cellular functions complicated
the understanding of underlying mechanisms. A tool to deconstruct and control
these microenvironmental properties is needed to access and quantify the
functional studies and cellular phenotype as a function of defined
microenvironment.
3.2.2. Summary.
We developed the microenvironment microarray (MEArray) platform for cell-
based functional screening of interactions with combinatorial
microenvironments98. The simultaneous manipulation of both the molecular
composition and the matrix rigidity, combined with widely available microarray

! 32!
and basic micropatterning technologies, allowed us to probe the impact of
defined microenvironment to the cellular functions. MEArray screens require as
few as 10,000 cells per array, which facilitates functional studies of rare cell types
such as adult progenitor cells.
3.2.3. A flow chart of the MEArray procedure.
MEArrays can be printed using a wide variety of recombinant growth factors,
cytokines, and purified ECM proteins, and combinations thereof. The platform is
limited only by the availability of specific reagents. MEArrays are amenable to
time-lapsed analysis, but most often are used for end point analyses of cellular
functions that are measureable with fluorescent probes. For instance, DNA
synthesis, apoptosis, acquisition of differentiated states, or production of specific
gene products are commonly measured. Briefly, the basic flow of an MEArray
experiment is to prepare slides coated with printing substrata and to prepare the
master plate of proteins that are to be printed. Then the arrays are printed with a
microarray robot, cells are allowed to attach, grow in culture, and then are
chemically fixed upon reaching the experimental endpoint. Fluorescent or
colorimetric assays, imaged with traditional microscopes or microarray scanners,
are used to reveal relevant molecular and cellular phenotypes (Figure 10).
3.2.4. Verification of representative results.
An example of patterned protein deposition on a printed PDMS-coasted MEArray
using a square-tipped silicon pins on a quill pin microarray-printing robot is
shown in (Figure 11). Deposition of various proteins that are printed can be
verified by immunofluorescence using antibodies (Figure 12). Dilutions of the

! 33!
protein solutions in the master plate are reflective of the amount (fluorescent
intensity) that is deposited on the printing substrata surface (Figure 12). Cells
should attach to the printed features in an obvious patterned manner (Figure 13).
An example of an MEArray experiment showing that inverse dilutions of two
microenvironment proteins elicited specific keratin expression profiles in a protein
concentration-dependent manner in a human multipotent mammary epithelial
progenitor cell line (D920 cells), is shown in (Figure 14). Bubble plots are useful
for determining whether specific phenotypes are imposed upon cells on replicate
features of a dilution series. For instance, if a particular molecule in a
microenvironment causes a distinct phenotype, once the instructive component
has been diluted enough into a background of a neutral ECM the phenotype
should change or disappear. Immunofluorescence detection of keratin 8 and
keratin 14 intermediate filament proteins was performed with an Axon 4200a
(Molecular Devices) microarray scanner. Twelve replicate dilution series were
printed on each MEArray, and the log2 ratio of keratin 8 to keratin 14 mean
fluorescence intensity was graphed as a bubble plot to give a realistic idea of
variation and reproducibility of the signal. Shown is data from an MEArray that
was fixed after cells had attached and unbound cells were washed away (Figure
14A), and after 24 hr of culture (Figure 14B). For this relatively small analysis, a
one-way ANOVA was used to determine variance from the mean signal at each
time point, and grouped two-tailed T-tests were used to determine whether the
different dilutions of type I collagen and recombinant human P-cadherin caused
changes in keratin expression. There was no variation from the mean among

! 34!
cells on the features just after attachment; however, there were significant
differences in keratin expression among cells after 24 hr of exposure to the
different microenvironments. T-tests verified that high type I collagen
concentrations elicited higher keratin 8 expression, whereas high P-cadherin
concentrations elicited a strong keratin 14 signal after 24 hr. This result was
consistent with previous reports that Pcadherin-containing microenvironments
will impose of K14-expressing myoepithelial phenotype on bi-potent mammary
progenitor cells62. An example of an entire scanned MEArray printed on a
40,000Pa PA gel is shown (Figure 15).
3.3. A continuum of therapeutic responses to a single pathway-targeted
compound imposed by combinatorial microenvironments.
3.3.1. Rationale.
My first work showed that matrix rigidity is one of the important factors altering
lapatinib responses. The results of mechanosensing perturbations with lapatinib
suggested that not only matrix rigidity, but also the molecular composition in
Matrigel could modulate lapatinib responses. We developed the MEArray for
simultaneously investigating the impact of matrix rigidity and the molecular
composition of microenvironment to drug responses. I applied the MEArray and
asked the question that how matrix rigidity, molecular composition, and the
interaction between these two microenvironmental properties modulate lapatinib
responses.

! 35!
3.3.2. Summary.
The results suggested that both matrix rigidity and the molecular composition
alter lapatinib responses. Matrix rigidity conferred lapatinib resistance in
HCC1569, which was consistent with our previous report39. The combined
treatment of verteporfin and lapatinib has stronger inhibition to cells grown on
softer substrate. I also identified candidates, such as fibronectin that may
contribute to lapatinib resistance, for further validations and investigations of
mechanisms.
3.3.3. Both molecular compositions and matrix rigidity alter
morphological features.
With the MEArray, we were able to deconstruct and control both biophysical and
biochemical properties of microenvironment to generate defined
microenvironments and acquire multifaceted readouts of functional studies. The
workflow of MEArray showed that even in a proof of concept experiment with low
complexity of combinations of microenvironments, including four different major
ECM compositions, seven recombinant proteins, two matrix rigidities, and three
different drug treatments, it could yield more than two hundred defined
microenvironments. The rich information in the output was single-cell resolution
image data, including morphological features, the fluorescence intensity of
targeted proteins, and functional measurements (Figure 16A). In order to reach
better statistical power, we had 30 replicates for each defined microenvironment
per slide, and 2 technique replicated slides for each MEArray experiment,

! 36!
resulting in a total of 60 replicates for each condition. Each dot on slide was
spaced by 350 µm to avoid direct contact between cells on every dot (Figure
16B). First, I asked whether cellular morphological features as well as cellular
functions could be affected by matrix rigidity or molecular composition. The
images were acquired by an epifluorescence microscope (Nikon), and the
images were analyzed in Cellprofiler99 to extract high-content information of
measured features. To accommodate all information for visualization, cellular
size and eccentricity, median intensity of HER2, and pHER2 staining were used
in ViSNE to transform and project data into a scatter plot81. Each dot in ViSNE
plot represented one defined molecular composition, and different color is either
different matrix rigidity (Figure 16C) or different major ECM (Figure 16D). We
showed that, dots were clustered based on matrix rigidity (Figure 16C) as well as
major ECM component (Figure 16D), suggesting that both biophysical and
biochemical properties of microenvironment impacted cellular features. The PCA
analysis was performed to identify the major variants, and the
microenvironmental components that contributed to alter these variants. Each dot
represented one molecular composition, and colors represented matrix rigidities
(Figure 16E) or different major ECM component (Figure 16F) in PCA analysis.
The PCA analysis showed consistent conclusion with ViSNE that dots were
clustered based on not only different matrix rigidity (Figure 16E) but also the
molecular composition (Figure 16F). Furthermore, two major clusters, which were
fibronectin and type IV collagen; and laminin I and type I collagen, were well
separated either in ViSNE (Figure 16D) or PCA analysis (Figure 16F). In the

! 37!
dimension one of PCA analysis, the major variants that were affected by
microenvironments were number of neighbor cell and size of cell (Figure 17).
Overall, we saw that the microenvironments influenced cellular morphological
features.
3.3.4. Both molecular compositions and matrix rigidity impact
lapatinib responses.
We then wanted to further investigate how microenvironment affected cellular
function, such as lapatinib responses. Our previous report showed that lapatinib
had a synergistic effect with verteporfin, that could eliminate modulus-dependent
lapatinib resistance39. Thus, we studied the drug responses of cells that were
cultured on either 2500 Pa or 40 kPa gels with either lapatinib alone or a
combined treatment of lapatinib and verteporfin. In the ViSNE analysis, each dot
represented one molecular composition, and different colors represented
different drug treatments (Figure 18A), different major ECM components (Figure
18B), or drug sensitivity (Figure 18C). We first saw that cells on 2500 Pa with
combined treatment were the most separated from other conditions (Figure 18A).
Although the different drug treatments influenced clustering in ViSNE (Figure
18A), the clustering was still affected by the major ECM components, suggesting
that major ECM component strongly influenced cellular features (Figure 18B).
Interestingly, even though we did not use lapatinib sensitivity as a clustering
factor in ViSNE, cells on 2500 Pa with combined treatment of lapatinib and
verteporfin that showed the highest sensitivity, were distinctly separated solely
based on morphological features (Figure 18C). After the z-score normalization

! 38!
(normalized mean = 0, and positive and negative value indicates above and
below the mean, respectively), the drug responses were quantified to relatively
sensitive (blue color) or resistant (red color). Cells cultured on 40 kPa were
generally more resistant to lapatinib, which is consistent with our previous
report39. With the clustered heat map of z-score of EdU incorporation ratio
normalized by DMSO control, the cells cultured on 2500 Pa with combined
treatments showed the highest sensitivity (Figure 18D). The results also
suggested that major ECM components influenced the lapatinib responses, e.g.
cells on type IV collagen (red top legend) and on fibronectin (green top legend)
were clustered closed, suggesting that these two ECM played important roles in
altering drug responses (Figure 18D). The sub-group heat map showed that not
only major ECM components, but also the interactions between ECM and other
recombinant proteins, could modulate drug responses (Figure 18E). In
conclusion, MEArray showed that matrix rigidity contributed to lapatinib
resistance, and further showed that molecular compositions also influenced
lapatinib responses.
3.3.5. A systematic analysis for impact of individual
microenvironmental property as well as the pair-wise interactions of
single property to lapatinib responses.
There were multilayers of factors involved in the in vitro cellular responses to
drugs. In order to analyze the impact of individual components as well as pair-
wise interactions between components, the general linear model (GLM) was
applied to decouple the minor effects from the major one, and then quantify the

! 39!
lapatinib responses as a function of microenvironment. Besides the major ECM
proteins, such as fibronectin that conferred lapatinib resistance, other
recombinant proteins showed various impacts as well, e.g. EGF was tended to
increase the resistance of drug treatments, although these effects were minimal
(Figure 19A). The combined treatment of lapatinib and verteporfin had a
significant strong effect (Figure 19B), and the matrix rigidity conferred resistance
to drug treatments (Figure 19D), which were consistent with our previous report39.
Compared to type I collagen only, the combination of type I collagen and laminin
I conferred higher cell sensitivity, and fibronectin conferred significant cellular
resistance to lapatinib (Figure 19C). The synergistic or antagonistic effects of
pair-wise interactions between components were also analyzed and presented
(Figure 19E-H). Taken together, GLM analysis showed how each single
microenvironmental component affected drug responses. Furthermore, several
components, such as matrix rigidity or fibronectin, were found to correlate with
lapatinib resistance.
3.3.6. The lower pHER2/HER2 status was correlated with higher
lapatinib resistance.
Lapatinib inhibits proliferation via targeting HER2 receptors, thus, we
hypothesized that the level of pHER2 and HER2, which could be affected by
microenvironment, impacted lapatinib responses. I first asked whether the levels
of pHER2 and HER2 were modulated by matrix rigidity. The pHER2 and HER2
level of HCC1569 cultured on type I collagen-coated gel with various matrix
rigidities were measured by flow cytometry. The cells cultured on stiffer substrate

! 40!
showed higher HER2 and lower pHER2 level (Figure 20A), suggesting a role of
matrix rigidity in HER2 regulation. The pHER2/HER2 status was plotted against
the lapatinib responses, and it showed that the higher lapatinib resistance of
HCC1569 was correlated with lower pHER2/HER2 status (Figure 20B). With
MEArray, I then asked whether molecular composition contributed to the
pHER2/HER2 status and the lapatinib responses, and whether there were
correlation between that and matrix rigidity. From all of the combinatorial
microenvironments, the lapatinib resistance was trended higher (Figure 20C) and
the pHER2/HER2 status was trended lower (Figure 20D) in HCC1569 cultured
on stiffer substrate. However, the correlation between pHER2/HER2 status and
lapatinib responses showed no statistical significance, suggesting that the
molecular compositions may have various impacts on pHER2/HER2 and
lapatinib response (Figure 20G). A waterfall plot of pHER2/HER2 status and
lapatinib responses was presented with the same order of molecular
compositions, and clearly showed that the lapatinib responses were not always
inversely correlated with pHER2/HER2 status (Figure 20E-F).
3.3.7. Fibronectin conferred lapatinib resistance in HCC1569.
The microenvironments that showed prominent impact on lapatinib responses in
HCC1569 were validated. Among all of the major ECM components, fibronectin
conferred lapatinib resistance the most (Figure 19C). Fibronectin has been
connected to breast cancer progression and tamoxifen resistance via the
interaction with β1 integrin100, 101. Thus, the impact of adhesion to fibronectin was
validated and showed that fibronectin conferred HCC1569 lapatinib resistance

! 41!
(Figure 21A). We previously reported that lapatinib resistance is correlated with
the activation of YAP. Thus the ratio of nuclear or cytoplasmic YAP localization in
HCC1569 cultured on fibronectin-coated PA gels was quantified and showed that
adhesion to fibronectin increased nuclear YAP localization (Figure 21B). To
assess the impact of fibronectin on clinical outcome, analysis of breast cancer
data from The Cancer Genome Atlas data (AgilentG4502A_07_3)3 and The
Cancer Proteome Atlas data (BRCA protein RBN)102 were performed. The mRNA
level of fibronectin was not correlated with mRNA of YAP, but the there was a
positive correlation between fibronectin and YAP protein levels (Figure 21, C and
D). Also, neither mRNA nor protein level of fibronectin were correlated with
survival curve (Figure 21, E and F). Taken together, the results suggested that
fibroenctin may contribute to lapatinib resistance via YAP-dependent pathways,
but the mRNA and protein level of fibronectin were not directly correlated with
clinical outcome.

! 42!
Chapter 4: Discussion
4.1. The mechanosensing pathway and YAP are appealing therapeutic
targets.
I first demonstrated that the mechanical property of microenvironments
influenced resistance to and efficacy of the HER2 pathway-targeted therapeutic
lapatinib, in HER2-amplified breast cancer cells. Although engineered culture
substrata necessarily over-simplify the tumor microenvironment compared to in
vivo, they can reveal important mechanistic elements of cellular responses, by
winnowing down the possible candidate pathways that are involved in a given
response. I specifically probed the property of elastic modulus on cells at low
density on PA gels, to minimize the confounding effects of cell-cell contact. YAP
activation is known to be regulated also by cell-cell contact33, where high cell
density inhibits YAP activation by inducing YAP phosphorylation. In our
engineered system YAP and TAZ activation were correlated with resistance to
lapatinib, and when YAP was knocked out in orthotopically-implanted tumors
grown in mice, tumor growth slowed and they became more sensitive to lapatinib.
The resistance phenotype is not exclusively modulus-dependent, but by isolating
and studying that one physical property of the matrix, we revealed that the Hippo
pathway is likely an important component of resistance in HER2-targeted kinase
inhibitors.
YAP has been attributed with dual roles in tumorgenesis in breast cancer.
Studies in vitro have shown that exogenous expression of YAP in cells can

! 43!
promote cell growth, suggesting YAP has a role as a tumor promoter84. Others
have reported potentially tumor suppressive roles for YAP. Loss of
heterozygosity at the YAP locus in a number of luminal breast cancers, and
shRNA knockdown of YAP in some breast cancer cell lines suppresses anoikis,
which is a form of programmed cell death, and promotes tumor growth in vivo103.
Moreover, YAP expression was reduced in some invasive carcinoma samples
compared to normal breast tissues104. The multiple roles of YAP in tumorigenesis
may be dependent upon the stage of a given cell’s progression, e.g. active YAP
enhances tumor growth when expressed in mammary carcinomas, but not when
expressed in a non-malignant mammary epithelial cell line105. YAP expression in
breast cancers may be subtype-dependent106, and YAP is notably present in
stromal cells107, not only epithelial, which further complicates the in vivo situation.
In addition, YAP and TAZ exhibit distinct functions, e.g. YAP knockout mice are
embryonic lethal108, but TAZ knockout mice can be viable although the animals
have kidney disease 109. Here we showed that either YAP or TAZ knockdown in
vitro can eliminate modulus-dependent lapatinib responses and confer more
sensitivity to lapatinib, suggesting redundant roles in the context of modulus-
dependent response to lapatinib.
The photosensitizer, verteporfin (Visudyne®, Novartis), is used as
photodynamic therapy for neovascular lesions in the eye110. In the absence of
photoactivation, verteporfin can disrupt TEAD(Transcriptional enhancer factor
TEF-1)-YAP association and inhibit YAP-induced liver overgrowth91, suggesting a
pharmacological strategy for regulating the transcriptional activities of YAP,

! 44!
which requires TEAD family proteins to bind to DNA. While verteporfin is a well
characterized, FDA approved drug for photodynamic therapy, the anti-
tumorigenic effect of YAP-related mechanism in breast cancer has not been well
studied. Our data show that verteporfin has a synergistic effect with lapatinib in
vitro, indicating that there is a potential benefit to testing the verteporfin in the
context of lapatinib resistance.
Many studies into resistance to HER2-targeted cancer therapeutics have
focused on intrinsic cellular mechanisms, such as compensatory pathway
activation, but the tumor microenvironment will likely play an important role as
well. Indeed, greater matrix rigidity leads to increased resistance to the anti-
proliferative effects of lapatinib, in HER2-amplified breast cancer cells on culture
substrata engineered to mimic different levels of matrix rigidity. Several studies
have shown in various cancer contexts that increasing matrix stiffness can both
promote chemotherapeutic resistance27, 111, 112, and decrease sensitivity to Raf
kinase inhibitors113; however, the mechanisms underlying these elastic modulus-
dependent effects are not yet well defined.
Lapatinib resistance also has been linked to compensatory activation of
HER314, but we did not find that HER3 was strongly activated in the context of
increased matrix rigidity. To mimic levels found in patient serum, we used 1.5 µM
lapatinib, a concentration considered high14, and we measured HER3
phosphorylation 48 hours after lapatinib treatment, whereas compensatory
activation of HER3 may occur after 72 hours and at a lower lapatinib
concentration. Taken together, and experimental differences notwithstanding,
! 45!
these reports suggest that resistance to HER2-targeted kinase inhibitors is likely
a multi-faceted challenge still to be overcome.
4.2. Applications of MEArrays.
That most failures in drug development are due to a lack of efficacy suggests that
our pre-clinical development toolbox does a poor job of predicting compound
activity in vivo114. Multi-well TCP plates are still the substrate of choice for much
of modern drug screening, which ignores an obvious lack of context115. Some
high-throughput (HT) compatible 3-D culture systems are being developed to
overcome this problem, but retooling of HT systems and improvements in image
analysis algorithms remain significant barriers to wide-scale adoption. Adaptation
of 2-D hydrogels that are controlled for tissue-like elastic moduli and are
conjugated with tissue-like molecular milieus to HT systems might present an
intermediate step that can both take advantage of existing HT systems and
recapitulate some key elements of in vivo microenvironments that are crucial for
determinants of drug responses.
MEArrays are enabling high-throughput functional exploration of stem cell
niches. While these array platforms create caricatures of in vivo
microenvironments, they enable researchers to functionally define molecular
components that maintain adult and embryonic stem cells, thus revealing
molecular regulators and pathways of the stem cell state. We predict this type of
functional cell-based dissection of combinatorial microenvironments will have
particular high impact in understanding normal and malignant human stem cells,
because in vivo experiments are essentially impossible. For instance, putative

! 46!
niche proteins and other tissue-specific proteins have been identified using
MEArrays, and validated in vivo in some cases, that were relevant to human
embryonic61, 116, neural63, mammary62, 64, and hepatic stem cells75. MEArrays
also were used to profile cell–ECM adhesion biases117,and to optimize growth
conditions of cultured cells118. Taking a combinatorial approach, relative to a
candidate-based approach, allows screening combinations of multiple tissue-
specific microenvironment proteins to identify extracellular cues that are the basis
for emergent cell behaviors. Functional roles for a number of molecules known to
be expressed in human mammary gland and brain, but hitherto had not been
ascribed respective roles for mammary or neural stem and progenitor cell
regulation, were discovered using this type of approach. The successful
application of MEArrays requires managing a number of technical details that are,
in many cases, on edge of discovery themselves. The remainder of this chapter
will elaborate on some of the issues that arise most often when producing
MEArrays on 2-D substrates and provide some discussion of how we are
managing them. There are relatively fewer examples of MEArray-type platforms
in 3-D, perhaps because some of the high-throughput liquid handling and 3-D
imaging requirements raise the barrier to entry, however an excellent example of
3-D MEArrays is available in Ranga et al.72.
4.3. Selecting the printing substrate: It depends on the biological
questions being asked.
There are numerous materials used to immobilize proteins, but the main object
remains the same where MEArray fabrication is concerned: a suitable surface

! 47!
coating for printing proteins upon should provide high adsorption capacity, low
cell attachment in areas not printed with proteins (i.e. non-fouling), and low spot-
to-spot variation. Other important considerations for protein arrays include, the
capacity to retain protein structure, functionality, and binding sites.
The most commonly used approaches are to chemically modify surfaces
of glass slides, e.g. with aldehydes or epoxies, or to coat them with very thin
layers of polymers such as polydimethylsiloxane (PDMS). Slides with these
surfaces adsorb proteins with either covalent bonds or strong electrostatic
interactions, respectively. Covalent modifications provide irreversible attachment,
however protein 3-dimensional structures may not be well maintained.
Unintended cell attachment also can be problematic with the chemically modified
glass and with the hydrophobic PDMS without the addition of non-fouling
coatings, like Pluronics F108 or bovine serum albumin. Another option is to coat
glass surfaces with polyacrylamide (PA), or poly(ethylene glycol) (PEG)
hydrogels. These types of hydrogels physically absorb proteins through relatively
weak electrostatic interactions. This retains most of the native protein
conformation, but there is higher variation in protein binding capacity119. One of
the most convenient properties of PA and PEG gels is their native non-fouling
character, which removes any problems of non-specific cell attachment.
Another important property to consider is the rigidity of the substrate.
PDMS is inexpensive and it is easy to manipulate its elastic modulus by altering
the cure:polymer ratio, and cover a range of rigidity similar to that of cartilage,
skin, and tendon (0.6 to 3.5 MPa). PEG is commonly used in cell fate decision
! 48!
studies, representing a range of rigidity from 500 kPa to 1.6 GPa. PA is another
inexpensive substrate, which can be tuned from 150 Pa to 150 kPa, which is
closer to the biological microenvironment for soft tissues like brain and breast120.
Which substrate for protein immobilization should be used really depends upon
the characteristics of cells used, the tissue structure being mimicked, and the
outcomes being measured.
4.4. MEArray data analysis: Seeing the forest for the trees.
A main goal of MEArray-type experiments is to provide causal links between
cellular responses and specific microenvironments. Both inter- and intra-
microenvironment heterogeneity of cellular responses are to be expected, and
can be instructive about the continuum of phenotypic plasticity within the
experimental system. Measuring heterogeneity of drug responses in various
contexts may result in more realistic expectations of drug responses in vivo. By
incorporating sufficient numbers of replicate features into the design of a given
MEArray, significant associations between microenvironments and cell
phenotypes can be identified, but the high dimensionality of the data is a
hindrance to extraction of meaningful information. Most MEArray platforms use
fluorescent probes to visualize biochemical and functional phenotypes, and
fluorescent and phase microscopy to capture morphological and colorimetric
phenotypes. There are no specialized high-throughput imaging systems for this
type of work currently available, however, microarray scanners, and
programmable, motorized epifluorescence or laser scanning confocal
microscopes have been successfully used to acquire the necessary images62, 72.

! 49!
Micrographs of cells attached to the various arrayed microenvironments can be
treated as ensemble data, i.e. averaging the signal from many cells on one spot
in a manner similar to DNA arrays, or as single-cell data when used in
combination with cell segmentation algorithms. Even in cases where MEArrays
are designed to have fairly low complexity, e.g. 100 or fewer unique
microenvironment combinations, the analytical challenges are significant. The
complexity of the information space generated from MEArray experiments
increases rapidly when taking into consideration multiple microenvironmental
properties such as rigidity, geometry, and molecular composition. In practice, the
statistical analysis of MEArray experiments is a rate-limiting step for this
technology, and there are multiple solutions for addressing this challenge. The
basic data processing workflow for MEArray experiments includes: signal
normalization, identifying functionally similar microenvironments by clustering,
dimension reduction, data visualization, and further pathway analysis. Table 1
shows some suggested software packages that aid with analyses of MEArray-
type data, with comments on specific strengths and weaknesses.
4.4.1. Data normalization.
All microarray-like data contain some useful information and a lot of noise, thus
proper data normalization is crucial. The data analysis starts from measuring
fluorescence intensity or colorimetric density of each target protein in cells on
each array feature, where intensity reflects the relative abundance of the target
protein. Intensities are impacted by factors, such as the characteristics of dye
(antibody), spatial location, and uneven surfaces of the slides that cause

! 50!
inconsistent background 121. Unlike DNA microarrays, which load the same
amount of cDNA onto the array and then uses total intensity as an internal
reference, the number of cells attached on the MEArray features varies by
microenvironment. Thus, we may use the average of the total signal from all cells
on all array features as a reference for normalization of arrays of the same
treatment condition. A signal emanating from cells on a control microenvironment,
which is known a priori to reproducibly bias towards a given phenotype, can be
used as a reference62. An alternative is to use spots that contain the same
amount of fluorescence molecules and should have the same intensity as an
internal control printed on each array. After proper normalization, the data are
ready to be further analyzed.
4.4.2. Statistical considerations.
The main purpose of MEArray experiments is to identify the specific
microenvironments that modulate certain cellular functions by comparing cellular
phenotypes between treatments and controls. Table 2 shows some methods,
which have been used for processing microarray data. Although Student’s t-test
is a widely used statistical test in biological research, it is valid only for comparing
two sets of data with each other. Dunnett’s t-test is the correct test for comparing
multiple sets of data with a single control, and in this research for identifying
multiple microenvironments that impose phenotypes significantly different from
the control62. The Z-score standardization is a simple method used to identify
meaningful groups that are distinct from the global mean. Z-scores were used
successfully to identify and optimize better culture conditions for rare cell

! 51!
populations122. However, Z-score has several limitations, like skewing of values
due to outliers within a dataset, less accuracy when cell numbers are reduced,
and the Z-score is based on the assumption that data fit a Gaussian distribution,
which is not the case in many biological systems. Thus, Guyon et al. proposed
the Φ-score as a cell-to-cell phenotypic scoring method for selecting the hit
discovery in cell-based assays. The Φ-score ranks cells instead of averaging
them, and shows performance that surpasses the Z-score for coping with the
above limitations. Indeed the Φ-score can be more sensitive (more true hits) and
more specific (fewer false positives) compared to other conventional methods123.
Clustering methods commonly used for DNA microarray datasets, such as
hierarchical or k-means clustering, also are used with MEArray data to separate
meaningful groups. Konagaya et al. interrogated a relatively small number of
growth factor combinations to optimize neural progenitor cell culture
microenvironments, and they used hierarchical cluster analysis to reveal three
major clusters of microenvironment combinations that facilitated growth versus
astrocyte or neuron differentiation124. Although these analyses can reveal the
meaningful groups within simple datasets, like traditional two-color DNA
microarray data, the difficulty and challenge of data clustering arises rapidly in
high dimensional data125. The phrase, “the curse of dimensionality”126, described
the general phenomenon that data analysis techniques ,which work well at lower
dimensions, are often unable to perform well when the dimensionality of data are
increased. Dimension reduction techniques have been developed to overcome
some of these difficulties.

! 52!
4.4.3. Dimension reduction and data visualization.
Thanks to improvements in computational processing power, we now are able to
deal with high-dimensional data more easily and with algorithms that do not
make painful compromises in the name of efficiency. The methods used for
dimension reduction distill the information from a sea of data into snap shots that
are emblematic of the underlying biology.
Principle component analysis (PCA) is used for dimension reduction and
can reveal the most variable factors that contribute to certain phenotypes127.
However, not all biological questions are related to the variables with highest
variance in the dataset, and in these cases, PCA is less able to identify the
contributing factors. Thus, Independent component analysis (ICA) is an
alternative to PCA, particularly when we know some certain characteristics of our
data, and assume that the observed data are separated into groups that are
independent of each other128. An example of a case where ICA has been applied
is the cocktail party problem, describing the human ability to selectively recognize
speech sound which are often assumed to be independent from each other in
noisy environment129. However, the need to make assumptions about the data
and to choose the number of components analyzed is a limitation of ICA,
particularly in high dimensional data sets where we may not fully understand the
relationships between variables. Due to this limitation, Yao et al. proposed
Independent Principle Component Analysis (IPCA) combining the advantages of
PCA and ICA, where they applied PCA as a pre-processing step to extract
components for subsequent analysis, and then applied ICA to filter out noise.

! 53!
They assumed that microarray-based gene expression measurements that follow
a Gaussian distribution represent noise (i.e. most of the genes are not expected
to change at a given condition), and they showed that IPCA was better at
revealing patterns in those biological data130. All of these approaches are used in
microarray analysis, but they often suffer from preserving important information
during data reconstruction when trying to analyze high dimensional single cell
data. Linear techniques such as PCA focus on separating dissimilar data points
far away in low-dimensional representations after data transformation. However,
biological data is often non-linear, and for high dimensional data it is usually
more important to keep similar data points close together in low-dimensional
representations, which is typically not feasible with linear mapping techniques131.
MEArray data are of a similar level of dimensionality to the data generated by
techniques like Mass cytometry (CyTOF). CyTOF is being developed as a new
single cell analysis technique that combines flow cytometry and transition
element isotope labeling, and CyTOF allows one to simultaneously measure up
to 100 protein markers inside and on the plasma membranes of cells132. CyTOF
and MEArray experiments generate very high content information, incorporating
information about multiple protein expression levels, multiple cellular morphology
parameters, and other image-based measurements among different treatments,
all at the single cell level. Qiu et al. developed and applied spanning-tree
progression analysis of density-normalized events (SPADE) to mass cytometry
data and demonstrated the ability of SPADE to recapitulate patterns of
hematopoiesis and to identify subpopulations of cells133. Based on the t-SNE

! 54!
technique, Amir et al. developed a non-linear approach called viSNE, for high-
dimensional data visualization. They were able to identify a rare leukemia
population when comparing leukemia diagnosis and relapse samples81. These
latter two approaches take into account major and the minor sources of variance
within a data and represent them on a low dimensional surface, which facilitates
the visualization of high dimensional data. Once the meaningful information has
been extracted, the data collected from MEArrays needs to be connected to the
existing body of knowledge in order to perform further biological validation.
4.5. ECM proteins have major impact on lapatinib responses.
We previously showed that the matrix rigidity plays an important role in altering
lapatinib resistance in HCC1569 via YAP-dependent mechanosensing
mechanisms. However, the impacts of molecular compositions of Matrigel to
lapatinib responses have not been well elucidated, yet. The reconstituted
basement membrane (BM), Matrigel, is rich in laminin and collagen IV, and the
signals from the BM regulate epithelial cellular functions in mammary cells134, 135.
Although adhesion to type I collagen or laminin I conferred cells similar lapatinib
responses (Figure 19C), the adhesion to both (1:1) showed higher lapatinib
sensitivity, suggesting that the impact of interactions between molecular
compositions could be different from impact of individual composition. Thus, the
details of mechanisms about how molecular compositions altered lapatinib
sensitivity required the consideration of context and more investigations for
elucidation.
! 55!
Recently, it has been shown that adhesion of cells to fibronectin activates
FAK-Src-YAP pathway, suggesting a plausible linkage between fibronectin and
YAP dependent pathway136. My results showed that fibronectin increased
lapatinib resistance and nuclear YAP translocation (Figure 21, A and B), and it is
likely that this fibronectin-induced nuclear YAP translocation contributed to
lapatinib resistance via FAK-Scr-YAP pathway. The first step to test this
hypothesis is to see whether the perturbation of FAK-Scr-YAP pathway can
eliminate fibronectin-induced lapatinib resistance as well as nuclear YAP
translocation. The expression of intracellular fibronectin has been connected to
breast cancer metastasis and provides prognostic significances137 and may
account for chemotherapeutic resistance101. Thus, a comprehensive
understanding of how fibronectin modulates drug responses is important for
designing therapeutic strategies.
4.6. The effects from other recombinant proteins.
Unlike the major ECM, which had more prominent and consistent impact on
lapatinib responses, the effects from recombinant proteins were much less
(Figure 19A). One explanation is that the impacts from ECM were more dominant
than recombinant proteins. Another explanation, which may also reflect the
importance of microenvironments, is that the impacts from recombinant proteins
to lapatinib responses are context-dependent and less consistent. For instance,
the combination of HGF and fibronectin conferred the highest lapatinib resistance
in 2500 Pa rigidity, but it showed minor impact on lapatinib responses in 40 kPa
(Figure 18E). The individual effect of each recombinant protein was computed by

! 56!
GLM analysis, which generated the adjusted lapatinib responses based on entire
data set. Thus, the various lapatinib responses among total combinatorial
microenvironments averaged out the impact of single recombinant protein.
In the MEArray experiments, cells were not only attached to the
combinatorial microenvironments that were printed, but also exposed to the trace
soluble components that were secreted by cells. It is likely that ECM, which cells
attached to, could modulate the secretion of soluble factors that impacted cells.
Although the impacts of these secreted components should not be ignored, we
may argue that these secretions may be trivial compared to combinatorial
microenvironments that cells directly adhered to. The volume of media that was
used for cell culture might dilute these soluble factors significantly to minimize the
impacts. Also, all cells in MEArray were exposed to a mixture of these diffused
soluble factors, which should no longer have microenvironment-dependent
impact. However, in order to really isolate and measure the impact of
microenvironment-dependent secreted soluble factors, multiple-well plates might
be used as an approach. For instance, if capable, the same replicates of
combinatorial ECM can be printed in isolated wells of a 384 multiple-well plate,
and the recombinant proteins added into wells one at a time. Thus, each well will
contain only replicates of one defined microenvironment, and the cells will be
exposed to the same microenvironment.

! 57!
Chapter 5: Conclusions
5.1. Conclusions
The success rate of translation from pre-clinical drug screening to clinical efficacy
is low, and it is also true in animal models, which serve as important sources in
vivo138. Besides the intrinsic genetic alterations, and inter-patient variability and
intra-tumor heterogeneity that modulate drug efficacy, emerging studies
demonstrated microenvironment is also an important determinant that modulates
therapeutic responses 139.
In summary, my research has demonstrated that the microenvironment has
significant impact on responses of targeted therapy. Although this MEArray
platform is not yet the model that can recapitulate real microenvironment in vivo,
the information acquired by accessing the impact of combinatorial
microenvironments can shed light on mechanisms of microenvironment-
dependent drug responses. I showed that merely changing matrix rigidity alone
could modulate lapatinib responses via YAP-dependent signaling pathway. The
combinatorial microenvironments microarray (MEArray) we developed provides a
feasible tool for answering questions such as how defined microenvironments
impact cellular biology. With MEArray, I demonstrated that both matrix rigidity
and molecular compositions could modulate lapatinib responses, and identified
microenvironments, such as higher matrix rigidity or fibronectin, conferred
lapatinib resistance. Further studies are needed and already in progress to

! 58!
elucidate the mechanisms to overcome the microenvironment-induced lapatinib
resistance.

! 59!
Chapter 6: Reference:
1. Siegel, R.L., Miller, K.D. & Jemal, A. Cancer statistics, 2016. CA: a cancer journal for clinicians 66, 7-30 (2016).
2. Society, A.C. Cancer Facts & Figures 2016. Atlanta: American Cancer Society (2016).
3. Koboldt, D.C. et al. Comprehensive molecular portraits of human breast tumours. Nature 490, 61-70 (2012).
4. Nio, Y. et al. Anticancer chemosensitivity changes between the original and recurrent tumors after successful chemotherapy selected according to the sensitivity assay. Annals of surgery 221, 89-99 (1995).
5. Kunz-Schughart, L.A., Freyer, J.P., Hofstaedter, F. & Ebner, R. The use of 3-D cultures for high-throughput screening: the multicellular spheroid model. J Biomol Screen 9, 273-285 (2004).
6. Bissell, M.J., Radisky, D.C., Rizki, A., Weaver, V.M. & Petersen, O.W. The organizing principle: microenvironmental influences in the normal and malignant breast. Differentiation 70, 537-546 (2002).
7. Kun, Y. et al. Classifying the estrogen receptor status of breast cancers by expression profiles reveals a poor prognosis subpopulation exhibiting high expression of the ERBB2 receptor. Human molecular genetics 12, 3245-3258 (2003).
8. Kim, M., Agarwal, S. & Tripathy, D. Updates on the treatment of human epidermal growth factor receptor type 2-positive breast cancer. Current opinion in obstetrics & gynecology (2013).
9. Rexer, B.N. & Arteaga, C.L. Intrinsic and acquired resistance to HER2-targeted therapies in HER2 gene-amplified breast cancer: mechanisms and clinical implications. Critical reviews in oncogenesis 17, 1-16 (2012).
10. Maximiano, S., Magalhaes, P., Guerreiro, M.P. & Morgado, M. Trastuzumab in the Treatment of Breast Cancer. BioDrugs : clinical immunotherapeutics, biopharmaceuticals and gene therapy (2016).
11. Lavaud, P. & Andre, F. Strategies to overcome trastuzumab resistance in HER2-overexpressing breast cancers: focus on new data from clinical trials. BMC Medicine 12, 1-10 (2014).
12. Medina, P.J. & Goodin, S. Lapatinib: a dual inhibitor of human epidermal growth factor receptor tyrosine kinases. Clin Ther 30, 1426-1447 (2008).
13. Rusnak, D.W. et al. Assessment of epidermal growth factor receptor (EGFR, ErbB1) and HER2 (ErbB2) protein expression levels and response to lapatinib (Tykerb, GW572016) in an expanded panel of human normal and tumour cell lines. Cell proliferation 40, 580-594 (2007).
14. Amin, D.N. et al. Resiliency and vulnerability in the HER2-HER3 tumorigenic driver. Science translational medicine 2, 16ra17 (2010).
15. Xia, W. et al. An heregulin-EGFR-HER3 autocrine signaling axis can mediate acquired lapatinib resistance in HER2+ breast cancer models. Breast cancer research : BCR 15 (2013).

! 60!
16. Liu, L. et al. Novel mechanism of lapatinib resistance in HER2-positive breast tumor cells: activation of AXL. Cancer research 69, 6871-6878 (2009).
17. Chen, C.T. et al. MET activation mediates resistance to lapatinib inhibition of HER2-amplified gastric cancer cells. Molecular cancer therapeutics 11, 660-669 (2012).
18. Provenzano, P.P., Inman, D.R., Eliceiri, K.W. & Keely, P.J. Matrix density-induced mechanoregulation of breast cell phenotype, signaling and gene expression through a FAK-ERK linkage. Oncogene 28, 4326-4343 (2009).
19. Engler, A.J., Sen, S., Sweeney, H.L. & Discher, D.E. Matrix elasticity directs stem cell lineage specification. Cell 126, 677-689 (2006).
20. Provenzano, P.P. & Keely, P.J. Mechanical signaling through the cytoskeleton regulates cell proliferation by coordinated focal adhesion and Rho GTPase signaling. Journal of cell science 124, 1195-1205 (2011).
21. Paszek, M.J. et al. Tensional homeostasis and the malignant phenotype. Cancer Cell 8, 241-254 (2005).
22. Weaver, V.M. et al. beta4 integrin-dependent formation of polarized three-dimensional architecture confers resistance to apoptosis in normal and malignant mammary epithelium. Cancer Cell 2, 205-216 (2002).
23. Weigelt, B., Lo, A.T., Park, C.C., Gray, J.W. & Bissell, M.J. HER2 signaling pathway activation and response of breast cancer cells to HER2-targeting agents is dependent strongly on the 3D microenvironment. Breast cancer research and treatment 122, 35-43 (2010).
24. Rubashkin, M.G. et al. Force engages vinculin and promotes tumor progression by enhancing PI3K activation of phosphatidylinositol (3,4,5)-triphosphate. Cancer research 74, 4597-4611 (2014).
25. Paszek, M.J. et al. The cancer glycocalyx mechanically primes integrin-mediated growth and survival. Nature 511, 319-325 (2014).
26. Mouw, J.K. et al. Tissue mechanics modulate microRNA-dependent PTEN expression to regulate malignant progression. Nature medicine 20, 360-367 (2014).
27. Schrader, J. et al. Matrix stiffness modulates proliferation, chemotherapeutic response, and dormancy in hepatocellular carcinoma cells. Hepatology 53, 1192-1205 (2011).
28. Justice, R.W., Zilian, O., Woods, D.F., Noll, M. & Bryant, P.J. The Drosophila tumor suppressor gene warts encodes a homolog of human myotonic dystrophy kinase and is required for the control of cell shape and proliferation. Genes & development 9, 534-546 (1995).
29. Zhao, B., Lei, Q.-Y. & Guan, K.-L. The Hippo–YAP pathway: new connections between regulation of organ size and cancer. Current opinion in cell biology 20, 638-646 (2008).
30. Tapon, N. et al. salvador Promotes Both Cell Cycle Exit and Apoptosis in Drosophila and Is Mutated in Human Cancer Cell Lines. Cell 110, 467-478 (2002).
31. Harvey, K.F., Zhang, X. & Thomas, D.M. The Hippo pathway and human cancer. Nat Rev Cancer 13, 246-257 (2013).

! 61!
32. Curto, M. & McClatchey, A.I. Nf2/Merlin: a coordinator of receptor signalling and intercellular contact. British journal of cancer 98, 256-262 (2008).
33. Zhao, B. et al. Inactivation of YAP oncoprotein by the Hippo pathway is involved in cell contact inhibition and tissue growth control. Genes & development 21, 2747-2761 (2007).
34. Mo, J.-S. et al. Cellular energy stress induces AMPK-mediated regulation of YAP and the Hippo pathway. Nature cell biology 17, 500-510 (2015).
35. Dupont, S. et al. Role of YAP/TAZ in mechanotransduction. Nature 474, 179-183 (2011).
36. Yu, F.X. & Guan, K.L. The Hippo pathway: regulators and regulations. Genes & development 27, 355-371 (2013).
37. Acerbi, I. et al. Human breast cancer invasion and aggression correlates with ECM stiffening and immune cell infiltration. Integrative biology : quantitative biosciences from nano to macro 7, 1120-1134 (2015).
38. Moroishi, T., Hansen, C.G. & Guan, K.-L. The emerging roles of YAP and TAZ in cancer. Nat Rev Cancer 15, 73-79 (2015).
39. Lin, C.H. et al. Microenvironment rigidity modulates responses to the HER2 receptor tyrosine kinase inhibitor lapatinib via YAP and TAZ transcription factors. Molecular biology of the cell 26, 3946-3953 (2015).
40. Johnson, R. & Halder, G. The two faces of Hippo: targeting the Hippo pathway for regenerative medicine and cancer treatment. Nature reviews. Drug discovery 13, 63-79 (2014).
41. Light, D.W. & Kantarjian, H. Market spiral pricing of cancer drugs. Cancer 119, 3900-3902 (2013).
42. Hay, M., Thomas, D.W., Craighead, J.L., Economides, C. & Rosenthal, J. Clinical development success rates for investigational drugs. Nat Biotech 32, 40-51 (2014).
43. Quail, D.F. & Joyce, J.A. Microenvironmental regulation of tumor progression and metastasis. Nature medicine 19, 1423-1437 (2013).
44. Bissell, M.J. & Hines, W.C. Why don’t we get more cancer? A proposed role of the microenvironment in restraining cancer progression. Nature medicine 17, 320-329 (2011).
45. Talmadge, J.E., Singh, R.K., Fidler, I.J. & Raz, A. Murine Models to Evaluate Novel and Conventional Therapeutic Strategies for Cancer. The American journal of pathology 170, 793-804 (2007).
46. Egeblad, M., Nakasone, E.S. & Werb, Z. Tumors as organs: complex tissues that interface with the entire organism. Developmental cell 18, 884-901 (2010).
47. Junttila, M.R. & de Sauvage, F.J. Influence of tumour micro-environment heterogeneity on therapeutic response. Nature 501, 346-354 (2013).
48. Mlecnik, B. et al. The tumor microenvironment and Immunoscore are critical determinants of dissemination to distant metastasis. Science translational medicine 8, 327ra326-327ra326 (2016).
49. Butcher, D.T., Alliston, T. & Weaver, V.M. A tense situation: forcing tumour progression. Nat Rev Cancer 9, 108-122 (2009).

! 62!
50. Correia, A.L. & Bissell, M.J. The tumor microenvironment is a dominant force in multidrug resistance. Drug resistance updates : reviews and commentaries in antimicrobial and anticancer chemotherapy 15, 39-49 (2012).
51. Sneddon, J.B. & Werb, Z. Location, location, location: the cancer stem cell niche. Cell stem cell 1, 607-611 (2007).
52. Yang, Z.J. & Wechsler-Reya, R.J. Hit 'em where they live: targeting the cancer stem cell niche. Cancer Cell 11, 3-5 (2007).
53. Flynn, C.M. & Kaufman, D.S. Donor cell leukemia: insight into cancer stem cells and the stem cell niche. Blood 109, 2688-2692 (2007).
54. Fuchs, E., Tumbar, T. & Guasch, G. Socializing with the Neighbors: Stem Cells and Their Niche. Cell 116, 769-778 (2004).
55. Scadden, D.T. The stem-cell niche as an entity of action. Nature 441, 1075-1079 (2006).
56. Collins, C.A. et al. Stem cell function, self-renewal, and behavioral heterogeneity of cells from the adult muscle satellite cell niche. Cell 122, 289-301 (2005).
57. Nishimura, E.K. et al. Dominant role of the niche in melanocyte stem-cell fate determination. Nature 416, 854-860 (2002).
58. Sacco, A., Doyonnas, R., Kraft, P., Vitorovic, S. & Blau, H.M. Self-renewal and expansion of single transplanted muscle stem cells. Nature 456, 502-506 (2008).
59. Booth, B.W. et al. The mammary microenvironment alters the differentiation repertoire of neural stem cells. Proc Natl Acad Sci U S A 105, 14891-14896 (2008).
60. Boulanger, C.A., Mack, D.L., Booth, B.W. & Smith, G.H. Interaction with the mammary microenvironment redirects spermatogenic cell fate in vivo. Proceedings of the National Academy of Sciences of the United States of America 104, 3871-3876 (2007).
61. Flaim, C.J., Chien, S. & Bhatia, S.N. An extracellular matrix microarray for probing cellular differentiation. Nat Meth 2, 119-125 (2005).
62. LaBarge, M.A. et al. Human mammary progenitor cell fate decisions are products of interactions with combinatorial microenvironments. Integr Biol 1, 70-79 (2009).
63. Soen, Y., Mori, A., Palmer, T.D. & Brown, P.O. Exploring the regulation of human neural precursor cell differentiation using arrays of signaling microenvironments. Molecular Systems Biology 2, 37-37 (2006).
64. Lin, C.H., Lee, J.K. & LaBarge, M.A. Fabrication and use of microenvironment microarrays (MEArrays). J Vis Exp (2012).
65. LaBarge, M.A., Petersen, O.W. & Bissell, M.J. Of microenvironments and mammary stem cells. Stem cell reviews 3, 137-146 (2007).
66. LaBarge, M.A. The difficulty of targeting cancer stem cell niches. Clinical cancer research : an official journal of the American Association for Cancer Research 16, 3121-3129 (2010).

! 63!
67. Bissell, M.J. & LaBarge, M.A. Context, tissue plasticity, and cancer: Are tumor stem cells also regulated by the microenvironment? Cancer cell 7, 17-23 (2005).
68. Kenny, P.A. & Bissell, M.J. Tumor reversion: Correction of malignant behavior by microenvironmental cues. International Journal of Cancer 107, 688-695 (2003).
69. Levental, I., Georges, P.C. & Janmey, P.A. Soft biological materials and their impact on cell function. Soft Matter 3, 299-306 (2007).
70. Hansen, K.C. et al. An in-solution ultrasonication-assisted digestion method for improved extracellular matrix proteome coverage. Molecular & cellular proteomics : MCP 8, 1648-1657 (2009).
71. Zanella, F., Lorens, J.B. & Link, W. High content screening: seeing is believing. Trends in biotechnology 28, 237-245 (2010).
72. Ranga, A. et al. 3D niche microarrays for systems-level analyses of cell fate. Nature communications 5 (2014).
73. Pelissier, F.A. et al. Age-related dysfunction in mechanotransduction impairs differentiation of human mammary epithelial progenitors. Cell Rep 7, 1926-1939 (2014).
74. Shin, I., Park, S. & Lee, M.-r. Carbohydrate Microarrays: An Advanced Technology for Functional Studies of Glycans. Chemistry – A European Journal 11, 2894-2901 (2005).
75. Brafman, D.A. et al. Investigating the role of the extracellular environment in modulating hepatic stellate cell biology with arrayed combinatorial microenvironments. Integrative Biology 1, 513-524 (2009).
76. Lee, G.Y., Kenny, P.A., Lee, E.H. & Bissell, M.J. Three-dimensional culture models of normal and malignant breast epithelial cells. Nature methods 4, 359-365 (2007).
77. Tse, J.R. & Engler, A.J. Preparation of hydrogel substrates with tunable mechanical properties. Current protocols in cell biology / editorial board, Juan S. Bonifacino ... [et al.] Chapter 10, Unit 10 16 (2010).
78. Jones, T.R. et al. CellProfiler Analyst: data exploration and analysis software for complex image-based screens. BMC Bioinformatics 9, 1-16 (2008).
79. Team, R.C. R: A Language and Environment for Statistical Computing. (2015).
80. Hilsenbeck, S.G. et al. Statistical Analysis of Array Expression Data as Applied to the Problem of Tamoxifen Resistance. Journal of the National Cancer Institute 91, 453-459 (1999).
81. Amir, E.-a.D. et al. viSNE enables visualization of high dimensional single-cell data and reveals phenotypic heterogeneity of leukemia. Nat Biotech 31, 545-552 (2013).
82. Rosario-Martinez, H.D. phia: Post-Hoc Interaction Analysis. (2015). 83. Halder, G., Dupont, S. & Piccolo, S. Transduction of mechanical and
cytoskeletal cues by YAP and TAZ. Nature reviews. Molecular cell biology 13, 591-600 (2012).

! 64!
84. Wang, X., Su, L. & Ou, Q. Yes-associated protein promotes tumour development in luminal epithelial derived breast cancer. Eur J Cancer 48, 1227-1234 (2012).
85. Neve, R.M. et al. A collection of breast cancer cell lines for the study of functionally distinct cancer subtypes. Cancer Cell 10, 515-527 (2006).
86. Burris, H.A., 3rd et al. Phase I safety, pharmacokinetics, and clinical activity study of lapatinib (GW572016), a reversible dual inhibitor of epidermal growth factor receptor tyrosine kinases, in heavily pretreated patients with metastatic carcinomas. Journal of clinical oncology : official journal of the American Society of Clinical Oncology 23, 5305-5313 (2005).
87. Soofi, S.S., Last, J.A., Liliensiek, S.J., Nealey, P.F. & Murphy, C.J. The elastic modulus of Matrigel as determined by atomic force microscopy. J Struct Biol 167, 216-219 (2009).
88. Saruwatari, L. et al. Osteoblasts generate harder, stiffer, and more delamination-resistant mineralized tissue on titanium than on polystyrene, associated with distinct tissue micro- and ultrastructure. Journal of bone and mineral research : the official journal of the American Society for Bone and Mineral Research 20, 2002-2016 (2005).
89. Kolahi, K.S. et al. Effect of substrate stiffness on early mouse embryo development. PloS one 7, e41717 (2012).
90. Holle, A.W. & Engler, A.J. More than a feeling: discovering, understanding, and influencing mechanosensing pathways. Curr Opin Biotechnol 22, 648-654 (2011).
91. Liu-Chittenden, Y. et al. Genetic and pharmacological disruption of the TEAD-YAP complex suppresses the oncogenic activity of YAP. Genes & development 26, 1300-1305 (2012).
92. Zhang, J. et al. YAP-dependent induction of amphiregulin identifies a non-cell-autonomous component of the Hippo pathway. Nature cell biology 11, 1444-1450 (2009).
93. Higginbotham, J.N. et al. Amphiregulin exosomes increase cancer cell invasion. Current biology : CB 21, 779-786 (2011).
94. Hurbin, A., Dubrez, L., Coll, J.L. & Favrot, M.C. Inhibition of apoptosis by amphiregulin via an insulin-like growth factor-1 receptor-dependent pathway in non-small cell lung cancer cell lines. The Journal of biological chemistry 277, 49127-49133 (2002).
95. Yotsumoto, F. et al. Amphiregulin regulates the activation of ERK and Akt through epidermal growth factor receptor and HER3 signals involved in the progression of pancreatic cancer. Cancer science 101, 2351-2360 (2010).
96. Garrett, J.T. et al. Transcriptional and posttranslational up-regulation of HER3 (ErbB3) compensates for inhibition of the HER2 tyrosine kinase. Proc Natl Acad Sci U S A 108, 5021-5026 (2011).
97. Hobor, S. et al. TGF-alpha and amphiregulin paracrine network promotes resistance to EGFR blockade in colorectal cancer cells. Clinical cancer research : an official journal of the American Association for Cancer Research (2014).

! 65!
98. LaBarge, M.A. et al. Human mammary progenitor cell fate decsions are products of interactions with combinatorial microenvironments. Integrative Biology 1, 70-79 (2009).
99. Lamprecht, M.R., Sabatini, D.M. & Carpenter, A.E. CellProfiler: free, versatile software for automated biological image analysis. Biotechniques 42, 71-75 (2007).
100. Pontiggia, O. et al. The tumor microenvironment modulates tamoxifen resistance in breast cancer: a role for soluble stromal factors and fibronectin through β1 integrin. Breast cancer research and treatment 133, 459-471 (2012).
101. Yuan, J. et al. Acquisition of epithelial-mesenchymal transition phenotype in the tamoxifen-resistant breast cancer cell: a new role for G protein-coupled estrogen receptor in mediating tamoxifen resistance through cancer-associated fibroblast-derived fibronectin and β1-integrin signaling pathway in tumor cells. Breast cancer research : BCR 17, 69 (2015).
102. Li, J. et al. TCPA: a resource for cancer functional proteomics data. Nat Meth 10, 1046-1047 (2013).
103. Yuan, M. et al. Yes-associated protein (YAP) functions as a tumor suppressor in breast. Cell Death Differ 15, 1752-1759 (2008).
104. Tufail, R., Jorda, M., Zhao, W., Reis, I. & Nawaz, Z. Loss of Yes-associated protein (YAP) expression is associated with estrogen and progesterone receptors negativity in invasive breast carcinomas. Breast cancer research and treatment 131, 743-750 (2012).
105. Lamar, J.M. et al. The Hippo pathway target, YAP, promotes metastasis through its TEAD-interaction domain. Proc Natl Acad Sci U S A 109, E2441-2450 (2012).
106. Kim, S.K., Jung, W.H. & Koo, J.S. Yes-associated protein (YAP) is differentially expressed in tumor and stroma according to the molecular subtype of breast cancer. Int J Clin Exp Pathol 7, 3224-3234 (2014).
107. Calvo, F. et al. Mechanotransduction and YAP-dependent matrix remodelling is required for the generation and maintenance of cancer-associated fibroblasts. Nature cell biology 15, 637-646 (2013).
108. Morin-Kensicki, E.M. et al. Defects in yolk sac vasculogenesis, chorioallantoic fusion, and embryonic axis elongation in mice with targeted disruption of Yap65. Molecular and cellular biology 26, 77-87 (2006).
109. Hossain, Z. et al. Glomerulocystic kidney disease in mice with a targeted inactivation of Wwtr1. Proc Natl Acad Sci U S A 104, 1631-1636 (2007).
110. Michels, S. & Schmidt-Erfurth, U. Photodynamic therapy with verteporfin: a new treatment in ophthalmology. Seminars in ophthalmology 16, 201-206 (2001).
111. Zustiak, S., Nossal, R. & Sackett, D.L. Multiwell stiffness assay for the study of cell responsiveness to cytotoxic drugs. Biotechnol Bioeng 111, 396-403 (2014).
112. Sharma, S., Santiskulvong, C., Rao, J., Gimzewski, J.K. & Dorigo, O. The role of Rho GTPase in cell stiffness and cisplatin resistance in ovarian cancer cells. Integr Biol 6, 611-617 (2014).
! 66!
113. Nguyen, T.V., Sleiman, M., Moriarty, T., Herrick, W.G. & Peyton, S.R. Sorafenib resistance and JNK signaling in carcinoma during extracellular matrix stiffening. Biomaterials 35, 5749-5759 (2014).
114. Baker, B.M. & Chen, C.S. Deconstructing the third dimension - how 3D culture microenvironments alter cellular cues. Journal of cell science 125, 3015-3024 (2012).
115. Labarge, M.A., Parvin, B. & Lorens, J.B. Molecular deconstruction, detection, and computational prediction of microenvironment-modulated cellular responses to cancer therapeutics. Adv Drug Deliv Rev 70, 123-131 (2014).
116. Ankam, S., Teo, B.K., Kukumberg, M. & Yim, E.K. High throughput screening to investigate the interaction of stem cells with their extracellular microenvironment. Organogenesis 9, 128-142 (2013).
117. Kuschel, C. et al. Cell adhesion profiling using extracellular matrix protein microarrays. Biotechniques 40, 523-531 (2006).
118. Konagaya, S., Kato, K., Nakaji-Hirabayashi, T., Arima, Y. & Iwata, H. Array-based functional screening of growth factors toward optimizing neural stem cell microenvironments. Biomaterials 32, 5015-5022 (2011).
119. Angenendt, P. Progress in protein and antibody microarray technology. Drug discovery today 10, 503-511 (2005).
120. Kim, H. et al. Patterning Methods for Polymers in Cell and Tissue Engineering. Ann Biomed Eng 40, 1339-1355 (2012).
121. Yang, Y.H. et al. Normalization for cDNA microarray data: a robust composite method addressing single and multiple slide systematic variation. Nucleic Acids Research 30, e15 (2002).
122. Brafman, D.A., Chien, S. & Willert, K. Arrayed cellular microenvironments for identifying culture and differentiation conditions for stem, primary and rare cell populations. Nat. Protocols 7, 703-717 (2012).
123. Guyon, L. et al. Φ-score: A cell-to-cell phenotypic scoring method for sensitive and selective hit discovery in cell-based assays. Scientific reports 5, 14221 (2015).
124. Konagaya, S., Kato, K., Nakaji-Hirabayashi, T., Arima, Y. & Iwata, H. Array-based functional screening of growth factors toward optimizing neural stem cell microenvironments. Biomaterials 32, 5015-5022 (2011).
125. Steinbach, M., Ertöz, L. & Kumar, V. in New Directions in Statistical Physics. (ed. L. Wille) 273-309 (Springer Berlin Heidelberg, 2004).
126. Bellman, R. Adaptive Control Processes: A Guided Tour. (Princeton University Press, Princeton, New Jersey; 1961).
127. Hilsenbeck, S.G. et al. Statistical analysis of array expression data as applied to the problem of tamoxifen resistance. J Natl Cancer Inst 91, 453-459 (1999).
128. Scholz, M., Gatzek, S., Sterling, A., Fiehn, O. & Selbig, J. Metabolite fingerprinting: detecting biological features by independent component analysis. Bioinformatics 20, 2447-2454 (2004).
129. Haykin, S. & Chen, Z. The cocktail party problem. Neural computation 17, 1875-1902 (2005).

! 67!
130. Yao, F., Coquery, J. & Le Cao, K.-A. Independent Principal Component Analysis for biologically meaningful dimension reduction of large biological data sets. BMC Bioinformatics 13, 24 (2012).
131. Laurens van der Maaten, G.H. Visualizing data using t-SNE. The Journal of Machine Learning Research 9, 2579-2605 (2008).
132. Bendall, S.C. et al. Single-Cell Mass Cytometry of Differential Immune and Drug Responses Across a Human Hematopoietic Continuum. Science (New York, N.y.) 332, 687-696 (2011).
133. Qiu, P. et al. Extracting a cellular hierarchy from high-dimensional cytometry data with SPADE. Nature biotechnology 29, 886-891 (2011).
134. Hughes, C.S., Postovit, L.M. & Lajoie, G.A. Matrigel: a complex protein mixture required for optimal growth of cell culture. Proteomics 10, 1886-1890 (2010).
135. Novaro, V., Roskelley, C.D. & Bissell, M.J. Collagen-IV and laminin-1 regulate estrogen receptor α expression and function in mouse mammary epithelial cells. Journal of cell science 116, 2975-2986 (2003).
136. Kim, N.-G. & Gumbiner, B.M. Adhesion to fibronectin regulates Hippo signaling via the FAK–Src–PI3K pathway. The Journal of cell biology 210, 503-515 (2015).
137. Fernandez-Garcia, B. et al. Expression and prognostic significance of fibronectin and matrix metalloproteases in breast cancer metastasis. Histopathology 64, 512-522 (2014).
138. Mak, I.W.Y., Evaniew, N. & Ghert, M. Lost in translation: animal models and clinical trials in cancer treatment. American Journal of Translational Research 6, 114-118 (2014).
139. Bedard, P.L., Hansen, A.R., Ratain, M.J. & Siu, L.L. Tumour heterogeneity in the clinic. Nature 501, 355-364 (2013).
140. Scholz, M., Gatzek, S., Sterling, A., Fiehn, O. & Selbig, J. Metabolite fingerprinting: detecting biological features by independent component analysis. Bioinformatics 20, 2447 - 2454 (2004).

! 68!
Chapter 7: Figures and figure legends

! 69!
Figure 1. Substrata elastic modulus is a modifier of lapatinib responses in
HER2-amplified cancer cells.
Bar graphs showing the relative incorporation of EdU expressed as a percentage
of DMSO-treated cells in: (A) HCC1569 and BT549 cultured on 2D tissue culture
plastic (TCP) dishes or 3D in Matrigel for 48 h, and then treated with lapatinib or
DMSO for 48 h (n = 3, 500 cells/condition/experiment, * p < 0.05). (B)
Representative images of HCC1569 and BT549 cultured on 2D TCP or in 3D
Matrigel. EdU is pseudocolored red, and nuclear DNA is blue. (C) Bar graphs
showing relative incorporation of EdU expressed as a percentage of DMSO-
treated cells. HCC1569 and BT549 cultured on 2D TCP or 400 Pa
polyacrylamide (PA) gels for 48 h, followed by lapatinib (1.5 µM) or DMSO for 48
h (n = 3, 500 cells/condition/experiment, * p < 0.05). (D) Representative images
of HCC1569 and BT549 cultured on 2D TCP or 400 Pa PA gels. EdU is
pseudocolored red, and nuclear DNA is blue. Scale bars represent 20 µm. (E)
Dose-response curves used to calculate IC50 of lapatinib in HCC1569 cultured
on 400 Pa PA gel (0.94 µM) versus 2D TCP (2.66 µM). (n = 3, 500
cells/condition/experiment, * p < 0.05)39.

! 70!
Figure 1
E"
10-4 10-2 100 10200
50
100
Lapatinib (µM)
EdU
inco
rpor
atio
n(%
DM
SO c
ontro
l)
PA gel (400 Pa)2D TCP (>2 GPa)
Nuc
leus
EdU
DMSO Lapatinib
3D Matrigel (400 Pa)
EdU
DMSO Lapatinib
2D TCP (>2 GPA)
Nuc
leus
EdU
E
dU
HC
C15
69
BT5
49
DMSO Lapatinib
PA gel (400 Pa)
DMSO Lapatinib
2D TCP (>2 GPA)
Nuc
leus
EdU
E
dU
Nuc
leus
EdU
E
dU
HC
C15
69
BT5
49
A" B"
C" D"
BT549 HCC15690
50
100
EdU
inco
rpor
atio
n(%
DM
SO c
ontro
l)
PA gel (400 Pa)2D TCP (>2 GPa)
*
(HER2 -)� (HER2 +)�
BT549 HCC15690
50
100
EdU
inco
rpor
atio
n(%
DM
SO c
ontro
l)
3D Matrigel (400 Pa)2D TCP (>2 GPa)
(HER2 -)� (HER2 +)�
*

! 71!
Figure 2. Inhibition of ROCK1/2 and myosin II increases resistance to
lapatinib on compliant substrata but has no effect in 3D matrigel.
Bar graphs showing the relative incorporation of EdU expressed as a percentage
of DMSO-treated cells in response to 1.5mM lapatinib on 400 Pa or >2 GPa
substrata in the presence of (A) Y27632 (10mM) or (B) blebbistatin (10mM). Bar
graphs showing relative incorporation of EdU expressed as a percentage of
DMSO-treated cells in response to 1.5mM lapatinib on 400 Pa or Matrigel
substrata in the presence of (C) Y27632 (10mM) or (D) blebbistatin (10mM) *
indicates p < 0.05.
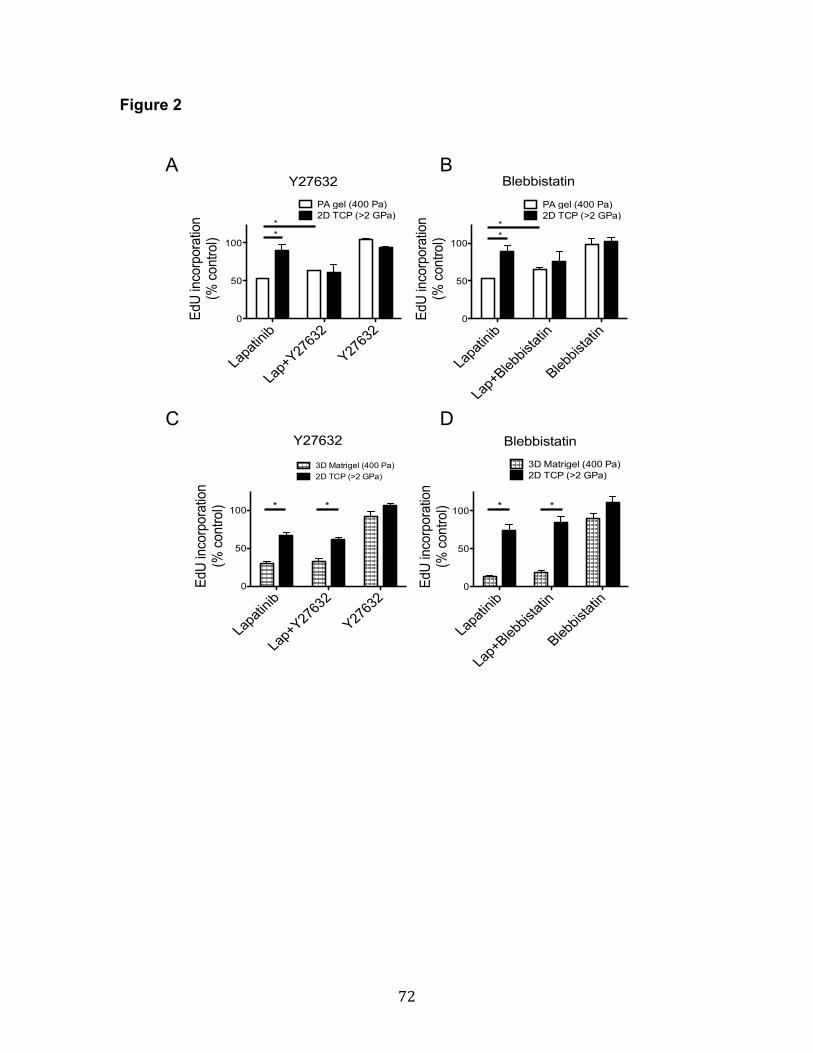
! 72!
Figure 2
Blebbistatin
Lapa
tinib
Lap+
Blebbis
tatin
Blebbis
tatin
0
50
100
EdU
inco
rpor
atio
n(%
con
trol)
3D Matrigel (400 Pa)2D TCP (>2 GPa)
Y27632
Lapa
tinib
Lap+
Y2763
2
Y2763
20
50
100
EdU
inco
rpor
atio
n(%
con
trol)
3D Matrigel (400 Pa)2D TCP (>2 GPa)
Blebbistatin
Lapa
tinib
Lap+
Blebbis
tatin
Blebbis
tatin
0
50
100
EdU
inco
rpor
atio
n(%
con
trol)
PA gel (400 Pa)2D TCP (>2 GPa)
Y27632
Lapa
tinib
Lap+
Y2763
2
Y2763
20
50
100
EdU
inco
rpor
atio
n(%
con
trol)
PA gel (400 Pa)2D TCP (>2 GPa)
A
* * * *
* * * *
C
B
D

! 73!
Figure 3. YAP and TAZ are required for the modulus-dependent lapatinib
responses.
(A) Representative images of HCC1569 after 48 h cultured on substrata of
increasing stiffness: immunofluorescence stains represent YAP (green), TAZ
(red), and nucleus (blue). Scale bars represent 20 µm. (B) Bar graphs showing
the proportions of single cells in which YAP and TAZ were located in the nucleus,
cytoplasm, or evenly distributed in both compartments, as a function of stiffness
(n = 3, 100 cells/condition/ experiment, * p < 0.05). (C) Bar graphs showing the
relative incorporation of EdU in HCC1569 cultured on 2D TCP and 400 Pa PA
gel with YAP or TAZ knockdown by siRNA for 72 h, and then treated with
lapatinib (1.5 µM) or DMSO for 48 h. Results are expressed as a percentage of
cells treated with DMSO and non-silencing control (NSC) siRNA-treated cells (n
= 3, 500 cells/condition/experiment, * p < 0.05), (D) Bar graphs showing relative
incorporation of EdU in HCC1569 cultured on 400 Pa and 40 kPa PA gels for 48
h, and then treated with lapatinib (1.5 µM) together with verteporfin (2 µg/mL), or
DMSO for 48 h. Results expressed as percentage of DMSO treated controls (n =
3, 500/condition/experiment, * p < 0.05)39.

! 74!
Figure 3
C D
YAP
TAZ
Nuc
leus
TAZ
YAP
400 Pa 2500 Pa 4400 Pa 40 kPa TCP (>2 GPa)
400 P
a
2500
Pa
4400
Pa
40 kP
a
TCP (>2 G
Pa)0
50
100
% o
f Tot
al c
ells
TAZ
N>CN=CC>N
400 P
a
2500
Pa
4400
Pa
40 kP
a
TCP (>2 G
Pa)0
50
100
% o
f Tot
al c
ells
YAP
N>CN=CC>N
*
*
Lapa
tinib
Lap+
VP
Vertep
orfin
0
50
100
EdU
inco
rpor
atio
n(%
DM
SO c
ontro
l)400 Pa40 kPa*
Lap+
NSC
Lap+
siTAZ
siTAZ
0
50
100
EdU
inco
rpor
atio
n(%
DM
SO+N
SC c
ontro
l) 400 PaTCP (>2 GPa)
Lap+
NSC
Lap+
siYAP
siYAP
0
50
100
EdU
inco
rpor
atio
n(%
DM
SO+N
SC c
ontro
l) 400 PaTCP (>2 GPa)
* *
*
* *
*
A B

! 75!
Figure 4. YAP knockdown has synergistic trend of inhibition with lapatinib
in vivo.
Tumor volume curves as a function of time and the summary table of area under
curve (AUC) data for different treatment groups. The tumor volume was
measured during the course of lapatinib treatment on mice that did not receive
IPTG or lapatinib (group A), mice treated with IPTG only (group B), mice treated
with lapatinib only (group C), and mice treated with lapatinib together with IPTG
(group D)39.

! 76!
Figure 4
0 5 10 15 20 250
500
1000
1500
2000 No IPTGwith IPTGNo IPTG +Lapatinibwith IPTG +Lapatinib
Days after start lapatinb
Tum
or V
olum
e (m
m3 )
ABCD
*
*
Number of values
Minimum25% PercentileMedian75% PercentileMaximum
MeanStd. DeviationStd. Error
Lower 95% CIUpper 95% CI
No IPTG9
1194712757158202129924153
1668047471582
1303120328
with IPTG 10
4480617777201086214308
83723069970.5
617710567
No IPTG +Lapatinib10
11492626581171587368
49382359745.9
32506625
with IPTG +Lapatinib10
17512843380153507334
41711859587.8
28415501S
umm
ary
of A
UC
dat
a

! 77!
Figure 5. YAP-dependent amphiregulin protein regulation is involved in the
modulus-dependent lapatinib responses.
Bar graphs showing (A) AREG mRNA expression level measured by qRT-PCR
and (B) cell surface AREG measured by FACS in HCC1569 on TCP or 400 Pa
PA gels for 96 h (n = 3, 10000 cells/condition/experiment, * p < 0.05). (C) Bar
graphs showing the proportions of single cells in which YAP and TAZ were
located in the nucleus, cytoplasm, or evenly distributed in both compartments, as
a function of stiffness in HCC1569 cultured on TCP or 400 Pa PA gel for 48 h,
and then treated with AREG (5 ng/mL) for 48 h (n = 3, 100
cells/condition/experiment, * p < 0.05). (D) Bar graphs showing the relative
incorporation of EdU, expressed as a percentage of DMSO-treated cells in
HCC1569 cultured on TCP or 400 Pa PA gels for 48 h, and then treated with
lapatinib (1.5 mM), AREG (5 ng/mL), and erlotinib (1.5 mM) for 48 h (n = 3, 500
cells/condition/experiment, * p < 0.05). (E) Bar graphs showing intracellular
AREG protein levels measured by ELISA in HCC1569 with NSC siRNA or YAP
knockdown by siRNA for 72 h (n = 3, * p < 0.05). (F) Bar graphs show the relative
incorporation of EdU, expressed as a percentage of (DMSO and NSC siRNA)-
treated cells in HCC1569 cultured on 400 Pa and 40 kPa PA gel with AREG
knockdown by siRNA for 72 h, and then treated with lapatinib (1.5 µM) or DMSO
for 48 h (n = 3, 500 cells/condition/experiment, * p < 0.05)39.

! 78!
Figure 5
400 Pa TCP (>2 GPa)0.00
0.05
0.10
0.15
0.20
0.25
mR
NA
of A
REG
(Rel
ativ
e to
GAP
DH
)
A" B" C"
D" E" F"
Lap+
NSC
Lap+
siAREG
siAREG
0
50
100
EdU
inco
rpor
atio
n(%
DM
SO+N
SC c
ontro
l) 400 Pa40 kPa
* *
400 Pa TCP (>2 GPa)0
50
100
EdU
inco
rpor
atio
n(%
DM
SO c
ontro
l)
LapatinibLap+AREGLap+AREG+Erlotinib
* *
400 Pa TCP (>2 GPa)0.90
0.95
1.00
1.05
1.10
AR
EG
(Nor
mal
ized
by
TC
P)
*
DMSOAREG
DMSOAREG
0
50
100
% o
f Tot
al c
ells
N>CN=CC>N
400 Pa TCP (>2 GPa)
*
NSC siYAP0.0
0.5
1.0
AR
EG
(Nor
mal
ized
by
NS
C)
*
! 79!
Figure 6. Knockdown efficiency in siRNA experiments.
(A) Expression levels of YAP and TAZ measured by qRT-PCR in HCC1569 with
NSC siRNA, YAP or TAZ knockdown by siRNA for 72 h. (B) Fold change of
expression levels of various receptors and ligands of the HER family were
measured by qRT-PCR in HCC1569 with NSC siRNA or AREG knockdown by
siRNA after 72 h39.
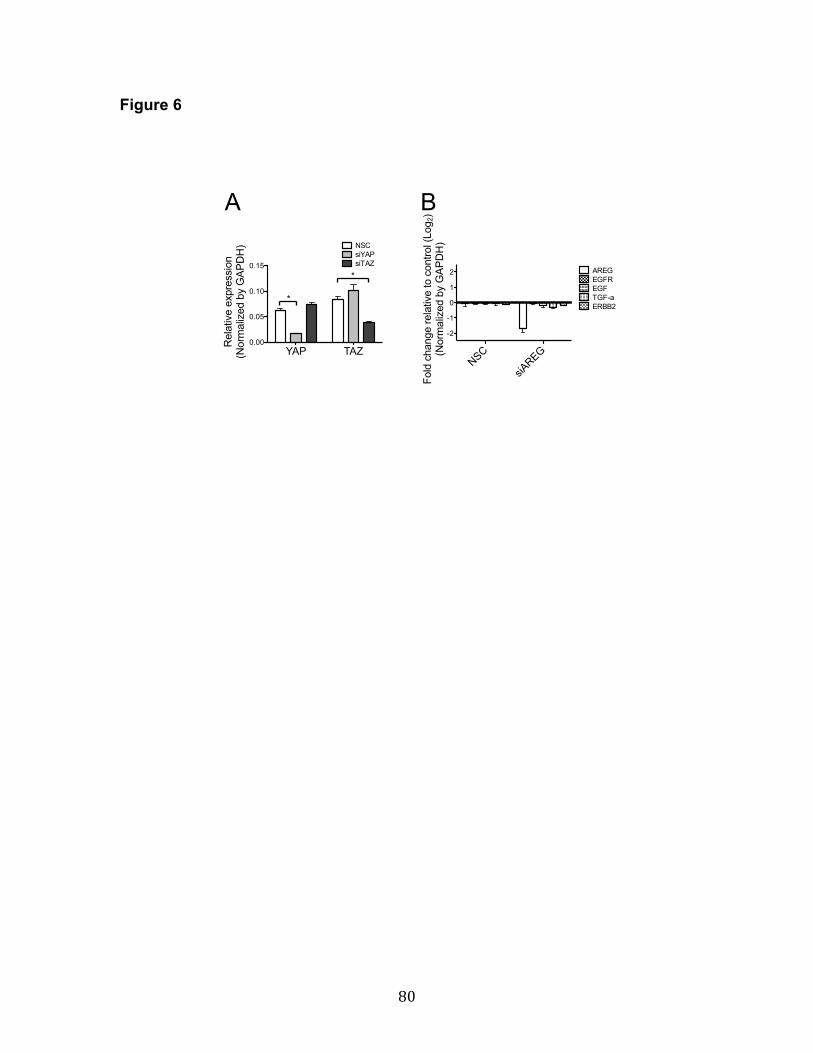
! 80!
Figure 6
NSC
siAREG
-2
-1
0
1
2
Fold
cha
nge
rela
tive
to c
ontro
l (Lo
g 2)
(Nor
mal
ized
by
GAP
DH)
AREGEGFREGFTGF-aERBB2
B A
YAP TAZ0.00
0.05
0.10
0.15
Rel
ativ
e ex
pres
sion
(Nor
mal
ized
by
GAP
DH
) NSCsiYAPsiTAZ
*
*

! 81!
Figure 7. Verteporfin has a synergistic effect with lapatinib.
Line graphs show the relative incorporation of EdU, expressed as a percentage
of DMSO-treated cells in HCC1569 cultured on 400 Pa or 40 kPa PA gels for 48
h, and then treated with lapatinib (1.5 µM) together with verteporfin (0, 0.2, 2, 10
µg/mL), or DMSO for 48 h. (n = 3, 500 cells/condition/experiment, * p < 0.05)39.

! 82!
Figure 7
0 0.2 2 100
50
100
EdU
inco
rpor
atio
n(%
DM
SO c
ontro
l)
Lap 0 µMLap 1.5 µMLap 0 µMLap 1.5 µM
µg/mL0 0.278 2.78 13.9µM
**
400 Pa
40 kPa

! 83!
Figure 8. Correlation between YAP gene expression with expression of a
number of Hippo and HER-related genes in the TCGA dataset.
Summary table showing correlation between YAP and ERBB2 gene expression
with the other indicated genes. Pearson’s r statistic is shown. Below, regression
plots showing examples of the fit for all tumor types39.
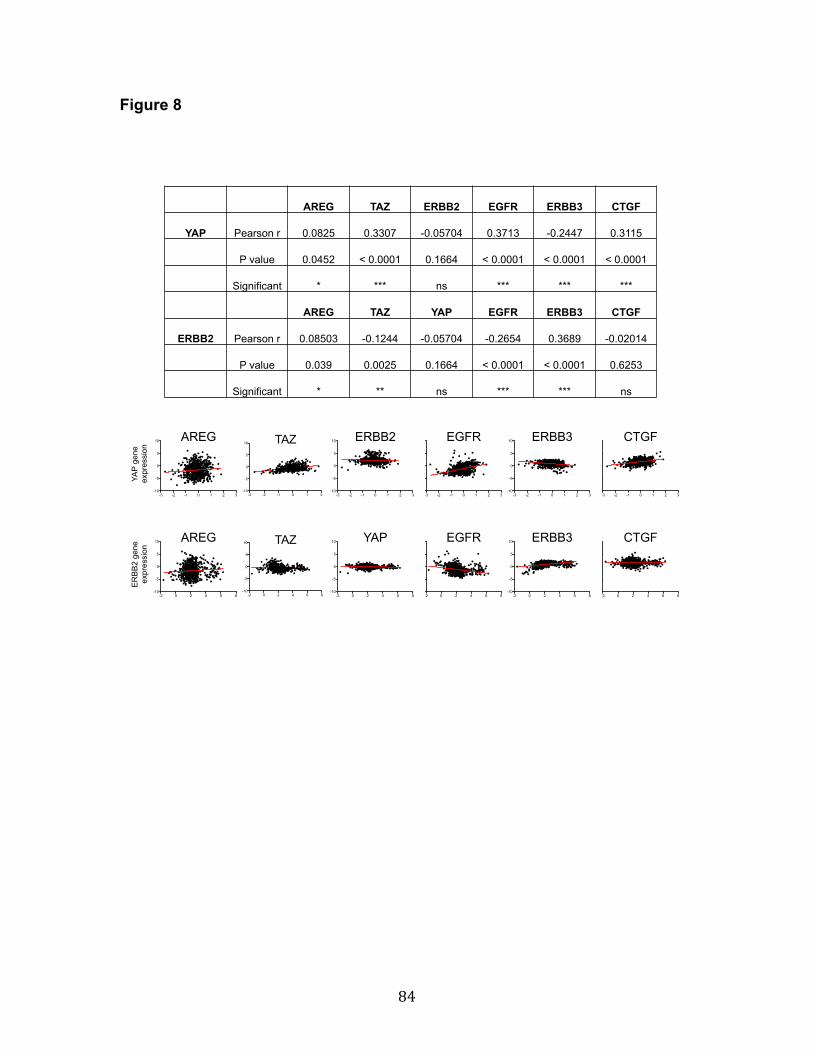
! 84!
Figure 8
AREG TAZ ERBB2 EGFR ERBB3 CTGF
YAP Pearson r 0.0825 0.3307 -0.05704 0.3713 -0.2447 0.3115
P value 0.0452 < 0.0001 0.1664 < 0.0001 < 0.0001 < 0.0001
Significant * *** ns *** *** ***
AREG TAZ YAP EGFR ERBB3 CTGF
ERBB2 Pearson r 0.08503 -0.1244 -0.05704 -0.2654 0.3689 -0.02014
P value 0.039 0.0025 0.1664 < 0.0001 < 0.0001 0.6253
Significant * ** ns *** *** ns
AREG
-3 -2 -1 0 1 2 3-10
-5
0
5
10 CTGF
-3 -2 -1 0 1 2 3-10
-5
0
5
10EGFR
-3 -2 -1 0 1 2 3-10
-5
0
5
10ERBB2
-3 -2 -1 0 1 2 3-10
-5
0
5
10 ERBB3
-3 -2 -1 0 1 2 3-10
-5
0
5
10
AREG
-2 0 2 4 6 8-10
-5
0
5
10 CTGF
-2 0 2 4 6 8-10
-5
0
5
10EGFR
-2 0 2 4 6 8-10
-5
0
5
10 ERBB3
-2 0 2 4 6 8-10
-5
0
5
10YAP
-2 0 2 4 6 8-10
-5
0
5
10
YAP
gen
e
expr
essi
on
ER
BB
2 ge
ne
expr
essi
on
-3 -2 -1 0 1 2-10
-5
0
5
10 TAZ
-2 0 2 4 6 8-10
-5
0
5
10 TAZ

! 85!
Figure 9. Responses to changes in microenvironmental stiffness for 49
different receptor tyrosine kinases (RTK).
(A) Images of RTK array membranes that were probed with extracts from
HCC1569 cells. HCC1569 were grown for 48 h on 400 Pa or 40 kPa PA gel for
48 h, treated with lapatinib (1.5 µM) or DMSO, and then harvested at 1 h or 48 h
after lapatinib treatment. (B) Bar graphs showing quantification of intensity of
phosphorylation on EGFR, HER2, HER3, VEGFR1, and RYK RTKs. (C) A
complete table of the RTKs represented on the blot39.

! 86!
Figure 9
A
B 1 hr after lapatinib treatment
pEGFR
pHER2
pHER3
pVEGFR1
pRYK
0
1
2
3
Arbi
trary
uni
t(N
orm
aliz
ed to
pEG
FR in
400
Pa
DM
SO)
400 Pa DMSO400 Pa Lapatinib40 kPa DMSO40 kPa Lapatinib
48 hr after lapatinib treatment
pEGFR
pHER2
pHER3
pVEGFR1
pRYK
0
1
2
3
Arbi
trary
uni
t(N
orm
aliz
ed to
pEG
FR in
400
Pa
DM
SO)
400 Pa DMSO400 Pa Lapatinib40 kPa DMSO40 kPa Lapatinib
48 hr after lapatinib treatment
pEGFR
pHER2
pHER3
pVEGFR1
pRYK
0
1
2
3
Arbi
trary
uni
t(N
orm
aliz
ed to
pEG
FR in
400
Pa
DM
SO)
400 Pa DMSO400 Pa Lapatinib40 kPa DMSO40 kPa Lapatinib
1 hr 1: pRYK 2: pVEGFR1 3: pEGFR 4: pHER2 5: pHER3
1: pEphB3 2: pRYK 3: pEGFR 4: pHER2 5: pHER3
48 hr
C Human Phospho-RTK Array Coordinates

! 87!
Figure 10. A flow chart of the MEArray procedure.
First, the printing substrata are prepared either with PDMS or PA. Second, the
master plates are prepared and annotated in a database. Third, the MEArrays
are printed and encoded with serial numbers. Fourth, culture chambers are
attached, surfaces are blocks and/or rinsed, then cells are allowed to attach and
unbound cells are washed away64.

! 88!
Figure 10

! 89!
Figure 11. Deposition and relative abundance of printed proteins can be
verified with immunostaining prior to cell attachment.
Antibodies that recognized type IV collagen and laminin-111 were used to verify
their presence in printed features of an MEArray64.

! 90!
Figure 11

! 91!
Figure 12. Deposition and relative abundance of printed proteins can be
verified with immunostaining prior to cell attachment.
Using an average pixel intensity analysis feature in NIH ImageJ software, the
relative abundance of the two proteins across a series of dilutions, starting from a
200 mg/mL protein solution, can be qualitatively assessed64.

! 92!
Figure 12

! 93!
Figure 13. Deposition and relative abundance of printed proteins can be
verified with immunostaining prior to cell attachment.
Phase micrograph of D920 cells attached to square-shaped features of a printed
PDMS-coated MEArray64.

! 94!
Figure 13

! 95!
Figure 14. An example of an MEArray analysis using changes in keratin
expression in a multipotent progenitor cell line as a functions of time and
microenvironment.
Each bubble represents ratios of keratin 8 and keratin 14 protein levels from 10-
15 cells attached to a feature in a MEArray. It shows the keratin ratios after 24
hours on an array that was plated in parallel. The maximum concentration of
both proteins was 200mg/mL and diluted 2-fold. The diameter of a bubble
represents the magnitude of the log2 ratio of keratin 8 and keratin 14 mean
intensity, and the orange and white color-coding indicates values >0 and <0,
respectively. F-values for one-way ANOVA and P-values from T-tests, and
brackets with arrows identifying the populations compared, are shown64.

! 96!
Figure 14
[Col
lage
n I]
[P-c
adhe
rin]
P=N
S
F=1.1 F=2.5
A B 0 hours 24 hours
Replicate dilution series Replicate dilution series

! 97!
Figure 15. An example of an MEArray scan acquired using a tiled
acquisition mode on a laser scanning confocal microscope.
HCC1569 cells we allowed to incorporate the DNA analog EdU for 4 hour prior to
fixation. DAPI (blue) and EdU (red) are shown64.

! 98!
Figure 15
HCC1569 on 40,000Pa PA gel MEArray Blue = DAPI, Red = EdU

! 99!
Figure 16. Both molecular compositions and matrix rigidity alter
morphological features.
(A) A summary for a MEArray experiment. The total defined conditions were
constructed by 4 Major ECM, 7 recombinant proteins, 2 matrix rigidity, and 2 drug
treatments plus DMSO as control. The outcomes are cellular morphological
measurements, immunofluorescence staining of targeted proteins, and functional
analysis. (B) A representative image of MEArray. ViSNE was used for
visualization of MEArray data. Each dot represents one defined
microenvironment and color represents either (C) matrix rigidity or (D) major
ECM composition. PCA analysis was used for identifying major variants. Each
dot represents one defined microenvironment, and color represents either (E)
matrix rigidity or (F) major ECM composition.

! 100!
Figure 16
ECM Tyep I collagen (C1) Fibronectin (FN) Type IV collagen (C4) Laminin I (L1) Mix of L1 and C1 (L1C1)
AREG IL6 EGF IL8 Gas6 TGFb HGF
Proteins
2500 Pa 40 kPa
Matrix rigidity Molecular compositions
XX
Treatments
DMSO Lapatinib (Lap) Lap + Verteporfin
X
5 x 7 x 2 x 3 = 210 combinations
Input
Cellular morphology HER2 pHER2
EdU incorporation (Proliferation)
Morphological feature Protein Cell function Output
●
●
●
●
●
●
●
●
●
●
●
●
●
●
●
●
●
●
●
●
●
●
●
●
●
●
●
●
●
●
●●
●●
●
●
●
●
●
●
●
●
●
●
●
●
●
●●
●●
●
●
●
●●
● ●
●●
●
●
C1AREG 2500Pa
C1Buffer 2500Pa
C1C4 2500Pa
C1EGF 2500Pa
C1FN 2500Pa
C1FNEGF 2500Pa
C1Gas6 2500Pa
C1HGF 2500Pa
C1IL6 2500Pa
C1IL8 2500Pa
C1L1 2500Pa
C1L1C1 2500Pa
C1TGFb 2500Pa
C4AREG 2500Pa
C4Buffer 2500Pa
C4C1 2500Pa
C4EGF 2500Pa
C4FN 2500Pa
C4Gas6 2500Pa
C4HGF 2500Pa
C4IL6 2500Pa
C4IL8 2500Pa
C4L1 2500Pa
C4L1C1 2500Pa
C4TGFb 2500Pa
FNAREG 2500Pa
FNC1 2500Pa
FNC4 2500Pa
FNEGF 2500Pa
FNFN 2500Pa
FNGas6 2500PaFNHGF 2500Pa
FNIL6 2500PaFNIL8 2500Pa
FNL1 2500Pa
FNL1C1 2500Pa
FNTGFb 2500Pa
L1AREG 2500Pa
L1Buffer 2500Pa
L1C1 2500Pa
L1C1AREG 2500Pa
L1C1Buffer 2500Pa
L1C1C1 2500Pa
L1C1C4 2500Pa
L1C1EGF 2500Pa
L1C1FN 2500Pa
L1C1FNTGFb 2500Pa
L1C1Gas6 2500PaL1C1HGF 2500Pa
L1C1IL6 2500PaL1C1IL8 2500Pa
L1C1L1 2500Pa
L1C1TGFb 2500Pa
L1C4 2500Pa
L1EGF 2500PaL1FN 2500Pa
L1Gas6 2500PaL1HGF 2500Pa
L1IL6 2500PaL1IL8 2500Pa
L1L1C1 2500Pa
L1TGFb 2500Pa
C1AREG 40kPa
C1Buffer 40kPa
C1C4 40kPaC1EGF 40kPa
C1FN 40kPa
C1FNEGF 40kPa
C1Gas6 40kPa
C1HGF 40kPa
C1IL6 40kPa
C1IL8 40kPa
C1L1 40kPa
C1L1C1 40kPa
C1TGFb 40kPa
C4AREG 40kPa
C4Buffer 40kPa
C4C1 40kPa
C4EGF 40kPa
C4FN 40kPa
C4Gas6 40kPa
C4HGF 40kPa
C4IL6 40kPa
C4IL8 40kPa
C4L1 40kPa
C4L1C1 40kPa
C4TGFb 40kPa
FNAREG 40kPa
FNC1 40kPa
FNC4 40kPa
FNEGF 40kPa
FNFN 40kPa
FNGas6 40kPa
FNHGF 40kPa
FNIL6 40kPa
FNIL8 40kPa
FNL1 40kPa
FNL1C1 40kPa
FNTGFb 40kPa
L1AREG 40kPa
L1Buffer 40kPa
L1C1 40kPa
L1C1AREG 40kPa
L1C1Buffer 40kPa
L1C1C1 40kPa
L1C1C4 40kPa
L1C1EGF 40kPaL1C1FN 40kPa
L1C1FNTGFb 40kPa
L1C1Gas6 40kPa
L1C1HGF 40kPaL1C1IL6 40kPaL1C1IL8 40kPa
L1C1L1 40kPa
L1C1TGFb 40kPa
L1C4 40kPaL1EGF 40kPa
L1FN 40kPa
L1Gas6 40kPa
L1HGF 40kPaL1IL6 40kPa
L1IL8 40kPa
L1L1C1 40kPaL1TGFb 40kPa
●2500Pa
40kPa
−6
−3
0
3
6
−10 −5 0 5 10Dim1 (64.5%)
Dim
2 (1
5%)
Groups●a●a
aa
2500Pa
40kPa
Individuals factor map − PCA
●
●
●
●
●
●
●
●
●
●
●
●
●
●
●
●
●
●
●
●
●
●
●
●
●
●
●
●
●
●
●●
●●
●
●
●
●
●
●
●
●
●
●
●
●
●
●●
●●
●
●
●
●●
● ●
●●
●
●
C1AREG 2500Pa
C1Buffer 2500Pa
C1C4 2500Pa
C1EGF 2500Pa
C1FN 2500Pa
C1FNEGF 2500Pa
C1Gas6 2500Pa
C1HGF 2500Pa
C1IL6 2500Pa
C1IL8 2500Pa
C1L1 2500Pa
C1L1C1 2500Pa
C1TGFb 2500Pa
C4AREG 2500Pa
C4Buffer 2500Pa
C4C1 2500Pa
C4EGF 2500Pa
C4FN 2500Pa
C4Gas6 2500Pa
C4HGF 2500Pa
C4IL6 2500Pa
C4IL8 2500Pa
C4L1 2500Pa
C4L1C1 2500Pa
C4TGFb 2500Pa
FNAREG 2500Pa
FNC1 2500Pa
FNC4 2500Pa
FNEGF 2500Pa
FNFN 2500Pa
FNGas6 2500PaFNHGF 2500Pa
FNIL6 2500PaFNIL8 2500Pa
FNL1 2500Pa
FNL1C1 2500Pa
FNTGFb 2500Pa
L1AREG 2500Pa
L1Buffer 2500Pa
L1C1 2500Pa
L1C1AREG 2500Pa
L1C1Buffer 2500Pa
L1C1C1 2500Pa
L1C1C4 2500Pa
L1C1EGF 2500Pa
L1C1FN 2500Pa
L1C1FNTGFb 2500Pa
L1C1Gas6 2500PaL1C1HGF 2500Pa
L1C1IL6 2500PaL1C1IL8 2500Pa
L1C1L1 2500Pa
L1C1TGFb 2500Pa
L1C4 2500Pa
L1EGF 2500PaL1FN 2500Pa
L1Gas6 2500PaL1HGF 2500Pa
L1IL6 2500PaL1IL8 2500Pa
L1L1C1 2500Pa
L1TGFb 2500Pa
C1AREG 40kPa
C1Buffer 40kPa
C1C4 40kPaC1EGF 40kPa
C1FN 40kPa
C1FNEGF 40kPa
C1Gas6 40kPa
C1HGF 40kPa
C1IL6 40kPa
C1IL8 40kPa
C1L1 40kPa
C1L1C1 40kPa
C1TGFb 40kPa
C4AREG 40kPa
C4Buffer 40kPa
C4C1 40kPa
C4EGF 40kPa
C4FN 40kPa
C4Gas6 40kPa
C4HGF 40kPa
C4IL6 40kPa
C4IL8 40kPa
C4L1 40kPa
C4L1C1 40kPa
C4TGFb 40kPa
FNAREG 40kPa
FNC1 40kPa
FNC4 40kPa
FNEGF 40kPa
FNFN 40kPa
FNGas6 40kPa
FNHGF 40kPa
FNIL6 40kPa
FNIL8 40kPa
FNL1 40kPa
FNL1C1 40kPa
FNTGFb 40kPa
L1AREG 40kPa
L1Buffer 40kPa
L1C1 40kPa
L1C1AREG 40kPa
L1C1Buffer 40kPa
L1C1C1 40kPa
L1C1C4 40kPa
L1C1EGF 40kPaL1C1FN 40kPa
L1C1FNTGFb 40kPa
L1C1Gas6 40kPa
L1C1HGF 40kPaL1C1IL6 40kPaL1C1IL8 40kPa
L1C1L1 40kPa
L1C1TGFb 40kPa
L1C4 40kPaL1EGF 40kPa
L1FN 40kPa
L1Gas6 40kPa
L1HGF 40kPaL1IL6 40kPa
L1IL8 40kPa
L1L1C1 40kPaL1TGFb 40kPa
●2500Pa
40kPa
−6
−3
0
3
6
−10 −5 0 5 10Dim1 (64.5%)
Dim
2 (1
5%)
Groups●a●a
aa
2500Pa
40kPa
Individuals factor map − PCA
PC1
PC
2
●
●
●
●
●
●
●
●
●
●
●
●
●
●
●
●●
●
●
●
●
●
●
●
●
●
C1AREG 2500Pa
C1Buffer 2500Pa
C1C4 2500Pa
C1EGF 2500Pa
C1FN 2500Pa
C1FNEGF 2500Pa
C1Gas6 2500Pa
C1HGF 2500Pa
C1IL6 2500Pa
C1IL8 2500Pa
C1L1 2500Pa
C1L1C1 2500Pa
C1TGFb 2500Pa
C4AREG 2500Pa
C4Buffer 2500Pa
C4C1 2500Pa
C4EGF 2500Pa
C4FN 2500Pa
C4Gas6 2500Pa
C4HGF 2500Pa
C4IL6 2500Pa
C4IL8 2500Pa
C4L1 2500Pa
C4L1C1 2500Pa
C4TGFb 2500Pa
FNAREG 2500Pa
FNC1 2500Pa
FNC4 2500Pa
FNEGF 2500Pa
FNFN 2500Pa
FNGas6 2500PaFNHGF 2500Pa
FNIL6 2500PaFNIL8 2500Pa
FNL1 2500PaFNL1C1 2500Pa
FNTGFb 2500Pa
L1AREG 2500Pa
L1Buffer 2500Pa
L1C1 2500Pa
L1C1AREG 2500Pa
L1C1Buffer 2500Pa
L1C1C1 2500Pa
L1C1C4 2500Pa
L1C1EGF 2500Pa
L1C1FN 2500Pa
L1C1FNTGFb 2500Pa
L1C1Gas6 2500PaL1C1HGF 2500Pa
L1C1IL6 2500PaL1C1IL8 2500Pa
L1C1L1 2500Pa
L1C1TGFb 2500Pa
L1C4 2500Pa
L1EGF 2500PaL1FN 2500PaL1Gas6 2500PaL1HGF 2500Pa
L1IL6 2500PaL1IL8 2500Pa
L1L1C1 2500Pa
L1TGFb 2500Pa
C1AREG 40kPa
C1Buffer 40kPa
C1C4 40kPaC1EGF 40kPa
C1FN 40kPa
C1FNEGF 40kPa
C1Gas6 40kPa
C1HGF 40kPa
C1IL6 40kPa
C1IL8 40kPa
C1L1 40kPa
C1L1C1 40kPa
C1TGFb 40kPa
C4AREG 40kPa
C4Buffer 40kPa
C4C1 40kPa
C4EGF 40kPa
C4FN 40kPa
C4Gas6 40kPa
C4HGF 40kPa
C4IL6 40kPa
C4IL8 40kPa
C4L1 40kPa
C4L1C1 40kPa
C4TGFb 40kPa
FNAREG 40kPa
FNC1 40kPa
FNC4 40kPa
FNEGF 40kPa
FNFN 40kPa
FNGas6 40kPa
FNHGF 40kPa
FNIL6 40kPa
FNIL8 40kPa
FNL1 40kPa
FNL1C1 40kPa
FNTGFb 40kPa
L1AREG 40kPa
L1Buffer 40kPa
L1C1 40kPa
L1C1AREG 40kPa
L1C1Buffer 40kPa
L1C1C1 40kPa
L1C1C4 40kPa
L1C1EGF 40kPaL1C1FN 40kPa
L1C1FNTGFb 40kPa
L1C1Gas6 40kPa
L1C1HGF 40kPaL1C1IL6 40kPaL1C1IL8 40kPa
L1C1L1 40kPa
L1C1TGFb 40kPa
L1C4 40kPaL1EGF 40kPa
L1FN 40kPa
L1Gas6 40kPa
L1HGF 40kPaL1IL6 40kPa
L1IL8 40kPa
L1L1C1 40kPaL1TGFb 40kPa
●C1
C4
FNL1
L1C1
−4
0
4
−5 0 5 10 15Dim1 (64.5%)
Dim
2 (1
5%)
Groups●a●a
aa
aa
aa
aa
C1
C4
FN
L1
L1C1
Individuals factor map − PCA
●
●
●
●
●
●
●
●
●
●
●
●
●
●
●
●●
●
●
●
●
●
●
●
●
●
C1AREG 2500Pa
C1Buffer 2500Pa
C1C4 2500Pa
C1EGF 2500Pa
C1FN 2500Pa
C1FNEGF 2500Pa
C1Gas6 2500Pa
C1HGF 2500Pa
C1IL6 2500Pa
C1IL8 2500Pa
C1L1 2500Pa
C1L1C1 2500Pa
C1TGFb 2500Pa
C4AREG 2500Pa
C4Buffer 2500Pa
C4C1 2500Pa
C4EGF 2500Pa
C4FN 2500Pa
C4Gas6 2500Pa
C4HGF 2500Pa
C4IL6 2500Pa
C4IL8 2500Pa
C4L1 2500Pa
C4L1C1 2500Pa
C4TGFb 2500Pa
FNAREG 2500Pa
FNC1 2500Pa
FNC4 2500Pa
FNEGF 2500Pa
FNFN 2500Pa
FNGas6 2500PaFNHGF 2500Pa
FNIL6 2500PaFNIL8 2500Pa
FNL1 2500PaFNL1C1 2500Pa
FNTGFb 2500Pa
L1AREG 2500Pa
L1Buffer 2500Pa
L1C1 2500Pa
L1C1AREG 2500Pa
L1C1Buffer 2500Pa
L1C1C1 2500Pa
L1C1C4 2500Pa
L1C1EGF 2500Pa
L1C1FN 2500Pa
L1C1FNTGFb 2500Pa
L1C1Gas6 2500PaL1C1HGF 2500Pa
L1C1IL6 2500PaL1C1IL8 2500Pa
L1C1L1 2500Pa
L1C1TGFb 2500Pa
L1C4 2500Pa
L1EGF 2500PaL1FN 2500PaL1Gas6 2500PaL1HGF 2500Pa
L1IL6 2500PaL1IL8 2500Pa
L1L1C1 2500Pa
L1TGFb 2500Pa
C1AREG 40kPa
C1Buffer 40kPa
C1C4 40kPaC1EGF 40kPa
C1FN 40kPa
C1FNEGF 40kPa
C1Gas6 40kPa
C1HGF 40kPa
C1IL6 40kPa
C1IL8 40kPa
C1L1 40kPa
C1L1C1 40kPa
C1TGFb 40kPa
C4AREG 40kPa
C4Buffer 40kPa
C4C1 40kPa
C4EGF 40kPa
C4FN 40kPa
C4Gas6 40kPa
C4HGF 40kPa
C4IL6 40kPa
C4IL8 40kPa
C4L1 40kPa
C4L1C1 40kPa
C4TGFb 40kPa
FNAREG 40kPa
FNC1 40kPa
FNC4 40kPa
FNEGF 40kPa
FNFN 40kPa
FNGas6 40kPa
FNHGF 40kPa
FNIL6 40kPa
FNIL8 40kPa
FNL1 40kPa
FNL1C1 40kPa
FNTGFb 40kPa
L1AREG 40kPa
L1Buffer 40kPa
L1C1 40kPa
L1C1AREG 40kPa
L1C1Buffer 40kPa
L1C1C1 40kPa
L1C1C4 40kPa
L1C1EGF 40kPaL1C1FN 40kPa
L1C1FNTGFb 40kPa
L1C1Gas6 40kPa
L1C1HGF 40kPaL1C1IL6 40kPaL1C1IL8 40kPa
L1C1L1 40kPa
L1C1TGFb 40kPa
L1C4 40kPaL1EGF 40kPa
L1FN 40kPa
L1Gas6 40kPa
L1HGF 40kPaL1IL6 40kPa
L1IL8 40kPa
L1L1C1 40kPaL1TGFb 40kPa
●C1
C4
FNL1
L1C1
−4
0
4
−5 0 5 10 15Dim1 (64.5%)
Dim
2 (1
5%)
Groups●a●a
aa
aa
aa
aa
C1
C4
FN
L1
L1C1
Individuals factor map − PCA
PC1
PC
2 A
B
SNE-1
2500 Pa 40k Pa
SN
E-2
C
E D
F
SNE-1
SN
E-2
C1 C4 FN L1C1 L1
Molecular composition
350 µm

! 101!
Figure 17. The number of neighbor cells and cellular morphology were
highly impacted by microenvironments.
A PCA analysis showing the major variants, such as number of neighbor cells,
and cell morphology parameters, that were affected by microenvironments in the
first and second PCA axis. A bar graph showing the major variants in the first
dimension of PCA analysis.

! 102!
Figure 17
HER2CellArea
HER2CellCompactness
HER2CellEccentricity
HER2CellExtent
HER2CellFormFactor
HER2CellMajorAxisLengthHER2CellMaxFeretDiameter
HER2CellMaximumRadiusHER2CellMeanRadiusHER2CellMedianRadius
HER2CellMinFeretDiameterHER2CellMinorAxisLength
HER2CellPerimeter
HER2CellSolidity
HER2CellCorrelationCorrelationThreshRedThreshFarRed
HER2CellMedianIntensityThreshFarRed
HER2CellMedianIntensityThreshRed
HER2CellStdIntensityThreshFarRed
HER2CellStdIntensityThreshRed
HER2CellNeighborsAngleBetweenNeighborsAdjacent HER2CellNeighborsFirstClosestDistanceAdjacent
HER2CellNeighborsNumberOfNeighborsAdjacentHER2CellNeighborsPercentTouchingAdjacent
CorrelationCorrelationThreshRedThreshFarRed
CorrelationSlopeThreshRedThreshFarRed
EdU
HER2Status
Attachment
−0.4
0.0
0.4
−1.0 −0.5 0.0 0.5 1.0Dim1 (64.5%)
Dim
2 (1
5%)
5060708090
contrib
Variables factor map − PCA
0
2
4
HER2CellN
eighb
orsNum
berO
fNeighb
orsAdja
cent
HER2CellN
eighb
orsPerc
entTo
uchin
gAdja
cent
HER2CellP
erimete
r
HER2CellM
axim
umRad
ius
HER2CellM
inorAxis
Leng
th
HER2CellM
inFere
tDiamete
r
HER2CellF
ormFa
ctor
HER2CellM
eanR
adius
HER2CellN
eighb
orsAng
leBetw
eenN
eighb
orsAdja
cent
HER2CellA
rea
HER2CellM
edian
Radius
Attach
ment
HER2CellN
eighb
orsFirs
tCloses
tDistanc
eAdja
cent
HER2CellC
orrela
tionC
orrela
tionT
hresh
RedThre
shFa
rRed
HER2CellE
ccentr
icity
HER2CellM
edian
Inten
sityThre
shFa
rRed
EdU
Correla
tionS
lopeT
hresh
RedThre
shFa
rRed
HER2CellM
axFe
retDiam
eter
HER2CellM
edian
Inten
sityThre
shRed
HER2CellM
ajorAxis
Leng
th
HER2CellS
olidity
HER2CellC
ompa
ctnes
s
HER2Stat
us
HER2CellE
xtent
HER2CellS
tdInte
nsityT
hresh
Red
HER2CellS
tdInte
nsityT
hresh
FarR
ed
Correla
tionC
orrela
tionT
hresh
RedThre
shFa
rRed
Cont
ribut
ions
(%)
Contribution of variables to Dim−1

! 103!
Figure 18. The combined treatment of lapatinib and verteporfin had more
inhibition on cells cultured on 2500 Pa substrate. Each point in ViSNE plot
represents one defined microenvironment. Different color represents different
matrix rigidity and drug treatment (A), different molecular combination (B), or
different sensitivity to drug treatment (C). (D) The same data was normalized by
z-score (A z-score of 0 is the mean, and the positive and the negative z-score
indicating above or below the mean and by how many standard deviation), and
plotted as heat map. In heat map, different color represents different major ECM
in top-legend and represents lapatinib sensitivity in lower-legend (blue is
sensitive, and red is resistant). (E) The heat map was plotted as sub-groups.

! 104!
Figure 18
SN
E-2
SNE-1
2500 Pa Lap 2500 Pa LapVP 40 kPa Lap 40 kPa LapVP
SN
E-2
SNE-1
C1 C4 FN L1C1 L1
SN
E-2
SNE-1
Resistant Sensitive
A
2500 Pa 40 kPa Lapatinib Lapatinib + Veterporfin E
Sensitive Resistant
Molecular composition EdU incorporation % DMSO control
2500 Pa 40 kPa
D
B C
C1
L1C1
L1
C4
FN
No
EGF
Gas6
IL6
IL8
AREG HGF
TGFb
0 1
Condition
2500 Pa_Lap
2500 Pa_LapVP
40 kPa_Lap
40 kPa_LapVP
C1
C1I
L6L1
TGFb
C1A
REG
C1T
GFb
C1I
L8L1
Gas
6L1
HG
FC
4EG
F L1L1
EGF
C1E
GF
C4H
GF
L1C
1EG
FC
4IL8
L1C
1L1
C1I
L6L1
C1A
REG
L1C
1IL8
L1C
1TG
FbL1
AREG
L1C
1HG
FL1
C1G
as6
L1IL
6L1
IL8
C1H
GF
C4T
GFb
C4A
REG
C1G
as6
C4
FNG
as6
C4G
as6
FNC
4IL6
FNIL
6FN
TGFb
FNAR
EGFN
HG
FFN
IL8
FNEG
F
-1 0 1 2 3 4 5 6
Major ECMC1C4FNL1L1C1
C1
L1
L1C1
C4
FN
No
TGFb
EGF
AREG
Gas6
IL6
HGF
IL8
0 1 2 3 4
C1
C4
L1C1
FN
L1
No
IL8
Gas6
EGF
IL6
TGFb
AREG HGF
-1 0 1
C1
L1C1
C4
L1
FN
No
IL6
HGF
AREG IL8
TGFb
Gas6
EGF
0 1 2 3 4 5 6
Sensitive Resistant

! 105!
Figure 19. A systematic analysis of the microenvironmental impact on drug
responses.
A bar graph showing the individual effect of (A) recombinant protein, (B) drug
treatment, (C) Major ECM, and (D) matrix rigidity in drug responses. White bar
represents control and the dash line represents overall mean. (E~H) Heat maps
showing the effect of pair-wised interactions between each individual element of
microenvironment to drug responses.

! 106!
Figure 19
Other Proteins
Major ECM Stiffness
Treatments
50 100
AREGBuf
EGFGas6HGF
IL6IL8
TGFb
EdU Incorporation% DMSO
AREGBufEGFGas6HGFIL6IL8
50 100
C1
C4
FN
L1
L1C1
EdU Incorporation% DMSO
C1C4FNL1L1C1
50 100
2500 Pa
40 kPa
EdU Incorporation% DMSO
2500 Pa40 kPa
50 100
Lapatinib
LapVP
EdU Incorporation% DMSO
LapatinibLapVP
**
***
**
G
F
E
H
A B
C D
90
80
AREG Buf IL8
Gas6 IL6
TGFb HGF EGF
Lapatinib
LapVP
AREG
Buf
IL8
Gas6
IL6
TGFb
HGF
EGF
8090
Lapatinib
LapVP
AREG
Buf
IL8
Gas6
IL6
TGFb
HGF
EGF
8090
Lap LapVP
100
80
Lap LapVP
Lapatinib
LapVP
2500 Pa
40 kPa
80100
2500 Pa 40 kPa
Lapatinib
LapVP
2500 Pa
40 kPa
80100
140
120
100
80 AREG
HGF Buf
Gas6 IL6
EGF IL8
TGFb
C1 C4 FN
L1C1 L1
AREG
HGF
Buf
Gas6
IL6
EGF
IL8
TGFb
80100
120140
C1 C4 FN
L1C1 L1
AREG
HGF
Buf
Gas6
IL6
EGF
IL8
TGFb
80100
120140
C1 C4 FN L1C1 L1
120
100
80 C1 L1 C4
L1C1 FN
2500 Pa 40 kPa 2500 Pa
40 kPa
C1
L1
C4
L1C1
FN
80100
120
2500 Pa
40 kPa
C1
L1
C4
L1C1
FN
80100
120

! 107!
Figure 20. The pHER2/HER2 status is affected by microenvironment and
contributes to lapatinib inhibition.
(A) The HER2 and pHER2 level of HCC1569 cultured on type 1 collagen coated
PA gels with various matrix rigidity were measured by flow cytometry. (B) The
pHER2/HER2 status is plotted against lapatinib responses. (C) A box plot
showing all data points of lapatinib responses from all combinatorial
microenvironments. (D) A box plot showing all data points of pHER2/HER2
status from all combinatorial microenvironments. (E) A linear regression plot
showing the correlation between pHER2/HER2 status and lapatinib responses
normalized by cells cultured on 2500 Pa gels. (F) A waterfall plot showing the
pHER2/HER2 status of all combinatorial microenvironments. (G) A column plot
with the same order of labels on x-axis as (F) showing the lapatinib responses of
all combinatorial microenvironments.

! 108!
Figure 20
FNTGFbL1C
4
L1Buffer
L1C1FNTGFbL1C
1L1L1C
1C1
FNL1C1
L1C1BufferC1L1C1C
4C4L1C1L1
C1C1IL6
L1L1C
1L1C
1C4
C4L1C1FNL1
FNC1C4IL8
C4HGF
L1C1FN
L1TGFbL1IL6
C1Gas6C1FN
C1TGFbL1C
1
L1C1TGFbC1HGF
FNAREG
C4TGFbC1IL8
L1C1IL6
C1AREGL1C1IL8
C1Buffer
L1AREGL1FN
C4AREGL1HGF
C4C1
L1C1AREGL1Gas6
C4Gas6
C4BufferL1IL8
FNIL6
L1C1Gas6L1EGF
L1C1EGF
L1C1HGFC1EGF
C4IL6
FNHGF
FNEGFFNIL8
FNC4C4FN
C1FNEGFC4EGF
FNGas6FNFN
-1.5
-1.0
-0.5
0.0
0.5
pHER
2/HER
2 (Lo
g 2)No
rmali
zed b
y 250
0 Pa
-1.5 -1.0 -0.5 0.0 0.5-1.0
-0.5
0.0
0.5
1.0
1.5
pHER2/HER2 Status (Log2)Normalized by 2500 Pa
EdU
inco
rpor
atio
n (L
og2)
Nor
mal
ized
by
2500
Pa
400 Pa
2500 Pa
4400 Pa
40 kPa
HER2 pHER2
>2 GPa
Control 40
0 Pa
2500
Pa
4400
Pa
40 kP
a
>2 GPa
0
20
40
60
80
100
0.0
0.2
0.4
0.6
0.8
1.0
EdU
inco
rpor
atio
n(%
con
trol)
pHER2/HER2EdU incorporation
pHER
2/HER
2(R
elative to 400 Pa PA gel)
2500
Pa
40 kP
a0
1
2
3
pHER
2/H
ER2
(Arb
itrar
y U
nit)
2500
Pa
40 kP
a0
1
2
3
Lapa
tinib
Res
pons
e(A
rbitr
ary
Uni
t)
A B
C D G
FNTGFbL1C
4
L1Buffer
L1C1FNTGFbL1C
1L1
L1C1C
1
FNL1C1
L1C1BufferC1L1C1C
4C4L1
C1L1C1C1IL6
L1L1C
1
L1C1C
4
C4L1C1FNL1
FNC1C4IL8
C4HGF
L1C1FN
L1TGFbL1IL6
C1Gas6C1FN
C1TGFbL1C
1
L1C1TGFbC1HGF
FNAREG
C4TGFbC1IL8
L1C1IL
6
C1AREGL1C
1IL8
C1Buffer
L1AREGL1FN
C4AREGL1HGF
C4C1
L1C1AREGL1Gas6
C4Gas6
C4BufferL1IL8
FNIL6
L1C1Gas6L1EGF
L1C1EGF
L1C1HGFC1EGF
C4IL6
FNHGF
FNEGFFNIL8
FNC4C4FN
C1FNEGFC4EGF
FNGas6FNFN
-2
-1
0
1
2
3
EdU
(Lap/D
MSO)
(Log
2)No
rmali
zed b
y 250
0 Pa
E
F
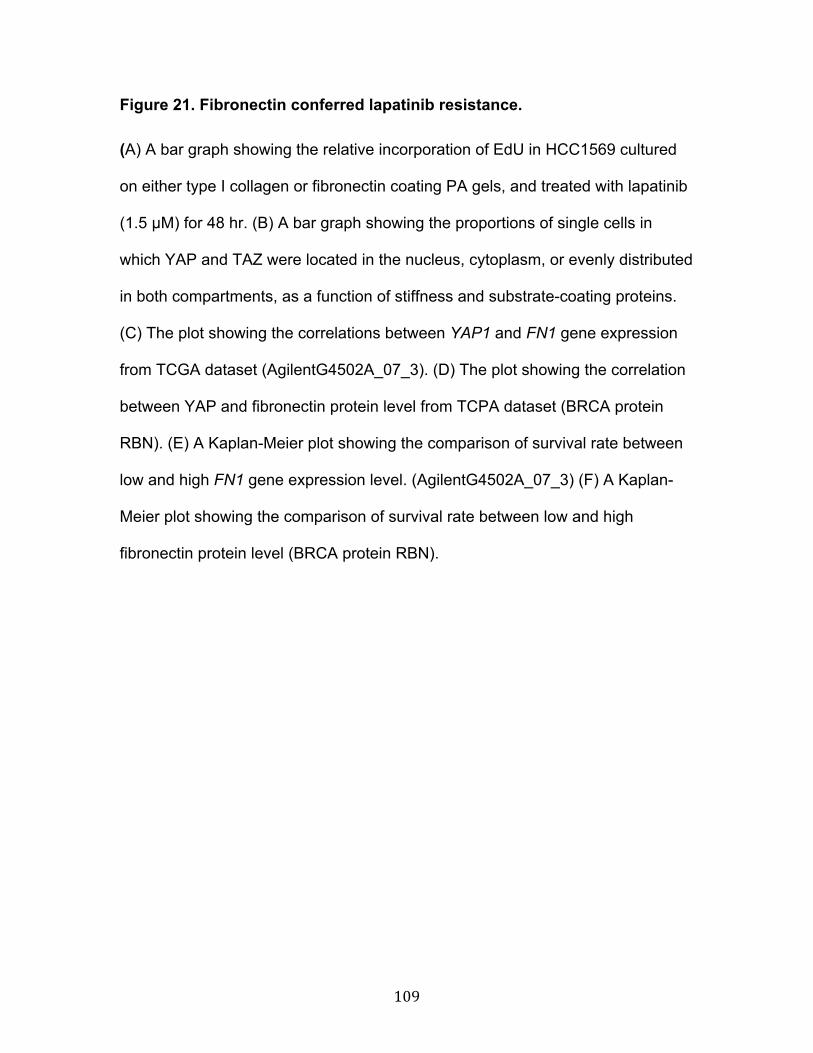
! 109!
Figure 21. Fibronectin conferred lapatinib resistance.
(A) A bar graph showing the relative incorporation of EdU in HCC1569 cultured
on either type I collagen or fibronectin coating PA gels, and treated with lapatinib
(1.5 µM) for 48 hr. (B) A bar graph showing the proportions of single cells in
which YAP and TAZ were located in the nucleus, cytoplasm, or evenly distributed
in both compartments, as a function of stiffness and substrate-coating proteins.
(C) The plot showing the correlations between YAP1 and FN1 gene expression
from TCGA dataset (AgilentG4502A_07_3). (D) The plot showing the correlation
between YAP and fibronectin protein level from TCPA dataset (BRCA protein
RBN). (E) A Kaplan-Meier plot showing the comparison of survival rate between
low and high FN1 gene expression level. (AgilentG4502A_07_3) (F) A Kaplan-
Meier plot showing the comparison of survival rate between low and high
fibronectin protein level (BRCA protein RBN).

! 110!
Figure 21
A B
0 2000 4000 6000 80000
50
100
Survival proportions: mRNA of fibronectin
Days elapsed
Perc
ent s
urvi
val
LowHigh
0 2000 4000 6000 80000
50
100
Survival proportions: Protein level of fibronectin
Days elapsed
Perc
ent s
urvi
val
LowHigh
E F
C D
-4 -2 0 2 4-3
-2
-1
0
1
2
FN1
YAP1
mRNA
2500
Pa
40 kP
a0
50
100
EdU
inco
rpor
atio
n(%
DM
SO c
ontro
l)C1FN
2500
Pa
40 kP
a
2500
Pa
40 kP
a0
50
100
% o
f Tot
al c
ells
YAP N > CN = CC > N
C1 FN
-2 0 2 4 6-1.0
-0.5
0.0
0.5
1.0
1.5
2.0
Fibronectin
YAP
Protein

! 111!
Figure 22. Example of MEArray platforms.
(A-E) Representative schemes of MEArray platform and a summary table below.

! 112!
Figure 22
C
!
!
A
!E
B
D
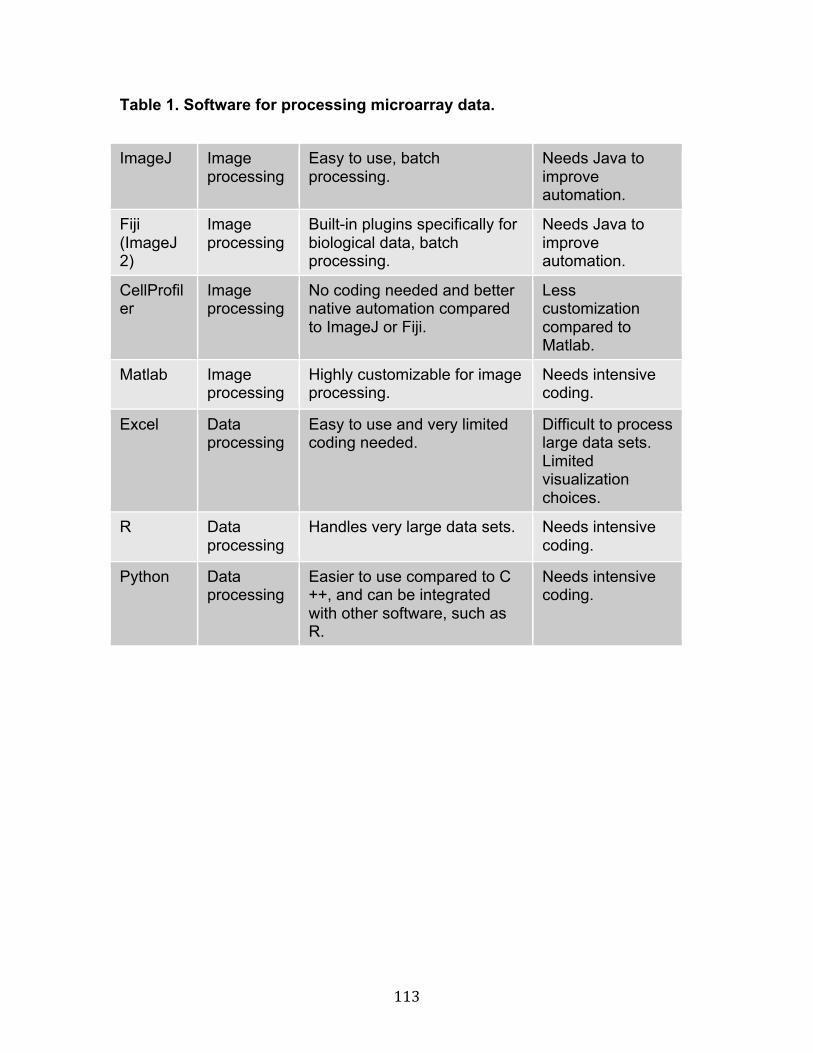
! 113!
Table 1. Software for processing microarray data.
ImageJ Image processing
Easy to use, batch processing.
Needs Java to improve automation.
Fiji (ImageJ 2)
Image processing
Built-in plugins specifically for biological data, batch processing.
Needs Java to improve automation.
CellProfiler
Image processing
No coding needed and better native automation compared to ImageJ or Fiji.
Less customization compared to Matlab.
Matlab Image processing
Highly customizable for image processing.
Needs intensive coding.
Excel Data processing
Easy to use and very limited coding needed.
Difficult to process large data sets. Limited visualization choices.
R Data processing
Handles very large data sets. Needs intensive coding.
Python Data processing
Easier to use compared to C ++, and can be integrated with other software, such as R.
Needs intensive coding.

! 114!
Table 2 Data analysis and visualization techniques used with MEArray-type
data.
Methods Type Advantages Limitations Ref
Z-score Normalization Easy to implement even in excel.
Sensitive to outlier values, and less accurate in cases with few cell numbers
122
Φ-score Normalization Overcomes the limitations of Z-score.
Needs specialized software for implementation, such as R
123
Dunnett’s test
Statistical test
Overcomes problems with type I errors (false positives) due to multiple comparisons to a single control.
Does not make all pair-wise comparisons
62
PCA Dimension reduction
A simple method to PCA to identify patterns due to variance.
Only reflects linear relationships
80
ICA Filter noise and data separation
An alternative method to identify patterns and filter noise.
Data needs to be non Gaussian distribution and independent to each other.
140
IPCA Filter noise and dimension reduction
A method combined PCA and ICA to identify patterns.
Similar to ICA, certain assumptions are needed.
130
SPADE Visualization Identifies patterns in high dimensional data.
Lower resolution compared to ViSNE, needs further statistical tests for validation.
133
ViSNE Visualization Similar to SPADE, but has higher resolution. Can reflect non-linear relationships.
Needs further statistical tests for validation.
81

! 115!
Chapter 8: Appendices
Abbreviations
Akt: Protein kinase B
AREG: Amphiregulin
AUC: Area under curve
Axl: Ark and Ufo
BM: Basement membrane
EGFR: Epidermal growth factor receptor
E(Pa): Elastic(Pascal)
HER2: Human epidermal growth factor receptor 2
HER3: Human epidermal growth factor receptor 3
HGF: Hepatocyte growth factor
ICA: Independent component analysis
IPCA: Independent principle component analysis
IPTG: Isopropyl β-D-1-thiogalactopyranoside
MEArray: Microenvironments microarray
MET: Hepatocyte growth factor receptor
PA: Polyacrylamide
PCA: Principle component analysis
PDMS: Polydimethylsiloxane
PEG: Poly(ethylene glycol)
PFA: Paraformaldehyde

! 116!
RTK: Receptor tyrosine kinase
Sulfo-SANPAH: sulfosuccinimidyl 6-(4'-azido-2'-nitrophenylamino)hexanoate
TAZ: PDZ-binding motif
TCP: Tissue culture plastic
TEAD: Transcription enhancer factor TEF 1
YAP: Yes-associated protein 1