dissecting the investor psyche: what motivates our clients
DESCRIPTION
Prepared For: definition , IFSA Conference 2005 By: Linda McAvenna. Dissecting the investor psyche: what motivates our clients. Agenda. Setting the scene An Australia-wide Snapshot in 2005 Managed Investments in 2005 2005 vs 2004 – trends in the marketplace Dissecting the investor psyche - PowerPoint PPT PresentationTRANSCRIPT
Prepared For:Prepared For:
definitiondefinition, IFSA Conference 2005, IFSA Conference 2005
By: Linda McAvennaBy: Linda McAvenna
Dissecting the investor psyche: Dissecting the investor psyche: what motivates our clientswhat motivates our clients

2
• Setting the scene
• An Australia-wide Snapshot in 2005
• Managed Investments in 2005
• 2005 vs 2004 – trends in the marketplace
• Dissecting the investor psyche
• Financial Advice in 2005
• What have we learned
AgendaAgenda

Setting the SceneSetting the Scene

4
• This research is aimed at assisting IFSA members in identifying what motivates managed investment (managed fund and superannuation) customers
• With a view to:– encouraging higher participation in managed
investments [funds and superannuation]– improving investor sentiment– building a more confident investor base– educating and engaging the target market
Purpose of the researchPurpose of the research

An Australia-wideAn Australia-wideSnapshot in 2005Snapshot in 2005
[General Population Survey][General Population Survey]

6
An Australia-wide Snapshot in 2005An Australia-wide Snapshot in 2005
• General Population telephone survey n=802– A representative sample across Australia– To determine incidence of managed fund and
superannuation investors, and– Usage of financial advisers across the Australian
community nationally
Fieldwork conducted in July 2005Fieldwork conducted in July 2005

7
Current investmentsCurrent investments
Q1. Q1. Do you currently have any of the following investments either in your own name, in Do you currently have any of the following investments either in your own name, in joint names or as part of an investment club? joint names or as part of an investment club?
14
20
26
37
78
0 20 40 60 80 100
None of the above
Investment in a managed fund that is NOT part of asuperannuation fund
Residential investment property
Shares in a company listed on the Australian StockExchange which you hold directly, NOT as part of a
managed fund
Superannuation of any kind
%
Base: General Population n=802
Higher among:• Empty Nesters 32%• H’hold income $130k + 36%• Use Fin Adviser 37%

8
Yes23%
No77%
Currently use a financial adviser Currently use a financial adviser
Q7. DQ7. Do you o you currentlycurrently use the services of a financial adviser or planner? use the services of a financial adviser or planner?
Base: General Population n=802
Based on a representative sample of Australian adultsBased on a representative sample of Australian adults

9
Likelihood of using a financial Likelihood of using a financial adviser over the next 12 monthsadviser over the next 12 months
Q16A/26. Q16A/26. In the next 12 months, would you say that you are…In the next 12 months, would you say that you are…
10 15 22 52 1
0% 20% 40% 60% 80% 100%
Very likely-4 Somewhat likely-3Somewhat unlikely-2 Very unlikely-1(Don’t know)
Base: Do not currently of a financial adviser n=602
Based on Australian adults who do not currently use a financial adviserBased on Australian adults who do not currently use a financial adviser
Mean Score /4
2.02.0

10
Very likely to use
8%
Somewhat likely to use
11%
Currently use23%
58%
Financial advice in 2006?Financial advice in 2006?Base:
General Population n=802
Q7. DQ7. Do you o you currentlycurrently use the services of a financial adviser or planner? use the services of a financial adviser or planner?
Q16a. Q16a. In the next 12 months, would you say that you are…In the next 12 months, would you say that you are…

Managed InvestmentsManaged Investmentsin 2005in 2005
[Investor Sample][Investor Sample]

12
Investor sample compositionInvestor sample composition
• n=592 with managed investments…n=592 with managed investments…
– n=354 with $25k plus in managed funds
– n=238 with $25k plus superannuation (but no managed funds)
Total n=592 investors with managed funds and/or superannuationTotal n=592 investors with managed funds and/or superannuation
Fieldwork conducted in July 2005Fieldwork conducted in July 2005

13
Main issues currently influencing Main issues currently influencing investment decisionsinvestment decisions
Q1. Q1. From your perspective, what are the top three issues currently facing the From your perspective, what are the top three issues currently facing the investment investment markets that are affecting your investment decisions?markets that are affecting your investment decisions?
Base: All investorsn=592
28
31
14
40
20
21
43
10
16
22
42
76
17
0 20 40 60 80 100
Australian interest rates
NET INTEREST RATES
Australian share market
Australian economy
NET DOMESTIC POLICIES
The residential property/housing market
Return on your investment
NET PROPERTY
Australian/US dollar exchange rate
Oil prices
US economy/share market
Global economy/share markets
NET GLOBAL MARKETS
%

14
Current investmentsCurrent investments
Q1. Q1. Do you currently have any of the following investments either in your own name, in Do you currently have any of the following investments either in your own name, in joint names or as part of an investment club? joint names or as part of an investment club?
37
60
73
91
0 20 40 60 80 100
Residential investment property
Investment in a managed fund that is NOTpart of a superannutation fund
Shares in a company listed on the AustralianStock Exchange which you hold directly, NOT
as part of a managed fund
Superannuation of any kind
%
Base: All investors2005 n=592
15
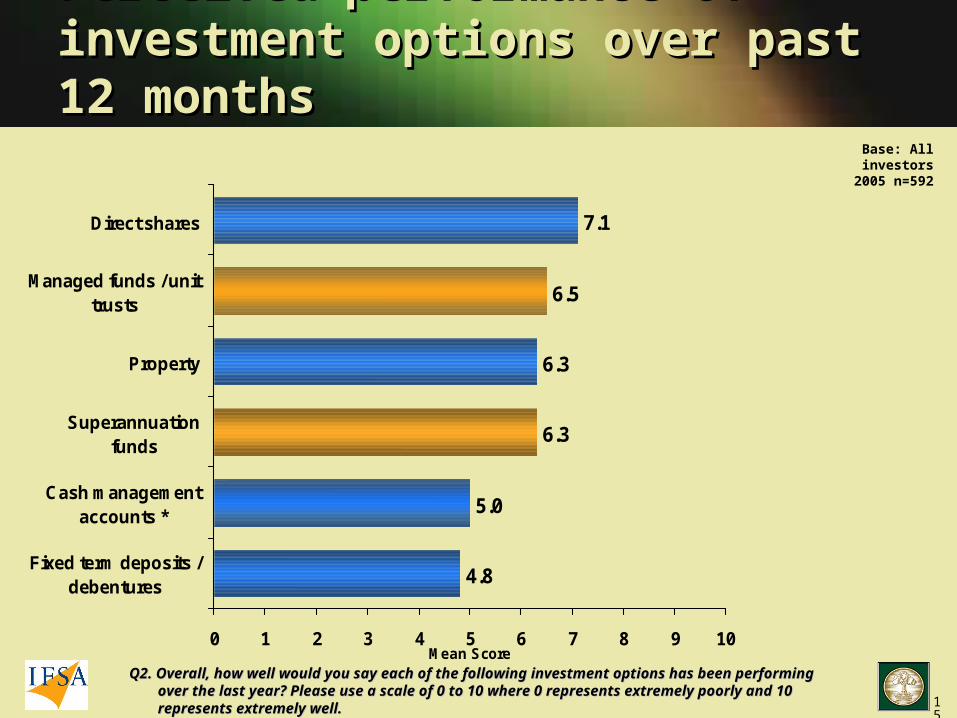
Perceived performance of investment Perceived performance of investment options over past 12 monthsoptions over past 12 months
Q2. Q2. Overall, how well would you say each of the following investment options has been performing Overall, how well would you say each of the following investment options has been performing over the last year? Please use a scale of 0 to 10 where 0 represents extremely poorly and 10 over the last year? Please use a scale of 0 to 10 where 0 represents extremely poorly and 10 represents extremely well.represents extremely well.
4.8
5.0
6.3
6.3
6.5
7.1
0 1 2 3 4 5 6 7 8 9 10
Fixed term deposits /debentures
Cash managementaccounts *
Superannuationfunds
Property
Managed funds / unittrusts
Direct shares
Mean Score
Base: All investors2005 n=592

16
Q2. Q2. Overall, how well would you say each of the following investment options has been performing Overall, how well would you say each of the following investment options has been performing over the last year? Please use a scale of 0 to 10 where 0 represents extremely poorly and 10 over the last year? Please use a scale of 0 to 10 where 0 represents extremely poorly and 10 represents extremely well.represents extremely well.
4.8
4.9
6.2
6.4
6.2
7.2
4.7
5.1
6.4
6.3
6.7
7.1
0 1 2 3 4 5 6 7 8 9 10
Fixed term deposits /debentures
Cash managementaccounts
Superannuationfunds
Property
Managed funds / unittrusts
Direct shares
Mean Score
Not currently using Currently usingBase: All investors
2005 n=592
1010
77
1818
2020
1414
2020
1111
1111
22
33
‘‘Top 2’ (9,10)Top 2’ (9,10)%%
Perceived performance of investment options by Perceived performance of investment options by whether currently use financial adviserwhether currently use financial adviser
33
22

Managed InvestmentsManaged InvestmentsKey Choice FactorsKey Choice Factors
Importance vs. PerformanceImportance vs. Performance
in 2005 in 2005

18
1.1. I trust my money is safeI trust my money is safe
2.2. Delivers on promiseDelivers on promise
3.3. Long term returns on investment (more than 5 years)Long term returns on investment (more than 5 years)
4.4. Fees and chargesFees and charges
5.5. Reputation of investment operator / fund managerReputation of investment operator / fund manager
6.6. Transparency in all aspects of operationsTransparency in all aspects of operations
7.7. Risk associated with the investmentRisk associated with the investment
8.8. Experts make the decisionsExperts make the decisions
9.9. Tax effectivenessTax effectiveness
10.10. Ease of accessing your moneyEase of accessing your money
11.11. Ease of moving money / funds between productsEase of moving money / funds between products
12.12. No stressNo stress
13.13. Advice / recommendation from financial adviser / plannerAdvice / recommendation from financial adviser / planner
14.14. Ethically / socially responsibleEthically / socially responsible
15.15. Range of product options availableRange of product options available
16.16. Short –term return on investment (2-5 years)Short –term return on investment (2-5 years)
17.17. Awards or star ratingsAwards or star ratings
18.18. Level of minimum investmentLevel of minimum investment
Managed Investments in 2005Managed Investments in 2005Key Choice Factors*Key Choice Factors*
* Derived from qualitative investor research conducted in 2004 on behalf of IFSA

19
Q9Q9 How How important important are each of the following are each of the following factors to you when factors to you when
considering whether considering whether or not to invest in managed investments or not to invest in managed investments
(managed funds / unit trusts and (managed funds / unit trusts and superannuation funds). Please superannuation funds). Please
rate each rate each of the factors on a scale from 0 to 10 of the factors on a scale from 0 to 10
Q10Q10 How How satisfied satisfied are you with the performance of your managed are you with the performance of your managed
investments (managed funds / unit trusts and superannuation investments (managed funds / unit trusts and superannuation
funds) funds) in relation to each factor listed below. Again, please rate each in relation to each factor listed below. Again, please rate each
factor factor on a scale from 0 toon a scale from 0 to 1010

20
12
34 56
78
9 1011
121314
15
16
17
18
4
5
6
7
8
9
10
4 5 6 7 8 9 10
Key Choice FactorsKey Choice FactorsImportance vs. Performance in 2005Importance vs. Performance in 2005
Performance
Imp
ort
an
ce
Ave
rag
e 6.
3
1. I trust my money is safe2. Delivers on promise3. Long term returns on investment
(more than 5 years)4. Fees and charges5. Reputation of investment operator /
fund manager6. Transparency in all aspects of
operations7. Risk associated with the investment8. Experts make the decisions9. Tax effectiveness10. Ease of accessing your money11. Ease of moving money / funds
between products12. No stress13. Advice / recommendation from
financial adviser / planner14. Ethically / socially responsible15. Range of product options available16. Short –term return on investment (2-5
years)17. Awards or star ratings18. Level of minimum interest

21
Perceived performance of managed Perceived performance of managed investments by whether currently use investments by whether currently use financial adviserfinancial adviser
Currently use Financial adviser / PlannerCurrently use Financial adviser / Planner
YesYes (n=336) (n=336)
score / 10score / 10
NoNo (n=246) (n=246)
score / 10score / 10
I trust my money is safeI trust my money is safe 7.17.1 6.86.8 - 0.3- 0.3
Reputation of investment operator / fund managerReputation of investment operator / fund manager 7.27.2 6.86.8 - 0.4- 0.4
No stressNo stress 7.07.0 6.66.6 - 0.4- 0.4
Ease of accessing your moneyEase of accessing your money 7.07.0 6.36.3 - 0.7- 0.7
Level of minimum investmentLevel of minimum investment 6.76.7 6.86.8 + + 0.10.1
Tax effectivenessTax effectiveness 6.76.7 6.06.0 - 0.7- 0.7
Ease of moving money / funds between productsEase of moving money / funds between products 6.86.8 6.26.2 - 0.6- 0.6
Range of product options availableRange of product options available 7.07.0 6.46.4 - 0.6- 0.6
Experts make the decisionsExperts make the decisions 6.76.7 6.06.0 - 0.7- 0.7
Advice / recommendation from financial adviser / plannerAdvice / recommendation from financial adviser / planner 6.06.0 4.74.7 - 1.3- 1.3
Delivers on promiseDelivers on promise 6.46.4 5.95.9 - 0.5- 0.5
Risk associated with the investmentRisk associated with the investment 6.86.8 6.56.5 - 0.3- 0.3
Transparency in all aspects of operationsTransparency in all aspects of operations 6.46.4 6.26.2 - 0.2- 0.2
Ethically / socially responsibleEthically / socially responsible 6.66.6 6.46.4 - 0.2- 0.2
Long term returns on investment (more than 5 years) *Long term returns on investment (more than 5 years) * 6.66.6 6.26.2 - 0.4- 0.4
Fees and chargesFees and charges 5.25.2 4.84.8 - 0.4- 0.4
Short-term return on investment (2-5 years)Short-term return on investment (2-5 years) 5.75.7 5.25.2 - 0.5- 0.5
Awards or star ratingsAwards or star ratings 6.06.0 5.45.4 - 0.6- 0.6
* 10+ yrs - 2004

2005 vs 20042005 vs 2004Trends in the Trends in the MarketplaceMarketplace

23
Perceived performance of investment Perceived performance of investment options over past 12 monthsoptions over past 12 months
Q2. Q2. Overall, how well would you say each of the following investment options has been performing Overall, how well would you say each of the following investment options has been performing over the last year? Please use a scale of 0 to 10 where 0 represents extremely poorly and 10 over the last year? Please use a scale of 0 to 10 where 0 represents extremely poorly and 10 represents extremely well.represents extremely well.
4.7
4.9
7.2
5.7
6.3
4.8
5.0
6.3
6.3
6.5
7.1
0 1 2 3 4 5 6 7 8 9 10
Fixed term deposits /debentures
Cash managementaccounts *
Superannuationfunds
Property
Managed funds / unittrusts
Direct shares
Mean Score
2004 2005
Base: All investors2005 n=5922004 n=600
* 2005 only
88
77
1919
1313
1616
3232
1111
55
22
22
22
‘‘Top 2’ (9,10)Top 2’ (9,10)%%

24
Importance of Key Choice FactorsImportance of Key Choice Factors2005 vs. 20042005 vs. 2004
Mean Score / 10Mean Score / 10
20042004 20052005
I trust my money is safeI trust my money is safe 8.58.5 8.88.8 0.30.3
Delivers on promiseDelivers on promise 8.58.5 8.58.5 --
Long term returns on investment (more than 5 years) *Long term returns on investment (more than 5 years) * 8.08.0 8.38.3 0.30.3
Fees and chargesFees and charges 8.68.6 8.28.2 0.40.4
Reputation of investment operator / fund managerReputation of investment operator / fund manager 8.08.0 8.18.1 0.10.1
Transparency in all aspects of operationsTransparency in all aspects of operations 8.18.1 8.08.0 0.10.1
Tax effectivenessTax effectiveness 7.77.7 7.57.5 0.20.2
Experts make the decisionsExperts make the decisions 7.77.7 7.67.6 0.10.1
Risk associated with the investmentRisk associated with the investment 7.57.5 7.67.6 0.10.1
Ease of accessing your moneyEase of accessing your money 7.57.5 7.27.2 0.30.3
Ethically / socially responsibleEthically / socially responsible 6.66.6 6.66.6 --
Advice / recommendation from financial adviser / plannerAdvice / recommendation from financial adviser / planner 6.56.5 6.66.6 0.10.1
No stressNo stress 7.47.4 6.76.7 0.70.7
Ease of moving money / funds between productsEase of moving money / funds between products 7.27.2 6.96.9 0.30.3
Range of product options availableRange of product options available 6.96.9 6.66.6 0.30.3
Short-term return on investment (2-5 yearsShort-term return on investment (2-5 years 6.66.6 6.06.0 0.60.6
Awards or star ratingsAwards or star ratings 6.16.1 5.45.4 0.70.7
Level of minimum investmentLevel of minimum investment 5.75.7 4.84.8 0.90.9
* 10+ yrs - 2004

25
Performance of Key Choice FactorsPerformance of Key Choice Factors2005 vs. 20042005 vs. 2004
Mean Score / 10Mean Score / 10
20042004 20052005
I trust my money is safeI trust my money is safe 7.07.0 7.07.0 --
Delivers on promiseDelivers on promise 6.26.2 6.26.2 --
Long term returns on investment (more than 5 years) *Long term returns on investment (more than 5 years) * 6.66.6 6.46.4 0.20.2
Fees and chargesFees and charges 5.55.5 5.05.0 0.50.5
Reputation of investment operator / fund managerReputation of investment operator / fund manager 6.96.9 7.07.0 0.10.1
Transparency in all aspects of operationsTransparency in all aspects of operations 6.36.3 6.36.3 --
Tax effectivenessTax effectiveness 6.56.5 6.46.4 0.10.1
Experts make the decisionsExperts make the decisions 6.46.4 6.46.4 --
Risk associated with the investmentRisk associated with the investment 6.66.6 6.66.6 --
Ease of accessing your moneyEase of accessing your money 6.86.8 6.76.7 0.10.1
Ethically / socially responsibleEthically / socially responsible 6.46.4 6.56.5 0.10.1
Advice / recommendation from financial adviser / plannerAdvice / recommendation from financial adviser / planner 6.16.1 5.95.9 0.20.2
No stressNo stress 6.66.6 6.96.9 0.30.3
Ease of moving money / funds between productsEase of moving money / funds between products 6.56.5 6.66.6 0.10.1
Range of product options availableRange of product options available 6.76.7 6.76.7 --
Short-term return on investment (2-5 yearsShort-term return on investment (2-5 years 5.65.6 5.55.5 0.10.1
Awards or star ratingsAwards or star ratings 6.16.1 5.75.7 0.40.4
Level of minimum investmentLevel of minimum investment 6.86.8 6.76.7 0.10.1
* 10+ yrs - 2004

26
4
12
16
17
18
4
12
16
17
18
4
5
6
7
8
9
10
4 5 6 7 8 9 10
Key Trends 2005 vs. 2004Key Trends 2005 vs. 2004Importance vs. PerformanceImportance vs. Performance
Performance
Imp
ort
an
ce
Ave
rag
e 6.
3
1. I trust my money is safe2. Delivers on promise3. Long term returns on investment
(more than 5 years)4. Fees and charges5. Reputation of investment operator /
fund manager6. Transparency in all aspects of
operations7. Risk associated with the investment8. Experts make the decisions9. Tax effectiveness10. Ease of accessing your money11. Ease of moving money / funds
between products12. No stress13. Advice / recommendation from
financial adviser / planner14. Ethically / socially responsible15. Range of product options available16. Short –term return on investment (2-5
years)17. Awards or star ratings18. Level of minimum interest
2005200520042004

Dissecting the Investor Dissecting the Investor PsychePsyche
[Investor Segmentation][Investor Segmentation]

28
Dissecting the investor psyche - Dissecting the investor psyche - Investor SegmentationInvestor Segmentation
21%
20%
23%
19%17%
Confident - DIYConfident - DIYIt’s All Too HardIt’s All Too Hard
Cruising – Not EngagedCruising – Not Engaged
Confident – Needs SupportConfident – Needs Support
Stressed – Needs Stressed – Needs SupportSupport

29
Confident DIYConfident DIY 19%19%• Predominantly male
• Wide investment portfolio including direct shares, managed funds, superannuation and investment property
• Most likely to have direct shares and investment property
• 3 in 5 have $100K+ invested in superannuation
• Optimistic about their financial future
• Clear financial goals
• Actively plan their finances
• Knowledgeable about financial matters in general
• Less likely to use a financial adviser (than some other investor segments)
30
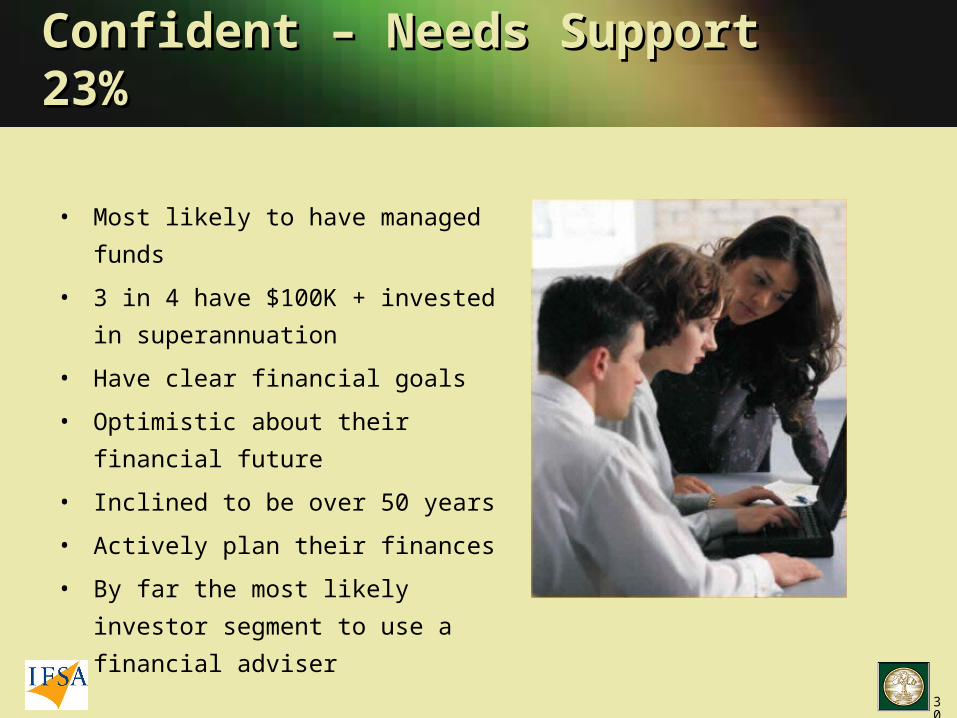
Confident – Needs SupportConfident – Needs Support 23%23%
• Most likely to have managed funds
• 3 in 4 have $100K + invested in
superannuation
• Have clear financial goals
• Optimistic about their financial future
• Inclined to be over 50 years
• Actively plan their finances
• By far the most likely investor segment
to use a financial adviser

31
Stressed - Needs SupportStressed - Needs Support 20%20%
• Similar to ‘Confident – Needs Support’ investors in that they:
– Do try to actively plan their finances
– and do have clear financial goals
• 1 in 2 have $100K + invested in superannuation
• But are…
– less optimistic financially
– more stressed about financial matters
• A higher incidence of under 40 year olds
• More noticeable amongst females
• More likely to use a financial adviser
(than some other investor segments)
32
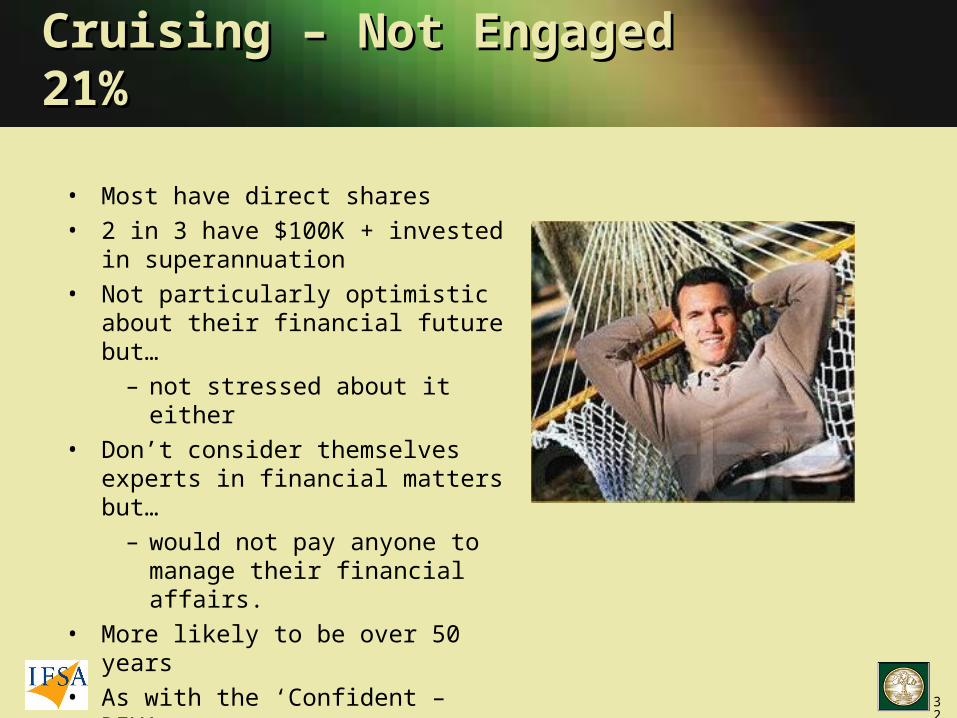
Cruising – Not EngagedCruising – Not Engaged 21%21%
• Most have direct shares
• 2 in 3 have $100K + invested in superannuation
• Not particularly optimistic about their financial future but…
– not stressed about it either
• Don’t consider themselves experts in financial matters but…
– would not pay anyone to manage their financial affairs.
• More likely to be over 50 years
• As with the ‘Confident – DIY’
– Predominantly male
– Less likely to use a financial adviser

33
It’s All Too HardIt’s All Too Hard 17%17%
• Least likely to have managed funds
• 1 in 3 have $100K + invested in superannuation
• Believe financial planning takes up too much time – prefer to spend their time on something else
• Don’t enjoy making financial decisions
• Claim to be lazy when it comes to managing their finances
• Agree they don’t pay enough attention to their finances
• Females most likely to be in this segment
• A younger (under 40) skew

Financial AdviceFinancial Advicein 2005in 2005
[Investor Sample][Investor Sample]

35
Yes57%
No43%
Currently use a financial adviserCurrently use a financial adviser
Q13. DQ13. Do you currently use the services of a financial adviser or planner?o you currently use the services of a financial adviser or planner?
Base:Investors
n=592Based on Managed Investment customersBased on Managed Investment customers

36
Use of a financial adviser – by Use of a financial adviser – by investor segmentinvestor segment
Q13. DQ13. Do you currently use the services of a financial adviser or planner?o you currently use the services of a financial adviser or planner?
56
38
61
85
37
57
0 20 40 60 80 100
It's All Too Hard
Cruising - Not Engaged
Stressed - NeedsSupport
Confident - NeedsSupport
Confident - DIY
ALL Investors
% 'Yes'
Base:Investors
n=592
37
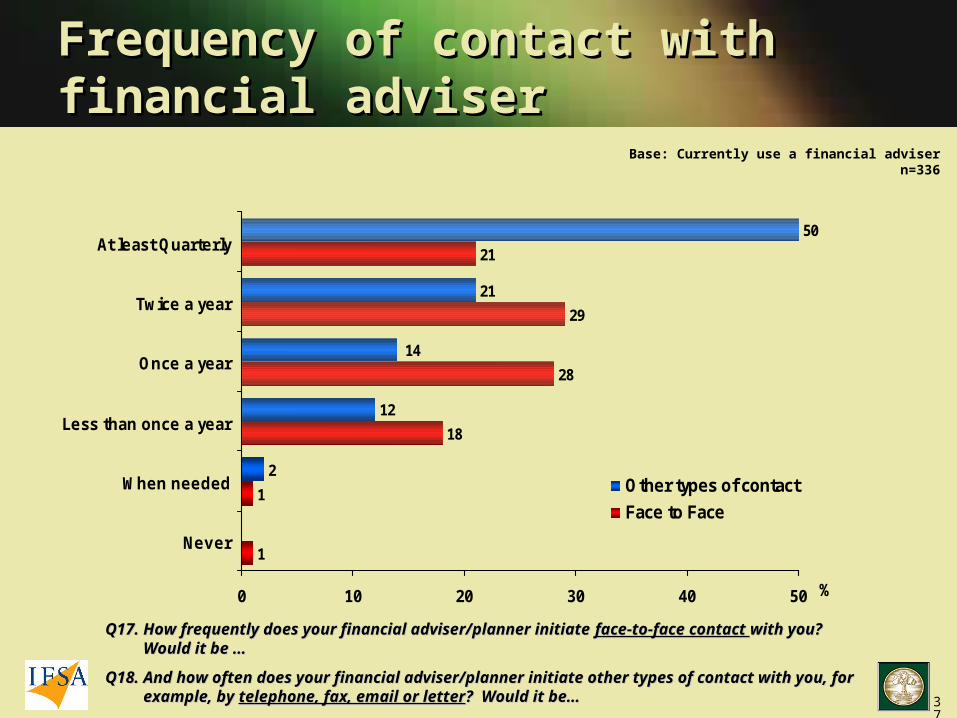
Frequency of contact with financial Frequency of contact with financial adviseradviser
Q17. Q17. How frequently does your financial adviser/planner initiate How frequently does your financial adviser/planner initiate face-to-face contact face-to-face contact with you? with you? Would it be … Would it be …
Q18. Q18. And how often does your financial adviser/planner initiate other types of contact with you, for And how often does your financial adviser/planner initiate other types of contact with you, for example, by example, by telephone, fax, email or lettertelephone, fax, email or letter? Would it be… ? Would it be…
Base: Currently use a financial advisern=336
1
1
18
28
29
21
2
12
21
50
14
0 10 20 30 40 50
Never
When needed
Less than once a year
Once a year
Twice a year
At least Quarterly
%
Other types of contact
Face to Face
38
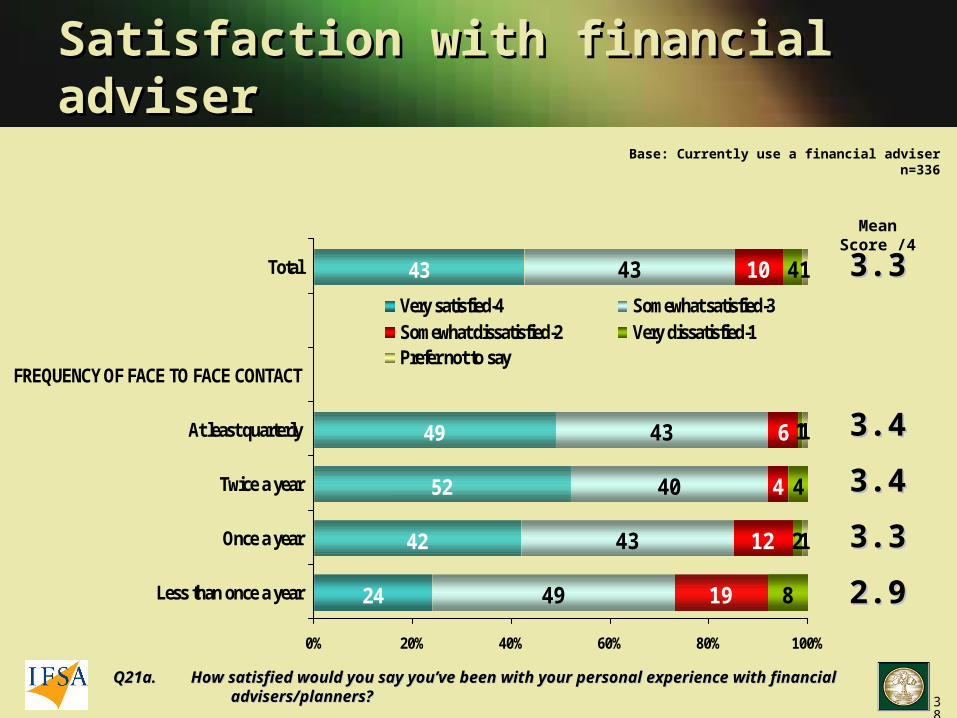
Satisfaction with financial adviserSatisfaction with financial adviser
Q21a. Q21a. How satisfied would you say you’ve been with your personal experience with financial How satisfied would you say you’ve been with your personal experience with financial advisers/planners?advisers/planners?
24
42
52
49
43
49
43
40
43
43
19
12
4
6
10
8
2
4
4
1
11
1
0% 20% 40% 60% 80% 100%
Less than once a year
Once a year
Twice a year
At least quarterly
FREQUENCY OF FACE TO FACE CONTACT
Total
Very satisfied-4 Somewhat satisfied-3Somewhat dissatisfied-2 Very dissatisfied-1Prefer not to say
Base: Currently use a financial advisern=336
Mean Score /4
3.33.3
3.43.4
3.43.4
3.33.3
2.92.9

39
Reliance on financial adviserReliance on financial adviser
10
7
9
7
9
31
34
44
44
38
34
49
43
40
43
14
5
1
6
8
3
2
1
2
6
1
1
3
2
0% 20% 40% 60% 80% 100%
Less than once a year
Once a year
Twice a year
At least quarterly
FREQUENCY OF FACE TOFACE CONTACT
Total
Rely totally on financial adviser-6Rely heavily-5Rely somewhat-4Rely very little-3Rely on for purchase of products-2Do not rely on financial adviser at all-1
Base: Currently use a financial advisern=336
Mean Score /6
4.44.4
4.54.5
4.54.5
4.34.3
4.24.2
Q22. Q22. Which one of the following statements BEST applies to you? Which one of the following statements BEST applies to you?
40
Value of current adviserValue of current adviser
Q25. Q25. I would now like you to consider the I would now like you to consider the valuevalue you you place on your financial adviser or planner.place on your financial adviser or planner.I am going to read out some more statements. I am going to read out some more statements. Using the same 0 to 10 scale, where 10 means you Using the same 0 to 10 scale, where 10 means you ‘strongly agree’ and 0 means you ‘strongly ‘strongly agree’ and 0 means you ‘strongly disagree’, please tell me whether you agree or disagree’, please tell me whether you agree or disagree with each statement as they relate to you. disagree with each statement as they relate to you. You may give any score between 0 and 10.You may give any score between 0 and 10.
41
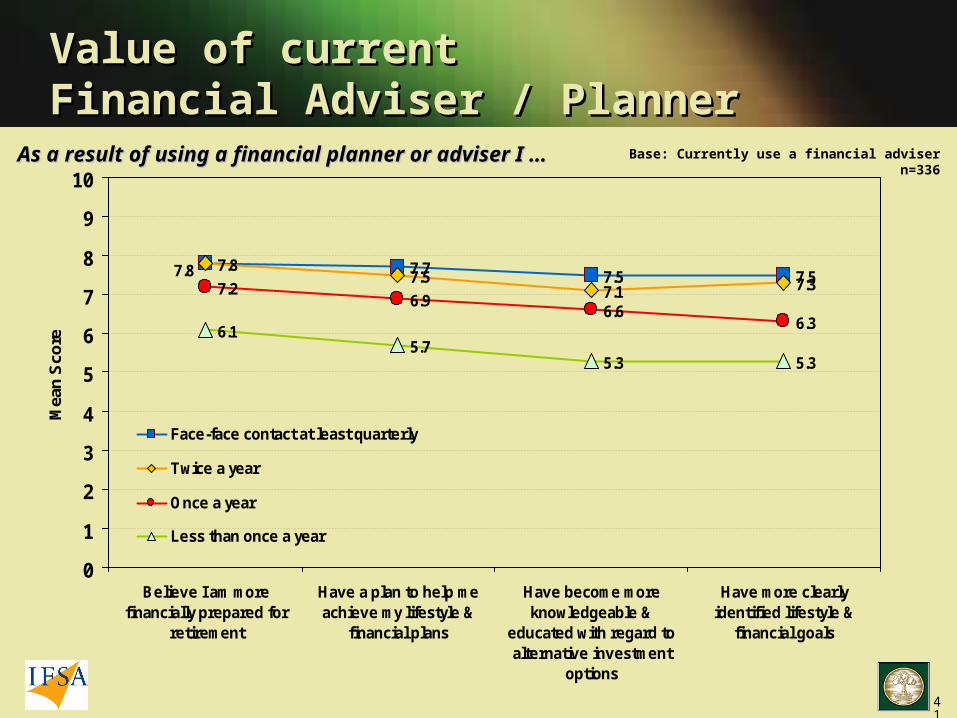
Value of currentValue of currentFinancial Adviser / PlannerFinancial Adviser / Planner
7.7 7.5 7.57.8
7.57.1 7.37.2
6.96.6
6.36.15.7
5.3 5.3
7.8
0
1
2
3
4
5
6
7
8
9
10
Believe I am morefinancially prepared for
retirement
Have a plan to help meachieve my lifestyle &
financial plans
Have become moreknowledgeable &
educated with regard toalternative investment
options
Have more clearlyidentified lifestyle &
financial goals
Mea
n S
core
Face-face contact at least quarterly
Twice a year
Once a year
Less than once a year
As a result of using a financial planner or adviser I …As a result of using a financial planner or adviser I … Base: Currently use a financial advisern=336

42
Value of currentValue of currentFinancial Adviser / Planner Financial Adviser / Planner cont.cont.
7.7 7.6 7.4 7.5
5.5
7.7 7.7 7.5 7.3 7.37.26.9 7.1
6.7
4.9
6.25.9 5.8
6.15.7
4.5
7.7
5.7
6.9
0
1
2
3
4
5
6
7
8
9
10
Have learnt moreabout myfinances
Am confident Ihave made better
investmentdecisions
Am moreconfident that Iwill achieve my
lifestyle andfinancial plans
My overall wealthis higher than
before I startedusing him/her
Feel I am more incontrol of my
finances
Am betterprotected
because ofproducts like life
insurance /income
protection
Mea
n S
core
Face-face contact at least quarterly
Twice a year
Once a year
Less than once a year
As a result of using a financial planner or adviser I …As a result of using a financial planner or adviser I …Base: Currently use a financial adviser
n=336

43
Likelihood of using a financial Likelihood of using a financial adviser over the next 12 monthsadviser over the next 12 months
Q26. Q26. In the next 12 months, would you say that you are…In the next 12 months, would you say that you are…
8 22 19 43 8
0% 20% 40% 60% 80% 100%
Very likely-4 Somewhat likely-3Somewhat unlikely-2 Very unlikely-1(Don’t know)
Base: Do not currently use a financial adviserInvestors
n=256
Investors who do not currently use a financial adviser
Mean Score /4
1.951.95

44
Very likely to use
4%
Somewhat likely to use
10%
Currently use54%
39%
Financial Advice in 2006?Financial Advice in 2006?Base:
Investors n=592
Q26. Q26. In the next 12 months, would you say that you are…In the next 12 months, would you say that you are…
Q13. DQ13. Do you currently use the services of a financial adviser or planner?o you currently use the services of a financial adviser or planner?

What have we learnedWhat have we learned

46
Investor sentiment 2005 vs. 2004Investor sentiment 2005 vs. 2004
• Over the past 12 months managed funds are perceived to have performed slightly better than
superannuation or investment property, though not as well as direct shares
• Compared with 2004, satisfaction with managed investments (funds and superannuation) has shown
a marked increase, (as has satisfaction with direct shares), though not surprisingly, satisfaction with
property investment has slumped
• In 2005, managed investment customers appear to be …
– ‘less stressed’ than they were 12 months ago
– less concerned about fees and charges
– less concerned about the short-term (2-5 years) return on managed investments
– less concerned about awards or star ratings
– less concerned about the levels of minimum investments
• However, the biggest ‘gap’ in terms of importance vs. performance relates to ‘fees and charges’ which
suggests that investors feel that more improvements can be made in this area

47
The value of financial adviceThe value of financial advice
• Nearly 1 in 4 Australian adults currently uses a financial adviser or planner, and this is
set to rise in 2006
• Amongst adults with managed investments, the figure is significantly higher at close to
6 in 10 – this figure is also likely to increase in 2006
• Satisfaction with financial advisers/planners is highest amongst investors who have a
face-to-face meeting with their adviser/planner at least every six months
• Investors who currently use a financial adviser/planner are more satisfied with the
performance of managed funds and superannuation over the past year (than investors
who do not currently use one)
And most importantly…
• Satisfaction with managed investments, across all 18 identified managed investment
key choice drivers, is noticeably higher amongst investors who currently use a financial
adviser/planner

Thank youThank you