dissecting and modeling a transcriptional dynamics during
TRANSCRIPT
University of ConnecticutOpenCommons@UConn
Doctoral Dissertations University of Connecticut Graduate School
7-28-2015
Dissecting and Modeling a TranscriptionalDynamics During Stochastic Phase of SomaticReprogrammingKyung Min ChungUniversity of Connecticut - Storrs, [email protected]
Follow this and additional works at: https://opencommons.uconn.edu/dissertations
Recommended CitationChung, Kyung Min, "Dissecting and Modeling a Transcriptional Dynamics During Stochastic Phase of Somatic Reprogramming"(2015). Doctoral Dissertations. 853.https://opencommons.uconn.edu/dissertations/853
Dissecting and Modeling a Transcriptional Dynamics During Stochastic Phase of
Somatic Reprogramming
Kyung-Min Chung, PhD
University of Connecticut, 2015
Abstract
Forced ectopic expression of the transcription factors OCT4, SOX2, KLF4, and c-
MYC (OSKM) can directly reprogram various somatic cells into induced pluripotent stem
cells (iPSCs). These reprogrammed cells offer great potential as a source for patient-
matched regenerative therapies thanks to their striking molecular and phenotypic
similarity to embryonic stem cells. However, despite years of research, this process
remains highly inefficient and produces considerable cellular heterogeneity. Moreover,
long latency has stalled the effort to understand the mechanisms and molecular
changes underlying the reprogramming process. To improve and facilitate the
development of efficient and rapid reprogramming strategies, a clear understanding of
fundamental reprogramming mechanisms is essential.
In this work, we use single-cell transcript profiling, fluorescence-activated cell
sorting (FACS), and mathematical modeling to provide a precise mathematical
framework describing the dynamics of pluripotency gene expression during
reprogramming by OSKM. Additionally, we generated a reprogramming progression
axis that precisely measures the progression of individual cells towards pluripotency.
We found that the stochastic phase of reprogramming is an ordered probabilistic
process with independent gene-specific dynamics. Furthermore, we demonstrated that
Kyung-Min Chung - University of Connecticut, 2015
polycistronic viral (OSKM) delivery produces significantly higher reprogramming
efficiencies as compared to monocistronic delivery, due to premature inactivation of the
individual O, S, K, or M vectors in the monocistronic method. Finally, we show that the
order of gene activation is similar in two fibroblast cell types, MRC-5 and BJ, and that
these two cell types take divergent paths upon reprogramming factor induction, followed
by convergence later in the reprogramming process.
The results of our work emphasize the important value of precise mathematical
modeling and of the reprogramming progression axis in understanding fundamental
reprogramming mechanisms. This work lays the foundation for the measurement and
mechanistic dissection of treatments that enhance the rate or efficiency of
reprogramming to pluripotency.
i
Dissecting and Modeling a Transcriptional Dynamics During Stochastic Phase of
Somatic Reprogramming
Kyung-Min Chung
B.S., SUNY at Geneseo, 2003
M.S., New York University, 2008
A Dissertation
Submitted in Partial Fulfillment of the
Requirements for the Degree of
Doctor of Philosophy
at the
University of Connecticut
2015

ii
Copy right by
Kyung-Min Chung
2015

iii
APPROVAL PAGE
Doctor of Philosophy Dissertation
Dissecting and Modeling a Transcriptional Dynamics During Stochastic Phase of
Somatic Reprogramming
Presented by
Kyung-Min Chung, M.S.
Major Advisor: ___________________________________________________________ Craig E. Nelson
Associate Advisor: _________________________________________________________ David J. Goldhamer
Associate Advisor: _________________________________________________________ Xiuchun (Cindy) Tian
Associate Advisor: _________________________________________________________ Charles Giardina
Associate Advisor: _________________________________________________________ Barbara Mellone
University of Connecticut 2015

iv
Acknowldgement
First I would like to give all the glory to God and I am grateful to him for the good health,
wellbeing and spiritual guidance that were necessary to complete this long journey.
I would like to gratefully and sincerely thank Dr. Craig E. Nelson for his guidance,
understanding, patience, and most importantly, his friendship during my graduate
studies at University of Connecticut. His mentorship was paramount in providing a well-
rounded experience consistent my long-term career goals. He encouraged me to not
only grow as an experimentalist and a chemist but also as an instructor and an
independent thinker. I am not sure many graduate students are given the opportunity to
develop their own individuality and self-sufficiency by being allowed to work with such
independence. I also thank you for giving me lifetime memory and experiments that I
learn through up and down, good time and bad time together.
I am also grateful to Dr. David Goldhamer. I am extremly thankful and indebted to him
for sharing expertise, and sincere and valuable guidance and encouragement extended
to me.
I would like to thank Dr. Xihuan Tian (Cindy) for her input on my reprogramming
projects, valuable discussions and accessibility.
I would like to thank Dr. Charles Girdina for your continued support and encouragement.
You always mention, a good day will come soon, help me get through bad times.
I cannot express enough thanks to Dr. Barbara Mellone for her loving care, assistance
and guidance in finishing my graduate career.
I would like to thank Dr. Carol Noris for spending endless time for searching very rare
and hard to find reprogramming cell through FACS.
My completion of this project could not have been accomplished without the support of
my labmates, Asav, Ajay, Steve, Randy, Ed, Kevin; and two of the past member Dr.
Jason and Dr. Caroline. You guys provided me for much-needed humor and
entertainment in what could have otherwise been a somewhat stressful laboratory
environment.
To Fred: whom I worked closely, stimulating discussion and puzzled over many of
unpredictable world of reprogramming. Thank you for dealing with me for almost 6 years

v
of your life and I am very grateful for your friendship. Hopefully I will see you and Asav
graduating right after me.
Of course, I am very grateful for my parents and sister. Thank you for unconditional
love, support, and their faith in me. Without mom and dad, I wouldn’t be here and
accomplish highest degree in genetic field.
Finally, and most importantly, I would like to thank my wife Hwaran. Her support,
encouragement, quiet patience and unwavering love were unquestionably the bedrock
upon which the past seven years of my life have been built. Her tolerance of my
occasional discourteous moods is a testament in itself of her unbending devotion and
love.

vi
vii
Table of Contents
Chapter 1 Introduction ...................................................................................... 1
1.1 SomaticReprogramming ............................................................................. 1
1.1.1 Various somatic reprogramming methods for clinical safety ............... 1
1.1.2 Various somatic reprogramming addressing a reprogramming efficiency ...................................................................................................... 2
1.2 Reprogramming stage and barriers ............................................................ 4
1.3 Reprogramming progression assessments ................................................ 7
1.4 Currently proposed reprogramming models ............................................... 9
1.5 Scope of my thesis ................................................................................... 10
Chapter 2 Single cell transcript analysis of monocistronic OSKM factors somatic reprogramming cells .......................................................................... 11
2.1 Introduction ............................................................................................... 11
2.1.1 single cell analysis of reprogramming reveal that reprogramming is proceed in two major phases ..................................................................... 13
2.1.2 Chromatin remodeling during early stochastic phase of reprogramming ........................................................................................... 14
2.2 Results ..................................................................................................... 16
2.2.1 Reprogramming Experimental Design .............................................. 16
2.2.2 Measuring progression towards pluripotency .................................... 18
2.2.3 Mapping the trajectory of monocistronic OSKM infected cell throughout reprogramming......................................................................... 20
2.2.3.1 Principle component analysis .................................................... 20
2.2.3.2 Generation of reprogramming progression axis ......................... 21
2.2.3.3 Expression of two reprogramming surface markers;
SSEA4 and Tra1-60 ............................................................................... 21
2.2.3.4 Self organizing map ................................................................... 22
2.2.3.5 Limitation of this approach ......................................................... 24
viii
2.2.4 Mapping coarse changes in gene expression along the productive trajectories ................................................................................................. 25
2.2.4.1 Quantitative gene expression analysis ...................................... 25
2.2.4.2 Comparing gene expression dynamic between mouse and human .................................................................................................... 26
2.2.5 Generation of effective reprogramming model by Gaussian Distribution ................................................................................................. 28
2.2.5.1 Addressing two hypothesis by two models ................................ 28
2.2.5.2 Comparisons of models ............................................................. 30
2.2.6 Gene expression dynamics during monocistronic OSKM somatic reprogramming ........................................................................................... 32
2.2.7 Pluripotency gene regulatory network during the stochastic phase of reprogramming ........................................................................................... 34
2.2.8 Reprogramming model ...................................................................... 38
2.3 Discussion ................................................................................................ 40
2.3.1 Transcriptional heterogeneity expression .......................................... 41
2.3.2 Activation of gene during reprogramming ......................................... 42
2.3.3 Local chromatin architecture of the pluripotency gene attribute to reprogramming efficiency ........................................................................... 42
2.3.4 Successful reprogramming required enhance expression of chromatin modifers ..................................................................................................... 43
Chapter 3 Polycistronic delivery of OSKM reprogramming factors improves reprogramming efficiency compared with Monocistronic reprogramming . 45
3.1 Introduction .............................................................................................. 45
3.2 Results ..................................................................................................... 48
3.2.1 Monocistronic and Polycistronic reprogramming efficiency ............... 48
3.2.2 Experimental design.......................................................................... 49
3.2.3 Reprogramming progression of individual cell between two reprogramming methods ............................................................................ 51
3.2.4 Generation of logistic regression model ............................................ 52
ix
3.2.5 Assessment of two reprogramming methods by logistic regression model ......................................................................................................... 54
3.2.6 Heterogeneity expression of exogenous OSKM reprogramming factors ........................................................................................................ 57
3.2.7 Expression of endogenous and exogenous OSKM reprogramming factors in monocistronic reprogramming .................................................... 58
3.2.8 Transcriptional analysis of low GFP express reprogramming cell ..... 60
3.2.9 Three reprogramming factor combination (SKM, OKM, OSM, OSK) somatic reprogramming ............................................................................. 62
3.3 Discussion ................................................................................................ 64
Chapter 4 Comparison between MRC-5 and BJ fibroblast cells using Polycistronic OSKM reprogramming factors ................................................. 67
4.1 Introduction .............................................................................................. 67
4.2 Results ..................................................................................................... 68
4.2.1 Comparing the dynamics of pluripotency gene expression between two fibroblast cell lines BJ and MRC-5 ....................................................... 68
4.2.2 Modeling approach to compare the point of activation of gene between two cell lines ................................................................................ 71
4.3 Discussion ................................................................................................ 73
Chapter 5 Conclusion and Future Studies ................................................................. 75
5.1 Conclusion ............................................................................................... 75
5.2 Future Studies .......................................................................................... 77
Chapter 6 Material and Methods ..................................................................... 79
6.1 Monocistronic OSKM mediated somatic reprogramming ......................... 79
6.2 Comparison between Monocistronic and Polycistronic reprogramming methods and two cell typs; BJ and MRC-5 fibroblasts ................................... 84
Chapter 7 Appendices ............................................................................................ 90
7.1 Supplemental Figures .................................................................................. 90
7.2 Supplemental Tables .................................................................................. 115
7.3 Authored papers ......................................................................................... 119
References .............................................................................................................. 120
x
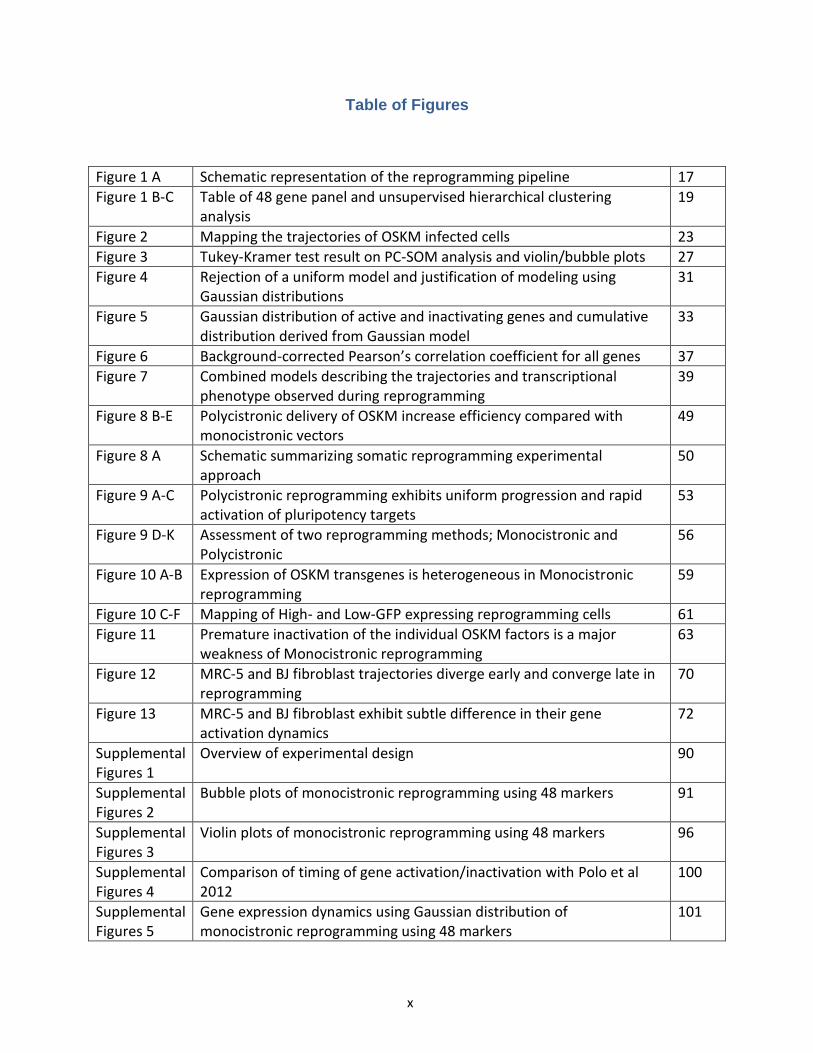
Table of Figures
Figure 1 A Schematic representation of the reprogramming pipeline 17
Figure 1 B-C Table of 48 gene panel and unsupervised hierarchical clustering analysis
19
Figure 2 Mapping the trajectories of OSKM infected cells 23
Figure 3 Tukey-Kramer test result on PC-SOM analysis and violin/bubble plots 27
Figure 4 Rejection of a uniform model and justification of modeling using Gaussian distributions
31
Figure 5 Gaussian distribution of active and inactivating genes and cumulative distribution derived from Gaussian model
33
Figure 6 Background-corrected Pearson’s correlation coefficient for all genes 37
Figure 7 Combined models describing the trajectories and transcriptional phenotype observed during reprogramming
39
Figure 8 B-E Polycistronic delivery of OSKM increase efficiency compared with monocistronic vectors
49
Figure 8 A Schematic summarizing somatic reprogramming experimental approach
50
Figure 9 A-C Polycistronic reprogramming exhibits uniform progression and rapid activation of pluripotency targets
53
Figure 9 D-K Assessment of two reprogramming methods; Monocistronic and Polycistronic
56
Figure 10 A-B Expression of OSKM transgenes is heterogeneous in Monocistronic reprogramming
59
Figure 10 C-F Mapping of High- and Low-GFP expressing reprogramming cells 61
Figure 11 Premature inactivation of the individual OSKM factors is a major weakness of Monocistronic reprogramming
63
Figure 12 MRC-5 and BJ fibroblast trajectories diverge early and converge late in reprogramming
70
Figure 13 MRC-5 and BJ fibroblast exhibit subtle difference in their gene activation dynamics
72
Supplemental Figures 1
Overview of experimental design 90
Supplemental Figures 2
Bubble plots of monocistronic reprogramming using 48 markers 91
Supplemental Figures 3
Violin plots of monocistronic reprogramming using 48 markers 96
Supplemental Figures 4
Comparison of timing of gene activation/inactivation with Polo et al 2012
100
Supplemental Figures 5
Gene expression dynamics using Gaussian distribution of monocistronic reprogramming using 48 markers
101
xi
Supplemental Figures 6
Modeling complex gene behavior with two Gaussian distributions 105
Supplemental Figures 7
Modeling Gene Expression Dynamics Using Logistic Regression Models between MRC-5 and BJ fibroblast cells
106
Supplemental Figure 8
Modeling Gene Expression Dynamics Using Logistic Regression Models between monocistronic and polycistronic reprgramming cells moving towards pluripotency.
112
Supplemental Table 1
List of 48 Taq-man Assay used in single cell qRT-PCR 115
Supplemental Table 2
Parameters for Single Gaussian distribution Model
116
Supplemental Table 3
Phenotype and number of cell collected by FACS for single cell Transcript analysis
117
Supplemental Table 4
List 96 Taq-man Assay used in single cell qRT-PCR using Biomark instrument
118
1
Chapter 1 Introduction
1.1 Somatic Reprogramming
Various mammalian somatic cells can be reprogrammed to induced pluripotent stem
cells (iPSCs) through ectopic expression of four individual transcriptional factors –
OCT4, SOX2, KLF4, and c-MYC (OSKM) [1] and allow the direct modeling of human
disease, ultimately offering the potential to revolutionize regenerative medicine[2]. Since
their discovery by Yamanaka in 2006, reprogramming techniques have been
comprehensively studied, with reprogramming translated from mouse adult fibroblasts
[1,3,4] to various human adult fibroblasts [1,5,6], including adipose stem cells [7],
mature B cells [8], stomach and liver cells [9], neural stem cells [10,11], melanocytes
[12], pancreatic cells [13], and keratinocytes [14] indicating that these techniques have
a seemingly universal capacity to change cellular identity. However, even with their
tremendous potential for reprogramming various cell types, reprogramming techniques
have been hindered by stochastic, extreme heterogeneity, and a nonspecific
reprogramming process, which resulted in low reprogramming efficiency (0.001% to
1%) [1,15]. In addition, generating iPSCs through conventional methods raises
concerns about their use in clinical applications, due to virus-mediated gene delivery
that results in genomic integration of the four exogenous reprogramming factors and the
natural function of c-MYC as an oncogene [16].
1.1.1 Various somatic reprogramming methods addressing clinical safety
To overcome these numerous reprogramming obstacles and clinical safety
concerns, many improvements in methodology have been achieved through alternate
transduction, such as episomal vector [17], adenoviral [18], Sendai vectors [19],
2
transient transfection [18], removable PiggyBac Transposon Vector System [20], and
the minicircle system [21]. These methods address clinical safety concerns relating to
the potential use of iPSCs in regenerative medicine by avoiding the integration of
exogenous DNA and the permanent introduction of oncogenes. However, the efficiency
and kinetics of these methods remain extremely low compared to conventional vector-
integrating methods [22–24]. In addition, iPSCs have been generated using
recombinant protein or synthetic mRNAs, but the protocols for doing so involves
technical challenges and are expensive [25–28]. Furthermore, the addition of certain
microRNAs (miR200, miR302, miR369) to OSKM factors can generate iPSCs more
efficiently, but the concrete use and robustness of these methods remain unclear
[29,30].
1.1.2 Various somatic reprogramming methods addressing reprogramming efficiency
Along with addressing clinical safety concerns, many different methods have
been developed to increase reprogramming efficiency. One such method uses different
sets of transcriptional factors to generate iPSCs. For example, SOX1 and SOX3 can
replace SOX2, KLF2 can replace KLF4, and L-MYC and N-MYC are able to replace c-
MYC in mice [16]. Additionally, using NANOG instead of KLF4 and LIN28A instead of c-
MYC with OCT4 and SOX2 (OSNL) can generate human iPSCs from human fibroblast
cells [17]. Furthermore, the mesenchymal-epithelial transition (MET)-related gene CDH1
can replace OCT4 in the OSKM cocktail in mice [31], and ectopic expression of
chromatin-modifying genes, such as TET1, TET2, UTX, BRG1, and BAF155
(SMARCC1) [32–34], can replace one of the four OSKM factors during reprogramming.
Other unrelated pluripotency-associated transcriptional factors, such as the orphan
3
nuclear receptor ESRRB, can replace KLF4 [35], and the orphan nuclear receptor
NR5A2 can replace OCT4 [33].
Moreover, c-MYC reprogramming factors have been shown to be dispensable
[16], and human and mouse neural stem cells that already express endogenous SOX2,
KLF4, and c-MYC can only be reprogrammed with ectopic expression of OCT4 [11,25].
However, dispensing with any of the four OSKM reprogramming factors yields
extremely low reprogramming efficiency compared to the four conventional factors are
used [36].
In addition to using a combination of various transcriptional factors to generate
iPSCs, small-molecule compounds alone and with the four reprogramming factors can
generate iPSCs and enhance reprogramming efficiency. These small-molecule
compounds are comprised of the GSK3 inhibitor Kenpaullone [37], the DNA
methyltransferase inhibitor 5-Azacytidine [38], the histone methyltransferase inhibitor
BIX-01294 [11,39], the histone deacetylase inhibitor valproic acid [40,41], the
MAPK/ERK inhibitor PD0325901 [42], and Vitamin C [43]. Unlike conventional
integrating OSKM factors, which directly involve and target pluripotent-specific
chromatin-remodeling complex in somatic cells [44,45], these small compounds
indirectly initiate somatic reprogramming by mediating endogenous, non-pluripotent-
specific chromatin-remodeling complex in somatic cells [46]. As a result, the successful
and robust induction of iPSCs by small-molecule compounds alone would
fundamentally change the concept of somatic reprogramming.
4
In addition to small-molecule compounds and various transcriptional factors, the
stoichiometric ratio between the four reprogramming factors (OSKM 3:1:1:1) [47] and
the single polycistronic vector cassette that contains all four reprograming factors [48]
increase somatic reprogramming efficiency. Furthermore, certain extracellular signaling
pathways, such as the Wnt and TGF- pathways, are involved in the reprogramming
process. For example, the inhibition of TGF- during MET transition by c-MYC [49,50]
and the activation of Wnt/-catenin signaling are likely to enhance reprogramming by
broadly activating various pluripotent genes [51]. However, the mechanistic role played
by each of the pathways during reprogramming is still elusive and a subject of debate.
These various iPSC-generating methods show that somatic reprogramming is
complicated and involves many different steps, roadblocks, and pathways. Modifying
each of the reprogramming steps may facilitate and increase reprogramming efficiency.
1.2 Stages of and barriers to reprogramming
During the reprogramming process, successful reprogramming cells are required to
transition through key intermediate stages and reprogramming barriers, such as
increasing cell cycle rate [52], downregulation of fibroblast markers [15], resetting the
epigenetic landscape [45,53–55], acquisition of epithelial characteristics through the
process referred to as the Mesenchymal Epithelial Transition (MET) [56], and activation
of early and late pluripotent markers to establish the pluripotency network [57]. These
barriers are rate-limiting factors and probably contribute to the long latency of the
process and its low reprogramming efficiency.
5
During early reprogramming, successful reprogramming cells must increase their
proliferation rate and simultaneously decrease in size. These proliferative and
morphological changes are complemented on the molecular level by the induction of the
proliferation gene, the induction of chromatin modifiers, and the downregulation of
fibroblast-related genes [45,56,58]. If reprogramming cells fail to induce cell proliferation
and do not undergo the proper morphological changes, they either remain in fibroblast-
like stages or often undergo apoptosis, senescence, or cell-cycle arrest. Specifically,
silencing of the apoptotic regulators P53 and P21 is observed in early reprogramming
and depleting these regulators has been found to enhance reprogramming efficiencies.
In addition, during proper reprogramming, somatic cells must exhibit dramatic
epigenetic changes in histone modification and DNA methylation similar to an
embryonic stem cell (ESC)-like state. Several small-molecule compounds that inhibit
histone and DNA methylation increase reprogramming efficiency [46] and enhance
expression of the chromatin-modifying associated gene in successful reprogramming in
an early stage of the process [59], and have demonstrated that changes in the
epigenetic landscape are required for proper reprogramming. Moreover, failed
reprogramming cells generally do not activate the expression of chromatin modifiers.
Embryonic stem cells (ESCs) have the characteristics of epithelial cells with tight
intercellular interactions, and express the important epithelial gene E-cadherin [60].
Therefore, mesenchymal-like somatic cells must gain an epithelial characteristic during
reprogramming. During the MET, the reprogramming cell undertakes coordinated
changes in cell-to-cell and cell–to-matrix interactions [61] that result in gaining epithelial
characteristics and losing mesenchymal characteristics.
6
In addition to these interactions, properly-functioning reprogramming cells also gain
expression of epithelial-related genes, such as CDH1, and downregulate expression of
mesenchymal-related genes, such as SNAI1 [61]. The MET is a critical early roadblock
to reprogramming and it is likely to be a determinant of successful reprogramming. For
example, inhibiting the TGF signaling pathway [62] and promoting bone morphogenic
protein (BMP) signaling [63] to enhance reprogramming efficiencies.
Furthermore, E-cadherin genes are upregulated during the MET and are critical to
establishing and maintaining pluripotency [60]. The addition of CDH1 to the OSKM
cocktail can greatly improve reprogramming efficiency by decreasing iPSC generation
time[64]. Meanwhile, the disruption of CDH1 activity through antibody blocking
significantly decreases reprogramming efficiency[65].
The extracellular, but not intracellular, domain of CDH1 is sufficient to generate
iPSCs with OSKM reprogramming factors[65]. While these and other findings suggest
that the major function of CDH1 is to promote colony formation through the MET, it is
currently the only factor capable of replacing OCT4 (a key transcriptional regulator) in
the OSKM cocktail.
After the acquisition of epithelial characteristics and the establishment of ESC-like
colony formations, reprogramming cells initiate activation of early pluripotent genes and
establish a pluripotency network through expression of the endogenous core pluripotent
genes OCT4, SOX2, and NANOG [66]. Several studies have suggested that the key
event in initiating the late hierarchical phase and in establishing the core pluripotency
network involves activation of the endogenous pluripotent initiating factor SOX2, which
7
promotes the activation of a series of downstream genes that allow the cells to enter the
pluripotent state [57].
However, if the reprogramming cells do not enter the hierarchical phase by not
expressing endogenous SOX2 or do not maintain high expression levels of endogenous
OCT4 and SOX2, these cells can relapse to an intermediate stage of reprogramming,
which further decreases reprogramming efficiencies. Furthermore, before the cells
establish and enter the core pluripotent network, they must silence exogenous OSKM
DNA [4]. However, this finding has been called into question by the contrary findings of
other studies [67].
Each of these processes is thought to be a key stage in or barrier to reprogramming
methods, and the extent to which they respectively suppress or activate these
responses is associated with higher reprogramming efficiency.
1.3 Reprogramming progression assessments
The progression of cells through the reprogramming process has been determined
by observing the morphological structure of the cell, as well as the expression of
pluripotent surface markers, such as SSEA4, Tra1-60, and alkaline phosphatase (AP),
or other transcriptional markers, such as endogenous OCT4 and NANOG[68],[52],[69].
These standards are widely accepted for assessments of iPSCs. As adult somatic cells
begin to reprogram, they change morphologically from stretched and motile cells into
compact and polarized cells, followed by colony formation. These compact colonies
have distinct borders and well-defined edges that are similar to embryonic stem cells,
and are comprised of cells with large nuclei and scant cytoplasm [68]. Although a wide
8
arrange of colony morphologies results from somatic reprogramming and appears to be
similar to embryonic stem cells, only a subset of these colonies is functionally and
molecularly comparable to ESCs. Hence, looking at morphology alone does not
accurately distinguish fully reprogrammed iPSCs from partially reprogrammed iPSCs,
nor does it accurately measure the progression towards pluripotency.
The progression of reprogramming cells can also be assessed through the
expression of cell surface markers. In mice, fibroblast cells that are undergoing
reprogramming pass through a series of cell states that are characterized by the
expression of specific surface markers. Initially, the expression of the fibroblast marker
Thy1 is lost, followed by the expression of the SSEA1 surface marker by day 3 (D3)[69].
Later in the reprogramming process, the pluripotency genes OCT4 and NANOG, as well
as AP, are expressed; these are often used as markers of successful
reprogramming[52]. Similarly, human reprogramming cells are marked by the loss of
CD13 fibroblast markers, followed by SSEA3, SSEA4 (early), Tra1-81, and Tra1-60
(late) expression[68]. These are the most common surface markers that are widely used
to distinguish human-induced pluripotent stem cells (hiPSCs). Furthermore, recent
studies have indicated that the surface marker CD30, along with other surface markers,
can greatly enhance the distinguishing and identification of fully reprogrammed cells
[70]. While the expression of surface markers provides a useful metric for measuring
reprogramming progress and assessing pluripotency, the transcriptional heterogeneity
and potential of these cells to generate fully reprogrammed iPSCs remain unknown.
Another way to measure the progression toward fully reprogrammed iPSCs is by
assessing the expression of transcriptional markers. The genome-wide expression of
9
somatic cells during reprogramming showed downregulation of fibroblast markers,
downregulation of mesenchymal-related genes, activation of chromatin modifiers,
activation of epithelial-related genes, and activation of pluripotency-related genes
[5,38,71]. For example, in early reprogramming, the transcriptional markers LOX and
LUM (fibroblast markers) and SNAI1 and TGFBR2 (mesenchymal markers), are
downregulated, whereas KAT7 (chromatin modifiers), and CDH2 (epithelial markers)
are upregulated. The expression of ZFP42 and SALL4 (pluripotency markers) is
activated during the intermediate phase of reprogramming and the expression of late
pluripotency markers DPPA2 and DPPA4, as well as the robust expression of SOX2,
may define the late, stabilization, or maturation phases of reprogramming [72].
However, due to transcriptional heterogeneity and the expression of predictive
markers in both fully reprogrammed and partially reprogrammed iPSCs, transcriptional
markers alone cannot distinguish fully reprogrammed iPSCs from partially
reprogrammed iPSCs. As a result, only the teratoma assay can accurately distinguish
fully reprogrammed iPSCs from partially reprogrammed iPSCs.
1.4 Currently proposed reprogramming models
After demonstrating that reprogramming induces pluripotent stem cells using four
defined factors, a wave of different models has been proposed to describe the kinetics
of reprogramming. In principle, somatic reprogramming can be explained by two
mechanisms: (1) a stochastic mode, in which generation of iPSCs appears to be in
variable latency as a result of random acquisition of pluripotency in reprogramming cells
[3,15,73], or (2) a deterministic mode, in which reprogramming cells undergo a defined
order of reprogramming events with fixed latency [5,68,74]. The stochastic model is
10
strongly supported by numerical modeling [69,71], whereas the deterministic
reprogramming model is supported by the transcriptional kinetics observed upon
elimination of Mbd3 [75,76].
Recently, analysis of single reprogramming cells and intermediate subpopulations
[72] has indicated that the stochastic and deterministic changes in gene expression are
associated with distinct phases of the reprogramming process [57,77]. During early
reprogramming, changes in gene expression are largely stochastic, whereas the later
stages are marked by robust expression of endogenous SOX2 [72]b with a deterministic
order of gene expression. In addition, the roadmap defined by genome-wide
transcriptional analysis reveals that there are two major waves of gene activity at the
early and late stages of reprogramming, with the stochastic phase being observed
between these stages. The deterministic reprogramming mode appears to agree with
the stabilization phase defined by Wrana, further supporting the notion of the
reprogramming process as being mostly stochastic, followed by a deterministic phase.
1.5 Scope of this thesis
Current models suggest that reprogramming to pluripotency occurs in two phases:
an extended stochastic phase followed by a rapid deterministic phase. The stochastic
phase is believed to be a major rate-limiting step in the successful generation of
induced pluripotent stem cells. Furthermore, a detailed mechanistic understanding of
the stochastic reprogramming phase continues to prove elusive despite considerable
effort.

11
The results presented here provide a precise understanding of gene expression
dynamics and mathematical modeling during the stochastic reprogramming phase.
Moreover, these results will enable the measurement and mechanistic dissection of
treatments that improve the efficiency of somatic reprogramming, along with dissecting
the importance of the initial genetic status of starting cell types.
12
Chapter 2 Single cell transcript analysis of monocistronic OSKM factors somatic reprogramming cells
2.1 Introduction
Methods of reprograming somatic cells to a pluripotent state (iPSC) have
enabled the direct modeling of human disease and ultimately promise to revolutionize
regenerative medicine [78,79]. While iPSCs can be consistently generated through viral
infection with the Yamanaka Factors OCT4, SOX2, KLF4, and c-MYC (OSKM) [1],
infected cells rapidly become heterogeneous with significant differences in
transcriptional and epigenetic profiles, as well as developmental potential [80–84]. This
heterogeneity, the low efficiency of iPSC generation (0.1-0.01%) and the fact that many
iPSC lines display karyotypic and phenotypic abnormalities [85–87] has hindered the
production of iPSCs that can be used safely and reliably in a clinical setting.
Several reprogramming studies using ChIP-seq and RNA-Seq experiments have
revealed ensemble gene expression and epigenetic changes that occur during
reprogramming by OSKM, and have greatly enhanced our understanding of the process
[79,88,53,45,55]. These studies require the use of populations of cells comprised of
heterogeneous mixtures undergoing reprogramming (0.01-0.1% of which will become
iPSC) or stable, partially reprogrammed, self-renewing lines arrested in a partially
reprogrammed state, unlikely to ever become iPSCs without additional manipulation
[81–84]. Because these techniques rely on either the ensemble properties of mixed
populations, or upon the analysis of cell lines arrested at partially reprogrammed states
that may not be representative of normal intermediate steps in a functional
13
reprogramming process, they have limited ability to reveal the changes that appear to
be essential to successful reprogramming.
Furthermore, single-cell imaging studies provide a powerful complement to
ensemble, population level analyses. Live imaging studies have identified a number of
key morphological and cell cycle related changes that occur during reprogramming to
iPSC [52,56]. These observations suggest that an ordered set of phenotypic changes
precede acquisition of the fully pluripotent state [53]. However, these studies are
necessarily limited in their molecular-genetic resolution, and they provide little insight to
the transcriptional changes accompanying key morphological and developmental
transitions in the reprogramming process. This chapter is a transcript of the manuscript
published on this work in 2014, in Plos One.
2.1.1 Single cell analysis of reprogramming reveal that reprogramming is proceed in
two major phases
Recent studies of a single-cell transcriptional analysis of reprogramming of
mouse fibroblasts by OSKM revealed that reprogramming proceeds in two major
phases: an early stochastic phase followed by a rapid “hierarchical” phase [57]. While
the latter phase appears deterministic and is characterized by the coordinated
expression of pluripotency genes in an ordered fashion, the early phase exhibits
apparently random gene expression patterns that persist through the majority of the
process [57,77]. This conclusion is further supported by two key pieces of evidence
from other studies, which specified a transgenic OSKM activity is required for the
majority of the reprogramming process, indicating that most of this process is not
governed by the concerted action of the endogenous pluripotency gene regulatory
14
network (GRN) [52,69,15], and a mechanistically undescribed period of variable
‘latency’ of cells in the stochastic phase results in significant temporal variability in the
appearance of fully reprogrammed iPSC colonies [3].
2.1.2 Chromatin remodeling during early stochastic phase of reprogramming
Several studies have attributed the protracted stochastic phase to the
requirement for extensive chromatin remodeling during reprogramming [89,90]. These
changes involve the complex coordination of factors to deposit and remove histone
modifications and DNA methylation at specific loci to achieve a pluripotent epigenetic
state. The need to reset the epigenetic landscape appears to delay the coordinated
activation of the pluripotency GRN and is likely to be a major barrier to rapid and
efficient reprogramming. Indeed, it has been shown that OSKM binding in the early
stages of reprogramming is greatly impeded by the presence of repressive chromatin,
and initial binding is largely restricted to existing open chromatin domains
[79,45,55,91,54]. Consequent remodeling of somatic cell chromatin clearly occurs, but
the order and mechanism of remodeling events during the stochastic phase is not fully
understood.
Many studies have suggested that the stochastic phase is a major rate-limiting
step in the reprogramming process, but provide little mechanistic insight into the
molecular underpinnings of these events. In addition, it has not yet been determined
how these findings translate to the reprogramming of human cells, which will be
required prior to clinical application of iPSCs. In order to alleviate these issues during
reprogramming, generating accurate map of gene expression dynamics during the
15
stochastic phase are essential and this map can provide a framework for the molecular
dissection of these rate-limiting events in reprogramming.
In this study, we perform single-cell transcript analysis of MRC-5 human lung
fibroblasts undergoing reprogramming by OSKM and demonstrate that changes in gene
expression in the stochastic phase of reprogramming are not simply gradual and
random; rather, genes are activated and inactivated at specific points during the
progression from fibroblast to iPSC. Coupling single-cell transcript profiling with
mathematical modeling, we illustrate that the gradual acquisition of pluripotency gene
expression during reprogramming occurs as an ordered, probabilistic, gene-specific
process that shows no signatures of interdependence between genes.
Furthermore, we generate reprogramming map using single cell transcript
profiling, which provides a robust model that can be used to dissect the precise
mechanisms and chromatin modifications that limit the rate and efficiency of conversion
of somatic cells to iPSC. Our results and finding will lays the foundation for the precise
measurement and mechanistic dissection of this critical rate-limiting step in
reprogramming.
16
2.2 Results
2.2.1 Reprogramming Experimental Design
In order to dissect the reprogramming mechanism, first we combine qualitatively
and quantitatively robust single-cell transcript profiling [92] with FACS to measure the
progression of individual MRC-5 human fetal lung fibroblasts through the
reprogramming process. To make our results as broadly relevant as possible, we used
viral delivery of the OSKM transgene cocktail, the most widespread method applied to
human cell reprogramming [93,94]. At select time points after transduction, cells were
dissociated, stained, analyzed and collected by FACS. FACS markers used in this study
include GFP (virus derived), αSSEA4, αTRA-1-60, and αCDH1 (see Materials and
Methods). These markers were essential and allowed for enrichment of the rare cells
exhibiting hallmarks of productive reprogramming. For example, SSEA4 and TRA-1-60
routinely provide ~30 and 3,000 fold enrichment, respectively (data not shown). While
very few SSEA4+ cells are likely to become true iPSCs, they provide a measurement of
cells that have begun to exit the fibroblast in response to OSKM transduction. In
contrast, isolation of TRA-1-60+ cells later in reprogramming (Day 14) is likely to yield a
large number of cells destined to become iPSC. In fact, >90% of these cells remain
TRA-1-60+ after sorting and subsequent culture and this stability of the TRA-1-60+
phenotype has been shown to be a major determinant for the potential of cells to
become iPSC [95]. Single cells with defined FACS phenotypes were collected into cell
lysis buffer and subject to single-cell RT-qPCR as previously described [92] (Figure 1A).
Throughout the course of this study we isolated and pre-screened 576 cells in total,
using 172 cells that passed quality control for our final analysis (see Materials and
17
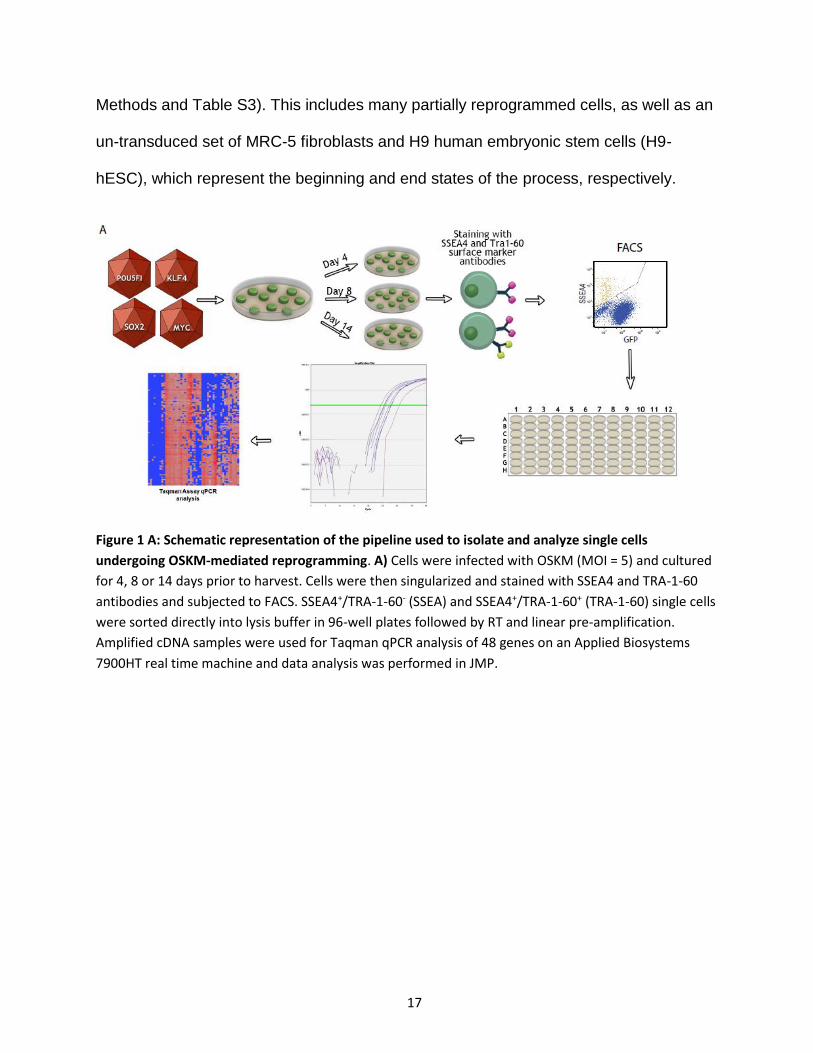
Methods and Table S3). This includes many partially reprogrammed cells, as well as an
un-transduced set of MRC-5 fibroblasts and H9 human embryonic stem cells (H9-
hESC), which represent the beginning and end states of the process, respectively.
Figure 1 A: Schematic representation of the pipeline used to isolate and analyze single cells
undergoing OSKM-mediated reprogramming. A) Cells were infected with OSKM (MOI = 5) and cultured
for 4, 8 or 14 days prior to harvest. Cells were then singularized and stained with SSEA4 and TRA-1-60
antibodies and subjected to FACS. SSEA4+/TRA-1-60- (SSEA) and SSEA4+/TRA-1-60+ (TRA-1-60) single cells
were sorted directly into lysis buffer in 96-well plates followed by RT and linear pre-amplification.
Amplified cDNA samples were used for Taqman qPCR analysis of 48 genes on an Applied Biosystems
7900HT real time machine and data analysis was performed in JMP.
18
2.2.2 Measuring progression towards pluripotency
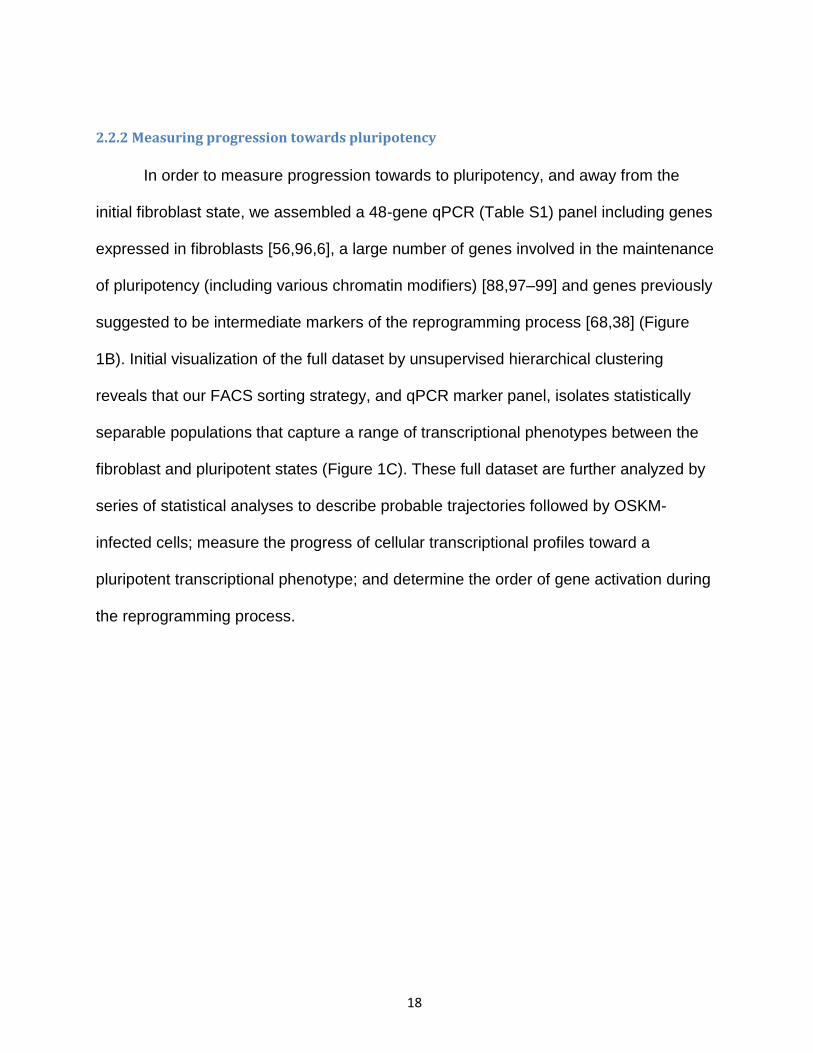
In order to measure progression towards to pluripotency, and away from the
initial fibroblast state, we assembled a 48-gene qPCR (Table S1) panel including genes
expressed in fibroblasts [56,96,6], a large number of genes involved in the maintenance
of pluripotency (including various chromatin modifiers) [88,97–99] and genes previously
suggested to be intermediate markers of the reprogramming process [68,38] (Figure
1B). Initial visualization of the full dataset by unsupervised hierarchical clustering
reveals that our FACS sorting strategy, and qPCR marker panel, isolates statistically
separable populations that capture a range of transcriptional phenotypes between the
fibroblast and pluripotent states (Figure 1C). These full dataset are further analyzed by
series of statistical analyses to describe probable trajectories followed by OSKM-
infected cells; measure the progress of cellular transcriptional profiles toward a
pluripotent transcriptional phenotype; and determine the order of gene activation during
the reprogramming process.
19
Figure 1 B-C: B) Table of the 48 gene panel used for qPCR analysis, categorized as fibroblast-associated,
pluripotency-associated, intermediate marker or chromatin modifier gene. C) Unsupervised hierarchical
clustering analysis illustrating the effective isolation of single cells by FACS for SSEA4 and TRA-1-60
surface markers. While some overlap is observed between the two populations, they are largely
transcriptionally separable. GFP+-only and CDH1+ populations have been excluded for illustrative
purposes.
20
2.2.3 Mapping the trajectory of monocistronic OSKM-infected cell throughout
reprogramming
A series statistical analysis of transcriptional profile of intermediate
reprogramming cell reveals that OSKM infected cells exit the fibroblast state along two
distinct trajectories: a productive trajectory toward increasingly ESC-like expression
profiles or an alternative trajectory leading away from both the fibroblast and ESC state.
These two pathways are distinguished by the coordinated expression of a small group
of chromatin modifiers in the productive trajectory, which marks a key early step
towards successful reprogramming and the rapid upregulation of chromatin modification
genes is consistent with the need for extensive chromatin remodeling prior to
establishment of the endogenous pluripotent GRN [79,100,73].
2.2.3.1 Principle component analysis
As a first step in visualizing our single cell transcription dataset, we used principal
components analysis (PCA) to assess the complexity and major sources of variation in
gene expression between all cells collected in our study. This analysis uncovers that the
first two PCA dimensions account for 33.1% of the observed variation, where PC1
primarily represents a cell’s distance from hESC, and PC2 primarily captures distance
from fibroblasts (Figure 2A). In addition, these two axes appear to represent distinct
trajectories followed by cells transduced with OSKM The first is a roughly linear
productive trajectory between the fibroblast and hESC groups (R2=0.60, Figure 2B) and
the second is an orthogonal trajectory leading away from fibroblast but not towards a
pluripotent phenotype (herein referred to as the alternate trajectory, or ALT).
21
2.2.3.2 Generation of reprogramming progression axis
Since the productive and alternate trajectory are well correlated with the PC1 and
PC2 dimensions respectively (Figure 2C) and capture much of the variation in our
dataset, we developed a metric to analyze our data in a 2-dimensional Euclidean space
that maps each cell’s distance (relative similarity) to the centroids of both the Fibroblast
and hESC groups. In addition, we construct a Euclidean diagonal between Fibroblast
and hESC which we term the “reprogramming progression axis”. This axis serves as a
useful measurement of a given cell’s progression towards pluripotency.
2.2.3.3 Expression of two reprogramming surface markers; SSEA4 and Tra1-60
Interestingly, when mapping the FACS-sorted phenotypes onto our Euclidean
similarity graph we noticed that, while SSEA4 and TRA-1-60 appear in the expected
order (SSEA4+ before TRA-1-60+), the SSEA4+ and SSEA4+/TRA-1-60+ populations
exhibit considerable transcriptional heterogeneity (Figure 2D). SSEA4 positive cells are
found in both the productive and alternative trajectories suggesting that, while SSEA4
may be a reliable marker of exit from the fibroblast state, it does not necessarily indicate
that cells have moved toward a pluripotent transcriptional phenotype. Even more
pronounced is the diversity of TRA-1-60 positive cells. The transcriptional phenotype of
these cells extends from a nearly fibroblast-like profile, to a nearly ESC-like profile. The
extremely high degree of transcriptional heterogeneity we observe, even within well-
defined and widely utilized FACS profiles, underscores the utility of single cell analysis
to dissect fine differences in gene expression between partially reprogrammed cells.
22
2.2.3.4 Self Organizing Map
We utilized a Self-Organizing Map (SOM) to identify separable groups along the
two previously described reprogramming trajectories in both PCA and Euclidean space
(Figure 2E and F, respectively). Four of these groups (Fib, Early, Late and Pluri) lie
along the productive trajectory from Fibroblast to ESC and the fifth encompasses cells
in the alternate trajectory (Alt). It is important to note that while these groups can be
statistically distinguished from one another, however we do not believe these represent
discrete stages in the reprogramming process. Further inspection reveals that
progression along the productive trajectory is characterized by the consolidation of
chromatin modifier expression, an increased probability of pluripotency gene
expression, a progressive decrease in the expression of fibroblast markers and
transient expression or repression of predicted intermediate markers [3,38].
By comparing transcript expression in these five SOM groups, it shows that
among the earliest distinctions between the productive and alternate trajectories (Early
vs Alt) is the induction of chromatin-modifying enzyme expression. While many of these
genes are expressed at low levels in fibroblasts, they are coordinately up-regulated in
the “Early” group, and become expressed at uniformly high levels in all cells progressing
towards pluripotency. In contrast, cells in the alternate trajectory down-regulate or
eliminate expression of these genes (Figure 2G). In addition, “Alt” cells fail to upregulate
the expression of early pluripotency genes (Figure 2H) and are found at all of the time
points examined, suggesting that these cells are unlikely to be on a trajectory that
ultimately leads to pluripotency, and most likely undergoing either transformation or
apoptosis [39,40].
23
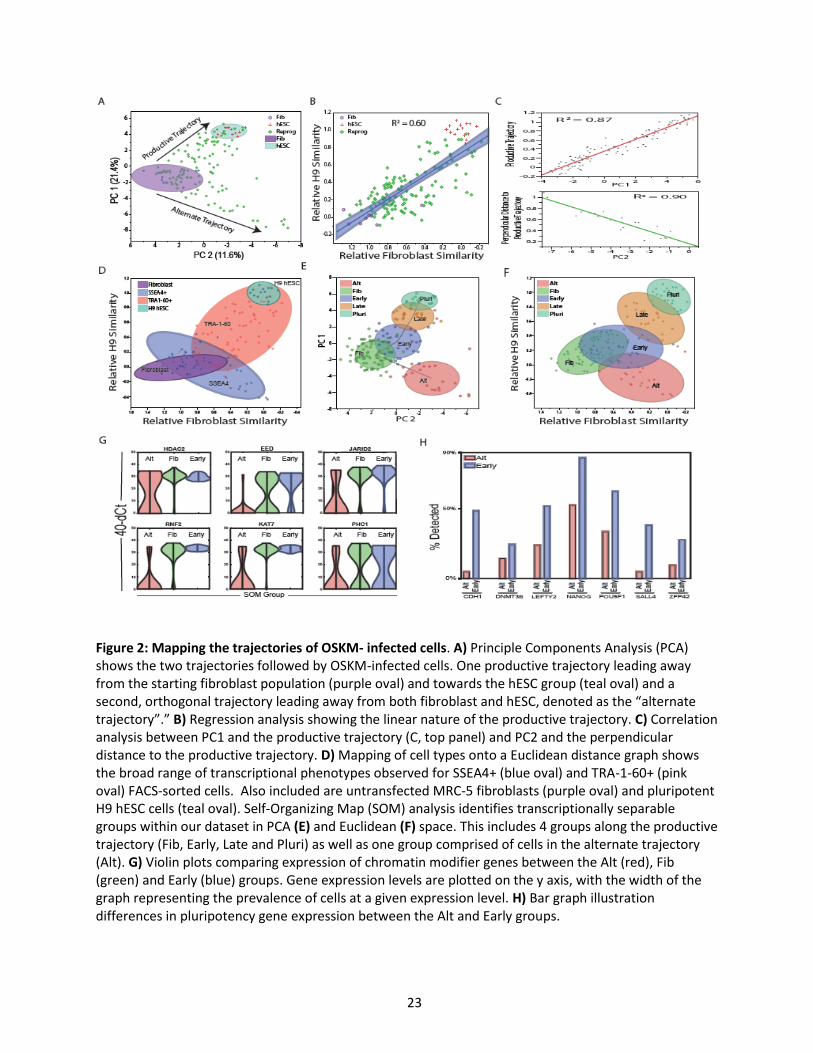
Figure 2: Mapping the trajectories of OSKM- infected cells. A) Principle Components Analysis (PCA) shows the two trajectories followed by OSKM-infected cells. One productive trajectory leading away from the starting fibroblast population (purple oval) and towards the hESC group (teal oval) and a second, orthogonal trajectory leading away from both fibroblast and hESC, denoted as the “alternate trajectory”.” B) Regression analysis showing the linear nature of the productive trajectory. C) Correlation analysis between PC1 and the productive trajectory (C, top panel) and PC2 and the perpendicular distance to the productive trajectory. D) Mapping of cell types onto a Euclidean distance graph shows the broad range of transcriptional phenotypes observed for SSEA4+ (blue oval) and TRA-1-60+ (pink oval) FACS-sorted cells. Also included are untransfected MRC-5 fibroblasts (purple oval) and pluripotent H9 hESC cells (teal oval). Self-Organizing Map (SOM) analysis identifies transcriptionally separable groups within our dataset in PCA (E) and Euclidean (F) space. This includes 4 groups along the productive trajectory (Fib, Early, Late and Pluri) as well as one group comprised of cells in the alternate trajectory (Alt). G) Violin plots comparing expression of chromatin modifier genes between the Alt (red), Fib (green) and Early (blue) groups. Gene expression levels are plotted on the y axis, with the width of the graph representing the prevalence of cells at a given expression level. H) Bar graph illustration differences in pluripotency gene expression between the Alt and Early groups.

24
2.2.3.5 Limitation of this approach
It is important to note that our analysis constructs likely reprogramming
trajectories by sampling partially reprogrammed cells. This approach is common among
many efforts to sample dynamic processes and is particularly ubiquitous in attempts to
dissect the reprogramming process [19,24,39]. We apply the standard parsimonious
assumption that the shortest path defined by these samples represents the most likely
trajectories of the process. One caveat of this approach is that we cannot exclude the
possibility that progression within the observed state-space is non-linear, and may be
complex and/or cyclical. These possibilities will need to be ruled out with longitudinal
live cell studies beyond the scope of this work. Another important consequence is that
while cells clearly take time to traverse the trajectory, we do not expect progress along a
trajectory to have a linear relationship with time. However, progress may be loosely
thought of as a surrogate for time but should not be strictly interpreted as such.
25
2.2.4 Mapping coarse changes in gene expression along the productive trajectories
2.2.4.1 Quantitative gene expression analysis
In order to provide a rough benchmark for other literature examining
transcriptional changes in ensemble samples of partially reprogramed cells, we
identified quantitative expression differences between SOM groups along the productive
trajectory (Figure 3). It is clear from our data that specific changes in gene expression
occur along different portions of the trajectory, which suggests an underlying order to
the gradual acquisition of pluripotency gene expression during the reprogramming
process. However, closer analysis reveals that there does not appear to be tight
covariance between genes activated along the progression toward pluripotency.
Representative bubble plots illustrating transcript presence and absence (Figure 3 and
Figure S2) show that genes being activated during reprogramming exhibit a period of
heterogeneity in transcript detection prior to being detected in all cells approaching
pluripotency.
Furthermore, quantitative analysis of gene expression levels also supports this
finding (Figure 3, Figure S3). These plots depict gene expression levels on the y-axis,
overlain with a distribution graph showing the range of expression values within the
population. A unimodal distribution indicates uniform expression around a mean within
the population, whereas a bimodal distribution demonstrates a transcriptionally
heterogeneous population (e.g. high/low) for the gene in question. Nearly all the genes
in our study exhibit this bimodal behavior at some point along the reprogramming
trajectory, before achieving a unimodal distribution as they approach the fully
reprogrammed state, however the point of bimodality varies in a gene-specific manner.
26
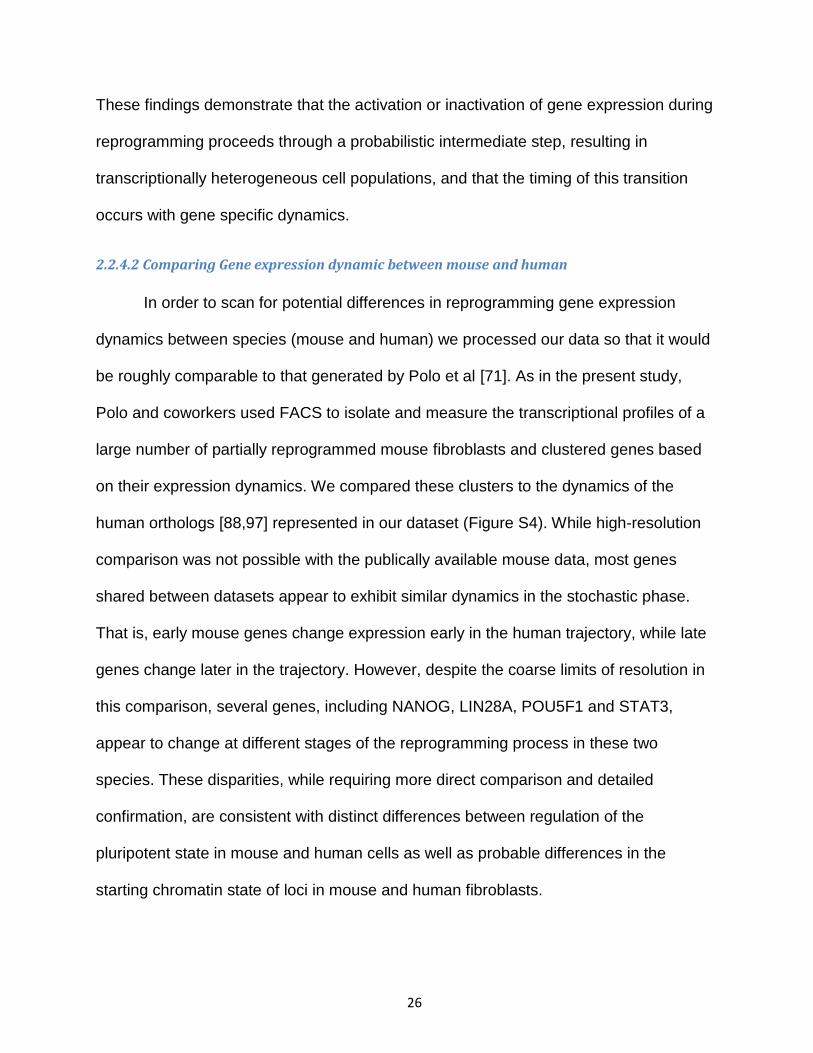
These findings demonstrate that the activation or inactivation of gene expression during
reprogramming proceeds through a probabilistic intermediate step, resulting in
transcriptionally heterogeneous cell populations, and that the timing of this transition
occurs with gene specific dynamics.
2.2.4.2 Comparing Gene expression dynamic between mouse and human
In order to scan for potential differences in reprogramming gene expression
dynamics between species (mouse and human) we processed our data so that it would
be roughly comparable to that generated by Polo et al [71]. As in the present study,
Polo and coworkers used FACS to isolate and measure the transcriptional profiles of a
large number of partially reprogrammed mouse fibroblasts and clustered genes based
on their expression dynamics. We compared these clusters to the dynamics of the
human orthologs [88,97] represented in our dataset (Figure S4). While high-resolution
comparison was not possible with the publically available mouse data, most genes
shared between datasets appear to exhibit similar dynamics in the stochastic phase.
That is, early mouse genes change expression early in the human trajectory, while late
genes change later in the trajectory. However, despite the coarse limits of resolution in
this comparison, several genes, including NANOG, LIN28A, POU5F1 and STAT3,
appear to change at different stages of the reprogramming process in these two
species. These disparities, while requiring more direct comparison and detailed
confirmation, are consistent with distinct differences between regulation of the
pluripotent state in mouse and human cells as well as probable differences in the
starting chromatin state of loci in mouse and human fibroblasts.
27
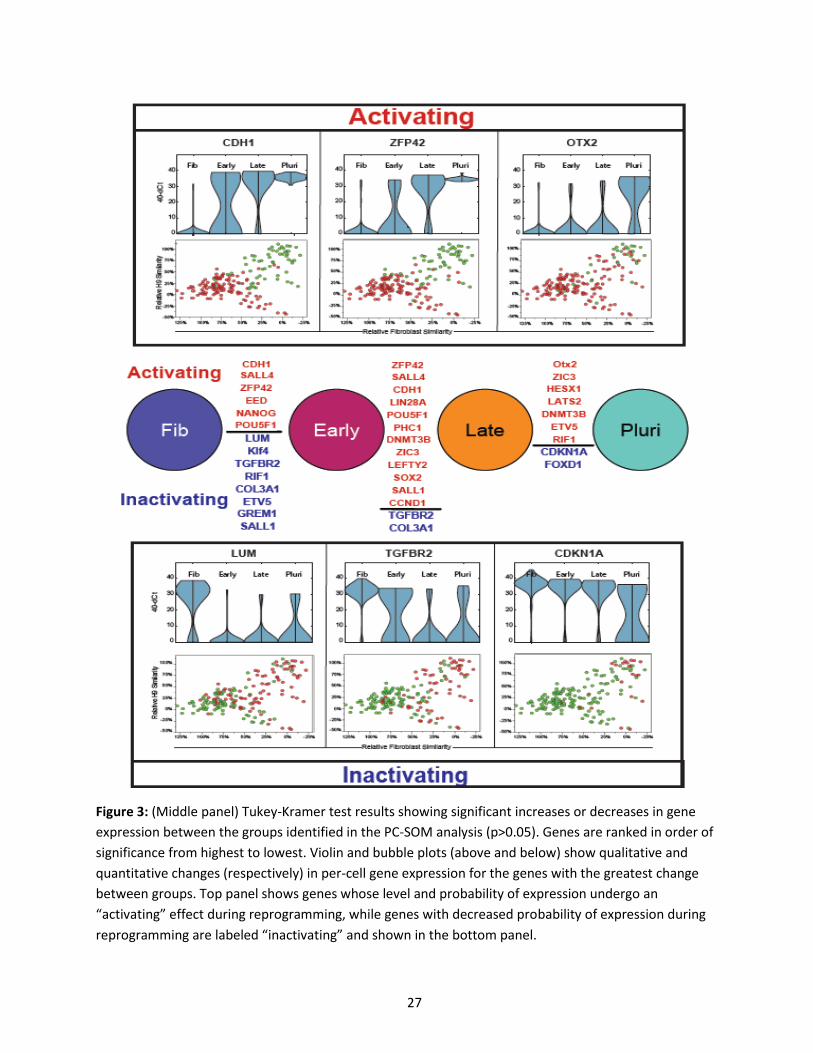
Figure 3: (Middle panel) Tukey-Kramer test results showing significant increases or decreases in gene
expression between the groups identified in the PC-SOM analysis (p>0.05). Genes are ranked in order of
significance from highest to lowest. Violin and bubble plots (above and below) show qualitative and
quantitative changes (respectively) in per-cell gene expression for the genes with the greatest change
between groups. Top panel shows genes whose level and probability of expression undergo an
“activating” effect during reprogramming, while genes with decreased probability of expression during
reprogramming are labeled “inactivating” and shown in the bottom panel.
28
2.2.5 Generation of effective reprogramming model by Gaussian Distributions
Our observation that distinct transcriptional differences exist between PC-SOM
clusters indicates that gene expression changes during the stochastic phase of
reprogramming appears to occur in an ordered fashion. However, the coarse grained
nature of this differential analysis between statistically identifiable, but not necessarily
biologically relevant groups provides little insight to the exact nature of the order of gene
expression dynamics during the stochastic phase. In particular, we wanted to address
two specific questions: 1) Is the acquisition of pluripotency gene expression random and
gradual, with all genes approaching a pluripotent profile at a uniform rate over the
course of the process?; and 2) Is there sub-structure within the patterns of gene
activation that would suggest the activation of modules within the pluripotency GRN?
We addressed these questions by differentiating between null and alternative
hypotheses (in the form of distribution models) predicting gene expression frequencies
along the reprogramming trajectory from MRC-5 to H9-ESC and comparing these to
what we observe in our experiments.
2.2.5.1 Addressing two hypothesis by two models
In order to formally address the first question, we modeled random gradual
change in gene expression by assigning each fibroblast and pluripotency marker a
uniform rate (probability) of change along the trajectory from MRC-5 to H9-ESC that
would result in predicted gene expression frequencies that match the observed
frequencies at the start (MRC-5) and end (H9-ESC) of the process [71]. In contrast, our
alternative hypothesis was that genes change expression at specific stages of the
process; in other words, gene expression during the stochastic phase is ordered. This
29
alternative scenario was modeled by fitting Gaussian probability distributions to each
gene such that the probability distribution was centered at the point of greatest change
in gene expression frequency along the reprogramming trajectory.
In order to model the behavior of transient genes, and to help calibrate
differences between goodness of fit between models, we also built more complex
models with two probability distributions, which allowed us to model genes that change
expression at two points in the process. Changes in gene expression frequency
predicted by our null model are linear, while the alternative model with one probability
distribution predicts sigmoidal changes and the two distribution model allows for more
complex dynamics of change in gene expression frequency, such as transient activation
or inactivation. The goodness of fit of each model to our observed data was then
measured for each gene in both PCA and Euclidean space using an F-test statistic.
Because goodness of fit typically scales with the number of parameters in a model, the
Gaussian models were penalized for added parameters using a corrected Akaike
Information Criterion (AIC, see Materials and Methods). The results of these tests can
be found in (Figure 4A-D and Table S2).
As demonstrated in Figure 4B, the vast majority of genes reject the null
hypothesis (F-statistic > F-Critical) in favor of a Gaussian model. Note that many genes
that reject the null hypothesis do so very strongly, while the few genes that better fit
linear dynamics do so only marginally (Figure 4C). In addition, most genes that do not
reject the uniform model exhibit little or no change over the course of reprogramming or
have noisy expression profiles. Both of these observations suggest that most gene
expression changes occurring during the stochastic phase are not simply gradual
30
acquisition of an ESC-like expression frequency, rather they turn on and off at specific
points in the process.
2.2.5.2 Comparisons of models
To further assess the confidence with which random change (uniform probability
distribution) in gene expression during the stochastic phase can be rejected by our
models (Gaussian probability distribution) is to compare the explanatory power of each
model, as adjusted for the additional parameters required in each more progressively
complex scenario. Figure 4D shows that while one normal distribution significantly
improves AIC (lower is better), two normal (or even three normal - data not shown) do
not add much explanatory power. One exception is for genes that exhibit transient
expression changes, the fits for which are shown in Figure S6.
For this reason, we suggest that gene expression dynamics during the stochastic
phase are best described as events occurring at specific points in the process, where
most gene’s expression dynamics are well described by a single normal probability
distribution centered at the point of maximal rate of change. Genes that change at very
specific points in the process have very tight probability distributions, while genes with
less precise dynamics display broader probability distributions (approaching the uniform
distribution of our null model).
31
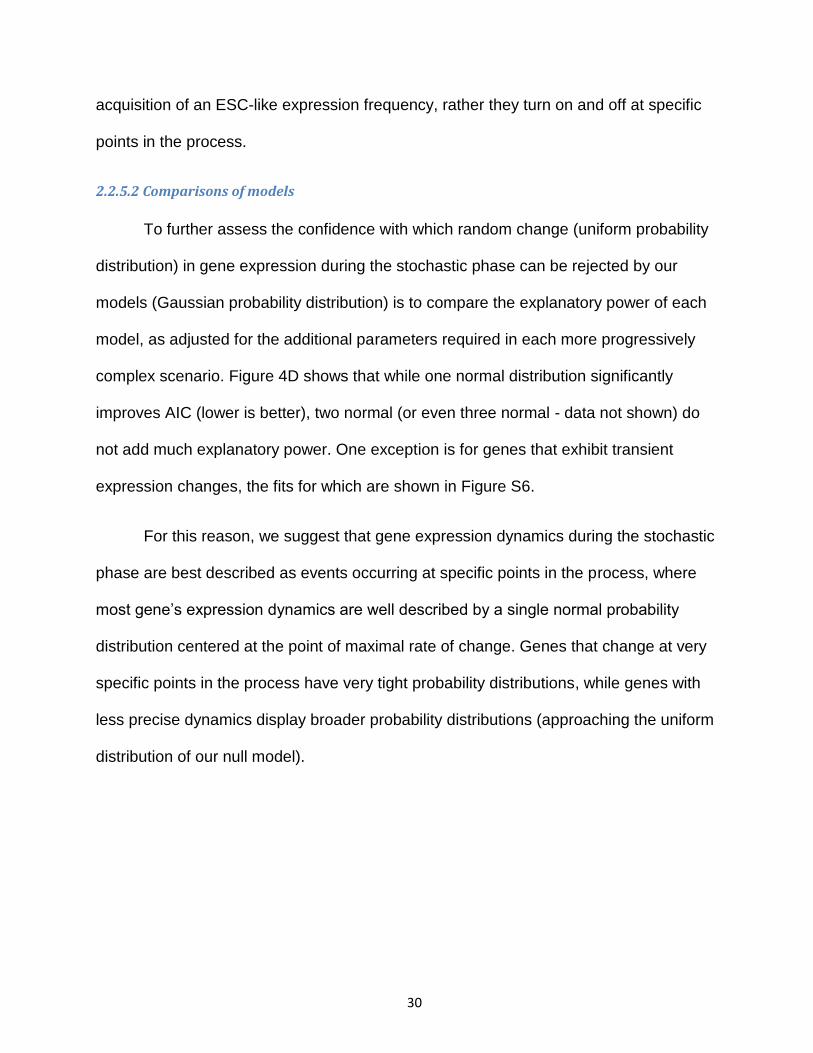
Figure 4: Rejection of a uniform model and justification of modeling using Gaussian distributions. (A)
Predicted outcomes of gene expression probabilities associated with uniform (left panel) or Gaussian
(right panel). Uniform and Gaussian probability distributions (dashed line) give rise to cumulative
probabilities (solid line) that describe the population of cells at a given point in time. A Uniform
probability results in the gradual activation / inactivation of a gene throughout the process, while
Gaussian distributions suggest a bias in expression change towards a particular point in the process. (B)
Pie charts showing the relative number of genes that accept or reject the Uniform (left panel) or
Gaussian model (right panel) as determined using an F-statistic test. The strength with which these
genes accept or reject each model is shown in (C). (D) Comparison of AICC value for all genes between
the Uniform model and a Gaussian model using one or two normal distributions. While considerable
improvement is observed for the Gaussian vs Uniform model, the addition of a second normal
distribution does not dramatically improve model fit.
32
2.2.6 Gene expression dynamics during monocistronic OSKM somatic reprogramming
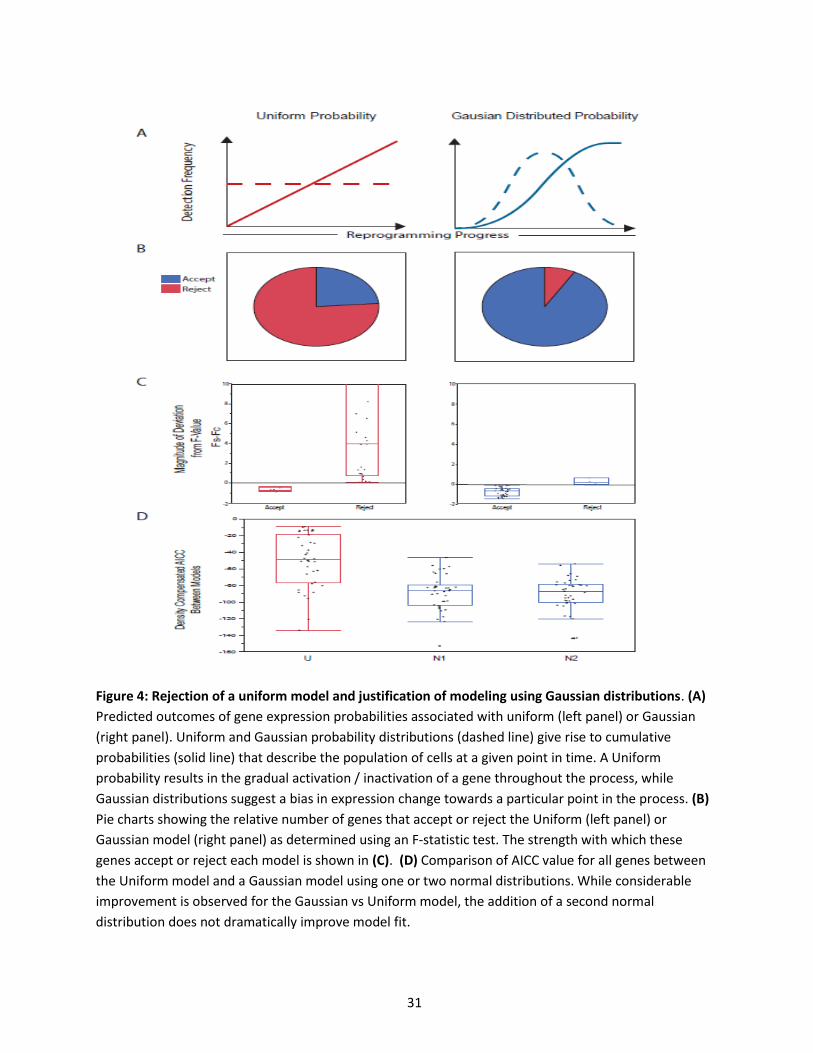
In order to compare dynamics between genes, we modeled each gene in our
study using single Gaussian probability distributions as described above. All model fits
are illustrated in the Figures S5. One example fit is illustrated for CDH1 in Figure 5A. In
this figure the black dots represent measured expression frequencies of CDH1 in sliding
windows along the inferred reprograming trajectory. The red curve shows gene
expression dynamics modeled as a Gaussian probability distribution fit to the
experimental data and the blue line illustrates expression frequencies predicted by that
probability curve.
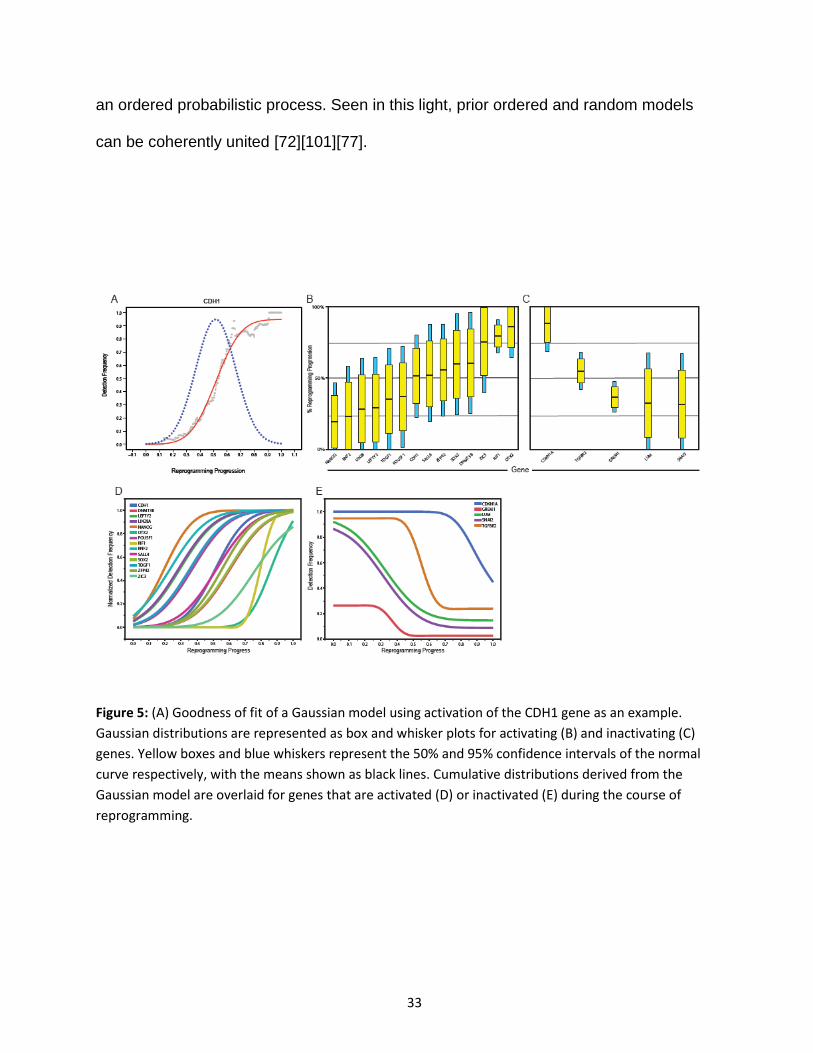
When the dynamics of several genes are compared in one graph (Figure 5B-E) it
is readily evident that genes are activated or inactivated at different points during the
reprogramming process, genes have specific stringencies in their activation dynamics
(some genes change at fairly specific stages, while others change over almost the
entire course of the process), and there is considerable overlap in the expression
probabilities of individual genes. Most genes are activated or repressed with diffuse
dynamics, while several (NANOG, CDH1, ZFP42, ZIC3 and OTX2) change at more
specific stages of the reprogramming process. The diffuse dynamics and broad
windows of activation observed for most pluripotency markers is consistent with the
longitudinal observation that the expression of the surface antigens SSEA4 and TRA-1-
60 in iPSC colonies are not strongly predictive of successful reprogramming events
[68,69].
Putting together, this data strongly supports the hypothesis that rather than being
a strictly ordered or strictly random process, the stochastic phase of reprogramming is
33
an ordered probabilistic process. Seen in this light, prior ordered and random models
can be coherently united [72][101][77].
Figure 5: (A) Goodness of fit of a Gaussian model using activation of the CDH1 gene as an example.
Gaussian distributions are represented as box and whisker plots for activating (B) and inactivating (C)
genes. Yellow boxes and blue whiskers represent the 50% and 95% confidence intervals of the normal
curve respectively, with the means shown as black lines. Cumulative distributions derived from the
Gaussian model are overlaid for genes that are activated (D) or inactivated (E) during the course of
reprogramming.
34
2.2.7 Pluripotency Gene Regulatory Network during the Stochastic Phase of Reprogramming
Having observed ordered dynamics in the stochastic phase, we sought to
determine if there was any indication that this order might arise from the partial
activation of the endogenous pluripotency GRN. Current models suggest that partially
reprogrammed cells enter a late, rapid deterministic phase that is controlled by
activation of the endogenous pluripotency GRN and may be marked (in mouse cells) by
the activation of the endogenous Sox2 locus [20,46]. Alternatively, order could emerge
gradually or fractionally during the stochastic phase. A hallmark of concerted gene
regulation as exerted by a GRN, is strong correlation (or anti-correlation) between gene
expression patterns [57,77,71].
Our model provides a powerful way to detect correlated gene expression that lies
above the background correlations inherent during reprogramming (i.e. pluripotency
markers all become expressed in fully reprogrammed cells). Based on our model, we
generate two hypotheses that can explain gene expression correlation during stochastic
phase of reprogramming. First, our null hypothesis is that during the stochastic phase
there is no dependency between genes and that all correlation between gene
expression in individual cells results simply from the increase in frequency of
pluripotency markers as cells approach an ESC-like transcriptional profile. Second, our
alternative hypothesis is that some pluripotency genes may be co-regulated (or cross-
regulate) during the stochastic phase and would thus display higher than background
levels of co-expression (as measured by correlation).
35
To test these hypotheses we used the probability profiles of each gene to
generate a simulated data set in which gene expression is determined only by the
probability profile of each gene, with no dependencies between genes. The resulting
dataset accurately recapitulates the individual dynamics of each gene in our dataset,
and provides pairwise correlation values that are solely dependent upon the
convergence of all pluripotency markers on uniform expression in ESC. We then
compared pairwise correlations between genes in this background data set with the real
correlations observed in our single-cell transcript data (Figure 6).
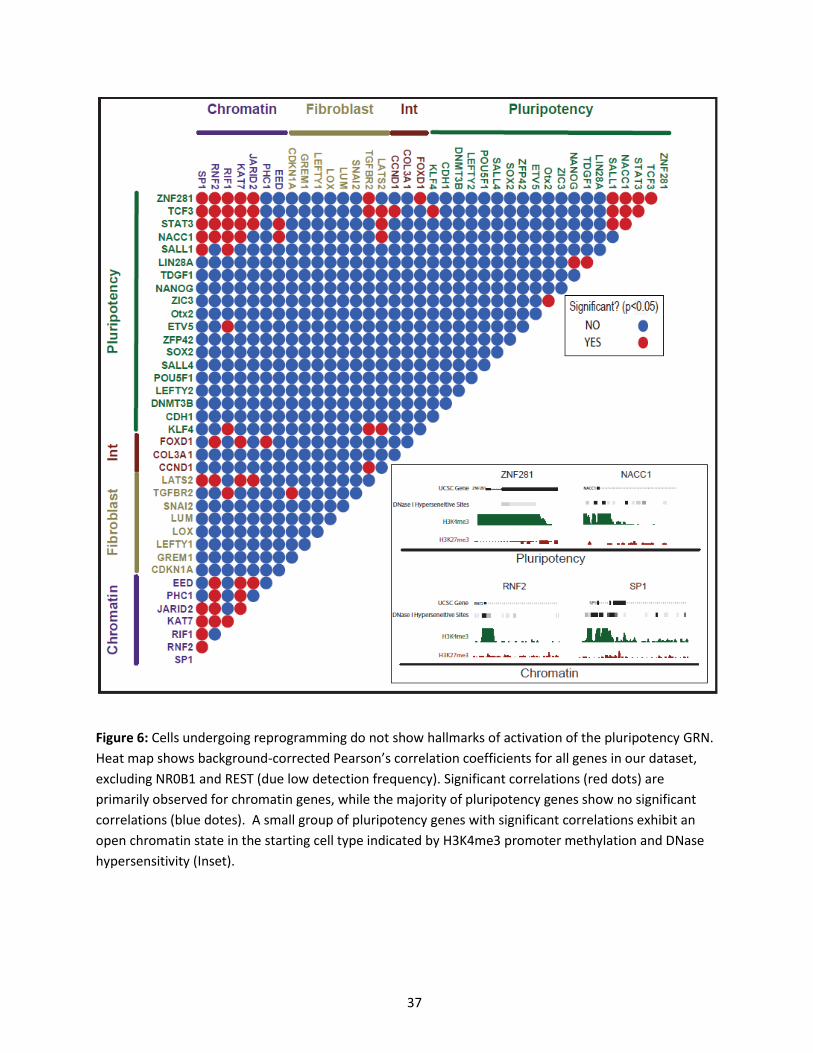
Interestingly, the only correlations we find rise above background expectations
occur between a set of chromatin regulators that distinguish between entry into the
productive trajectory and entry into the alternative trajectory (Figure 6). This coordinated
activity is likely the result of activation of the c-MYC GRN, which is known to be
activated upon OSKM induction, and is largely limited to genes with a permissive
chromatin state in fibroblasts as is the case for many chromatin modifier genes
[102,103] (Figure 6, inset).
In contrast, none of the correlations between members of the pluripotency GRN
rise above background expectations, despite their overall increase in expression
frequency as cells approach an ESC-like expression profile. We therefore accept the
null hypothesis: that despite the ordered activation of genes in the pluripotency GRN
during the reprogramming process, there is no evidence for gradual or modular
activation of the pluripotency GRN during the stochastic phase of reprogramming.

36
The numbers of genes we analyze in our study somewhat limits the power of this
analysis, and a more comprehensive single-cell study measuring many more genes
might uncover obligate relationships between genes that are not apparent in our core
pluripotency GRN gene set. However, an important outcome that follows from this result
is that the dynamics of gene activation during the stochastic phase appear to depend
only upon the local properties of each gene, rather than the sequential activation of
precursors in the GRN.
37
Figure 6: Cells undergoing reprogramming do not show hallmarks of activation of the pluripotency GRN.
Heat map shows background-corrected Pearson’s correlation coefficients for all genes in our dataset,
excluding NR0B1 and REST (due low detection frequency). Significant correlations (red dots) are
primarily observed for chromatin genes, while the majority of pluripotency genes show no significant
correlations (blue dotes). A small group of pluripotency genes with significant correlations exhibit an
open chromatin state in the starting cell type indicated by H3K4me3 promoter methylation and DNase
hypersensitivity (Inset).
38
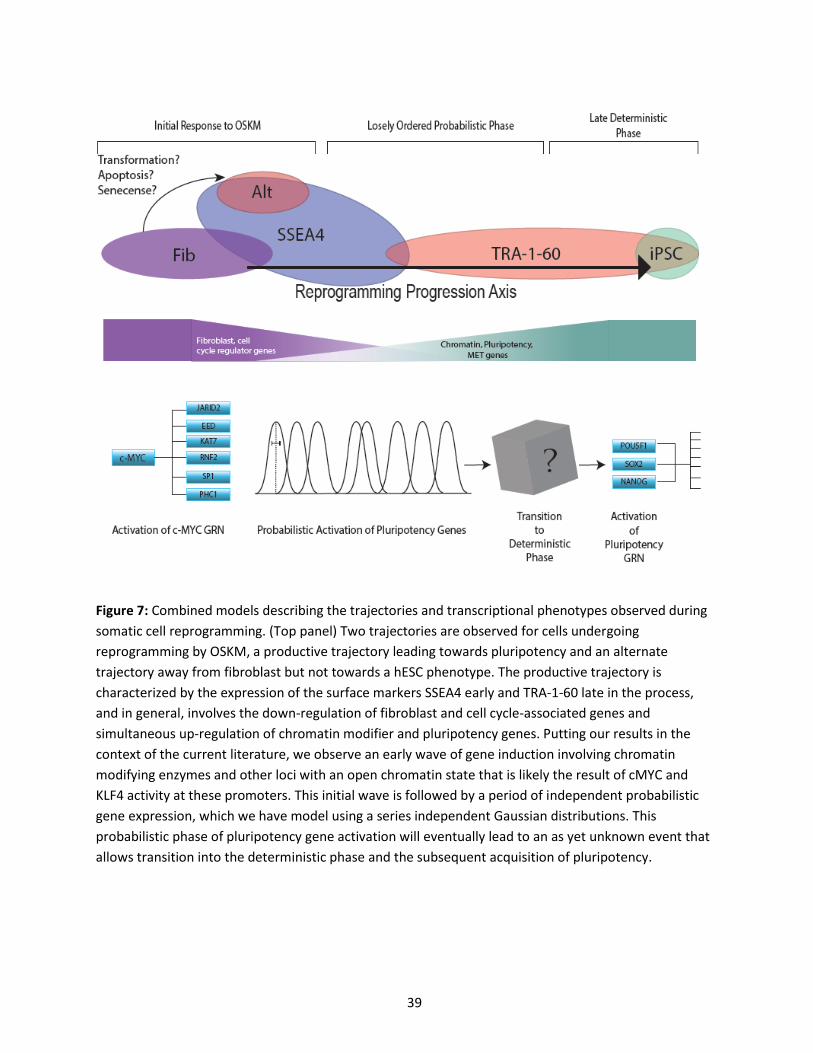
2.2.8 Reprogramming model
We generate a model (Figure 7) that describing the reprogramming trajectories,
transcriptional phenotypes and its dynamics during somatic cell reprogramming using
individual OSKM factors. Our model indicate that cells that undergoing reprogramming,
located either productive trajectory leading towards pluripotency and an alternate
trajectory away from fibroblast but not towards a hESC phenotypes. The productive
trajectory is characterized by the expression of both SSEA4 and TRA1-60 surface
markers, and in general involves the down regulation of fibroblast markers, cell cycle
associated genes, and simultaneous gene that involve in chromatin modification and
pluripotency genes are up regulated.
Furthermore, coupling our finding with other reprogramming model and
literatures, we observe early wave of gene induction involving chromatin modified
enzyme and other loci with an open chromatin state that is probably the results of KLF4
and cMYC activity at these promoters, and this initial wave is tailed by probabilistic
independent gene expression period, which describe in our model. This probabilistic
phase of gene activation will ultimately lead to yet unidentified events that allow
transition into deterministic phase and acquisition of pluripotency GRN.
39
Figure 7: Combined models describing the trajectories and transcriptional phenotypes observed during
somatic cell reprogramming. (Top panel) Two trajectories are observed for cells undergoing
reprogramming by OSKM, a productive trajectory leading towards pluripotency and an alternate
trajectory away from fibroblast but not towards a hESC phenotype. The productive trajectory is
characterized by the expression of the surface markers SSEA4 early and TRA-1-60 late in the process,
and in general, involves the down-regulation of fibroblast and cell cycle-associated genes and
simultaneous up-regulation of chromatin modifier and pluripotency genes. Putting our results in the
context of the current literature, we observe an early wave of gene induction involving chromatin
modifying enzymes and other loci with an open chromatin state that is likely the result of cMYC and
KLF4 activity at these promoters. This initial wave is followed by a period of independent probabilistic
gene expression, which we have model using a series independent Gaussian distributions. This
probabilistic phase of pluripotency gene activation will eventually lead to an as yet unknown event that
allows transition into the deterministic phase and the subsequent acquisition of pluripotency.
40
2.3 Discussion
In this study we present a rigorous single cell analysis of reprogramming in
human cells and show that the stochastic phase of reprogramming of human fibroblasts
by OSKM is an ordered probabilistic process which can be simply modeled using
independent Gaussian distributions. An advantage of our approach lies in the fact that it
makes no a priori assumptions about the progression of cells toward pluripotency,
based on time or surface marker expression, both of which are poor indicators of
reprogramming progress.
In addition, the simplicity of our model and its exceptional fit to our observed
expression dynamics provide a tractable framework for further dissecting the rate-
limiting aspects of reprogramming. The results of this work also unify existing ordered
and random models of the stochastic phase of reprogramming [68,52,56,57,15,3] and
are consistent with observations from both population level and single cell studies of
gene expression changes during reprogramming [68,38,72]. The ordered nature of the
stochastic phase is readily apparent in the distinct, gene-specific expression dynamics
we observe during reprogramming, while the probabilistic nature of the process is
evident in broad gene-specific expression dynamics over large portions of the
reprogramming trajectory (Figure 5 and Figure 7), and the apparently independent
control of gene expression dynamics during the stochastic phase (Figure 6). These
findings are consistent with a recent study by Tanabe et al. [95] that suggests the TRA-
1-60+ phenotype is unstable and transcriptionally heterogeneous and that stabilization
of the TRA-1-60+ population is a critical rate limiting step in reprogramming.
41
2.3.1 Transcriptional Heterogeneity expression
We note that variations in the cell cycle could contribute to the transcriptional
heterogeneity of a subset of genes in our dataset. However recent studies in hESC
have shown that the transcription of genes associated with pluripotency does not
fluctuate during the cell cycle [104], suggesting that cell cycle status is unlikely to have a
major impact on our analysis of the activation of the pluripotency GRN. In addition, the
persistence of cyclin transcripts throughout the cell cycle and their considerable post-
transcriptional regulation in ESC’s [105], precludes strong inference of cell cycle status
from transcriptional measurement of a single cell-cycle regulator.
Another possible source of transcriptional heterogeneity between partially
reprogrammed cells in our cultures could be the delivery of O, S, K, and M on individual
vectors (as is standard in widely utilized human reprogramming protocols). However the
broad agreement of expression dynamics over the course of reprogramming between
our results using individual viral delivery, and those reported by Polo et al using an
inducible, polycistronic construct in a clonal cell line, suggests that viral heterogeneity
does not fundamentally affect the order of gene expression dynamics, or the shape of
the trajectory of cells undergoing the reprogramming process.
Furthermore, the initial description of the highly heterogeneous nature of the
stochastic phase by Buganim et al was also derived from data using clonal cells
expressing OSKM from an inducible polycistronic OSKM construct. Thus, the stochastic
nature of this phase does not appear to be a direct consequence of OSKM
heterogeneity. However, these results do not rule out the possibility that each of the
OSKM factors have distinct roles in various stages of the reprogramming process, nor
42
that heterogeneity in OSKM content will be observed across the partially reprogrammed
population of cells. Indeed, understanding the role of each factor in the reprogramming
process and the critical window for the action of each represents an important goal of
future work.
2.3.2 Activation of genes during reprogramming
One consequence of the independent activation of genes during reprogramming
is that an extremely wide variety of cell states are present during the reprogramming
process, which gives the overt appearance of disorder. Thus, while any given partially
reprogrammed cell’s gene expression pattern may appear to be random, the
probabilities of expression of individual genes are clearly biased towards specific points
along the reprogramming trajectory. One implication of these findings is that any single
marker is unlikely to be effective at determining the extent to which a given cell has
been reprogrammed [68,5].
2.3.3 Local chromatin architecture of the pluripotency gene attribute to reprograming
efficiency
A likely explanation for the apparent lack of deterministic behavior during the
stochastic phase may be the existence of as yet unidentified, gene-specific factors that
restrict the rate of transcription activation by OSKM. One compelling candidate for these
factors is the local chromatin architecture of the pluripotency genes in the starting
somatic cell type. Indeed, epigenetic remodeling was implicated as a major rate limiting
step in even the earliest days of somatic cell reprogramming using nuclear transfer
[89,90] and is almost certainly one of the most important probabilistic events limiting the
rate and efficiency of reprogramming. Many reports have experimentally validated this
43
hypothesis by demonstrating that global chromatin reorganization is critical for
successful reprogramming [79,45,55,54]. Because many of the required changes in
chromatin state appear to occur in a slow and probabilistic fashion [106–108] it is likely
that these changes limit the rate at which exogenous OSKM can activate the
endogenous pluripotency GRN thus limiting the efficiency and speed of reprogramming
and endowing the majority of the process with stochastic dynamics.
2.3.4 Successful Reprogramming required enhance expression of chromatin modifiers
Our finding, that enhanced expression of chromatin modifiers is a hallmark of
entry into productive reprogramming complements several studies demonstrating that
successful reprogramming requires the gradual erosion of epigenetic barriers to
activation of the pluripotency GRN by OSKM [79,91,54,109,4]. This event is likely
governed by the activity of c-MYC, which together with KLF4, acts early in
reprogramming to activate loci with permissive chromatin states, including many
chromatin modifier loci in fibroblasts [45,91]. In addition, many treatments known to
enable chromatin remodeling have been shown to enhance the rate and/or efficiency of
the reprogramming process [109,39,110,40], while, conversely, knocking down factors
required for such epigenetic changes can inhibit or prevent successful reprogramming
[109,39,40,111–113]. However, with the exception of some very early events [45,91] the
order and precise identity of chromatin modifications required for successful
reprogramming is not yet well known.
By precisely describing and modeling gene expression dynamics during the
stochastic phase the present study provides a quantitative framework for dissecting

44
these key rate limiting steps and will enable the mechanistic dissection of interventions
known to accelerate or enhance the efficiency of the reprogramming process.

45
Chapter 3 Polycistronic delivery of OSKM reprogramming factors improves
reprogramming efficiency compared to monocistronic reprogramming
3.1 Introduction
Many efforts to illuminate the molecular underpinnings of reprogramming have
been complicated by the inefficiency and temporal asynchrony of the process. Only
0.01-1% of cells reach the pluripotent state and they do so at different rates over the
course of a 3- to 4-week period. As a result, the majority of studies conducted to date
that rely on bulk measurement of heterogeneous populations of cells are inherently
biased towards analyzing unsuccessful reprogramming events. Thus, measurement of
transcriptional or other events leading to pluripotency may be obscured. To overcome
this limitation of bulk analysis our group and others have used single cell analysis and
mathematical modeling to deconstruct the transcriptional and protein-level changes
occurring in cells undergoing reprogramming [53,72,114,115].
By profiling individual cells en route to pluripotency, we are better able to assess
how the pluripotency gene regulatory network (GRN) becomes activated in response to
the OSKM factors. Specifically, it allows us to determine whether this activation
happens as a series of concerted deterministic events or occurs gradually over the
duration of the process. Equally important is the ability to measure what appear to be
unsuccessful reprogramming events leading to trajectories other than pluripotency.
Identifying common features in divergent cells can reveal events that prevent cells from
becoming iPSCs.
46
An earlier work proposed a model wherein acquisition of pluripotency is primarily
limited by an early probabilistic or stochastic phase. During this phase, genes
associated with pluripotency activate independently and lack the coordinated
expression that is characteristic of a stable pluripotent state [56,3,72,101]. This period
can persist for a variable length of time, after which cells that have made the requisite
epigenetic and transcriptional changes activate the pluripotency gene regulatory
network (GRN) and are stabilized in the iPSC state [77,72,75]. The stabilization of this
network requires precisely controlled levels of OSKM expression [91,116]. Premature
inactivation of exogenous OSKM fails to generate iPSCs [15,117]. Conversely, failure to
inactivate the OSKM cassette forces cells into an alternate ESC-like state, distinct from
iPSCs [118]. Given the relationship between factor stoichiometry and efficiency, it is
important to assess how variations in the reprogramming method impact the acquisition
of pluripotency.
Comparing monocistronic and polycistronic viral delivery of the four factors is of
particular interest, as this remains the most widely utilized reprogramming strategy in
the human system [64,1]. Monocistronic delivery enables flexibility in the stoichiometry
of factor delivery due to random integration of the individual constructs. However, many
cells receive combinations of factors that are suboptimal for reprogramming or ones that
may cause cells to take a different trajectory to the pluripotent state [116,119]. By
contrast, polycistronic delivery fixes the ratio of factor delivery at 1:1:1:1, a ratio that
may not be optimal for successful reprogramming, but one that guarantees that all
transfected cells will carry a full complement of the reprogramming factors. In separate
studies, it has been demonstrated that mono- and polycistronic systems reprogram cells
47
at different efficiencies in mice (0.01% and 0.5%, respectively), and in humans (0.2%
and 1.5%, respectively) [1,94,112,48,120]. However, no direct comparison of these
methods has yet been performed. Furthermore, species-specific differences in the
molecular events leading to pluripotency exist between mice and humans [30], further
complicating the comparison of these two techniques and underscoring the importance
of studying reprogramming in human cells for clinical purposes.
In this chapter, we use single-cell transcript analysis to compare the
transcriptional dynamics underlying the acquisition of pluripotency in monocistronic and
polycistronic OSKM systems. We demonstrate that polycistronic viral delivery produced
significantly higher reprogramming efficiencies than monocistronic delivery, and that this
effect is caused in part by premature inactivation of the individual O, S, K, or M vectors
in the monocistronic method. In addition, we show that the activation of key pluripotency
loci, such as NANOG, OCT4, LIN28, and DNMT3B, occurred earlier in the polycistronic
condition, and that these cells progressed more uniformly toward pluripotency.
48
3.2 Results
3.2.1 Monocistronic and polycistronic reprogramming efficiency
To assess the reprogramming efficiency of the monocistronic (Mono) and
polycistronic (Poly) reprogramming methods, we used FACS to analyze the percentage
of SSEA4 single-positive (S+T-) and SSEA4/TRA-1-60 double-positive (S+T+) cells,
markers associated with early and late reprogramming, respectively [68,69,5]. We
observed a significant enrichment of S+T- cells in the Poly condition compared to the
Mono condition, which increased from a 2-fold difference at D4 to a greater than 8-fold
difference at D14. This trend was seen in TRA-1-60+ cells as well, where Poly exhibits
an approximately 15-fold increase at both time points analyzed (Figure 8C).
To determine whether the difference in SSEA4 and TRA-1-60 expression
between the conditions was correlated with reprogramming efficiency, we stained and
counted AP+ colonies at D21 and D28. Poly cells had 10-fold more AP+ colonies than
Mono cells at D21, and this increase was even more pronounced at D28, the point at
which colonies are typically selected to establish iPSCs (Figure 8D). This corresponds
to an efficiency of approximately 5% and 0.5% for Poly and Mono cells, respectively.
This is consistent with previous reports showing a 10-fold increase in reprogramming
efficiency between the two conditions, albeit in separate studies [64,1,121]. In our
experience, Mono colonies tended to be broad and covered more area than Poly
colonies, which were small and punctate. Example colonies are shown in Figure 8B. To
ensure that this difference in morphology did not skew our colony-counting results, we

49
also measured the total area of the plate that was covered by AP+ cells. We still
observed significantly higher AP-positivity in Poly than in Mono cells (Figure 8E).
Figure 8 (B-E): Polycistronic delivery of OSKM increased efficiency compared to monocistronic vectors B) Representative images of AP+ MRC-5 colonies reprogrammed with either monocistronic (top) or polycistronic (bottom) viruses. C) Quantification of SSEA4+ / Tra1-60- and SSEA4+ / Tra1-60+ cells at D7 and D14 in both monocistronic and polycistronic conditions. Polycistronic reprogramming produced 10-fold more AP+ colonies in terms of both number (D) and area (E) covered.
3.2.2 Experimental Design
To measure transcripts in individual cells at various points in the reprogramming
process, we infected MRC-5 fibroblasts with a polycistronic construct containing all four
Yamanaka factors (Poly). We then isolated cells by FACS at D4, D7, D11, D14, and
D21 using the surface markers SSEA4 and TRA-1-60 to enrich for early (SSEA4+/TRA-
1-60-) and late (SSEA4+/TRA-1-60+) reprogramming events, respectively (Figure 8A).
These cells were sorted into 96-well PCR plates and processed through our single-cell
pipeline. qPCR was performed using a Fluidigm Biomark against a 96-marker panel
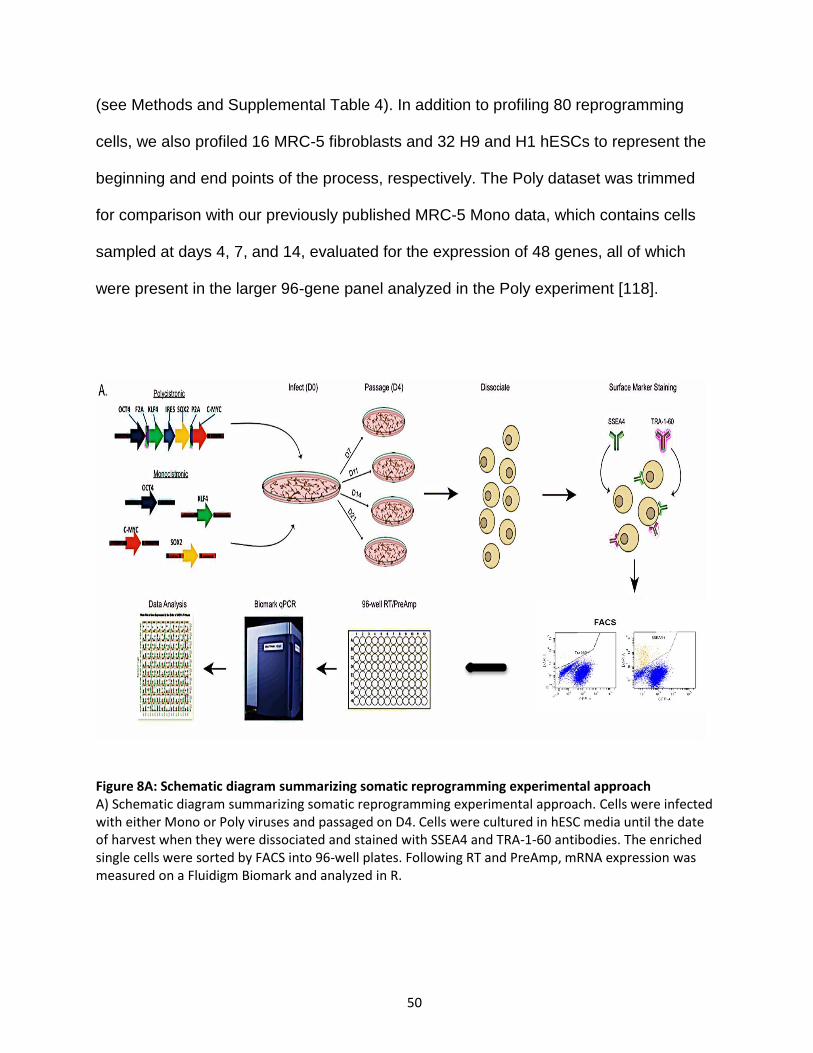
50
(see Methods and Supplemental Table 4). In addition to profiling 80 reprogramming
cells, we also profiled 16 MRC-5 fibroblasts and 32 H9 and H1 hESCs to represent the
beginning and end points of the process, respectively. The Poly dataset was trimmed
for comparison with our previously published MRC-5 Mono data, which contains cells
sampled at days 4, 7, and 14, evaluated for the expression of 48 genes, all of which
were present in the larger 96-gene panel analyzed in the Poly experiment [118].
Figure 8A: Schematic diagram summarizing somatic reprogramming experimental approach A) Schematic diagram summarizing somatic reprogramming experimental approach. Cells were infected with either Mono or Poly viruses and passaged on D4. Cells were cultured in hESC media until the date of harvest when they were dissociated and stained with SSEA4 and TRA-1-60 antibodies. The enriched single cells were sorted by FACS into 96-well plates. Following RT and PreAmp, mRNA expression was measured on a Fluidigm Biomark and analyzed in R.
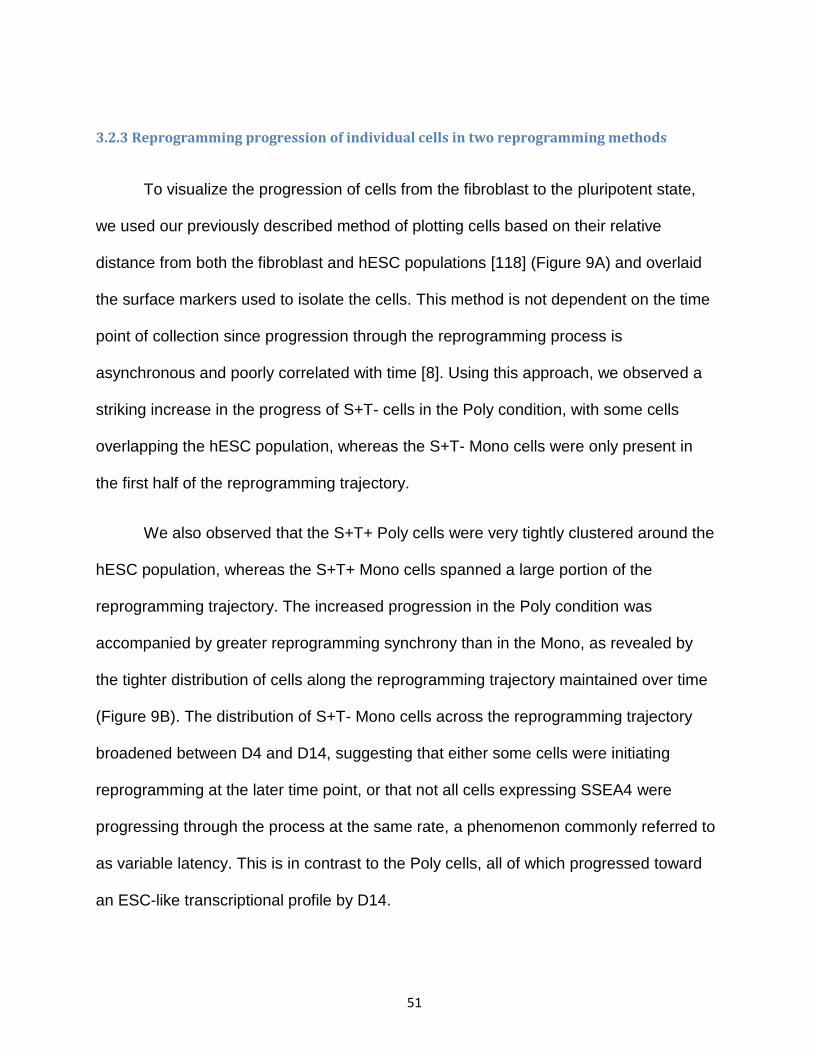
51
3.2.3 Reprogramming progression of individual cells in two reprogramming methods
To visualize the progression of cells from the fibroblast to the pluripotent state,
we used our previously described method of plotting cells based on their relative
distance from both the fibroblast and hESC populations [118] (Figure 9A) and overlaid
the surface markers used to isolate the cells. This method is not dependent on the time
point of collection since progression through the reprogramming process is
asynchronous and poorly correlated with time [8]. Using this approach, we observed a
striking increase in the progress of S+T- cells in the Poly condition, with some cells
overlapping the hESC population, whereas the S+T- Mono cells were only present in
the first half of the reprogramming trajectory.
We also observed that the S+T+ Poly cells were very tightly clustered around the
hESC population, whereas the S+T+ Mono cells spanned a large portion of the
reprogramming trajectory. The increased progression in the Poly condition was
accompanied by greater reprogramming synchrony than in the Mono, as revealed by
the tighter distribution of cells along the reprogramming trajectory maintained over time
(Figure 9B). The distribution of S+T- Mono cells across the reprogramming trajectory
broadened between D4 and D14, suggesting that either some cells were initiating
reprogramming at the later time point, or that not all cells expressing SSEA4 were
progressing through the process at the same rate, a phenomenon commonly referred to
as variable latency. This is in contrast to the Poly cells, all of which progressed toward
an ESC-like transcriptional profile by D14.
52
3.2.4 Generation of a logistic regression model
The period of variable latency may result from the stochastic and uncoordinated
activation of pluripotency loci required to drive cells toward the pluripotent state [polo
2012]. Because cells reprogrammed by the polycistronic method progressed more
uniformly toward the ESC state than by the monocistronic method, we asked whether
the activation of pluripotency loci or the inactivation of fibroblast-associated loci was
more tightly coordinated in Poly cells. To answer this question, we improved upon our
published method [118] (Methods) to model the gene expression changes following the
reprogramming trajectory from fibroblast to hESC.
Our new method improved accuracy compared to our previous model, while also
reducing the number of parameters to minimize bias. We defined the reprogramming
trajectory by projecting cells into a 2-dimensional PCA space and fitting a polynomial
curve through the dataset. We then found the shortest distance from each point to the
curve and assigned a value for that cell along the trajectory. These values were scaled
from 0 to 1, representing the beginning and end of the process, respectively. For each
gene in our dataset, we reduced the data to presence/absence calls and fit a logistic
regression to the data, representing a continuous measure of the probability of detecting
a given gene over the course of reprogramming.
In addition, we gained information about when a gene was activated in the
majority of samples and how rapidly that change occurred based on the point of
greatest change in probability and on the steepness of the curve, respectively. An
53
example fit curve is shown in Figure 9C, with dashed lines representing bootstrapped
confidence intervals around the fit curve. The expectation of this model is that
conditions where gene expression changes rapidly corresponds to a reprogramming
process with fewer barriers to the transcriptional activation/inactivation events that are
necessary to reach pluripotency and more closely resembles a deterministic, rather than
probabilistic, process.
Figure 9 (A-C): Polycistronic reprogramming exhibited uniform progression and rapid activation of pluripotency targets A) Reprogramming trajectory of Mono (left) and Poly (right) cells plotted by Euclidean distance from fibroblast (x-axis) and hESC (y-axis). Fibroblasts and hESC are marked by pink and green ovals, respectively, whereas SSEA4+ and TRA-1-60+ cells are shown in teal and purple, respectively. B) Boxplot shows the progression of cells from each condition as a function of time. Both SSEA4+ and TRA-1-60+ Poly cells progressed more and were more tightly distributed at D14 than comparable cells from Mono. C) Example logistic regression fit of NANOG expression in Mono (red) and Poly (blue) reprogramming with bootstrapped confidence intervals (dashed lines). Points represent the binary expression data for each cell used in the model fitting.
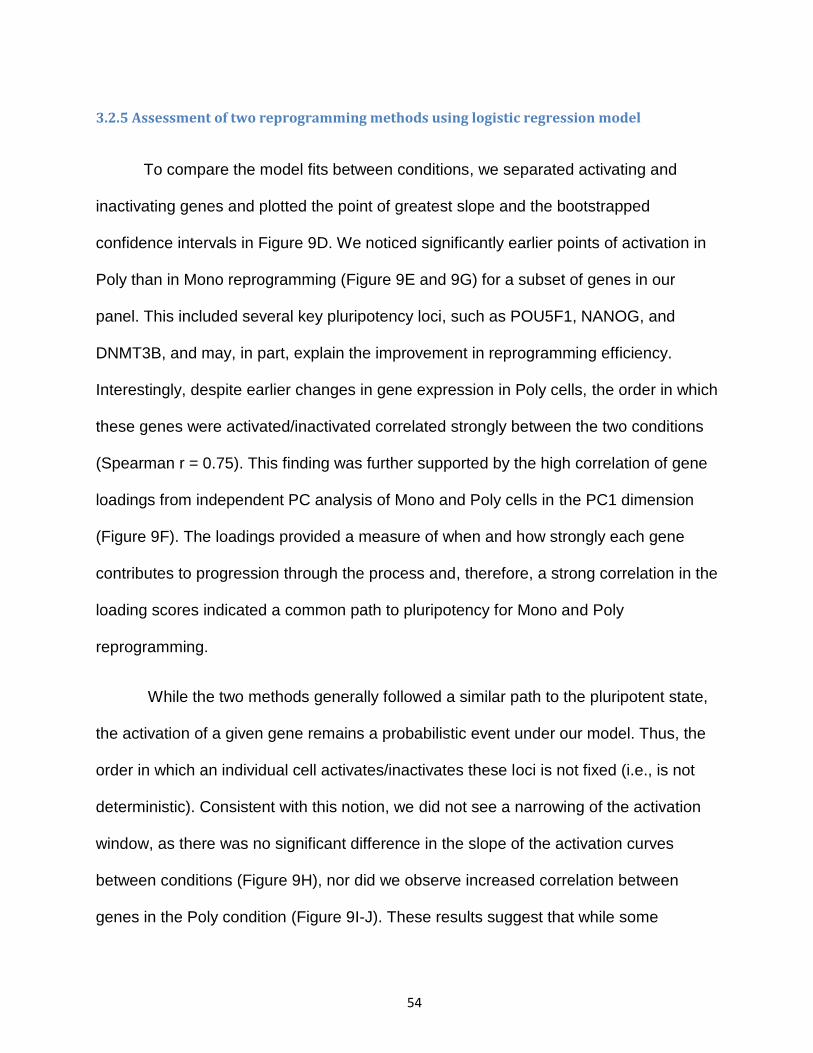
54
3.2.5 Assessment of two reprogramming methods using logistic regression model
To compare the model fits between conditions, we separated activating and
inactivating genes and plotted the point of greatest slope and the bootstrapped
confidence intervals in Figure 9D. We noticed significantly earlier points of activation in
Poly than in Mono reprogramming (Figure 9E and 9G) for a subset of genes in our
panel. This included several key pluripotency loci, such as POU5F1, NANOG, and
DNMT3B, and may, in part, explain the improvement in reprogramming efficiency.
Interestingly, despite earlier changes in gene expression in Poly cells, the order in which
these genes were activated/inactivated correlated strongly between the two conditions
(Spearman r = 0.75). This finding was further supported by the high correlation of gene
loadings from independent PC analysis of Mono and Poly cells in the PC1 dimension
(Figure 9F). The loadings provided a measure of when and how strongly each gene
contributes to progression through the process and, therefore, a strong correlation in the
loading scores indicated a common path to pluripotency for Mono and Poly
reprogramming.
While the two methods generally followed a similar path to the pluripotent state,
the activation of a given gene remains a probabilistic event under our model. Thus, the
order in which an individual cell activates/inactivates these loci is not fixed (i.e., is not
deterministic). Consistent with this notion, we did not see a narrowing of the activation
window, as there was no significant difference in the slope of the activation curves
between conditions (Figure 9H), nor did we observe increased correlation between
genes in the Poly condition (Figure 9I-J). These results suggest that while some

55
pluripotency genes were activated earlier in the process in Poly reprogramming, neither
coordinated GRN activity nor deterministic behavior was observed.
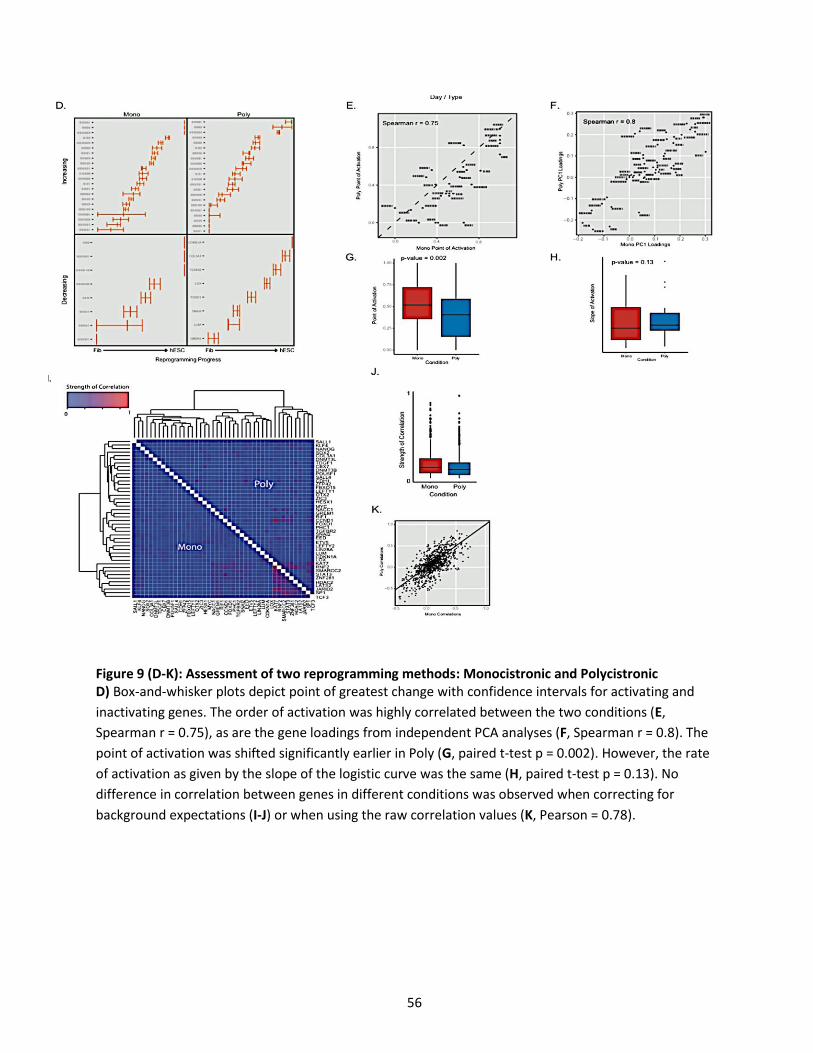
56
Figure 9 (D-K): Assessment of two reprogramming methods: Monocistronic and Polycistronic D) Box-and-whisker plots depict point of greatest change with confidence intervals for activating and
inactivating genes. The order of activation was highly correlated between the two conditions (E,
Spearman r = 0.75), as are the gene loadings from independent PCA analyses (F, Spearman r = 0.8). The
point of activation was shifted significantly earlier in Poly (G, paired t-test p = 0.002). However, the rate
of activation as given by the slope of the logistic curve was the same (H, paired t-test p = 0.13). No
difference in correlation between genes in different conditions was observed when correcting for
background expectations (I-J) or when using the raw correlation values (K, Pearson = 0.78).
57
3.2.6 Heterogeneity expression of exogenous OSKM reprogramming factors
Given that gene activation/inactivation was only slightly enhanced in polycistronic
reprogramming and that the overall dynamics of the process appear similar between
conditions, we looked for other factors that might be contributing to the poor efficiency of
Mono reprogramming. We hypothesized that OSKM heterogeneity might contribute to
the low efficiency of Mono reprogramming because the factors are delivered on
separate viral particles. To test this hypothesis, we included SYBR primers targeting
synthetic 3’-UTR regions present in the individual OSKM constructs, which allowed us
to measure the expression of the transgenes in all single cells collected for this
experiment, in addition to the 48-gene panel analyzed above. Looking at all four factors
collectively, it is apparent that a vast minority of cells expressed all four exogenous
factors, with most cells expressing only one or two of the transgenes, including cells
close to the hESC state (Figure 10A).
Interestingly, cells that expressed the full complement of reprogramming factors
were clustered early in the reprogramming trajectory, with no four-factor containing cells
progressing beyond the 50% mark. By contrast, most cells late in the trajectory
expressed only one or two factors, typically either OCT4, MYC, or both (Figure 10B). As
expected, nearly all cells progressing along a previously described alternate trajectory
away from both fibroblast and hESC lacked expression of all reprogramming factors
except MYC, illustrating the requirement of OSK expression for productive
reprogramming.

58
3.2.7 Expression of endogenous and exogenous OSKM reprogramming factors in
monocistronic reprogramming
The considerable heterogeneity of transgene expression in Mono reprogramming
cells led us to compare the expression of the endogenous (ENDO) and exogenous
(EXO) copies of the OSKM factors to see whether cells lacking transgene expression
exhibited activation of the endogenous copy (Figure 10B). Nearly all Mono cells
expressed exogenous MYC, whereas only three cells expressed the endogenous form.
This can probably be attributed to the profound proliferative effects of high levels of
MYC expression [45,102,103,4], which resulted in the expansion of this population and
increased the likelihood of their being sampled in our experiment.
By contrast, EXO-KLF4 was detected in very few cells. However, the
endogenous form is present in the majority of samples. This is consistent with the role
played by KLF4 in promoting MET, an essential step in reprogramming that occurs late
in the process [44–46].
Moreover, consistent with previous reports that OCT4-high SOX2-low is an
optimal stoichiometry factor for reprogramming [114,116], we noticed that the
expression of exogenous OCT4 and SOX2 exhibited opposite patterns, with EXO-SOX2
expressing cells confined to the first half of the reprogramming trajectory and EXO-
OCT4 cells persisting until the later stages of reprogramming (Figure 10B).
In addition, many late-reprogramming cells expressed both the ENDO and EXO
forms of OCT4, further supporting this notion. Surprisingly, approximately 50% of late
reprogramming cells failed to express either ENDO or EXO-SOX2. In mice, SOX2 is
59
required for entry into the deterministic phase and stabilization of the pluripotent state.
The absence of SOX2 in some of our late reprogramming cells raises the question as to
whether or not these cells will successfully reprogram. In addition, it is unclear whether
these cells were capable of progressing to the late stages of reprogramming in the
absence of SOX2 expression, or whether the SOX2 virus was prematurely inactivated
prior to completing the process.
Figure 10 (A-B): Expression of OSKM transgenes was heterogeneous in monocistronic reprogramming A: Reprogramming trajectory overlaid with number of transgenes expressed within each cell as determined by SYBR green qPCR. Few cells expressed all four factors, and most contained only one or two. B: Trajectory plots with total exogenous and/or endogenous OSKM content displayed. Splines of endogenous and exogenous factor content along the trajectory are shown above.
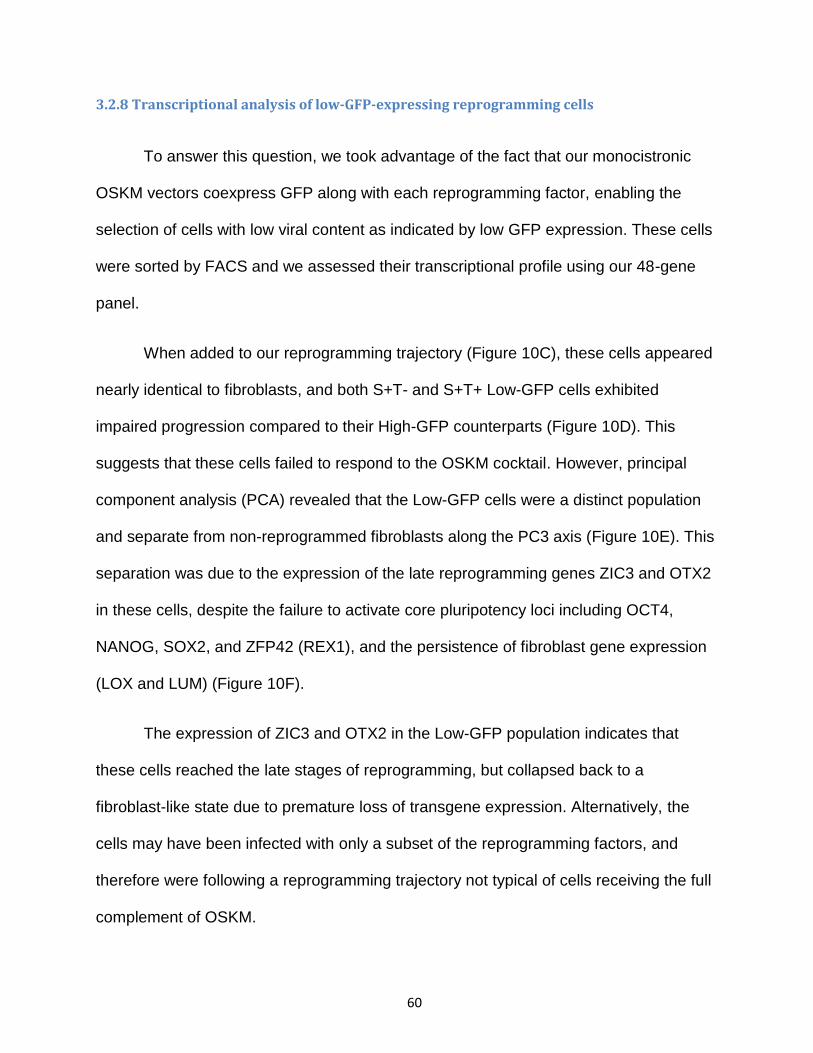
60
3.2.8 Transcriptional analysis of low-GFP-expressing reprogramming cells
To answer this question, we took advantage of the fact that our monocistronic
OSKM vectors coexpress GFP along with each reprogramming factor, enabling the
selection of cells with low viral content as indicated by low GFP expression. These cells
were sorted by FACS and we assessed their transcriptional profile using our 48-gene
panel.
When added to our reprogramming trajectory (Figure 10C), these cells appeared
nearly identical to fibroblasts, and both S+T- and S+T+ Low-GFP cells exhibited
impaired progression compared to their High-GFP counterparts (Figure 10D). This
suggests that these cells failed to respond to the OSKM cocktail. However, principal
component analysis (PCA) revealed that the Low-GFP cells were a distinct population
and separate from non-reprogrammed fibroblasts along the PC3 axis (Figure 10E). This
separation was due to the expression of the late reprogramming genes ZIC3 and OTX2
in these cells, despite the failure to activate core pluripotency loci including OCT4,
NANOG, SOX2, and ZFP42 (REX1), and the persistence of fibroblast gene expression
(LOX and LUM) (Figure 10F).
The expression of ZIC3 and OTX2 in the Low-GFP population indicates that
these cells reached the late stages of reprogramming, but collapsed back to a
fibroblast-like state due to premature loss of transgene expression. Alternatively, the
cells may have been infected with only a subset of the reprogramming factors, and
therefore were following a reprogramming trajectory not typical of cells receiving the full
complement of OSKM.
61
Figure 10 (C-F): Mapping of High- and Low-GFP-expressing reprogramming cells. Mapping of High- and Low-GFP-expressing cells on reprogramming trajectory demonstrates that Low-GFP cells exhibited a fibroblast-like expression pattern (C) and failed to progress toward pluripotency as compared to High-GFP cells (D). Principal Component Analysis reveals that Low-GFP cells were distinct from all other cells in our experiment (E). This was due to the expression of the late reprogramming genes ZIC3 and OTX2 despite the failure to activate core pluripotency genes and the persistence of fibroblast gene expression, as shown in (F).
62
3.2.9 Somatic reprogramming using three-factor combinations of SKM, OKM, OSM, and OSK
We tested this hypothesis explicitly by generating all possible 3-factor
combinations (SKM, OKM, OSM, and OSK), removing each factor from the STEMCCA
polycistronic vector, and measuring the reprogramming trajectory of the infected cells.
Attempts to reprogram cells with any of these three-factor combinations failed to
produce any AP+ colonies and resulted in a significant reduction in SSEA4+ and TRA-
1-60+ cells.
These cells also failed to productively reprogram, moving away from fibroblast,
but not toward hESC (Figure 11A), as evidenced by the minimal expression of both
fibroblast and pluripotency genes in our panel. However, this reduced expression was
not caused by a lack of cell viability or the induction of apoptosis, indicating that these
cells followed a trajectory that could not be measured using our existing marker set. K-
means clustering of the 3-factor reprogramming conditions along with the MRC-5 Mono
dataset (Figure11B) revealed that this trajectory is equivalent to the Alternate trajectory
we identified previously [20], and suggests that Mono cells in this Alternate group were
also cells that failed to receive the full complement of OSKM (Figure11C).
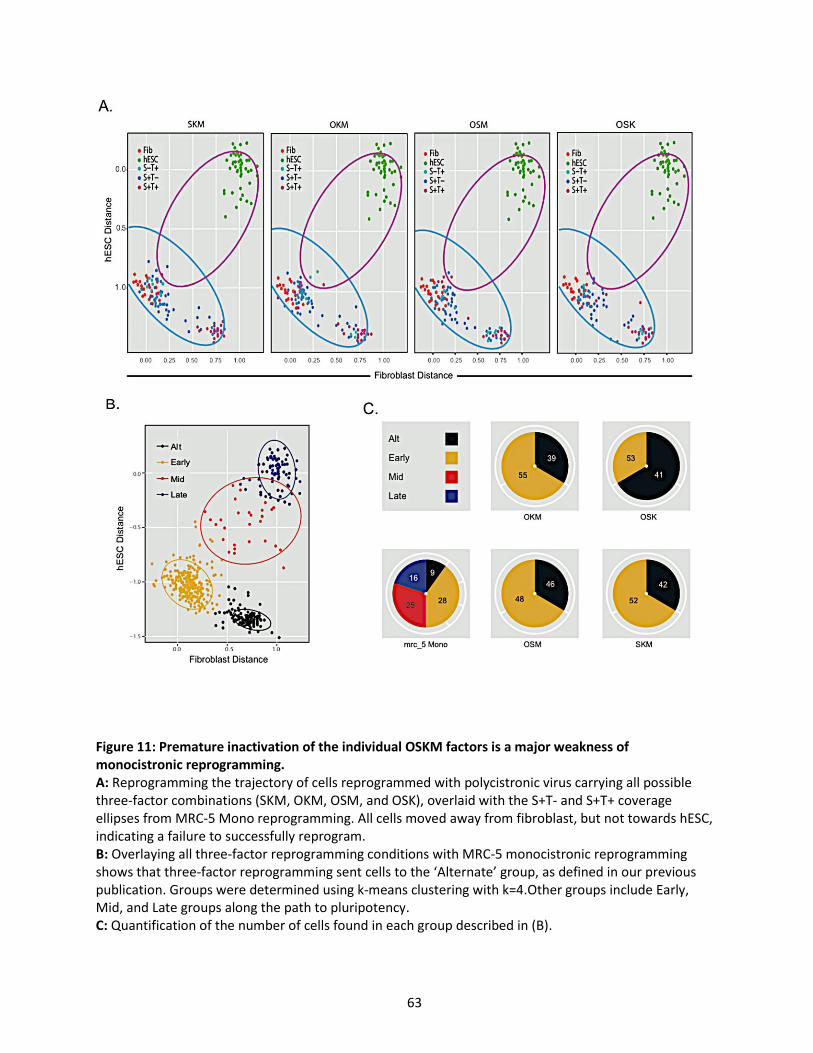
63
Figure 11: Premature inactivation of the individual OSKM factors is a major weakness of monocistronic reprogramming. A: Reprogramming the trajectory of cells reprogrammed with polycistronic virus carrying all possible three-factor combinations (SKM, OKM, OSM, and OSK), overlaid with the S+T- and S+T+ coverage ellipses from MRC-5 Mono reprogramming. All cells moved away from fibroblast, but not towards hESC, indicating a failure to successfully reprogram. B: Overlaying all three-factor reprogramming conditions with MRC-5 monocistronic reprogramming shows that three-factor reprogramming sent cells to the ‘Alternate’ group, as defined in our previous publication. Groups were determined using k-means clustering with k=4.Other groups include Early, Mid, and Late groups along the path to pluripotency. C: Quantification of the number of cells found in each group described in (B).
64
3.3 Discussion
In this chapter, we performed a side-by-side comparison of polycistronic and
monocistronic reprogramming in human fibroblast cells. Our primary findings are that
reprogramming by the polycistronic method resulted in a 10-fold increase in efficiency
over monocistronic reprogramming, and that this difference was due in part to the
premature inactivation of the individual OSKM factors in the monocistronic condition.
While it has been previously documented that factor expression decreases over the
course of reprogramming [15,122], this was believed to represent cells entering the
pluripotent state. Inactivation of the reprogramming factors is generally considered to be
a late event in the reprogramming process, and is associated with the generation of
stable iPSC lines [36,48].
Our study represents the first report that premature inactivation of OSKM can
occur amid productive reprogramming and results in a collapse of cells back to a
fibroblast-like state. These cells exhibited signatures of productive reprogramming, in
particular, the expression of the late reprogramming genes ZIC3 and OTX2. However,
they failed to activate the core pluripotency circuitry and continued to express markers
of the fibroblast state. We excluded the possibility that these failed reprogramming
events arose from cells receiving an incomplete complement of OSKM by
demonstrating that cells lacking any one of the four factors failed to reprogram.
Our analysis of transgene content in productively reprogramming cells
demonstrates that a particular stoichiometry is optimal for pushing cells toward the
pluripotent state. Specifically, high levels of OCT4 and low levels of SOX2 were favored
65
in cells that reached an ESC-like transcriptional profile, whereas KLF4 expression was
consistent throughout the process, as previous reports have stated [114,119]. The
robust detection of MYC throughout the process was expected due to the rapid
expansion of MYC expressing cells, and this increase in cell cycling has been shown to
greatly enhance the efficiency of reprogramming [103]. Importantly, it has been
previously shown that there is no selective inactivation of any of the four reprogramming
factors in iPSCs [23]. Therefore, the differences we see in factor content reflect a bias
for particular OSKM combinations as we select for late reprogramming events (i.e.,
TRA-1-60+ cells) rather than preferential inactivation of any one factor.
By examining the trajectories followed by cells reprogrammed with either Mono
or Poly viruses, we noticed that cells from the Mono condition exhibited a delay in the
activation of several pluripotency loci, including POU5F1, NANOG, DNMT3B, and
LIN28, compared to Poly reprogramming. The period preceding the activation of the
core pluripotency circuitry is referred to as latency, which is believed to be a major rate-
limiting step in generating iPSCs. Our observation that latency was increased in the
monocistronic conditions with relatively lower efficiencies supports this notion and, to
our knowledge, is the first time that this phenomenon has been measured between
distinct conditions.
Our study demonstrates that different reprogramming paradigms have the
greatest effect early in the process prior to the onset of pluripotency gene expression.
Once expression is initiated, cells from all conditions follow a similar path to the
pluripotent state as long as OSKM expression is maintained. The establishment and
maintenance of factor expression is a critical challenge in monocistronic reprogramming

66
because not all cells receive the full OSKM cocktail, nor do they maintain their
expression throughout the entire process in all cells. This is a key advantage of the
polycistronic method, which ensures delivery of all four factors on a single construct.
Our ability to make these conclusions relies on the single-cell resolution of our analysis
and the comparison between multiple reprogramming conditions, and demonstrates the
need for rigorous comparison between protocols in order to determine the effect of
procedural variables on the reprogramming process.
67
Chapter 4 Comparison between MRC-5 and BJ fibroblast cells using polycistronic OSKM reprogramming factors
4.1 Introduction
Most studies to date have focused on reprogramming fibroblasts thanks to their
simplicity of isolation. However, dozens of other cell types have been successfully
reprogrammed [7,9,11,12]. The starting cell type has been demonstrated to have a
significant effect on both the efficiency of the process and the differentiation capacity of
the resulting iPSCs [5,68,101]. There is evidence to suggest that these effects are
caused by unique epigenetic landscapes in different cell types that can affect the
accessibility of pluripotency loci, and consequently their ability to be activated by
reprogramming factors [79,55,54,123]. This epigenetic landscape also results in a
‘memory’ of the cell’s starting identity, making differentiation back to the cell type of
origin more efficient than generation of more therapeutically relevant alternatives
[82,124,125]. Thus, the starting cell type can have a dramatic influence on the outcome
of the reprogramming process, but again, no analysis of whether this affects the
acquisition of pluripotency has been performed.
Using the mathematical modeling and precise pluripotency progression
measurement discussed in previous chapters, it is a logical next step to compare
OSKM-mediated reprogramming of two fibroblast tissues that have similar transcription
profiles but different chromatin states. Comparing the gene expression and activation
dynamics during the reprogramming process of these two fibroblast cell types will show
how gene-specific chromatin states in the starting cells control gene activation dynamics
during the reprogramming process, and this comparison can subsequently be used to
68
dissect the precise mechanisms and chromatin modifications that limit the conversion
rate and efficiency of somatic cells to iPSCs.
4.2 Results
4.2.1 Comparing the dynamics of pluripotency gene expression in BJ and MRC-5
fibroblast cell lines
Having determined that premature inactivation of the individual OSKM factors
was a major weakness of Mono reprogramming, we then compared the dynamics of
pluripotency gene expression in two fibroblast cell lines, BJ and MRC-5, using the
polycistronic method. To this end, we compared MRC-5 and BJ cells reprogrammed
with polycistronic OSKM and analyzed the expression of 96 genes as described above.
In our system, BJ fibroblasts exhibited approximately 3X greater efficiency than MRC-5,
as determined by the number of AP+ colonies at days 7, 14,and 21. Thus, we next
sought to determine whether this difference in efficiency was evident in the trajectories
of each reprogramming cell type or in the expression of individual genes. Comparing the
progression of cells over the course of reprogramming showed little difference in the
S+T- and S+T+ cells from both cell types and, as expected, we found that S+T+ cells
progressed uniformly toward pluripotency whereas S+T- exhibited a broader distribution
due to variable latency (Figure 12A-B).
In addition, visualizing the trajectories in PCA space showed that most of the
process appears identical among cell types in the first two PC dimensions, which
cumulatively capture approximately 35% of the variance (Figure 12C). However,
inclusion of the PC3 dimension (5% variance) revealed a slight divergence between the
two trajectories early in the process, followed by convergence near the hESC state

69
(Figure 12D). This observation was reiterated by plotting each cell type side by side in
its own PC space. An initial comparison of the PCA showed that both cell types
exhibited a similar distribution of reprogramming intermediates as determined by the
amount of variation captured by each PC dimension (Figure 12E). Comparison of the
gene loadings between the MRC-5 and BJ PC analyses revealed a strong correlation in
the PC1 (Spearman r = 0.95) and PC2 (Spearman r = 0.72) dimensions, whereas
correlation in the PC3 dimension was weak (Spearman r = 0.59) (Figure 12F). This
again suggests that nearly identical gene expression dynamics exist between the two
cell types, along with subtle differences.
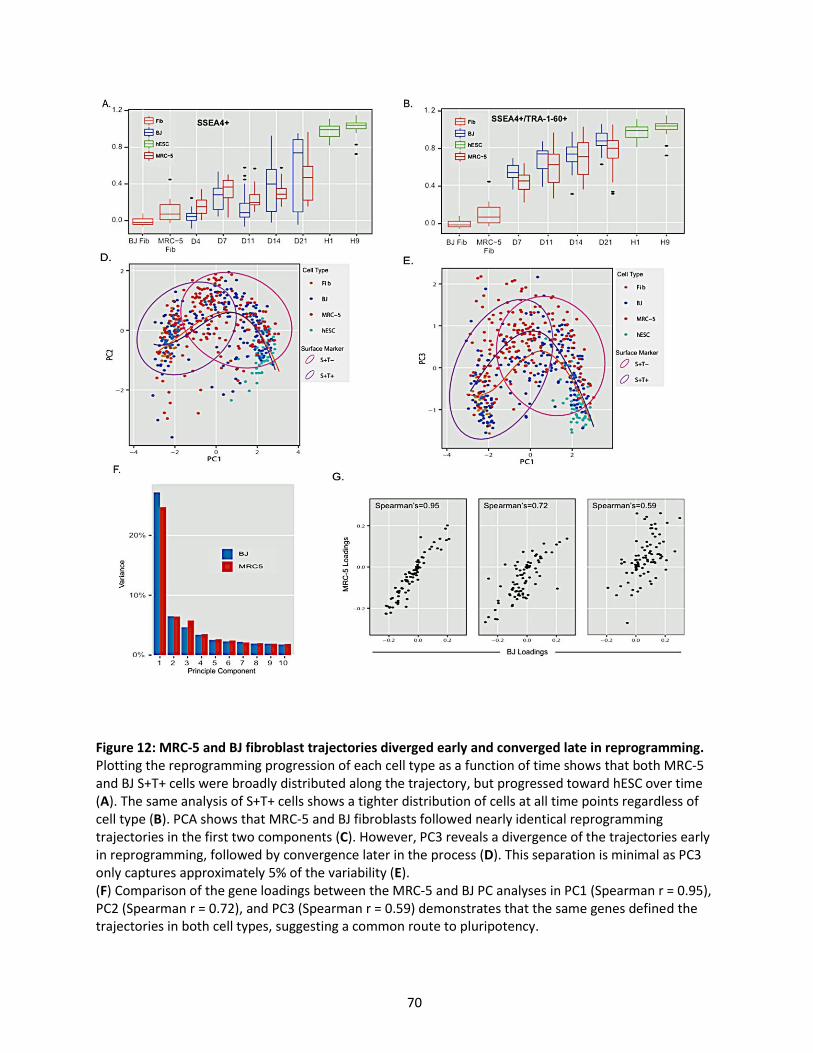
70
Figure 12: MRC-5 and BJ fibroblast trajectories diverged early and converged late in reprogramming. Plotting the reprogramming progression of each cell type as a function of time shows that both MRC-5 and BJ S+T+ cells were broadly distributed along the trajectory, but progressed toward hESC over time (A). The same analysis of S+T+ cells shows a tighter distribution of cells at all time points regardless of cell type (B). PCA shows that MRC-5 and BJ fibroblasts followed nearly identical reprogramming trajectories in the first two components (C). However, PC3 reveals a divergence of the trajectories early in reprogramming, followed by convergence later in the process (D). This separation is minimal as PC3 only captures approximately 5% of the variability (E). (F) Comparison of the gene loadings between the MRC-5 and BJ PC analyses in PC1 (Spearman r = 0.95), PC2 (Spearman r = 0.72), and PC3 (Spearman r = 0.59) demonstrates that the same genes defined the trajectories in both cell types, suggesting a common route to pluripotency.
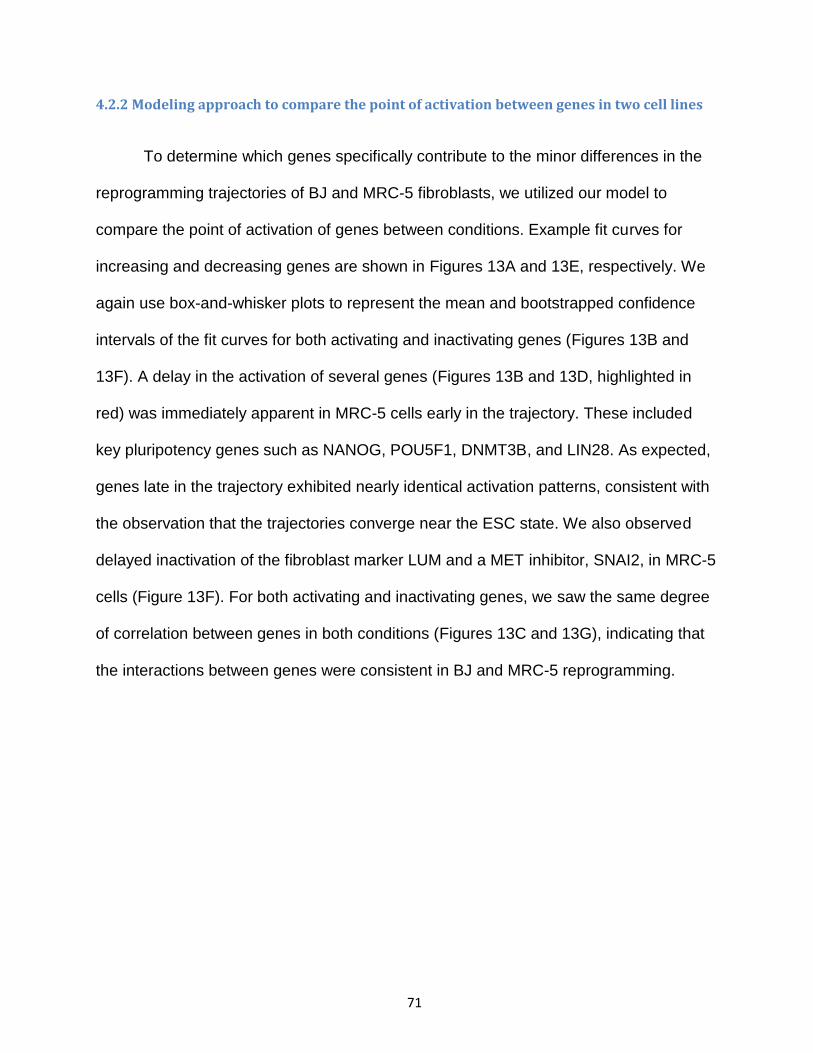
71
4.2.2 Modeling approach to compare the point of activation between genes in two cell lines
To determine which genes specifically contribute to the minor differences in the
reprogramming trajectories of BJ and MRC-5 fibroblasts, we utilized our model to
compare the point of activation of genes between conditions. Example fit curves for
increasing and decreasing genes are shown in Figures 13A and 13E, respectively. We
again use box-and-whisker plots to represent the mean and bootstrapped confidence
intervals of the fit curves for both activating and inactivating genes (Figures 13B and
13F). A delay in the activation of several genes (Figures 13B and 13D, highlighted in
red) was immediately apparent in MRC-5 cells early in the trajectory. These included
key pluripotency genes such as NANOG, POU5F1, DNMT3B, and LIN28. As expected,
genes late in the trajectory exhibited nearly identical activation patterns, consistent with
the observation that the trajectories converge near the ESC state. We also observed
delayed inactivation of the fibroblast marker LUM and a MET inhibitor, SNAI2, in MRC-5
cells (Figure 13F). For both activating and inactivating genes, we saw the same degree
of correlation between genes in both conditions (Figures 13C and 13G), indicating that
the interactions between genes were consistent in BJ and MRC-5 reprogramming.
72
Figure 13: MRC-5 and BJ fibroblasts exhibited subtle differences in their gene activation dynamics. Logistic regressions were used to model the probability of detecting a given gene along the reprogramming trajectory. Example model fits for activating and inactivating genes are shown in (A) and (E), respectively. Box-and-whisker plots are used to represent the mean and bootstrapped confidence intervals of the fit curves for both activating (B) and inactivating genes (F), and indicate that a small group of genes (B and D, highlighted in red) exhibited a delay in expression in MRC-5 fibroblasts. However, the overall order of activation/inactivation was highly correlated among cell types (D and H). We also observed a similar correlation among activating genes in both conditions (C), although decreasing genes appeared more tightly regulated in BJ than in MRC-5 (H).
73
4.3 Discussion
It is commonly believed that latency results from the remodeling of the epigenetic
landscape to allow the activation of pluripotency loci, and it is expected that different
factor stoichiometries or starting cell types affect the rate at which this process occurs
[17,29,31,47,49,50]. If true, this would imply that BJ cells have a more permissive
chromatin state at some loci than MRC-5 fibroblasts, facilitating their activation. A
rigorous comparison of reprogramming in cell types with divergent chromatin states
would directly address this hypothesis and represents an attractive area of research.
Despite the differences observed early in the process, cells from all conditions
activated pluripotency genes in a similar probabilistic order following the latency period,
suggesting a common mechanism in establishing pluripotency. The convergence on a
common trajectory late in the process resembles the deterministic phase described by
Buganim et al. However, in our system these gene activation events were independent
and probabilistic and we, therefore, do not believe that our observation represents a
strictly deterministic process. It was also somewhat surprising that different
reprogramming conditions resulted in similar reprogramming trajectories given the
variation in quality and differentiation potential of iPSCs derived from these different
methods [6,51]. This implies that iPSC phenotype variation resulted, not from
differences in how the pluripotency network is established, but probably from
differences that were not analyzed in our study. This may result from differential
expression of genes whose expression alters the iPSC phenotype, or it may occur at
the epigenetic level, as has been shown for the Dio-Dlk3 locus in mice [116].
74
In contrast to the similarities between BJ and MRC-5 at the transcript level, the
surface markers SSEA4 and TRA-1-60 labelled slightly different populations between
cell types. While the reason for this is unclear, it illustrates the impact of cell type on
selecting informative biomarkers to isolate cells from different parts of the
reprogramming process. SSEA4 and TRA-1-60 are also unique in that they are the only
markers examined in our study that exhibit a strict order of activation: SSEA4 turns on
before TRA-1-60, and all TRA-1-60+ cells are also SSEA4+. This is very different from
the probabilistic order observed at the transcript level for most genes in our panel and it
raises the question as to whether the process is more highly ordered or deterministic at
the level of protein expression. Recently, several groups have begun to explore the
dynamics of the proteome during reprogramming; however, this has not yet been
coupled with transcriptional analysis, and all studies to date have been performed in
mice. This remains an important area of study in the field of reprogramming.
75
Chapter 5 Conclusion and Future Directions
5.1 Conclusion
Even now, many years after the discovery of somatic reprogramming using
OSKM factors, a detailed mechanistic understanding of reprogramming remains elusive.
Numerous studies suggest that reprogramming to pluripotency occurs in two phases: a
prolonged stochastic phase followed by a rapid deterministic phase [77], which is
represented by the high expression of endogenous SOX2 transcript and low or null
expression of exogenous SOX2 transcripts in mice [72]. The primary objective of this
thesis was to provide a precise mathematical framework that describes the dynamic of
pluripotency gene expression during somatic reprogramming, and to present a precise
model that describes the stochastic phase of reprogramming, in the hope of enabling
the measurement and detailed mechanistic dissection of various reprogramming
methods and treatments that enhance the rate of reprogramming efficiency.
Using single-cell analysis, human fibroblast cells undergoing reprogramming at
various time points, were analyzed with a 96-marker panel. With these data, we were
able to construct a Euclidean diagonal between the fibroblasts and the hESC
transcriptional data profile that accurately measured a given reprogramming cell’s
progression toward hESC. Using this metric, we were able to show that partially
reprogrammed cells infected with OSKM factors followed either alternative trajectories
or productive trajectories, and that these two pathways could be distinguished by the
organized expression of a small group of chromatin modifiers. In addition, using
Euclidean space analysis, principal component analysis, and Gaussian distribution, we
76
showed that the stochastic phase of reprogramming in human fibroblasts is an ordered,
probabilistic process with gene-specific dynamics.
Furthermore, our comparisons of two the most widely used reprogramming
methods, the monocistronic and polycistronic OSKM virus cassettes, confirmed that the
polycistronic OSKM virus cassette significantly increased reprogramming efficiency
compared to the monocistronic OSKM virus cassette [48], and we are the first to
demonstrate that this difference is caused in part by the premature inactivation of the
individual OSKM factors in the monocistronic condition. We also demonstrated that
premature inactivation of OSKM can occur amid productive reprogramming and results
in a collapse of cells back to a fibroblast-like state. Conversely, the gene expression
dynamics during both reprogramming methods were not found to contribute to
reprogramming efficiency.
Finally, we compared two human fibroblast cell lines: BJ and MRC-5. Our results
showed that the two cell lines diverge at the beginning of the reprogramming
trajectories, but converge at the end of these trajectories. The minor differences in the
early reprogramming trajectories were contributed by the variation in expression latency
of activating key pluripotency genes and by the inactivation of fibroblast genes.
Nonetheless, even with these subtle differences, the two cell types have nearly identical
gene expression dynamics and gene interactions are consistent in BJ and MRC-5
reprogramming.
77
5.2 Future Studies
This work presents the mechanistic description and modeling of gene expression
dynamics during the stochastic phase of reprogramming, which provide an essential
quantitative framework for dissecting key rate-limiting steps and will enable the
mechanistic dissection of interventions known to accelerate or enhance the efficiency of
the reprogramming process. In addition, the early stochastic phase of reprogramming is
governed by c-MYC-responsive chromatin modifiers, and successful reprogramming
requires the gradual erosion of epigenetic barriers to activation of the pluripotency GRN
by OSKM. Furthermore, this work demonstrates that different reprogramming
paradigms have the greatest impact prior to the onset of pluripotency gene expression.
Once pluripotent gene expression is initiated, cells from the various conditions we
measured follow a similar path to the pluripotent state as long as OSKM expression is
maintained.
While these findings are important, my work represents only a first step in
dissecting complicated and largely unknown reprogramming mechanisms. Therefore,
further studies are necessary to enhance our understanding of these mechanism. Such
studies include expanding the gene marker panel from 96 to all genes known to be
expressed in humans through RNAseq technology, and developing an enhanced model
that precisely describes the behavior of expressed transcripts.
Additionally, a careful assessment of reprogramming in cell types with divergent
chromatin states and epigenetic landscapes will specify the order and exact identity of
78
the chromatin modifications that are required for successful and efficient
reprogramming.
Finally, the investigation of protein expression dynamics, coupled with
transcriptional analysis during reprogramming, will highlight the mechanistic
involvement of transcriptional and translational regulation.
Using single-cell transcriptional analysis to provide a mechanistic understanding
and modeling of gene expression dynamics during the rate-limiting phase of
reprogramming will help to enable a faster and more efficient reprogramming process
and will contribute greatly to the development of therapeutically relevant and safely
induced pluripotent stem cells. It will also help researchers to have a complete tool for
measuring and comparing changes in transcriptional dynamics among various
treatments during somatic reprogramming. Ultimately, this tool will provide a needed
support to researchers for developing a somatic reprogramming protocol involving
sequential targeting, which targets specific pathways at specific time points during the
reprogramming process.
79
Chapter 6 Materials and Methods
6.1 Monocistronic OSKM mediated somatic reprogramming
6.1.1 Production of Retrovirus:
Retroviral vectors (pMIG) containing OCT4, SOX2, KLF4, c-MYC (OSKM) along
with helper plasmids (VSV-G and Gag-pol) were obtained from I.H.Park (Yale
University, New Haven, CT). To generate viral particles, individual retroviral vectors
were co-transfected with VSV-G and Gag-pol into 293T cells seeded at 2 x 10⁶ cells per
10-cm2 using FuGENE 6 transfection reagent (Roche Applied Science). After 72-hour
induction, supernatants were collected, filtered through 0.45µm filter and concentrated
using Vivaspin 300,000 MWCO PES filter columns (Sartorius). Viral titer was
determined using FACS analysis for GFP expression (encoded in the pMIG vector). An
MOI of 5 was used for all experiments.
6.1.2 Cell culture and Fibroblast Reprogramming:
MRC-5 human fetal lung fibroblasts were obtained from I.H. Park (Yale
University, New haven, CT). Briefly, MRC-5 cells were expanded in human fibroblast
(hFib) media (DMEM (Gibco), 10% FBS (Milipore), 1% L-glutamine (Gibco) and 1X
Penn-Strep (Gibco). One day prior to infection, 1 x 10⁵ MRC-5 fibroblasts were seeded
into one well of a 6-well dish containing hFib media. The next day, cells were incubated
in RI media (MEM alpha (Mediatech) and 10% FBS (Millipore)) containing 5ug/mL
protamine sulfate (Sigma) and OSKM virions for 24hrs followed by replacement with
fresh RI media. Cells were cultured for 72hrs post-infection and passaged to two 10cm2
dishes pre-seeded with 7.5 x 10⁵ inactivated feeders in hESC media supplemented with
80
10µM Y-27632 (Calbiochem). After passaging, fresh hESC media was added daily until
the end of the experiment. H9 human embryonic stem cells (WiCell) were maintained in
hESC media (DMEM F-12 (Gibco), 20% Knockout-Serum Replacement (Gibco), 1% L-
Glutamine (Gibco), 1% Non-Essential Amino Acids (Gibco), 5µM β-mercaptoethanol
(Gibco), and 2ng/mL b-FGF) and passaged using standard methods.
6.1.3 Antibody Staining and FACS Sorting of Reprogramming Cells:
Reprogramming MRC-5 fibroblast cells were harvested with 1mL Accumax
(Millipore) per well (6-well dish) for 15 minutes at 37°C. Cells were pelleted, washed
with PBS (Gibco) and wash buffer (2% FBS in HBSS (Invitrogen)), and resuspended in
wash buffer. Cells were then stained using antibodies for SSEA4 (Biolegend, Cat#
330405) TRA-1-60 (Biolegend, Cat# 330605), washed 3 times and resuspended in
FACS buffer (1% FBS in PBS). For FACS, cells were live/dead stained and gated on
GFP and appropriate surface markers as indicated and single cells sorted into 96 well
PCR plates. All FACS was performed using a BD Bioscience FACS Aria II.
6.1.4 Quality Control and Single cell qRT-PCR:
Single cell qRT-PCR was performed as previously described [92]. Briefly, single
cells were lysed and denatured by incubating at 70°C for 10 minutes and then cooled to
4°C. Cells were then reverse transcribed and pre-amplified using gene specific primers
(0.25X pooled TaqMan assays) and analyzed by qPCR. qPCR was performed using
TaqMan chemistry in 384 well plates on an ABI 7900HT Fast Real-Time system.
Average cycle threshold (Ct) values obtained from qPCR reactions were normalized to
GAPDH (∆Ct), and inverted by taking the (40 – ∆Ct) value. To reduce technical error
81
and ensure robust sample quality, all cells with a GAPDH Ct value of 25 or greater were
excluded from further analysis. TaqMan assays for endogenous OCT4, SOX2, KLF4
and c-MYC were directed against the 3’-UTR region of the transcript, which is distinct
from the synthetic UTRs incorporated in the viral OSKM transgenes, conferring their
specificity to the endogenous transcripts.
6.1.5 Marker Panel Selection
Genes selected for inclusion in our 48 marker panel were chosen based on
several criteria. For pluripotency and chromatin modifier genes we selected those
whose role in the establishment or maintenance of the pluripotent state was well
documented and experimentally validated. This decision was further informed using the
dataset of Dowell et. al. [126] which assigns a self-renewal score to genes based on
their integration in the pluripotency gene regulatory network (as determined by direct
binding of O, S, K and/or M) as well as their degree of co-expression with well-
established pluripotency genes. Fibroblast genes were selected based on their
expression in fibroblasts and absence from hESCs as determined in [96,127].
6.1.6 Data Analysis:
Distance was determined by reducing gene expression to 0(undetected) and
1(detected, Ct < 40) and calculating the average Euclidean distance for each cell to the
FIB and PLURI groups, ignoring self-comparisons. Similarity was computed for each
group distance by taking the ratio of the distance between FIB and PLURI minus each
cell’s distance to the group in question, over the distance between FIB and PLURI
minus the average distance of that group to itself. The average of the similarity to
82
PLURI and the complement of the similarity to FIB was taken as an estimate of the
progression of each cell along the PLURI trajectory. Distance off of the trajectory was
taken as the Euclidean distance from the FIB and PLURI similarities to the trajectory
value.
PCA-based SOM analysis was performed in JMP, Version 10 (a SAS
product)[128] using a 5-by-1 matrix and visualizing on a biplot (PC1 vs PC2). Cells
within the “Alt” group were considered to be outliers (as described above) and were
excluded from subsequent analysis, unless otherwise indicated. Hierarchical clustering
was also performed in JMP, using Ward’s method with no standardization, on (40-∆CT)
values. Coverage ellipses on the Euclidian distance graphs represent 90% coverage of
the data points from the group indicated. For correlation analysis Pearson’s correlation
coefficients within a defined SOM grouping were taken for the entire 48x48 matrix of
genes analyzed in this study. Network graphs were constructed in Cytoscape using a
force-directed layout derived from the top 100 Pearson correlations between all of the
cells, excluding outliers, in our analysis (n = 117).
6.1.7 Model Generation:
To generate accurate models, the data was first interpolated to generate a high
resolution training set. The entire sample population was included, except for outliers
considered as the cells with the highest distance off of the trajectory (10%, N=17). The
training data represented the percentage of cells expressing a gene at any point along
the PLURI trajectory, and was measured by uniformly placing overlapping bins of fixed
width across the range and directly counting the number of cells expressing each gene.
Models were generated to then predict the percentage expressing at any trajectory

83
location. ‘Uniform’ models were generated by assigning a ‘Baseline’ value at the start of
the trajectory (=0), and fixing a slope such that a straight line passed from the ‘Baseline’
to the value at the end of the trajectory (=1). ‘Normal’ models were then fit to this data
using the ‘optim’ function in R, attempting to minimize the mean squared error, using the
constraint, and the following form:
In order to verify model quality and compare fitting between different models, AICc was
calculated and a bootstrapping test was performed. AICc was calculated by:
where n is the effective number of sample points present in the original data, k is the
number of free model parameters, and MSE is the mean squared error from the model
prediction to the training data. Bootstrapping was performed by repeatedly simulating
the training data but using only n bins and randomly resampling a fixed number of cells
from each bin’s range. The error between the model prediction and the resampled data
was compared to the expected error using an F-test to predict if the error induced by
lack-of-fit exceeded the pure error of the data by a significant level, and this was tracked
as a percentage of all tests done against the model.
16/3StdDev
),,(*)(1=i iii
dStdDevMeantNormalCDFScaleBaselinetdNormal
'1
)1(22ln
kn
kkkMSEnAICc
84
6.1.8 Correlation Analysis
First, simulated populations of an equal size were generated by sampling a set of points
along the reprogramming progression axis such that they matched the distribution of
values in the original dataset. For each sampling point, representative of a single
simulated cell, each gene was set to detected or undetected independently, using the
frequency curves generated from our Gaussian model. Pearson correlation coefficients
were then computed for this reference population, and averaged over repeated runs
(n=1000000). Differences in correlation between this background dataset and those
calculated for our observed data were then tested for significance using the ‘r.test’
function of the R package ‘psych’.
6.2 Comparison between Monocistronic and Polycistronic reprogramming
methods and two cell types; BJ and MRC-5 fibroblasts.
6.2.1 Vector plasmid construction and Design
Monocistronic reprogramming retroviral vectors (pMIG) containing OCT4, SOX2, KLF4,
c-MYC (OSKM) along with helper plasmids (VSV-G and Gag-pol) were obtained from
I.H.Park (Yale University, New Haven, CT). The Polycistronic lentiviral vector
(STEMCCA-LoxP) containing all four reprogramming factors in single cassette, along
with helper plasmids (VSV-G, Gag-pol, TAT and Rev) were generous gift from G.
Mostoslavsky (Boston University School of Medicine, Boston MA). The 3-factor
polycistronic vectors were constructed by modifying STEMCCA-LoxP as follows. First,
we removed either the OCT4-F2A-KLF4 or SOX2-E2A-cMYC cassette from the
STEMCAA-LoxP vector using the NotI/BamHI or NdeI/BsaBI sites, respectively. The
85
deleted cassettes were then replaced with one of the two original cDNAs to generate a
3-factor-containing polycistronic vector. The individual human cDNAs encoding the four
reprogramming factors were amplified from the STEMCCA-LoxP vector using following
primers: OCT4 NotI Poly F (5’-GCGGCCGCATGGCGGGACACCTGGCTTC-3’); OCT4
BamHI Poly R (5’-GGATCCTCAGTTTGAATGCATGGGAGAG-3’); KLF4 NotI Poly F (5’-
GCGGCCGCATGGCTGTCAGCGACGCGCTG 3’); KLF4 BamHI Poly R (5’-
GGATCCTTAAAAATGCCTCTTCATGTG-3’); Sox2 NdeI Poly F (5’-
CATATGATGTACAACATGATGGAGACGG-3’); Sox2 BsaB1 Poly R (5’-
GATCCTAATCCTATGTGTGAGAGGGGCAGTGTG-3’); c-Myc NdeI Poly F (5’-
CATATGATGCCCCTCAACGTTAGCTTCACC-3’); c-Myc BsaB1 Poly R (5’-
GATCCTAATCTTACGCACAAGAGTTCCGTAGCTG-3’).
6.2.2 Production of Reprogramming virus
Simultaneous delivery of the four reprogramming factors OCT4, SOX2,KLF4 and c-
MYC [1] and delivery of three reprogramming factors (SKM, OKM, OSM, OSK) were
achieved using the STEMCCA-LoxP polycistronic lentiviral vector. Virus was produced
by cotransfection of STEMCCA-LoxP along with helper plasmids VSV-G, Gag-pol, Rev
and TAT into 293T cells in 5 x 10cm2 dishes. 72hrs post-transfection, supernatant was
harvested and concentrated to 1mL using Vivaspin 300,000 MWCO PES filter columns
(Sartorius), and 100ul of the concentrated virions were used for each reprogramming
experiment. Individual OSKM retrovirus (monocistronic) were generated as previously
described [118] and infected at an MOI of 5 for all reprogramming experiments.
6.2.3 Cell culture and fibroblast Reprogramming
86
BJ neonatal foreskin fibroblasts were purchased from Stemgent and expanded in hFib
media (DMEM, 10% FBS, 1% L-glutamine, 1% Penn/Strep) to passage 9. For
monocistronic, polycistronic and 3-factor reprogramming experiments, 1 x 10^5 BJ cells
were plated into 1 well of a 6-well dish in RI media (MEM alpha (Mediatech) and 10%
FBS (Millipore)) containing 5ug/mL protamine sulfate (Sigma) and either STEMCAA-
LoxP virions or individual pMIG-OSKM virions for 24hrs followed by replacement with
fresh RI media. 72hrs post-infection, cells were split into 10cm2 dishes pre-seeded with
7.5 x10⁵ irradiated MEFs. Cells were split 1:2 for all monocistronic experiments and 1:3,
1:10, 1:20 and 1:30 for day 7,11,14 and 21 polycistronic reprogramming, respectively.
One day after the split, cells were switched to hESC media (DMEM F-12 (Gibco), 20%
Knockout-Serum Replacement (Gibco), 1% L-Glutamine (Gibco), 1% Non-Essential
Amino Acids (Gibco), 5µM β-mercaptoethanol (Gibco), and 2ng/mL b-FGF)
supplemented with 10µM Y-27632 (Calbiochem). Cells were then maintained in hESC
media until the time of harvest. H1 and H9 human embryonic stem cells (WiCell) were
maintained in mTeSR media (Stem Cell Technologies) on matrigel treated 6 well plates
and passaged as single cells using trypsin and hESC Cloning and Recovery
Supplement (Stemgent).
6.2.4 Antibody staining and FACS sorting Reprogramming cells
For both reprogramming paradigms, cells were harvested with 1mL 0.01% Trypsin
(Gibco) per 10cm2 dish for 5 minutes at 37°C. Cells were pelleted, washed twice with
staining buffer (2% FBS in HBSS (Invitrogen)), and resuspended in 100uL staining
buffer. For monocistronic reprogramming, cells were stained with either biotinylated α-
SSEA4 (Biolegend, 330404) or α-TRA-1-60 (330604) followed by Brilliant Violet-421
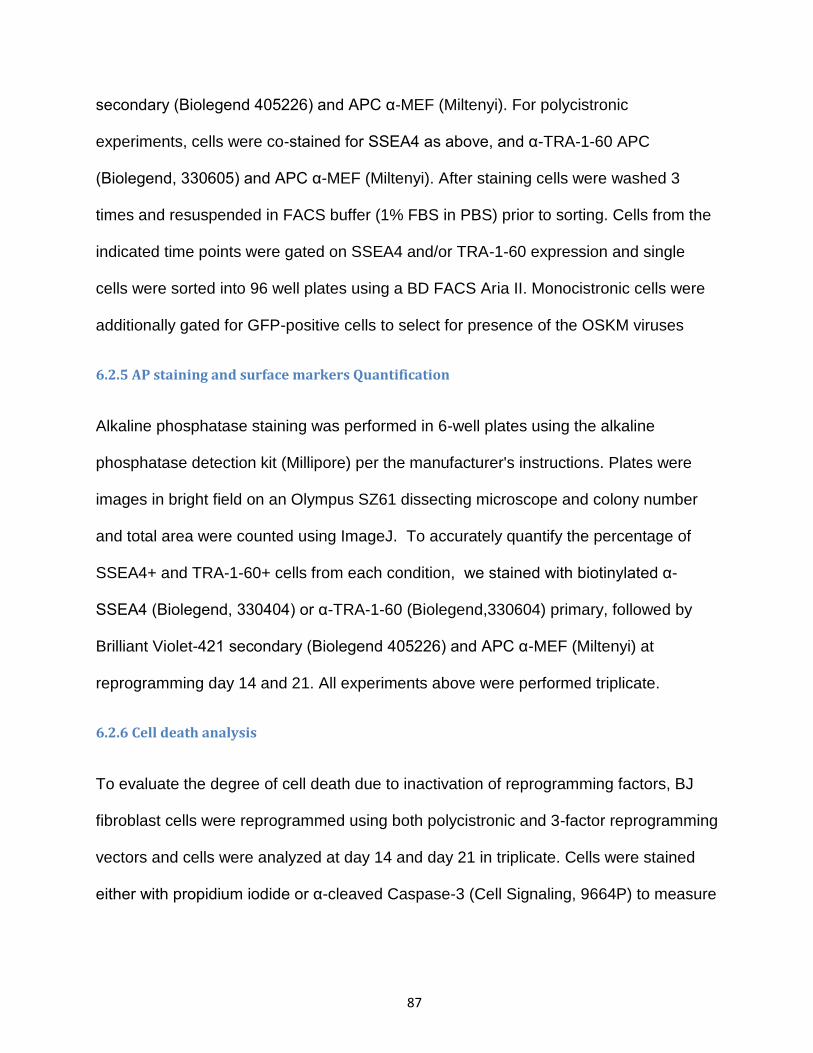
87
secondary (Biolegend 405226) and APC α-MEF (Miltenyi). For polycistronic
experiments, cells were co-stained for SSEA4 as above, and α-TRA-1-60 APC
(Biolegend, 330605) and APC α-MEF (Miltenyi). After staining cells were washed 3
times and resuspended in FACS buffer (1% FBS in PBS) prior to sorting. Cells from the
indicated time points were gated on SSEA4 and/or TRA-1-60 expression and single
cells were sorted into 96 well plates using a BD FACS Aria II. Monocistronic cells were
additionally gated for GFP-positive cells to select for presence of the OSKM viruses
6.2.5 AP staining and surface markers Quantification
Alkaline phosphatase staining was performed in 6-well plates using the alkaline
phosphatase detection kit (Millipore) per the manufacturer's instructions. Plates were
images in bright field on an Olympus SZ61 dissecting microscope and colony number
and total area were counted using ImageJ. To accurately quantify the percentage of
SSEA4+ and TRA-1-60+ cells from each condition, we stained with biotinylated α-
SSEA4 (Biolegend, 330404) or α-TRA-1-60 (Biolegend,330604) primary, followed by
Brilliant Violet-421 secondary (Biolegend 405226) and APC α-MEF (Miltenyi) at
reprogramming day 14 and 21. All experiments above were performed triplicate.
6.2.6 Cell death analysis
To evaluate the degree of cell death due to inactivation of reprogramming factors, BJ
fibroblast cells were reprogrammed using both polycistronic and 3-factor reprogramming
vectors and cells were analyzed at day 14 and day 21 in triplicate. Cells were stained
either with propidium iodide or α-cleaved Caspase-3 (Cell Signaling, 9664P) to measure
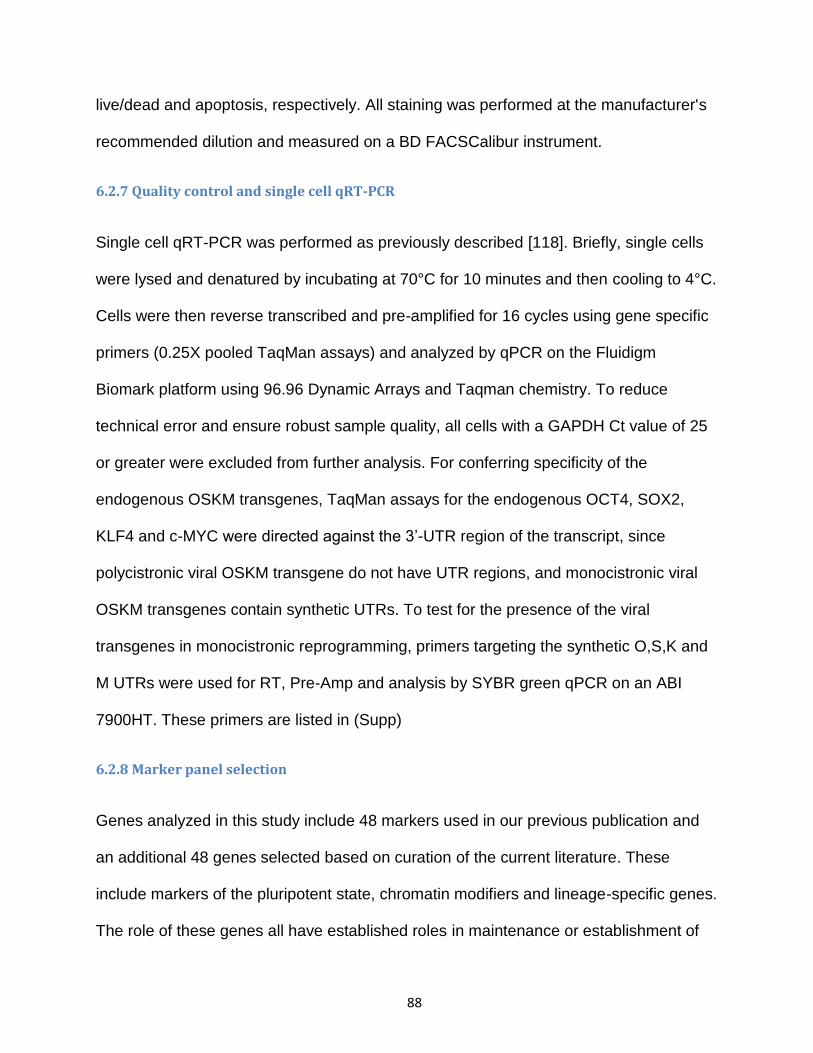
88
live/dead and apoptosis, respectively. All staining was performed at the manufacturer's
recommended dilution and measured on a BD FACSCalibur instrument.
6.2.7 Quality control and single cell qRT-PCR
Single cell qRT-PCR was performed as previously described [118]. Briefly, single cells
were lysed and denatured by incubating at 70°C for 10 minutes and then cooling to 4°C.
Cells were then reverse transcribed and pre-amplified for 16 cycles using gene specific
primers (0.25X pooled TaqMan assays) and analyzed by qPCR on the Fluidigm
Biomark platform using 96.96 Dynamic Arrays and Taqman chemistry. To reduce
technical error and ensure robust sample quality, all cells with a GAPDH Ct value of 25
or greater were excluded from further analysis. For conferring specificity of the
endogenous OSKM transgenes, TaqMan assays for the endogenous OCT4, SOX2,
KLF4 and c-MYC were directed against the 3’-UTR region of the transcript, since
polycistronic viral OSKM transgene do not have UTR regions, and monocistronic viral
OSKM transgenes contain synthetic UTRs. To test for the presence of the viral
transgenes in monocistronic reprogramming, primers targeting the synthetic O,S,K and
M UTRs were used for RT, Pre-Amp and analysis by SYBR green qPCR on an ABI
7900HT. These primers are listed in (Supp)
6.2.8 Marker panel selection
Genes analyzed in this study include 48 markers used in our previous publication and
an additional 48 genes selected based on curation of the current literature. These
include markers of the pluripotent state, chromatin modifiers and lineage-specific genes.
The role of these genes all have established roles in maintenance or establishment of
89
the pluripotent state, or have known functions in reprogramming. Fibroblast genes were
selected based on their expression in fibroblasts and absence from hESCs as
determined in [32,61].
6.2.9 Data analysis and computational Modeling
qPCR data from the Biomark was binarized such that detected genes (Ct<35) and
undetected genes were converted to 0 and 1 values, respectively. This dataset was
then used for all subsequent analysis in R v3.0.1. We then developed a modeling
pipeline to describe the expression changes occurring during reprogramming. First, we
use PCA to reduce the data to two dimensions (PC1 and PC2) and we fit a polynomial
regression curve to the data and define the reprogramming trajectory. We then project
each cell to a point on the curve based on the shortest distance, providing a value for
each call along the trajectory. The trajectory values are then scaled between 0
(fibroblast) and 1 (hESC) for easier interpretation. To model expression of each gene,
we use the binary data and reprogramming trajectory to fit a logistic regression that
describes the probability of detection as reprogramming progresses. Bootstrapping the
logistic fitting procedure 100 times and sampling with replacement to ensure robustness
of the method created confidence intervals.
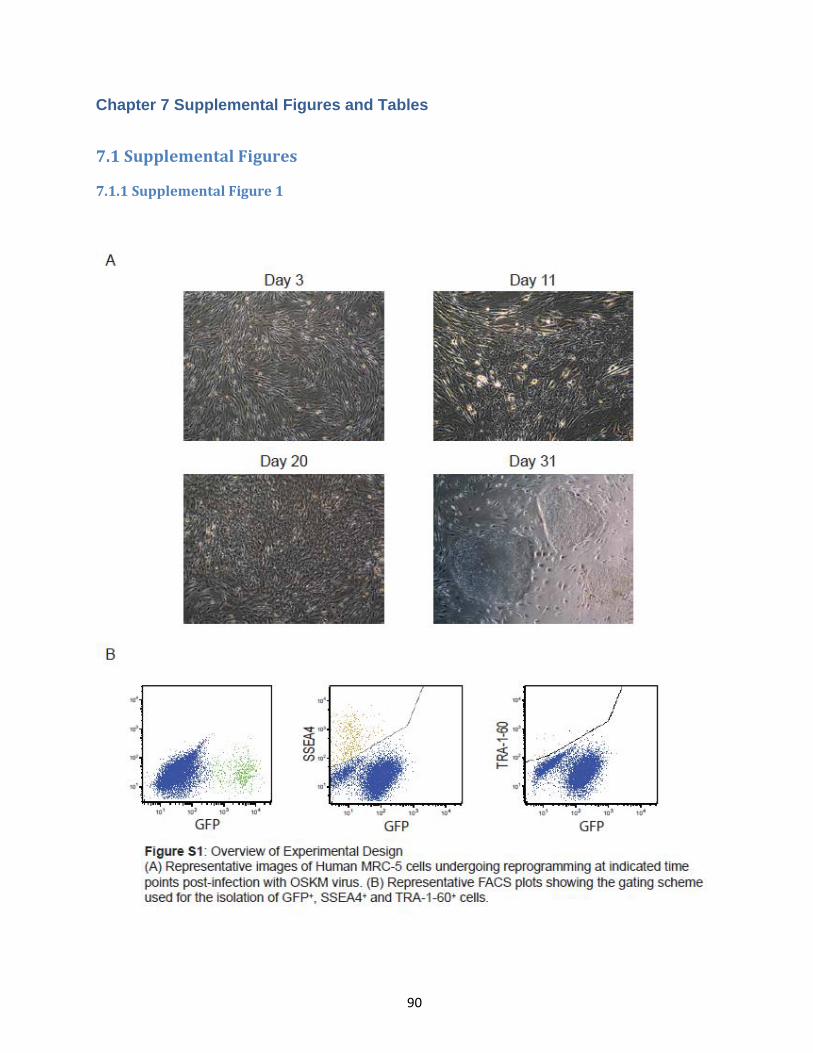
90
Chapter 7 Supplemental Figures and Tables
7.1 Supplemental Figures
7.1.1 Supplemental Figure 1
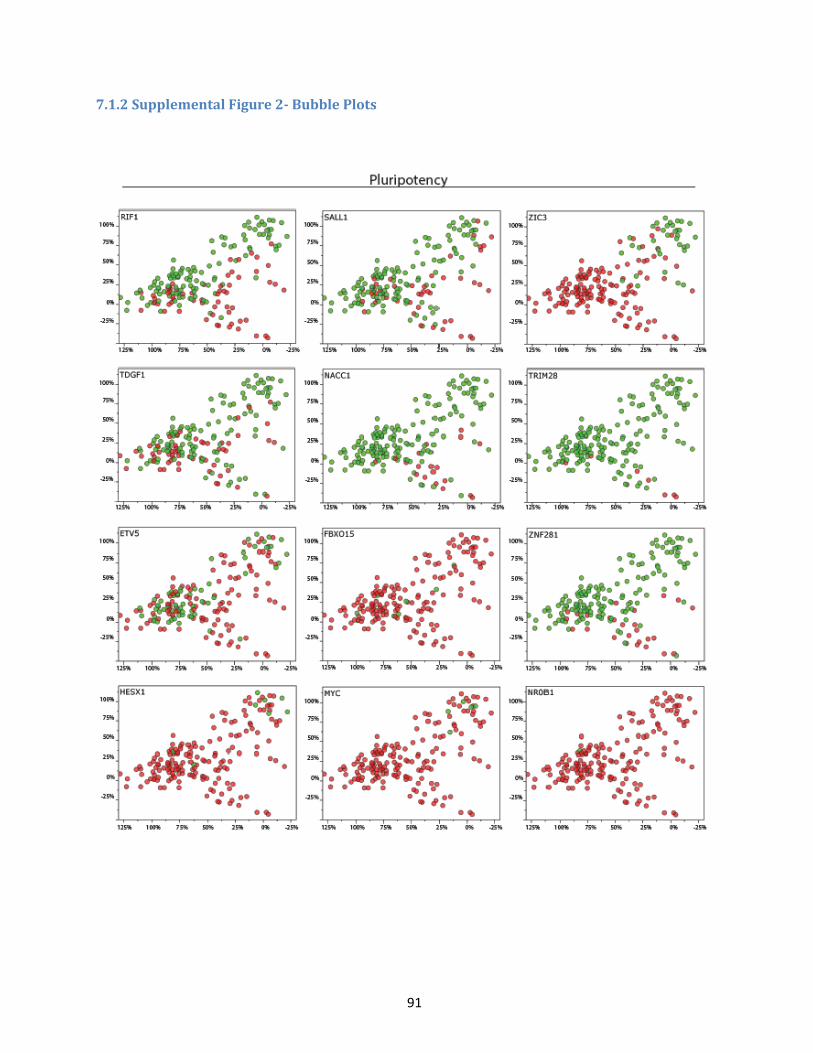
91
7.1.2 Supplemental Figure 2- Bubble Plots
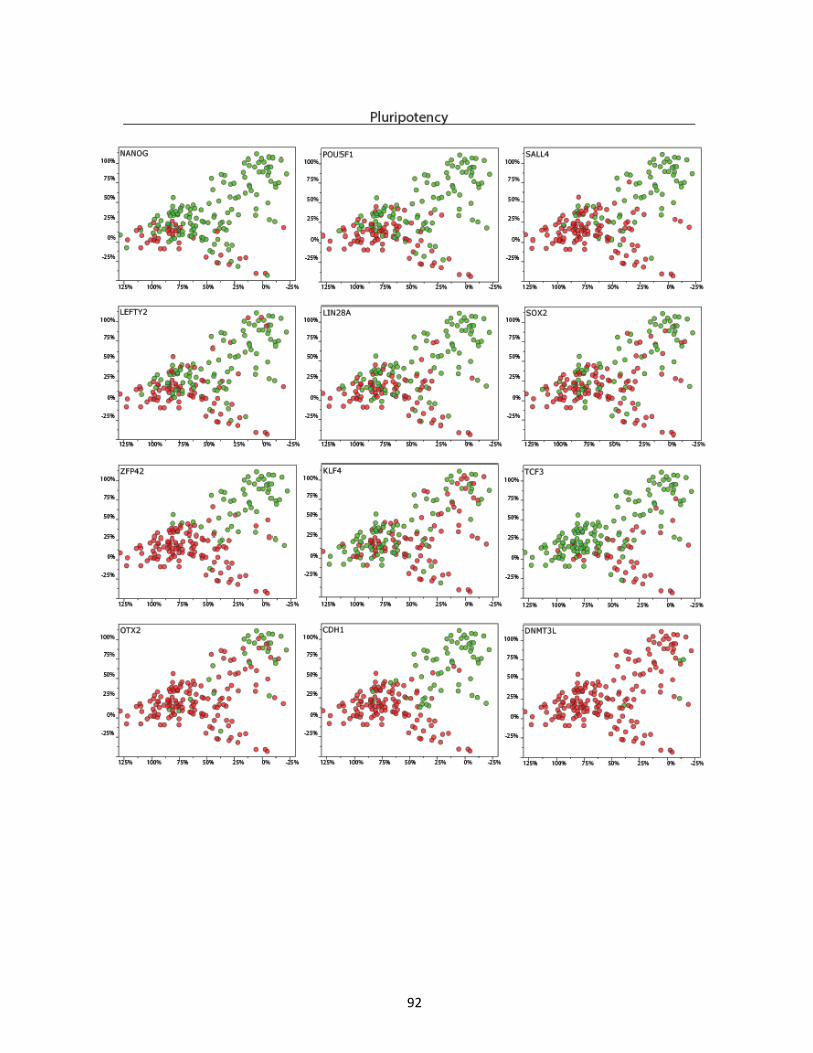
92
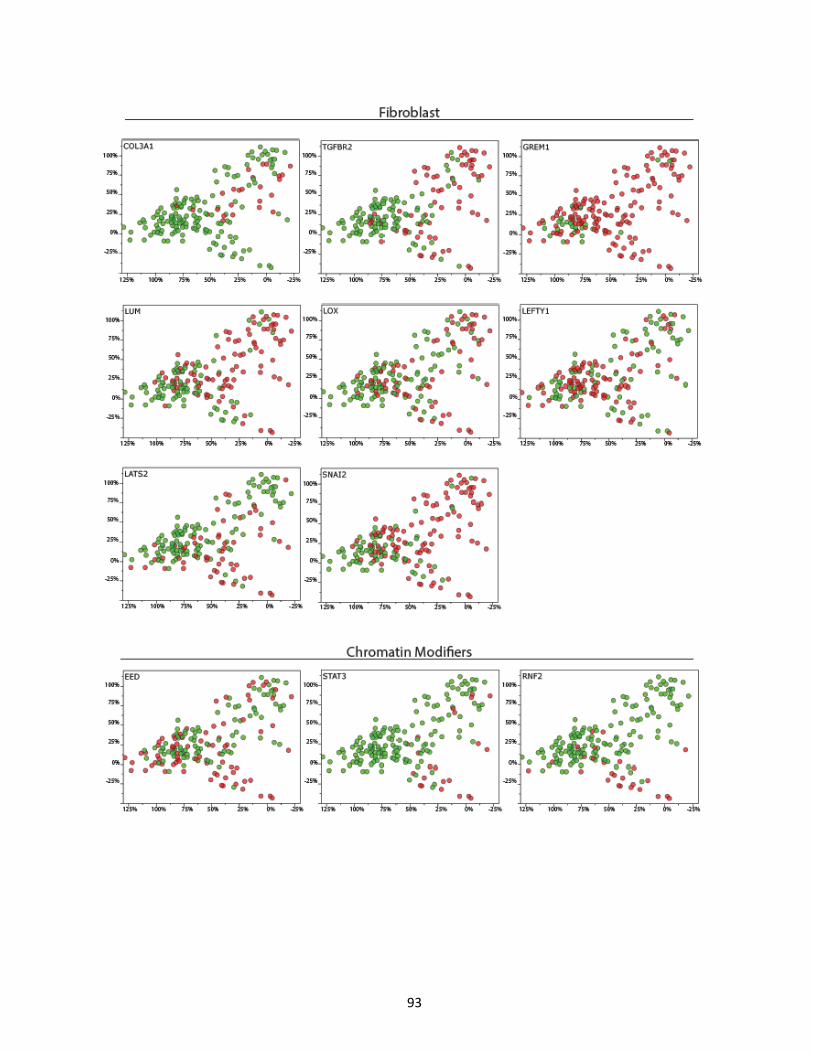
93
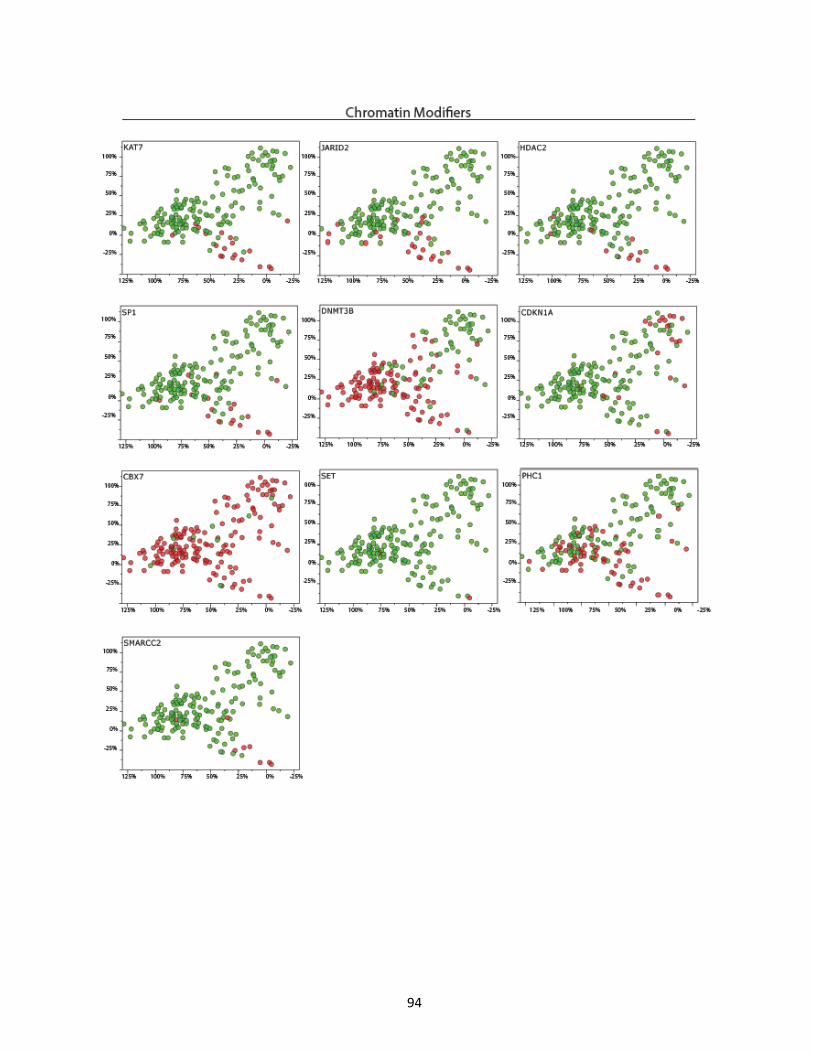
94
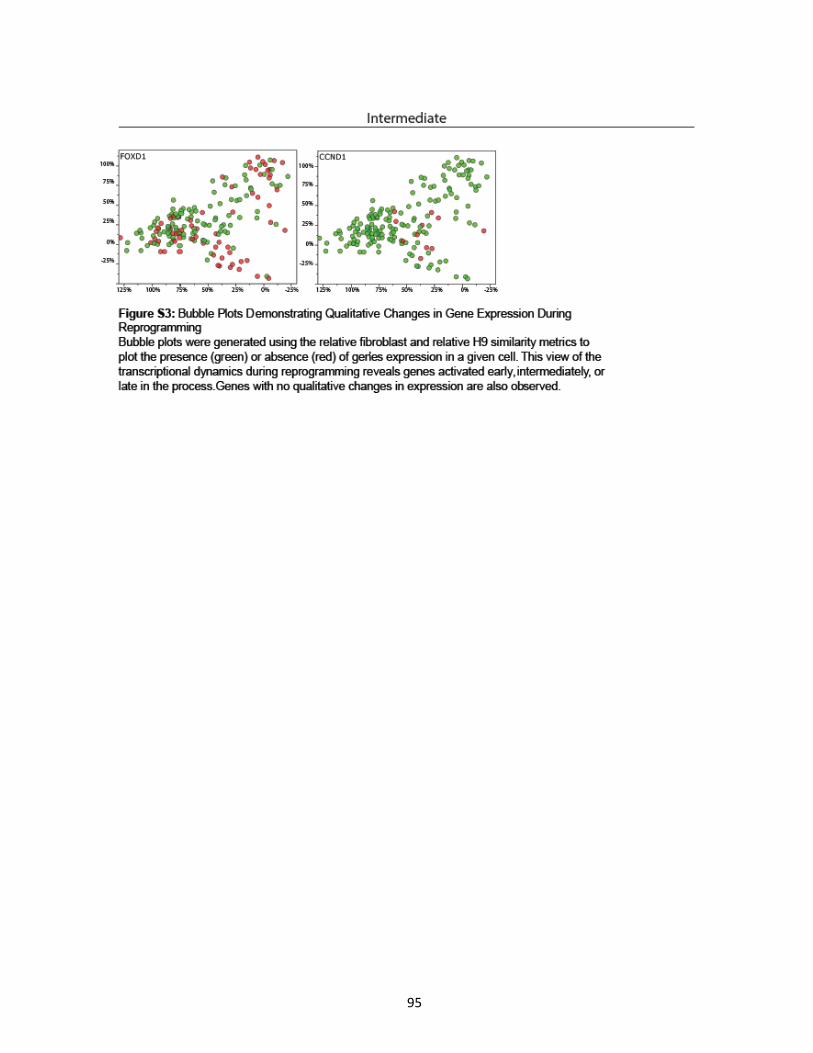
95
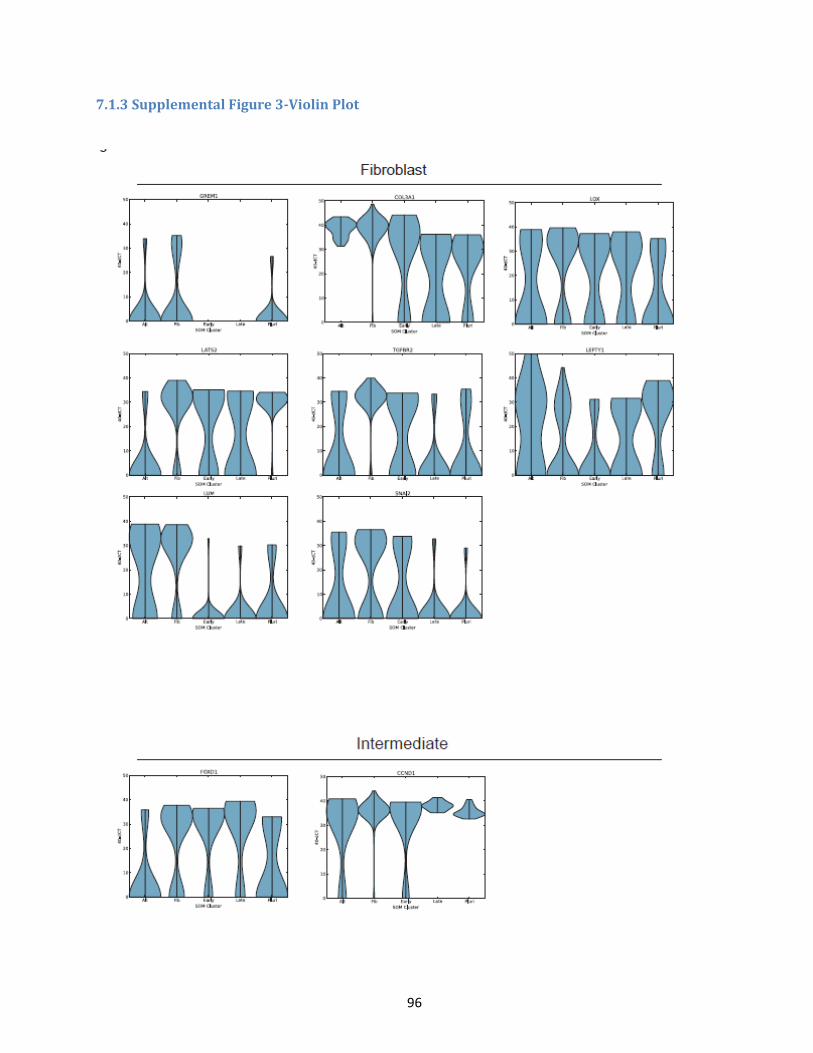
96
7.1.3 Supplemental Figure 3-Violin Plot
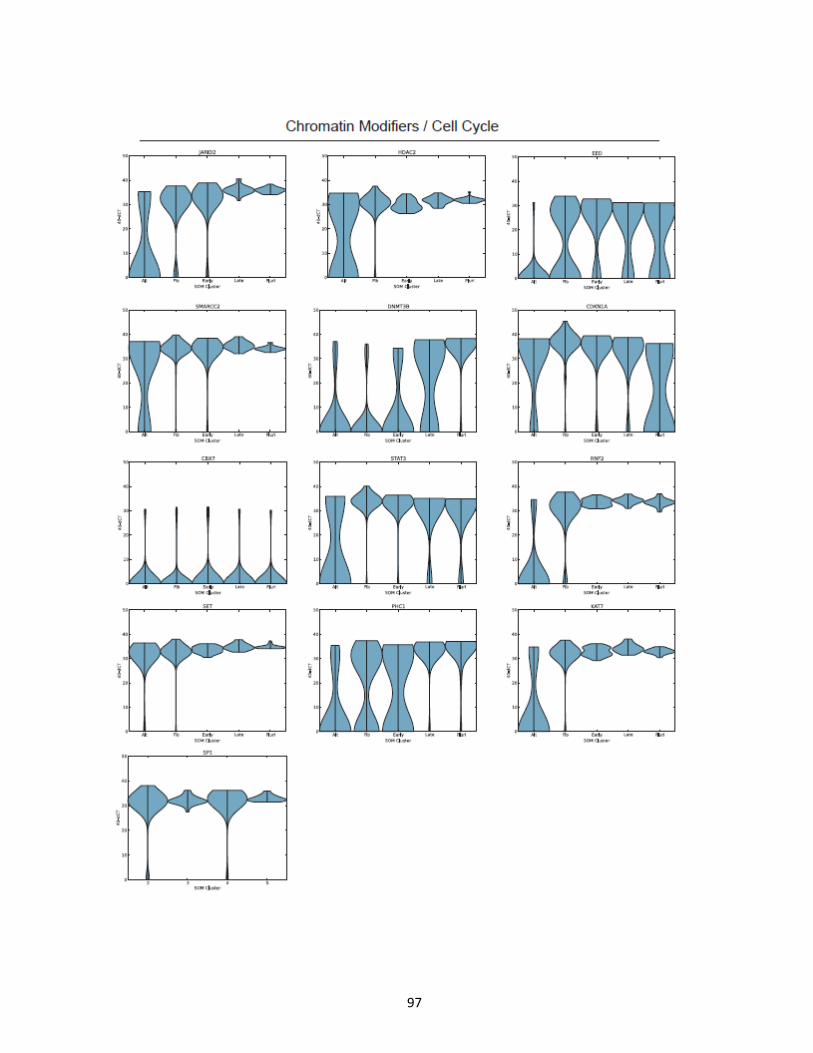
97
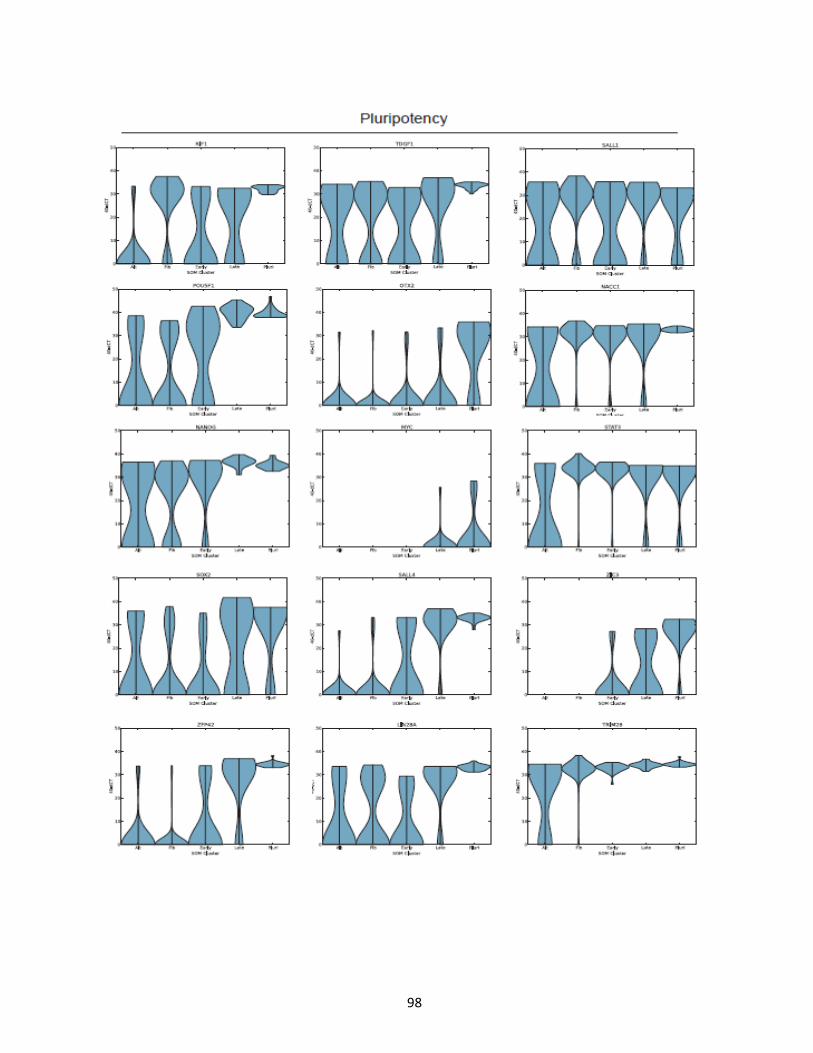
98
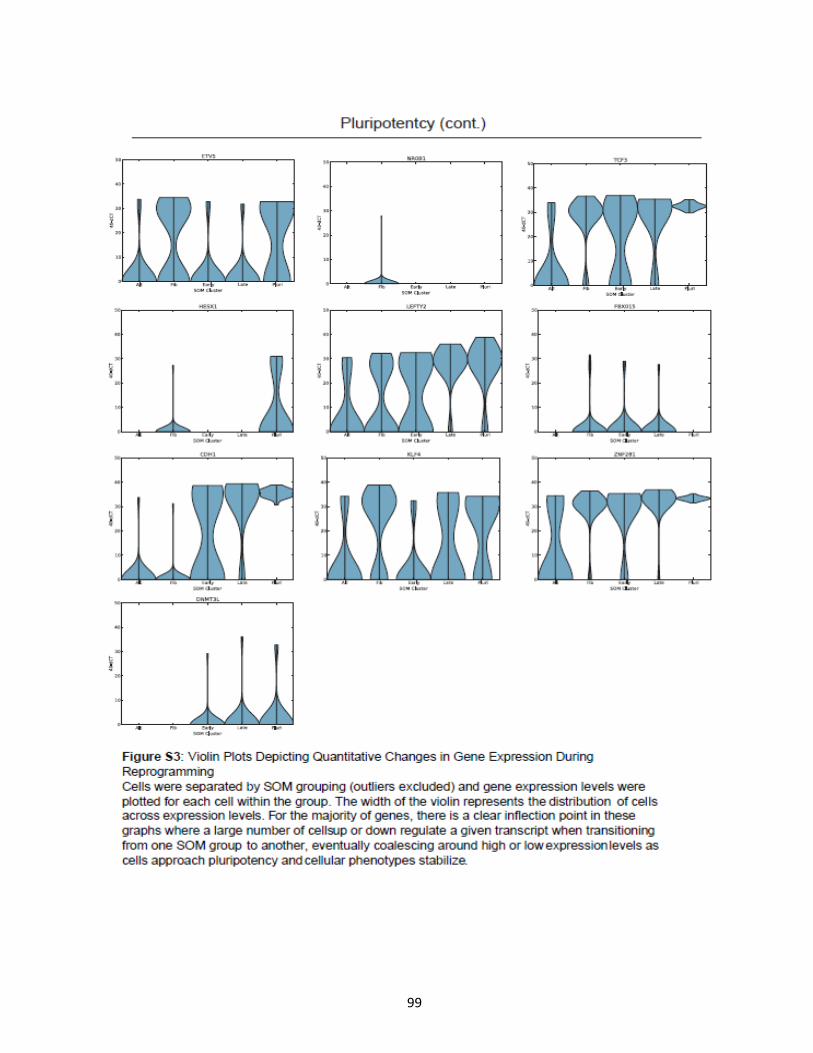
99
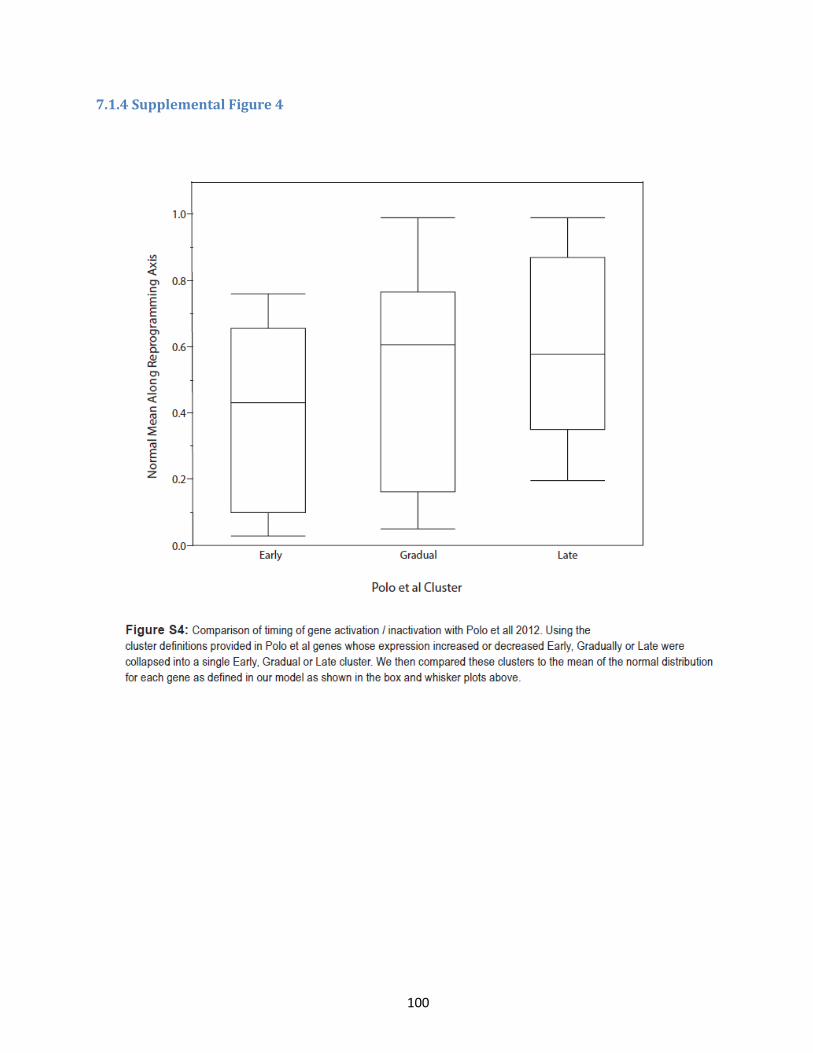
100
7.1.4 Supplemental Figure 4
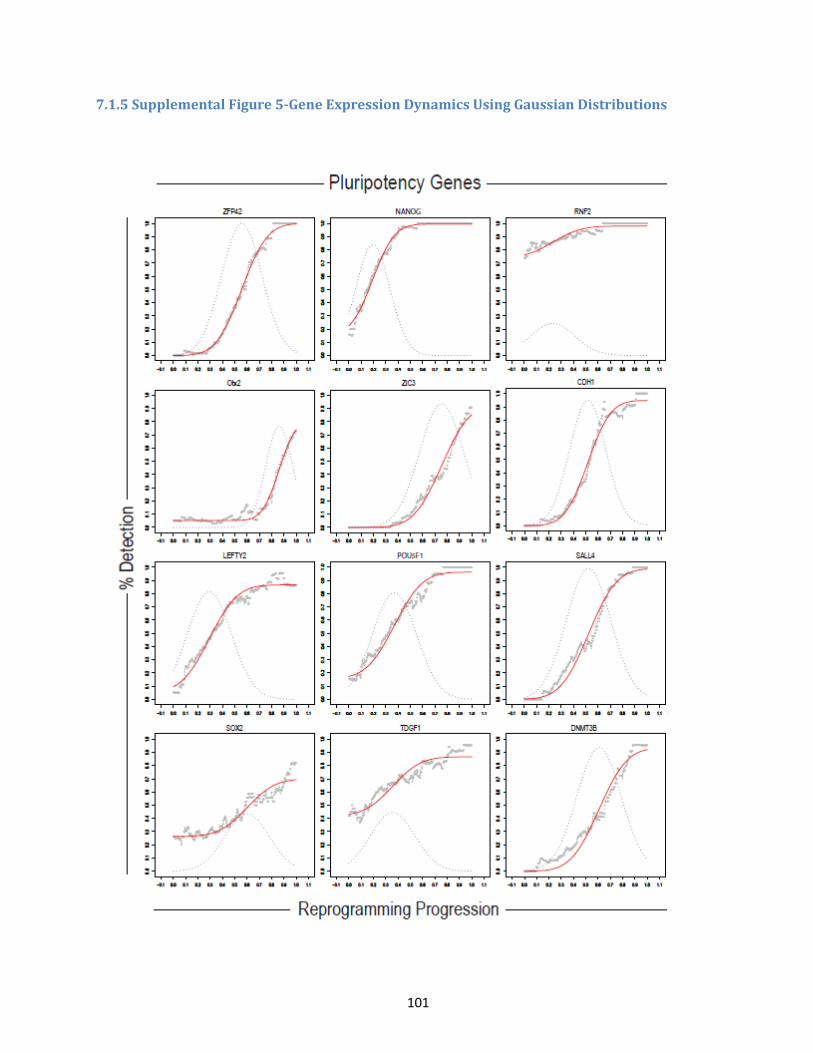
101
7.1.5 Supplemental Figure 5-Gene Expression Dynamics Using Gaussian Distributions

102
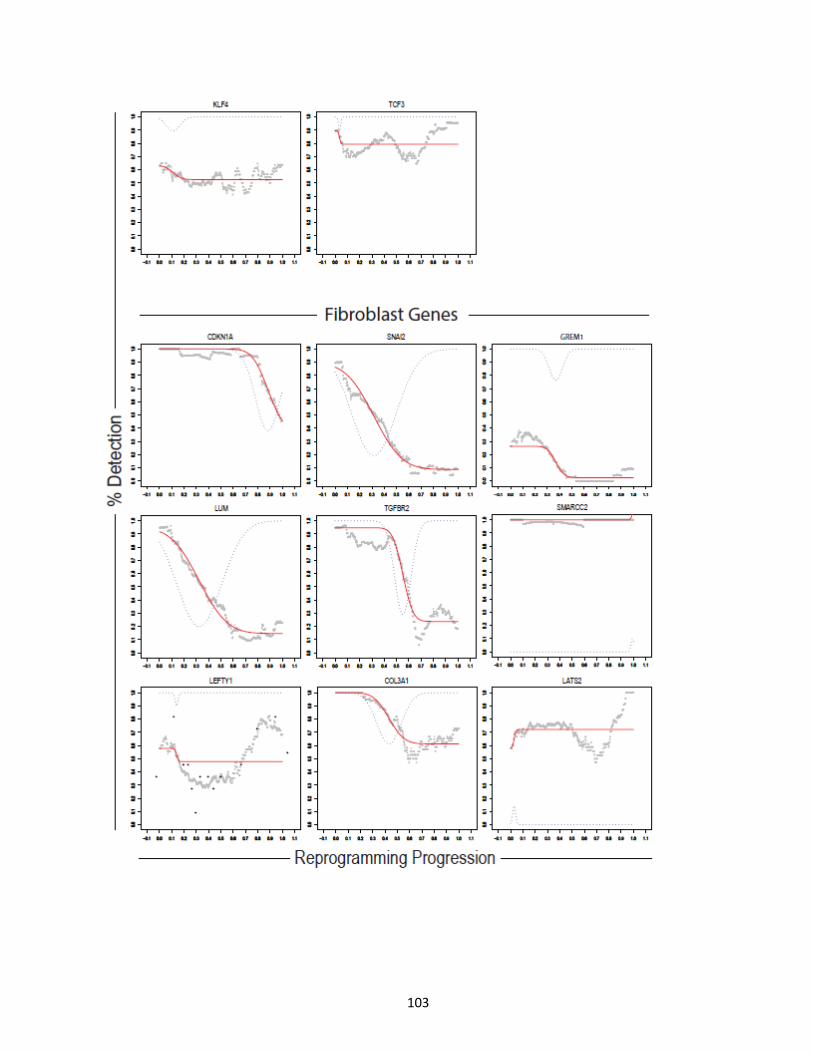
103
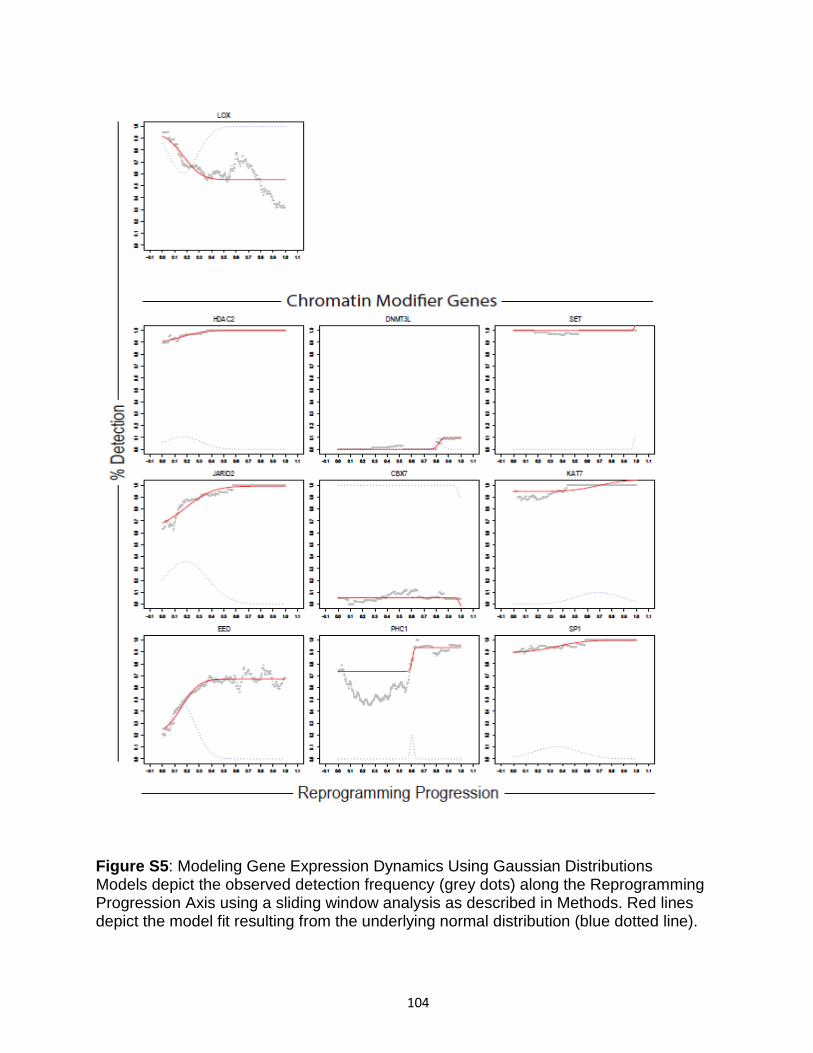
104
Figure S5: Modeling Gene Expression Dynamics Using Gaussian Distributions Models depict the observed detection frequency (grey dots) along the Reprogramming Progression Axis using a sliding window analysis as described in Methods. Red lines depict the model fit resulting from the underlying normal distribution (blue dotted line).
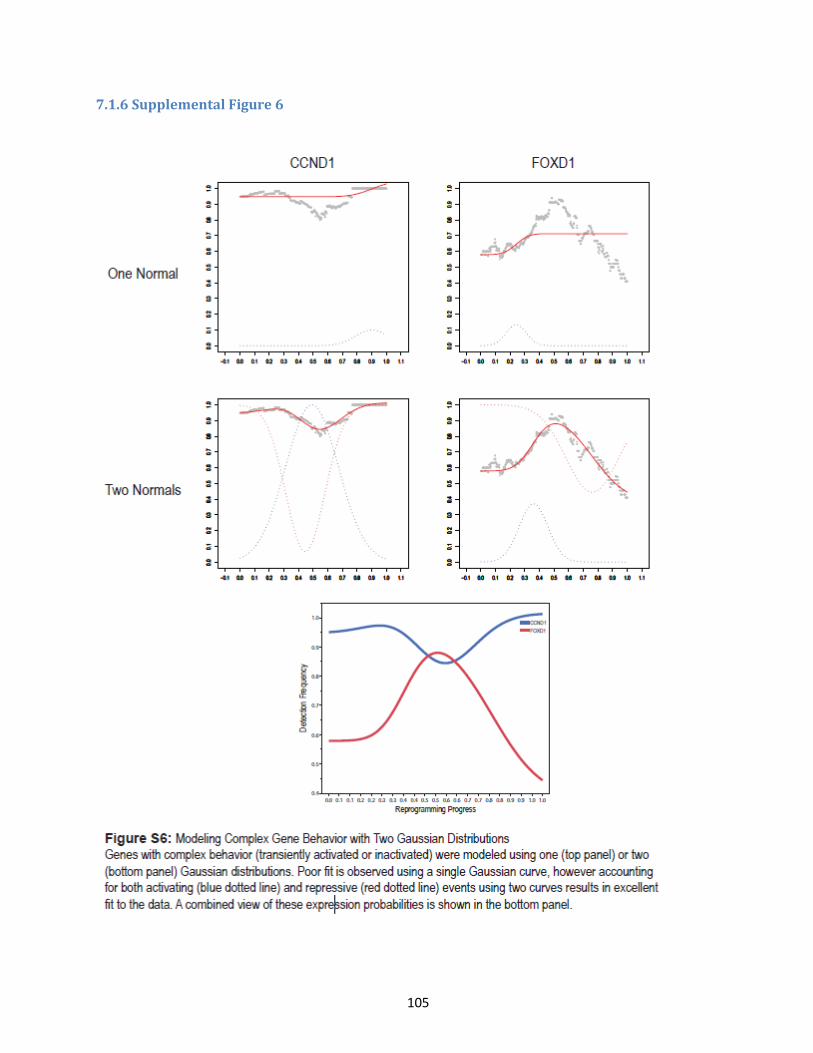
105
7.1.6 Supplemental Figure 6
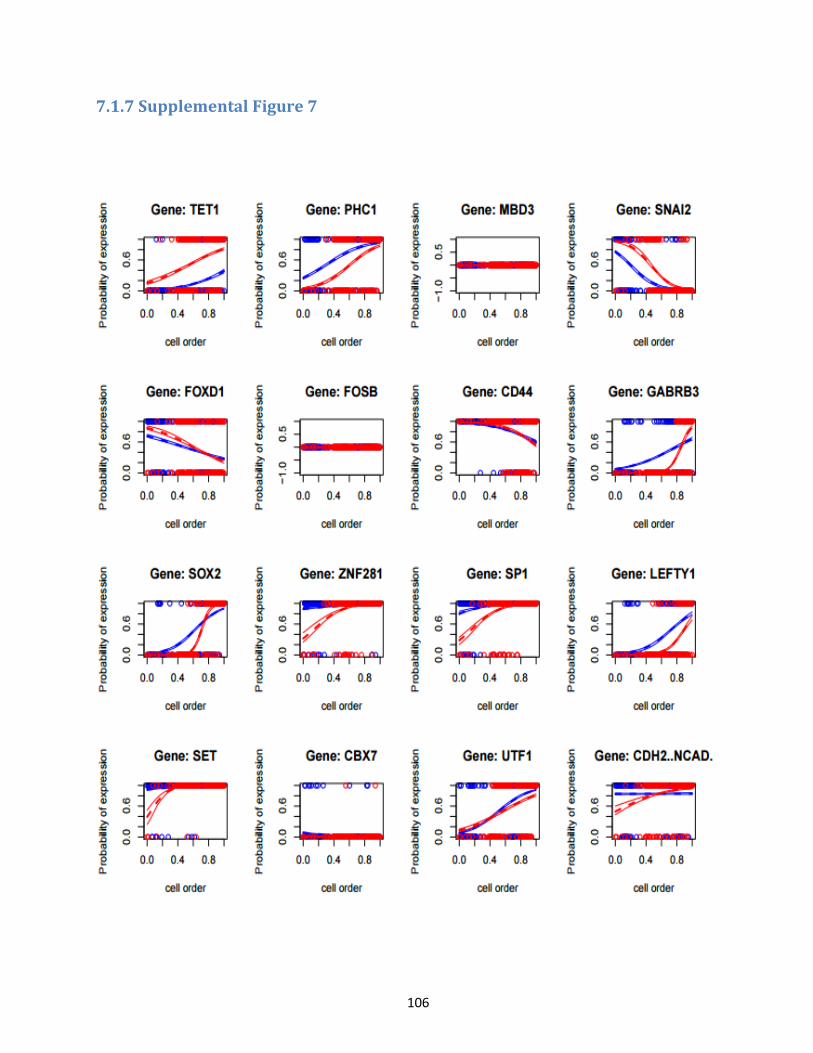
106
7.1.7 Supplemental Figure 7
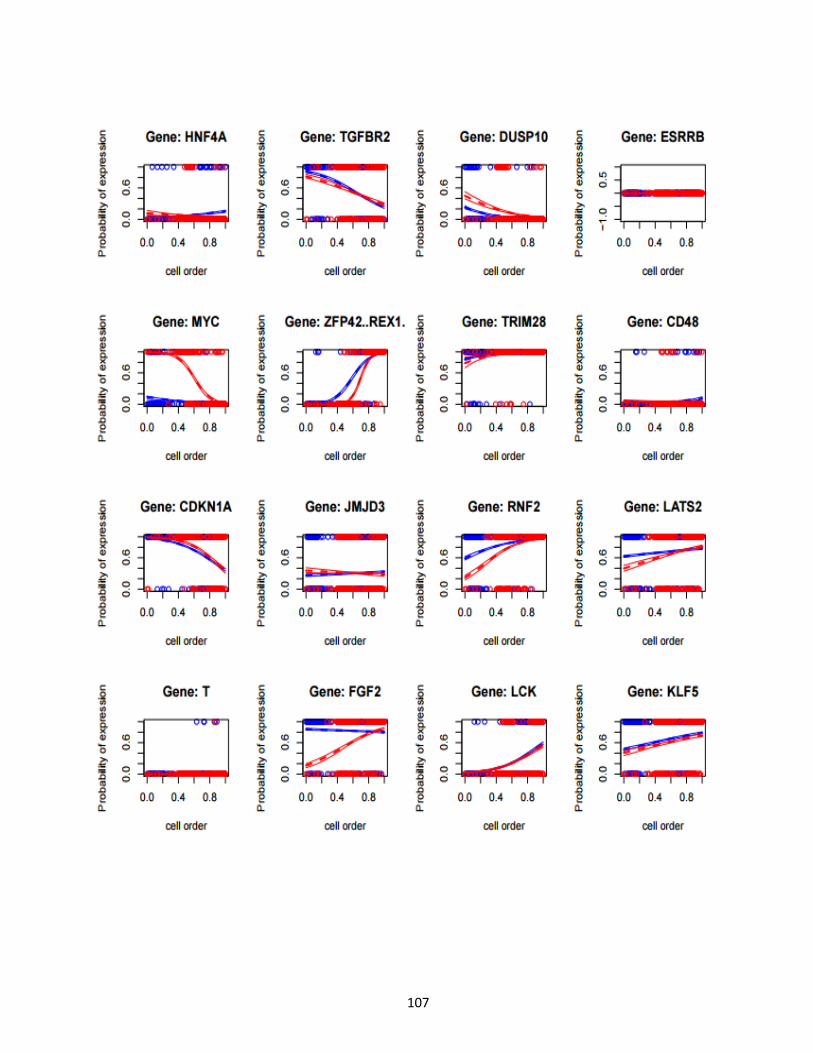
107
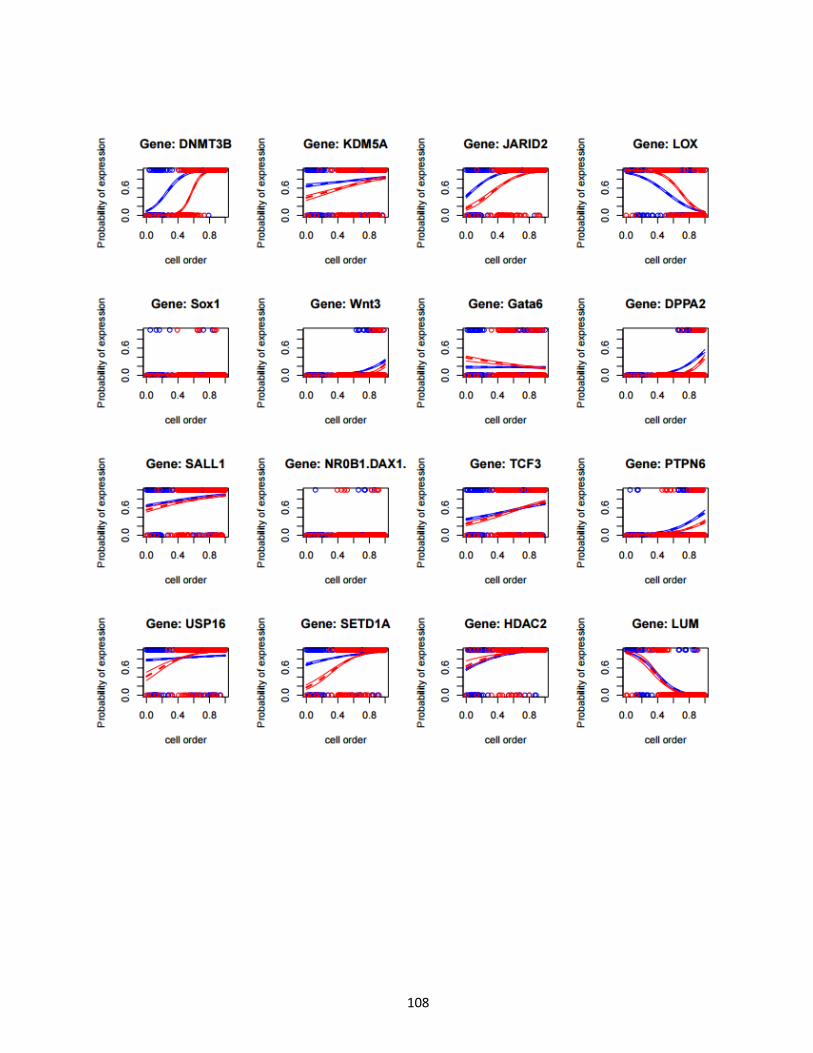
108
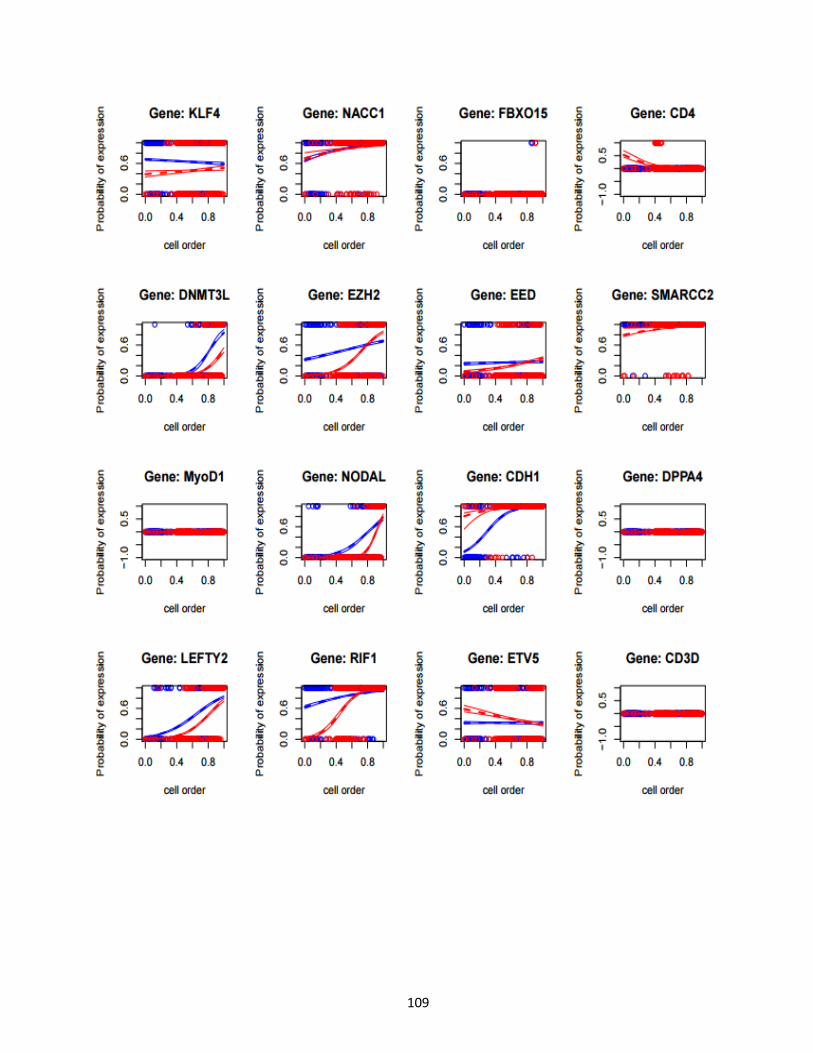
109
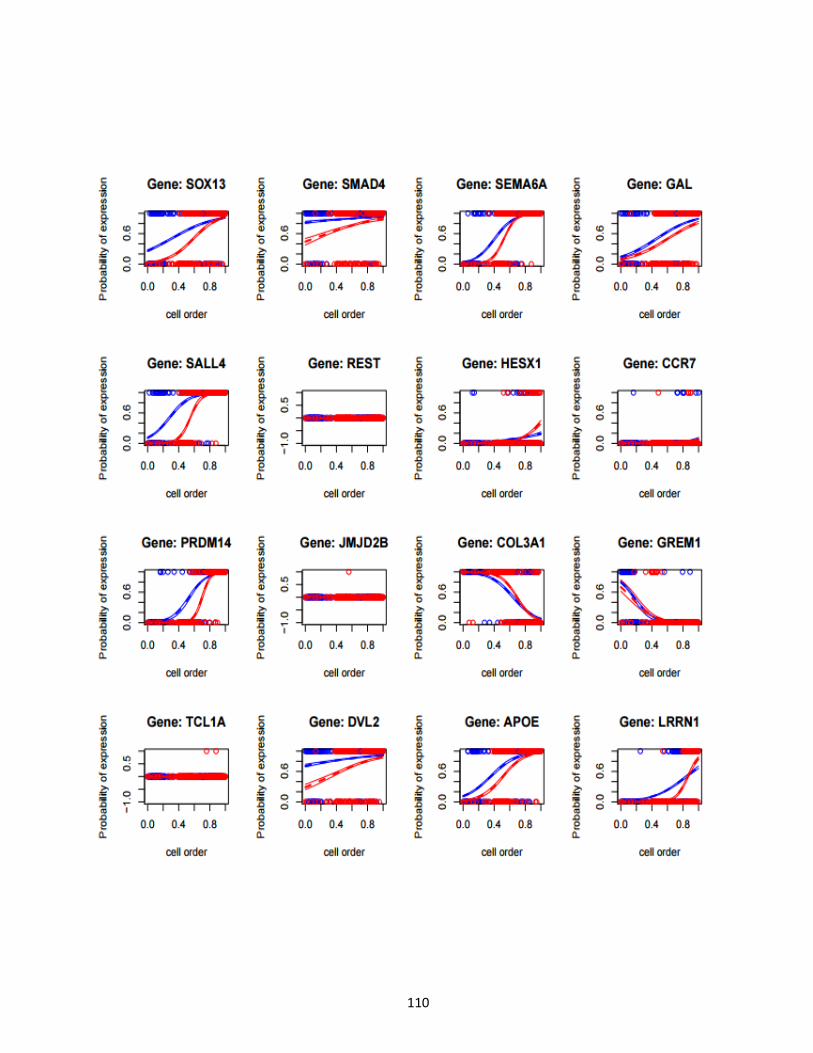
110
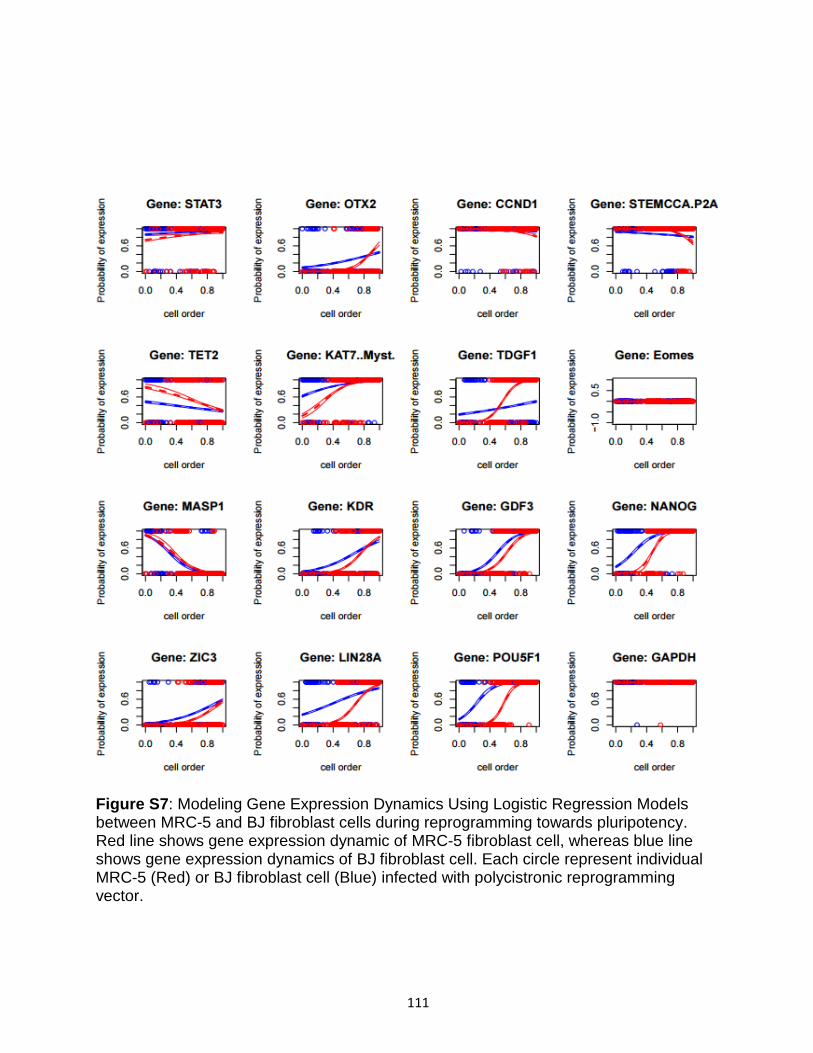
111
Figure S7: Modeling Gene Expression Dynamics Using Logistic Regression Models between MRC-5 and BJ fibroblast cells during reprogramming towards pluripotency. Red line shows gene expression dynamic of MRC-5 fibroblast cell, whereas blue line shows gene expression dynamics of BJ fibroblast cell. Each circle represent individual MRC-5 (Red) or BJ fibroblast cell (Blue) infected with polycistronic reprogramming vector.
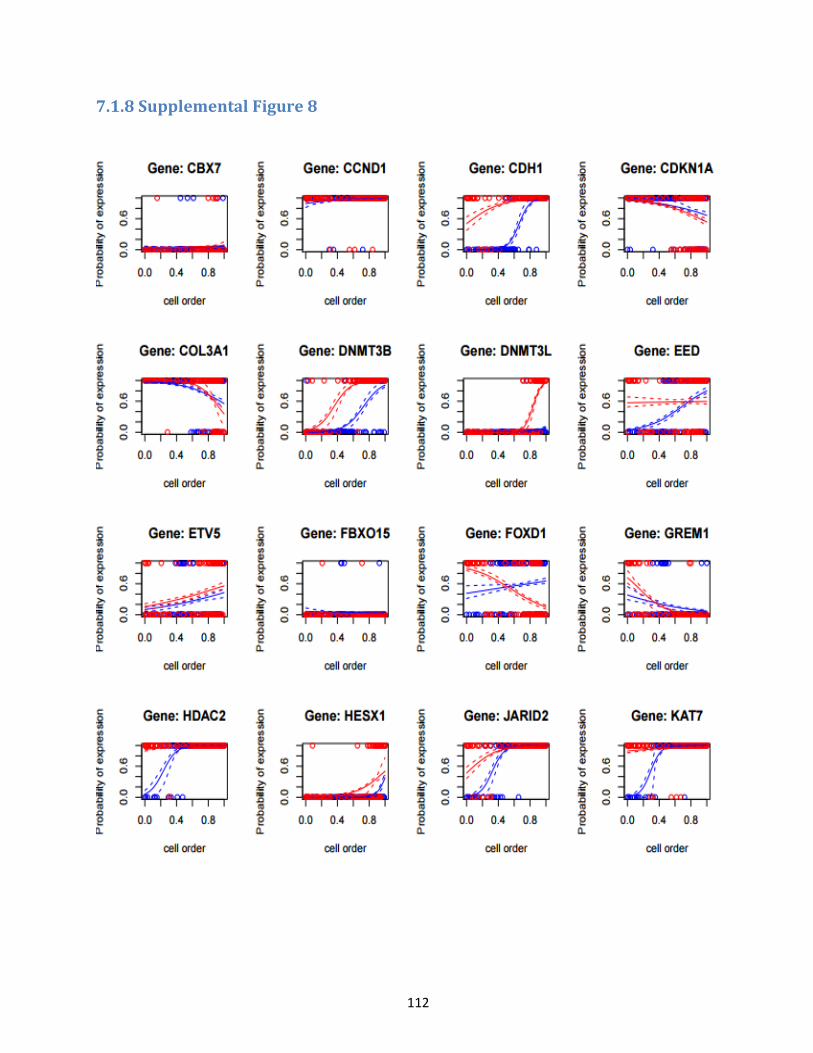
112
7.1.8 Supplemental Figure 8
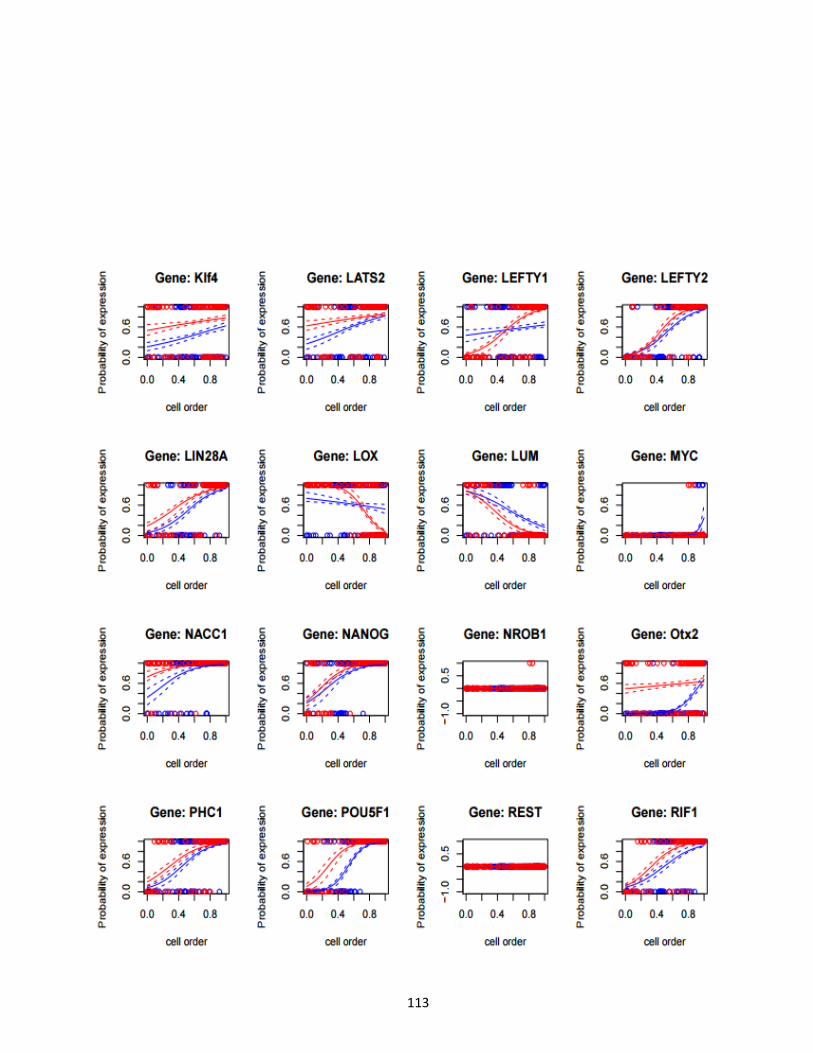
113
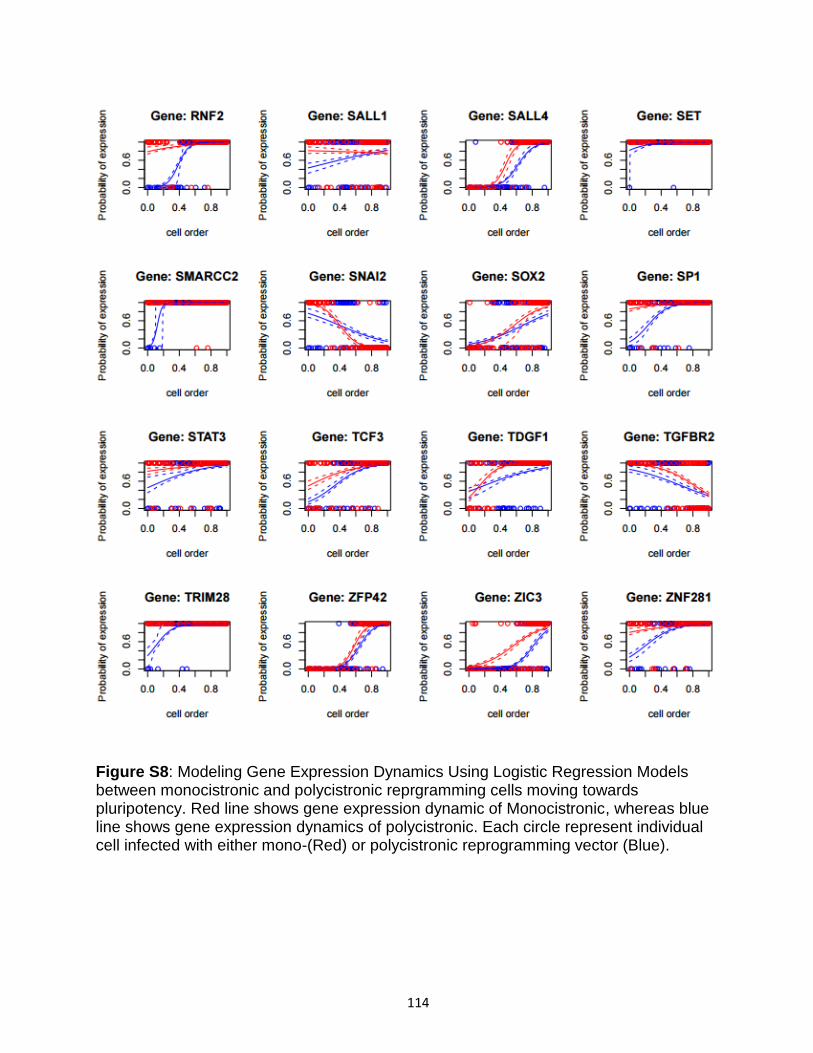
114
Figure S8: Modeling Gene Expression Dynamics Using Logistic Regression Models between monocistronic and polycistronic reprgramming cells moving towards pluripotency. Red line shows gene expression dynamic of Monocistronic, whereas blue line shows gene expression dynamics of polycistronic. Each circle represent individual cell infected with either mono-(Red) or polycistronic reprogramming vector (Blue).
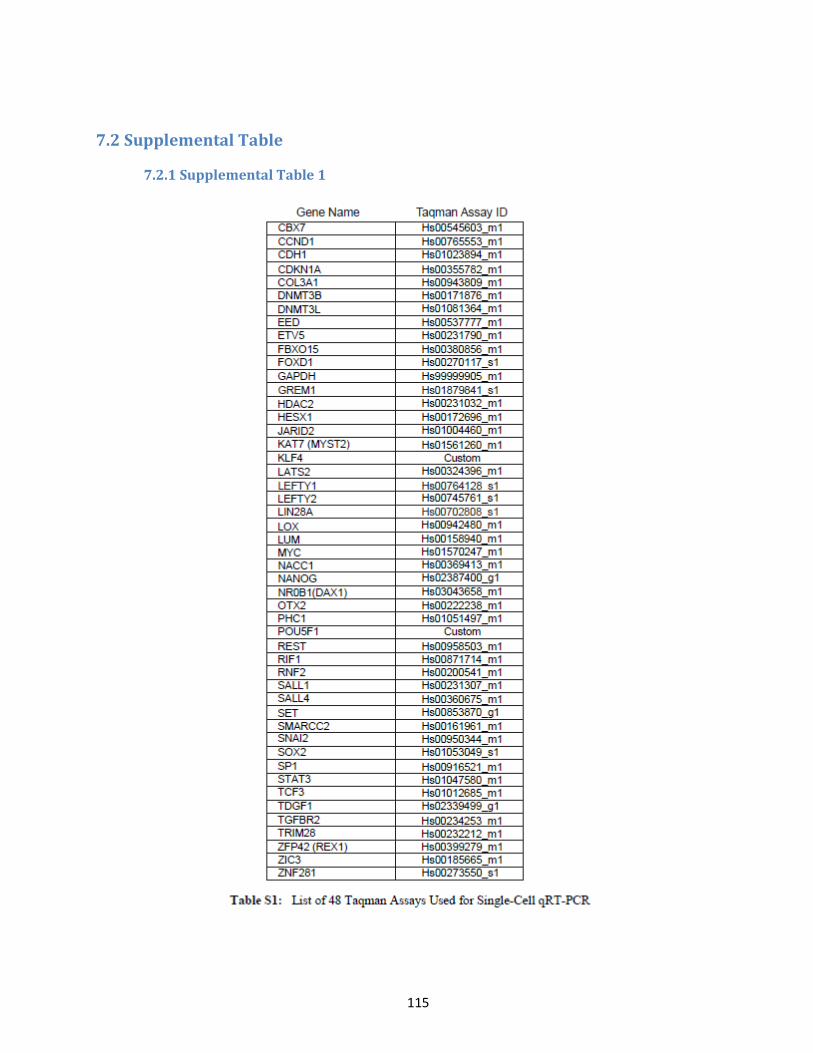
115
7.2 Supplemental Table
7.2.1 Supplemental Table 1
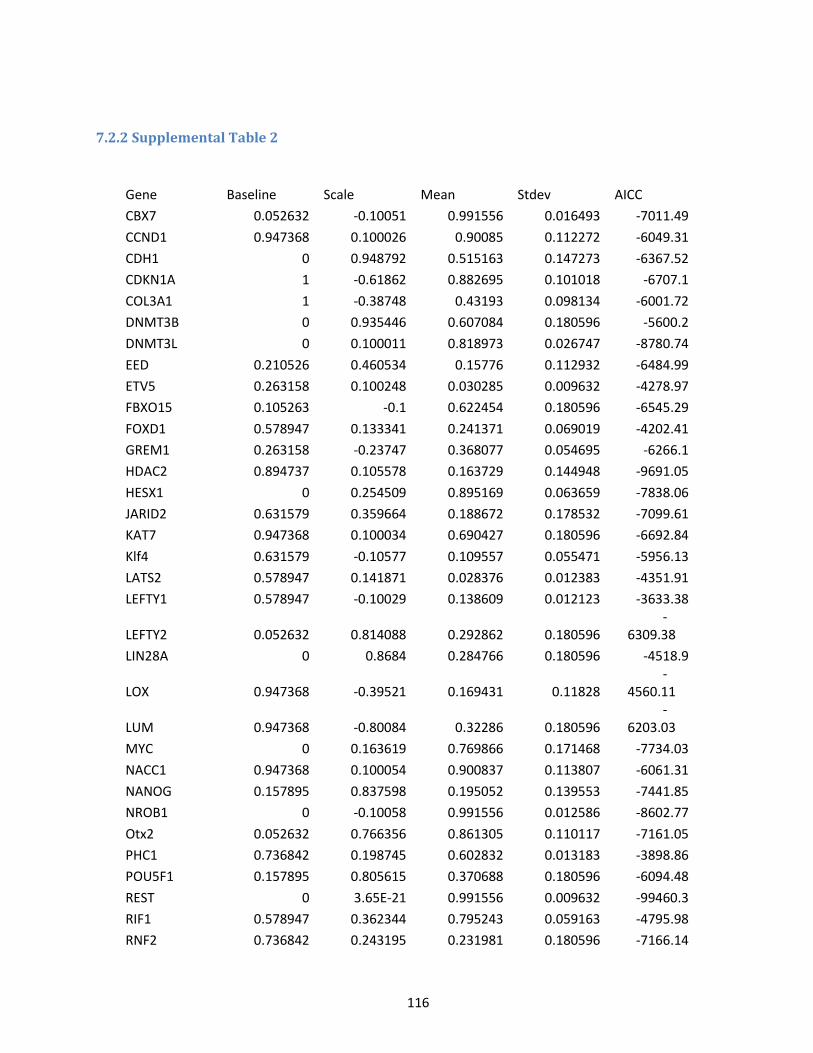
116
7.2.2 Supplemental Table 2
Gene Baseline Scale Mean Stdev AICC
CBX7 0.052632 -0.10051 0.991556 0.016493 -7011.49
CCND1 0.947368 0.100026 0.90085 0.112272 -6049.31
CDH1 0 0.948792 0.515163 0.147273 -6367.52
CDKN1A 1 -0.61862 0.882695 0.101018 -6707.1
COL3A1 1 -0.38748 0.43193 0.098134 -6001.72
DNMT3B 0 0.935446 0.607084 0.180596 -5600.2
DNMT3L 0 0.100011 0.818973 0.026747 -8780.74
EED 0.210526 0.460534 0.15776 0.112932 -6484.99
ETV5 0.263158 0.100248 0.030285 0.009632 -4278.97
FBXO15 0.105263 -0.1 0.622454 0.180596 -6545.29
FOXD1 0.578947 0.133341 0.241371 0.069019 -4202.41
GREM1 0.263158 -0.23747 0.368077 0.054695 -6266.1
HDAC2 0.894737 0.105578 0.163729 0.144948 -9691.05
HESX1 0 0.254509 0.895169 0.063659 -7838.06
JARID2 0.631579 0.359664 0.188672 0.178532 -7099.61
KAT7 0.947368 0.100034 0.690427 0.180596 -6692.84
Klf4 0.631579 -0.10577 0.109557 0.055471 -5956.13
LATS2 0.578947 0.141871 0.028376 0.012383 -4351.91
LEFTY1 0.578947 -0.10029 0.138609 0.012123 -3633.38
LEFTY2 0.052632 0.814088 0.292862 0.180596 -
6309.38
LIN28A 0 0.8684 0.284766 0.180596 -4518.9
LOX 0.947368 -0.39521 0.169431 0.11828 -
4560.11
LUM 0.947368 -0.80084 0.32286 0.180596 -
6203.03
MYC 0 0.163619 0.769866 0.171468 -7734.03
NACC1 0.947368 0.100054 0.900837 0.113807 -6061.31
NANOG 0.157895 0.837598 0.195052 0.139553 -7441.85
NROB1 0 -0.10058 0.991556 0.012586 -8602.77
Otx2 0.052632 0.766356 0.861305 0.110117 -7161.05
PHC1 0.736842 0.198745 0.602832 0.013183 -3898.86
POU5F1 0.157895 0.805615 0.370688 0.180596 -6094.48
REST 0 3.65E-21 0.991556 0.009632 -99460.3
RIF1 0.578947 0.362344 0.795243 0.059163 -4795.98
RNF2 0.736842 0.243195 0.231981 0.180596 -7166.14
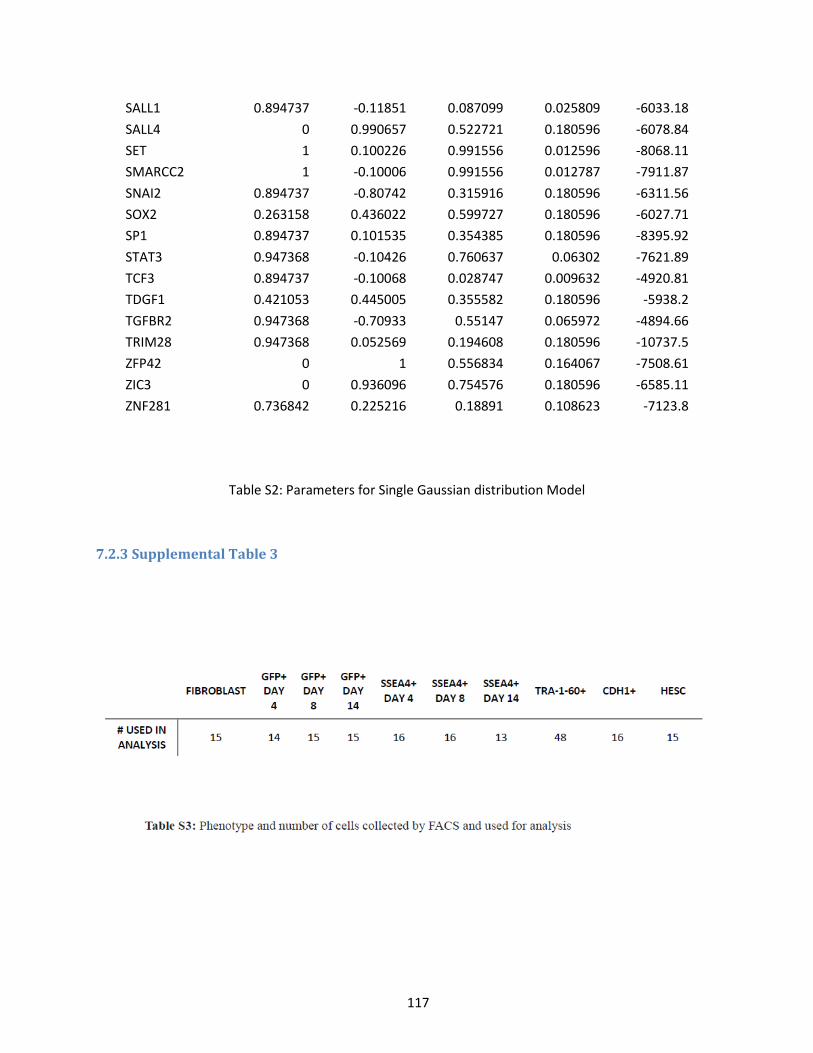
117
SALL1 0.894737 -0.11851 0.087099 0.025809 -6033.18
SALL4 0 0.990657 0.522721 0.180596 -6078.84
SET 1 0.100226 0.991556 0.012596 -8068.11
SMARCC2 1 -0.10006 0.991556 0.012787 -7911.87
SNAI2 0.894737 -0.80742 0.315916 0.180596 -6311.56
SOX2 0.263158 0.436022 0.599727 0.180596 -6027.71
SP1 0.894737 0.101535 0.354385 0.180596 -8395.92
STAT3 0.947368 -0.10426 0.760637 0.06302 -7621.89
TCF3 0.894737 -0.10068 0.028747 0.009632 -4920.81
TDGF1 0.421053 0.445005 0.355582 0.180596 -5938.2
TGFBR2 0.947368 -0.70933 0.55147 0.065972 -4894.66
TRIM28 0.947368 0.052569 0.194608 0.180596 -10737.5
ZFP42 0 1 0.556834 0.164067 -7508.61
ZIC3 0 0.936096 0.754576 0.180596 -6585.11
ZNF281 0.736842 0.225216 0.18891 0.108623 -7123.8
Table S2: Parameters for Single Gaussian distribution Model
7.2.3 Supplemental Table 3
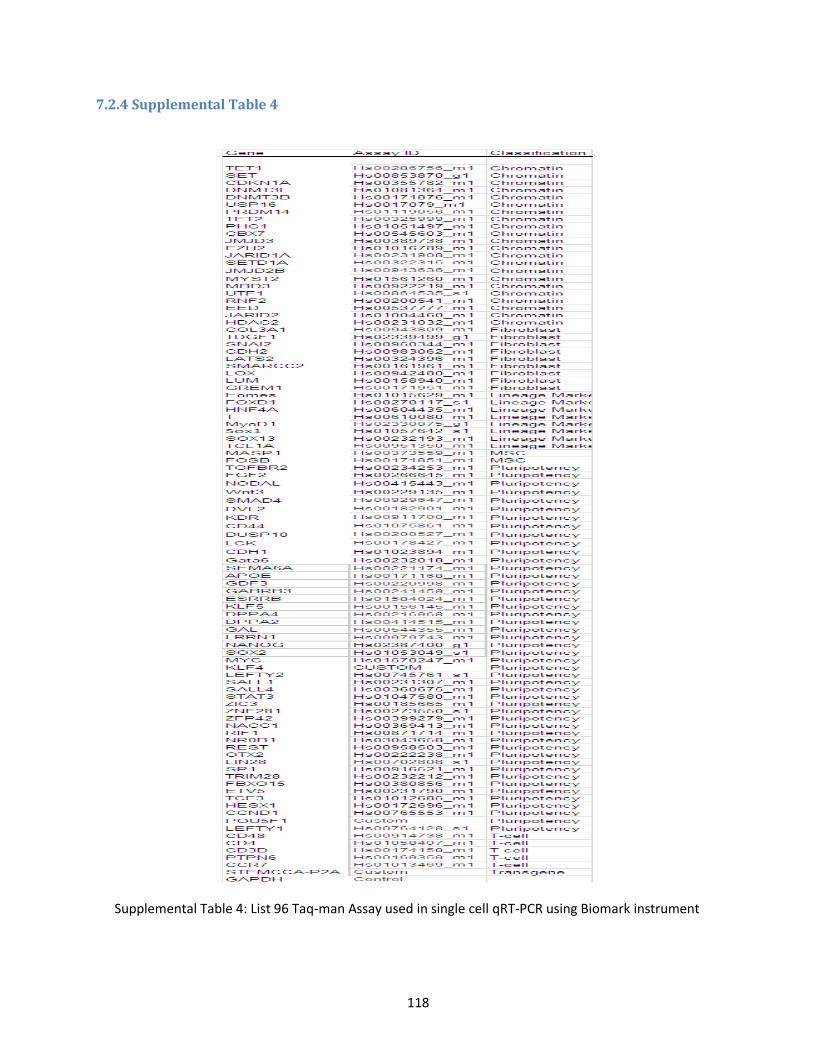
118
7.2.4 Supplemental Table 4
Supplemental Table 4: List 96 Taq-man Assay used in single cell qRT-PCR using Biomark instrument
119
7.3 Authored Papers
7.3.1 Single cell analysis reveals the stochastic phase of reprogramming to
pluripotency is an ordered probabilistic process
Chung K-M, Kolling FW, Gajdosik MD, Burger S, Russell AC, Nelson CE PLoS One. Public Library of Science; 2014;9: e95304. doi:10.1371/journal.pone.0095304
Abstract: Despite years of research, the reprogramming of human somatic cells to pluripotency
remains a slow, inefficient process, and a detailed mechanistic understanding of reprogramming remains
elusive. Current models suggest reprogramming to pluripotency occurs in two-phases: a prolonged
stochastic phase followed by a rapid deterministic phase. In this paradigm, the early stochastic phase is
marked by the random and gradual expression of pluripotency genes and is thought to be a major rate-
limiting step in the successful generation of inducedPluripotent Stem Cells (iPSCs). Recent evidence
suggests that the epigenetic landscape of the somatic cell is gradually reset during a period known as the
stochastic phase, but it is known neither how this occurs nor what rate-limiting steps control progress
through the stochastic phase. A precise understanding of gene expression dynamics in the stochastic
phase is required in order to answer these questions. Moreover, a precise model of this complex process
will enable the measurement and mechanistic dissection of treatments that enhance the rate or efficiency
of reprogramming to pluripotency. Here we use single-cell transcript profiling, FACS and mathematical
modeling to show that the stochastic phase is an ordered probabilistic process with independent gene-
specific dynamics. We also show that partially reprogrammed cells infected with OSKM follow two
trajectories: a productive trajectory toward increasingly ESC-like expression profiles or an alternative
trajectory leading away from both the fibroblast and ESC state. These two pathways are distinguished by
the coordinated expression of a small group of chromatin modifiers in the productive trajectory, supporting
the notion that chromatin remodeling is essential for successful reprogramming. These are the first results
to show that the stochastic phase of reprogramming in human fibroblasts is an ordered, probabilistic
process with gene-specific dynamics and to provide a precise mathematical framework describing the
dynamics of pluripotency gene expression during reprogramming by OSKM.
120
Reference
1. Takahashi K, Yamanaka S. Induction of pluripotent stem cells from mouse embryonic and adult fibroblast cultures by defined factors. Cell. 2006;126: 663–676. Available: http://dx.doi.org/10.1016/j.cell.2006.07.024
2. Cao S, Loh K, Pei Y, Zhang W, Han J. Overcoming barriers to the clinical utilization of iPSCs: reprogramming efficiency, safety and quality. Protein Cell. 2012;3: 834–45. doi:10.1007/s13238-012-2078-6
3. Hanna J, Saha K, Pando B, van Zon J, Lengner CJ, Creyghton MP, et al. Direct cell reprogramming is a stochastic process amenable to acceleration. Nature. Nature Publishing Group; 2009;462: 595–601. doi:10.1038/nature08592
4. Plath K, Lowry WE. Progress in understanding reprogramming to the induced pluripotent state. Nat Rev Genet. Nature Publishing Group; 2011;12: 253–265. doi:10.1038/nrg2955
5. Park I-H, Zhao R, West J a, Yabuuchi A, Huo H, Ince T a, et al. Reprogramming of human somatic cells to pluripotency with defined factors. Nature. 2008;451: 141–6. doi:10.1038/nature06534
6. Yu J, Vodyanik M a, Smuga-Otto K, Antosiewicz-Bourget J, Frane JL, Tian S, et al. Induced pluripotent stem cell lines derived from human somatic cells. Science. 2007;318: 1917–20. doi:10.1126/science.1151526
7. Sun N, Panetta NJ, Gupta DM, Wilson KD, Lee A, Jia F, et al. Feeder-free derivation of induced pluripotent stem cells from adult human adipose stem cells. Proc Natl Acad Sci U S A. 2009;106: 15720–5. doi:10.1073/pnas.0908450106
8. Hanna J, Markoulaki S, Schorderet P, Carey BW, Beard C, Wernig M, et al. Direct reprogramming of terminally differentiated mature B lymphocytes to pluripotency. Cell. 2008;133: 250–64. doi:10.1016/j.cell.2008.03.028
9. Aoi T, Yae K, Nakagawa M, Ichisaka T, Okita K, Takahashi K, et al. Generation of pluripotent stem cells from adult mouse liver and stomach cells. Science. 2008;321: 699–702. doi:10.1126/science.1154884
10. Eminli S, Utikal J, Arnold K, Jaenisch R, Hochedlinger K. Reprogramming of neural progenitor cells into induced pluripotent stem cells in the absence of exogenous Sox2 expression. Stem Cells. 2008;26: 2467–74. doi:10.1634/stemcells.2008-0317
121
11. Kim JB, Zaehres H, Wu G, Gentile L, Ko K, Sebastiano V, et al. Pluripotent stem cells induced from adult neural stem cells by reprogramming with two factors. Nature. 2008;454: 646–50. doi:10.1038/nature07061
12. Utikal J, Maherali N, Kulalert W, Hochedlinger K. Sox2 is dispensable for the reprogramming of melanocytes and melanoma cells into induced pluripotent stem cells. J Cell Sci. 2009;122: 3502–10. doi:10.1242/jcs.054783
13. Stadtfeld M, Brennand K, Hochedlinger K. Reprogramming of pancreatic beta cells into induced pluripotent stem cells. Curr Biol. 2008;18: 890–4. doi:10.1016/j.cub.2008.05.010
14. Maherali N, Ahfeldt T, Rigamonti A, Utikal J, Cowan C, Hochedlinger K. A high-efficiency system for the generation and study of human induced pluripotent stem cells. Cell Stem Cell. 2008;3: 340–5. doi:10.1016/j.stem.2008.08.003
15. Stadtfeld M, Maherali N, Breault DT, Hochedlinger K. Defining molecular cornerstones during fibroblast to iPS cell reprogramming in mouse. Cell Stem Cell. 2008;2: 230–40. doi:10.1016/j.stem.2008.02.001
16. Nakagawa M, Koyanagi M, Tanabe K, Takahashi K, Ichisaka T, Aoi T, et al. Generation of induced pluripotent stem cells without Myc from mouse and human fibroblasts. Nat Biotechnol. 2008;26: 101–6. doi:10.1038/nbt1374
17. Yu J, Hu K, Smuga-Otto K, Tian S, Stewart R, Slukvin II, et al. Human induced pluripotent stem cells free of vector and transgene sequences. Science. 2009;324: 797–801. doi:10.1126/science.1172482
18. Okita K, Nakagawa M, Hyenjong H, Ichisaka T, Yamanaka S. Generation of mouse induced pluripotent stem cells without viral vectors. Science. 2008;322: 949–53. doi:10.1126/science.1164270
19. Gonzalez F, Barragan Monasterio M, Tiscornia G, Montserrat Pulido N, Vassena R, Batlle Morera L, et al. Generation of mouse-induced pluripotent stem cells by transient expression of a single nonviral polycistronic vector. Proc Natl Acad Sci U S A. 2009;106: 8918–22. doi:10.1073/pnas.0901471106
20. Woltjen K, Michael IP, Mohseni P, Desai R, Mileikovsky M, Hämäläinen R, et al. piggyBac transposition reprograms fibroblasts to induced pluripotent stem cells. Nature. 2009;458: 766–70. doi:10.1038/nature07863
21. Jia F, Wilson KD, Sun N, Gupta DM, Huang M, Li Z, et al. A nonviral minicircle vector for deriving human iPS cells. Nat Methods. 2010;7: 197–9. doi:10.1038/nmeth.1426
122
22. Seki T, Yuasa S, Oda M, Egashira T, Yae K, Kusumoto D, et al. Generation of induced pluripotent stem cells from human terminally differentiated circulating T cells. Cell Stem Cell. 2010;7: 11–4. doi:10.1016/j.stem.2010.06.003
23. Stadtfeld M, Nagaya M, Utikal J, Weir G, Hochedlinger K. Induced pluripotent stem cells generated without viral integration. Science. 2008;322: 945–9. doi:10.1126/science.1162494
24. Zhou W, Freed CR. Adenoviral gene delivery can reprogram human fibroblasts to induced pluripotent stem cells. Stem Cells. 2009;27: 2667–74. doi:10.1002/stem.201
25. Kim D, Kim C-H, Moon J-I, Chung Y-G, Chang M-Y, Han B-S, et al. Generation of human induced pluripotent stem cells by direct delivery of reprogramming proteins. Cell Stem Cell. 2009;4: 472–6. doi:10.1016/j.stem.2009.05.005
26. Warren L, Manos PD, Ahfeldt T, Loh Y-H, Li H, Lau F, et al. Highly efficient reprogramming to pluripotency and directed differentiation of human cells with synthetic modified mRNA. Cell Stem Cell. 2010;7: 618–30. doi:10.1016/j.stem.2010.08.012
27. Yakubov E, Rechavi G, Rozenblatt S, Givol D. Reprogramming of human fibroblasts to pluripotent stem cells using mRNA of four transcription factors. Biochem Biophys Res Commun. 2010;394: 189–93. doi:10.1016/j.bbrc.2010.02.150
28. Zhou H, Wu S, Joo JY, Zhu S, Han DW, Lin T, et al. Generation of induced pluripotent stem cells using recombinant proteins. Cell Stem Cell. 2009;4: 381–4. doi:10.1016/j.stem.2009.04.005
29. Anokye-Danso F, Trivedi CM, Juhr D, Gupta M, Cui Z, Tian Y, et al. Highly efficient miRNA-mediated reprogramming of mouse and human somatic cells to pluripotency. Cell Stem Cell. Elsevier Inc.; 2011;8: 376–88. doi:10.1016/j.stem.2011.03.001
30. Miyoshi N, Ishii H, Nagano H, Haraguchi N, Dewi DL, Kano Y, et al. Reprogramming of mouse and human cells to pluripotency using mature microRNAs. Cell Stem Cell. Elsevier Inc.; 2011;8: 633–8. doi:10.1016/j.stem.2011.05.001
31. Redmer T, Diecke S, Grigoryan T, Quiroga-Negreira A, Birchmeier W, Besser D. E-cadherin is crucial for embryonic stem cell pluripotency and can replace OCT4 during somatic cell reprogramming. EMBO Rep. Nature Publishing Group; 2011;12: 720–6. doi:10.1038/embor.2011.88
123
32. Gao Y, Chen J, Li K, Wu T, Huang B, Liu W, et al. Replacement of Oct4 by Tet1 during iPSC induction reveals an important role of DNA methylation and hydroxymethylation in reprogramming. Cell Stem Cell. 2013;12: 453–69. doi:10.1016/j.stem.2013.02.005
33. Heng J-CD, Feng B, Han J, Jiang J, Kraus P, Ng J-H, et al. The nuclear receptor Nr5a2 can replace Oct4 in the reprogramming of murine somatic cells to pluripotent cells. Cell Stem Cell. 2010;6: 167–74. doi:10.1016/j.stem.2009.12.009
34. Soufi A. Mechanisms for enhancing cellular reprogramming. Curr Opin Genet Dev. 2014;25: 101–9. doi:10.1016/j.gde.2013.12.007
35. Feng B, Ng J-H, Heng J-CD, Ng H-H. Molecules that promote or enhance reprogramming of somatic cells to induced pluripotent stem cells. Cell Stem Cell. 2009;4: 301–12. doi:10.1016/j.stem.2009.03.005
36. Chen J, Liu J, Yang J, Chen Y, Chen J, Ni S, et al. BMPs functionally replace Klf4 and support efficient reprogramming of mouse fibroblasts by Oct4 alone. Cell Res. 2011;21: 205–12. doi:10.1038/cr.2010.172
37. Lyssiotis CA, Foreman RK, Staerk J, Garcia M, Mathur D, Markoulaki S, et al. Reprogramming of murine fibroblasts to induced pluripotent stem cells with chemical complementation of Klf4. Proc Natl Acad Sci U S A. 2009;106: 8912–7. doi:10.1073/pnas.0903860106
38. Mikkelsen TS, Hanna J, Zhang X, Ku M, Wernig M, Schorderet P, et al. Dissecting direct reprogramming through integrative genomic analysis. Nature. 2008;454: 49–55. doi:10.1038/nature07056
39. Shi Y, Desponts C, Do JT, Hahm HS, Schöler HR, Ding S. Induction of pluripotent stem cells from mouse embryonic fibroblasts by Oct4 and Klf4 with small-molecule compounds. Cell Stem Cell. 2008;3: 568–74. doi:10.1016/j.stem.2008.10.004
40. Huangfu D, Maehr R, Guo W, Eijkelenboom A, Snitow M, Chen AE, et al. Induction of pluripotent stem cells by defined factors is greatly improved by small-molecule compounds. Nat Biotechnol. Nature Publishing Group; 2008;26: 795–7. doi:10.1038/nbt1418
41. Huangfu D, Osafune K, Maehr R, Guo W, Eijkelenboom A, Chen S, et al. Induction of pluripotent stem cells from primary human fibroblasts with only Oct4 and Sox2. Nat Biotechnol. Nature Publishing Group; 2008;26: 1269–75. doi:10.1038/nbt.1502
42. Silva J, Barrandon O, Nichols J, Kawaguchi J, Theunissen TW, Smith A. Promotion of reprogramming to ground state pluripotency by signal inhibition.
124
PLoS Biol. Public Library of Science; 2008;6: e253. doi:10.1371/journal.pbio.0060253
43. Blaschke K, Ebata KT, Karimi MM, Zepeda-Martínez JA, Goyal P, Mahapatra S, et al. Vitamin C induces Tet-dependent DNA demethylation and a blastocyst-like state in ES cells. Nature. Nature Publishing Group, a division of Macmillan Publishers Limited. All Rights Reserved.; 2013;500: 222–6. doi:10.1038/nature12362
44. Sridharan R, Tchieu J, Mason MJ, Yachechko R, Kuoy E, Horvath S, et al. Role of the murine reprogramming factors in the induction of pluripotency. Cell. Elsevier Inc.; 2009;136: 364–77. doi:10.1016/j.cell.2009.01.001
45. Koche RP, Smith ZD, Adli M, Gu H, Ku M, Gnirke A, et al. Reprogramming factor expression initiates widespread targeted chromatin remodeling. Cell Stem Cell. Elsevier Inc.; 2011;8: 96–105. doi:10.1016/j.stem.2010.12.001
46. Hou P, Li Y, Zhang X, Liu C, Guan J, Li H, et al. Pluripotent Stem Cells Induced from Mouse Somatic Cells by Small-Molecule Compounds. Science (80- ). 2013;341: 651–654. doi:10.1126/science.1239278
47. Tiemann U, Sgodda M, Warlich E, Ballmaier M, Schöler HR, Schambach A, et al. Optimal reprogramming factor stoichiometry increases colony numbers and affects molecular characteristics of murine induced pluripotent stem cells. Cytometry A. 2011;79: 426–35. doi:10.1002/cyto.a.21072
48. Somers A, Jean J-C, Sommer CA, Omari A, Ford CC, Mills JA, et al. Generation of transgene-free lung disease-specific human induced pluripotent stem cells using a single excisable lentiviral stem cell cassette. Stem Cells. 2010;28: 1728–40. doi:10.1002/stem.495
49. Marson A, Levine SS, Cole MF, Frampton GM, Brambrink T, Johnstone S, et al. Connecting microRNA genes to the core transcriptional regulatory circuitry of embryonic stem cells. Cell. 2008;134: 521–533. doi:10.1016/j.cell.2008.07.020
50. Ichida JK, Blanchard J, Lam K, Son EY, Chung JE, Egli D, et al. A small-molecule inhibitor of tgf-Beta signaling replaces sox2 in reprogramming by inducing nanog. Cell Stem Cell. 2009;5: 491–503. doi:10.1016/j.stem.2009.09.012
51. Miyabayashi T, Teo J-L, Yamamoto M, McMillan M, Nguyen C, Kahn M. Wnt/beta-catenin/CBP signaling maintains long-term murine embryonic stem cell pluripotency. Proc Natl Acad Sci U S A. 2007;104: 5668–73. doi:10.1073/pnas.0701331104
125
52. Smith ZD, Nachman I, Regev A, Meissner A. Dynamic single-cell imaging of direct reprogramming reveals an early specifying event. Nat Biotechnol. Nature Publishing Group; 2010;28: 521–6. doi:10.1038/nbt.1632
53. Mikkelsen TS, Ku M, Jaffe DB, Issac B, Lieberman E, Giannoukos G, et al. Genome-wide maps of chromatin state in pluripotent and lineage-committed cells. Nature. 2007;448: 553–560. doi:10.1038/nature06008
54. Mattout A, Biran A, Meshorer E. Global epigenetic changes during somatic cell reprogramming to iPS cells. J Mol Cell Biol. 2011;3: 341–50. doi:10.1093/jmcb/mjr028
55. Maherali N, Sridharan R, Xie W, Utikal J, Eminli S, Arnold K, et al. Directly reprogrammed fibroblasts show global epigenetic remodeling and widespread tissue contribution. Cell Stem Cell. 2007;1: 55–70. doi:10.1016/j.stem.2007.05.014
56. Samavarchi-Tehrani P, Golipour A, David L, Sung H-K, Beyer T a, Datti A, et al. Functional genomics reveals a BMP-driven mesenchymal-to-epithelial transition in the initiation of somatic cell reprogramming. Cell Stem Cell. Elsevier Inc.; 2010;7: 64–77. doi:10.1016/j.stem.2010.04.015
57. Buganim Y, Faddah D a, Jaenisch R. Mechanisms and models of somatic cell reprogramming. Nat Rev Genet. Nature Publishing Group; 2013;14: 427–39. doi:10.1038/nrg3473
58. Ku M, Koche RP, Rheinbay E, Mendenhall EM, Endoh M, Mikkelsen TS, et al. Genomewide analysis of PRC1 and PRC2 occupancy identifies two classes of bivalent domains. PLoS Genet. 2008;4: e1000242. doi:10.1371/journal.pgen.1000242
59. Mah N, Wang Y, Liao M-C, Prigione A, Jozefczuk J, Lichtner B, et al. Molecular insights into reprogramming-initiation events mediated by the OSKM gene regulatory network. PLoS One. Public Library of Science; 2011;6: e24351. doi:10.1371/journal.pone.0024351
60. Cai J, Chen J, Liu Y, Miura T, Luo Y, Loring JF, et al. Assessing self-renewal and differentiation in human embryonic stem cell lines. Stem Cells. 2006;24: 516–30. doi:10.1634/stemcells.2005-0143
61. Li R, Liang J, Ni S, Zhou T, Qing X, Li H, et al. A mesenchymal-to-epithelial transition initiates and is required for the nuclear reprogramming of mouse fibroblasts. Cell Stem Cell. 2010;7: 51–63. doi:10.1016/j.stem.2010.04.014
126
62. Woltjen K, Stanford WL. Preview. Inhibition of Tgf-beta signaling improves mouse fibroblast reprogramming. Cell Stem Cell. 2009;5: 457–8. doi:10.1016/j.stem.2009.10.007
63. Hawkins K, Joy S, McKay T. Cell signalling pathways underlying induced pluripotent stem cell reprogramming. World J Stem Cells. 2014;6: 620–628. doi:10.4252/wjsc.v6.i5.620
64. Aasen T, Raya A, Barrero MJ, Garreta E, Consiglio A, Gonzalez F, et al. Efficient and rapid generation of induced pluripotent stem cells from human keratinocytes. Nat Biotechnol. 2008;26: 1276–84. doi:10.1038/nbt.1503
65. Chen T, Yuan D, Wei B, Jiang J, Kang J, Ling K, et al. E-cadherin-mediated cell-cell contact is critical for induced pluripotent stem cell generation. Stem Cells. 2010;28: 1315–25. doi:10.1002/stem.456
66. Theunissen TW, Jaenisch R. Molecular control of induced pluripotency. Cell Stem Cell. Elsevier; 2014;14: 720–34. doi:10.1016/j.stem.2014.05.002
67. David L, Samavarchi-Tehrani P, Golipour A, Wrana JL. Looking into the black box: insights into the mechanisms of somatic cell reprogramming. Genes (Basel). 2011;2: 81–106. doi:10.3390/genes2010081
68. Chan EM, Ratanasirintrawoot S, Park I-H, Manos PD, Loh Y-H, Huo H, et al. Live cell imaging distinguishes bona fide human iPS cells from partially reprogrammed cells. Nat Biotechnol. 2009;27: 1033–7. doi:10.1038/nbt.1580
69. Brambrink T, Foreman R, Welstead GG, Lengner CJ, Wernig M, Suh H, et al. Sequential expression of pluripotency markers during direct reprogramming of mouse somatic cells. Cell Stem Cell. 2008;2: 151–159. doi:10.1016/j.stem.2008.01.004
70. Abujarour R, Valamehr B, Robinson M, Rezner B, Vranceanu F, Flynn P. Optimized surface markers for the prospective isolation of high-quality hiPSCs using flow cytometry selection. Sci Rep. 2013;3: 1179. doi:10.1038/srep01179
71. Polo JM, Anderssen E, Walsh RM, Schwarz B a, Nefzger CM, Lim SM, et al. A molecular roadmap of reprogramming somatic cells into iPS cells. Cell. Elsevier Inc.; 2012;151: 1617–32. doi:10.1016/j.cell.2012.11.039
72. Buganim Y, Faddah D a, Cheng AW, Itskovich E, Markoulaki S, Ganz K, et al. Single-Cell Expression Analyses during Cellular Reprogramming Reveal an Early Stochastic and a Late Hierarchic Phase. Cell. Elsevier Inc.; 2012;150: 1209–22. doi:10.1016/j.cell.2012.08.023
127
73. Orkin SH, Hochedlinger K. Chromatin connections to pluripotency and cellular reprogramming. Cell. Elsevier Inc.; 2011;145: 835–850. doi:10.1016/j.cell.2011.05.019
74. Subramanyam D, Blelloch R. Watching reprogramming in real time. Nat Biotechnol. Nature Publishing Group; 2009;27: 997–998. doi:10.1038/nbt1109-997
75. Rais Y, Zviran A, Geula S, Gafni O, Chomsky E, Viukov S, et al. Deterministic direct reprogramming of somatic cells to pluripotency. Nature. Nature Publishing Group, a division of Macmillan Publishers Limited. All Rights Reserved.; 2013;advance on. doi:10.1038/nature12587
76. Brumbaugh J, Hochedlinger K. Removing reprogramming roadblocks: Mbd3 depletion allows deterministic iPSC generation. Cell Stem Cell. Elsevier; 2013;13: 379–81. doi:10.1016/j.stem.2013.09.012
77. Golipour A, David L, Liu Y, Jayakumaran G, Hirsch CL, Trcka D, et al. A Late Transition in Somatic Cell Reprogramming Requires Regulators Distinct from the Pluripotency Network. Cell Stem Cell. Elsevier Inc.; 2012;11: 769–782. doi:10.1016/j.stem.2012.11.008
78. Yamanaka S. Induced pluripotent stem cells: past, present, and future. Cell Stem Cell. Elsevier; 2012;10: 678–84. doi:10.1016/j.stem.2012.05.005
79. Hochedlinger K, Plath K. Epigenetic reprogramming and induced pluripotency. Development. 2009;136: 509–23. doi:10.1242/dev.020867
80. Ghosh Z, Wilson KD, Wu Y, Hu S, Quertermous T, Wu JC. Persistent donor cell gene expression among human induced pluripotent stem cells contributes to differences with human embryonic stem cells. PLoS One. 2010;5: e8975. doi:10.1371/journal.pone.0008975
81. Induced pluripotent stem cells and embryonic stem cells are distinguished by gene expression signatures.
82. Marchetto MCN, Yeo GW, Kainohana O, Marsala M, Gage FH, Muotri AR. Transcriptional signature and memory retention of human-induced pluripotent stem cells. Reh TA, editor. PLoS One. Public Library of Science; 2009;4: e7076. doi:10.1371/journal.pone.0007076
83. Hu B-Y, Weick JP, Yu J, Ma L-X, Zhang X-Q, Thomson JA, et al. Neural differentiation of human induced pluripotent stem cells follows developmental principles but with variable potency. Proc Natl Acad Sci U S A. 2010;107: 4335–40. doi:10.1073/pnas.0910012107
128
84. Narsinh KH, Sun N, Sanchez-freire V, Lee AS, Almeida P, Hu S, et al. Brief report Single cell transcriptional profiling reveals heterogeneity of human induced pluripotent stem cells. 2011;121: 1217–1221. doi:10.1172/JCI44635DS1
85. Mayshar Y, Ben-David U, Lavon N, Biancotti J-C, Yakir B, Clark AT, et al. Identification and classification of chromosomal aberrations in human induced pluripotent stem cells. Cell Stem Cell. 2010;7: 521–531. doi:10.1016/j.stem.2010.07.017
86. Taapken SM, Nisler BS, Newton MA, Sampsell-Barron TL, Leonhard KA, McIntire EM, et al. Karotypic abnormalities in human induced pluripotent stem cells and embryonic stem cells. Nat Biotechnol. Nature Publishing Group, a division of Macmillan Publishers Limited. All Rights Reserved.; 2011;29: 313–314. doi:10.1038/nbt.1835
87. Laurent LC, Ulitsky I, Slavin I, Tran H, Schork A, Morey R, et al. Dynamic changes in the copy number of pluripotency and cell proliferation genes in human ESCs and iPSCs during reprogramming and time in culture. Cell Stem Cell. 2011;8: 106–118. doi:10.1016/j.stem.2010.12.003
88. Kim J, Chu J, Shen X, Wang J, Orkin SH. An extended transcriptional network for pluripotency of embryonic stem cells. Cell. 2008;132: 1049–61. doi:10.1016/j.cell.2008.02.039
89. Gurdon JB. Genetic reprogramming following nuclear transplantation in Amphibia. Semin Cell Dev Biol. 1999;10: 239–43. doi:10.1006/scdb.1998.0284
90. Rideout WM, Eggan K, Jaenisch R. Nuclear cloning and epigenetic reprogramming of the genome. Science. 2001;293: 1093–8. doi:10.1126/science.1063206
91. Soufi A, Donahue G, Zaret KS. Facilitators and Impediments of the Pluripotency Reprogramming Factors’ Initial Engagement with the Genome. Cell. 2012;null. doi:10.1016/j.cell.2012.09.045
92. Gibson JD, Jakuba CM, Boucher N, Holbrook K a, Carter MG, Nelson CE. Single-cell transcript analysis of human embryonic stem cells. Integr Biol (Camb). 2009;1: 540–51. doi:10.1039/b908276j
93. Lowry WE, Richter L, Yachechko R, Pyle a D, Tchieu J, Sridharan R, et al. Generation of human induced pluripotent stem cells from dermal fibroblasts. Proc Natl Acad Sci U S A. 2008;105: 2883–8. doi:10.1073/pnas.0711983105
94. Takahashi K, Tanabe K, Ohnuki M, Narita M, Ichisaka T, Tomoda K, et al. Induction of pluripotent stem cells from adult human fibroblasts by defined factors. Cell. 2007;131: 861–872. doi:10.1016/j.cell.2007.11.019
129
95. Tanabe K, Nakamura M, Narita M, Takahashi K, Yamanaka S. Maturation, not initiation, is the major roadblock during reprogramming toward pluripotency from human fibroblasts. Proc Natl Acad Sci U S A. 2013;110: 12172–9. doi:10.1073/pnas.1310291110
96. Rinn JL, Bondre C, Gladstone HB, Brown PO, Chang HY. Anatomic demarcation by positional variation in fibroblast gene expression programs. PLoS Genet. 2006;2: e119. doi:10.1371/journal.pgen.0020119
97. Boyer L a, Lee TI, Cole MF, Johnstone SE, Levine SS, Zucker JP, et al. Core transcriptional regulatory circuitry in human embryonic stem cells. Cell. 2005;122: 947–56. doi:10.1016/j.cell.2005.08.020
98. Ramalho-Santos M, Yoon S, Matsuzaki Y, Mulligan RC, Melton D a. “Stemness”: transcriptional profiling of embryonic and adult stem cells. Science. 2002;298: 597–600. doi:10.1126/science.1072530
99. Young R a. Control of the embryonic stem cell state. Cell. Elsevier Inc.; 2011;144: 940–54. doi:10.1016/j.cell.2011.01.032
100. Hemberger M, Dean W, Reik W. Epigenetic dynamics of stem cells and cell lineage commitment: digging Waddington’s canal. Nat Rev Mol Cell Biol. Nature Publishing Group; 2009;10: 526–37. doi:10.1038/nrm2727
101. Yamanaka S. Elite and stochastic models for induced pluripotent stem cell generation. Nature. Nature Publishing Group; 2009;460: 49–52. doi:10.1038/nature08180
102. Rahl PB, Lin CY, Seila AC, Flynn R a., McCuine S, Burge CB, et al. c-Myc Regulates Transcriptional Pause Release. Cell. Elsevier Ltd; 2010;141: 432–445. doi:10.1016/j.cell.2010.03.030
103. Singh AM, Dalton S. The cell cycle and Myc intersect with mechanisms that regulate pluripotency and reprogramming. Cell Stem Cell. Elsevier Inc.; 2009;5: 141–9. doi:10.1016/j.stem.2009.07.003
104. Singh AM, Chappell J, Trost R, Lin L, Wang T, Tang J, et al. Cell-cycle control of developmentally regulated transcription factors accounts for heterogeneity in human pluripotent cells. Stem cell reports. Elsevier; 2013;1: 532–44. doi:10.1016/j.stemcr.2013.10.009
105. Neganova I, Zhang X, Atkinson S, Lako M. Expression and functional analysis of G1 to S regulatory components reveals an important role for CDK2 in cell cycle regulation in human embryonic stem cells. Oncogene. Macmillan Publishers Limited; 2009;28: 20–30. doi:10.1038/onc.2008.358
130
106. Flöttmann M, Scharp T, Klipp E. A stochastic model of epigenetic dynamics in somatic cell reprogramming. Front Physiol. 2012;3: 216. doi:10.3389/fphys.2012.00216
107. Nishino K, Toyoda M, Yamazaki-Inoue M, Fukawatase Y, Chikazawa E, Sakaguchi H, et al. DNA methylation dynamics in human induced pluripotent stem cells over time. PLoS Genet. 2011;7: e1002085. doi:10.1371/journal.pgen.1002085
108. Hanna J, Carey BW, Jaenisch R. Reprogramming of somatic cell identity. Cold Spring Harb Symp Quant Biol. 2008;73: 147–55. doi:10.1101/sqb.2008.73.025
109. Onder TT, Kara N, Cherry A, Sinha AU, Zhu N, Bernt KM, et al. Chromatin-modifying enzymes as modulators of reprogramming. Nature. Nature Publishing Group; 2012;483: 598–602. doi:10.1038/nature10953
110. Li Y, Zhang Q, Yin X, Yang W, Du Y, Hou P, et al. Generation of iPSCs from mouse fibroblasts with a single gene, Oct4, and small molecules. Cell Res. Nature Publishing Group; 2011;21: 196–204. doi:10.1038/cr.2010.142
111. Shi Y, Do JT, Desponts C, Hahm HS, Schöler HR, Ding S. A combined chemical and genetic approach for the generation of induced pluripotent stem cells. Cell Stem Cell. 2008;2: 525–8. doi:10.1016/j.stem.2008.05.011
112. Zhao Y, Yin X, Qin H, Zhu F, Liu H, Yang W, et al. Two supporting factors greatly improve the efficiency of human iPSC generation. Cell Stem Cell. Elsevier Inc.; 2008;3: 475–479. doi:10.1016/j.stem.2008.10.002
113. Li W, Ding S. Small molecules that modulate embryonic stem cell fate and somatic cell reprogramming. Trends Pharmacol Sci. 2010;31: 36–45. doi:10.1016/j.tips.2009.10.002
114. Zunder ER, Lujan E, Goltsev Y, Wernig M, Nolan GP. A continuous molecular roadmap to iPSC reprogramming through progression analysis of single-cell mass cytometry. Cell Stem Cell. Elsevier; 2015;16: 323–37. doi:10.1016/j.stem.2015.01.015
115. Pan G, Pei D. Order from Chaos: Single Cell Reprogramming in Two Phases. Cell Stem Cell. 2012;11: 445–447. doi:10.1016/j.stem.2012.09.004
116. Carey BW, Markoulaki S, Hanna JH, Faddah DA, Buganim Y, Kim J, et al. Reprogramming factor stoichiometry influences the epigenetic state and biological properties of induced pluripotent stem cells. Cell Stem Cell. 2011;9: 588–98. doi:10.1016/j.stem.2011.11.003
131
117. Radzisheuskaya A, Chia GL Bin, dos Santos RL, Theunissen TW, Castro LFC, Nichols J, et al. A defined Oct4 level governs cell state transitions of pluripotency entry and differentiation into all embryonic lineages. Nat Cell Biol. Nature Publishing Group; 2013;15: 579–90. doi:10.1038/ncb2742
118. Chung K-M, Kolling FW, Gajdosik MD, Burger S, Russell AC, Nelson CE. Single cell analysis reveals the stochastic phase of reprogramming to pluripotency is an ordered probabilistic process. PLoS One. Public Library of Science; 2014;9: e95304. doi:10.1371/journal.pone.0095304
119. Papapetrou EP, Tomishima MJ, Chambers SM, Mica Y, Reed E, Menon J, et al. Stoichiometric and temporal requirements of Oct4, Sox2, Klf4, and c-Myc expression for efficient human iPSC induction and differentiation. Proc Natl Acad Sci U S A. 2009;106: 12759–64. doi:10.1073/pnas.0904825106
120. Sommer CA, Sommer AG, Longmire TA, Christodoulou C, Thomas DD, Gostissa M, et al. Excision of reprogramming transgenes improves the differentiation potential of iPS cells generated with a single excisable vector. Stem Cells. 2010;28: 64–74. doi:10.1002/stem.255
121. Carey BW, Markoulaki S, Hanna J, Saha K, Gao Q, Mitalipova M, et al. Reprogramming of murine and human somatic cells using a single polycistronic vector. Proc Natl Acad Sci U S A. 2009;106: 157–162. doi:10.1073/pnas.0811426106
122. Hanna JH, Saha K, Jaenisch R. Pluripotency and cellular reprogramming: facts, hypotheses, unresolved issues. Cell. Elsevier Inc.; 2010;143: 508–25. doi:10.1016/j.cell.2010.10.008
123. Doege CA, Inoue K, Yamashita T, Rhee DB, Travis S, Fujita R, et al. Early-stage epigenetic modification during somatic cell reprogramming by Parp1 and Tet2. Nature. Nature Publishing Group, a division of Macmillan Publishers Limited. All Rights Reserved.; 2012;488: 652–5. doi:10.1038/nature11333
124. Bird A. DNA methylation patterns and epigenetic memory. Genes Dev. 2002;16: 6–21. doi:10.1101/gad.947102
125. Azuara V, Perry P, Sauer S, Spivakov M, Jørgensen HF, John RM, et al. Chromatin signatures of pluripotent cell lines. Nat Cell Biol. 2006;8: 532–538. doi:10.1038/ncb1403
126. Dowell KG, Simons AK, Wang ZZ, Yun K, Hibbs MA. Cell-type-specific predictive network yields novel insights into mouse embryonic stem cell self-renewal and cell fate. Emmert-Streib F, editor. PLoS One. Public Library of Science; 2013;8: e56810. doi:10.1371/journal.pone.0056810

132
127. Yang KE, Kwon J, Rhim J-H, Choi JS, Kim S Il, Lee S-H, et al. Differential expression of extracellular matrix proteins in senescent and young human fibroblasts: a comparative proteomics and microarray study. Mol Cells. 2011;32: 99–106. doi:10.1007/s10059-011-0064-0
128. SAS Institute, Cary N. JMP, Version 10.