disproportionate collapse analysis of mid- rise cross
TRANSCRIPT
Disproportionate collapse analysis of mid-rise cross-laminated timber buildings
Mpidi Bita, H, Currie, NGR and Tannert, T
http://dx.doi.org/10.1080/15732479.2018.1456553
Title Disproportionate collapse analysis of mid-rise cross-laminated timber buildings
Authors Mpidi Bita, H, Currie, NGR and Tannert, T
Publication title Structure and Infrastructure Engineering
Publisher Taylor & Francis
Type Article
USIR URL This version is available at: http://usir.salford.ac.uk/id/eprint/46518/
Published Date 2018
USIR is a digital collection of the research output of the University of Salford. Where copyright permits, full text material held in the repository is made freely available online and can be read, downloaded and copied for non-commercial private study or research purposes. Please check the manuscript for any further copyright restrictions.
For more information, including our policy and submission procedure, pleasecontact the Repository Team at: [email protected].

Page 1
Disproportionate collapse analysis of mid-rise cross-laminated
timber buildings
Hercend Mpidi Bita*, Wood Science, The University of British Columbia, Vancouver,
Canada, [email protected] (*Corresponding author)
Neil Currie, Computing, Science and Engineering, The University of Salford, Manchester,
United Kingdom, [email protected]
Thomas Tannert, Integrated Wood Engineering, University of Northern British Columbia,
Prince George BC, Canada, [email protected]
Abstract
This paper investigates the structural behaviour of a twelve-storey Cross-Laminated Timber
(CLT) building subjected to sudden removal of internal and external ground floor loadbearing
walls, and computes the probability of disproportionate collapse. Analyses are carried out at
three different structural idealisations, accounting for feasibility and complexity of finite
elements models to understand their performance at: i) the global, ii) the component, and iii) the
connection level. Focus is devoted on force and deformation-demands obtained from nonlinear
dynamic analyses of the building. The demands are compared against the supply from common
CLT panel sizes and the rotational stiffness (k) of the joints, detailed with off-the-shelf angle
brackets and self-tapping screws. The study demonstrates that the applied forces and
deformations required to develop resistance mechanisms are too large to be supplied by the
proposed element and connection designs, if an internal ground floor wall is removed. The
considered building has a probability of failure as high as 32% if designed without
considerations of the complexities associated with disproportionate collapse. Consequently, to
resist the effects of internal wall removal, the floors need to be redesigned and improved
structural detailing with sufficient strength, stiffness, and ductility is necessary to trigger collapse
resistance mechanisms.
Keywords: Progressive collapse, robustness, structural integrity, redundancy, reliability analysis,
mid-rise timber buildings, cross-laminated timber, engineered timber products.
Page 2
1 INTRODUCTION
1.1 Disproportionate Collapse
Investigations on timber buildings show that human errors, during design and
construction stages, are the main reasons for numerous failures observed in central Europe
(Fruhwald et al., 2007) and (Harte & Fragiacomo, 2010). Ignorance or carelessness is reported to
be the source for inadequate structural performance. For example, after construction, many
connections are found to behave differently than predicted by the design assumptions; and about
11% of failures are caused by unexpected tensile forces perpendicular to the grain direction
(Fruhwald et al., 2007). In addition to human errors, fire and severe earthquakes can also cause
significant damage to buildings (Tavakoli et al., 2012). The initial damage from these extreme or
abnormal loadings has a risk of propagation which can lead to the collapse of a significant part of
the structure (Krauthammer et al., 2002).
When the final collapse goes beyond the acceptable criteria set within building codes, it
is characterised as a disproportionate collapse: i.e., the level of structural failure is
disproportionate in relation to the element being damaged/removed. The European standard
EN1991-1-7 (CEN, 2006), specifies this threshold as a scenario when the final collapse damages
less than 15% of the floor area of the affected storey or 100m2, whichever is less, and does
extend not further than the immediate adjacent storeys. The incident of the Ronan Point
apartment in 1968, is a typical example: a gas explosion caused the loss of a loadbearing wall, at
the 18th floor, which in turn triggered the collapse of the entire corner of the building (Macleod,
2014).
Disproportionate collapse events have a low rate of occurrence, but they do imply serious
risk for human lives (ASCE, 2010). Previous incidents, such as the World Trade Centre,
explained by Shwartz (2001), have shown that fatalities are mainly caused by collapsing building
or structural elements rather than the extreme event itself. Consequently, Moore (2002) and the
United States Department of Defence (DoD, 2013) recommend that high-occupancy structures,
from a public safety point of view, shall be designed as a minimum to maintain stability for a
sufficient time to allow for evacuation. Their design shall account for rigorous protections,

Page 3
beyond what is normally provided for normal importance structures, to avoid disproportionate
collapse under all possible scenarios (CEN, 2006) and (ASCE, 2010).
The probability of disproportionate collapse, P(F), can be evaluated using Equation (1)
from Wang et al. (2011):
P(F) = P[F|DHi] × P[D|Hi] × P[Hi] (1)
where P[Hi] is the probability of occurrence of a given abnormal loads (Hi), P[D|Hi] is the
probability of local damage (D) given (Hi) occurs; and P[F|DHi] is the probability of collapse
given that both hazard (Hi) and local damage (D) occur. P(F) of a structural element designed for
gravity loads is estimated to 10-5 per year (Wang et al., 2011); this can also be taken as starting
target for high-occupancy multi-storey building subjected to different loading conditions.
The load-demand placed on multi-storey buildings and its associated risk factor are
uncertain over the entire life span of the structure (Gudmundsson & Izzuddin, 2010). There is not
enough historical data to accurately define P[Hi] as well as the magnitude of the postulated load
(Lew, 2003). Furthermore, it is not practical to account for all abnormal actions as their sources
are not always anticipated, and the probability that the designed building will actually be
exposed to the measured load magnitude is low (Lew, 2003) and (Hamburger & Whittaker,
2004). Since reducing P[Hi] is not a practical approach, in many cases P[D|Hi] is likely to be
close to 1.0. The only reasonable strategy is to reduce P[F|DHi] by accounting for structural
robustness (Vlassis et al., 2008). A robust building reduces P(F) by developing new equilibrium
states, which reduces P[F|DHi] in the event that P[D|Hi] certainly occurred.
It is not feasible to represent all ‘abnormal’ loads that might impact the building, also
labelled ‘malicious actions’ according to EN1991-1-7 (CEN, 2006). There is a broad range of
sources, type, and magnitude of forces from vehicle impact to terrorist attacks. Compared to
earthquake design, there is a lack of disproportionate collapse information on parameters such as
sources, type and magnitude of the extreme loading, as well as the size of the initial damages
associated with subsequent collapse. With the insufficient information, limitations, and
complexity to model both the abnormal loads and the considered scenarios, it was more realistic
for this paper to implement an event-independent approach, as recommended by Krauthammer et
al. (2002) and Lew (2003). Herein, no interest is given to the extreme loading itself or its
Page 4
probability of occurrence, and loadbearing elements are simply deleted from the structural
topology.
Although this is an imaginary scenario, the notional key element removal is important in
order to obtain a damage-to-performance correlation. In other words, measuring the structural
performance of the building, in terms of forces and deformations as well as resistance
mechanisms, following the loss of a loadbearing element as initial damage. After removal,
subsequent collapse can be measured and compared against disproportionate collapse thresholds
such as those defined by the EN1991-1-7 (CEN, 2006). This process will be particularly relevant
for structures where specific risk assessments need to be compiled to demonstrate compliance
with local building regulations through comparison of more commonplace structures. This
method focuses on decreasing P[F|DHi] by giving no importance on the extreme event (Hi), and
assuming that P[D|Hi] is definitely 1.0. This is recommended by the EN1991-1-7 (CEN, 2006),
Unified Facilities Criteria UFC 4-023-03 (DoD, 2013) and General Service Administration GSA
(GSA, 2013) as the preferred way to understand the ability of the structure to resist
disproportionate collapse after an extreme event.
1.2 Design Guidance for Timber Buildings
Structural integrity, a key factor in designing for robustness, is an indirect approach
suggested in different design standards such as NBCC (Canadian Commission of Buildings and
Fire Codes (NBCC, 2010), ASCE-7 (ASCE, 2010), EN1991-1-7 (CEN, 2006), and engineering
guidance such as (UFC) 4-023-03 (DoD, 2013), and (GSA, 2013), to avoid disproportionate
collapse. Structural integrity offers sufficient continuity, stiffness, and ductility to bridge over the
damage by redistributing the loads to the undamaged area of the building. EN1991-1-7 (CEN,
2006) and UFC 4-023-03 (DoD, 2013) prescribe the minimum tie forces necessary for continuity
in most wall systems structures. Starossek and Haberland (2010) explained that the stiffness and
ductility allow for strength and large deformation without failure, at any structural level.
Effective continuity, stiffness and ductility make a redundant structure which can utilise
resistance mechanisms, as an alternate load-path, to avoid widespread collapse.
In the UK, the Timber Frame project (TF2000), conducted by the Structural Timber
Association (Milner et al., 2003), subjected a six-storey experimental light-frame wood building
to a rigorous test programme to assess its structural performance. Disproportionate collapse was

Page 5
investigated, leading to recommendations on the minimum force demands at connection level to
tie different horizontal and vertical loadbearing elements together, and enable light-frame wood
structures, of up to six storeys, to behave as one entity. The TF2000 projects also resulted to the
provisions of different structural detailing that would help meeting the forces and deformations
requirements for structural integrity.
For mid-rise timber buildings, effective and efficient methods to ensure continuity,
stiffness and ductility are yet to be implemented, tested and approved. Furthermore, the use of
TF2000 is limited to six-storey buildings and it is uncertain whether this guideline can be applied
to other structural systems of different heights and proportions (Arup, 2011). Large panel
structures, where CLT constructions can be included, are inherently discontinuous (Schultz et al.,
1977a and 1977b). For CLT platform or balloon construction, as resistance mechanisms, wall
panels can develop cantilever, beam actions and vertical suspension whereas floor planks can
trigger membrane, catenary and diaphragm actions. Adapting the TF2000 provisions can lead to
unrealistic or expensive solutions for mid- to high-rise buildings. Furthermore, the recommended
approaches explained by Stevens (2012) to supply the prescribed minimum tie forces, such as
using the floor system as it is done for concrete slabs, might not be practical and cost efficient.
While cross-laminated timber (CLT) is seen to be a viable option for tall buildings (Green
& Karsh, 2012; Zhang et al., 2015; Zhang et al., 2017; Shahnewaz et al., 2017), there is a lack of
guidance on how to effectively design mid- and high-rise wood buildings, and specifically on the
design against disproportionate collapse. Thorough investigations which consider advanced
approaches such as the alternative load-path method using nonlinear dynamic analysis, as
recommended by UFC 4-023-03 (DoD, 2013), for realistic performances and economic designs,
are not available. Consequently, disproportionate collapse prevention is left to engineering
judgements and best practices. Linear static analysis, where key elements are delicately removed,
is currently used to quantify subsequent failure following initial damage. This method, however,
overestimate the connections forces, and hence leads to uneconomic designs.
Considering the lack of research investigating the performance of mid-rise CLT buildings
for disproportionate collapse preventions, there is a need to implement practical guidance for
adequate design methods and appropriate mitigation strategies to satisfy structural integrity.
TRADA (2009) published a report to illustrate the design of mid-rise CLT buildings under
Page 6
gravity and lateral loads using a twelve-storey case study. Mpidi Bita et al. (2016 and 2017)
evaluated the building’s structural performance following the removal of the internal ground
floor loadbearing wall and showed that the building was prone to disproportionate collapse. The
authors recommended a thorough and detailed investigation considering the impacts of
parameters such as removal of different loadbearing elements, the CLT panel layups, and the
connection properties.
1.3 Objective
This paper investigates the structural performance of a 12-storey CLT building after the
loss of a ground floor loadbearing wall, as initial damage following an extreme loading event.
CLT buildings can only be as strong as the connection between individual loadbearing panels
(Schultz et al., 1977b) and (Patel, 2014); and 23% of structural failures in timber buildings are
caused by inadequately designed or improperly fabricated joints (Fruhwald, 2007). Therefore,
this paper emphasises the structural robustness by mean of the rotational capabilities (ϴ),
associated with the rotational stiffness (k) of the connections, necessary to develop resistance
mechanisms. In addition to connection properties, the thickness and material properties of the
CLT panels are also considered. As a further objective, a reliability analysis was conducted to
study the residual capacity of the damaged structure, and to compute the probability of
disproportionate collapse.
2 CASE STUDY
2.1 Building Description
The considered case study was the twelve-storey residential CLT building as proposed by
Timber Research and Development Association (TRADA, 2009). The building is a box-shaped
construction, 9m × 9m floor plan with a 3m clear height, where all internal and external walls are
loadbearing, see Figure 1a. As shown in Figure 1b, the walls are 9m long uninterrupted; the floor
has a continuous span over the internal loadbearing wall, which was placed halfway between the
two external walls.

Page 7
Figure 1: TRADA building: a) schematic and b) floor plan
The TRADA design considered dead, live and wind loads to select CLT panels and
connections for structural stability. The dead loads were estimated according to EN1991 (CEN,
2009) as 1.37kPa, 1.26kPa and 1.28kPa for floor, internal and external walls, respectively; the
live load was 1.5kPa. The lateral load resisting system was designed to resist the applied wind
forces (assumed to be 1.0kPa on the two orthogonal directions). Stability against overturning at
the lower storey as well as the whole building was satisfied, and no additional hold-downs were
required. In the UK, earthquake loads are not considered for office or residential buildings.
Resistance against sliding was provided by brackets at the interface with the adjacent storey or
foundations. Furthermore, connections provided at the interface between perpendicular walls
were also checked for lateral shear resistance; this was provided over the entire building height.
The calculations demonstrated that 126mm (floor and external walls) and 135mm thick
(internal walls) 3-ply CLT panels can meet the EN1990 (CEN, 2010) and EN1991 (CEN, 2009)
requirements. The CLT floor panels were shown to possess adequate strength and stiffness to act
as horizontal diaphragm considering that: i) the span-to-depth ratio did not exceed 2:1; ii) the
span between supporting walls was less than 12m; and iii) the connections were designed to
resist the applied horizontal shear forces. Table 1 presents the ratios between demands and
capacities of the structural elements.
Table 1: Summary of design checks (TRADA, 2009)
Structural Component Design Check Utilisation (%)
126 mm CLT floor panel Flexure
Shear
44
23

Page 8
Deflection
Vibration
88
56
135 mm internal CLT shear wall
Combined axial and bending
In-plane shear stress
Bearing stress
50
21
138
126mm external CLT shear wall
Combined axial and bending In-
plane shear stress
Bearing stress
85
12
73
Details of the full design can be found in the TRADA report (TRADA, 2009). The
calculations also include the imposed limits on deflections and vibrations, according to EN1995-
1-1 (CEN, 2008) from which the utilisation percentages shown in Table 1 have been estimated.
The deflection limit was taken as leff /250, where leff is 4/5 times the span according to EN1995-
1-1 Annex B. The vibration checks followed EN1995-1-1:2004 to account for transverse rigidity.
Herein, the natural frequency of the floor, the maximum allowable static deflection, and the unit
impulse velocity response of the floor, needed to be below their acceptable limits.
2.2 Scope and Connection Detailing
TRADA (2009) recommended that further checks are still needed: i) bearing stress on
CLT floor panels; ii) disproportionate collapse as per EN1991-1-7 (CEN, 2006) classifications
with respect to storey height and occupancy level; iii) fire resistance; and iv) design provisions
for openings in shear-walls. The TRADA (2009) report demonstrated the structural feasibility of
the 12-storey building under the assumed gravity and lateral loads. Therefore, the same
assumptions for Serviceability (SLS) and Ultimate (ULS) Limit State design were considered.
The investigation presented herein only considers disproportionate collapse analysis of the
presented building as recommended by the UFC 4-023-03 (DoD, 2013). Dynamic analyses using
sudden key element removal was performed, associated to large deformation to capture possible
resistance mechanisms for disproportionate collapse prevention. The investigation presented
herein is limited to mid-rise CLT buildings with platform constructions which are, usually, office
or commercial buildings of normal or high importance according to the National Building Code
of Canada (NBCC, 2010) or Class 2A/2B per EN1991-1-7 (CEN, 2006).
This study is based on the same layout and design as the TRADA (2009) example.
TRADA (2009) did not specify the CLT layup since different manufacturers can provide almost
Page 9
any desired layup. Herein, all panels are 3-ply CLT with equal thickness 42mm and 45mm, for
126mm and 135mm panels, respectively. The building was checked for conformity with the
Ultimate and Serviceability Limit State requirements of NBCC (2010) and the Canadian timber
material standard CSA-O86 (CSA, 2016). It was confirmed that the capacity of the selected floor
panels was adequate for the gravity loads. TRADA (2009) considered a wind pressure of 1.0kPa,
therefore no further checks for code compliance were required as the wind loads according to
NBCC are smaller. Since this paper considers the ability to develop resistance mechanisms
against disproportionate collapse following the loss of ground floor loadbearing walls, no
considerations were given in the wall-to-foundation detailing. This joint was restrained against
translations in all three orthogonal directions.
To investigate the robustness of the building and its ability to develop resistance
mechanisms against disproportionate collapse, the losses of the entire ground floor internal and
external walls were considered as two different scenarios, following the GSA (2013) and UFC 4-
023-03 (DoD, 2013) guidelines. The first set-up emphasised on the membrane and catenary
actions of the floor while the second triggered the cantilever mechanism, as explained by
(Schultz et al., 1977-a). It was assumed that strength, stiffness and ductility of the connections
alone controlled the overall stability of the building. The TRADA report (2009) did not detail the
connections between the loadbearing components. A static analysis of the building was
performed at the global level to obtain the forces at the connection level, which were then used to
specify the details.
The main structural detailing, the floor-to-wall connection, shown in Figure 2, was
composed of: i) self-tapping screws (STS), 300mm long ASSY™ of 8mm diameter, to connect
the floor to the wall below; and ii) off-the-shelf angle brackets and regular wood screws to fasten
the floor to the wall above. STS are the connectors of choice for most mass-timber applications
(Hossain et al., 2016); the specific products have a European Technical Approval ETA-11/0190
(ETA, 2011). The angle brackets were 90mm wide, 2.5mm thick without rib, and were placed at
500mm centre to centre to connect the floor to the wall above. To connect the floor panel to the
wall below, STS were inserted, at 90 degrees, with a spacing of 500mm.

Page 10
Figure 2: Wall-to-floor joint
2.3 Numerical Model Development
To investigate the building’s behaviour at the structural (global), component (macro) and
connection (micro) levels, as shown in Figure 3, finite element analyses (FEA) were performed.
The commercial software package ANSYS (2015) was used because of its capability to capture
the geometric nonlinear behaviour at every sub-step of the dynamic analysis at global level, as
explained in Section 2.4, and to model the floor-to-wall connection with screws and angle
brackets in sufficient details in 3D. A three-level structural idealisation was implemented at
global, macro and micro levels.
Figure 3: Multi-level idealisation: a) global model, b) macro model, and c) micro model
Page 11
2.3.1 Global model
The building behaviour after the element removal was obtained from geometric nonlinear
dynamic analysis using the 3D global model, see Figure 3a. For the removal of the ground floor
wall, the static case was compared to the dynamic case, which accounted for the speed of
removal. The influence of the dynamic motion and nonlinear behaviour as compared to the linear
static case stated in UFC 4-023-03 (DoD, 2013) guideline as the dynamic increase factor (DIF),
is estimated to be 2.0 for wood loadbearing walls. The static approach is identical to the TF2000
methodology, whereas the sudden removal triggers a dynamic response. The results from this
level were considered as upper bound, in terms of force and deformation-demands on the
structural components and their connections. At the global level, the focus was on the resulting
forces and deformations, and the ability of the building to trigger resistance mechanisms against
disproportionate collapse. As a consequence, the joints were assumed to be fully fixed to allow
for full force redistribution between different components.
The CLT walls and floors were idealised by 2D surface shell elements, made of different
layers to represent the actual CLT layup, with linear orthotropic material properties. Table 2 lists
the values of the moduli of elasticity (E), shear moduli (G), and poison ratio (U) for the
longitudinal (L) and transverse (T) directions of timber, obtained from CSA-O86 (CSA, 2016).
The CLT models were first verified with hand calculations for bending and shear capacities,
using the shear analogy method as discussed by Gagnon and Pirvu (2009), then validated against
the experimental results of 5-ply CLT panels under four-point bending test, done by Popovski et
al. (2016). The floors were 9m long, continuous over the internal support with no in-plane
connections. The top layer was longitudinal to the span direction, with the remaining layers
oriented crosswise. The different layers were fully bonded and continuous along the width of the
panel. Due to manufacturing limitations with respect to width of the CLT panels, floor-to-floor
connections were needed in the transverse direction of the building plan. Since 3m is a standard
width of CLT panels, three panels were needed at every floor level of the considered building in
the transverse direction. The walls were 3m high continuous over their spans.
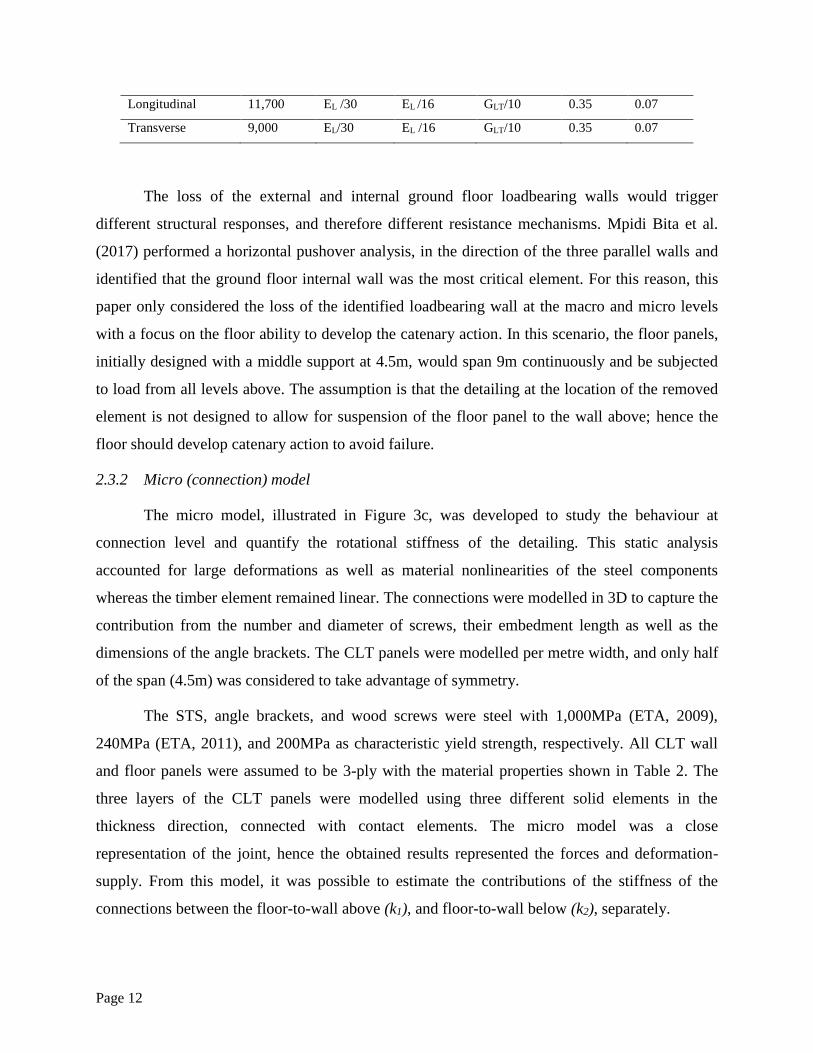
Table 2: Material properties for timber elements
Layer Direction EL [MPa] ET [MPa] GL [MPa] GT [MPa] UL [~] UT [~]
Page 12
Longitudinal 11,700 EL /30 EL /16 GLT/10 0.35 0.07
Transverse 9,000 EL/30 EL /16 GLT/10 0.35 0.07
The loss of the external and internal ground floor loadbearing walls would trigger
different structural responses, and therefore different resistance mechanisms. Mpidi Bita et al.
(2017) performed a horizontal pushover analysis, in the direction of the three parallel walls and
identified that the ground floor internal wall was the most critical element. For this reason, this
paper only considered the loss of the identified loadbearing wall at the macro and micro levels
with a focus on the floor ability to develop the catenary action. In this scenario, the floor panels,
initially designed with a middle support at 4.5m, would span 9m continuously and be subjected
to load from all levels above. The assumption is that the detailing at the location of the removed
element is not designed to allow for suspension of the floor panel to the wall above; hence the
floor should develop catenary action to avoid failure.
2.3.2 Micro (connection) model
The micro model, illustrated in Figure 3c, was developed to study the behaviour at
connection level and quantify the rotational stiffness of the detailing. This static analysis
accounted for large deformations as well as material nonlinearities of the steel components
whereas the timber element remained linear. The connections were modelled in 3D to capture the
contribution from the number and diameter of screws, their embedment length as well as the
dimensions of the angle brackets. The CLT panels were modelled per metre width, and only half
of the span (4.5m) was considered to take advantage of symmetry.
The STS, angle brackets, and wood screws were steel with 1,000MPa (ETA, 2009),
240MPa (ETA, 2011), and 200MPa as characteristic yield strength, respectively. All CLT wall
and floor panels were assumed to be 3-ply with the material properties shown in Table 2. The
three layers of the CLT panels were modelled using three different solid elements in the
thickness direction, connected with contact elements. The micro model was a close
representation of the joint, hence the obtained results represented the forces and deformation-
supply. From this model, it was possible to estimate the contributions of the stiffness of the
connections between the floor-to-wall above (k1), and floor-to-wall below (k2), separately.

Page 13
The 3D model was highly nonlinear and complex; therefore, 2D models were constructed
and calibrated, using the calculated k-values to mimic the same behaviour. The connection
between the floor and the wall above as well as the connection between the floor and the wall
below were represented by k1 and k2, respectively. Here, the joints were idealised by rotational
springs with linear material properties, 200,000MPa and 0.3 for elastic modulus and poison ratio,
respectively.
2.3.3 Macro (component) model
The calibrated 2D micro model was then extended to the macro model, by symmetry. The
macro model, as shown in Figure 3b, was built in 2D using the same assumption as in the global
model, with 3m wide CLT panels. The connections were idealised by uniaxial springs calibrated
to the k-values as obtained from the 3D micro model and verified by hand calculations using
Equation (2). The location of nodes was numbered from 1 to 12; nodes 2, 3 and 4 (similarly 7, 8
and 9) were coincident nodes and were constrained in the two orthogonal directions to ensure
identical deformations. The permanent loads from the floor above were applied as favourable
loads at node 5 and 10, as it provides additional resistance against lateral movements of the floor
panel. The model also accounted for the self-weight of the CLT panels as well as 50% of the
imposed loads on floor, according to the NBCC (2010) extreme load combination, see Equation
(3). For this level of structural idealisation, to capture the in-plane floor behaviour necessary for
catenary actions, static analyses associated to large deformation and linear material properties for
both structural components and their connections were done. The forces obtained from nonlinear
dynamic analysis of the global model were applied on this model, at the same location as the
removed element, to investigate whether the supplied rotational stiffness would be sufficient to
carry the force and deformation demands. The final failure was considered disproportionate
when any of the constraints described in Section 2.5 was violated.
The required rotational stiffness was expressed in terms of the axial stiffness (Kser) under
service loads, recommended from EN1995 (CEN, 2008), and calculated using the Equation (2)
multiplied by the polar second moment of area (IP). Here (ρm) is the mean density of timber, (d)
is the screw diameter and (s) and (n) are the number of shear plane and screws, respectively. IP
accounts for the distance from the centre of the group of screws to the considered fastener in the
two orthogonal directions. Kser would allow to estimate the required number of screws. The

Page 14
results from Equation (2) helped determining the required stiffness (k) that can be achieved in a
real construction; and therefore, set the limit values for what is deemed practical:
𝐾𝑠𝑒𝑟 = ∑ ∑ 𝜌𝑚1.5 × (
𝑑
23)𝑛
𝑗−1𝑠𝑖−1 (2)
2.4 Nonlinear Dynamic Analysis
Nonlinear Dynamic Analysis were conducted to investigate the dynamic response of the
building after element removal, following the UFC 4-023-03 (DoD, 2013) and GSA (GSA,
2013) recommendations. This analysis was only performed at the global level to define the upper
bounds for disproportionate collapse prevention as described in Section 2.3.1. The probability of
having the maximum live, snow and wind loads acting on a structure at the same time as an
extreme event is negligible, assuming that all events are statically independent (Wang et al.,
2011). It is for this reason that the total loads (W) on the floors, used to estimate the residual
capacity of the structure after initial damage, were calculated from the EN1990 accidental load
combination (CEN, 2010). The resulting Equation (3) is identical to ASCE-7 (ASCE, 2010) and
NBCC (NBCC, 2010) prescriptions:
𝑊 = ∑ { 𝐺𝑘,𝑗 + 𝜓1,1 𝑄𝑘,1}𝑗≥1 (3)
where Gk,j and Qk,I are the dead and live loads, respectively; the factor of combinations (ψ) are
1.0 and 0.5 for Gk,j and Qk,I, respectively.
Wind load was ignored as the NBCC (2010) extreme load combination does not account
for it assuming that the likelihood of having a malicious load at the same time as winds is
negligible. Modal analyses were required to estimate the fundamental periods of the damaged
structure without the internal or external ground floor wall. The critical Rayleigh damping ratio
was assumed to be 5%, typical for timber structures (Gagnon & Pirvu, 2009). The results, which
captured the mode shapes with vertical motions around the removed element, were used to
calculate the mass coefficient (Alpha) and stiffness coefficient (Beta) of the Rayleigh damping
used for the dynamic simulations. Thereafter, a static analysis of the global model was performed
to obtain the forces at the top of the removed elements; this is considered as load-step zero from
Figure 4 .

Page 15
Figure 4: Load-step for the dynamic analysis
Using the same global model but without the internal ground floor loadbearing wall,
these forces were applied in the opposite direction, as the first load-step of the dynamic analysis
to simulate the static condition. The maximum deflections and forces on the components and
their connections were checked to ensure that they were identical to the ones obtained from the
undamaged building with the internal wall. Then these forces were deleted to mimic the speed of
removal of the key elements, as the second load-step. For the third load-step, the building was
damp the energy released from the previous step until static equilibrium was restored.
A range of removal speeds can be used, keeping in mind that quicker removal leads to
higher dynamic effects. According to GSA (2013), the dynamic behaviour can cause up to twice
the deformations obtained from a static analysis; the DIF as per UFC 4-023-03 (DoD, 2013).
Different speed of removal can idealise extreme events that the structure might be exposed to.
GSA (2013) recommends a removal time of less than 1/10 of the period associated with the
mode shape that exhibits vertical movements around the removed structural element. For initial
analysis, the speed of removal (t) was assumed to be 0.001sec to meet the GSA (2013)
specifications.
2.5 Sensitivity Analysis
After understanding the structural behaviour after the defined element loss scenario, a sensitivity
analysis was performed at the macro level to evaluate the impact of connection stiffness, floor
and wall panel thicknesses, as well as material properties of the selected CLT panels. The
relevant input parameters that influence the structural response were defined as: 1) the stiffness
of the connection between the floor and the wall above (k1); 2) the stiffness of the connection
Page 16
between the floor and the wall below (k2); 3) the stress grade of the CLT panels (SG) according
to CSA-O86 (herein for simplicity, wall and floor panels are of the same SG); 4) the number of
layers of the CLT floor panels (nF), herein an uneven number of layers with alternating
orientation; 5) the thickness of the longitudinal layers of the CLT floor panel (tL,F); 6) the
thickness of the transverse layers of the CLT floor panel (tT,F); 7) the number of layers of the
CLT wall panels (nW); 8) the thickness of the longitudinal layers of the CLT wall panel (tL,W);
and 9) the thickness of the transverse layers of the CLT wall panel (tT,W). A boundary condition
was that for all CLT panels, the longitudinal layer thickness was always bigger than the
transverse layer thickness. These parameters and their ranges are summarised in Table 3.
The response of the structure at the macro level was measured in terms of: 1) the bending
moment in the floor panel at the location of the removed element (MZ); 2) the maximum
deflection of the floor panel (ΔY); 3) the maximum applied shear forces on the CLT panel (SY); 4)
maximum the axial forces at the connection level (FX); 5) the vertical loads on top of the wall
below the affected floor (BY).
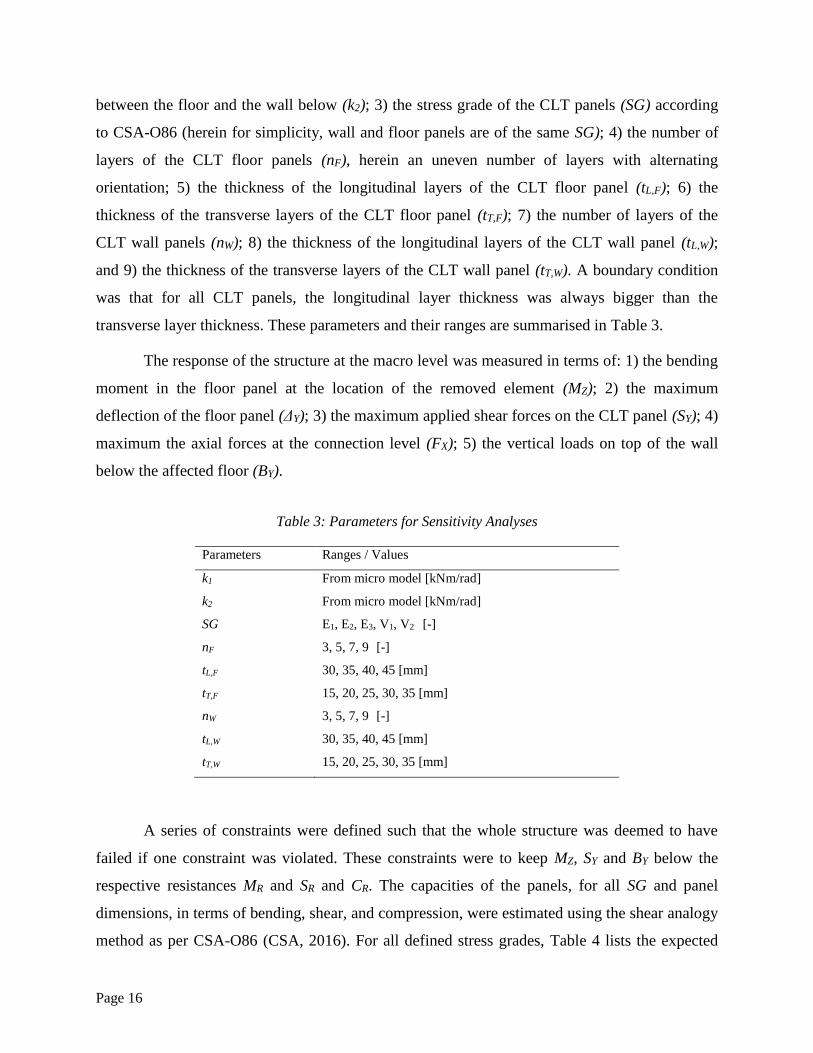
Table 3: Parameters for Sensitivity Analyses
Parameters Ranges / Values
k1
k2
SG
nF
tL,F
tT,F
nW
tL,W
tT,W
From micro model [kNm/rad]
From micro model [kNm/rad]
E1, E2, E3, V1, V2 [-]
3, 5, 7, 9 [-]
30, 35, 40, 45 [mm]
15, 20, 25, 30, 35 [mm]
3, 5, 7, 9 [-]
30, 35, 40, 45 [mm]
15, 20, 25, 30, 35 [mm]
A series of constraints were defined such that the whole structure was deemed to have
failed if one constraint was violated. These constraints were to keep MZ, SY and BY below the
respective resistances MR and SR and CR. The capacities of the panels, for all SG and panel
dimensions, in terms of bending, shear, and compression, were estimated using the shear analogy
method as per CSA-O86 (CSA, 2016). For all defined stress grades, Table 4 lists the expected

Page 17
mean values for bending, shear and compressive strength, estimated from the 5th percentile of the
nominal values given in CSA-O86 (CSA, 2016), as well as the corresponding Young’s modulus.
In addition, ΔY should be kept below the maximum deformation (Δmax) allowed for
catenary action. Stevens (2012) recommended limit deflection to 10% of the span for catenary
action. Herein, 0.5m is used as threshold for disproportionate collapse, which is around 5% of
the span, considering the span after internal wall removal, and the feasibility of obtaining such
deformation in timber structures. Also, since the catenary action depends on the tie forces
(Stevens, 2012), the objective of this paper was to keep FX small, as the connections are
primarily designed for shear, hence have a low axial resistance. In the sensitivity study, 3,000
analyses were run to account for different permutations of the input parameters. Advanced Latin
Hypercube Sampling (ALHS) (Most & Will, 2011) was applied to determine the importance
factor (IF) for all input parameters for the subsequent structural optimisation at the macro level.
Table 4: Material properties with respect to stress grade (CSA, 2015)
Stress grade
Longitudinal Transverse
Young’s modulus
[MPa]
Bending
strength [Mpa]
Shear strength
[Mpa]
Compresive
strength [Mpa]
Young’s
modulus
[MPa]
E1
E2
E3
V1
V2
11,700
10,300
8,300
11,000
9,500
33.60
28.45
20.71
11.90
14.05
0.60
0.75
0.51
0.75
0.60
23.00
21.60
18.00
16.70
13.70
9,000
10,000
6,500
10,000
9,000
2.6 Parameter Optimisation
To optimise the structure using the estimated IF, 13,900 analyses of the building at
component level were run. For this analysis, input parameters, see Table 3, with significant
impacts (IF>0.1) on the structural response are automatically filtered, with more permutations for
parameters with the highest IF. The objective was to find the optimum values that would enable
to carry the applied loads from the analysis at global level by developing catenary action as a
resistance mechanism, and to meet all the constraints. The selection of the input parameters for
the best design targeted the smallest commercially available thickness of CLT panel to have a
Page 18
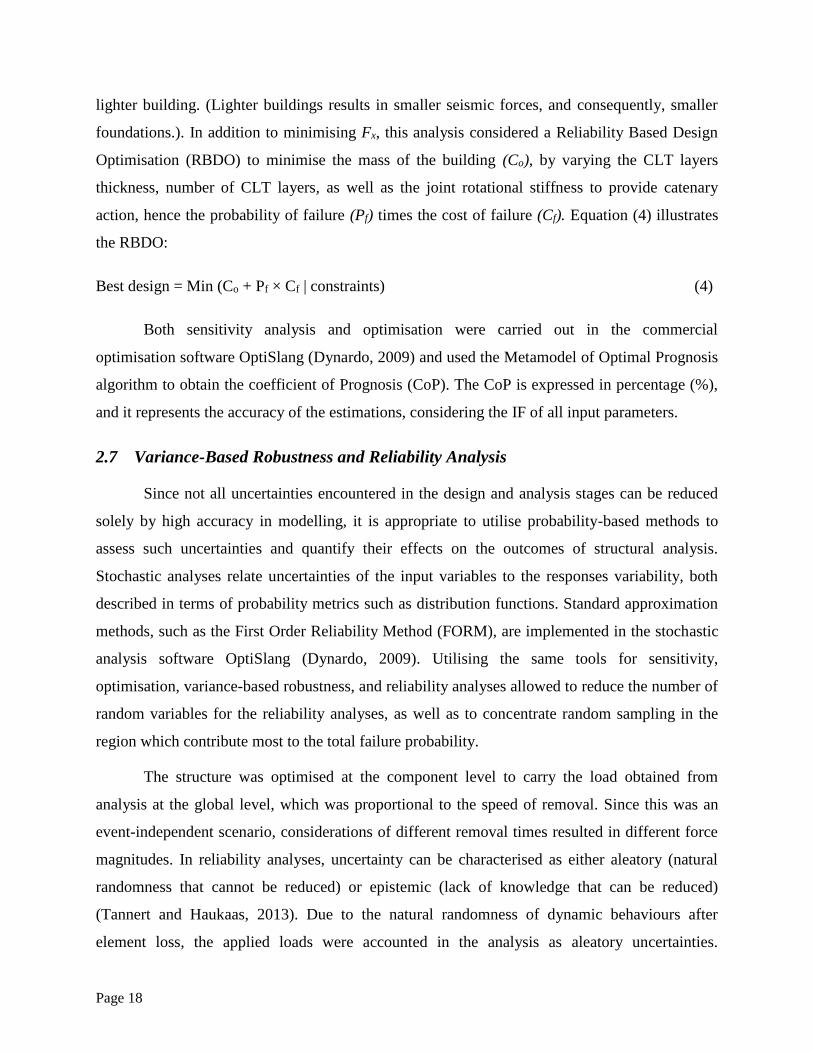
lighter building. (Lighter buildings results in smaller seismic forces, and consequently, smaller
foundations.). In addition to minimising Fx, this analysis considered a Reliability Based Design
Optimisation (RBDO) to minimise the mass of the building (Co), by varying the CLT layers
thickness, number of CLT layers, as well as the joint rotational stiffness to provide catenary
action, hence the probability of failure (Pf) times the cost of failure (Cf). Equation (4) illustrates
the RBDO:
Best design = Min (Co + Pf × Cf | constraints) (4)
Both sensitivity analysis and optimisation were carried out in the commercial
optimisation software OptiSlang (Dynardo, 2009) and used the Metamodel of Optimal Prognosis
algorithm to obtain the coefficient of Prognosis (CoP). The CoP is expressed in percentage (%),
and it represents the accuracy of the estimations, considering the IF of all input parameters.
2.7 Variance-Based Robustness and Reliability Analysis
Since not all uncertainties encountered in the design and analysis stages can be reduced
solely by high accuracy in modelling, it is appropriate to utilise probability-based methods to
assess such uncertainties and quantify their effects on the outcomes of structural analysis.
Stochastic analyses relate uncertainties of the input variables to the responses variability, both
described in terms of probability metrics such as distribution functions. Standard approximation
methods, such as the First Order Reliability Method (FORM), are implemented in the stochastic
analysis software OptiSlang (Dynardo, 2009). Utilising the same tools for sensitivity,
optimisation, variance-based robustness, and reliability analyses allowed to reduce the number of
random variables for the reliability analyses, as well as to concentrate random sampling in the
region which contribute most to the total failure probability.
The structure was optimised at the component level to carry the load obtained from
analysis at the global level, which was proportional to the speed of removal. Since this was an
event-independent scenario, considerations of different removal times resulted in different force
magnitudes. In reliability analyses, uncertainty can be characterised as either aleatory (natural
randomness that cannot be reduced) or epistemic (lack of knowledge that can be reduced)
(Tannert and Haukaas, 2013). Due to the natural randomness of dynamic behaviours after
element loss, the applied loads were accounted in the analysis as aleatory uncertainties.
Page 19
Epistemic uncertainties also stem from the fact that numerical models can neither fully represent
the actual structure nor completely capture its real behaviour (Yin and Li, 2010).
In this paper, the variability in the estimation of the connection stiffness were considered
as epistemic uncertainties, given that the parameters were calibrated using observations from the
micro model and Equation (2). The variability of timber as a natural material is related to both
aleatory and epistemic uncertainties. This research assumed that extensive testing of CLT panels,
in addition to rigorous CLT production quality control procedures, would reduce this variability.
Therefore, the strength and stiffness properties of the CLT were also considered as epistemic
uncertainties from the fact that numerical models only captured part of the real behaviour (the
material models were based on a limited number of tests) (Yin and Li, 2010). A Variance-Based
Robustness Analysis (VBRA) investigates the effects of random uncertainties on the variability
of structural response (Most & Will, 2011). The robustness analysis estimates the sigma (σ)
level, which is the number of standard deviation about the mean value, for all defined structural
responses with respect to the probability distribution functions (PDF) obtained from varying the
input uncertainties. A σ-level of 4.0 is often required for an acceptable level of safety (Most &
Will, 2011). The probability of exceedance (Pe) of the constraints can be estimated from the σ-
level. The robustness analysis also required an ALHS, with 3,000 as the chosen sample size.
In addition to the input parameters from the sensitivity analysis, the following
uncertainties that influence the structural response were considered: 10) the modulus of elasticity
of the longitudinal layers of the CLT panels (EL); 11) the modulus of elasticity for the transverse
layers of the CLT panels (ET); 12) the bending strength of the CLT floor panels (fb); 13) the shear
strength of the CLT floor panels (fs); 14) the compressive strength of the CLT wall panels (fc);
15) the stiffness of the floor-to-wall above connection (k1); 16) the stiffness of the floor-to-wall
below connection (k2); and 17) the applied loads from dynamic analysis at global level (F). In
these calculations, however, the dead and live loads were assumed to be deterministic given that
most of the variability was due to the speed of the element removal.
For both VBRA and FORM, the set limits state functions (LSFs) were identical to the
constraints defined in the sensitivity analysis. Specifically, the LSFs (g) were the
disproportionate collapse defined thresholds. A basic reliability problem was considered; failure
occurred when g ≤ 0, defined as resistance (R) minus demand (D). From Equation (5), the
Page 20
resistances (R) were established as MR, SR, CR, Δmax and their respective demands (D) were given
as Mz, Sy, By and Δy. For VBRA, the consideration of the LSFs was a component reliability
problem; the σ-level dealt with a single LSF at the time. With the LSFs considered separately,
the results of the variance-based robustness analysis would be whether the optimised structure
would be safe (robust) or unsafe (non-robust), in presence of a given uncertainty in the model:
g = R – S (5)
In FORM, all four LSFs had to comply with the condition g>0 for the structure to be
considered safe; and failure was defined when one, or more than one, LSF was violated (g≤0). In
other words, although the LSF were formulated individually, all four LSFs were considered as a
series system when evaluating structural safety as follows:
g(Xi) = min (gj(Xi)); i=1…N and j=1…4 (6)
where Xi represents an input random variable i (i=1..N), N is the total number of considered input
variables (herein = 8), and gj(Xi) is the considered LSF j (j=1…4). Correlations between the LSF
are not considered; instead the algorithms implemented in OptiSlang consider inputs correlations
of the defined random variables (with respect to the mean, coefficient of variation, and
distribution type) which implies output correlations (e.g., Mr depends on the EL, ET and Fb,
whereas the demand Mz depends on F). This approach leads to one compound LSF; therefore,
FORM results give a single reliability index (β) used to estimate a single probability of
disproportionate collapse (Pf):
Pf = Ф(-β) (7)
Tests on small clear wood specimens have shown high variabilities in strength properties
of wood (e.g., Jessome (1977)). For Engineered Wood Products such as CLT, these variabilities
are reduced through the homogenisation during the production process, where defects are either
removed or distributed (Thelandersson and Larsen, 2003). The coefficient of variation (CoV) of
the Young’s modulus of CLT has been shown to depend on the panel width; for 960mm wide
panels, it was determined as 6% (Joebstl et al. 2006). Steiger and Gulzow (2009) showed that the
variability of CLT strength properties depends on panel thickness, layup, width, strength of the
individual boards, moisture content, and fabrication process. The authors tested different CLT
products and established the CoV for the bending strength to range from 10% to 14%; the CoV

Page 21
for the Young’s modulus to range from 4% to 10%. Joebstl et al. (2008) investigated the in-plane
shear strength of CLT panels and found that the CoV ranged from 3% and 16% depending on the
panel layup. Brandner et al. (2013) concluded that the CoV for shear strength ranged from 5% to
10%, again depending on width, thickness, and gap width between the boards. Jeitler et al.
(2016) tested CLT made of the hardwood species birch and established the CoV for the Young’s
modulus, bending, shear and compression strengths as 4%, 11%, 9% and 7%, respectively.
In the current study, the variance-based robustness and reliability analyses were
performed on an optimised structure of a case-study building, using Canadian made CLT for
which there is no data available for the strength and stiffness CoVs. However, the literature
review revealed that the CoVs for strength and stiffness properties of European CLT are around
10% or smaller, depending on a series of individual parameter. Therefore, a normal PDF with
10% CoV was considered for all CLT material properties, assuming the 5th percentile is 87% of
the nominal values given in CSA-O86 (CSA, 2015), see Table 5. Although material parameters
were assumed as normally distributed random variables, limits were imposed to ensure that no
negative values were selected.
The stiffness of the floor-to-wall above as well as the floor-to-wall below were also
defined as a normal PDF with their mean values obtained from the optimised structure. It was
found that the estimations using Equation (2), considering changes in screw diameters and CLT
density, were within 10% of the values obtained from the micro model, considering identical
changes. Therefore, a CoV of 10% was deemed acceptable for k1 and k2. (Schneider (2015)
tested on off-the-shelf angle brackets and screws, and found CoV in that range). The mean value
of the applied forces was obtained from 30 different analyses at global level, with the speed of
removal ranging from 10-5 to 10-2sec. It is worth mentioning that, for the considered building,
these ranges accounted for both static and maximum dynamic effects, with slowest removal
mimicking simple element removal with dead and live loads only. The forces obtained following
the considered range of speed removal was defined as a PDF, with a CoV of 100% calculated
from the magnitude of the forces obtained from the different removal speeds.
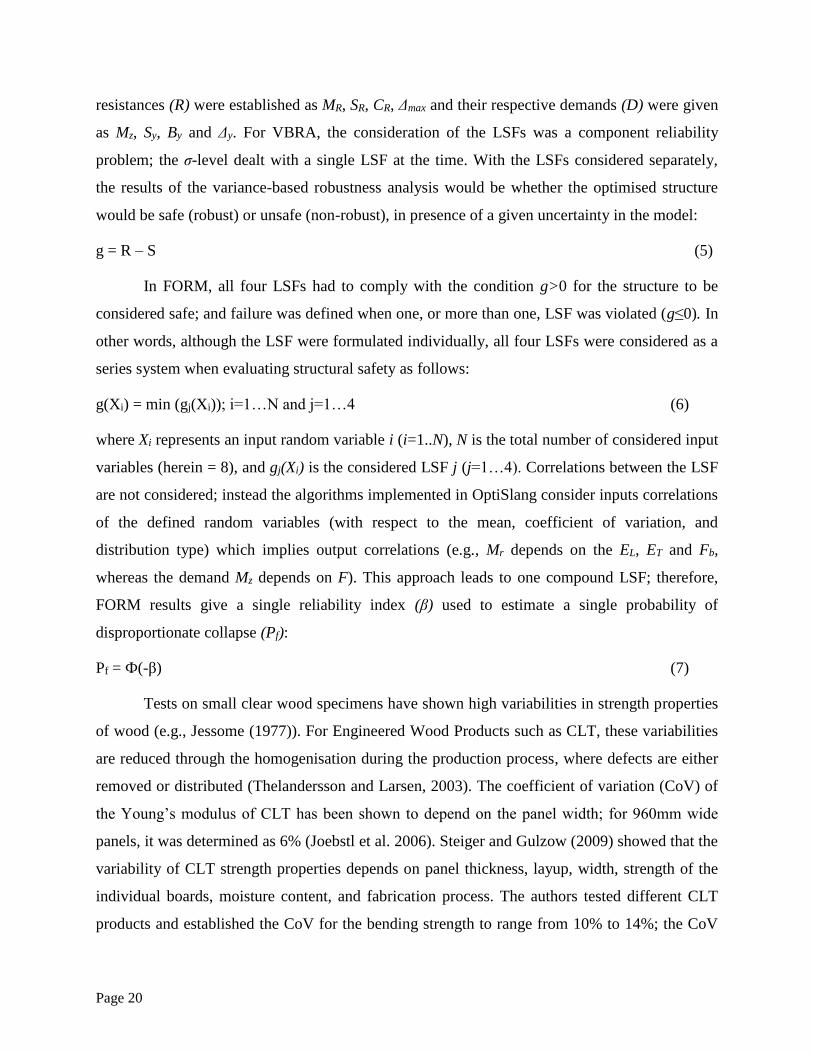
Table 5: Uncertainties for reliability analysis at macro level
Variable Description PDF type Mean CoV Min Max
Page 22
(%) (MPa) (MPa)
EL
ET
Fb
Fs
Fc
k1
k2
F
E-value for longitudinal layers
E-value for transverse layers
Bending strength
Shear strength
Compressive strength
Stiffness of floor-to-wall above
Stiffness of floor-to-wall below
Applied force
Normal
Normal
Normal
Normal
Normal
Normal
Normal
Lognormal
As per Table 4
As per Table 4
As per Table 4
As per Table 4
As per Table 4
From optimisation
From optimisation
From global model
10
10
10
10
10
10
10
100
7,502
5,770
21.50
0.38
14.73
-
-
-
15,900
12,230
45.60
0.81
31.22
-
-
-
3 RESULTS AND DISCUSSION
3.1 Nonlinear Dynamic Analysis of the Global Model
Modal analyses for internal and external ground floor loadbearing walls removal,
estimated the natural frequency of the building to 0.6Hz. The frequency of the mode shape with
vertical deformations around the removed element, as illustrated in Figure 5a and Figure 5b for
internal and external wall removal scenarios respectively, was 6.1Hz. Thereafter, a static analysis
of the twelve-storey building gave downward forces of 1,546kN and 1,260kN right on top of the
internal and external ground floor walls, respectively. The structural elements to be removed
were replaced by these forces, acting upwards at the same location, in order to mimic the normal
static case during the dynamic analysis.
It was observed that the quicker the removal, the stronger the dynamic motions, which led
to higher imposed deformations and consequently larger forces on the members. Furthermore, it
was noted that for 0.001sec or quicker, 5% critical damping would not be sufficient for a good
structural resilience. The existence of moment reversal observed in the results highlights the
concern of designing the members and connections for dynamic loadings, even though the
building would not be subjected to seismic loads. These observations agree with conclusions of
previous research (Mpidi Bita et al., 2016 and 2017).

Page 23
Figure 5: Mode shapes: a) internal removal and b) external removal
The results of the static analyses (S1) were compared against the outcomes of the dynamic
analysis (S2). Since no importance was given to the extreme loading itself, the speed of removal
(t) was initially assumed to be 0.001sec, to meet the GSA (2013) specifications. Figure 6 and
Figure 7 show the maximum forces obtained after the loss of the internal and external wall,
respectively for the two cases (S1 and S2). Force distribution occurred and the loads on top of the
removed elements decreased drastically, from the values obtained after analyses of the complete
structure before the initial damage. One could assume that after removal, each floor tried to carry
its own loads to relieve the damaged area; hence increasing the tie forces at connection level.
Furthermore, the outcomes of the present study show that S2 were about 1.5 higher than S1 hence
agreeing with the DIF recommended in the literature (DoD, 2013).
The floor design had to consider not only the downward vertical forces but also the
dynamic upward loads, confirming the conclusions by Mpidi Bita et al. (2016). Depending on
the speed of removal (t), uplift forces from S2, at the location of the removed element, were as
high as 300% of the values obtained from the static removal of the loadbearing wall, S1. The
axial or tie forces at the connections for S2 was about ten times higher than the results from S1 in
order to develop resistance mechanisms, for both internal and external wall removals. This
increase raises a concern as the proposed detailing is primarily designed for shear according to
section 10.6.6 of CSA-O86 and, therefore, might not be able to carry axial forces higher than
60kN per panel width, as recommended in EN1991-1-7 (CEN, 2006). Furthermore, out-of-plane
shear forces at wall-to-floor connections increase from 3kN for S1 to 189kN for S2 in the case of

Page 24
internal wall removal. This emphasises the need for new structural detailing in order to avoid
disproportionate collapse.
Figure 6: Results of internal wall removal
Figure 7: Results of external wall removal
For internal wall removal, the building’s response also highlighted the need to design the
floor for twice its original length for the structural form considered. Herein, the continuous floor
carried 193kN at mid-span, from S2 for the considered removal time. A lognormal PDF was
obtained, for speed of removal (t) from 10-5 to 10-2sec, with a mean value of 265kN and 100%
CoV. This PDF was used to assign the random variable (F) for the reliability analysis at the level
of the macro model. The upper limit value of the PDF, obtained from a speed of removal of
0.0001sec, was 423kN.

Page 25
3.2 Analysis of the Micro and Macro Models
The deformed shape of the micro model, as shown in Figure 8a, gave a maximum
rotation (θ) of 1.14 rad. Static analysis of the 3D micro model gave a rotational stiffness of
211kNm/rad and 359kNm/rad for k1 and k2, respectively. In the 3D model, it was observed that
the provided joint detailing could only carry about 44% of the load obtained from the nonlinear
dynamic analysis of the global model. The full force could only be applied if the rotational
stiffness, both k1 and k2, of the models was changed to values greater than 106kNm/rad.
Furthermore, the observed points of high stresses were the angle brackets, connecting the wall
and the floor above, and excessive bending and shear of the STS connection. In addition, some
CLT panels experienced high compression perpendicular to the grain stresses, beyond CSA-O86
(2016) thresholds, pointing to possible disproportionate collapse.
Figure 8: Isometric view of the deformed shapes: a) 3D micro model and b) 3D macro model
2D macro models were used to estimate the required rotational joint stiffness, necessary
to carry the applied loads. Figure 8b shows the deformed shape. It was observed that, when k-
values were below 103kNm/rad, the structure would not be able to carry 193kN (the dynamic
loads obtained from the removal of the internal loadbearing wall), due to excessive deformation
(θ) and high tie forces (Fx). Beyond 106kNm/rad, the connection could be assumed to be fully
rigid and negligible changes in Fx were noted. Using the axial stiffness under the service loads,
expressed in terms of Kser from Equation (2), it was found that 81 screws, representing a
rotational stiffness of 105 kNm/rad, would be required along the width of one CLT panel, to carry
the applied forces. This requirement is not practical. To obtain a realistic or practical number of

Page 26
screws, the required rotational stiffness needed to be between 1kNm/rad and 103 kNm/rad.
Therefore, these values used as a range for k1 and k2 for the subsequent analyses.
Assuming thresholds as defined in Section 2.5, the analysis at the component level
showed that the building was prone to disproportionate collapse. Failure was observed when
comparing the Mz against MR. All other constraints were not violated. It can be argued that the
new span of 9m would be unpractical for the proposed CLT panel size. Furthermore, the results
confirm that 10% of the span for catenary action, as suggested by Stevens (2012) would not be
practical for timber structures, unless the designer introduces a detailing that would enable a
formation of plastic hinges. Large deformations of magnitudes higher than 500mm, for catenary
action, could only be attained by incorporating a floor-to-floor detailing that takes axial forces.
3.3 Sensitivity Analysis
The results of the sensitivity analysis showed that applied mid-span bending moment and
deflection on the floor panel caused failure in 85% and 35% of the sample size, respectively.
This highlights the need of incorporating a detailing at the location of the removed element, that
can develop plastic hinges to enable large deformations while maintaining load-carrying
capacity. Table 6 shows how each input parameters influence each structural response, before
optimisation.
Table 6: Results of the sensitivity analysis
Structural
Response
IF of input paramters [%] CoP
[%] .k1 .k2 SG .nF .tL,F .tT,F nW tL,W tT,W
MR
MZ
SR
SY
Δy
CR
BY
FX
-
-
-
-
1
-
-
1
-
-
-
-
-
-
-
6
9
9
4
-
1
6
-
-
53
53
72
85
70
-
-
31
7
7
6
7
7
-
-
4
3
3
5
6
3
-
-
2
-
-
-
64
79
8
-
-
-
13
10
2
-
-
-
1
8
1
100
100
100
100
97
99
100
96
Page 27
All responses had at least 96% as CoP, hence confirming the accuracy of the estimations
with respect to the IF. The results show that, for both floor and wall panels, the main parameter
is the CLT thickness, expressed as the number of plies. MR and MZ are the main cause of
observed structural failures, SG is the second most important parameter. The joint stiffnesses k1
and k2 mainly influenced the values of the axial forces FX, with the latter having the highest IF.
Considering the thickness of the panel, the size of the longitudinal layers always had more
influence compared to the thickness of the transverse layers.
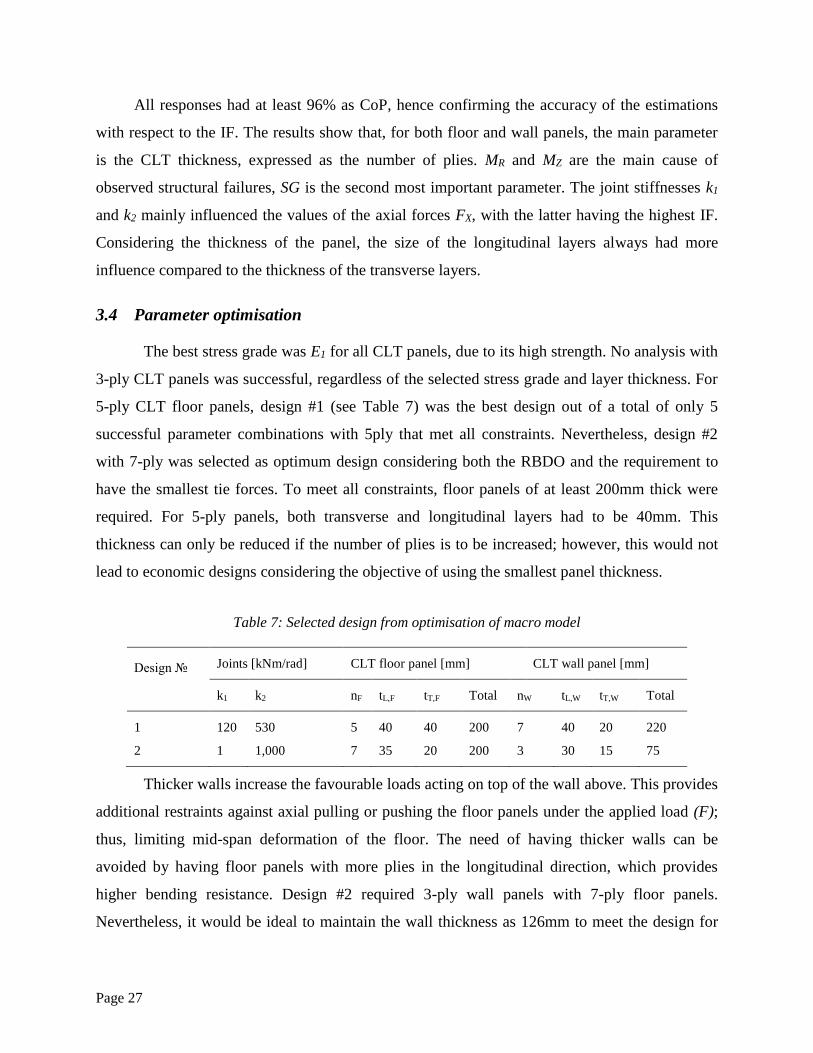
3.4 Parameter optimisation
The best stress grade was E1 for all CLT panels, due to its high strength. No analysis with
3-ply CLT panels was successful, regardless of the selected stress grade and layer thickness. For
5-ply CLT floor panels, design #1 (see Table 7) was the best design out of a total of only 5
successful parameter combinations with 5ply that met all constraints. Nevertheless, design #2
with 7-ply was selected as optimum design considering both the RBDO and the requirement to
have the smallest tie forces. To meet all constraints, floor panels of at least 200mm thick were
required. For 5-ply panels, both transverse and longitudinal layers had to be 40mm. This
thickness can only be reduced if the number of plies is to be increased; however, this would not
lead to economic designs considering the objective of using the smallest panel thickness.
Table 7: Selected design from optimisation of macro model
Design №
Joints [kNm/rad] CLT floor panel [mm] CLT wall panel [mm]
k1 k2 nF tL,F tT,F Total nW tL,W tT,W Total
1
2
120
1
530
1,000
5
7
40
35
40
20
200
200
7
3
40
30
20
15
220
75
Thicker walls increase the favourable loads acting on top of the wall above. This provides
additional restraints against axial pulling or pushing the floor panels under the applied load (F);
thus, limiting mid-span deformation of the floor. The need of having thicker walls can be
avoided by having floor panels with more plies in the longitudinal direction, which provides
higher bending resistance. Design #2 required 3-ply wall panels with 7-ply floor panels.
Nevertheless, it would be ideal to maintain the wall thickness as 126mm to meet the design for
Page 28
gravity and lateral loads as described in Section 2.1. Furthermore, design #2 confirms k1 should
be kept to its minimum, based on lateral design; k2 should be kept to its maximum to develop
catenary action of floor panels. Positive axial force on the connection means that for the
deflected shape at component level, the external walls, both above and below the affected floor,
would be pulled inward creating a tensile axial force on the connection. Negative axial
compressive forces, as obtained for the optimised design, are opposite and pushed the walls
outward. This behaviour is affected by the magnitude of the considered rotational stiffness k1 and
k2. When the latter is kept closer its minimum (1kNm/rad) and the former closer to its maximum
(103kNm/rad), the resulting tie forces are positive. Since neither timber nor the proposed
detailing are good in tension, applying negative axial compressive forces is the ideal behaviour.
For the optimum design, Design #2, this negative axial force caused out-of-plane bending of the
walls near the connection.
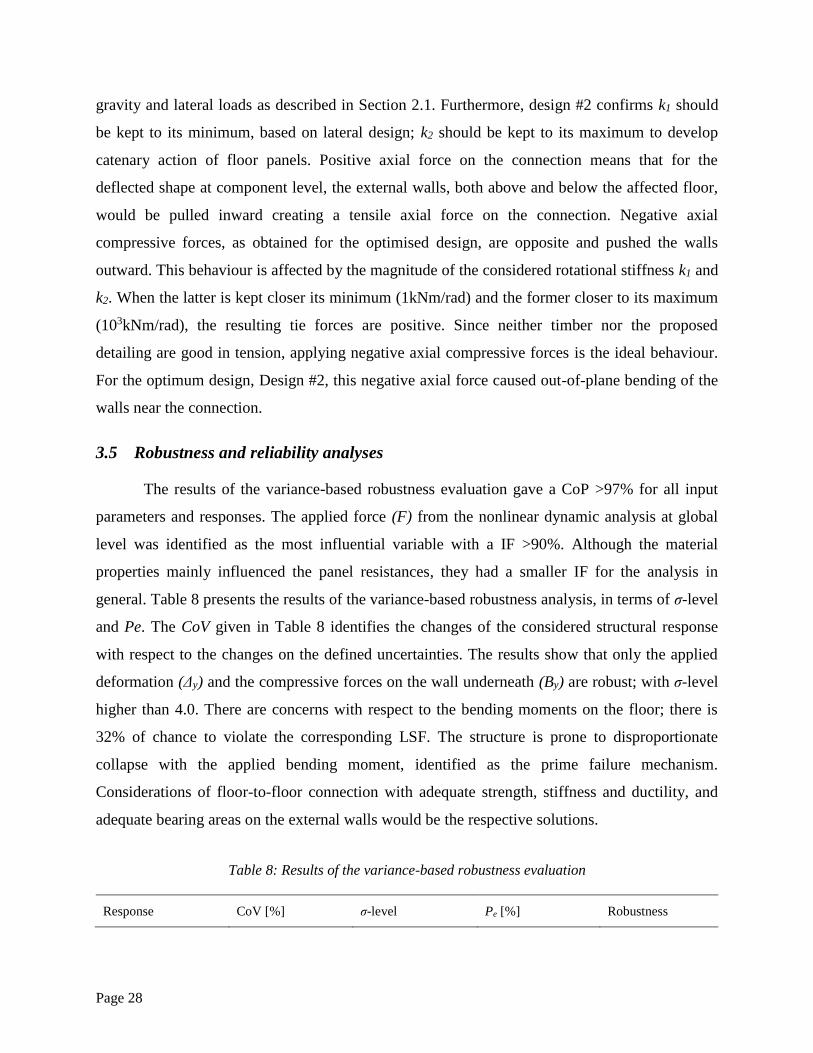
3.5 Robustness and reliability analyses
The results of the variance-based robustness evaluation gave a CoP >97% for all input
parameters and responses. The applied force (F) from the nonlinear dynamic analysis at global
level was identified as the most influential variable with a IF >90%. Although the material
properties mainly influenced the panel resistances, they had a smaller IF for the analysis in
general. Table 8 presents the results of the variance-based robustness analysis, in terms of σ-level
and Pe. The CoV given in Table 8 identifies the changes of the considered structural response
with respect to the changes on the defined uncertainties. The results show that only the applied
deformation (Δy) and the compressive forces on the wall underneath (By) are robust; with σ-level
higher than 4.0. There are concerns with respect to the bending moments on the floor; there is
32% of chance to violate the corresponding LSF. The structure is prone to disproportionate
collapse with the applied bending moment, identified as the prime failure mechanism.
Considerations of floor-to-floor connection with adequate strength, stiffness and ductility, and
adequate bearing areas on the external walls would be the respective solutions.
Table 8: Results of the variance-based robustness evaluation
Response CoV [%] σ-level Pe [%] Robustness

Page 29
Mz
Sy
Δy
By
99
62
75
17
0.04
3.18
5.72
12.80
32.00
1.60
0.33
0.03
Not Robust
Not Robust
Robust
Robust
The results of the reliability analysis confirmed the outcomes from the robustness
analysis. Among 93 designs, the design point (design #77) corresponded to a force (F) of 93kN.
The reliability index (β) was estimated to 0.46, giving a probability of failure P(F) of 32%. Such
a high P(F) obtained at component level could directly be related to high chances of
disproportionate collapse of the twelve-storey CLT building, in the event of sudden loss of the
internal ground floor load-bearing wall. The catenary action of the CLT floor system with the
supplied rotational stiffness would not be sufficient to avoid widespread failure. This highlights
safety concerns regarding the design and construction of mid-rise CLT structures.
4 CONCLUSIONS
This paper presented FEA to investigate the probability of disproportionate collapse of a
twelve-storey CLT building following the sudden removal of internal and external ground floor
loadbearing walls. A nonlinear dynamic analysis was performed at global level to capture the
overall structural performance under the applied extreme loads. This was followed by a
sensitivity analysis in order to optimise the structure at component level. Thereafter, a variance-
based robustness analysis was considered to estimate the vulnerability of the optimised structure
in the presence of uncertainties in the applied loads, which is affected by the speed of element
removal, material properties of timber elements, and connection stiffness. Finally, reliability
analyses were performed to compute the probability of disproportionate collapse. The following
conclusions can be drawn:
1) At global level, slowly removing key elements, resulting in a static behaviour, is not
sufficient; the analysis needs to capture both dynamic behaviour and nonlinearities. For the
presented building, it was found that the forces from the dynamic simulation is about 1.5 higher
than the outcome from static analysis.
Page 30
2) Since the nature and the probability of the extreme events is unknown, understanding the
structural behaviour under different loads is of high importance. The importance of
overdesigning the structural elements cannot be overstated to account for a bigger range of
events susceptible to occur during the life time of the building.
3) The tie forces necessary to trigger resistance mechanism such as cantilever and catenary
actions are higher than what normal self-tapping screws and angle brackets could supply.
Therefore, there is a need to develop novel connection detailing with sufficient strength, stiffness
and ductility.
4) The design of the considered building shall account for force reversal for all removal
scenarios, and twice the original floor span, for internal wall removal. For the latter, the main
failure mechanisms are the applied bending moment and deflection at the location of the
removed element.
5) Optimisation of the considered structure at component level showed that CLT panel shall be at
least 200mm thick, regardless the number of plies, with E1 as stress grade, to satisfy
serviceability and ultimate limit state, as well as disproportionate collapse requirements (for the
considered material properties, connection detailing, and a removal speed longer than 0.001sec).
6) The results showed that in presence of uncertainties in material properties, connection
stiffnesses, as well as different speed of removal, the building had a probability of failure
collapse as high as 32% if simply designed to be code compliant without specific considerations
of the complexities associated with disproportionate collapse.
7) The sensitivity and variance-based robustness analyses have identified the applied bending
and deformations as the main failure mechanism. Horizontal ties with sufficient strength,
stiffness and ductility are required to develop catenary action of the floor panel. Otherwise,
vertical ties shall be provided to enable suspension of the floor to the wall above.

Page 31
REFERENCES
ANSYS. (2015). Ansys-15. Pennsylvania, USA: SAS IP, Inc.
Arup (2011). Review on international research on structural robustness and disproportionate
collapse. Retrieved from: https://www.gov.uk/government/publications/.
ASCE. (2010). ASCE Standard ASCE/SEI 7: Minimum design loads for buildings and other
structures. American Society of Civil Engineers, Virginia, USA.
Brandner, R., Bogensperger, T., & Schickhofer, G. (2013). In plane shear strength of Cross
Laminated Timber (CLT): Test configuration, quantification and influencing parameters.
International Council for Research and Innovation in Building and Construction. Working
Commission W18- Timber Structures, Vancouver, Canada.
CSA O86 (2016). Engineering design in wood, Canadian Standards Association, Mississauga,
Canada.
Dynardo (2009). OptiSLang: The optimising structural language. Dynardo GmbH, Germany.
EN 1990 (2010). Basic of structural design. CEN European Committee for Standardisation,
Brussels, Belgium.
EN 1991-1-1 (2009). General actions – Densities, self-weight, imposed loads for buildings. CEN
European Committee for Standardisation, Brussels, Belgium.
EN 1991-1-7 (2006). Actions on structures – Part 1-7: Accidental actions. CEN European
Committee for Standardisation, Brussels, Belgium.
EN 1995-1-1 (2008). Design of timber structures – Part 1-1: General – Common rules and rules
for buildings. CEN European Committee for Standardisation, Brussels, Belgium.
ETA-06/0106 (2008). Tree-dimensional nailing plate (timber-to-timber/timber-to-concrete or
steel angle bracket. European Technical Approval. Deutsches Institut fuer Bautechnik,
Berlin, Germany.
ETA-11/0190 (2011). Wurth self-tapping screws. European Technical Approval. Deutsches
Institut fuer Bautechnik, Berlin, Germany.
Page 32
Fruhwald, E., Serrano, E., Toratti, T., Emilsson, A., & Thelandersson, S. (2007). Design of safe
timber structures – How can we learn from structural failures in concrete, steel and timber?
Report TVBK-3053. Lund University, Sweden.
Gagnon, S., & Pirvu, C. (2009). Cross laminated timber handbook. (Canadian ed. SP-528E).
FPInnovations. Vancouver, Canada.
Green, M. & Karsh, J.E. (2012). Tall wood-the case for tall wood buildings. Wood Enterprise
Coalition. Vancouver, Canada.
GSA (2013). Progressive collapse analysis and design guidelines for new Federal office
buildings and Major Modernization Projects. General Service Administration, USA.
Gudmundsson, G.V., & Izzuddin, B.A. (2010). The ‘sudden column loss’ idealisation for
disproportionate collapse assessment. The Institution of Structural Engineers, 88, 22-26.
Hamburger, R., & Whittaker, A. (2004). Design of steel structures for blast-related progressive
collapse resistance. The Steel Conference, California, USA.
Harte, A., & Fragiacomo, M. (2010). Cost action E55 – Modelling of the performance of timber
structures: 6th workshop. University of Ljubljana, Slovenia.
Hossain, A., Danzig, I., & Tannert, T. (2016) Cross-laminated timber shear connection with
innovative self-tapping screw assemblies. ASCE Journal of Structural Engineering 142(11),
04016099-1.
Jeitler, G., Augustin, M., & Schickhofer, G. (2016). Mechanical properties of Glued Laminated
Timber and Cross Laminated Timber produced with the wood species birch. World
Conference on Timber Engineering, Vienna, Austria.
Jessome, A.P. (1977). Strength and related properties of woods grown in Canada. Forestry
Technical Report 21. Eastern Forest Products Laboratory, Ottawa, Canada.
Joebstl, R.A., Bogensperger, T., & Schickhofer,G. (2006). A contribution to the design and
system effect of Cross Laminated Timber (CLT). International Council for Research and
Innovation in Building and Construction. Working Commission W18- Timber Structures,
Florence, Italy.

Page 33
Joebstl, R.A., Bogensperger, T., & Schickhofer, G. (2008). In-plane shear strength of Cross
Laminated Timber. International Council for Research and Innovation in Building and
Construction. Working Commission W18- Timber Structures, St. Andrews, Canada.
Krauthammer, T., Hall, R. L., Woodson, S. C., Baylot, J. T., Hayes, J. R., & Sohn, Y. (2002).
Development of progressive collapse analysis procedure and condition assessment for
structures. National Workshop on Prevention of Progressive Collapse in Rosemont,
Multihazard Mitigation Council of the National Institute of Building Sciences. Pennsylvania
State University, USA.
Lew, H.S. (2003). Best practices guidelines for mitigation of building progressive collapse.
Building and Fire Research Laboratory, National Institute of standards and Technology,
Maryland, USA.
Macleod, I.A. (2014). Modern structural analysis: Supplementary information on modelling.
Thomas Telford Ltd, London, UK.
Milner, M., Bullock, M., & Pitts, G. (2003). Multi-storey timber frame building: a design guide.
BRE, London, UK.
Moore, D.B. (2002). The UK and European regulations for accidental actions. Prevention of
progressive collapse: Report on the July 2005 National Workshop and Recommendations for
future effort. National Institute of Building Sciences Washington, DC, USA.
Most, T. & Will, J. (2011). OptiSlang: Robustness design optimisation in industrial virtual
product development – the optimising structural language. International Conference on
Reliable Engineering Computing, Prague, Czech Republic.
Mpidi Bita, H. Currie, N. & Tannert, T. (2017). Reliability analysis and disproportionate collapse
for multi-storey cross-laminated timber buildings. World Conference on Earthquake
Engineering, Santiago, Chile.
Mpidi Bita, H., Currie, N., & Tannert, T. (2016). Assessment of disproportionate collapse for
multi-storey cross-laminated timber buildings. World Conference on Timber Engineering,
Vienna, Austria.
NBCC (2010). National Building Code of Canada. Canadian Commission of Buildings and Fire
Codes. National Research Council Canada, Ottawa, Canada.

Page 34
Patel, B.R. (2014). Progressive collapse analysis of RC buildings using nonlinear static and
nonlinear dynamic method. International Journal of Emerging Technology and Advanced
Engineering, 4 (9): 1640-1644.
Popovski, M., Chen, Z., & Gafner, B. (2016). Structural behaviour of point-supported CLT floor
systems. World Conference on Timber Engineering, Vienna, Austria.
Schneider, J. (2015). Conventional and novel timber steel hybrid connections: testing,
performance and assessment. Doctoral Dissertation. University of British Columbia,
Canada.
Schultz, D.M., Burnett, E.F.P. & Findel, M. (1977a). Design and construction of large-panel
concrete structures: A design approach to general structural integrity. (Report 2). Portland
Cement Association, Washington, DC, USA.
Schultz, D.M., Burnett, E.F.P., & Findel, M. (1977b). Design and construction of large-panel
concrete structures: A design approach to general structural integrity. (Report 4). Portland
Cement Association, Washington, DC, USA.
Shahnewaz, Md., Tannert, T., Popovski, M., & Alam, M.S. (2017). In-plane stiffness of cross
laminated timber panels with openings. Structural Engineering International 27 (2), 217-223.
Shwartz, M. (2001). Structural engineer describes collapse of the world trade centre towers:
Hamburger, Ronald. Stanford University, USA.
Starossek, U., & Haberland, M. (2010). Disproportionate collapse: Terminology and procedures.
Journal of Performance of Constructed Facilities, 24:1943-5509.0000138.
Steiger, R., & Gulzow, A. (2009). Validity of bending tests on strip-shaped specimens to derive
bending strength and stiffness properties of Cross Laminated Timber (CLT). International
Council for Research and Innovation in Building and Construction. Working Commission
W18 – Timber Structures, Dubendorf, Switzerland.
Stevens, D. (2012). Final report for: Assessment and proposed approach for tie forces in framed
and load-bearing wall structures. Protection Engineering Consultants, Texas, USA.
Structural Timber Association. (2010). Timber frame structures- platform frame construction
(part 3). (Rev 0-10.11.14/EB005). Structural Timber Association, London, UK.

Page 35
Structurlam. (2015). CrossLam CLT design guide Metric-Ver 11. Penticton, Canada:
Structuralam. Retrieved from: http://www.structurlam.com/.
Tannert, T., & Haukaas, T. (2013). Probabilistic models for structural performance of rounded
dovetail joints. Journal of Structural Engineering, 139: 1478-1488.
Tavakoli, H.R., Rashidi, A.A., & Abdollahzadeh G.R. (2012). 3-D Nonlinear static progressive
collapse analysis of multi-story steel braced buildings. World Conference on Earthquake
Engineering, Lisboa, Portugal.
Thelandersson, S., & Larsen, J. (2003). Timber engineering. John Wiley & Sons Ltd, Sussex,
UK.
TRADA (2009). Worked Example. – 12-storey building of cross-laminated timber (Eurocode 5).
Timber Research and Development Association. TRADA Technology Ltd,
Buckinghamshire, UK.
UFC 4-023-03 (2013) Unified Facilities Criteria – Design of buildings to resist progressive
collapse. USA: Department of Defence, USA.
Vlassis, A.G., Izzuddin, B.A., Elghazouli, A.Y., & Nethercot, D.A. (2008). Progressive collapse
of multi-storey buildings due to sudden column loss - Part II: Application. Engineering
Structures, 30,1424-1438.
Wang, Y., Lin, F., & Gu, X. (2011). Load and resistance factors for progressive collapse
resistance design of reinforced concrete building structures. Advanced Material Research,
255-260, 388-344.
Yin, Y. & Li, Y. (2010). Seismic collapse risk of light-frame wood construction considering
aleatoric and epistemic uncertainties. Structural Safety 32: 250-261.
Zhang, X., Fairhurst, M., & Tannert, T. (2015). Ductility estimation for a novel timber-steel-
hybrid system. Journal of Structural Engineering. 142(4): E4015001.
Zhang X., Riasat A., Bhat P., Popovski M., & Tannert T. (2017). Seismic performance of
embedded steel beam connection in cross-laminated timber panels for tall-wood hybrid
system. Canadian Journal of Civil Engineering 44:611–618.