dispersion stability of functionalized graphene in …cml/assets/pdf/pu_13_xxhsieh.pdfdispersion...
TRANSCRIPT

Dispersion Stability of Functionalized Graphene in Aqueous SodiumDodecyl Sulfate SolutionsAndrew G. Hsieh,† Sibel Korkut,†,‡ Christian Punckt,†,‡ and Ilhan A. Aksay*,†
†Department of Chemical and Biological Engineering, Princeton University, Princeton, New Jersey 08544, United States‡Vorbeck Princeton Research Center, Vorbeck Materials Corp., 11 Deerpark Drive, Monmouth Junction, New Jersey 08852, UnitedStates
*S Supporting Information
ABSTRACT: The colloidal stability of functionalized graphenesheets (FGSs) in aqueous sodium dodecyl sulfate (SDS)solutions of different concentrations was studied by opticalmicroscopy and ultraviolet−visible light absorption after firstdispersing the FGSs ultrasonically. In up to ∼10 μM SDSsolutions, FGSs reaggregated within a few minutes, formingramified structures in the absence of SDS and increasinglycompact structures as the amount of SDS increased. Above ∼10μM, the rate of reaggregation decreased with increasing SDSconcentration; above ∼40 μM, the suspensions were colloidallystable for over a year. The concentration of ∼40 μM SDS lies 2orders of magnitude below the critical surface aggregationconcentration of ∼1.8 mM SDS on FGSs but above theconcentration (∼18 μM) at which SDS begins to form a monolayer on FGSs. Neither surface micelle nor dense monolayercoverage is therefore required to obtain stable aqueous FGS dispersions. We support our experimental results by calculating thevan der Waals and electrostatic interaction energies between FGSs as a function of SDS concentration and show that theexperimentally observed transition from an unstable to a stable dispersion correlates with a transition from negative to positiveinteraction energies between FGSs in the aggregated state. Furthermore, our calculations support experimental evidence thataggregates tend to develop a compact structure over time.
■ INTRODUCTION
Functionalized graphene sheets (FGSs) can be produced inlarge quantities by simultaneous thermal exfoliation andreduction of graphite oxide (GO)1,2 or by chemical reductionof graphene oxide3 and have been used in a wide variety ofapplications due to their extraordinary physical properties: Inlithium ion batteries, for example, the inclusion of electricallyconducting FGSs in metal oxide electrodes increases powerdensity.4−7 In polymer composites, the presence of FGSs leadsto higher modulus,8−10 elongation at failure,8,10 andstrength8−10 while improving the thermal stability8,11 andproviding electrical conductivity as well.9,10,12 When added toliquid fuels, FGSs may lower ignition temperatures andenhance combustion rates.13,14 The benefit of FGSs in theseapplications stems from interactions of the metal oxide,polymer matrix, or fuel molecules with graphene and, inparticular, with the lattice defects (topological defects andvacancies)1,15 and oxygen-containing functional groups1,15
found on FGSs. As such, to take full advantage of theproperties of FGSs, their accessible surface area needs to bemaximized.The theoretical specific surface area of graphene is 2630
m2/g. However, in dry FGS powders obtained from the thermalreduction of GO, the restacking of the sheets decreases the
surface area to 500−700 m2/g, as determined by nitrogenadsorption.2 Loosely aggregated FGSs can be separated fromone another with sufficient energy input, for example viaultrasonication in a solvent,1,2 and can be dispersed into mostlyindividual sheets, leading to an accessible surface area of up to1850 m2/g in suspension.2 However, FGSs reaggregate due toattractive van der Waals forces once the energy input fromultrasonication ceases, unless reaggregation is prevented eitherby reducing the van der Waals forces through refractive indexmatching16 or by introducing repulsive steric, electrostatic, orelectrosteric forces. FGSs that are dispersed in polar aproticsolvents such as N-methyl-2-pyrrolidone or dimethylformamidetypically form suspensions that are stable over a time scale ofmonths,17,18 likely due to refractive index matching betweenFGSs and the solvent.16 Nevertheless, aqueous FGS suspen-sions are necessary for many practical applications, such asgraphene−metal oxide nanocomposites for battery electro-des,4,6 graphene−polymer composites,8,9 and high surface areatapes.19 This generates a demand for aqueous FGS suspensionsthat are stable over the time scales of the respective processes.
Received: September 12, 2013Revised: November 1, 2013
Article
pubs.acs.org/Langmuir
© XXXX American Chemical Society A dx.doi.org/10.1021/la4035326 | Langmuir XXXX, XXX, XXX−XXX
Due to the large mismatch in the refractive indices of water20
and FGSs,21 the introduction of repulsive electrostatic or stericinteractions is necessary to obtain stable dispersions.FGSs exhibit a high number density of oxygen-containing
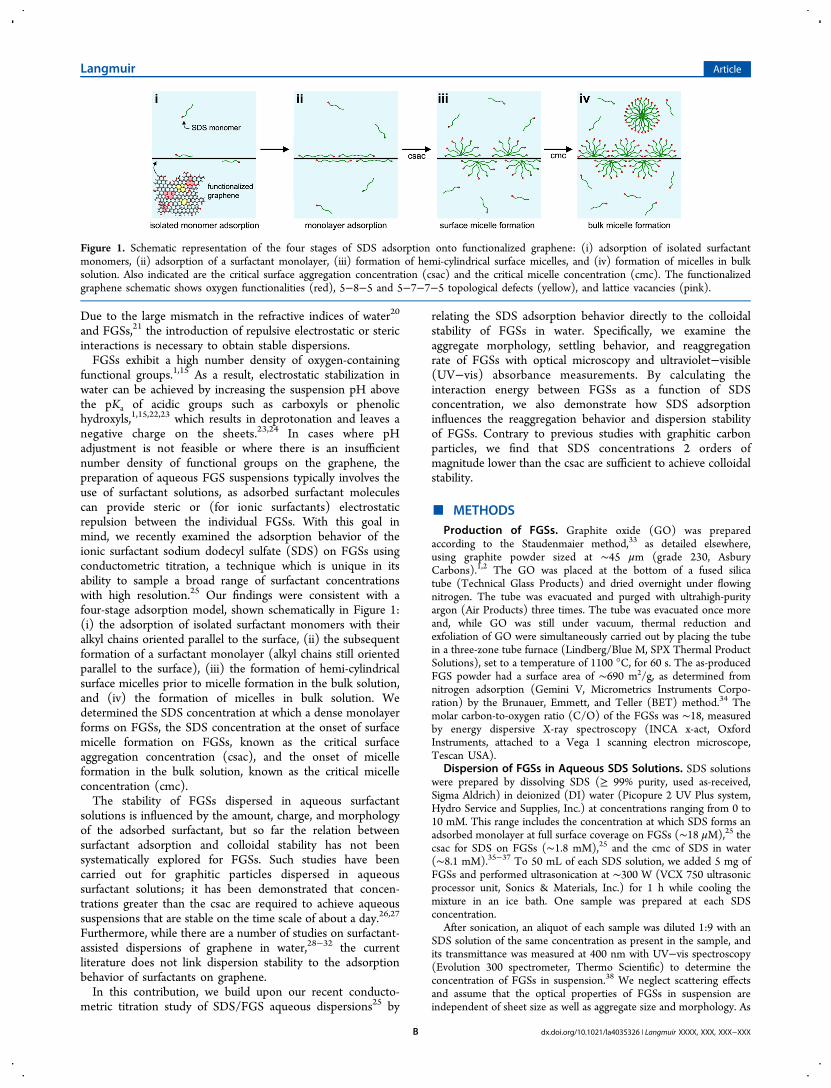
functional groups.1,15 As a result, electrostatic stabilization inwater can be achieved by increasing the suspension pH abovethe pKa of acidic groups such as carboxyls or phenolichydroxyls,1,15,22,23 which results in deprotonation and leaves anegative charge on the sheets.23,24 In cases where pHadjustment is not feasible or where there is an insufficientnumber density of functional groups on the graphene, thepreparation of aqueous FGS suspensions typically involves theuse of surfactant solutions, as adsorbed surfactant moleculescan provide steric or (for ionic surfactants) electrostaticrepulsion between the individual FGSs. With this goal inmind, we recently examined the adsorption behavior of theionic surfactant sodium dodecyl sulfate (SDS) on FGSs usingconductometric titration, a technique which is unique in itsability to sample a broad range of surfactant concentrationswith high resolution.25 Our findings were consistent with afour-stage adsorption model, shown schematically in Figure 1:(i) the adsorption of isolated surfactant monomers with theiralkyl chains oriented parallel to the surface, (ii) the subsequentformation of a surfactant monolayer (alkyl chains still orientedparallel to the surface), (iii) the formation of hemi-cylindricalsurface micelles prior to micelle formation in the bulk solution,and (iv) the formation of micelles in bulk solution. Wedetermined the SDS concentration at which a dense monolayerforms on FGSs, the SDS concentration at the onset of surfacemicelle formation on FGSs, known as the critical surfaceaggregation concentration (csac), and the onset of micelleformation in the bulk solution, known as the critical micelleconcentration (cmc).The stability of FGSs dispersed in aqueous surfactant
solutions is influenced by the amount, charge, and morphologyof the adsorbed surfactant, but so far the relation betweensurfactant adsorption and colloidal stability has not beensystematically explored for FGSs. Such studies have beencarried out for graphitic particles dispersed in aqueoussurfactant solutions; it has been demonstrated that concen-trations greater than the csac are required to achieve aqueoussuspensions that are stable on the time scale of about a day.26,27
Furthermore, while there are a number of studies on surfactant-assisted dispersions of graphene in water,28−32 the currentliterature does not link dispersion stability to the adsorptionbehavior of surfactants on graphene.In this contribution, we build upon our recent conducto-
metric titration study of SDS/FGS aqueous dispersions25 by
relating the SDS adsorption behavior directly to the colloidalstability of FGSs in water. Specifically, we examine theaggregate morphology, settling behavior, and reaggregationrate of FGSs with optical microscopy and ultraviolet−visible(UV−vis) absorbance measurements. By calculating theinteraction energy between FGSs as a function of SDSconcentration, we also demonstrate how SDS adsorptioninfluences the reaggregation behavior and dispersion stabilityof FGSs. Contrary to previous studies with graphitic carbonparticles, we find that SDS concentrations 2 orders ofmagnitude lower than the csac are sufficient to achieve colloidalstability.
■ METHODSProduction of FGSs. Graphite oxide (GO) was prepared
according to the Staudenmaier method,33 as detailed elsewhere,using graphite powder sized at ∼45 μm (grade 230, AsburyCarbons).1,2 The GO was placed at the bottom of a fused silicatube (Technical Glass Products) and dried overnight under flowingnitrogen. The tube was evacuated and purged with ultrahigh-purityargon (Air Products) three times. The tube was evacuated once moreand, while GO was still under vacuum, thermal reduction andexfoliation of GO were simultaneously carried out by placing the tubein a three-zone tube furnace (Lindberg/Blue M, SPX Thermal ProductSolutions), set to a temperature of 1100 °C, for 60 s. The as-producedFGS powder had a surface area of ∼690 m2/g, as determined fromnitrogen adsorption (Gemini V, Micrometrics Instruments Corpo-ration) by the Brunauer, Emmett, and Teller (BET) method.34 Themolar carbon-to-oxygen ratio (C/O) of the FGSs was ∼18, measuredby energy dispersive X-ray spectroscopy (INCA x-act, OxfordInstruments, attached to a Vega 1 scanning electron microscope,Tescan USA).
Dispersion of FGSs in Aqueous SDS Solutions. SDS solutionswere prepared by dissolving SDS (≥ 99% purity, used as-received,Sigma Aldrich) in deionized (DI) water (Picopure 2 UV Plus system,Hydro Service and Supplies, Inc.) at concentrations ranging from 0 to10 mM. This range includes the concentration at which SDS forms anadsorbed monolayer at full surface coverage on FGSs (∼18 μM),25 thecsac for SDS on FGSs (∼1.8 mM),25 and the cmc of SDS in water(∼8.1 mM).35−37 To 50 mL of each SDS solution, we added 5 mg ofFGSs and performed ultrasonication at ∼300 W (VCX 750 ultrasonicprocessor unit, Sonics & Materials, Inc.) for 1 h while cooling themixture in an ice bath. One sample was prepared at each SDSconcentration.
After sonication, an aliquot of each sample was diluted 1:9 with anSDS solution of the same concentration as present in the sample, andits transmittance was measured at 400 nm with UV−vis spectroscopy(Evolution 300 spectrometer, Thermo Scientific) to determine theconcentration of FGSs in suspension.38 We neglect scattering effectsand assume that the optical properties of FGSs in suspension areindependent of sheet size as well as aggregate size and morphology. As
Figure 1. Schematic representation of the four stages of SDS adsorption onto functionalized graphene: (i) adsorption of isolated surfactantmonomers, (ii) adsorption of a surfactant monolayer, (iii) formation of hemi-cylindrical surface micelles, and (iv) formation of micelles in bulksolution. Also indicated are the critical surface aggregation concentration (csac) and the critical micelle concentration (cmc). The functionalizedgraphene schematic shows oxygen functionalities (red), 5−8−5 and 5−7−7−5 topological defects (yellow), and lattice vacancies (pink).
Langmuir Article
dx.doi.org/10.1021/la4035326 | Langmuir XXXX, XXX, XXX−XXXB

dispersions of pristine graphene display a linear relationship betweenconcentration and absorbance according to the Beer−Lambert law,38herein we report sample absorbance, which we assume to beproportional to FGS concentration. The state of FGS aggregation ineach sample was determined with optical microscopy imaging(Axioplan 2, Carl Zeiss Microscopy) using a water immersionobjective (C-Apochromat 63×/1.2 W Korr, Carl Zeiss Microscopy).To accomplish this, a poly(dimethylsiloxane) (PDMS) spacer ringwith an inner diameter of ∼7 mm and thickness of ∼1 mm was placedon a microscope slide. The chamber was filled with ∼50 μL ofundiluted suspension sample and enclosed with a cover glass.The suspensions were then centrifuged for 1 h at 3000 rpm (IEC
Centra GP8R with 218 A rotor) to accelerate any potentialsedimentation, and optical images and UV−vis absorbance measure-ments were taken again. The samples were left undisturbed for 4 days,after which centrifugation and subsequent absorbance measurementswere repeated. After 1 year, the samples were centrifuged once more,and their absorbances were measured. All samples were maintained atroom temperature for the duration of the experiment.
■ RESULTS AND DISCUSSION
Dispersions of FGSs in Aqueous SDS Solutions. Figure2 shows optical microscopy images of FGS suspensionsprepared in aqueous SDS solutions at various SDS concen-trations [SDS], both a few minutes after sonication (Figure 2a)and after the samples are first centrifuged (Figure 2b). In theabsence of SDS, i.e., in DI water, shortly after sonication theFGSs are aggregated in the form of ramified structures that area few tens of micrometers in size (Figure 2a). Similar FGSstructures are observed at [SDS] = 5 μM; however, in this case,the aggregates appear to be less ramified. At [SDS] = 10 μMSDS, the FGSs are aggregated in structures ∼10 μm in size thatappear significantly more compact than those at lower [SDS];additionally, particles ∼1 μm in size and smaller are observed.In all the samples with [SDS] > 10 μM, aggregated FGSs areabsent; instead, particles that are ∼1 μm and smaller areimaged. In addition to the structures described above, darkstructures that are a few micrometers in size are observed in allthe samples (see Supporting Information [SI], Figure S1). Incontrast to the aggregates observed in DI water and in low[SDS] solutions (≤ 10 μM), these dark structures appear ratherdense, as indicated by their strong optical absorbance (i.e., darkcolor in the optical images).After the first centrifugation, the ramified aggregates already
observed in DI water prior to centrifugation are still present in
suspension (Figure 2b). In the 5 μM SDS sample, the less-ramified (i.e., denser) aggregates have settled out; instead, onlyramified aggregates that appear similar to those observed in DIwater (presumably present before centrifugation) are observedin suspension. In the 10 μM SDS sample, the more-compactaggregates appear to have settled out, and in the samples with[SDS] ≥ 10 μM, the particles that are ∼1 μm and smallerremain in suspension. Additionally, the dark structures withdiameters of several μm that were observed in all the samples(Figure S1) are absent after centrifugation; these were likelydense FGS aggregates that could not be dispersed during theinitial sonication. From the optical images of the suspensionsshown in Figure 2a, we thus distinguish five types of FGSstructures based on their morphologies: (i) highly ramifiedaggregates, (ii) less-ramified aggregates, (iii) large (> 10 μm)compact aggregates, (iv) dispersed single- or few-layer FGSs,and (v) hard aggregates a few μm in size. It is evident that,except for the hard aggregates, the morphology of the FGSstructures is determined by [SDS] and thus by the extent ofSDS adsorption on FGSs.Optical images, however, only provide qualitative informa-
tion about the state of dispersion in each sample, and thus, weturn to UV−vis absorbance for a quantitative analysis of thedispersion behavior. Figure 3 shows sample absorbances shortlyafter dispersion by sonication (blue curve) and after eachcentrifugation of the samples 1 h, 4 days, and 1 year later.Shortly after sonication, the absorbances of the suspensions areapproximately equal (0.63 ± 0.02), confirming that approx-imately equal amounts of FGSs have been suspended in eachsample, independent of [SDS]. Following centrifugation 1 h, 4days, and 1 year after sonication, the absorbance in almost allthe samples is decreased. The largest decrease is observed for[SDS] ≤ 20 μM, with a notable minimum at 10 μM that formsduring the first centrifugation and deepens as a result of thesecond centrifugation. After centrifugation one year later, theabsorbance of the DI water sample is 0.34; as [SDS] increases,the sample absorbance decreases to 0.04 at 5 μM and remainsuniformly low up to 20 μM SDS, indicating that the majority ofthe FGSs have settled. In contrast, at [SDS] ≥ 40 μM, theabsorbances decrease to a lesser degree. Even after a year, theaverage absorbance is 0.56 ± 0.07 following centrifugation,indicating that at these concentrations ∼87% of the initial FGSsremain in suspension. Given the otherwise consistent trends in
Figure 2. Representative optical microscope images of FGSs dispersed at a concentration of 0.1 mg/mL in aqueous SDS solutions (a) aftersonication and (b) after the first centrifugation (1 h later); [SDS] in each sample (from left to right): 0 μM (DI water), 5 μM, 10 μM, 20 μM, 100μM, and 10 mM; the scale bar is the same for all images.
Langmuir Article
dx.doi.org/10.1021/la4035326 | Langmuir XXXX, XXX, XXX−XXXC
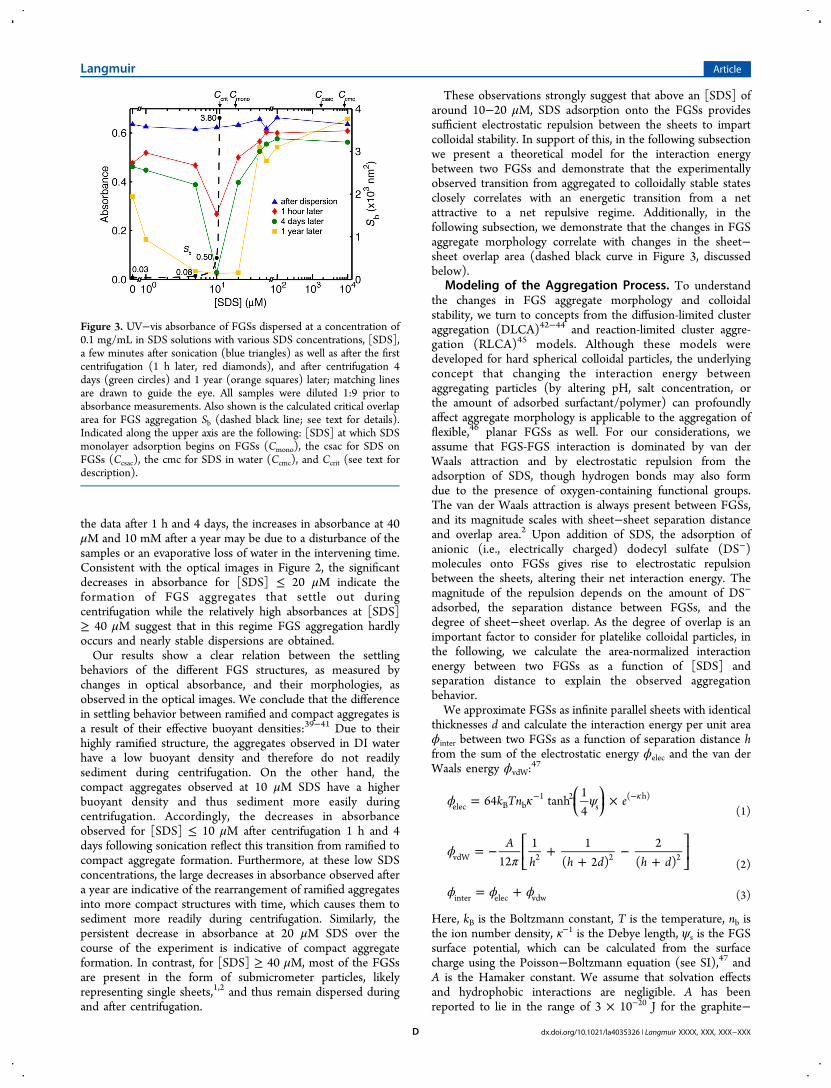
the data after 1 h and 4 days, the increases in absorbance at 40μM and 10 mM after a year may be due to a disturbance of thesamples or an evaporative loss of water in the intervening time.Consistent with the optical images in Figure 2, the significantdecreases in absorbance for [SDS] ≤ 20 μM indicate theformation of FGS aggregates that settle out duringcentrifugation while the relatively high absorbances at [SDS]≥ 40 μM suggest that in this regime FGS aggregation hardlyoccurs and nearly stable dispersions are obtained.Our results show a clear relation between the settling
behaviors of the different FGS structures, as measured bychanges in optical absorbance, and their morphologies, asobserved in the optical images. We conclude that the differencein settling behavior between ramified and compact aggregates isa result of their effective buoyant densities:39−41 Due to theirhighly ramified structure, the aggregates observed in DI waterhave a low buoyant density and therefore do not readilysediment during centrifugation. On the other hand, thecompact aggregates observed at 10 μM SDS have a higherbuoyant density and thus sediment more easily duringcentrifugation. Accordingly, the decreases in absorbanceobserved for [SDS] ≤ 10 μM after centrifugation 1 h and 4days following sonication reflect this transition from ramified tocompact aggregate formation. Furthermore, at these low SDSconcentrations, the large decreases in absorbance observed aftera year are indicative of the rearrangement of ramified aggregatesinto more compact structures with time, which causes them tosediment more readily during centrifugation. Similarly, thepersistent decrease in absorbance at 20 μM SDS over thecourse of the experiment is indicative of compact aggregateformation. In contrast, for [SDS] ≥ 40 μM, most of the FGSsare present in the form of submicrometer particles, likelyrepresenting single sheets,1,2 and thus remain dispersed duringand after centrifugation.
These observations strongly suggest that above an [SDS] ofaround 10−20 μM, SDS adsorption onto the FGSs providessufficient electrostatic repulsion between the sheets to impartcolloidal stability. In support of this, in the following subsectionwe present a theoretical model for the interaction energybetween two FGSs and demonstrate that the experimentallyobserved transition from aggregated to colloidally stable statesclosely correlates with an energetic transition from a netattractive to a net repulsive regime. Additionally, in thefollowing subsection, we demonstrate that the changes in FGSaggregate morphology correlate with changes in the sheet−sheet overlap area (dashed black curve in Figure 3, discussedbelow).
Modeling of the Aggregation Process. To understandthe changes in FGS aggregate morphology and colloidalstability, we turn to concepts from the diffusion-limited clusteraggregation (DLCA)42−44 and reaction-limited cluster aggre-gation (RLCA)45 models. Although these models weredeveloped for hard spherical colloidal particles, the underlyingconcept that changing the interaction energy betweenaggregating particles (by altering pH, salt concentration, orthe amount of adsorbed surfactant/polymer) can profoundlyaffect aggregate morphology is applicable to the aggregation offlexible,46 planar FGSs as well. For our considerations, weassume that FGS-FGS interaction is dominated by van derWaals attraction and by electrostatic repulsion from theadsorption of SDS, though hydrogen bonds may also formdue to the presence of oxygen-containing functional groups.The van der Waals attraction is always present between FGSs,and its magnitude scales with sheet−sheet separation distanceand overlap area.2 Upon addition of SDS, the adsorption ofanionic (i.e., electrically charged) dodecyl sulfate (DS−)molecules onto FGSs gives rise to electrostatic repulsionbetween the sheets, altering their net interaction energy. Themagnitude of the repulsion depends on the amount of DS−
adsorbed, the separation distance between FGSs, and thedegree of sheet−sheet overlap. As the degree of overlap is animportant factor to consider for platelike colloidal particles, inthe following, we calculate the area-normalized interactionenergy between two FGSs as a function of [SDS] andseparation distance to explain the observed aggregationbehavior.We approximate FGSs as infinite parallel sheets with identical
thicknesses d and calculate the interaction energy per unit areaϕinter between two FGSs as a function of separation distance hfrom the sum of the electrostatic energy ϕelec and the van derWaals energy ϕvdW:
47
ϕ κ ψ= × κ− −⎜ ⎟⎛⎝
⎞⎠k Tn e64 tanh
14elec B b
1 2s
( h)
(1)
ϕπ
= − ++
−+
⎡⎣⎢
⎤⎦⎥
Ah h d h d121 1
( 2 )2
( )vdW 2 2 2(2)
ϕ ϕ ϕ= +inter elec vdw (3)
Here, kB is the Boltzmann constant, T is the temperature, nb isthe ion number density, κ−1 is the Debye length, ψs is the FGSsurface potential, which can be calculated from the surfacecharge using the Poisson−Boltzmann equation (see SI),47 andA is the Hamaker constant. We assume that solvation effectsand hydrophobic interactions are negligible. A has beenreported to lie in the range of 3 × 10⁻²⁰ J for the graphite−
Figure 3. UV−vis absorbance of FGSs dispersed at a concentration of0.1 mg/mL in SDS solutions with various SDS concentrations, [SDS],a few minutes after sonication (blue triangles) as well as after the firstcentrifugation (1 h later, red diamonds), and after centrifugation 4days (green circles) and 1 year (orange squares) later; matching linesare drawn to guide the eye. All samples were diluted 1:9 prior toabsorbance measurements. Also shown is the calculated critical overlaparea for FGS aggregation Sb (dashed black line; see text for details).Indicated along the upper axis are the following: [SDS] at which SDSmonolayer adsorption begins on FGSs (Cmono), the csac for SDS onFGSs (Ccsac), the cmc for SDS in water (Ccmc), and Ccrit (see text fordescription).
Langmuir Article
dx.doi.org/10.1021/la4035326 | Langmuir XXXX, XXX, XXX−XXXD

water−graphite system,48 and we use this value as anapproximation for FGS−water−FGS. Though the value of Adecreases with h for separations of < 2 nm,48 for our purposeswe assume that A remains constant. On the basis of previousthickness measurements by atomic force microscopy (AFM),1,2
we take d to be 1 nm. ψs depends on the surface charge density,which we take to be solely due to DS− adsorbed on FGSs andestimate from conductometric titrations of aqueous FGSsuspensions,25 assuming that FGSs in suspension have asurface area of 1850 m2/g as reported by McAllister et al.2 Sincethe material used herein came from a different batch than theFGSs used by McAllister et al.,2 the effective surface areas maydiffer; however, this does not significantly affect the outcome(see SI for details on ψs). Additionally, to account for the stericbarrier from an adsorbed SDS monolayer,49 we assume a hardboundary at h = 1.5 nm, which is about twice the width of ahydrocarbon chain as estimated from its van der Waals radius.50
In the following, we consider both the interaction energies andkinetics associated with transitions between the dispersed (h →∞) and aggregated (h = 1.5 nm) states for the [SDS] range inwhich FGS aggregation is observed. Our calculations are basedonly on energetics and do not include entropic effects, althoughwe recognize that a model based on free energy minimizationwould be more accurate.47,51
We consider two parallel FGSs in suspension that approachone another with an area of overlap, S, and calculate the totalinteraction energy between the two FGSs as a function of hfrom ϕtotal = S·ϕinter. We assume that the adsorbed surfactant isdistributed homogeneously over the FGSs, and that only theoverlapping areas contribute to ϕtotal. These are very restrictiveassumptions. In reality, FGSs are flexible46 and randomlyoriented in suspension, and adsorbed SDS is not necessarilyhomogeneously distributed; also, edge effects likely contributeto ϕtotal, as Coulombic interactions decay slowly with distance.Additionally, SDS-bare regions are expected to be present onFGSs, effected by incomplete SDS adsorption onto sp2-hybridized regions, by defects and functional groups of FGSsonto which SDS does not adsorb,25,52 or by surfactant moleculeexchange between the bulk and the surface, resulting influctuating coverage.53 Consequently, the calculated energiespresented in the following should not be considered asquantitatively accurate but should instead serve as order-of-magnitude estimates of general trends.While two FGSs can interact with any S up to the value of
the sheet size (∼1 μm2), we first consider an overlap area S =100 nm2 for the following calculations, as this yields ϕtotal onthe order of kBT and facilitates the discussion of conceptspertaining to aggregation kinetics. We then discuss theenergetics of FGS aggregation and consider the role of S, andin particular the changes in S, in the subsequent calculations.ϕtotal is plotted as a function of h in Figure 4a for three SDS
concentrations: 0, 5, and 50 μM. In the following, we firstdescribe how the energy landscape changes as a function of[SDS] and then discuss how these changes affect FGSdispersion behavior. In all cases, the total interaction energyat infinite separation, ϕtotal,∞, equals 0 (not shown in Figure 4);thus, the total interaction energy at the h = 1.5 nm stericbarrier, ϕtotal,1.5, represents the change in energy from infiniteseparation to an aggregated state. In DI water, i.e., when [SDS]= 0 μM, electrostatic repulsion between FGSs is assumed to beabsent, and thus, there is no kinetic barrier for aggregation;since ϕtotal,1.5 < 0, there is a net attraction at the steric barrier.As [SDS] increases to 5 μM, the adsorption of SDS introduces
electrostatic repulsion between FGSs, creating a barrier foraggregation, Eagg; the energy barrier for deaggregation Edeagg,however, is larger as Edeagg = Eagg − ϕtotal,1.5. Increasing [SDS] to50 μM, electrostatic repulsion from adsorbed SDS causes Eaggto exceed Edeagg as ϕtotal,1.5 > 0; now, there is a net repulsion atthe steric barrier. To further illustrate the influence of SDSadsorption on the energy landscape between two FGSs, inFigure 4b we show the dependence of Eagg and Edeagg on [SDS].We note that at a critical SDS concentration of Ccrit ≈ 11 μM,Eagg and Edeagg are equal to one another, and ϕtotal,1.5 = 0. Thus,Ccrit signifies a transition from a net attractive to a net repulsiveregime and, as demonstrated below, also indicates the transtionfrom persistently aggregated states to stably dispersedsuspensions.In the absence of external energy input (e.g., from
ultrasonication or shear flow), FGSs will aggregate only if thethermal energy is strong enough for FGSs to overcome Eagg. Todetermine if an aggregated state will persist, we considervariations in the rate of aggregation versus the rate ofdeaggregation, as done in previous studies of aggregationtransitions.44,54−57 The basic concept is that systems will evolvetoward a persistently aggregated state only if the rate ofaggregation, ragg ∝ exp[−Eagg/(kBT)],
54−57 exceeds the rate of
Figure 4. (a) The total interaction energy Φtotal (for 100 nm2 overlapin units of kBT) between FGSs as a function of separation distance h atSDS concentrations [SDS] of 0 μM (red), 5 μM (blue), and 50 μM(black). The dashed blue line indicates the steric barrier from adsorbedSDS at h = 1.5 nm. Indicated for the 5 μM SDS curve: the change inenergy between the dispersed (h → ∞) and aggregated (h = 1.5 nm)states Φtotal,1.5, and the energy barriers for aggregation Eagg anddeaggregation Edeagg. (b) The dependence of Eagg and Edeagg on [SDS].The critical SDS concentration Ccrit at which the barriers are equal isindicated. All energies were calculated assuming an overlap area S =100 nm2.
Langmuir Article
dx.doi.org/10.1021/la4035326 | Langmuir XXXX, XXX, XXX−XXXE

deaggregation, rdeagg ∝ exp[−Edeagg/(kBT)].54−57 Thus at 0 μMSDS, ragg ≫ rdeagg as Eagg = 0 and the sticking probability forcolliding FGSs, which can be expressed simplistically as σ = (1+ rdeagg/ragg)
−1,55,57 is assumed to be close to 1, implying thatFGSs aggregate upon contact. Indeed, the highly ramifiedaggregates observed in DI water (Figure 2a) are reminiscent ofthe ramified structures that form when initially dispersedspherical colloids aggregate in the absence of interparticlerepulsion, as described by modified versions of the DLCAmodel.44,58 This suggests that even in the absence of SDS, theFGSs were in a dispersed state during and immediately aftersonication, and that the highly ramified structures formedthrough reaggregation of initially dispersed FGSs.As [SDS] increases to 5 μM, Eagg grows relative to Edeagg,
causing σ to decrease; thus, colliding FGSs do not alwaysremain aggregated and can restructure toward denser states.44
The less-ramified aggregates observed at 5 μM SDS (Figure 2a)are remeniscent of decreased branching that occurs when thereis a finite probability that thermal energy can cause primaryparticles to repeatedly aggregate and deaggregate;62 this enablesaggregate restructuring via an increase in the overlap area S, asdiscussed below.44,58 As [SDS] increases to Ccrit, ragg approachesrdeagg since Eagg approaches Edeagg. The compact aggregatesobserved at 10 μM (Figure 2a), i.e., at an [SDS] close to ourestimate of Ccrit, resemble the aggregation of initially dispersedspherical colloids into compact structures under conditions inwhich the two energy barriers are nearly equal.44,58
Furthermore, as σ ≈ 0.5 at Ccrit, the likelihood of aggregaterestructuring is at a maximum.As [SDS] exceeds Ccrit, ϕtotal,1.5 becomes positive, and Eagg is
now greater than Edeagg; thus, rdeagg exceeds ragg, and σapproaches zero. From a kinetics point of view, we thereforetake Ccrit to be the onset of the transition from persistentlyaggregated states to stably dispersed suspensions. Forcomparison, Ccrit is indicated on the upper axis in Figure 3along with the value of [SDS] at which the adsorbed surfactantmonolayer reaches full coverage on FGSs (Cmono ≈ 18 μM),25
the csac for SDS on FGSs (Ccsac ≈ 1.8 mM),25 and the cmc forSDS in water (Ccmc ≈ 8.1 mM).35−37
Turning now to the energetics of FGS aggregation, fornegative values of ϕtotal,1.5 a binding energy Eb = −ϕtotal,1.5 canbe defined. While FGSs in suspension have a Maxwell−Boltzmann thermal energy distribution, we first consider aconstant Eb on the order of kBT to gain insight on the role of Sin FGS aggregation. For [SDS] < Ccrit, i.e., when ϕtotal,1.5 < 0and stable aggregates are expected to form, we calculate thecritical overlap area Sb that results in Eb = kBT (Figure 3, dashedblack line). Conceptually, at a given [SDS], Sb is the minimumoverlap area that FGSs with thermal energy kBT must collidewith for aggregation to occur (i.e., Eb > kBT when S > Sb). Wenote that changing Eb in this calculation simply scales Sbproportionally, leaving the curve qualitatively unchanged. At 0μM SDS, Sb ≈ 30 nm2 and as [SDS] increases toward Ccrit, Sbincreases to ∼500 nm2 at 10 μM then rises dramatically to∼3800 nm2 at 10.9 μM. Based on our calculation of Sb, as[SDS] increases and Eb decreases, a larger degree of FGSoverlap is expected, which is consistent with the increasinglycompact aggregate structures observed in Figure 2 andcorroborates the analysis of Figure 4 discussed above.Accordingly, as settling behavior changes with aggregatemorphology,39−41 the decrease in UV−vis absorbance observedas [SDS] increases from zero to Ccrit after the first
centrifugation (Figure 3) reflects the transition from ramifiedto compact aggregate formation.Due to the thermal energy distribution, however, random
thermal fluctuations may be large enough for aggregated FGSsto overcome Edeagg, enabling them to restructure by changing S.We note that a decrease in S results in a smaller Edeagg and thusa higher rdeagg; conversely, aggregates with a larger S have alower rdeagg and are more likely to survive. Furthermore, assystems tend toward their lowest-energy state, at a given [SDS]there is also an energetic driving force for aggregated FGSs torestructure by increasing S and forming more compactstructures, as this acts to decrease ϕtotal,1.5 (i.e., increase Eb).Indeed, the progressive decrease in absorbance that is observedfor [SDS] < Ccrit (Figure 3) is indicative of the rearrangementof ramified aggregates into more compact structures on a timescale of days (for [SDS] → Ccrit) through months (for [SDS]→ 0), enabling them to sediment during subsequentcentrifugations. Although aggregate restructuring via anincrease in S is unique to sheetlike particles (as spheres onlymake point contacts), it is analogous to the restructuring ofhard spherical colloids via an increase in coordinationnumber.46
At values of [SDS] slightly above Ccrit (but < 40 μM), thedecrease in UV−vis absorbance over time (Figure 3) impliesthat persistent FGS aggregation does occur, though the rateappears to decrease as [SDS] increases. This observationconflicts with the positive ϕtotal,1.5 values calculated for this[SDS] range, and the discrepancy may be due to theapproximations in our model, as discussed below. At [SDS]≥ 40 μM, while the decrease in average absorbance followingthe first centrifugation is attributed to the settling of hardaggregates, after the second centrifugation the averageabsorbance decreases slightly further. This is possibly due toa small degree of FGS reaggregation, however it is most likelydue to the settling of hard aggregates that did not sedimentduring the first centrifugation. Indeed, after a year the averageabsorbance does not decrease further by an appreciableamount, especially considering the large drop in absorbanceobserved after a year for [SDS] < 40 μM, suggesting that nofurther reaggregation occurred.While it is striking that our calculated value of Ccrit lies close
to the experimentally observed minimum in the absorbance andappears to mark the transition from the aggregated structures tothe dispersed state, we are cautious not to overinterpret thiscorrelation. Due to the many assumptions and approximationsthat were made, our calculations of ϕinter, ϕtotal, and Sb are notquantitatively accurate. As such, one possible explanation forFGS aggregation above Ccrit is that our calculated value of ∼11μM SDS for the critical concentration is too low and that thetransition from negative to positive ϕtotal,1.5 actually occurs at ahigher [SDS]. Another possible explanation could be that at[SDS] between Ccrit and 40 μM, thermal energy may be able toovercome the increase in energy associated with aggregation, asthe magnitudes of both ϕtotal,1.5 and Eagg are on the order of kBT.In particular, considering that FGSs are flexible and also couldinitially aggregate in more geometrically complex configurationsthan considered here (e.g., edge on plane), it is plausible thatkinetically trapped aggregates may form. At [SDS] ≥ 40 μM,though, as ϕtotal,1.5 grows increasingly positive and Eagg ≫ kBT,aggregation is likely prevented both energetically and kineti-cally, such that dispersed FGSs are electrostatically stabilized.
Langmuir Article
dx.doi.org/10.1021/la4035326 | Langmuir XXXX, XXX, XXX−XXXF
■ CONCLUSIONWe have shown that SDS concentrations ≥ 40 μM, i.e., abovethe onset of monolayer adsorption on FGSs, are sufficient toachieve colloidal stability in aqueous FGS dispersions. Usingoptical microscopy and UV−vis absorbance measurements inconjunction with a simple interaction energy model, wedemonstrated the influence of SDS adsorption on theaggregation of platelike FGSs and found that aggregatemorphology (and thus settling behavior) depends strongly onSDS concentration: In the absence of the surfactant, due to thelack of electrostatic repulsion, van der Waals attractiondominates and causes FGSs to form highly ramified aggregates.As the SDS concentration is increased, the growing repulsionfrom adsorbed SDS causes FGS aggregates to develop a morecompact structure due to an increase in sheet−sheet overlaparea. Additionally, over time, ramified FGS aggregatesrestructure into more compact structures via an increase inthe overlap area. Above a critical SDS concentration, we findthat the dispersed state becomes increasingly stabilized, and thegrowing kinetic barrier eventually prevents the reaggregation ofFGSs for at least a year. Finally, while the formation of stabledispersions of FGSs in aqueous media is important for manyapplications such as the processing of graphene−metal oxidenanocomposites, graphene−polymer composites, and highsurface area tapes, we do not assume that a well-dispersedstate is always optimal. Certainly, for applications in whichcontrol of FGS aggregate morphology is desired, the findingspresented herein are relevant.
■ ASSOCIATED CONTENT*S Supporting InformationOptical images of hard aggregates and details regarding theinfluence of FGS surface area on the calculations. This materialis available free of charge via the Internet at http://pubs.acs.org.
■ AUTHOR INFORMATIONCorresponding Author*E-mail: [email protected]. Telephone: 609-258-4393.NotesThe authors declare no competing financial interest.
■ ACKNOWLEDGMENTSThis work was supported by the Pacific Northwest NationalLaboratory (operated for the United States Department ofEnergy by Battelle) under Grant Number DE-AC05-76RL01830.
■ REFERENCES(1) Schniepp, H. C.; Li, J.-L.; McAllister, M. J.; Sai, H.; Herrera-Alonso, M.; Adamson, D. H.; Prud’homme, R. K.; Car, R.; Saville, D.A.; Aksay, I. A. Functionalized Single Graphene Sheets Derived fromSplitting Graphite Oxide. J. Phys. Chem. B 2006, 110, 8535−8539.(2) McAllister, M. J.; Li, J.-L.; Adamson, D. H.; Schniepp, H. C.;Abdala, A. A.; Liu, J.; Herrera-Alonso, M.; Milius, D. L.; Car, R.;Prud’homme, R. K.; Aksay, I. A. Single Sheet Functionalized Grapheneby Oxidation and Thermal Expansion of Graphite. Chem. Mater. 2007,19, 4396−4404.(3) Stankovich, S.; Piner, R. D.; Chen, X.; Wu, N.; Nguyen, S. T.;Ruoff, R. S. Stable Aqueous Dispersions of Graphitic Nanoplatelets viathe Reduction of Exfoliated Graphite Oxide in the Presence ofPoly(Sodium 4-Styrenesulfonate). J. Mater. Chem. 2006, 16, 155−158.(4) Wang, D.; Choi, D.; Li, J.; Yang, Z.; Nie, Z.; Kou, R.; Hu, D.;Wang, C.; Saraf, L. V.; Zhang, J.; Aksay, I. A.; Liu, J. Self-Assembled
TiO2−Graphene Hybrid Nanostructures for Enhanced Li-IonInsertion. ACS Nano 2009, 3, 907−914.(5) Wu, Z.-S.; Ren, W.; Wen, L.; Gao, L.; Zhao, J.; Chen, Z.; Zhou,G.; Li, F.; Cheng, H.-M. Graphene Anchored with CO3O4Nanoparticles as Anode of Lithium Ion Batteries with EnhancedReversible Capacity and Cyclic Performance. ACS Nano 2010, 4,3187−3194.(6) Wang, D.; Kou, R.; Choi, D.; Yang, Z.; Nie, Z.; Li, J.; Saraf, L. V.;Hu, D.; Zhang, J.; Graff, G. L.; Liu, J.; Pope, M. A.; Aksay, I. A.Ternary Self-Assembly of Ordered Metal Oxide−Graphene Nano-composites for Electrochemical Energy Storage. ACS Nano 2010, 4,1587−1595.(7) Zhu, X.; Zhu, Y.; Murali, S.; Stoller, M. D.; Ruoff, R. S.Nanostructured Reduced Graphene Oxide/Fe2O3 Composite as aHigh-Performance Anode Material for Lithium Ion Batteries. ACSNano 2011, 5, 3333−3338.(8) Wang, J. C.; Wang, X. B.; Xu, C. H.; Zhang, M.; Shang, X. P.Preparation of Graphene/Poly(Vinyl Alcohol) Nanocomposites withEnhanced Mechanical Properties and Water Resistance. Polym. Int.2011, 60, 816−822.(9) Bao, C. L.; Guo, Y. Q.; Song, L.; Hu, Y. Poly(Vinyl Alcohol)Nanocomposites Based on Graphene and Graphite Oxide: AComparative Investigation of Property and Mechanism. J. Mater.Chem. 2011, 21, 13942−13950.(10) Ozbas, B.; O’Neill, C. D.; Register, R. A.; Aksay, I. A.;Prud’homme, R. K.; Adamson, D. H. Multifunctional ElastomerNanocomposites with Functionalized Graphene Single Sheets. J.Polym. Sci., Part B: Polym. Phys. 2012, 50, 910−916.(11) Verdejo, R.; Barroso-Bujans, F.; Rodriguez-Perez, M. A.; de Saja,J. A.; Lopez-Manchado, M. A. Functionalized Graphene Sheet FilledSilicone Foam Nanocomposites. J. Mater. Chem. 2008, 18, 2221−2226.(12) Stankovich, S.; Dikin, D. A.; Dommett, G. H. B.; Kohlhaas, K.M.; Zimney, E. J.; Stach, E. A.; Piner, R. D.; Nguyen, S. T.; Ruoff, R. S.Graphene-Based Composite Materials. Nature 2006, 442, 282−286.(13) Sabourin, J. L.; Dabbs, D. M.; Yetter, R. A.; Dryer, F. L.; Aksay,I. A. Functionalized Graphene Sheet Colloids for Enhanced Fuel/Propellant Combustion. ACS Nano 2009, 3, 3945−3954.(14) Liu, L. M.; Car, R.; Selloni, A.; Dabbs, D. M.; Aksay, I. A.;Yetter, R. A. Enhanced Thermal Decomposition of Nitromethane onFunctionalized Graphene Sheets: ab initio Molecular DynamicsSimulations. J. Am. Chem. Soc. 2012, 134, 19011−19016.(15) Bagri, A.; Mattevi, C.; Acik, M.; Chabal, Y. J.; Chhowalla, M.;Shenoy, V. B. Structural Evolution During the Reduction ofChemically Derived Graphene Oxide. Nat. Chem. 2010, 2, 581−587.(16) Coleman, J. N. Liquid-Phase Exfoliation of Nanotubes andGraphene. Adv. Funct. Mater. 2009, 19, 3680−3695.(17) Villar-Rodil, S.; Paredes, J. I.; Martínez-Alonso, A.; Tascon, J. M.D. Preparation of Graphene Dispersions and Graphene-PolymerComposites in Organic Media. J. Mater. Chem. 2009, 19, 3591−3593.(18) Pham, V. H.; Dang, T. T.; Cuong, T. V.; Hur, S. H.; Kong, B. S.;Kim, E. J.; Chung, J. S. Synthesis of Highly Concentrated Suspensionof Chemically Converted Graphene in Organic Solvents: Effect ofTemperature on the Extent of Reduction and Dispersibility. Korean J.Chem. Eng. 2012, 29, 1−6.(19) Korkut, S.; Roy-Mayhew, J. D.; Dabbs, D. M.; Milius, D. L.;Aksay, I. A. High Surface Area Tapes Produced with FunctionalizedGraphene. ACS Nano 2011, 5, 5214−5222.(20) Daimon, M.; Masumura, A. Measurement of the RefractiveIndex of Distilled Water from the Near-Infrared Region to theUltraviolet Region. Appl. Opt. 2007, 46, 3811−3820.(21) Jung, I.; Vaupel, M.; Pelton, M.; Piner, R.; Dikin, D. A.;Stankovich, S.; An, J.; Ruoff, R. S. Characterization of ThermallyReduced Graphene Oxide by Imaging Ellipsometry. J. Phys. Chem. C2008, 112, 8499−8506.(22) Yang, D.; Velamakanni, A.; Bozoklu, G.; Park, S.; Stoller, M.;Piner, R. D.; Stankovich, S.; Jung, I.; Field, D. A.; Ventrice, C. A., Jr.Chemical Analysis of Graphene Oxide Films after Heat and ChemicalTreatments by X-Ray Photoelectron and Micro-Raman Spectroscopy.Carbon 2009, 47, 145−152.
Langmuir Article
dx.doi.org/10.1021/la4035326 | Langmuir XXXX, XXX, XXX−XXXG
(23) Konkena, B.; Vasudevan, S. Understanding Aqueous Dispersi-bility of Graphene Oxide and Reduced Graphene Oxide through pKa
Measurements. J. Phys. Chem. Lett. 2012, 3, 867−872.(24) Li, D.; Muller, M. B.; Gilje, S.; Kaner, R. B.; Wallace, G. G.Processable Aqueous Dispersions of Graphene Nanosheets. Nat.Nanotechnol. 2008, 3, 101−105.(25) Hsieh, A.; Punckt, C.; Korkut, S.; Aksay, I. A. Adsorption ofSodium Dodecyl Sulfate on Functionalized Graphene Measured byConductometric Titration. J. Phys. Chem. B 2013, 117, 7950−7958.(26) Greenwood, F, G.; Parfitt, G, D.; Picton, N, H.; Wharton, D, G.,Adsorption and Wetting Phenomena Associated with Graphon inAqueous Surfactant Solutions. In Adsorption from Aqueous Solution,American Chemical Society: 1968; Vol. 79, pp 135−144.(27) Kawasaki, H.; Ban, K.; Maeda, H. Investigation of the Stability ofGraphite Particle Dispersion and the Hemimicelle Formation Processat Graphite/Solution Interfaces Using Atomic Force Microscopy. J.Phys. Chem. B 2004, 108, 16746−16752.(28) Lotya, M.; Hernandez, Y.; King, P. J.; Smith, R. J.; Nicolosi, V.;Karlsson, L. S.; Blighe, F. M.; De, S.; Wang, Z.; McGovern, I. LiquidPhase Production of Graphene by Exfoliation of Graphite inSurfactant/Water Solutions. J. Am. Chem. Soc. 2009, 131, 3611−3620.(29) Green, A. A.; Hersam, M. C. Solution Phase Production ofGraphene with Controlled Thickness via Density Differentiation. NanoLett. 2009, 9, 4031−4036.(30) Smith, R. J.; Lotya, M.; Coleman, J. N. The Importance ofRepulsive Potential Barriers for the Dispersion of Graphene UsingSurfactants. New J. Phys. 2010, 12, 125008.(31) Fernandez-Merino, M. J.; Paredes, J.; Villar-Rodil, S.; Guardia,L.; Solís-Fernandez, P.; Salinas-Torres, D.; Cazorla-Amoros, D.;Morallon, E.; Martínez-Alonso, A.; Tascon, J. Investigating theInfluence of Surfactants on the Stabilization of Aqueous ReducedGraphene Oxide Dispersions and the Characteristics of TheirComposite Films. Carbon 2012, 50, 3184−3194.(32) Pu, N. W.; Wang, C. A.; Liu, Y. M.; Sung, Y.; Wang, D. S.; Ger,M. D. Dispersion of Graphene in Aqueous Solutions with DifferentTypes of Surfactants and the Production of Graphene Films by Sprayor Drop Coating. J. Taiwan Inst. Chem. Eng. 2012, 43, 140−146.(33) Staudenmaier, L. Verfahren zur Darstellung der Graphitsaure.Ber. Dtsch. Chem. Ges. 1898, 31, 1481−1487.(34) Brunauer, S.; Emmett, P. H.; Teller, E. Adsorption of Gases inMultimolecular Layers. J. Am. Chem. Soc. 1938, 60, 309−319.(35) Williams, R.; Phillips, J.; Mysels, K. The Critical MicelleConcentration of Sodium Lauryl Sulphate at 25 °C. Trans. FaradaySoc. 1955, 51, 728−737.(36) Anghel, D.; Ciocan, N. Critical Micelle Concentration (CMC)Determination with the Aid of Liquid Membrane Electrode Sensitiveto Dodecyl Sulfate Anion. Colloid Polym. Sci. 1976, 254, 114−115.(37) Newbery, J.; Smith, V. Measurement of the Critical MicelleConcentration by Ion-Selective Electrodes. Colloid Polym. Sci. 1978,256, 494−495.(38) Hernandez, Y.; Nicolosi, V.; Lotya, M.; Blighe, F. M.; Sun, Z.;De, S.; McGovern, I.; Holland, B.; Byrne, M.; Gun’Ko, Y. K. High-Yield Production of Graphene by Liquid-Phase Exfoliation ofGraphite. Nat. Nanotechnol. 2008, 3, 563−568.(39) Li, D. H.; Ganczarczyk, J. Fractal Geometry of ParticleAggregates Generated in Water and Wastewater Treatment Processes.Environ. Sci. Technol. 1989, 23, 1385−1389.(40) Gregory, J. The Role of Floc Density in Solid-Liquid Separation.Filtr. Sep. 1998, 35, 367−371.(41) Khelifa, A.; Hill, P. S. Models for Effective Density and SettlingVelocity of Flocs. J. Hydraul. Res. 2006, 44, 390−401.(42) Meakin, P. Formation of Fractal Clusters and Networks byIrreversible Diffusion-Limited Aggregation. Phys. Rev. Lett. 1983, 51,1119−1122.(43) Kolb, M.; Botet, R.; Jullien, R. Scaling of Kinetically GrowingClusters. Phys. Rev. Lett. 1983, 51, 1123−1126.(44) Shih, W. Y.; Aksay, I. A.; Kikuchi, R. Reversible-Growth Model:Cluster-Cluster Aggregation with Finite Binding Energies. Phys. Rev. A1987, 36, 5015−5019.
(45) Kolb, M.; Jullien, R. Chemically Limited Versus DiffusionLimited Aggregation. J. Phys. (Paris), Lett. 1984, 45, 977−981.(46) Schniepp, H. C.; Kudin, K. N.; Li, J.-L.; Prud’homme, R. K.; Car,R.; Saville, D. A.; Aksay, I. A. Bending Properties of SingleFunctionalized Graphene Sheets Probed by Atomic Force Microscopy.ACS Nano 2008, 2, 2577−2584.(47) Russel, W. B.; Saville, D. A.; Schowalter, W. R., ColloidalDispersions. Cambridge University Press: 1992.(48) Li, J. L.; Chun, J.; Wingreen, N. S.; Car, R.; Aksay, I. A.; Saville,D. A. Use of Dielectric Functions in the Theory of Dispersion Forces.Phys. Rev. B 2005, 71, 235412.(49) Overbeek, J. T. G. Recent Developments in the Understandingof Colloid Stability. J. Colloid Interface Sci. 1977, 58, 408−422.(50) Bondi, A. van der Waals Volumes and Radii. J. Phys. Chem.1964, 68, 441−451.(51) Shih, W. Y.; Aksay, I. A.; Kikuchi, R. Phase Diagrams of ChargedColloidal Particles. J. Chem. Phys. 1987, 86, 5127−5132.(52) Glover, A. J.; Adamson, D. H.; Schniepp, H. C. Charge-DrivenSelective Adsorption of Sodium Dodecyl Sulfate on Graphene OxideVisualized by Atomic Force Microscopy. J. Phys. Chem. C 2012, 116,20080−20085.(53) Saville, D. A.; Chun, J.; Li, J. L.; Schniepp, H. C.; Car, R.; Aksay,I. A. Orientational Order of Molecular Assemblies on InorganicCrystals. Phys. Rev. Lett. 2006, 96, 018301.(54) Langmuir, I. The Vapor Pressure of Metallic Tungsten. Phys.Rev. 1913, 2, 329−342.(55) Langmuir, I. The Constitution and Fundamental Properties ofSolids and Liquids. Part I. Solids. J. Am. Chem. Soc. 1916, 38, 2221−2295.(56) Verwey, E. J. W.; Overbeek, J. T. G.; van Nes, K., Theory of theStability of Lyophobic Colloids: The Interaction of Sol Particles Having anElectric Double Layer; Elsevier: New York: 1948.(57) Ehrlich, G. On the Kinetics of Chemisorption. J. Phys. Chem.1955, 59, 473−477.(58) Liu, J.; Shih, W. Y.; Sarikaya, M.; Aksay, I. A. Fractal ColloidalAggregates with Finite Interparticle Interactions: Energy Dependenceof the Fractal Dimension. Phys. Rev. A 1990, 41, 3206−3213.
Langmuir Article
dx.doi.org/10.1021/la4035326 | Langmuir XXXX, XXX, XXX−XXXH