dispersion-cancelled and dispersion-sensitive quantum optical coherence tomography
TRANSCRIPT

Dispersion-cancelled anddispersion-sensitive quantum optical
coherence tomography
Magued B. Nasr, Bahaa E. A. Saleh, Alexander V. Sergienko, andMalvin C. Teich
Quantum Imaging Laboratory, Departments of Electrical & Computer Engineering andPhysics, Boston University, Boston, MA 02215
http://www.bu.edu/qil
Abstract: Quantum optical coherence tomography (QOCT) makes use ofan entangled twin-photon light source to carry out axial optical sectioning.We have probed the longitudinal structure of a sample comprising multiplesurfaces in a dispersion-cancelled manner while simultaneously measuringthe group-velocity dispersion of the interstitial media between the reflectingsurfaces. The results of the QOCT experiments are compared with thoseobtained from conventional optical coherence tomography (OCT).
© 2004 Optical Society of America
OCIS codes: (110.4500) Optical coherence tomography; (170.4500) Optical coherence tomog-raphy; (270.0270) Quantum optics.
References and links1. R. C. Youngquist, S. Carr, and D. E. N. Davies, “Optical coherence-domain reflectometry: a new optical evalua-
tion technique,” Opt. Lett. 12, 158–160 (1987).2. K. Takada, I. Yokohama, K. Chida, and J. Noda, “New measurement system for fault location in optical waveg-
uide devices based on an interferometric technique,” Appl. Opt. 26, 1603–1606 (1987).3. A. F. Fercher and E. Roth, “Ophthalmic laser interferometry,” Proc. SPIE 658, 48–51 (1986).4. D. Huang, E. A. Swanson, C. P. Lin, J. S. Schuman, W. G. Stinson, W. Chang, M. R. Hee, T. Flotte, K. Gregory,
C. A. Puliafito, and J. G. Fujimoto, “Optical coherence tomography,” Science 254, 1178–1181 (1991).5. J. M. Schmitt, “Optical coherence tomography (OCT): A review,” IEEE J. Sel. Topics Quantum Electron. 5,
1205–1215 (1999).6. A. F. Fercher, W. Drexler, C. K. Hitzenberger, and T. Lasser, “Optical coherence tomography—principles and
applications,” Rep. Prog. Phys. 66, 239–303 (2003).7. A. F. Abouraddy, M. B. Nasr, B. E. A. Saleh, A. V. Sergienko, and M. C. Teich, “Quantum-optical coherence
tomography with dispersion cancellation,” Phys. Rev. A 65, 053817 (2002).8. M. B. Nasr, B. E. A. Saleh, A. V. Sergienko, and M. C. Teich, “Demonstration of dispersion-canceled quantum-
optical coherence tomography,” Phys. Rev. Lett. 91, 083601 (2003).9. J. D. Franson, “Nonlocal cancellation of dispersion,” Phys. Rev. A 45, 3126–3132 (1992).
10. A. M. Steinberg, P. G. Kwiat, and R. Y. Chiao, “Dispersion cancellation and high-resolution time measurementsin a fourth-order optical interferometer,” Phys. Rev. A 45, 6659–6665 (1992).
11. A. M. Steinberg, P. G. Kwiat, and R. Y. Chiao, “Dispersion cancellation in a measurement of the single-photonpropagation velocity in glass,” Phys. Rev. Lett. 68, 2421–2424 (1992).
12. T. S. Larchuk, M. C. Teich, and B. E. A. Saleh, “Nonlocal cancellation of dispersive broadening in Mach-Zehnderinterferometers,” Phys. Rev. A 52, 4145–4154 (1995).
13. L. Mandel and E. Wolf, Optical Coherence and Quantum Optics (Cambridge, New York, 1995), ch. 22.14. C. K. Hong, Z. Y. Ou, and L. Mandel, “Measurement of subpicosecond time intervals between two photons by
interference,” Phys. Rev. Lett. 59, 2044–2046 (1987).15. B. E. A. Saleh and M. C. Teich, Fundamentals of Photonics (Wiley, New York, 1991).
(C) 2004 OSA 5 April 2004 / Vol. 12, No. 7 / OPTICS EXPRESS 1353#3987 - $15.00 US Received 5 March 2004; revised 24 March 2004; accepted 25 March 2004

16. A. F. Fercher, C. K. Hitzenberger, M. Sticker, R. Zawadzki, B. Karamata, and T. Lasser, “Dispersion compensa-tion for optical coherence tomography depth-scan signals by a numerical technique,” Opt. Commun. 204, 67–74(2002).
17. M. Bass, Ed., Handbook of Optics, Vol. II, 2nd ed. (McGraw–Hill, New York, 1995), ch. 33, p. 67.18. http://www.cvdmaterials.com/pdf/Zinc%20Selenide.pdf
1. Introduction
Optical coherence tomography (OCT), a technique for carrying out axial sectioning of a speci-men, has come into wide use [1]–[6]. A quantum version of OCT that makes use of an entangledtwin-photon light source has recently been proposed [7] and experimentally demonstrated [8].A particular merit of quantum optical coherence tomography (QOCT) is that it is inherentlyimmune to group velocity dispersion (GVD) of the medium by virtue of the frequency en-tanglement associated with the twin-photon pairs [9]–[12]. Moreover, for sources of the samebandwidth, the entangled nature of the twin photons provides a factor of two enhancement inresolution relative to OCT.
In addition, QOCT permits us to directly determine the GVD coefficients of the intersti-tial media between the reflecting surfaces of the sample. A typical QOCT scan comprises twoclasses of features [7]. The features in the first class carry the information that is most oftensought in OCT: the depth and reflectance of the surfaces that constitute the sample. Each ofthese features is associated with a reflection from a single surface and is immune to GVD. Thefeatures in the second class, in contrast, arise from cross interference between the reflectionamplitudes associated with every pair of surfaces and are sensitive to the dispersion character-istics of the media between them. Measurement of the broadening of a feature associated withtwo consecutive surfaces directly yields the GVD coefficient of the interstitial medium lyingbetween them. In an OCT scan, only a single class of features is observed; each feature is asso-ciated with the reflection from a single surface and is subject to the cumulative dispersion of theentire sample above it. Thus, GVD information is not directly accessible via OCT; to measurethe GVD of a particular buried medium, one must consecutively compute the GVD of each ofthe constituent layers above it.
That said, the title of this paper is understood as follows: QOCT provides two classes ofinformation, a dispersion-cancelled tomograph and a dispersion-sensitive determination of theGVD coefficients of the various media that comprise the sample.
In this letter we report a QOCT experiment in which we simultaneously probe the longitudi-nal structure of a layered sample and the GVD of the intervening media. A parallel experimentusing conventional OCT, with a source of identical bandwidth, is conducted to provide a directcomparison of the two techniques. Our sample consisted of the four surfaces of two fused-silicawindows sandwiching a 12-mm-thick ZnSe window (a highly dispersive material). Using thereflections from this sample, we observe an improvement in resolution of a factor of ≈ 5.5.This improvement arises from the concatenation of two advantages inherent in QOCT: disper-sion cancellation and the factor-of-two entanglement advantage. The GVD coefficient of ZnSeis simultaneously determined to be β ′′ ≈ 4.0±0.8×10⁻²⁵s2 m−1.
2. Principles of QOCT
We begin with a brief discussion of the principle underlying QOCT (for a comparative reviewof the theories of QOCT and OCT the reader is referred to Ref. [7]). A schematic of the QOCTarrangement is illustrated in Fig. 1. The entangled twin photons may be conveniently generatedvia spontaneous parametric downconversion (SPDC) [13]. In this process a monochromaticlaser beam of angular frequency ω p, serving as the pump, is sent to a second-order nonlinearoptical crystal (NLC). A fraction of the pump photons disintegrate into pairs of downcon-
(C) 2004 OSA 5 April 2004 / Vol. 12, No. 7 / OPTICS EXPRESS 1354#3987 - $15.00 US Received 5 March 2004; revised 24 March 2004; accepted 25 March 2004
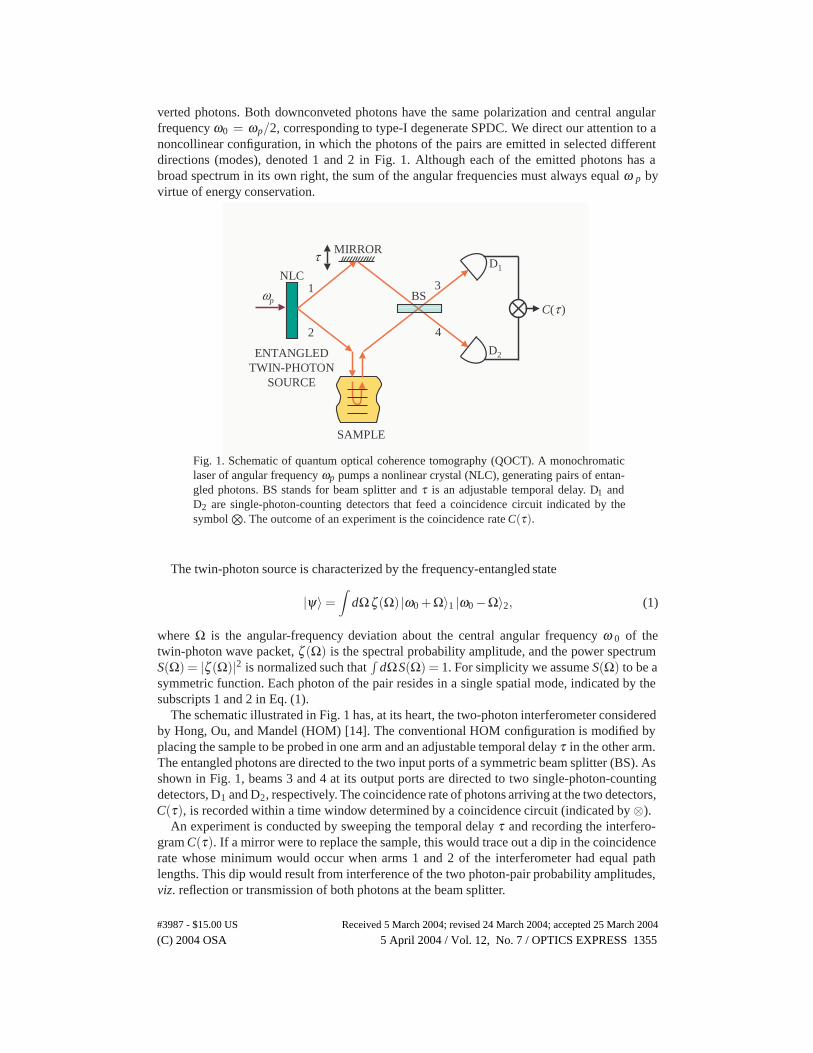
verted photons. Both downconveted photons have the same polarization and central angularfrequency ω0 = ωp/2, corresponding to type-I degenerate SPDC. We direct our attention to anoncollinear configuration, in which the photons of the pairs are emitted in selected differentdirections (modes), denoted 1 and 2 in Fig. 1. Although each of the emitted photons has abroad spectrum in its own right, the sum of the angular frequencies must always equal ω p byvirtue of energy conservation.
D1
MIRROR
BS
D2
SAMPLE
1
2
3
4
ENTANGLEDTWIN-PHOTON
SOURCE
τ
C(τ )ωp
NLC
Fig. 1. Schematic of quantum optical coherence tomography (QOCT). A monochromaticlaser of angular frequency ωp pumps a nonlinear crystal (NLC), generating pairs of entan-gled photons. BS stands for beam splitter and τ is an adjustable temporal delay. D1 andD2 are single-photon-counting detectors that feed a coincidence circuit indicated by thesymbol
⊗. The outcome of an experiment is the coincidence rate C(τ).
The twin-photon source is characterized by the frequency-entangled state
|ψ〉 =∫
dΩζ (Ω) |ω0 + Ω〉1 |ω0 −Ω〉2, (1)
where Ω is the angular-frequency deviation about the central angular frequency ω 0 of thetwin-photon wave packet, ζ (Ω) is the spectral probability amplitude, and the power spectrumS(Ω) = |ζ (Ω)|2 is normalized such that
∫dΩS(Ω) = 1. For simplicity we assume S(Ω) to be a
symmetric function. Each photon of the pair resides in a single spatial mode, indicated by thesubscripts 1 and 2 in Eq. (1).
The schematic illustrated in Fig. 1 has, at its heart, the two-photon interferometer consideredby Hong, Ou, and Mandel (HOM) [14]. The conventional HOM configuration is modified byplacing the sample to be probed in one arm and an adjustable temporal delay τ in the other arm.The entangled photons are directed to the two input ports of a symmetric beam splitter (BS). Asshown in Fig. 1, beams 3 and 4 at its output ports are directed to two single-photon-countingdetectors, D1 and D2, respectively. The coincidence rate of photons arriving at the two detectors,C(τ), is recorded within a time window determined by a coincidence circuit (indicated by ⊗).
An experiment is conducted by sweeping the temporal delay τ and recording the interfero-gram C(τ). If a mirror were to replace the sample, this would trace out a dip in the coincidencerate whose minimum would occur when arms 1 and 2 of the interferometer had equal pathlengths. This dip would result from interference of the two photon-pair probability amplitudes,viz. reflection or transmission of both photons at the beam splitter.
(C) 2004 OSA 5 April 2004 / Vol. 12, No. 7 / OPTICS EXPRESS 1355#3987 - $15.00 US Received 5 March 2004; revised 24 March 2004; accepted 25 March 2004

A weakly reflecting sample is described by a transfer function H(ω), characterizing theoverall reflection from all structures that comprise the sample, at angular frequency ω :
H(ω) =∫ ∞
0dzr(z,ω)ei2φ(z,ω). (2)
The quantity r(z,ω) is the complex reflection coefficient from depth z and 2φ(z,ω) is theround-trip phase accumulated by the wave while travelling through the sample to depth z.Losses are not included in this expression although they are accounted for subsequently. Asshown previously [7], the coincidence rate C(τ) is then given by
C(τ) ∝ Λ0 −ReΛ(2τ), (3)
whereΛ0 =
∫dΩ |H(ω0 + Ω)|2 S(Ω) (4)
andΛ(τ) =
∫dΩH(ω0 + Ω)H∗(ω0 −Ω)S(Ω)e−iΩτ (5)
represent the constant and varying contributions, respectively. The interferogram C(τ) yieldsuseful information about the transfer function H(ω) and hence about the reflectance r(z,ω) [7].
3. Experimental arrangement
The details of the QOCT experimental arrangement are shown in Fig. 2. For QOCT scans, thedotted components (mirrors M1 and M2, as well as detector D3) are removed. The entangledphotons, centered about λ0 = 812 nm and emitted in a non-collinear configuration, travel inbeams 1 and 2. The photon in beam 1 travels through a temporal delay τ before it enters theinput port of the first beam splitter, BS1. The second photon in beam 2 goes through a secondbeam splitter, BS2, which ensures normal incidence onto the sample. The photon returned fromthe sample is directed to the other input port of BS1. Beams 3 and 4, at the output of BS1, aredirected to detectors D1 and D2, respectively.
For OCT scans, the photons in beam 1 are discarded and mirrors M 1 and M2 remain inplace (see Fig. 2). The photons in beam 2 then simply serve as a short-coherence-time lightsource. The reflections from the sample and mirror M 1, after recombination at beam splitterBS2 are directed to detector D3 via mirror M2. The result is a simple Michelson interferometer,the standard configuration for OCT. To conduct an experiment, mirror M 1 is scanned therebysweeping the delay τ at the bottom of Fig. 2, and the singles rate is recorded, forming theOCT interferogram I(τ). This arrangement permits a fair comparison between QOCT and OCTsince both make use of a light source with identical spectrum. An alternative configuration forOCT scans, which we sometimes use, involves eliminating M2 and D3 altogether and simplyrecording the singles rate I(τ) at D1 or D2.
4. Results for a non-dispersive sample
The first experiment makes use of a four-surface sample ( j = 1, ...,4) comprising two thinfused-silica (FS) windows separated by air, as illustrated at the very top of Fig. 3. The transferfunction of the sample, H(ω), is therefore given by
H(ω) = HF(ω)+ HB(ω)eiωτd eiωτD , (6)
where HF(ω) = r1 + r2 eiωτd and HB(ω) = r3 + r4 eiωτd are the transfer functions of the front(F) and back (B) fused-silica windows, respectively. The round-trip time τ d between the two
(C) 2004 OSA 5 April 2004 / Vol. 12, No. 7 / OPTICS EXPRESS 1356#3987 - $15.00 US Received 5 March 2004; revised 24 March 2004; accepted 25 March 2004

Kr+
-IO
N L
AS
ER
λ p=
406
nm
SAMPLE
NLC
BS2
BS1
D2
F
F D1
D3
F
M1
M2
1
2
A
A
A
3
4
C (τ )
I (τ )
P
τ
τ
M
BD
Fig. 2. Experimental arrangement for quantum/classical optical coherence tomography(QOCT/OCT). A monochromatic Kr+-ion laser operated at λp = 406 nm pumps an 8-mm-thick type-I LiIO3 nonlinear crystal (NLC) after passage through a prism, P, and anaperture (not shown), which remove the spontaneous glow of the laser tube. BD stands forbeam dump (to block the pump), BS for beam splitter, M for mirror, A for 2.2-mm aper-ture, F for long-pass filter with cutoff at 725 nm, and D for single-photon-counting detector(EG&G, SPCM-AQR-15). The quantity τ represents a temporal delay. For QOCT scans,the dotted components M1, M2 and D3 are removed, the delay τ at the top of the figure isswept, and the coincidence rate C(τ) is measured within a 3.5-nsec time window. For OCTscans, beam 1 is discarded (beam 2 serves as the short-coherence-time light source), mirrorM1 is scanned thereby sweeping the delay τ at the bottom of the figure, and the singles rateI(τ) is recorded.
surfaces of each fused-silica window is given by τd = 2nd/c, whereas τD = 2D/c is the timedelay associated with a round trip through the intervening air. The reflectance from each surfaceof each window is |r j|2 = 0.04 at normal incidence; each window has a thickness d = 90 µm(which is greater than the 37-µm coherence length of the source); D = 4.5 mm is the air spacingbetween the two windows; c is the speed of light in vacuum; and n ≈ 1.5 is the refractive indexof the fused silica (which is taken to be independent of ω by virtue of the low dispersiveness ofthis material). Under these conditions, Eqs. (4)–(6) yield
Λ0 =4
∑j=1
|r j|2 (7)
andΛ(τ) = ΛF(τ)+ ΛB(τ −2τ0)+ ΛFB(τ − τ0), (8)
where τ0 ≡ τd + τD.The first two terms in Eq. (8), ΛF(τ) and ΛB(τ), represent the individual QOCT scans [8] of
the front (F) and back (B) fused-silica windows, respectively, and are given by
ΛF(τ) = |r1|2 s(τ)+ |r2|2 s(τ −2τd)+2Rer1r∗2 s(τ − τd)eiω0τd,
(C) 2004 OSA 5 April 2004 / Vol. 12, No. 7 / OPTICS EXPRESS 1357#3987 - $15.00 US Received 5 March 2004; revised 24 March 2004; accepted 25 March 2004

ΛB(τ) = |r3|2 s(τ)+ |r4|2 s(τ −2τd)+2Rer3r∗4 s(τ − τd)eiω0τd, (9)
where s(τ) is the Fourier transform of the power spectrum S(Ω). The QOCT scan of the frontwindow (ΛF) and the back window (ΛB) each comprise three terms. The first two of these aredips that arise from reflections from the front and back surfaces of each window (r 1 and r2 forthe front window; r3 and r4 for the back window). These dips, each of which is associated with
0 200 400
0.6
0.8
1.0
1.2
1.4
ΛΛΛΛB(3, 4)
(4, 4)
NO
RM
. QO
CT
C ( ττ ττ
)
2400 2600
ΛΛΛΛFB
(2, 4)
(1, 4) + (2, 3)(3, 3)
4600 4800 5000
d =90 µµµµm
d =90 µµµµm
(a)(1, 3)(1, 2)
(2, 2) (1, 1)
0 200 400
0.6
0.8
1.0
1.2
1.4
nd = 135 µµµµm
NO
RM
. OC
T I
( ττ ττ )
1 D = 4.5 mm
nd = 135 µµµµm
D = 4.5 mm
DELAY-LINE DISPLACEMENT cττττ /2 (µµµµm)4600 4800 5000
ΛΛΛΛF
(b)
18.5 µµµµm
37.0 µµµµm
AIRFS FS2 134 : SURFACE
LIGHTj =
Fig. 3. QOCT and OCT normalized interferograms for two d = 90-µm fused-silica (FS)windows separated by D = 4.5 mm of air. The four surfaces that comprise the sample arenumbered, as shown at the top of the figure. The abscissa is the scaled temporal delaycτ/2, which represents the displacement of the delay line for both experiments (OCT andQOCT). (a) Coincidence rate C(τ) normalized to the constant background Λ0 (the nor-malized QOCT interferogram). Features labelled ( j, j) correspond to reflections from thejth surface whereas those labelled ( j, k) , j = k, correspond to cross-interference betweenpairs of surfaces. The outermost clusters of features, labelled ΛF and ΛB, correspond to thetriplets of terms appearing in Eq. (9). The center cluster, labelled ΛFB, corresponds to theterms appearing in Eq. (10), in which (1,4) and (2,3) overlap. The power of the pump laserwas 7 mW, which resulted in a power in each of the downconverted beams of 43 pW. (b)Singles rate I(τ) normalized to constant background (the normalized OCT interferogram).The power of the pump laser was 13 mW, resulting in a downconverted-beam power of 80pW.
(C) 2004 OSA 5 April 2004 / Vol. 12, No. 7 / OPTICS EXPRESS 1358#3987 - $15.00 US Received 5 March 2004; revised 24 March 2004; accepted 25 March 2004

the reflection from a single surface, carry the information about the structure of the sample thatis often sought in OCT. They are separated by τd and are expected to exhibit 25% visibility byvirtue of Eqs. (3), (7), (8), and (9), since |r j|2 = 0.04 for j = 1, ...,4. The third term in ΛF orΛB [see Eq. (9)], which appears midway between the two dips, arises from cross interferencebetween the reflection amplitudes associated with the two surfaces. This intermediate termranges from a peak to a dip depending on the values of ω p, n, d, the arguments of r1 and r2
(front window), and the arguments of r3 and r4 (back window).The third term in Eq. (8), ΛFB(τ), which is given by
ΛFB(τ) = 2Re[r1r∗3 s(τ)+ (r1r∗4 e−iω0τd + r2r∗3 eiω0τd )s(τ − τd)+r2r∗4 s(τ −2τd)]eiω0τ0, (10)
arises from cross interference between the reflection amplitudes associated with pairs of sur-faces (one from each window) when the two windows are incorporated in a sample. Thesecross-window intermediate terms are of the same nature as the third terms in Λ F and ΛB for theindividual QOCT scans of each window [see Eq. (9)]. Substituting Eqs. (7)–(10) into Eq. (3)yields an interferogram that contains ten varying terms.
The experimental QOCT interferogram for this sample, normalized to the constant back-ground Λ0, is plotted in Fig. 3(a). The dips associated with the reflection from single surfacesare labelled ( j, j), where j is the surface number as shown at the top of the figure. These dips areseparated by the optical path length of the medium between them: going from right to left in thefigure, the values of the optical path lengths are nd = 135 µm (front window), n airD = 1D= 4.5mm (intervening air), and nd = 135 µm (back window). All ( j, j) dips exhibit 23% visibility,in close agreement with the theoretically expected value of 25%.
The cross-interference features associated with reflections from pairs of surfaces are labelled( j, k), j = k. For example, in the individual QOCT scan of the front window, Λ F(τ) in Eq. (9),the feature corresponding to the term 2Rer1r∗2 s(τ − τd)eiω0τd is labelled (1, 2). Because ofthe low dispersion of the layers comprising this sample, all dips and peaks in the plot havethe same width (18.5 µm full width at half maximum, FWHM). It is of interest to note thatalthough the two fused-silica windows are identical, the intermediate feature of the front win-dow, labelled (1, 2), turns out to be a peak while that of the back window, labelled (3, 4), isa dip. This can result from a slight thickness mismatch, of the order of the wavelength of thelight, between the two windows, as mentioned earlier. The abscissa is represented in units ofthe scaled temporal delay cτ/2, representing the physical displacement of the delay line.
The OCT interferogram for the same sample is expected to consist of four interference-fringe envelopes, each with visibility calculated to be 30%, separated by the same optical pathlength as the ( j, j) dips. The experimental OCT interferogram for this sample, normalized tothe constant background, is displayed in Fig. 3(b). The centers of the envelopes exhibit 26%visibility, which is close to the expected value.
It is apparent that the 18.5-µm FWHM of the dips observed in QOCT provides a factorof 2 improvement in resolution over the 37-µm FWHM of the envelopes observed in OCT.This improvement, which is in accord with theory [7], ultimately results from the entanglementinherent in the nonclassical light source used in QOCT [8].
5. Results for a dispersive sample
To demonstrate the dispersion-cancellation capability of QOCT, as well as the ability to mea-sure GVD coefficients, we carry out a second QOCT/OCT experiment with a highly dispersivemedium: a 12-mm-thick window of ZnSe placed between the two fused-silica windows. TheZnSe window is slightly canted with respect to the incident beam to divert back-reflections, asschematized at the top of Fig. 4.
(C) 2004 OSA 5 April 2004 / Vol. 12, No. 7 / OPTICS EXPRESS 1359#3987 - $15.00 US Received 5 March 2004; revised 24 March 2004; accepted 25 March 2004

0 200 400
0.6
0.8
1.0
1.2
1.4
ΛΛΛΛB
19.5 µµµµm
(3, 4)(4, 4) (3, 3)
NO
RM
. QO
CT
C ( ττ ττ
)
19200 19400
dispΛΛΛΛFB
(1, 4) + (2, 3)
(2, 4)
(1, 3)
35.5 µµµµm
38000 38200 38400
ΛΛΛΛF
L = 12 mm d = 90 µµµµm
d = 90 µµµµm
(a)(1, 2)
(2, 2) (1, 1)
18.5 µµµµm
0 200 400
0.6
0.8
1.0
1.2
1.4
104 µµµµm
NO
RM
. OC
T I
( ττ ττ )
DELAY-LINE DISPLACEMENT cττττ /2 (µµµµm)38000 38200 38400
(b)
nd = 135 µµµµm nd = 135 µµµµm
37.0 µµµµm
AIRAIRFS FSZnSe2 134 : SURFACE
LIGHTj =
Fig. 4. QOCT and OCT normalized interferograms for two d = 90-µm fused-silica (FS)windows sandwiching an L = 12-mm window of highly dispersive ZnSe. As shown at thetop of the figure, the ZnSe is slightly canted with respect to the incident beam (arrow) todivert back-reflections. The four surfaces that comprise the sample are numbered, as shownat the top of the figure. The abscissa is the scaled temporal delay cτ/2, which representsdisplacement of the delay line for both experiments (OCT and QOCT). (a) Coincidencerate C(τ) normalized to the constant background Λ0 (the QOCT normalized interferogram).Features labelled ( j, j) correspond to reflections from the jth surface whereas those labelled( j, k) , j = k, correspond to cross-interference between pairs of surfaces. The outermostclusters of features, labelled ΛF and ΛB, correspond to the features appearing in the firstand second terms of Eq. (13), respectively. The center cluster, labelled Λdisp
FB , correspondsto the terms appearing in Eq. (14), in which (1,4) and (2,3) overlap. The power of thepump laser was 120 mW, which resulted in a power in each of the downconverted beamsof 685 pW. (b) Singles rate I(τ) normalized to constant background (the normalized OCTinterferogram). The power of the pump laser was 120 mW, resulting in a downconverted-beam power of 685 pW.
The transfer function of this composite sample is
Hdisp(ω) = HF(ω)+ α HB(ω)eiω τd ei2β (ω)L, (11)
where β (ω) is the wave number and L = 12mm is the thickness of the ZnSe window. We haveignored the air gaps between the fused-silica and ZnSe windows since this has no material
(C) 2004 OSA 5 April 2004 / Vol. 12, No. 7 / OPTICS EXPRESS 1360#3987 - $15.00 US Received 5 March 2004; revised 24 March 2004; accepted 25 March 2004

effect on the results. The factor α represents the loss introduced by the ZnSe window; it ismeasured to be |α|2 = 0.32. The phase factor ei2β (ω)L in Eq. (11), which represents the round-trip propagation through the dispersive medium, replaces the phase factor e iωτD in Eq. (6),acquired through propagation in air. We now carry out the usual Taylor expansion of β (ω 0 +Ω)to second order in Ω, where Ω is the angular frequency deviation about ω o: β (ω0 + Ω) ≈β0 +β ′Ω+β ′′Ω2, where β ′ is the inverse of the group velocity at ω0, and β ′′ represents group-velocity dispersion (GVD) [15].
Substituting Hdisp(ω) from Eq. (11) into Eqs. (4) and (5) yields
Λ0 =2
∑j=1
|r j|2 + |α|24
∑j=3
|r j|2, (12)
andΛ(τ) = ΛF(τ)+ |α|2ΛB(τ −2τ1)+ Λdisp
FB (τ − τ1), (13)
respectively, where τ1 ≡ τd + τL, and τL = 2β ′L is the round-trip travel time through the ZnSewindow. The first term in Eq. (13), ΛF(τ), which represents the individual QOCT scan of thefront window, is unaffected by the presence of the dispersive ZnSe medium. The second termof Eq. (13), representing the QOCT scan of the back window, behaves as |α| 2 ΛB. The multipli-cation by the loss factor |α|2 simply results in a reduction of visibility. Neither β0 nor the GVDparameter β ′′ appear in the second term; nor, in fact, would any higher even-order terms werewe to carry the Taylor expansion further. Thus the features associated with the scan of the backwindow remain unaffected by dispersion.
The cancellation of GVD is an important signature of QOCT. In OCT, β ′′ does not cancel andthe result is a degradation of depth resolution and a reduction of the signal-to-noise ratio [16].
On the other hand, the third term in Eq. (13), Λ dispFB , which is a dispersed version of ΛFB, the
third term appearing in Eq. (8), is given by
ΛdispFB (τ) = 2Reα∗[r1r∗3 sdisp(τ)+ (r1r∗4 e−iω0τd + r2r∗3 eiω0τd )sdisp(τ − τd)
+r2r∗4 sdisp(τ −2τd)]e−i(ω0τd+2β0L), (14)
where sdisp(τ) is the Fresnel transform
sdisp (τ) =∫
dΩS(Ω)e−i2β ′′Ω2L e−iΩτ . (15)
The sensitivity of the cross-window intermediate terms in ΛdispFB to the dispersiveness of the
ZnSe medium permits the measurement of its GVD coefficient β ′′.Figure 4(a) displays the normalized QOCT interferogram for this sample. As predicted by
Eq. (13), the widths of all features in ΛF and ΛB remain essentially as they were in the absenceof the dispersive medium [see Fig. 3(a)]. These features encompass all the dips labelled ( j, j),which carry the structural information of the sample. Thus the optical sectioning capability ofthe QOCT technique is unaffected by the presence of the dispersive medium.
There is a slight broadening from 18.5 µm to 19.5 µm of the three features in the leftmostcluster labelled ΛB. This could result from the sensitivity of QOCT to the higher odd-orderterms in the Taylor expansion of β (ω0 + Ω), namely β ′′′,βV , ...etc, which are not cancelled.In the case at hand, however, numerical simulation reveals that the broadening associated withβ ′′′ (≈ 0.05 µm) is far less than that observed in the experiment. The broadening appears ratherto be a consequence of the diffraction of the beam as it propagates and its subsequent passagethrough an aperture, which results in a truncation of the spectrum of the light, an effect we havepreviously observed in other experiments. The center features of the triplets, (1, 2) and (3, 4),
(C) 2004 OSA 5 April 2004 / Vol. 12, No. 7 / OPTICS EXPRESS 1361#3987 - $15.00 US Received 5 March 2004; revised 24 March 2004; accepted 25 March 2004

in the QOCT interferogram displayed in Fig. 4(a), are also unaffected by the presence of theZnSe, since they are sensitive only to the dispersion of the fused silica, which is negligible. Thiswould not be the case, however, if the interstitial materials between the reflecting surfaces, 1and 2 (front window), and/or 3 and 4 (back window), were dispersive [7].
On the other hand, the intermediate features, labelled (1, 3), (1, 4), (2, 3), and (2, 4), appearingin the center cluster denoted Λdisp
FB are broadened (FWHM = 35.5 µm). This broadening arisesfrom the dispersiveness of the ZnSe medium lying between the ( j, k) pair of reflecting surfacesappearing in their labels. Given the thickness of the ZnSe, L = 12 mm, and fitting the datato Eq. (15), the value of the extracted GVD coefficient β ′′ is determined to be β ′′ ≈ 4.0±0.8× 10⁻²⁵ s2 m−1. This result is in good agreement with the nominal value obtained usingthe Sellmeier equation, β ′′ ≈ 5.4× 10⁻²⁵ s2 m−1 [17], and with the value obtained via directcomputation from n(λ ) (the refractive index as a function of wavelength [18]), which is β ′′ ≈5.2×10⁻²⁵ s2 m−1.
In contrast, in the normalized OCT interferogram displayed in Fig. 4(b), the two interference-fringe envelopes associated with reflections from the surfaces of the back window are broad-ened from 37 to 104 µm as a result of dispersion. Those of the front window are clearly unaf-fected by the dispersion of the medium that lies below the window.
6. Discussion
In the absence of prior information relating to the structure of the sample, features in the QOCTinterferogram associated with reflections from a single surface (referred to as the “first class” offeatures) may be confounded with cross-interference features associated with pairs of surfaces(the “second class” of features). These two classes may be readily distinguished, however, sinceslight variations of the pump frequency change the form of features in the second class (e.g.,from dips to humps), whereas those in the first class are invariant to such variations.
Thus, dithering the pump frequency, for example, can serve to wash out the features in thesecond class, thereby leaving intact the dispersion-cancelled portion of the interferogram thatreveals the axial structure of the sample [7]. We expect that returns from scattering media wouldhave this same effect because of the associated random phases. Simple subtraction of this pat-tern from the undithered version allows the second class of features to be separated, therebyalso providing a dispersion-sensitive determination of the GVD coefficients of the various me-dia that comprise the sample.
The signal-to-noise ratio (SNR) for the OCT and QOCT interferograms is determined by anumber of factors, including the optical power in the interferometer, the transmittances of theoptical paths, the quantum efficiency of the detector(s), and the duration of the experiment.These parameters play different roles in OCT and QOCT; in the case at hand, they varied fromone experiment to another, as is clear in Figs. 3 and 4.
7. Conclusion
We have carried out experiments demonstrating dispersion-cancelled and dispersion-sensitivequantum optical coherence tomography (QOCT). The three principal advantages that stem fromthe frequency entanglement of the twin-photon source: dispersion cancellation, resolution dou-bling, and the ability to directly measure the GVD coefficient, have been illustrated.
Acknowledgments
This work was supported by the National Science Foundation; by the Center for SubsurfaceSensing and Imaging Systems (CenSSIS), an NSF Engineering Research Center; and by theDavid & Lucile Packard Foundation.
(C) 2004 OSA 5 April 2004 / Vol. 12, No. 7 / OPTICS EXPRESS 1362#3987 - $15.00 US Received 5 March 2004; revised 24 March 2004; accepted 25 March 2004