disgorge the cash: the disconnect between corporate borrowing and investment
DESCRIPTION
In this white paper, Roosevelt Institute Fellow J.W. Mason provides evidence that the relationship between corporate cash flow and borrowing to productive corporate investment has disappeared in the last 30 years and has been replaced with corporate funds and shareholder payouts.TRANSCRIPT
KEY FINDINGS• In the 1960s and 1970s, an additional
dollar of earnings or borrowing was associated with about a 40-cent increase in investment. Since the 1980s, less than 10 cents of each borrowed dollar is invested.
• Since the 1980s, shareholder payouts have nearly doubled; in the second half of 2007, aggregate payouts actually exceeded aggregate investment. Today, there is a strong correlation between shareholder payouts and borrowing that did not exist before the mid-1980s.
• This change in corporate finance, associated with the “shareholder revolution”, means there is good reason to believe that the real economy benefits less from the easier credit provided by macroeconomic policy than it once did.
J.W. Mason is a Fellow at the Roosevelt Institute, where he works on the Financialization Project. He is also an assistant professor of economics at John Jay College, CUNY. His current research focuses on the history and political economy of credit, including the evolution of household debt and changing role of financial markets in business investment. He did his graduate work at the University of Massachusetts at Amherst, and his B.A. is from the University of Chicago. He has recent or forthcoming articles in the American Economic Journal: Macroeconomics, Economic and Political Weekly, and Rethinking Marxism. In addition to his scholarly work, he has published popular articles in The Nation, In These Times, and The American Prospect among other venues.
For media inquiries, please contact Marcus Mrowka at 212.444.9130 x 219 or [email protected].
The views and opinions expressed in this paper are those of the author and do not necessarily represent the views of the Roosevelt Institute, its donors, or its directors. This paper is licensed under a Creative Commons Attribution-NonCommercial 4.0 International License.
Copyright 2015, the Roosevelt Institute. All rights reserved. WWW.ROOSEVELTINSTITUTE.ORG 1
EXECUTIVE SUMMARYThis paper provides evidence that the strong empirical relationship of corporate cash flow and borrowing to productive corporate investment has disappeared in the last 30 years and has been replaced with corporate funds and shareholder payouts. Whereas firms once borrowed to invest and improve their long-term performance, they now borrow to enrich their investors in the short-run. This is the result of legal, managerial, and structural changes that resulted from the shareholder revolution of the 1980s. Under the older, managerial, model, more money coming into a firm – from sales or from borrowing – typically meant more money spent on fixed investment. In the new rentier-dominated model, more money coming in means more money flowing out to shareholders in the form of dividends and stock buybacks. These results have important implications for macroeconomic policy. The shareholder revolution – and its implications for corporate financing decisions – may help explain why higher corporate profits in recent business cycles have generally failed to lead to high levels of investment. And under this new system, cheaper money from lower interest rates will fail to stimulate investment, growth, and wages because, as we show here, additional funds are funneled to shareholders through buybacks and dividends.
Disgorge the Cash:The Disconnect Between Corporate Borrowing and Investment
Disgorge the Cash: The Disconnect Between Corporate Borrowing and Investment
By J.W. Mason, February 25, 2015
INTRODUCTION
Was the financial crisis responsible for the decline in business investment? It’s not clear.
During the Great Recession of 2008–2009, the U.S. experienced a severe financial crisis, involving record numbers of bank failures, the insolvency of major financial institutions, the seizing-up of interbank credit markets, and steep falls in the value of many classes of financial assets. Over the same period and subsequently, there was a major drop in business investment, including a 20 percent decline in fixed investment, in the nonfinancial corporate sector.1
It has become natural to think these two phenomena are related: policymakers, economists, and journalists take it for granted that the main cause of the steep decline of business investment was the disruption in the financial system, which cut off the flow of credit to nonfinancial businesses and prevented them from financing new investment.
Yet it is hard to make sense of business investment’s deep fall and lagging recovery if the problem is access to funding. There is no question that many businesses did face tighter credit conditions during the Great Recession; small, unincorporated businesses may have been especially vulnerable to the tightening of bank lending standards. But for the corporate sector, which accounts for 80 percent of business fixed investment, it is less obvious that credit conditions are the binding constraint on investment, either during the recession or in general. The argument that an adverse shi# in the supply of external funds was the main direct cause of the fall in corporate investment during and a#er the recession must at least account for several puzzling facts that don’t fit with such an explanation.
For the corporate sector as a whole, changes in borrowing over the last business cycle were counterbalanced by changes in payouts to shareholders, with no net effect on funds available for investment.
One striking anomaly: despite the run-up of corporate borrowing during the boom and the collapse in borrowing during the recession, the net flow of funds from financial markets to the corporate sector was no higher before the crisis than a#er. For the corporate sector as a whole, increases in shareholder payouts (dividends plus net share repurchases) absorbed all the increase in borrowing leading up the recession.2 And during the recession, the fall in shareholder payouts was equal to the fall in corporate borrowing. So despite the crisis in the financial
Copyright 2015, the Roosevelt Institute. All rights reserved. WWW.ROOSEVELTINSTITUTE.ORG 2
1 Fixed investment by nonfinancial corporations peaked at an annual rate of $1.4 trillion in the third quarter of 2007 before falling to $1.1 trillion in the fourth quarter of 2009. Fixed investment by noncorporate businesses fell somewhat more. Board of Governors of the Federal Reserve System, Financial Accounts of the United States. Fixed investment refers to investment in fixed capital.2 Dividends and repurchases are payments from firm to shareholders. For a detailed explanation on why both are included see Section V.
system, there was no decline in the net flow of funds into the nonfinancial corporate sector. This same pa$ern has persisted in the recovery.
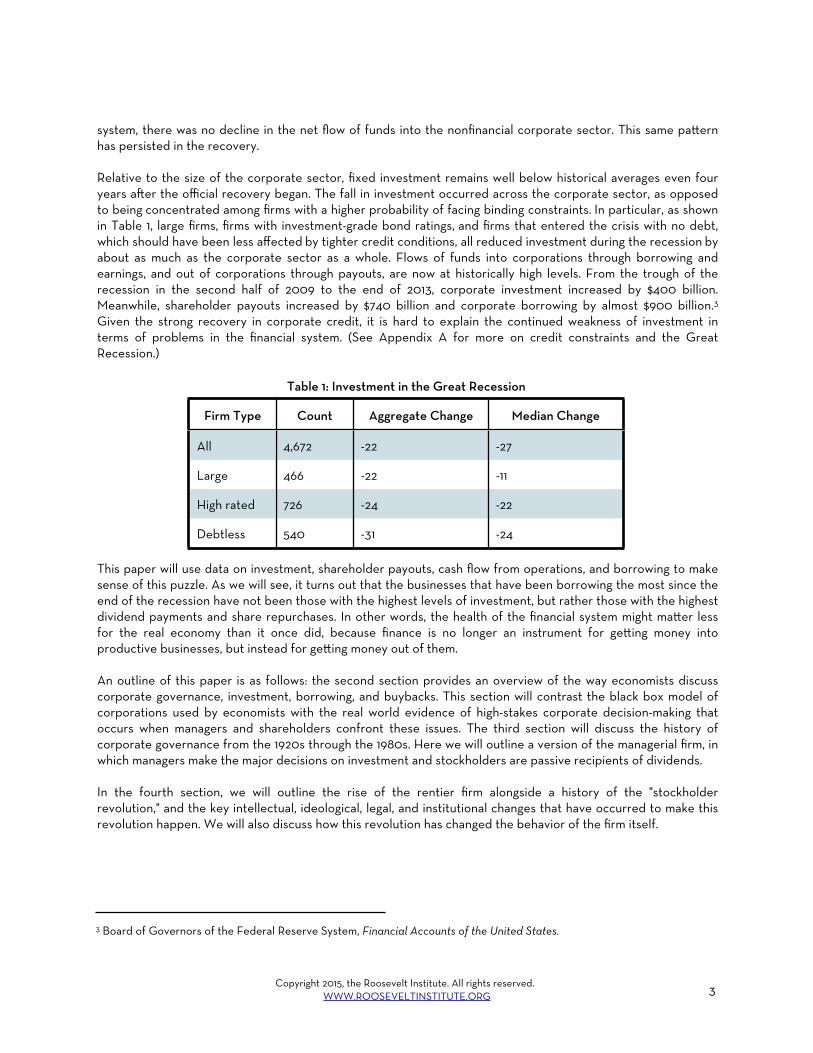
Relative to the size of the corporate sector, fixed investment remains well below historical averages even four years a#er the official recovery began. The fall in investment occurred across the corporate sector, as opposed to being concentrated among firms with a higher probability of facing binding constraints. In particular, as shown in Table 1, large firms, firms with investment-grade bond ratings, and firms that entered the crisis with no debt, which should have been less affected by tighter credit conditions, all reduced investment during the recession by about as much as the corporate sector as a whole. Flows of funds into corporations through borrowing and earnings, and out of corporations through payouts, are now at historically high levels. From the trough of the recession in the second half of 2009 to the end of 2013, corporate investment increased by $400 billion. Meanwhile, shareholder payouts increased by $740 billion and corporate borrowing by almost $900 billion.3 Given the strong recovery in corporate credit, it is hard to explain the continued weakness of investment in terms of problems in the financial system. (See Appendix A for more on credit constraints and the Great Recession.)
This paper will use data on investment, shareholder payouts, cash flow from operations, and borrowing to make sense of this puzzle. As we will see, it turns out that the businesses that have been borrowing the most since the end of the recession have not been those with the highest levels of investment, but rather those with the highest dividend payments and share repurchases. In other words, the health of the financial system might ma$er less for the real economy than it once did, because finance is no longer an instrument for ge$ing money into productive businesses, but instead for ge$ing money out of them.
An outline of this paper is as follows: the second section provides an overview of the way economists discuss corporate governance, investment, borrowing, and buybacks. This section will contrast the black box model of corporations used by economists with the real world evidence of high-stakes corporate decision-making that occurs when managers and shareholders confront these issues. The third section will discuss the history of corporate governance from the 1920s through the 1980s. Here we will outline a version of the managerial firm, in which managers make the major decisions on investment and stockholders are passive recipients of dividends.
In the fourth section, we will outline the rise of the rentier firm alongside a history of the "stockholder revolution," and the key intellectual, ideological, legal, and institutional changes that have occurred to make this revolution happen. We will also discuss how this revolution has changed the behavior of the firm itself.
Copyright 2015, the Roosevelt Institute. All rights reserved. WWW.ROOSEVELTINSTITUTE.ORG 3
3 Board of Governors of the Federal Reserve System, Financial Accounts of the United States.
Firm Type Count Aggregate Change Median Change
All 4,672 -22 -27
Large 466 -22 -11
High rated 726 -24 -22
Debtless 540 -31 -24
Table 1: Investment in the Great Recession

The fi#h section begins the second half of the paper, detailing our empirical results. It starts with several hypotheses that the data will explore. It continues with firm-level data, showing the changing correlations between borrowing and investment. The sixth section focuses on aggregate GDP data, also confirming these results. The paper ends with a conclusion discussing the relationship of the results to our current economy. Following that is an appendix with a discussion on credit conditions during the Great Recession.
WHAT DO DIVIDENDS DO?
Economic theory says that corporate dividends shouldn’t ma"er, but real shareholders clearly feel strongly that they do.
Before we turn to the data, we have to understand what is at stake. In particular, we need to understand why economic theories of corporate governance and corporate finance fail to explain observed reality. Questions of corporate governance are ultimately questions about what decisions corporations make about raising and spending money, who makes those decisions, and what criteria they use to make them. To accurately understand why the relationships between sources and uses of funds in the corporate sector might be different today than in decades past, we need to approach these questions in a concrete historical way, looking at the corporate finance decision as a zone of political conflict and not — as academic economists too o#en do — as just the solution to some objective maximization problem. First we will look at the general discrepancy between academic theory and corporate behavior, and then we will dig deeper into the history of these corporate governance theories.
The workhorse macroeconomic models taught in most graduate programs assume that it makes no difference whether households own their wealth directly in the form of buildings, machines, etc., or whether they pay someone else to manage it. They also treat business assets as the wealth of the firm’s “owners." In these kinds of models, it makes no difference to the “owners” whether businesses finance investment with their own retained earnings or raise it by issuing debt or new stock (Miller and Modigliani 1958). And it is hard to see why any business would incur the costs of higher borrowing simply in order to increase shareholder payouts, since from this perspective that is just moving money from one pocket to another.4
But actual wealth-holders evidently regard a firm’s financial structure as important and make a strong distinction between the assets of a firm in which they own stock and the assets they own directly. They clearly think that dividend payments and share repurchases — all else equal — leave them be$er off.
In many ways, economists’ understanding of the firm has become more sophisticated over the past 30 years, with renewed a$ention to agent-principle problems, incomplete contracts and the problems of monitoring and contract enforcement in the face of incomplete information. But these new ideas have had a limited impact in macroeconomics (Tirole 2006). According to traditional macroeconomic models, it might seem nonsensical for investors to demand that a company like Apple pay out its cash holdings as dividends, since the cash holdings belong to the shareholders whether they are paid out or not. Indeed, there is a substantial corporate finance literature devoted to the “dividend puzzle” — the question of why firms bother paying dividends at all.5 And yet, demands that companies
Copyright 2015, the Roosevelt Institute. All rights reserved. WWW.ROOSEVELTINSTITUTE.ORG 4
4 The classic statement of the irrelevance of firm's borrowing, dividends and financial structure to its real activities is Modigliani and Miller (1958), “The cost of capital, corporation finance and the theory of investment,” American Economic Review, 48, p.261-297. See below.5 Fisher Black's famous 1976 article on “The Dividend Puzzle” begins with the questions “Why do corporations pay dividends? Why should investors pay a!ention to dividends?” and concludes, simply, “We don't know.” Subsequent research has tended to deepen rather than resolve the puzzle.
“disgorge the cash” have become a central source of conflict between shareholders and corporate management. It is frequently noted in the business press that shareholders do not simply want higher profits, but also want a higher proportion of those profits paid out in the form of dividends and buybacks. A sampling of quotes includes:
- “‘I don’t think buy-backs are going to slow. There’s so much cash on the sidelines that shareholders want,’ said Robert Leonard, managing director of the special equity transactions group at Citigroup.”
- “Marianne Lake, chief financial officer [of JPMorgan Chase & Co.], told analysts the company could reach the new target faster but wanted to be able to also do ‘capital distribution to you guys’, by releasing profits rather than retaining them.”
- “Issuing debt to buy equity has become more a$ractive in recent months due to bold central bank action, which has pushed bond yields to record lows... Last year, Apple announced $10bn of share buybacks and said it would return $100bn to investors over the next three years, funded in part by a $17bn corporate bond... Companies are also using cheap money from the bond markets to fund special dividends. The discount warehouse club Costco, for example, borrowed $3bn from the markets late last year to fund a special dividend.”
- “An activist hedge fund has thrown down the gauntlet to Apple, pushing it to consider new ways to return billions of dollars to shareholders... Apple said it would consider the idea... ‘Apple’s management team and board of directors have been in active discussions about returning additional cash to shareholders,’ the company said in a statement.”
- “The biggest US companies may have as much as $2tn in cash available to spend in 2012, powering a potential surge in share buy-backs and dividend payments, [thanks to] a combination of cash on the books plus low levels of leverage and strong expected profits... Amid a struggling global economy, US companies in most industries have been hesitant to launch major new investments or complete large acquisitions, and have been primarily using cash to repurchase their shares and pay dividends. ‘If more firms were optimistic about the future and seeing new opportunities, this money could go to investment,’ said Marc Zenner, head of Corporate Finance Advisory at JPMorgan. ‘Doing share buy-backs is a less risky option, especially when valuations are low. It shows capital discipline and enthusiasm about the stock’s future, and can also fend off activists.’”6
Taken together, these quotes tell three stories, all three explicit in the final quote. First is that U.S. corporations are “primarily” using available cash for dividends and share repurchases. Second, there is a tradeoff between using funds for payouts and using them for investment. And third, one reason to make large payouts to shareholders is to “fend off activists.” An additional point o#en made in the business press is that payouts are o#en limited by a firm’s borrowing capacity. Corporations engaged in stock buybacks are o#en described as seeking to issue the maximum quantity of bonds that will not trigger a ratings downgrade. This might seem obvious, but it contradicts the standard economic assumption that firms can borrow as much as they wish to at the prevailing market interest rate.
If we take these claims seriously then corporate financing decisions are essential to understanding the weak recovery in investment during the Great Recession. And these corporate financing decisions, seen both in the stories above and in the larger data, are consistent with the major transformation of corporate governance over the past 30 years. In order to understand how the economy has evolved along these lines, we must be$er understand the history of corporate governance, both in theory and in practice.
Copyright 2015, the Roosevelt Institute. All rights reserved. WWW.ROOSEVELTINSTITUTE.ORG 5
6 All quotes from the Financial Times: “Low Bond Yields Fuel Corporate Buy-backs,” December 7, 2011; “Jamie Dimon Cautions on Loan Profits,” July 12, 2013; “Executives Cash in as Cheap Debt Funds Buybacks,” May 21, 2013; “Apple under Pressure on $137bn cash pile,” February 7, 2013; “US Groups Have $2tn to Play with This Year,” January 5, 2012.
Corporate governance would be a non-issue if firms simply had owners. Governance ma"ers because authority in corporations is divided between managers and shareholders, and they don’t always agree.
To understand trends in corporate investment, we need to take into account two fundamental facts about modern corporations. First, there is no single group corresponding to the "business owner," or "capitalist." The managers who control the day-to-day activities of the firm and the shareholders who are sometimes described as its owners are socially distinct groups; both have their spheres of authority over the firm and their claim on the profits it generates. The line between these two groups and the rights of each vary over time and between firms, but only in exceptional cases is one fully subordinate to the other.
Real businesses, like any large organization, are sociologically complex, with a variety of sites of authority and communities of interest, linked by a complex network of mutual rights and obligations that evolve over time. Many important questions about business behavior cannot be answered without taking into account actual or potential conflicts within the firm. We are accustomed to thinking of conflicts between workers and employers, or between labor and capital. But in some cases, conflict within capital, between shareholders and managers, has also been important. In particular, we cannot understand the recent changes in corporate investment except in the context of the changing relations between shareholders and managers since the 1980s.
The second fact, closely related to the first, is that a central arena for this conflict is corporate distribution of profits to shareholders via dividends and stock buybacks. If the shareholders were unambiguously the owners of the firm with no preference for whether wealth was stored in cash or capital equipment, for example, then shareholder payouts would be a non-event and uncontroversial; for this reason, as noted above, economists have sometimes wondered why businesses pay dividends at all. In the real world, however, payout policy is regarded to be of great importance by both shareholders and managers, and is a source of ongoing and sometimes acute conflict between them.
While economists historically have ignored this power struggle between managers and shareholders, it was central to business theory over the course of the 20th century and remains so today, as the balance of power within American corporations has shi#ed from shareholders to managers, and then shi#ed back toward shareholders.
In the early part of the 20th century, the courts tended to regard corporations as simply the property of shareholders, and the important role of stock markets as both a source of capital and an arena for changes of control through mergers and acquisitions meant that shareholders played an active role in the direction of corporations. Professional managers were a relatively new phenomenon and lacked a consciousness of themselves as a distinct professional group. But by the end of the 1920s, the management profession had become well established, with the establishment of business schools and a distinct career track. Thanks to the reforming politics of the Progressive Era, the idea that managers were stewards of the general good and not just agents of shareholders had become widely accepted. And a#er the crash of 1929, financial markets’ role in the day-to-day operations of American corporations was greatly curtailed. The result was what has come to be called “managerialism” — a system in which professional managers directed most corporations based on their own judgment, with shareholders’ role reduced to collecting their dividend payments (Davis 2009, Dumenil and Levy 2011, Henwood 1998). The shi# in power from managers back to shareholders will be a central topic of the rest of this paper.
Economists have developed a range of theories to model questions of corporate governance, many of which do not take into account the political ba"les so o#en described in the business press.
Copyright 2015, the Roosevelt Institute. All rights reserved. WWW.ROOSEVELTINSTITUTE.ORG 6

The relationship between shareholders and managers, like many questions of corporate governance and corporate finance, is challenging for economic theory because, on the face of it, it does not involve the allocation questions that are economists’ central concern. The fundamental question for economists is the most efficient way to combine labor, capital, and other factors to produce market outputs. This should not depend on the legal title given to the combination, or the form in which the surplus is distributed to the owners of those factors.
Thus, much of the economic literature on corporate finance focuses on its irrelevance. Most famously, Franco Modigliani and Merton Miller, in a 1958 paper and many later ones, showed that under certain assumptions, theoretically a firm’s capital structure will have no effect on its real production decisions. Regardless of who owns the firm, how much debt the firm carries, or how much the owners get paid, the firm will use the same inputs to produce the same outputs and sell them at the same price. (This work would eventually win both of them Nobel Prizes.)
Fisher Black applied a similar analysis to dividend policy in his widely cited 1976 article on “The Dividend Puzzle.” His central point is that there is no reason for rational investors to care about dividends. If a firm’s shares reflect the present value of the firm’s assets, then every dollar of dividends paid should reduce the market value of the firm by the same amount, leaving shareholders no be$er off.
“The dividends a company pays do not affect the value of its shares or the returns to investors,” Black argues, “because the higher the dividend, the less the investor receives in capital appreciation, no ma$er how the corporation’s business decisions turn out.” As Black notes, this claim is a straightforward application of the Modigliani-Miller theorem, and follows almost inevitably from the standard assumptions of complete markets and rational investors. “Under the assumptions of the Modigliani-Miller theorem,” Black continues, “a firm has value even if it pays out no dividends. Indeed, it has the same value it would have if it paid dividends.”
Black goes on to consider and reject various possible explanations. Some — like signaling and conflicts between debtors and creditors — seem inadequate to explain why firms pay out half their earnings (as it then was) to shareholders; others, like taxes and the costliness of eternal funds, would seem to make paying dividends strictly worse for shareholders than retaining funds in the firm, making the puzzle even deeper. The article concludes: “What should the individual investor do about dividends in his portfolio? We don’t know. What should the corporation do about dividend policy? We don’t know.” In the 40 years since Black posed these questions, there has been no shortage of economic research on corporate governance and payout policy, but no consensus on the solution to the puzzle has been reached.
The extensive literature on corporate governance continues to struggle with these questions. A typical (and widely cited) article on corporate capital structure opens with a conscious echo of Black: “How do firms choose their capital structures? Again, the answer is, ‘We don’t know’” (Myers 1984). At the root of the problem, perhaps, is the fundamental dichotomy originally noted by Modigliani and Miller and by Black: economic theory is intended to deal with the allocation of real resources, while corporate governance and corporate finance deal with the pa$ern of ownership claims and cash payments. There is no obvious connection between these two sets of questions. Or in the words of Jean Tirole, who won the 2014 Nobel Prize in economics for his own work on corporate finance, in orthodox theory “the size of the pie is unaffected by the way it is carved.” Of course this does not mean that economists have nothing to say about governance. Much of this literature is summarized in Tirole’s Theory of Corporate Governance, which starts from the premise that “the dominant Arrow–Debreu general equilibrium model of frictionless markets” can say “li$le about the firms’ financial choices and about their governance” (2006).
Tirole’s work is part of an ongoing effort to square the circle and understand governance from requirements of production. The lack of any obvious link between the two domains has made the area fertile ground for alternative theories. Or as Tirole puts it, the Modigliani-Miller theorem has “acted as a detonator for the theory of corporate finance” by eliminating the possibility of any straightforward explanation of corporate finance in
Copyright 2015, the Roosevelt Institute. All rights reserved. WWW.ROOSEVELTINSTITUTE.ORG 7
terms of the models preferred by economists. It is certainly possible to tell stories about how problems in allocating real resources can be solved by assigning someone control over production, dividing participants into those inside and outside the firm, and commi$ing to a set of cash payments between them. One of the most important bodies of work in this vein focuses on information asymmetries, building on a seminal 1986 article by Joseph Stiglitz and Bruce Greenwald. There is no question that this literature has produced creative and original intellectual work. It is less clear that it has successfully addressed the central questions of concern for policymakers.
Conflicts between shareholders and managers are essentially political conflicts. The balance of power in these conflicts has shi#ed in favor of shareholders over time.
An alternative approach sees governance through a political lens. Despite the great diversity of approaches to corporate governance inspired by Stiglitz and others, much of it shares one common feature: it sees governance as an optimal solution to some objective problem. The implicit question is: given our assumptions about information asymmetries, production technology, and the rest of it, why would a rational agent choose this particular governance structure as the best one?
But maybe that isn’t the best way to think about governance. Maybe it is be$er to think of it in terms of a political conflict over the income generated by existing firms.
Thinking of the corporation as a political community inhabited by groups with conflicting interests is common in sociology and law. (For a superb recent example of this kind of analysis of corporate governance from a legal perspective, see Daniel Greenwood’s “Enronitis” (2004).) But it is less common in the economics literature. Probably the most important recent economics work on corporate governance as a form of political conflict — certainly with respect to payout policy — is the work of William Lazonick. In a series of papers and several books, Lazonick and his coauthors have documented the ways in which corporate decisions about production, compensation, buybacks, and investment are not solutions to some optimizing problem, but political questions whose resolution depends on the position of the different constituencies around the firm.
Lazonick emphasizes the conflict between top managers and all other constituencies, including both shareholders and workers. The present paper emphasizes the conflict between shareholders on one side and workers on the other, with managers eventually bullied and cajoled onto the shareholders’ side. But in emphasizing the political nature of corporate governance and the fundamental importance of governance for investment dynamics, this paper follows the trail blazed by Lazonick (Lazonick 2008, 2014; Lazonick and O’Sullivan 2000).
From our perspective, the critical question is who makes decisions within the business, and in whose interests those decisions are made. In the simplest economic models, corporations are simply property and their owners make decisions about them, in the owners’ interests, guided by market prices.
In reality, however, corporations face questions about sources and uses of funds to which “markets” give no unambiguous answer; nor do real corporations have unambiguous “owners” any more than states, families, or other human communities do. There is not a set of “principals” whose interests trump everyone else’s, but rather a decision-making process in which various organized groups play a role. The question of which groups dominate depends on legal rights, but also on cultural norms and the degree to which they can organize and overcome their collective action problems. In short, corporate governance is a form of politics.
Copyright 2015, the Roosevelt Institute. All rights reserved. WWW.ROOSEVELTINSTITUTE.ORG 8

THE MANAGERIAL FIRM, 1920-1980
Through much of the 20th century, professional managers ran corporations with li"le oversight from shareholders. Although these “managerial” firms did not always serve the interests of their workers or the broader society, they were commi"ed to using available resources for productive investment to ensure their own long-term growth and survival.
From the consolidation of the modern corporation in the 1920s until the 1980s, decisions about corporate borrowing, investment, and payments to shareholders were typically made by autonomous management. Shareholders’ rights as “owners” of a corporation were purely notional; in practice, they were passive income recipients. Corporate cash flow in excess of fixed dividend payments was at the disposal of management and served as low-cost funding for fixed investment or other corporate purposes. Meanwhile, the partitioned lending market and binding reserve requirements of the post-New Deal financial system meant that even creditworthy borrowers o#en faced credit rationing. In combination with generally high investment demand during this period, the result of these institutional features was that fixed investment was strongly constrained by financing. In this regime, profitability was important not only for investment demand, but also for financing investment.
Since the 1980s, however, shareholders have actively exercised their first claim on all of “their" firms’ funds, borrowed as well as earned, leaving firms under intense pressure to maximize cash payments to shareholders. We cannot make sense of the relationship between financial conditions and real activity today without understanding what a dramatic change this represents from the corporate governance regime that existed for most of the 20th century.
Before the 20th century, most businesses were managed directly by their owners, assisted by a small number of clerks. The same individuals made day-to-day decisions about the operations of the businesses and received whatever profits they generated. Joint-stock companies with shareholders were limited to a few specific institutions. But starting with the railroads in the later 19th century, industrial concerns began to exceed the size that could be practically managed by individual owners — a development exacerbated, at least in the U.S., by the frequent reluctance of the heirs of business owners to take over when the founder retired or passed away. The great merger wave of the 1890s saw the corporate form established for the first time across a wide range of industries, and within a few decades the separation of ownership from control had become the norm.
By the 1920s, the largest businesses were almost all run by professional managers, in the U.K., Germany, and elsewhere as well as in the U.S. The idea that a corporation even had owners in any but the most abstract sense seemed increasingly anachronistic. Economist John Maynard Keynes, in his 1926 essay “The End of Laissez-Faire,” argued that a similar atrophy of shareholders’ role was likely in any professionally managed business. Once joint-stock companies “have reached a certain age and size,” he wrote, they cease to operate as “individualistic private enterprise.” Keynes further observed, “One of the most interesting and unnoticed developments of recent decades has been the tendency of big enterprise to socialise itself. A point arrives in the growth of a big institution — particularly a big railway or big public utility enterprise, but also a big bank or a big insurance company — at which the owners of the capital, i.e. its shareholders, are almost entirely dissociated from the management, with the result that the direct personal interest of the la$er in the making of great profit becomes quite secondary. When this stage is reached, the general stability and reputation of the institution are more considered by the management than the maximum of profit for the shareholders.”
The idea that the development of capitalism naturally leads to the disappearance of the individual capitalist was developed by Keynes through his later writing, including The General Theory, in which he famously suggested that stabilizing output and eliminating mass unemployment would inevitably lead to “the euthanasia of the
Copyright 2015, the Roosevelt Institute. All rights reserved. WWW.ROOSEVELTINSTITUTE.ORG 9
rentier” (1936). In the United States, the same trend was observed at the time by economists like Thorstein Veblen, Berle and Means, and Joseph Schumpeter, and later described by historians like Alfred Chandler in his classic book The Visible Hand: The Managerial Revolution in American Business (1977). All agreed with Keynes that it made no sense to speak of shareholders as “owners” of corporations, and that the growth of professionally managed corporations was eliminating the economic function of the individual wealth owner. Not everyone was as sanguine about this development as Keynes, but almost every observer of the new corporate form agreed that it was real.
This view of managers as wholly autonomous reached its high point at mid-century. In the 1940s and ’50s, the idea that shareholders should exercise any substantive control over “their" corporations seemed as anachronistic as the idea that political power should rest with a feudal nobility. This comparison was made explicitly by the leading management theorist of the era, Peter Drucker:
“The mass-production revolution has completed the destruction of the power of the land-owning aristocracy of the ancien regime... But it has also dethroned the ruling groups of bourgeois society: the merchant, the banker, the capitalist... Where only twenty years ago the bright graduate of the Harvard Business School aimed at a job with a New York Stock Exchange house, he now seeks employment with a steel, oil or automobile company” (1950).
Drucker might have exaggerated, but only a li$le. In the mid-20th century, finance played li$le active role in the economy; financial wealth entitled the owner to a steady income and nothing more. The real decision-makers were the top managers of nonfinancial firms. And for them, “the primary objective...[was] the long-term reproduction, growth and safety of the firm itself... For the managerial firm, dividend payments, like interest payments, are a cost of autonomy from capital market constituents" (Cro$y 1990).
The corporate finance model of the managerial firm was the “hierarchy of finance”: retained earnings for investment, supplemented by borrowing (or occasionally stock offerings) when internal funds fell short. An increase in available funds typically was used for faster growth, not higher payouts.
What does the corporate finance decision look like inside the managerial firm? First of all, managers prefer to rely on internal funds rather than funds raised from markets. Borrowing means that credit markets get to second-guess managers’ decisions about the direction of the business; adding too much debt could result in loss of control over the firm if the ability to repay comes into question. It is much be$er to finance investment with retained earnings whenever possible, so that no one outside of the firm gets a veto and the consequences of a bad investment choice are less dire.
A second major feature of the managerial firm is that the managers don’t have to think much about shareholders. The shareholders’ dividend is set at a standard and conventional level, and adjusted only rarely in light of the firm’s long-term prospects. If the business ends the year with more money than usual, that just means managers can invest more than usual, or perhaps enter new markets, acquire competitors, raise wages, or use the windfall in some other way calculated to promote the long-term survival and growth of the business. In any case, managers regard any excess earnings of the firm as theirs to dispose of as they see fit; the shareholders get the dividend and nothing more.
When we analyze corporate finance decisions made on these principles more systematically, we find they have several implications. First, from the point of view of management, internal funds are a cheaper source of finance than borrowing; furthermore, the costs of borrowing rise as the business borrows more, since more debt means yielding more power to financial markets. This means that there will be a correlation between a firm’s recent earnings and its investment, independent of the expected returns on that investment. This correlation will be
Copyright 2015, the Roosevelt Institute. All rights reserved. WWW.ROOSEVELTINSTITUTE.ORG 10
strongest among firms, and in periods, where access to external funds is least available. In other words, in a managerial firm profits are important not just because they are the incentive for investment, but also because they help fund it. Or in more formal terms, the investment-cash flow correlation will be strongest when the credit supply curve is steep. Second, the managerial firm will borrow only if it has good enough investment prospects to not only use up its internal funds, but also overcome the costs associated with higher borrowing. So we will tend to see the most borrowing among the corporations that are doing the most investing (or the most investment-like activities, like expanding abroad.) Finally, with payouts fixed at a conventional level, there will not be any short-term association between payments to shareholders and either earning or borrowing. Over the longer term, of course, firms that consistently are more profitable will eventually come to pay out higher dividends.
THE SHAREHOLDER REVOLUTION
Since the 1980s, the managerial firm has given way to the financialized or “rentier-dominated” firm of the shareholder revolution.
What is the alternative to the managerial firm? One model is the classical firm in which the owner and manager are the same person. In this type of firm, control is o#en inherited within a family, just like other forms of property. This was the norm in the 19th century and is still common in smaller businesses today. Another alternative, however, is what is sometimes called the rentier-dominated firm. Rentier means someone, presumably wealthy, whose main income comes from ownership of financial assets. Historically, rentiers normally owned bonds, especially government bonds. (The term itself comes from rente, a French word for government bonds.) But for the purposes of corporate governance, rentiers are most important as owners of corporate stock, either directly or more o#en through various intermediaries.
For most of the 20th century, rentiers did not play an active role in the governance of “their” corporations. But since the 1980s, there has been a dramatic power shi# within U.S. corporations, to the extent that the old managerial firm has been mostly replaced by the rentier-dominated firm. As described below, this shi# initially had important elements of conflict, with the hostile takeover as the characteristic weapon used by shareholders against recalcitrant managers. But more recently, thanks to the combination of share-heavy compensation and career paths that no longer link them tightly to a single business, top managers have effectively become rentiers themselves.
This change in corporate governance to the rentier model has weakened the link between corporate cash flow and investment and helps explain the depth of the Great Recession and the weakness of the recovery. It also has important implications for macroeconomic policy. Starting around 1980, there was a concerted campaign to re-establish shareholders’ control over "their" corporations, and in particular over the level of payouts. Once shareholders were able to effectively exercise their claim on the firm’s cash flow, internal funds could no longer serve as a low-cost source of investment financing. Shareholders also exercised effective claims on firms’ borrowing capacity, with firms seen as providing insufficient payouts coming under pressure to take on additional debt. At a macroeconomic level, these institutional changes led to higher and more variable payouts to shareholders and to higher corporate leverage, and have weakened or even severed the link between corporate borrowing and corporate investment. Under the rentier-dominated regime of recent decades, we suggest corporate finance is no longer a system for ge$ing funds into firms, but is instead a system for ge$ing funds out of them.
The displacement of professional managers by shareholders and their representatives from rulership of corporate America is an important but li$le-discussed development in the late-20th century U.S. The best accounts of this transformation include the work of William Lazonick, Wall Street by Doug Henwood (1998),
Copyright 2015, the Roosevelt Institute. All rights reserved. WWW.ROOSEVELTINSTITUTE.ORG 11
Managed by the Market by Gerald Davis (2009), and The Crisis of Neoliberalism by Gerard Dumenil and Dominique Levy (2011).7
We can divide the shareholder revolution into two stages. The first stage, conflict, took place in the second half of the 1980s; the second stage, assimilation, took place more gradually a#er 1990.
The central front in the first stage was the hostile takeover. The takeover movement was one of the most significant economic developments of the 1980s, leading to changes in ownership — and o#en the outright disappearance — of a greater proportion of American corporations than in any comparable period except the two great merger waves of the turn of the 20th century and the 1960s. And unlike in those previous merger booms, a large share of the acquisitions in the 1980s were opposed by the management of the company being acquired.
Over the course of the 1980s, fully half of all U.S. corporations were the objects of takeover bids. In several years, more than 10 percent of total stock market capitalization was purchased in acquisitions, an extremely high proportion by historical standards (Holmstrom and Kaplan 2001). Among Fortune 500 companies, 28 percent were the object of takeover a$empts, the majority hostile and the majority successful (Davis 2009). These takeovers were explicitly described by those involved as a way for owners of financial assets to “discipline" the professional managers of the corporations (Scharfstein 1988).
The era of hostile takeovers did not extend past the 1980s; KKR’s takeover of RJR-Nabisco was the last major deal of its kind. By the mid-1990s only 5 percent of tender offers were contested, compared with as many as 40 percent a decade earlier (Holmstrom and Kaplan 2001). The decline of the hostile takeover was the result of both declining performance of these deals in the late 1980s and a less favorable legal and regulatory environment, symbolized by Michael Milken’s conviction for securities fraud in 1990. By the end of the 1980s, more than 40 states had passed new anti-takeover laws. In Delaware, where the bulk of large American corporations are incorporated, the state Supreme Court ruled in Paramount Communications v. Time Inc. that boards had broad latitude to refuse a takeover offer. Twenty-nine other states had explicitly granted boards this authority by state law (Blair 1993).
The disciplinary aspect of the rentier-management relationship was now more likely to take the form of shareholder activism, with large outsider investors publicly pressuring management to increase payouts and adopt “value-enhancing" policies, pushing for seats on the board, sponsoring resolutions, and threatening to sell their shares en masse. Coordination between activist shareholders was significantly eased by a 1992 SEC rule change that eliminated onerous disclosure requirements for communication between shareholders (Holmstrom and Kaplan 2003). Combined with behind-the-scenes pressure, this kind of shareholder activism acted as a nontrivial constraint on managerial autonomy (Henwood 1998).
Initially, public pension funds were the leaders in this form of rentier activism, along with a few individual activist investors. But other classes of institutional investors have since adopted the tactic of acquiring large stakes in corporations and then using them to pressure management into adopting more shareholder-friendly policies. Hedge funds, for example, made only 10 13D filings in 1994, the first year for which records are available.8 In 2007, hedge fund 13D filings peaked at 272 (Bebchuk et al. 2013).
Copyright 2015, the Roosevelt Institute. All rights reserved. WWW.ROOSEVELTINSTITUTE.ORG 12
7 In particular, chapter 6 of Wall Street, chapters 2 and 3 of Managed by the Market, and chapters 3-6 of The Crisis of Neoliberalism provide a useful description of this history.8 13Ds are the legally required disclosures investors must file with the SEC when they acquire a stake of 5 percent or more in a publicly traded corporation.

Increasingly a#er 1990, the adversarial relationship between rentiers and managers gave way to managers’ acceptance of maximizing shareholder value as “holy writ" (Davis 2009). By 1997, the repudiation of managerialism was sufficiently thorough for the Business Roundtable — representing the CEOs of the 200 largest American companies — to change its position on business objectives (a#er years of opposition) to read “the paramount duty of management and the board is to the shareholder and not to...other stakeholders" (Holmstrom and Kaplan 2003).
One reason for this reorientation of management priorities was the change in executive compensation practices that began in the 1980s but came into its own in the 1990s. Executive pay both rose steeply in absolute terms
Copyright 2015, the Roosevelt Institute. All rights reserved. WWW.ROOSEVELTINSTITUTE.ORG 13
The Changes That Made This Possible
Why did the shareholders win? This is a deep and difficult question. Clearly, however, there were a number of developments in the larger society that were favorable for shareholder victory.
The first is an intellectual revolution. The idea that corporations exist solely to maximize shareholder wealth is as old as the corporation itself, but it largely receded from view during the middle of the century. The idea that the stock market could enforce this principle by offering a “market for corporate control" was reintroduced by Manne (1965), but it initially had li$le impact on either the theory or practice of corporate governance. It was the work of Michael Jensen and coauthors that introduced the idea of takeovers and restructurings as tools for compelling management to put the interests of shareholders above those of other corporate stakeholders (Jensen 1986, 1993, 2000; Jensen and Meckling 1976). Over time, the ideas that shareholders are substantively the owners of the corporation, that maximizing returns to shareholders is the only function of the corporation, and that pursuit of other goals by management is a serious problem that needs to be solved by appropriate institutions, including a market for corporate control, came to dominate much economic and legal thinking about corporate governance.
The second development was a number of legislative and administrative reforms that made it more feasible for shareholders to assert their notional power over management. Among these were legal challenges to laws limiting hostile takeovers of corporations, including the Supreme Court’s 1982 decision in Edgar v. MITE striking down Illinois’s anti-takeover law and similar laws in other states (Davis 2009). Also important was the revision of anti-trust regulations by the Reagan Justice Department, also in 1982, which relaxed the limits on concentration within industries. This opened up new possibilities for intra-industry mergers and undermined the logic of conglomerates, the major initial target of hostile takeovers (Roe 1996).
A third major factor was institutional changes in financial markets that made takeovers and other changes of control more feasible. One dimension of this was a broadening of the funds available to finance changes in corporate control, as the rules on the classes of investments permissible by various institutional funds were progressively relaxed, starting with pension funds in the 1970s and S&Ls in the early 1980s (Lazonick 2008). Later, the generalization of stock options and related compensation practices, plus much greater inter-firm mobility of top management, changed the incentives and worldview of top executives to be closer to that of shareholders.
The last major change was ideological. The idea that the creation of shareholder value is the sole purpose of a corporation, and of economic life in general, has been widely adopted in the business press and culture at large. Combined with this was a decline in the idea of the corporation as a social organism or institution with an autonomous social purpose and with stable relationships with its employees, customers and suppliers, and communities where it operated. Indeed, this shi# extended beyond the corporation throughout social life. The breadth of this vision suggested that America was becoming a “portfolio society" dominated by the “capital fiction," in which all social relationships are evaluated as income-yielding assets (Davis 2009).
and increasingly took the form of stock options; by the mid-1990s, options accounted for half of the compensation of CEOs at large U.S. corporations (Lazonick 2008). Less dramatic than the growth of stock-based executive pay but arguably just as important was the change in the career trajectory of successful managers: they were now less likely to reach executive positions through promotion within a given firm, which necessarily entailed a certain identification with the firm as an institution and the formation of social ties with others connected with it. Instead, top executives were more likely to be recruited from outside the firm. As managerial turnover increased, the cult of the individual “superstar CEO" took hold and boards became more inclined to hire outsiders for top positions (Kaplan and Minton 2012). Furthermore, given that leveraged buyouts did not, as early advocates had predicted, herald a shi# away from the corporate form, but instead served as a device to redistribute claims on a firm whose legal and organizational structure remained essentially unchanged, simply switching the personnel at the top was a more straightforward way of reorienting the firm toward shareholder value than the more disruptive process of changing ownership (Bhagat, Shleifer, and Vishny 1990).
In the rentier-dominated firm, shareholders have a claim not just on a conventional dividend, but on every additional dollar that becomes available to the firm, whether through higher earnings or more accessible credit.
The early proponents of the shareholder revolution hoped that financial managers at investment banks and private equity funds could entirely replace the top layers of corporate management, but these dreams were not fulfilled. While Mi$ Romney, for example, certainly exercises more power over production and investment decisions via his financial claims than his predecessors in the 1960s or 1970s could have, the overwhelming majority of corporate America continues to be run by professional managers a$ached to particular firms. Contrary to Michael Jensen’s hopeful forecasts that fund managers would replace corporate headquarters entirely, shareholders do not make the day-to-day decisions in American corporations. They do, however, sharply limit the decisions made by the managers, with the result that corporate finance in a rentier-dominated firm looks quite different than in a managerial one.
The big difference is that instead of receiving a stable, conventional dividend, shareholders in the rentier-dominated firm effectively choose how much will be paid out to them each year in the form of dividends and stock buybacks. Retained earnings no longer constitute a low-cost source of financing for investment, since only a high expected return will convince shareholders to leave earnings in the firm rather than take them as payouts. Shareholders can, and o#en do, demand payouts equal to total earnings, or even more.
To understand the corporate finance decision in a world of empowered shareholders, it’s useful to think about a rate of return we’ll call the “rentier opportunity cost.” This is the minimum expected return an investment project must have for shareholders to allow the corporation to invest funds in that project rather than paying them out. The rentier opportunity cost could just be the return shareholders expect if they invest their funds elsewhere, but usually it will be higher because shareholders place a higher value on money under their direct control than on money locked up in a corporation. In the managerial firm, investment projects can go forward if they offer a return greater than the cost of finance, which is very low for internal funds. In the rentier-dominated firm, a project only happens if expected returns also exceed the rentier opportunity cost.
In the managerial firm, more money coming in — from sales or from borrowing — typically means more money spent on fixed investment. In the rentier-dominated firm, more money coming in means more money flowing out to shareholders in the form of dividends and stock buybacks.
With a clear vision of the managerial and rentier-dominated firm, we can now ask how the difference between them will be reflected in empirical data. The first effect of rentier dominance is that investment will be lower, especially among firms and in periods with high cash flow from operations. Another way of looking at this is that
Copyright 2015, the Roosevelt Institute. All rights reserved. WWW.ROOSEVELTINSTITUTE.ORG
14

the correlation between investment and earnings we expect to see in the managerial firm does not exist for the rentier-dominated firm, since earnings no longer serve as low-cost investment finance. So both across firms and over time, we should see a weaker link between earnings and investment under rentier dominance than under managerialism.
While investment is lower and less correlated with earnings under rentier dominance than under managerialism, payouts to shareholders will be higher and more closely correlated with earnings. In a managerial firm, surprisingly high profits mean more money for investment. In the rentier-dominated firm, shareholders have first claim on any new earnings. If the expected returns on new investment haven’t changed, there is no reason for high profits to imply high investment. The extra money will just be paid out to shareholders instead. As a practical ma$er, share buybacks vary a great deal from year to year, while dividends are more stable. But dollars flow from corporate treasuries to shareholders either way.
With respect to borrowing, the behavior of the rentier-dominated firm depends on circumstance. When profits are low and credit is expensive, there will not be much difference between the two regimes. If the effective interest rate is greater than the rentier opportunity cost, then businesses will borrow only when they have good investment opportunities, just like under managerialism. But when profits are high and credit is cheap, it’s a different story. If the cost of borrowing is less than the rentier opportunity cost, it will make sense for the rentier-dominated firm to incur debt simply in order to increase payouts to shareholders — something the managerial firm would never do. So one of the key empirical indicators of a shi# from managerialism to rentier dominance is a positive correlation between borrowing and shareholder payouts.
A surprising but unambiguous implication of all this is that under rentier dominance, investment and borrowing decisions are generally unrelated. The firm invests up to the point where the expected return on the marginal product equals the rentier opportunity cost. Independently, it borrows until the marginal cost of additional debt equals the rentier opportunity cost. So a change in investment demand has no effect on borrowing and a change in the supply of funds has no effect on investment. Instead, shi#s in either investment demand or the availability of funds show up as changes in payouts. So we predict that the correlations of investment with cash flow and borrowing under managerialism will be replaced by correlations of shareholder payouts with cash flow and borrowing under rentier dominance.
The empirical evidence for the shi# from managerialism to rentier dominance is a weakening of the correlations of cash flow and borrowing with investment and a strengthening of correlations with shareholder payouts.
Our hypothesis is that during the 1950s through the 1970s, corporate finance and investment decisions broadly fit the managerial model. But since the shareholder revolution, corporate behavior has been closer to what we are calling the rentier dominance model. In the earlier period, shareholder payouts did not vary much from year to year, and the main limitation on investment was the ability to acquire funds, either from earnings or through credit markets. So a large fraction of each additional dollar that flowed into the corporate sector was invested. Since the mid-1980s, however, the increased power of shareholders meant that new investment projects could only go forward if their expected returns were high enough to make it worthwhile, from shareholders’ point of view, to have money in the firm rather than taking it out in the form of immediate payouts. And for whatever reason, shareholders placed a much higher value on a dollar under their direct control than on the same dollar inside a business in which they owned shares. Many projects that would have been worth investing in under the old system did not meet this new, higher threshold. As a result, an increase in funds available to the corporate sector had a much smaller effect on investment and instead tended to increase payouts to shareholders.
During the tech boom of the late 1990s, many businesses expected (rightly or wrongly) that they had very high-return projects available to them. So investment was high despite the very high “hurdle rate” imposed on new
Copyright 2015, the Roosevelt Institute. All rights reserved. WWW.ROOSEVELTINSTITUTE.ORG 15

investment by shareholders. But since then, corporate investment has been low by historic standards despite high corporate profits and abundant credit available to the corporate sector.
EMPIRICAL HYPOTHESIS
In the remainder of the paper, we look at data on corporate sources and uses of funds and see how well they fit this story. If depressed corporate investment is indeed related to stronger claims by shareholders, there should be a clear break in the relationship between sources and uses of corporate funds in the mid-1980s. Specifically, we should see several pa$erns:
1. There will be a strong correlation between borrowing and investment in the pre-1980s period, but this relationship will weaken or vanish entirely in the later period.
2. There will be a strong correlation between cash flow and investment in the earlier period, which will also weaken in the later period.
3. There will be no correlation between borrowing and payouts in the earlier period, but a strong relationship in the later period.
4. There will be some correlation between payouts and cash flow in the earlier period, but this relationship will grow stronger in the later period.
5. The changes in the borrowing correlations will probably be sharper than the changes in the cash flow correlations, because there are also non-financing channels linking profits to payouts and investment. In particular, even if internal funds are no longer important as a source of investment funding, high profits will still be associated with high expected returns.
6. The availability of funds probably varies more over the business cycle than does investment demand, which should be based on a firm’s long-term prospects and not just on current conditions. This implies that the early period’s correlation between cash flow and investment will be strongest during crises, when credit is tight, while the later correlations of cash flow and borrowing with payouts will be strongest during booms.
It is worth developing the last point a bit more. Under the managerial model, the credit supply curve only ma$ers when the supply of funds is low relative to demand. Thus, the association between investment and borrowing should be stronger among firms facing, and in periods of, tighter credit constraints. Under the rentier dominance model, by contrast, firms are always on the credit-supply curve. That is, rentiers demand that "their" corporations take full advantage of their borrowing capacity in order to increase payouts. Because payouts are residual, i.e. lowest priority use of funds, this constraint only ma$ers when firms have access to funds beyond those needed for high-expected-return investment and other internal purposes. This is most likely at times when cash flows from operation are high and credit is cheap and abundant. In periods of falling profits and tighter credit constraints, by contrast, it is more likely that the demand-for-funds curve will cross the supply-of-funds curve and variable payouts will go to zero. Thus the correlation between payouts and borrowing will be weaker in periods of tight credit constraints and among firms facing more restricted credit supplies. So while we hypothesize that in general there will be clearer links of borrowing and cash flow with payouts under rentier dominance, over shorter horizons expect that the strength of these links will show strong procyclical variation. By the same logic, the strengthening of the payout relationships will be strongest among larger firms and in general those with the greatest borrowing capacity.
Dividends and share buybacks are two ways of doing the same thing, and should be combined as one metric.
In this paper, we are combining share buybacks with dividends into a single measure of payouts to shareholders, as is common in the corporate finance literature. Both dividends and repurchases are payments from firm to
Copyright 2015, the Roosevelt Institute. All rights reserved. WWW.ROOSEVELTINSTITUTE.ORG 16
shareholders. They equally reduce resources available to the firm, and, at a sufficient level of abstraction, provide equal income for shareholders. It is well known that, in simple models of share valuation based on the present value of expected future dividends, the value of shares does not change when firms substitute repurchases for dividends (Fama and French 2001).
The empirical literature on stock buybacks is generally consistent with the idea that buybacks can be aggregated with dividends, that they draw on funds that might otherwise be used for investment or other purposes, and that their purpose is to move cash out of the corporation in order to limit tendencies toward managerialism.
A number of papers, such as Jagannathan et al. (2000) and Di$mar and Di$mar (2004), start from the premise that dividends and repurchases represent two alternative forms to distribute cash to shareholders, and then ask what guides the choice between them. Like most of this literature, they find that dividends and buybacks do indeed appear to be substitutes; they are carried out by the same firms and have similar effects on their balance sheets. Like Fama and French, these papers find that repurchases are more likely to reflect temporary increases in cash flow. Thus, the shi# toward repurchases reflects increased cyclical variation in payouts. Le# unaddressed is the question of why temporary windfalls should be paid out to shareholders at all. A firm facing financial constraints would be expected to retain them.
An answer is suggested by another strand of the literature, including Nohel and Tarhan (1998), Lie (2000), and Myers (2001). These papers suggest that paying out windfalls via share repurchases is important to mitigate "agency problems," or conflicts of interest in which managers are not faithful agents for shareholders. With stable dividends, short-term increases in available funds would be at the disposal of management; distributing them through buybacks is a way of controlling the temptation to "overinvest." This evidence that buybacks are a way of transferring to shareholders funds that might otherwise be used for investment is consistent with the argument we make in this paper. But like almost all of the principal-agent literature on corporate governance, these papers take it for granted that only shareholders represent the social interest. If autonomous managers might choose a different level of investment from shareholders, they assume that the task of governance arrangements is to make sure that shareholders’ views prevail.
EMPIRICAL RESULTS
The first test is to look across firms in a given year to see whether correlations between flows of money into and out of the firm change in the predicted way.
To test this hypothesis, we examine data for the corporate sector as a whole and for individual corporations on two sources of funds (cash flow from operations and net borrowing) and two uses of funds (fixed investment and payouts to shareholders, including net share repurchases). Another way of asking the question is: is there a clear difference between the two periods in the extent to which additional funds going into the corporate sector remain there, financing fixed investment and other corporate expenditures, versus the extent to which they quickly pass through and flow out to shareholders? The more leaky corporate buckets are (or perhaps be$er, the more easily they overflow), the less difference the economy-wide supply of liquidity will make to the amount of activity inside the firms. As we will see, the data is broadly consistent with the idea that the shareholder revolution had exactly this effect: the marginal use of funds for corporations has shi#ed from investment toward payouts, reducing the importance of credit market conditions for real investment.
We test this using simple regression analysis. We perform two sets of regressions, one with investment as the dependent variable and the other with shareholder payouts as the dependent variable, and with cash flow from operations and credit market borrowing as the independent variables for each. For the firm-level data, we perform one regression for each year to see how the relationship between each of the uses of funds and the two
Copyright 2015, the Roosevelt Institute. All rights reserved. WWW.ROOSEVELTINSTITUTE.ORG 17
sources of funds has changed over time. For the time-series data, we perform two regressions, one for the period before 1985 and the other for 1985 to the present. The firm-level data is drawn from the Compustat database, described below. The economy-wide data is from the financial accounts published by the Federal Reserve. (These accounts were formerly known as the Flow of Funds, and are still o#en referred to by that name.)
Both firm-level and aggregate data from the Federal Reserve’s financial accounts are consistent with the hypothesis of a shi# from managerial corporate finance regime to a rentier-dominated one. Before the 1980s, we find both large coefficients (indicating a strong effect) and high measures of correlation (indicating a statistically important effect) in the regressions of corporate investment on corporate borrowing and cash flow from operations. This is consistent with the idea that investment was o#en limited by the availability of funds and was the main use for external funds from the credit market. During this early period, on the other hand, there is no association between shareholder payouts and borrowing. But since the mid-1980s, the associations between investment and borrowing and between investment and internal funds have both become much weaker. This suggests that for most firms, financing is no longer the main constraint on investment, and that non-investment uses have become more important for credit demand.
At the same time, a new association has appeared between shareholder payouts and both internal funds and credit-market borrowing. These relationships — especially the relationship between payouts and borrowing — are hard to explain in the old paradigm in which businesses borrow to invest and only increase payouts once good investment opportunities are exhausted. This was the usual assumption in the postwar decades. In that paradigm, a firm with less money than it needs for investment (and other costs of expansion) will issue debt to raise the additional money needed. And a firm that is bringing in more money than its expansion plans require will pay out the excess to shareholders. So when we look across firms, we should find either high borrowing or high payments to shareholders, but not both together. Similarly, over time we would expect to see borrowing and payouts move inversely, with more borrowing in periods when expected returns on investment are high and more shareholder payouts in periods when expected returns on investment are low.
Since the mid-1980s, however, we see a very different pa$ern. We find that the firms that borrow the most also tend to be the firms making the largest payouts to shareholders. And we find that both borrowing and payouts rise at business cycle peaks and fall in recessions. These pa$erns are hard to make sense of if we think of corporate borrowing mainly as a way of financing investment. They are easier to explain if we think of borrowing as largely driven by shareholders’ demands for increased payouts. In this case, it is not surprising that both borrowing and payouts rise at business cycle peaks, when liquidity is abundant and borrowing standards are more lenient, and both fall a#er crises when liquidity becomes scarce and credit standards get stricter. Finally, both the change in investment correlations and the change in payout correlations can be precisely dated to the mid-1980s, exactly when we know that the institutional changes that composed the shareholder revolution were taking place.
Cross-Sectional Data
The firm-level tests use the data from the Compustat database, which covers all publicly-traded firms in the United States going back to the 1950s. In these tests, investment includes R&D spending and payouts include both dividends and share repurchases.
The natural way to explore these relationships is to ask whether the corporations that have the most money flowing in from borrowing or earnings tend to be the same ones that are investing the most or the ones that are paying out the most to shareholders. For corporations with publicly traded shares, all the relevant data is reported in their annual reports and related filings.
Copyright 2015, the Roosevelt Institute. All rights reserved. WWW.ROOSEVELTINSTITUTE.ORG 18
Accordingly, we investigate the predictions of the previous section using firm-level data from Compustat. Compustat is a database maintained by Standard & Poor’s that compiles financial data from SEC filings for all companies traded on major U.S. stock exchanges. This includes most of the largest businesses operating in the United States. The number of firms in the database has increased from around 2,000 in 1960 to more than 10,000 in recent years. We exclude all firms in finance, insurance, and real estate and all firms whose primary business is outside of the United States. We also exclude any observations that are missing data for total assets, investment, credit-market debt, earnings, or depreciation. This eliminates about half the observations, leaving around 1,000 firms each year in the 1950s, rising to 5,000 per year in the 2000s. For the payout regressions, we also exclude observations missing data for dividends and share repurchases. Share repurchase data has only been reported since 1970, so we don’t do the firm-level payout regressions for earlier dates.
Investment is defined as capital expenditure plus research and development spending for years in which that is reported separately, payouts are total dividends plus stock repurchases, net borrowing is the year-over-year change in debt, and cash flow is income before extraordinary items plus depreciation and amortization. All variables are normalized by firm total assets and then winsorized at the 1 percent and 99 percent levels. TThe sample is limited to the largest 25 percent of firms by assets for each year. There are a number of reasons to only focus on the largest firms here. The majority of publicly traded firms are relatively small, but aggregate activity is dominated by the largest firms. The largest 25 percent of firms in the Compustat database for each year typically account for over 90 percent of total assets, investment, borrowing, and shareholder payouts, while the smallest 25 percent account for 1 percent or less. But because of the much greater variance of financial flows associated with small firms, if we included them they would dominate the results.
The shareholder value revolution was very much focused on the largest corporations, where the separation of ownership and control and the autonomy of management had been most fully developed. Smaller firms are more likely to be closely held, with less professional management in the first period and less pressure from external shareholders in the later one. In addition, a large majority of smaller firms never report positive profits, even in boom years. In general, the story of the shi# away from managerialism is focused on the largest firms.
The cross-sectional results are reported in Figures 1 through 4. These are ordinary least squares regressions of investment and payouts, respectively, on borrowing and cash flow, one regression for each year. The central line shows the estimated coefficient on each of the two right-hand side variables. The crosses show a range of two standard errors above and below the point estimate. Share repurchases are reported only on cash flow statements, which are not included in Compustat for years before the early 1970s, so the payout regressions begin in 1973.
In the 1960s, an additional dollar of earnings or borrowing was associated with about a 40-cent increase in investment. In recent years, the same dollar is associated with less than 10 cents of additional investment.
What the figures show is how we would expect the dependent variable to change if the independent variable increased. So, for example, if we look at corporations in 1965, we find that each additional dollar of borrowing is associated with around 30 cents of additional investment. So we would expect a business that added debt equal to 10 percent of its assets to be investing about 3 percent of its assets more than an otherwise similar business that did not take on any new debt in that year. The crosses show 5 percent confidence intervals. So looking again at 1965, we see that, under conventional assumptions, there would be less than a 5 percent chance of the association between investment borrowing we see in the data occurring by chance if the true relationship were weaker than 0.2 (20 cents of investment for each additional dollar of borrowing) or stronger than 0.4. So while we can’t be sure of exactly how much of the relationship we are looking at is due to chance, we can be confident that most of the pa$ern we are seeing is not. (The reason the confidence intervals are so wide in the earliest
Copyright 2015, the Roosevelt Institute. All rights reserved. WWW.ROOSEVELTINSTITUTE.ORG 19

Figure 1: Firm-Level Investment-Borrow Correlation
The figure shows the coefficient on borrowing of annual regressions of capital expenditure on borrowing and cash flow for the largest 25 percent of nonfinancial corporations by assets, as reported in Compustat. Variables are normalized by total assets.
Figure 2: Firm-Level Investment-Cash Flow Correlation
The figure shows the coefficient on cash flow of annual regressions of capital expenditure on borrowing and cash flow for the largest 25 percent of nonfinancial corporations by assets, as reported in Compustat. Variables are normalized by total assets.
0.0!
0.1!
0.2!
0.3!
0.4!
0.5!
0.6!
0.7!
0.8!
0.9!
1952!
1955!
1958!
1961!
1964!
1967!
1970!
1973!
1976!
1979!
1982!
1985!
1988!
1991!
1994!
1997!
2000!
2003!
2006!
2009!
2012!
0.0!
0.1!
0.2!
0.3!
0.4!
0.5!
0.6!
0.7!
0.8!
0.9!
1.0!
1952!
1955!
1958!
1961!
1964!
1967!
1970!
1973!
1976!
1979!
1982!
1985!
1988!
1991!
1994!
1997!
2000!
2003!
2006!
2009!
2012!
Copyright 2015, the Roosevelt Institute. All rights reserved. WWW.ROOSEVELTINSTITUTE.ORG 20
years is that there are fewer observations in those years. In general, the larger the sample, the more precise the estimated regression coefficients.)
As Figures 1 and 2 show, firm-level variation in investment show a clear regime shi# in the mid-1980s. For investment and borrowing, the coefficient averages around 0.3 for the pre-1985 period and less than 0.1 in the later period. There is a sharply defined transition between the two periods, with the estimated relationship between investment and borrowing fairly stable in the periods before 1980 and a#er 1985 and dropping sharply in the first half of the 1980s. Remarkably, the relationship between investment and borrowing is weaker in every year a#er 1982 than in any earlier year. Note that the confidence intervals for the later period generally do not overlap the intervals for the earlier period. This means that the difference in coefficients will easily satisfy conventional significance tests. So we can confidently reject the possibility that this change is just the result of random noise in the data. Needless to say, that does not prove it is explained by our own hypothesis. But it does prove that there is a real phenomenon there to explain.
For cash flow and investment, there is also a clear transition in the early 1980s from a stronger to a weaker relationship, with coefficients averaging 0.4 before 1985 and 0.15 in the later period. Interestingly, the relationship is especially weak during the tech boom years of the late 1990s. Between 1998 and 2001, the correlation coefficient is not significantly greater than zero, meaning there is no statistical relationship between a corporation’s earnings in those years and its investment spending. This is not surprising, given what we know about the high levels of investment and abundant external funding for businesses in the tech sector during those years. Anecdotally, we are all familiar with businesses that had zero or negative earnings during the late 1990s but maintained high levels of investment spending.
Strikingly, the relationship between cash flow and investment also disappears during 2009, when the bulk of the most recent fall in investment occurred. This is an important challenge to the view that credit constraints were a major factor reducing investment in the Great Recession. There is an extensive empirical literature showing that tighter credit constraints are, in general, associated with a stronger investment-cash flow sensitivity (Fazzari, Hubbard, and Petersen 2000). And common sense tells us that if there is no statistical association between a given business’s level of investment and the amount of money it is currently earning, access to funds is probably not the most important factor in investment decisions. (Credit conditions could still be important indirectly, via changes in households’ ability to finance consumption or residential investment.)
The weakening or disappearance of the link between investment and firms’ two main sources of funds is an important macroeconomic shi#; it creates problems in particular for accounts of investment fluctuations that depend on the direct effects of credit constraints on business investment. In the absence of a strong relationship across firms between investment and sources of funds, the “financial theory of investment" that described the world before the 1980s may be a poor fit for today’s corporate sector.
Payouts
Today, there is a strong correlation between shareholder payouts and borrowing, a relationship that did not exist before the mid-1980s. There is also a stronger correlation between profits and payouts, at least during booms.
Next, in Figures 3 and 4, we consider shareholder payouts, meaning dividends plus share repurchases. While there is only a decade of payout data from the early period, there is still evidence of a regime change. For payouts and borrowing, there is a clear strengthening of the relationship over time: the coefficient is not significantly greater than zero for any year before 1985, but is significantly greater than zero for two-thirds of the years a#er 1985. The average coefficient value is very close to zero for the pre-1985 period and around 0.05 in
Copyright 2015, the Roosevelt Institute. All rights reserved. WWW.ROOSEVELTINSTITUTE.ORG 21
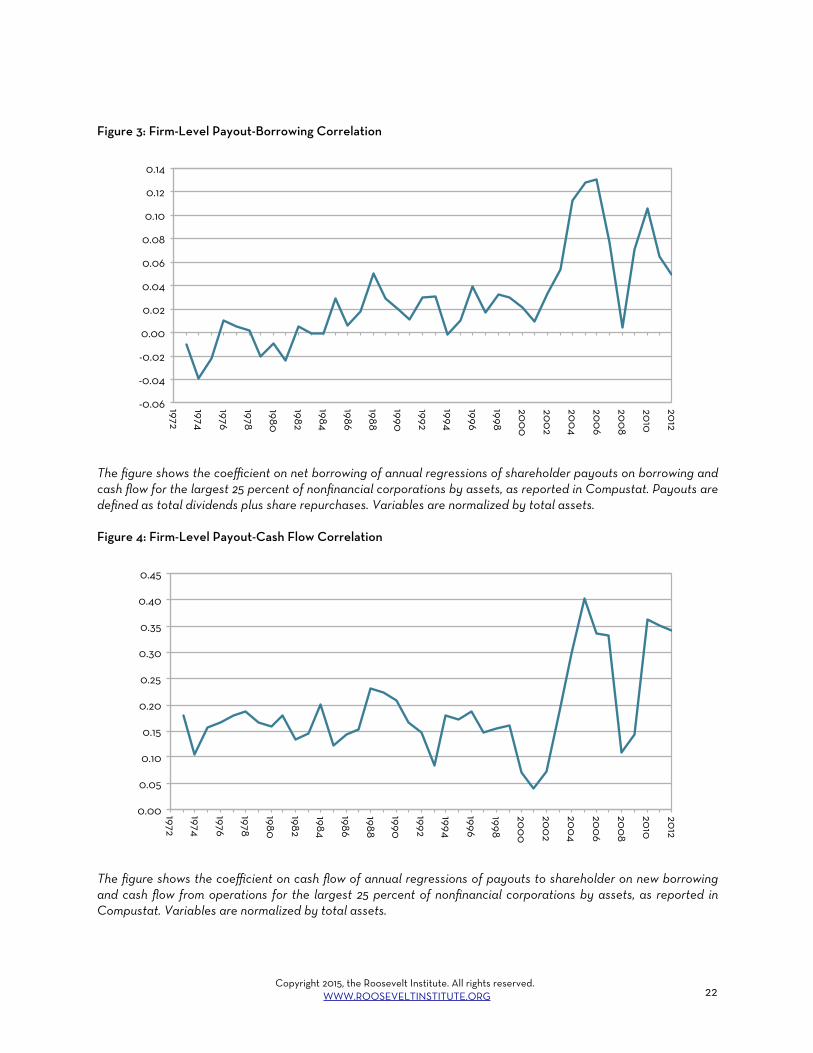
Figure 3: Firm-Level Payout-Borrowing Correlation
The figure shows the coefficient on net borrowing of annual regressions of shareholder payouts on borrowing and cash flow for the largest 25 percent of nonfinancial corporations by assets, as reported in Compustat. Payouts are defined as total dividends plus share repurchases. Variables are normalized by total assets.
Figure 4: Firm-Level Payout-Cash Flow Correlation
The figure shows the coefficient on cash flow of annual regressions of payouts to shareholder on new borrowing and cash flow from operations for the largest 25 percent of nonfinancial corporations by assets, as reported in Compustat. Variables are normalized by total assets.
-0.06!
-0.04!
-0.02!
0.00!
0.02!
0.04!
0.06!
0.08!
0.10!
0.12!
0.14!
1972!
1974!
1976!
1978!
1980!
1982!
1984!
1986!
1988!
1990!
1992!
1994!
1996!
1998!
2000!
2002!
2004!
2006!
2008!
2010!
2012!
0.00!
0.05!
0.10!
0.15!
0.20!
0.25!
0.30!
0.35!
0.40!
0.45!
1972!
1974!
1976!
1978!
1980!
1982!
1984!
1986!
1988!
1990!
1992!
1994!
1996!
1998!
2000!
2002!
2004!
2006!
2008!
2010!
2012!
Copyright 2015, the Roosevelt Institute. All rights reserved. WWW.ROOSEVELTINSTITUTE.ORG 22
the later period. In the 2000s it reaches 0.1. The relationship also shows a cyclical pa$ern, weakening in 1994 (a#er the end of the official recession, but while corporate borrowing was still falling), 2001, and 2008.
For payouts and cash flow, there is li$le evidence of a secularly strengthening relationship, but we do see increasingly large variation over the business cycle. The most dramatic feature of Figure 4 is how much the cash flow-payout relationship weakens in each of the last two recessions, and how much it strengthens in each following recovery. This strongly cyclical behavior is exactly as predicted in our hypothesis. Remember, in the rentier dominance regime, variation in internal funds only leads to variation in payouts when the firm has more than enough funds to pay for all projects with an expected return high enough to satisfy shareholders. When profits and borrowing capacity are low, it is likely that even when shareholders insist on a very high return (or “hurdle rate”) for new projects, firms still will not have enough internal funds to pay for even the projects that cross that high bar. In this case, there will be no correlation between internal funds and payouts. Put another way, the Jensenian injunction to "disgorge the cash" applies only to funds in excess of the firm’s (rentier-approved) requirements. Given that firms’ financing needs do not vary too much over the cycle, a much larger share of funds will be excess in the boom than in the slump. So the boom is when we should expect to see the strongest relationship between cash flow and payouts.
In addition, it is important to remember that there are other uses for cash besides investment and shareholder payouts. In particular, precautionary cash holdings may be an important use of funds during crises and downturns. This may also help explain why the cash flow-payout relationship weakens during recessions: fearful managers may be more likely to add any excess funds to their stock of cash rather than paying them out to shareholders. Finally, there is a mechanical reason why we would expect to see this cyclical pa$ern in a world of shareholder dominance. Most of the variation in shareholder payouts comes from share repurchases; firms that pay dividends do not change them much from year to year. And firms in distress almost never issue new shares. In other words, a firm cannot make negative payouts, so once it reduces them to zero, there will be no correlation between payouts and any further fall in profits. The number of corporations in this situation will be higher in recessions than in booms.
Firm Results Summary
Through the 1970s, there was a strong statistical relationship between flows of funds into corporations and their investment and no relationship between borrowing and payouts to shareholders. Today, the relationships of cash flow and borrowing with investment are weaker, while there is a strong new relationship between payouts and borrowing.
Another view of the changing relationship between sources and uses of funds across firms is shown in this paper. Here we have used the average value of each flow over the previous three years for 1960, 1975, 2005, and 2010. These results can be seen as snapshots of the financing decision across firms before and a#er the shareholder value revolution.
As Table 2 shows, in the early period, knowing the size of the main flows of funds into a firm is sufficient to predict the firm’s level of investment with a reasonable degree of precision. When we look across the largest corporations in a given year, we can say with confidence that the ones that are borrowing much more than average are also investing much more than average. Similarly, we can confidently say that investment is concentrated at the firms with the largest flows from operations. Roughly, it appears that 50–75 cents of each dollar of additional borrowing and 35–50 cents of each additional dollar of cash flow goes to investment.
Shareholder payouts, by contrast, are unrelated to borrowing. This is not surprising; in standard models of corporate investment, a given firm is either borrowing or making payouts to shareholders, but not both at once.
Copyright 2015, the Roosevelt Institute. All rights reserved. WWW.ROOSEVELTINSTITUTE.ORG 23
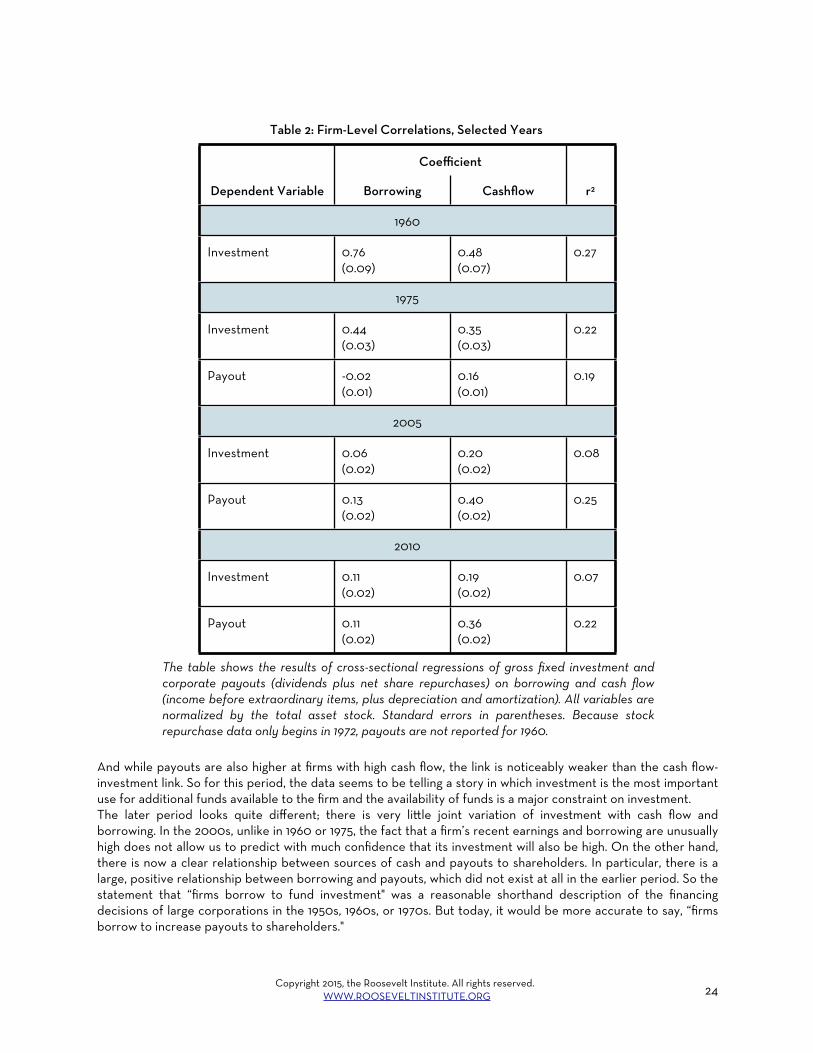
And while payouts are also higher at firms with high cash flow, the link is noticeably weaker than the cash flow-investment link. So for this period, the data seems to be telling a story in which investment is the most important use for additional funds available to the firm and the availability of funds is a major constraint on investment.The later period looks quite different; there is very li$le joint variation of investment with cash flow and borrowing. In the 2000s, unlike in 1960 or 1975, the fact that a firm’s recent earnings and borrowing are unusually high does not allow us to predict with much confidence that its investment will also be high. On the other hand, there is now a clear relationship between sources of cash and payouts to shareholders. In particular, there is a large, positive relationship between borrowing and payouts, which did not exist at all in the earlier period. So the statement that “firms borrow to fund investment" was a reasonable shorthand description of the financing decisions of large corporations in the 1950s, 1960s, or 1970s. But today, it would be more accurate to say, “firms borrow to increase payouts to shareholders."
Copyright 2015, the Roosevelt Institute. All rights reserved. WWW.ROOSEVELTINSTITUTE.ORG 24
Dependent Variable
CoefficientCoefficient
r2Dependent Variable Borrowing Cashflow r2
1960196019601960
Investment 0.76(0.09)
0.48(0.07)
0.27
1975197519751975
Investment 0.44(0.03)
0.35(0.03)
0.22
Payout -0.02(0.01)
0.16(0.01)
0.19
2005200520052005
Investment 0.06(0.02)
0.20(0.02)
0.08
Payout 0.13(0.02)
0.40(0.02)
0.25
2010201020102010
Investment 0.11(0.02)
0.19(0.02)
0.07
Payout 0.11(0.02)
0.36(0.02)
0.22
Table 2: Firm-Level Correlations, Selected Years
The table shows the results of cross-sectional regressions of gross fixed investment and corporate payouts (dividends plus net share repurchases) on borrowing and cash flow (income before extraordinary items, plus depreciation and amortization). All variables are normalized by the total asset stock. Standard errors in parentheses. Because stock repurchase data only begins in 1972, payouts are not reported for 1960.
As the table shows, this new pa$ern is essentially unchanged between 2005 and 2010. The financial crisis and Great Recession do not seem to have changed the corporate financing decision for large American businesses. Compare the coefficient of investment on borrowing in the first year and the last. In 1960, we would expect, on average, a firm that increased its borrowing by one dollar to increase its capital expenditures by 75 cents, with a corresponding boost to production and incomes. In 2010, by contrast, a dollar of additional borrowing is associated with only 10 cents of additional capital expenditure. The difference between these values helps explain why the Obama administration’s strategy of strengthening the financial system has had so li$le success at speeding recovery in the real economy.
Time Series Data
Data for the corporate sector as a whole from the Federal Reserve’s financial accounts tell a similar story to the firm-level data.
Next, we use quarterly time series data from the U.S. financial accounts prepared by the Federal Reserve to test the same predictions for the U.S. nonfinancial corporate sector in the aggregate. There are two reasons to try this additional set of regressions. First, they serve as an independent test of the hypothesis. The time series and firm-level data cover the same payment and income flows for approximately the same population of firms. But the variation we are looking at is completely different. The previous regressions looked for relationships in the differences between firms in a given year. Now we are looking at differences between years for the same population of firms. In other words, previously we were asking whether a particular corporation with unusually high cash flow or borrowing was also likely to have unusually high investment or shareholder payouts. Now we are asking whether a particular year in which the corporate sector as a whole has unusually high cash flow or borrowing is also likely to have unusually high aggregate investment or payouts. The second advantage of the aggregate data is that it lets us see how important this change in pa$erns is for the economy as a whole. With the firm-level data, we are seeing a change in the factors that determine which firms are most likely to be investing heavily or making large payouts to shareholders. But for policy purposes we are o#en more interested in understanding changes in investment for the economy as a whole, which might in principle behave quite differently.
The variables here are defined similarly to the firm-level regressions. Investment is gross fixed investment. Payouts are dividends less net equity issuance. Borrowing is the annualized quarterly change in credit-market liabilities. Cash flow is profits a#er tax plus capital consumption allowance. The only important difference is that now payouts include cash payments made for acquisitions. This is unavoidable given the aggregate data, but it is not unreasonable. A#er all, from the point of view of the corporate sector as a whole, buying back your own shares is not so different from buying another company’s shares: both involve the corporate sector making payments to shareholders rather than using those funds for some other purpose. All variables are expressed as a percent of total corporate assets. We use total corporate assets rather than GDP as the scaling variable partly to maintain consistency with the cross-sectional results reported in the section below, and partly because it seems more natural to measure corporate sources and uses of funds relative to the size of the corporate sector rather than relative to the size of the economy as a whole. Using trend GDP rather than corporate assets to normalize the flows yields almost identical results. The full set of data is available for 1952 onwards.
Corporate profits and investment have always risen in booms and fallen in slumps. But it is only since the 1980s that corporate borrowing and, especially, shareholder payouts have varied dramatically with the business cycle.
Figure 5 shows the four flows over the past six decades. We can think of this graph as readings on the monetary plumbing, showing the level of flows into and out of the corporate sector. Again, all the flows are measured as fractions of total corporate assets. (Normalizing by GDP instead would give a qualitatively similar picture.) As the
Copyright 2015, the Roosevelt Institute. All rights reserved. WWW.ROOSEVELTINSTITUTE.ORG 25
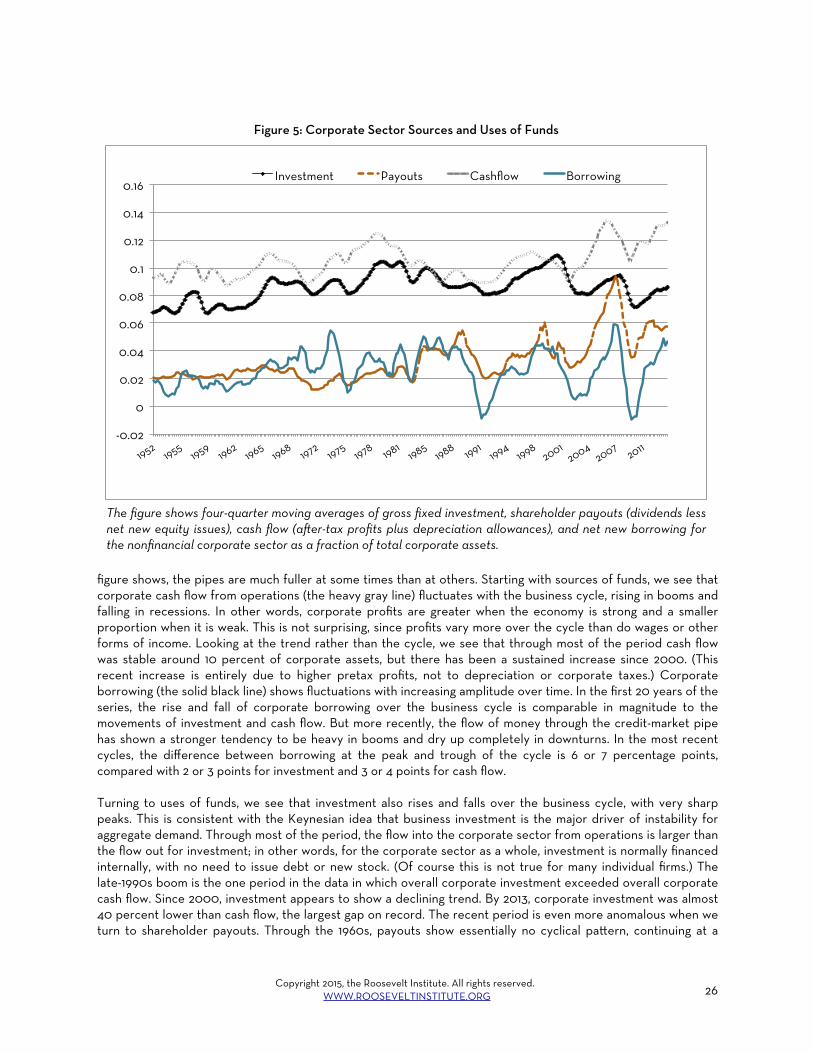
figure shows, the pipes are much fuller at some times than at others. Starting with sources of funds, we see that corporate cash flow from operations (the heavy gray line) fluctuates with the business cycle, rising in booms and falling in recessions. In other words, corporate profits are greater when the economy is strong and a smaller proportion when it is weak. This is not surprising, since profits vary more over the cycle than do wages or other forms of income. Looking at the trend rather than the cycle, we see that through most of the period cash flow was stable around 10 percent of corporate assets, but there has been a sustained increase since 2000. (This recent increase is entirely due to higher pretax profits, not to depreciation or corporate taxes.) Corporate borrowing (the solid black line) shows fluctuations with increasing amplitude over time. In the first 20 years of the series, the rise and fall of corporate borrowing over the business cycle is comparable in magnitude to the movements of investment and cash flow. But more recently, the flow of money through the credit-market pipe has shown a stronger tendency to be heavy in booms and dry up completely in downturns. In the most recent cycles, the difference between borrowing at the peak and trough of the cycle is 6 or 7 percentage points, compared with 2 or 3 points for investment and 3 or 4 points for cash flow.
Turning to uses of funds, we see that investment also rises and falls over the business cycle, with very sharp peaks. This is consistent with the Keynesian idea that business investment is the major driver of instability for aggregate demand. Through most of the period, the flow into the corporate sector from operations is larger than the flow out for investment; in other words, for the corporate sector as a whole, investment is normally financed internally, with no need to issue debt or new stock. (Of course this is not true for many individual firms.) The late-1990s boom is the one period in the data in which overall corporate investment exceeded overall corporate cash flow. Since 2000, investment appears to show a declining trend. By 2013, corporate investment was almost 40 percent lower than cash flow, the largest gap on record. The recent period is even more anomalous when we turn to shareholder payouts. Through the 1960s, payouts show essentially no cyclical pa$ern, continuing at a
Copyright 2015, the Roosevelt Institute. All rights reserved. WWW.ROOSEVELTINSTITUTE.ORG 26
-0.02!
0!
0.02!
0.04!
0.06!
0.08!
0.1!
0.12!
0.14!
0.16!
1952!1955!
1959!1962!
1965!1968!
1972!1975!
1978!1981!
1985!1988!
1991!1994!
1998!2001!
2004!2007!
2011!
Investment! Payouts! Cashflow! Borrowing!
The figure shows four-quarter moving averages of gross fixed investment, shareholder payouts (dividends less net new equity issues), cash flow (a"er-tax profits plus depreciation allowances), and net new borrowing for the nonfinancial corporate sector as a fraction of total corporate assets.
Figure 5: Corporate Sector Sources and Uses of Funds
steady low level through booms and recessions. But in the most recent business cycle, payouts rose by six points during the expansion and then fell by six points in the downturn — almost exactly the same as the rise and fall in borrowing, and much larger than the rise and fall in investment spending. The peak of the most recent cycle in the second half of 2007 stands out as the only period in the data in which aggregate payouts actually exceed aggregate investment.
If the corporate sector lacks funds for investment, it appears to be because too much money is flowing out, not because too li"le money is flowing in.
What we see here, to return to the money-pipes metaphor, is that the flows both into and out of the corporate sector are stronger in booms than in recessions, and these cyclical ebbs and flows have tended to grow stronger over time. Most important for our purposes, we see that the flows of money into the corporate sector — through both profits and borrowing — were very strong both in the expansion before the Great Recession and the recovery since then. But the flow out through the investment pipe has been anemic. So if we think of policy as plumbing, we might think of the blockage as being in the pipe coming out of the corporate sector rather than the pipes coming in. To see this, just compare the recent period with the late 1980s and early 1990s. Then, investment was quite low and so were borrowing and shareholder payouts. It is very plausible that lack of access to credit was important in holding back investment in that period. This is consistent with what we know from other sources. The collapse of the savings and loan industry probably interfered with business credit much more than the financial crisis of 2008, since S&Ls, unlike the institutions that failed in the more recent crisis, were primarily engaged in direct lending to business. Stories about a “credit crunch” were common in the media in the late 1980s and early 1990s, and the only period during which the National Federation of Business Owners’ survey of small business showed that “access to credit” was an important factor in expansion plans was the 1980s. Today, by contrast, the problem does not seem to be that corporations can’t raise the funds they need to invest, but that they have become less willing to do so — in which case, policies to improve availability of credit by strengthening the banking system are trying to clear the wrong pipe.
Figure 5 also suggests that since the mid-’80s, shareholder payouts have been higher, more variable, and more closely correlated with borrowing than in the earlier period. The immediate pre-Great Recession period stands out particularly dramatically. Notably, both payouts and borrowing hit their high for the full 60-year period at the same point, at the end of 2007. More broadly, all of the series except cash flow seem clearly to exhibit different behavior before and a#er the mid-1980s.7 The question is whether these visual impressions are valid. Are there statistically verifiable differences in the associations between these four variables between the earlier and more recent periods? At an economy-wide level, are higher corporate earnings and borrowing associated with higher investment or with higher payouts to shareholders?
With respect to the exact dating of the shi#, there is no single breakpoint. This was a sociologically complex, contested process that was not fully accomplished in one step. Even today, it seems likely that a substantial minority of the corporate sector — especially in growth industries — continues to function under a basically managerial regime, albeit under continuous pressure from the rentiers. A striking recent example of this pressure is Apple’s decision, under fire from activist shareholders, to use its cash holdings to begin paying dividends for the first time in 17 years and to devote $30 billion per year to stock repurchases. Dividends and repurchases together totaled $41 billion in 2013, slightly above the company’s reported earnings of $37 billion and approximately triple its combined budget for fixed investment ($8 billion) and research and development ($4 billion). So in an important sense, the shareholder revolution is ongoing.
That said, the critical institutional changes that made shareholder value the operational principle of corporate finance clearly took place in the first half of the 1980s. With respect to share repurchases, which drive most of the changed behavior of shareholder payouts, the critical change was the adoption of Rule 10b-18 by the SEC in 1982, which made large-scale share repurchases legal for the first time (Grullon and Michaely 2002). The
Copyright 2015, the Roosevelt Institute. All rights reserved. WWW.ROOSEVELTINSTITUTE.ORG 27
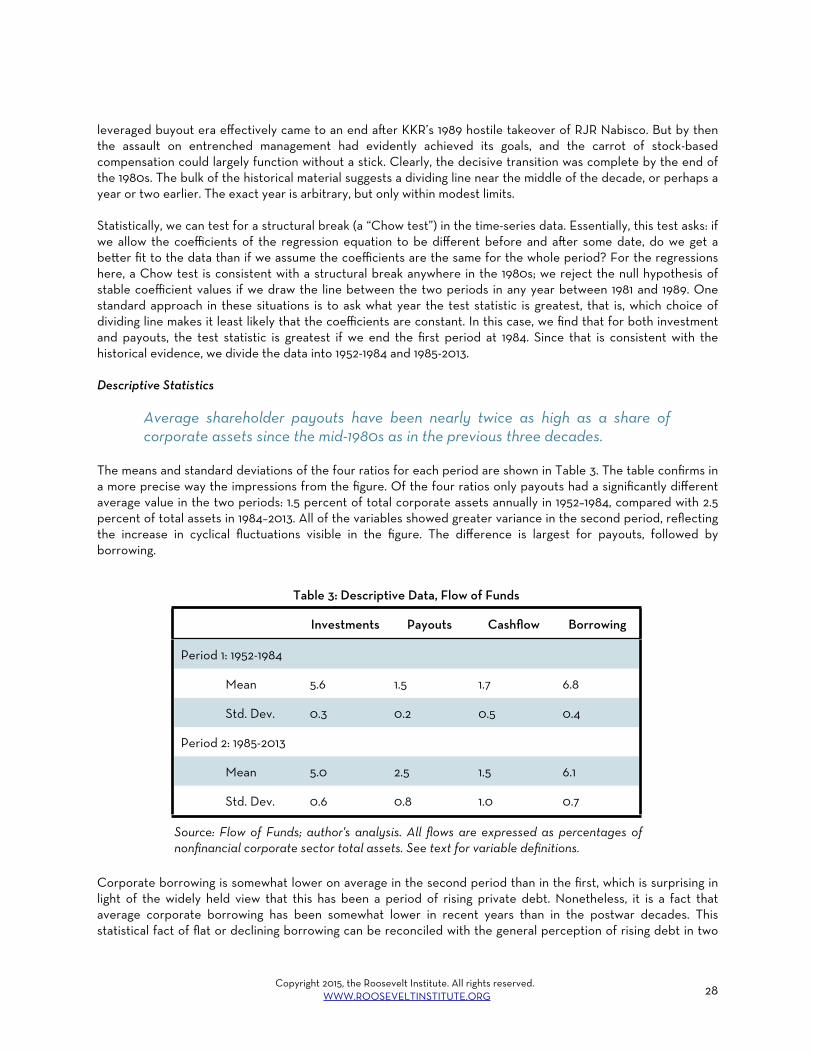
leveraged buyout era effectively came to an end a#er KKR’s 1989 hostile takeover of RJR Nabisco. But by then the assault on entrenched management had evidently achieved its goals, and the carrot of stock-based compensation could largely function without a stick. Clearly, the decisive transition was complete by the end of the 1980s. The bulk of the historical material suggests a dividing line near the middle of the decade, or perhaps a year or two earlier. The exact year is arbitrary, but only within modest limits.
Statistically, we can test for a structural break (a “Chow test”) in the time-series data. Essentially, this test asks: if we allow the coefficients of the regression equation to be different before and a#er some date, do we get a be$er fit to the data than if we assume the coefficients are the same for the whole period? For the regressions here, a Chow test is consistent with a structural break anywhere in the 1980s; we reject the null hypothesis of stable coefficient values if we draw the line between the two periods in any year between 1981 and 1989. One standard approach in these situations is to ask what year the test statistic is greatest, that is, which choice of dividing line makes it least likely that the coefficients are constant. In this case, we find that for both investment and payouts, the test statistic is greatest if we end the first period at 1984. Since that is consistent with the historical evidence, we divide the data into 1952-1984 and 1985-2013.
Descriptive Statistics
Average shareholder payouts have been nearly twice as high as a share of corporate assets since the mid-1980s as in the previous three decades.
The means and standard deviations of the four ratios for each period are shown in Table 3. The table confirms in a more precise way the impressions from the figure. Of the four ratios only payouts had a significantly different average value in the two periods: 1.5 percent of total corporate assets annually in 1952–1984, compared with 2.5 percent of total assets in 1984–2013. All of the variables showed greater variance in the second period, reflecting the increase in cyclical fluctuations visible in the figure. The difference is largest for payouts, followed by borrowing.
Corporate borrowing is somewhat lower on average in the second period than in the first, which is surprising in light of the widely held view that this has been a period of rising private debt. Nonetheless, it is a fact that average corporate borrowing has been somewhat lower in recent years than in the postwar decades. This statistical fact of flat or declining borrowing can be reconciled with the general perception of rising debt in two
Copyright 2015, the Roosevelt Institute. All rights reserved. WWW.ROOSEVELTINSTITUTE.ORG 28
Investments Payouts Cashflow Borrowing
Period 1: 1952-1984Period 1: 1952-1984Period 1: 1952-1984Period 1: 1952-1984Period 1: 1952-1984Period 1: 1952-1984
Mean 5.6 1.5 1.7 6.8
Std. Dev. 0.3 0.2 0.5 0.4
Period 2: 1985-2013Period 2: 1985-2013Period 2: 1985-2013Period 2: 1985-2013Period 2: 1985-2013Period 2: 1985-2013
Mean 5.0 2.5 1.5 6.1
Std. Dev. 0.6 0.8 1.0 0.7
Source: Flow of Funds; author's analysis. All flows are expressed as percentages of nonfinancial corporate sector total assets. See text for variable definitions.
Table 3: Descriptive Data, Flow of Funds
ways. First, corporate borrowing has been much more variable since the mid-1980s, with periods of high borrowing alternating with periods of corporate deleveraging. (Each of the past three recessions saw at least one quarter in which net corporate borrowing was negative, something that never occurred between 1950 and 1990.) So the post-1984 epoch certainly has seen periods of exceptionally high borrowing, even if borrowing was not high overall. Second, the rise in corporate debt, measured relative to either assets or GDP, is real and substantial. But it is important to remember that there is no necessary connection between changes in indebtedness and changes in borrowing. As it happens, the acceleration of corporate debt ratios a#er 1980 is the result not of higher borrowing, but of lower inflation, which implies a higher debt ratio for any given level of borrowing.
For present purposes, the important question is not the trends in the variables, but their relationships with each other. Is there a weakening of the association of investment with cash flow and borrowing? And is there a strengthening of the association of shareholder payouts with cash flow and borrowing?
As is o#en the case with time series data, these flows show significant autocorrelation, with each period resembling the period before. That is, changes tend to persist over time, with high values being followed by high values and low values being followed by low values. (This is true of macroeconomic variables in general. That’s why they can be plo$ed as smoothly rising and falling lines.) With autocorrelated variables, regression results can be misleading, especially if the variable shows a “unit root,” following a random walk with no underlying level or trend. The standard test rejects the hypothesis of a unit root for borrowing and for payouts. But the test just fails to reject a unit root for cash flow and clearly fails to reject a unit root for investment. So regressions using the levels of the variables are not appropriate. Instead, we look at correlations between the changes (or first differences) in the variables.
Regression Results
Statistically, we find the same pa"ern in variation over time that we saw across firms: since the 1980s, the relationships of cash flow and borrowing with investment have grown weaker, and the relationships with shareholder payouts have grown much stronger.
Regression results on the time series data are reported in Table 4. These are bivariate regressions of the year-over-year differences in each use on each source, all normalized by total corporate assets. Since the le#-hand variable in each regression is a use of funds and the right-hand variable is a source of funds, one natural way to interpret these results is as a description of the disposition of the marginal dollar entering the corporate sector. The results may be interpreted as suggesting that in the postwar decades, of each incremental dollar of income to the corporate sector, nearly half went to fixed investment and only a quarter was paid out to shareholders. Since 1985, those proportions have reversed, with 22 cents of each incremental dollar of income invested and all the rest paid out to shareholders. Similarly, in the postwar decade, of each additional dollar borrowed by the corporate sector, 20 cents was spent on fixed investment and 16 cents was paid out to shareholders. But since 1980, half of each additional dollar borrowed by the corporate sector has been paid out to shareholders, while only 15 cents has been invested.
These results are clearly consistent with our predictions. The relationships of investment with both borrowing and especially cash flow are notably weaker in the post-1985 period than before 1985. The coefficients of payouts on borrowing and cash flow, on the other hand, are both much greater in the post-1985 period, as is the share of variance explained by the payout-borrowing regression. For the non financial corporate sector as a whole, the hypothesis of a structural change in the financing decision seems consistent with the data. Most importantly, it strongly appears that in the aggregate, fixed investment is no longer the primary use of funds borrowed by corporations in the way that it was in earlier decades.
Copyright 2015, the Roosevelt Institute. All rights reserved. WWW.ROOSEVELTINSTITUTE.ORG 29

While the coefficients in this table are not identical to the ones reported for the firm-level data, the overall picture is remarkably similar. This similarity is especially striking since we are looking at an entirely different dimension of variation, over time rather than across firms. That suggests that we are looking at a genuine change in the structure of corporate finance decisions.
The prediction that is not borne out in the data is a larger change in the correlations of investment with borrowing than with cash flow. In fact, the relative weakening in the cash flow-investment relationship is significantly greater than in the borrowing-investment relationship. Recall that the same excess weakening of the cash flow-investment relationship is present in the cross-sectional regressions. This suggests the existence of some other factor, in addition to more assertive shareholders, that is holding down investment relative to profits. Three natural alternatives are chronically depressed demand, “the China price," and the relative lack of major innovations in the past 30 years. Even firms with high current profits will not invest if their existing capacity is underutilized. Nor will they invest if there is a high probability that imports will render their capital uncompetitive before the end of its normal life. Investment will also be depressed by a relative absence of major innovations or other “epoch-making" shi#s that devalue existing fixed capital while raising the return on new investment. All these factors introduce a wedge between the marginal profit rate on new capital, which is what firms try to estimate in making investment decisions, and the average rate of profit on the existing capital stock, which is what we see in the aggregate data. None of these alternatives is inconsistent with the hypothesis advanced here. But it is important to keep in mind that despite its immense — and o#en overlooked — macroeconomic importance, the shareholder revolution is hardly the only important difference between the investment decision facing a corporation in 2014 and the decision facing a corporation in 1964.
This final point is illustrated in the four plots featured in Figure 6, which plots corporate investment and shareholder payouts against cash flow from operations and net borrowing, respectively. Again, all four flows are normalized by the total asset stock. Here the series are broken into three periods: 1952–1984, as in the rest of the paper; 1985 to the business-cycle trough in 2001; and 2002–2013. The upper two panels of Figure 6 show the strong relationship between corporate sources of funds and investment in the 1950s through the early 1980s: the points of the sca$ers fall clearly along an upward-sloping diagonal, indicating that periods of high corporate earnings and high corporate borrowing were consistently also periods of high corporate investment. The relationship between investment and the two sources of funds is still present, though weaker, in the 1985–2001
Copyright 2015, the Roosevelt Institute. All rights reserved. WWW.ROOSEVELTINSTITUTE.ORG 30
Regression 1952 - 19841952 - 1984 1985 - 20131985 - 2013Regression
Coefficient r2 Coefficient r2
Investment on Borrowing 0.20(0.03)
0.22 0.15(0.03)
0.22
Investment on Cashflow 0.48(0.07)
0.28 0.22(0.08)
0.07
Payouts on Borrowing 0.16(0.03)
0.17 0.49(0.07)
0.30
Payouts on Cashflow 0.25(0.07)
0.09 0.78(0.21)
0.11
Table 4: Regression Results, Flow of Funds
The table shows that the relationship of investment with borrowing and cash flow from operations has grown weaker since 1985, while the relationship of payouts to shareholders with borrowing and cash flow from operations has grown stronger.

Figure 6: Corporate Sources and Uses of Funds, 1952-2014
Copyright 2015, the Roosevelt Institute. All rights reserved. WWW.ROOSEVELTINSTITUTE.ORG 31
Source: Flow of Funds. The figure shows aggregate quarterly fixed investment spending and cashflow from operations for U.S. nonfinancial corporations, at annual rates, normalized by the sector’s total assets. See text for variable definitions. The small circles show 1951Q4 through 1984Q4; the boxes show 1985Q1 through 2001Q3; and the triangles show 2001Q4 through 2014Q1.
period. But in the most recent business cycle and recovery, the correlations appear to have vanished entirely. The rise, fall, and recovery of corporate cash flow over the past dozen years is not associated with any similar shi#s in corporate investment, which seems stuck at a low level of 1–2 percent of total assets. Similarly, the very large swings in credit flows to the corporate sector do not correspond to any similar shi#s in aggregate investment. Turning to the lower two panels of Figure 6, showing shareholder payouts, we see at most a weak relationship with the two sources of funds in the earlier period. In the earlier period, it is payments to shareholders that are stable at 1–2 percent of corporate assets. In the most recent period, by contrast, payouts to shareholders vary much more, and appear more strongly associated with variation in cash flow and borrowing. The transitional period of 1985–2001 is intermediate between the two.
In the mid-20th century managerial firm, easier credit conditions translated into increased business investment. In today’s rentier-dominated firm, easier credit just translates into higher payouts to shareholders, so a healthy financial system may not have the benefits for the real economy that it did formerly.
The economy is an immensely complex system, encompassing all the money payments between households, businesses, and governments, and all the various assets and liabilities that represent promised or expected money payments in the future. Among the most visible of all these money payments and commitments are those associated with finance. It is natural to think that changes in the pace of financial payments are associated with, or even responsible for, changes in the flow of payments associated with the real economic activity of production and consumption. But the relationship between these two systems may be more complicated.
Finance does facilitate real activity. But it also facilitates changes in ownership claims and the rights associated with them. Finance can contribute to production. But just as o#en — more o#en, in modern economies — the function of finance is not to assemble funds for productive enterprises, but to extract funds from those enterprises.
It is natural to a$ribute high unemployment and low output over the past five years to the financial crisis of 2008 and its a#ermath. But, were the financial institutions that came under such stress in 2008–2009 contributing to real productive activity? This should not be taken for granted. Historically, it does seem to have been true at one point that firms’ investment decisions depended on how much they could borrow. In that se$ing, the health and confidence of banks would be an important factor in the level of real activity. But that era seems to have ended in the 1980s. For 30 years, the main function of the financial system with respect to corporate America has not been raising funds for investment, but compelling corporations to “disgorge the cash” in the form of payments to shareholders.
From World War I to the 1980s, most American corporations were run by professionals who placed a higher value on the growth and survival of the firm, and perhaps even on some broad social mission, than on maximizing payments to shareholders. More recently, shareholder value has been king. The transition between these two regimes took place in a relatively short period in the 1980s, and was brought about by finance — first via hostile takeovers and leveraged buyouts, later by stock-based compensation and shareholder activism — acting in its role as representative of the owning class as a whole. This transition was highly visible at the time, and it remains evident in the statistical relationships between corporate sources and uses of funds.
Between World War II and the 1980s, corporations paid a relatively fixed dividend and borrowed in order to invest. During these four decades, many businesses wanted to be growing faster than they were; the problem was how to pay for expansion. Additional money coming in the door — either from operations or from credit markets — would preferentially go to building up the firm through fixed investment. Since the 1980s, the calculations of managers have been different. Growth is not a goal unless the expected returns are high enough to satisfy shareholders who have a strong preference for cash in their pockets. The pressure from shareholders is strong enough that firms that can borrow cheaply — firms whose assets aren’t fully pledged as collateral — can
Copyright 2015, the Roosevelt Institute. All rights reserved. WWW.ROOSEVELTINSTITUTE.ORG 32
come under pressure to take on more debt in order to increase payouts to shareholders. In this se$ing, the corporate finance equation is quite different. Making it easier for businesses to borrow may not stimulate the real economy at all if all the money coming into the corporate sector via the “credit market pipe” immediately flows out through the “payout pipe.”
Empirically, we see this change in firm-level data. In earlier years, firms with high earnings or high borrowing tended to also have high investment. Similarly, years in which corporate earnings and borrowing were high also tended to be years of high corporate investment. More recently, these relationships have grown weaker. They have been replaced by a new relationship in which firms and periods with high earnings or borrowing also tend to be firms and periods with high payouts to shareholders.
CONCLUSION
These results have important implications for macroeconomic policy. The shareholder revolution and its implications for corporate financing decisions may help explain why corporate investment has been weak in recent business cycles despite high levels of corporate profits. In principle, high earnings mean abundant internal funds, which at one point would have been treated as a low-cost source of investment finance. But in the shareholder-dominated firm, there is no longer a presumption that internal funds should be used for investment. Supporters of the shareholder revolution would argue that this is a change for the be$er and that the high level of internally funded projects under the old managerial regime included a large proportion of white elephants whose expected returns were too low to justify their expense. Whether or not the shareholder-dominated firm chooses its projects more wisely is beyond the scope of this paper.9 But what is certainly true is that the previous two expansions have seen historically high levels of corporate profits and borrowing, but low levels of investment. And lower corporate investment implies lower levels of output and employment, no ma$er how wisely the individual projects are chosen.
More immediately, the analysis here helps explain why monetary policy has had so li$le success at boosting employment and output in the Great Recession. By historical standards, the past six years of a zero federal funds rate plus aggressive intervention to support credit markets represents an extraordinarily accommodative stance for U.S. monetary policy. Central banks in most other advanced countries have followed similar ultra-expansionary policies. Yet the recovery in real economic activity has been anemic at best. To some extent this may represent the exceptional severity of the shock resulting from the collapse of the housing bubble and the ensuing financial crisis. But the failure of output to respond to this extraordinary monetary stimulus should also raise questions about whether the traditional tools of monetary policy are still effective. In particular, the fact that low interest rates have encouraged increased corporate lending and borrowing without any accompanying boom in real investment should raise doubts about whether we can expect to achieve full employment through measures aimed at increasing the credit supply.
The Federal Reserve has certainly succeeded at making it cheaper for corporations to borrow, and in the postwar decades, when today’s policy consensus took shape, abundant credit would have offered strong encouragement for higher investment. In that context, it made sense to think of credit as the "gas pedal" or "thermostat" of the economy, which the central bank could raise or lower at will. But in the financialized economy, the link between credit availability and real production and job growth is much less reliable. Today, rentier-dominated firms use cheaper credit primarily to boost dividends and stock buybacks. This means there is no longer a strong link between real spending and corporate borrowing. This is serious problem for monetary policy, since it is this real spending that boosts GDP and employment. Without a strong link between financing
Copyright 2015, the Roosevelt Institute. All rights reserved. WWW.ROOSEVELTINSTITUTE.ORG 33
9 There are good reasons to doubt that the shareholder-dominated firm chooses its projects more wisely; a shorter required payback period may preclude many productivity-boosting investments. This case is stated forcefully by William Lazonick; see (Lazonick 2011).

and investment, it is more difficult to use lower interest rates to raise employment and wages. To the extent the policy is effective, it must rely more on the few sectors of the economy where real activity remains interest-sensitive — most recently, the housing sector. And the costs of responding to all demand shocks by inducing offse$ing swings in housing-related borrowing are now all too apparent.
Copyright 2015, the Roosevelt Institute. All rights reserved. WWW.ROOSEVELTINSTITUTE.ORG 34
APPENDIX A
There is no question that many businesses did face tighter credit conditions during the Great Recession. Small, unincorporated businesses may have been especially vulnerable to the tightening of bank lending standards. But for the corporate sector, which accounts for 80 percent of business fixed investment, it is less obvious that credit conditions are the binding constraint on investment, either during the recession or in general. An argument that an adverse shi# in the supply of external funds was the main direct cause of the fall in corporate investment in the recession would, at least, have to account for several anomalous facts.
1. The fall in investment occurred across the corporate sector, as opposed to being concentrated among firms with a higher probability of facing binding constraints. In particular, large firms, firms with investment-grade bond ratings, and firms that entered the crisis with no debt, which should have been less affected by tighter credit conditions, all reduced investment during the recession by about as much as the corporate sector as a whole. (See Table 1.)
2. As shown in the empirical sections, cash flow-investment sensitivity, a standard measure of credit constraints, does not show any consistent increase during the recession, either generally or relatively among firms more likely to face credit rationing. Nor is there an absolute or relative strengthening of cash flow-investment sensitivities during the early 1990s, the last period of severe financial distress.
3. At the same time they were reducing investment, corporations were increasing cash holdings. Since the purpose of holding cash is to buffer expensive-to-adjust spending flows, such as investment, against unexpected changes in cash income or other expenses, we would expect firms to spend down cash reserves in response to tighter credit conditions, before reducing investment. Yet during 2009, when the steepest fall in investment occurred, corporations increased their cash holdings by $470 billion. This is more than double the $230 billion reduction in fixed investment in the same period. Cross-sectional evidence also does not support the idea that firms were spending down cash to buffer against change in fixed investment, as one would expect if those changes were compelled by credit conditions (Kahle and Stulz, 2010).
4. Corporate borrowing did fall steeply in 2008-2009, from about 6 percent of trend GDP to -1 percent, a#er rising about the same amount over the previous five years. But payouts to shareholders (i.e. dividends plus net share repurchases) followed almost exactly the same pa$ern, rising by a bit over 6 points over 2003-2007 before falling by 6 points over 2008-2009. So the net funds flowing to corporations through the financial markets, for investment and other purposes, were essentially flat over the whole cycle.
5. Measured as shares of trend GDP, corporate profits and corporate debt both passed their pre-recession peaks in 2011. Business fixed investment, however, has been practically flat through the recovery, and is still 15 percent below its 2007 peak. This is a notable departure from the close association of corporate profits and corporate investment seen in earlier decades. It is also a challenge for the view that the fall in business investment was mainly due to lack of financing, i.e. to an unwillingness or inability of the financial system to hold business liabilities.
Copyright 2015, the Roosevelt Institute. All rights reserved. WWW.ROOSEVELTINSTITUTE.ORG 35
REFERENCES
Bhagat, Sanjai, Andrei Shleifer, and Robert W. Vishny. 1990. “Hostile takeovers in the 1980s: The return to corporate specialization." Brookings Papers on Economic Activity. Microeconomics 1990:1-84.
Bebchuk, Lucian A., Alon Brov, Robert J. Jackson Jr., and Wei Jiang. 2013. “Pre-Disclosure Accumulations by Activist Investors: Evidence and Policy." Journal of Corporation Law 39(1):1-34. Retrieved January 20, 2015
Black, Fischer. 1976. “The dividend puzzle." Journal of Portfolio Management 2(2):3-8.
Blair, Margaret. 1993. “Financial restructuring and the debate about corporate governance." in The Deal Decade, edited by Margaret Blair. Brookings Institution Press.
Chandler, Alfred D. 1977. The Visible Hand: The Managerial Revolution in American Business. USA: Harvard University Press.
Cro$y, James R. 1990. “Owner-manager conflict and financial theories of investment instability: a critical assessment of Keynes, Tobin, and Minsky." Journal of Post Keynesian Economics 12(4):519-542. Retrieved January 20, 2015
Cro$y, James R. 1992. “Neoclassical and Keynesian Approaches to the Theory of Investment." Journal of Post Keynesian Economics 14(4):48-496.
Davis, Gerald F. 2009. Managed by the Markets: How Finance Re-Shaped America. Oxford: Oxford University Press.
Drucker, Peter F. 1950. The New Society: The Anatomy of Industrial Order. Harper & Brothers.
Dumenil, Gerard, and Dominique Levy. 2011. The Crisis of Neoliberalism. USA: Harvard University Press.
Evans, Lawrence Lee. 2001. “What drives equity values: Fundamentals or Net Flows? An empirical analysis of the 1982-1999 US Stock Market Boom." PhD dissertation, Department of Economic, University of Massachuse$s – Amherst.
Fama, Eugene F., and Kenneth R. French. 2001. “Disappearing dividends: changing rm characteristics or lower propensity to pay?" Journal of Financial Economics 60(1):3-43.
Fazzari, Steven R., Glenn Hubbard, and Bruce C Petersen. 2000. “Investment-Cash Flow Sensitivities Are Useful: A Comment on Kaplan and Zingales." The Quarterly Journal of Economics 115(2):695-705.
Fazzari, Steven, R., Glenn Hubbard, and Bruce C. Petersen. 1987. “Financing Constraints and Corporate Investment." National Bureau of Economic Research, Inc. NBER Working Papers 2387.
Greenwood, Daniel J.H. 2004. “Enronitis: Why Good Corporations Go Bad." Columbia Business Law Review, Pp. 773-848.
Greenwald, Bruce C., and Joseph E. Stiglitz. 1986. “Externalities in Economies with Imperfect Information and Incomplete Markets.” The Quarterly Journal of Economics 101(2):229-264.
Grullon, Gustavo, and Roni Michaely. 2002. “Dividends, share repurchases, and the Substitution Hypothesis." The Journal of Finance 57(4):1649-1684.
Copyright 2015, the Roosevelt Institute. All rights reserved. WWW.ROOSEVELTINSTITUTE.ORG 36
Henwood, Doug. 1998. Wall Street: How It Works And for Whom. New York and London: Verso.
Holmstrom, Bengt, and Steven N. Kaplan. 2001. “Corporate Governance and Merger Activity in the U.S.: Making Sense of the 1980s and 1990s." Journal of Economic Perspectives 15(2):121-144.
Holmstrom, Bengt, and Steven N. Kaplan. 2003. “The State of US Corporate Governance: What’s Right and What’s Wrong." Journal of Applied Corporate Finance 15(3):8-20.
Kahle, Kathleen M. and Stulz, Rene M. 2010. "Financial Policies and the Financial Crisis: How Important was the Systemic Credit Contraction for Industrial Corporations?" Fisher College of Business Working Paper No. 2010-03-013.
Kaplan, Steven N., and Bernade$e A Minton. 2012. “How has CEO turnover changed?" International Review of Finance 12(1):57-87.
Jensen, Michael C. 1986. “Agency Costs of Free cash Flow, Corporate Finance, and Takeovers." The American Economic Review 76(2):323-329.
Jensen, Michael C. 1993. “The Modern Industrial Revolution, Exit, and the Failure of Internal Control Systems." The Journal of Finance 48(3):831-880.
Jensen, Michael C. 2000. A Theory of the Firm: Governance, Residual Claims, and Organizational Forms. Cambridge, MA and London: Harvard University Press.
Jensen, Michael C, and William H Meckling. 1976. “Theory of the Firm: Managerial Behavior, Agency Costs and Ownership Structure." Journal of Financial economics 3(4):305-360.
Keynes, John Maynard. 1926/2004. The End of Laissez Faire and The Economic Consequences of the Peace. London: Macmillan/Amherst, New York: Prometheus Books.
Lazonick, William. 2008. “The Quest for Shareholder Value: Stock Repurchases in the US Economy." Recherches Economiques de Louvain/Louvain Economic Review 74(4):479-540.
Lazonick, William. 2011. "From innovation to financialization: how shareholder value ideology is destroying the US Economy." The Handbook of the Political Economy of Financial Crises.
Lazonick, William. 2014. “Taking Stock: Why Executive Pay Results in an Unstable and Inequitable Economy." Roosevelt Institute.
Lazonick, William, and Mary O’Sullivan. 2000. “Maximizing shareholder value: a new ideology for corporate governance.” Economy and society, 29(1), 13-35.
Leary, Mark T., and Michael R Roberts. 2010. “The pecking order, debt capacity, and information asymmetry." Journal of Financial Economics 95(3):332-355.
Manne, Henry G. 1965. “Mergers and the market for corporate control." The Journal of Political Economy 73(2):110-120.
Miller, Merton, and Franco Modigliani. 1958. “The Cost of Capital, Corporation Finance and the Theory of Investment.” The American Economic Review 48(3):261-297.
Myers, S. C. 1984. “The Capital Structure Puzzle.” The Journal of Finance, 39(3), 574-592.
Copyright 2015, the Roosevelt Institute. All rights reserved. WWW.ROOSEVELTINSTITUTE.ORG 37
Roe, Mark J. 1996. “From Antitrust to Corporation Governance? The Corporation and the Law: 1959-1994." Pp:102-127 in The American Corporation Today, edited by Carl Kaysen and D.W. Skinner. Oxford University Press.
Scharfstein, David. 1988. “The disciplinary role of takeovers." The Review of Economic Studies 55(2):185-199.
Stothard, Michael. 2013. “Executives Cash in as Cheap Debt Funds Staff Buybacks,” Financial Times, May 21.
Tirole, Jean. 2006. The Theory of Corporate Finance. Princeton, NJ and Oxford: Princeton University Press. Accessed January 20th, 2015.
38Copyright 2015, the Roosevelt Institute. All rights reserved. WWW.ROOSEVELTINSTITUTE.ORG
570 Lexington Avenue, 5th Floor, New York, NY, 10022