disertation report
TRANSCRIPT

1
APPLICATION OF ELECTRICAL SURVEY
DISSERTATION SUBMITTED TO THE KURUKSHETRA UNIVERSITY IN
PARTIAL FULFILLMENT OF THE REQUIREMENT FOR THE DEGREE OF
MASTER OF TECHNOLOGY IN APPLIED GEOPHYSICS
BY
CHARU KAMRA
UNDER THE SUPERVISION OF:
Mr. SUSHIL KUMAR Mr. SANJAI KUMAR SINGH
ASSISTANT PROFESSOR SENIOR GEOPHYSICIST
GEOLOGICAL SURVEY OF INDIA
(GSI), LUCKNOW
DEPARTMENT OF GEOPHYSICS
KURUKSHETRA UNIVERSITY, KURUKSHETRA-136119

2
CANDIDATE’S DECLARATION
I hereby solemnly declare that the work which is being presented in this project,
entitled “APPLICATION OF ELECTRICAL SURVEY in partial fulfillment of the
requirements for the award of the degree of Master of Technology, in Applied
Geophysics by Kurukshetra University, Kurukshetra , is a bonafide work and
authentic record of my own project work carried out during the period from 14th
February 2015 to 15th May 2015,under the supervision of Sh. Sanjai Kumar Singh
(Senior Geophysicist), Mr. Vikash Anand (Geologist) & Mrs. Ritu Singh (Assistant
Geophysicist), GSI, Lucknow and Mr.Sushil Kumar, Assistant Professor,
Kurukshetra University, Kurukshetra. The matter embodied in this project has not
been submitted by me for the award of any other degree.
Date: (Charu Kamra)
M.Tech. (VIth Semester)
(Applied Geophysics)
Kurukshetra University
Kurukshetra

3
ACKNOWLEDGEMENT
I am grateful to Prof. R.C. Patel, Chairperson of Department of Geophysics, Kurukshetra University,
for granting me permission to carry out this project work at Geophysics Division, GSI ,Lucknow.
I express whole hearted and sincere gratitude to my guide Mr. Sushil Kumar, Assistant Professor,
Dept. of Geophysics, Kurukshetra University, Kurukshetra for his valuable guidance.
I am indebted to Mr. Sidhartha Swaroop, DDG ,GSI ,NR, LUCKNOW for granting me permission
to carry out this project work in GEOPHYSICS DIVISION , GSI , LUCKNOW.
I wish to express my sincere thanks to Dr. Sagina Ram for providing me the facilities to undertake
this project at GEOPHYSICS DIVISION, GSI , LUCKNOW ..
I wish to express my deep sense of gratitude to my guide and mentor Mr. Sanjai Kumar Singh
(Senior Geophysicist), Mr.Vikash Anand (Geologist) & Mrs. Ritu Singh (Assistant
Geophysicist), GSI, Lucknow. Their depth of knowledge, valuable guidance and constant
encouragement helped me to successfully complete this project.
Very venerably, I offer my deep gratitude to my parents who always prayed for my success and
earnestly believed that I can pursue higher studies. Lastly I am grateful to all those who have
contributed in this project especially to my senior Mrs. Ritu Singh for her help.
Date: Charu Kamra
M.Tech. (Applied Geophysics)
Kurukshetra University
Kurukshetra

4
CONTENTS
Abstract…………………………………………………………………….…………….…………10
Location………………………………………...………………………………………………......11
Geology of Area ………………………………………………………………………...………….13
Rock outcrops……………………………………………………………………………………….13
Layout of Geophysical instrument used…………………………………………………………….14
Quantum of Work…………………………………………………………………………………...15
Chapter-1: SP Method……………..………………………………………………….…………..16
Introduction…………………………………………………………………………..…………….. 17
1.1 Mechanism of SP……………………………………………………………..……….………... 17
1.2 Basic Equipment required for Sp method ………………………………………………..…......18
1.3 Data Acquisition……………………………………………………………………….……...... 20
Chapter-2: Difficulties in obtaining reliable data……….…………………………….……..........23
2.1 Cultural Noise…………………………………………………………………….……………....23
2.2 Mistakes in Polarity…………………………………………………..……………………….......24
2.3 Electrode Problems……………………………………………………...…………….……..........25
2.4 Wire Shorted to Ground…………………………………………………………...…….……….27
Chapter-3: Field Procedures………………………………………………………………………..29
3.1 Pre-Field Measures ………………………………………………………………………........... 29
3.2 Explanation of data sheet………………………………………………………….……………. 30
3.3 Acquiring the data……...………………………………………………………….……………..34
3.4 Data Acquisition at Survey Location Area………..……………………….…………………… 40
Chapter-4: Data Reduction………………………………………………………………………...41
4.1 Absolute voltage relative to base-survey…………………………………………………………41
4.2 Plotting profiles………………………………………………………………………………......41
4.3 Data Processing and Maps………………………….……….,……………………....…………..42
4.4 Description of profile in the Northern (Dholera block) of the study area…………………….... 47

5
4.5 Description of profile in the Southern (Dholera block) of the study area………………......... ...50
4.6 Conclusion from profiles and contour maps………………………………………………… …..52
4.7 Conclusion from SP profiles and contour map of Islampur area…………………………………..64
Conclusion and recommendations……………………………………………………………...…...65
References………………………………………………………………………………………….....66
LIST OF FIGURES……………………………………………………………………………………6
LIST OF PLATES……………………………………………………………………………………..8
LIST OF TABLES……………………………………………………………………………………..9

6
LIST OF FIGURES
Figure 1.1 : Mechanism of SP anomalies…………………………………………..………....17
Figure 1.2 : IPR-10 A, IP Receiver connected with two electrodes…………........................18
Figure 1.3 : Porous pot electrode with copper sulphate solution in the bottle……….….........19
Figure 1.4 : Winch used in the SP Survey……………………………………………….........19
Figure 1.5(a): Schematic of Procedure used to collect SP data…………………………..……..21
Figure 1.5(b): Schematic of Procedure used to collect SP data…………………………...……21
Figure 3.1(a): Preparing a base pot in the field………………………………………………...34
Figure 3.1(b): Preparing a base pot in the field…………………………………………………35
Figure 4.1: Map object in Surfer……………………………………………………………...43
Figure 4.2: Showing the profile along baseline, N100, N200, in Dholera block……..............45
Figure 4.3: Showing the profile N300, N400, N500, in Dholera block.............................46
Figure 4.4: Showing the profile N600 , in Dholera block………………………………….....47
Figure 4.5: Showing the profile S100, S200, S300, in Dholera block…..…….......…........... 48
Figure 4.6: Showing the profile S400, S500, S600, in Dholera block……...…..................... 49
Figure 4.7: Showing the profile along baseline, N100, N200 in Islampur block……............54
Figure 4.8: Showing the profile along N300, N400, N500 in Islampur block…….….…….. 55
Figure 4.9: Showing the profile along N600, N700, N800 in Islampur block……….……... 56
Figure 4.10: Showing the profile along N1000, N1100, N1200 in Islampur block……….…. 57
Figure 4.11: Showing the profile along N1300 in Islampur block………………..…................ 58

7
Figure 4.12: Showing the profile along baseline, S100, in Islampur block…….....……...58
Figure 4.13: Showing the profile along S200, S300, S400 in Islampur block…...……….59
Figure 4.14: Showing the profile along S500, S600, S700 in Islampur block……………60
Figure 4.15: Showing the profile along S800, S900, S1000 in Islampur block…………..61
Figure 4.16: Showing the profile along S1100, S1200 in Islampur block………………..62
8
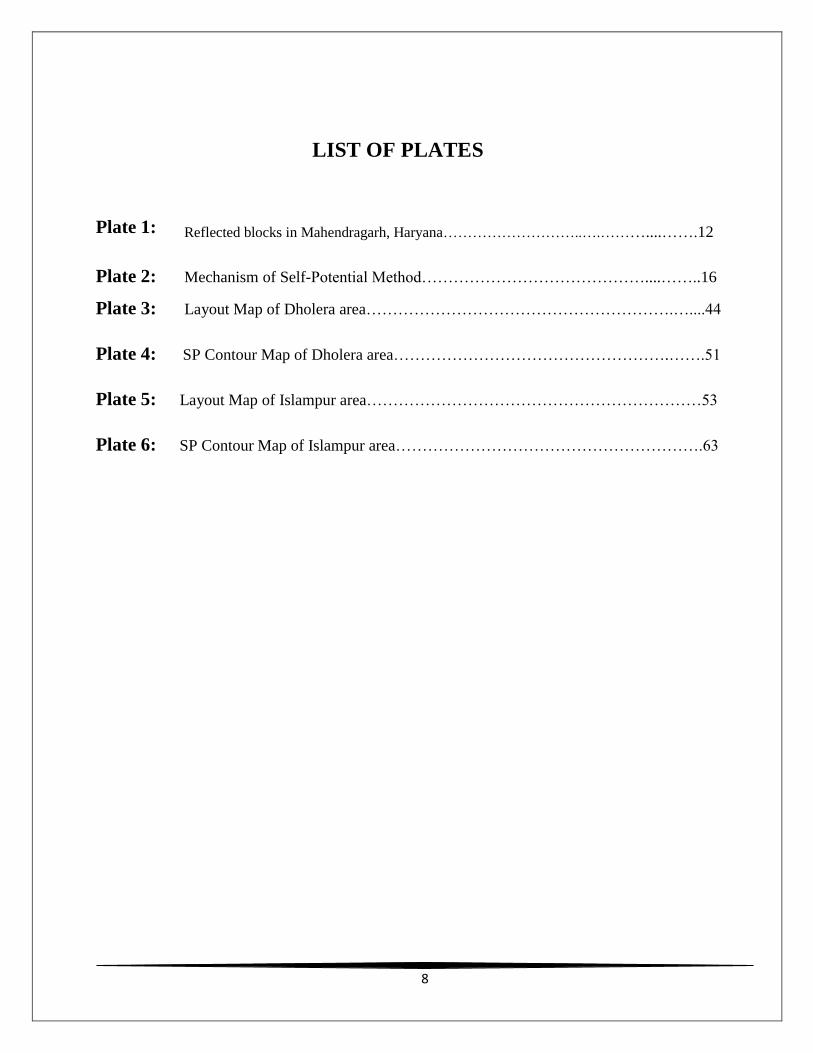
LIST OF PLATES
Plate 1: Reflected blocks in Mahendragarh, Haryana………………………..….………....…….12
Plate 2: Mechanism of Self-Potential Method……………………………………....……..16
Plate 3: Layout Map of Dholera area………………………………………………….…....44
Plate 4: SP Contour Map of Dholera area…………………………………………….…….51
Plate 5: Layout Map of Islampur area………………………………………………………53
Plate 6: SP Contour Map of Islampur area………………………………………………….63

9
List of Tables
Table 1.1 : Data Sheet for SP Survey………………………………….……………….....33

10
ABSTRACT
There are various methods of electrical surveying. Some make use of field within the Earth, while
others require the introduction of artificially-generated currents into the ground. The self potential
method makes use of natural currents flowing in the ground that are generated by electrochemical
processes to locate shallow bodies of anomalous conductivity. SP method is however simple, fast &
cheap method that is useful in rapid ground reconnaissance for base metals when accompanied by
magnetic. The self-potential (SP) method has a long history of successful exploration for minerals.
However, the technique has fallen into disuse, partly for reasons of fashion, but primarily because of
problems with repeatability and reproducibility of the data. Apart from possibility of detecting
sulfides, it is useful in mapping shallow structures like faults, shear & fracture zones and contacts etc.
The basic equipment required is simple, consisting of pair of electrodes connected by a wire to
receiver. The parameter measured through receiver is normal & reversed voltage, drift voltage.
Readings are taken along with the station locations, line, date & distance from the line base. The end
result of SP survey is a set of profiles and a contour map of equi-potential. The negative values goes
on increasing as anomalous zone is observed, during the acquisition of the data and reaches maximum
above the sulfide mass. The SP method is only of minor importance in exploration. This is because
quantitative interpretation is difficult and the depth of penetration is limited to about 30m. It is,
however, a rapid and cheap method requiring only simple field equipment. This report presents the
field procedures and data presentation to be used by self-potential field crews in mineral survey.

11
LOCATION:
The area under survey falls in the survey of India Toposheet No 54A/1. The field study area is
connected by all weather road from Delhi via Rewari –Narnaul–Nangal Chaudhary at distance of
about 180 km from country capital Delhi. Dholera and Islampur villages are about 5 and 15 km from
Nangal Chaudhary, in Mahendragarh, Haryana. Narnaul is connected with Delhi by meter gauge line
of the Northern railways. The survey area is shown on the topsheet as dark pencil line in the following
picture.

12
Plate 1: Reflected blocks in Mahendragarh, Haryana.

13
GEOLOGY OF THE AREA:
The study area is located in the Mahendragarh district of Haryana. The district lies between 27047 N to
28026 N and 75º56 E to 76º51E. The district has an area of 1693 square kilometers.
The presence of dry land topography is reflected as of inland streams, sandy
plain, shifting sand dunes, devoid of vegetation, fixed or fossil sand dunes , dissected upland tract,
and often barren, denuded rocky hill ranges and their outcrops provide an ensemble of terrain features
truly associated with semi arid to arid environment.
The features are morphologically symmetrical and provide rapid and often large
variations in relief and slope characteristics. Consequently overall relief is undulatory with a regional
north to north-east slope. Krishnawati River, flowing from north to south, is the main source of water
in the area. A number of Nalas connected to the main stream form the drainage system of the area.
ROCK OUTCROPS:
The pre Cambrian Aravalli hill ranges traverse through most part of the district in roughly south- west
and north –east direction. The Purana rocks belong to Ajabgarh series of Delhi system and is upper
Precambrian in age. In some parts of the district the rocks of Huronian period belongs to Archean-
Dharwar system.
The rock of Ajabgarh series consist of biotite schist, slates, phyllites,
quartzities and limestone. The hillocks and discontinuous ranges are locally called khols. The
lilthology comprises of Archean group of rocks in Mahendargarh and Narnaul is diverse and consist of
crystalline limestone, quartzites, shale, slates, gneiss and sandstones. The important mineral associated
with rocks are iron, calcite, slate, marble, limestone and dolomite.
The general strike of rock units is NNE- SSW with dips varying from 45 degree to
sub vertical. The area forms a part of synclinorium with a change of hill rocks in the area.

14
LAYOUT OF GEOPHYSICAL SURVEYS METHODS AND INSTRUMENTS
USED:
The base point 0/0 is fixed over a bund and base line of 1.3 km is laid in N30°E in Dholera block.
Traverses were laid orthogonal to it at an interval of 100m and marked as S100, S200.....upto S600 in
southern side of 0/0 and N100, N200....upto N600 in northern side. Stations were staked 20m apart
and marked as E20, E40….. in the east and W20, W40…….. in the west.
The baseline in Islampur block has been laid with bearing of N300 E.
The traverse from the base point 0/0 located near a reference point of old sareli fort in the study area is
extended in the northern and southern direction. This being the geophysical survey carried out of
detailed stage G3. The general traverse interval being 100 mts in the north direction extends maximum
to N1300 (about 1.3km) and in the southern direction extending to S1200(about 1.2km). The
perpendicular lines have the station interval of 20 mts to acquire data by the various geophysical
method. The stations on the traverse are put at an interval of 20 metres and have been designated as
E20, E40,…. W20,W40,….. according to the east or west to the base line.
Due to the disseminated nature of sulphide mineralization and presence of magnetic
minerals, SP, Magnetic(VF) and IP methods have been employed to delineate the zones of sulphide
minerlization and associated subsurface structural features present in the area.
The geophysical instruments used to carry out SP survey comprises of IPR 10 A,
NP Electrode, Winch and Walkie-Talkie.

15
QUANTUM OF WORK:
Area covered (approx): 3.9 sq. km .
Length of traverses covered with SP measurements : 39
Total number of SP observations: 1739

16
Chapter-1
SELF-POTENTIAL SURVEYS
Plate 2: Mechanism of Self-Potential Method.

17
Introduction:
The self-potential (or spontaneous polarization) method is based on the surface measurement of
natural potential differences resulting from electrochemical reactions in the subsurface. Since 1830 the
SP method has been employed in the search for minerals. Anomalous surface potentials are commonly
measured in the vicinity of pyrite (marcasite), chalcopyrite, pyrhotite, sphalerite, and graphite. Typical
SP anomalies may have amplitude of several hundred milli volts with respect to barren ground. They
invariably exhibit a central negative anomaly and are stable over long periods of time. They are
usually associated with deposits of metallic sulphides (Corry 1985), magnetite or graphite. These
potentials are generally measured in milli volts (mV) relative to a "survey base", where the potential is
arbitrarily assigned to be zero volts. The potentials of interest are always negative above a mineralized
body relative to a point outside the mineralization. The observed potentials are the result of oxidation,
or valence electron stripping, of sulfides; hence, the negative potential.
1.1 Mechanism of Self-Potential:
Field studies indicate that for a self-potential anomaly to
occur its causative body must lie partially in a zone of
oxidation. A widely-accepted mechanism of self potential
(Sato & Mooney 1960; for a more recent analysis see Kilty
1984) requires the causative body to straddle the water table
(Figure.1.1). Below the water table electrolytes in the pore
fluids undergo oxidation and release electrons which are
conducted upwards through the ore body. At the top of the
body the released electrons cause reduction of the
electrolytes.
A circuit thus exists in which current is carried electrolytically in the pore fluids and electronically in
the body so that the top of the body acts as a negative terminal. This explains the negative SP
anomalies that are invariably observed and, also, their stability as the ore body itself undergoes no
Figure 1.1: Mechanism of Self-Potential
Anomalies (M.Brooks et al.)

18
chemical reactions and merely serves to transport electrons from depth. As a result of the subsurface
currents, potential difference is produced at the surface.
1.2 Basic equipment required for SP method:
The basic equipment required is simple, consisting of a pair of electrodes connected by wire to a
receiver named IPR-10A IP receiver as shown in Figure.1.2. Copper-Sulfate(Cuso4) containing non-
polarizing electrodes is used to make contact with the ground. The electrodes must be non-polarizing
as simple metal spikes would generate their own SP effects. Non-polarizing electrodes consist of a
metal immersed in a saturated solution of its own salt, such as copper in copper sulphate. The salt is
contained in a porous pot that allows slow leakage of the solution into the ground. However, two
restrictions on the electrodes and voltmeter is important, as follows:
(1) no spurious potentials can be introduced by the measurement technique,
(2) the reference or base electrode must be placed outside the system, above the water table, and not
in a reducing environment such as a bog or swamp.
Figure 1.2: IPR-10 A IP receiver connected with two electrodes.

19
Figure 1.3: Porous pot electrode with copper-sulphate solution in the bottle.
Figure 1.4: WINCH used in the SP survey.

20
1.3 Data acquisition:
Figure 1.5(a, b) shows schematically the method of conventional SP data acquisition. The operator
attaches one end of the wire to the base station electrode. The wire is unreeled to station 1 where the
roving electrode is placed in a shallow hole in the ground. The voltage between the base station
electrode and the roving electrode is recorded with the defined sign convention. The base pot is always
attached to the negative lead of the voltmeter. After making the voltage measurement the roving
electrode is picked up and more wire is unreeled to station 2. The roving electrode is again placed in
the earth, and another voltage measurement is made. This procedure is repeated until the end of the
wire is reached, at which point the wire is rewound, and the reading is taken in the other side of the
base similarily in the above manner.
This process is repeated until the survey is complete. The data acquisition in the field was done with
the making a base point at 0/0.The instrument IPR 10A was attached to the porous pot containing
copper-sulfate to make it stable at the base. Further on the negative NP electrode was being kept at 0/0
and the positive NP electrode attached with the winch was moved along the traverse line at a station
interval of 20 meters each in both the east and west direction of the study area. After acquisition of
data the base point was connected with the succeeding traverse in the Southern part of the study area.
Similarly after acquiring the data from the southern part in the study area the northern part was
connected with the base at 0/0 and data was acquired.

21
Figure.1.5(a): Schematic of the procedure used to collect SP data.
Figure.1.5(b): Schematic of the procedure used to collect SP data.

22
(a) One day's coverage:
The distance which can be covered in one day will vary depending on terrain and
frequency of unexpected problems. Try to cover a minimum of 6 km per day on driving lines, and at
least 3 km per day on walking lines. An average of at least 2 km per day is expected.
(b) Data set for a completed survey:
The data set for a completed survey consists of an accurate map showing the location of the
measurement stations and the topography in the area and the voltage relative to the base station, a set
of data records, self-potential profiles covering the anomalous areas within the must be of sufficient
detail and clarity that the entire survey can be reconstructed by a geophysicist using the field notes and
maps independent of the field crew. The procedures outlined in the following sections are intended to
insure reproducibility without hindering production rates.

23
Chapter-2
DIFFICULTIES IN OBTAINING RELIABLE DATA
The potential of a point on the earth's surface results from the superposition of several
different electric fields. The direct current (DC) field contains the SP field and possibly cultural noise.
The time-varying field consists of telluric currents and cultural noise. In SP surveys, only the DC field
is of interest; all other electric potentials are regarded as "noise" and is to be avoided.
2.1 Cultural Noise:
Changes in the "natural" SP field can result from power lines, radio (mainly
ULF)Communications, buildings, fences, pipelines, etc. Noise from such sources may be common in
many SP survey areas. Care should be taken to avoid measurements suspected of significant cultural
noise.
The following is a list of the more common noise sources.
(a) Power lines:
Alternating current (AC) is used for power transmission in India. Near high tension lines or
generating stations, these signals may be strong enough to saturate the voltmeter and cause major
fluctuations in the voltage readings. Power lines are often grounded on every, other pole. The ground
wires alter the ground potential for several meters. No measurement should be made within 10m of a
ground wire to avoid any cultural DC offset. Base stations should not be located within 500m of any
power 1ines. If it proves impossible to avoid cultural noise due to power transmission, it is sometimes
possible to filter out the 60 Hz with a suitable notch or low pass filter.
(b) Telephone lines:
Telephone lines are grounded at regular intervals. No measurement should be made within
10m of a ground wire to avoid any cultural DC offset. Base stations should not be located within 500m
of any telephone line.

24
(c) Metal pipes, gas lines, cased drill holes, railroad tracks, fences:
These objects alter the electrical potential field of the earth wherever they are in
contact with the ground. They either "short out" the potential or interfere with the earth's natural state
with cathodic protection devices as are commonly found on pipelines. If possible, measurements
should not be made within 20m of any metal object. Pipelines are often electrically charged in order to
prevent corrosion. Measurements should not be made within 500m of an electrically-protected
pipeline. This includes all gas lines and most other metal pipe lines. When a measurement must be
taken near such objects, the distance to the object and description of the object should be recorded on
the data sheet. A note should be made stating that cultural interference is suspected. Use as much
space on the data sheet as necessary for a satisfactory description. Obviously, a base station must not
be located within 500m of any of these objects. Field studies also indicate that old drill casing will
affect the SP, and thus should be avoided if possible as far as 500 meters away.
(d) Industry:
Mines, mills, power plants, substations, and factories all produce or use large amounts of
electricity. The potential of the ground may be affected for tens of kilometers around them. The data
quality surrounding these objects is uncertain. Large scale power producers and consumers should be
documented by the SP crew on the map and in their notes so the area can be critically reviewed. Areas
where the data are obviously affected should be avoided. In the event the survey must be done near
such sources, consult the responsible geophysicist before proceeding. In some cases, such as near large
operating mines, it may be impossible to run an SP survey because of the extreme interference unless
the mine operation is shut down.
2.2 Mistakes in Polarity:
SP measurements are made and recorded with both possible polarities as an aid to
minimizing errors. The normal polarity is the first potential measurement taken. It consists of the base
pot connected to the negative terminal of the voltmeter and the roving pot to the positive. The normal
voltage is used in preparing the SP map. Accidently reversing the polarity recorded in the normal

25
column of the data sheet can have devastating effects on the SP survey. Take the utmost care to insure
proper polarity. The instrumentation is normally designed so that this mistake is not possible;
however, field modifications and repairs may negate the fail-safe design. After field repair or
modification of the equipment, check the polarity by measuring the voltage of a known source such as
a car or transistor battery.
2.3 Electrode Problems:
A copper-sulfate containing, non-polarizing electrode is used to make contact with the
ground. They consist of a plastic container filled with a saturated solution of copper sulfate. The base
of the container is porous and allows the solution to leak slowly into the ground. The porous pot itself
can affect the SP readings made by the crew in a variety of ways as detailed below.
(a) Chemical Differences:
Chemical differences in the copper sulfate solution between the porous pots can result in
a potential difference of several millivolts, independent of the earth. It can be measured with the
receiver when both are placed in the copper sulfate bath. If necessary, this voltage may be reduced to
less than 1 mV by mixing the solutions together or changing the solutions. Cleaning the surface on the
bottom of the pots after each station will also help in this respect.
(b) Sunlight:
Ultraviolet radiation on the copper sulfate solution will change its electrical potential. This
effect can be as high as 50 mV, though it is generally less. For this reason, keep the pots out of
sunlight.
(c)Temperature:
Temperature can also have an effect on the potential of one pot relative to another. This effect
is generally less than 10 mV, but an attempt must be made to shield the pots from radical temperature
changes. Keep the base pot insulated after it is emplaced. Keep the roving pot out of the sunlight when
making a reading, and in the constant temperature bath when not making a reading.

26
(d)Pot drift:
During the course of measuring an SP line, the potential between the base pot and roving
pot will change due to chemical and temperature variations. These variations result in pot drift. The
drift can be reduced by keeping the pots in the shade, and in the constant temperature bath when not in
use. Since the drift error is additive it must be removed each time the base pot is moved to a new
location. Suppose the drift correction is not made for a drift voltage of +10 mV. The absolute voltage
at the end point of the first line is then 10 mV too high. The end point of the first line is the base for
the second line. At the end of the second line the drift voltage is again +10 mV. The potential of the
end point is again 10 mV high relative to its base. That means the absolute voltage assigned to the end
point of the second line is 20 mV high. The same error will then propagate along all subsequent lines
run off this new base, and will result in a bad tie when this line is in any loop.
(e) High Contact Resistance:
The current resistance (R contact) between the porous electrodes and the earth may affect the
SP measurement by loading the circuit, and hence, reduce the measured voltage if the contact
resistance approaches within two orders of magnitude of the input impedance (R input) of the receiver
(i.e. R contact must be much less than R input (R contact « R input)). In order to keep the contact
resistance as small as possible, the pot should be placed in the most conductive ground available
within 10 meters of the distance mark on the cable. To minimize contact resistance, dig a small hole to
reach moist soil and plant the pot firmly in it. This procedure generally results in less than 50 kilo
ohms resistance between the base and roving pots. If the contact resistance is greater than 50 kilo
ohms, re-position the pot in another hole. Occasionally, it will not be possible to obtain a contact
resistance less than 50 kilo ohms due to frozen ground, very dry ground, high resistivity country rock,
etc. When this is the case, and if the voltage is stable, take the voltage reading and continue the survey.
Be sure to enter the contact resistance on the data sheet. Do NOT under any circumstances water the
pot holes to reduce the resistance because this will affect the potential reading. In highly resistive or
dry ground, contact resistance between 100 and 200 kilo ohm can be expected. In frozen ground the
contact resistance may easily exceed 1 mega ohm

27
(f) Soil Moisture:
The SP survey should not continue under conditions where soil moisture may be
changing during a line. The onset of heavy or persistent rain, or for a period of 12 hours after such a
rainstorm stops, precludes continuation of the survey. However, a brief shower which does not
penetrate more than 1 cm into the soil need not stop the survey. Since changes in soil moisture always
cause changes in the measured potential, a prime responsibility of the field crews is to avoid
conditions in which the soil moisture is changing while a line is being run. It is critical that at all base
stations the base electrode be located above the water table and out of any area where reducing
conditions (low Eh-high pH) might exist such as peat bogs, swamps, willow bogs, alongside streams,
etc. The base pot is best located on a hillside in previously undisturbed ground away from road fill, but
locating it in road fill would be preferable to marshy ground at the side of the road.
2.4 Wire Shorted to Ground:
(a) Bare Spots:
Bare spots on wires which short to the ground between the base pot and the receiver produce
large positive contact potentials (50 to 600 mV) which may be relatively steady with time. Usually the
bare spots will only ground in muddy or very damp earth. Unfortunately, grounded wires are difficult
to diagnose since planting a base in an area of negative potential and measuring in an area of higher SP
also produces these large positive potentials. For this reason, among others, it is not a good idea to put
a base station within an area of large (<-100 mV) negative potential. To deal with the problem, put
base stations in areas of high amplitude negative potential only as a last resort and immediately
question any large positive voltage measurements. Repair any bare spots on wires where the insulation
has broken through, and always keep the wire out of water or mud. This means when driving lines
through muddy areas and stream crossings, the driver must periodically stop and hang the line in trees
and on rocks to prevent the wire from lying in the mud or water. The same precaution must also be
taken on walking lines.

28
(b) Shorts to the Reel Housing:
A similar situation results when a wire shorts to the reel housing. After the reel housing is
placed on the ground, the short circuit is completed. All reels must be checked daily to make sure there
is infinite resistance between the wire and reel housing.
29
Chapter-3
FIELD PROCEDURES
The following is a detailed, step-by-step procedure used to collect SP data. The field procedure is to be
strictly followed by the field crews and contractors. If there are any questions about the method, please
ask the responsible geophysicist. It is assumed the procedure is understood at the beginning of the
survey and will be followed throughout.
3.1 PRE–FIELD MEASURES:
(a) Field Equipment:
Check and make sure that the field equipment is complete and serviceable. The wire
reels should always be checked for open circuits in the wire. A reasonable resistance is a few hundred
ohms or less per km of wire. To avoid spurious contact potentials between the reel housing and the
earth, the wire must be electrically isolated from the reel and the resistance reading between the wire
and the reel housing must be infinite. Check that the distance marks on the wire are marked clearly and
located properly, and that they are not slipping on the wire. Tape flags should be located every 100 m
and marked in km (0.5, 0.6… 1.3, etc.)
(b)Topographic Maps:
At least two copies of the topographic maps is required for covering the survey area.
One of these is to be used for the field and one is to be used as a clean, separate copy. Data are to be
transferred from the field map to the separate copy on a daily basis. The proposed line are marked with
a “Hi-Liter” on the field copy and is subject to change as the survey progresses. For this reason the
hotel map is labeled only with the actual data points as the survey progresses. Also, it is probable that
not all proposed lines will actually be run. If the proposed SP lines have not been marked on the field
copy of the map, contact the responsible geophysicist. The clean hotel maps should be rolled and
placed in a map tube for protection.

30
(c) Last Minute Check:
Before leaving for the field, do a small survey in the vicinity of the office to insure that all
Instrument is available and in working condition.
(d)Programmable Calculator:
If a programmable calculator is going to be used it is advisable at this time to obtain or
develop the program for obtaining the drift correction, tie-in voltage, and absolute voltage for each
station.
3.2 Explanation of the Data Sheet:
The data sheet is used to record all numbers and remarks relevant to the survey. New data
sheets should be started at the beginning of each day, or at the beginning of each new line designation.
All field data are to be entered with ball point pen on the data sheets (assume the data sheet will get
wet). If an error is made, cross it out with a single line, and rewrite the data above the error or on the
next line of the data sheet. Illegible field notes can make the entire survey useless. The methods to be
used for acquiring the recorded data are discussed in the following section. A completed data sheet is
shown in Table 1.1
(a) Date:
Record date, month, and year (e.g. 28/02/2015) when that particular form is being filled out.
The beginning of each day should start on a new data sheet.
(b)Area:
The name of the area of survey should be properly mentioned in the data sheet.
.
(c) Line:
Record the reference points used to designate the beginning and end of the survey line. The
reference point at the beginning of the line must be recorded at the beginning of each line

31
(d)Time:
Record the time at which the measurement was made in 24 hour local time, i.e., 00:00 to 23:59
hours.
(e) Distance from Line Base:
Record the distance from the base pot to the roving pot in meters, i.e., 100, 200, 300, etc., not
1, 2, 3 or some other private code.
(f) Normal Voltage:
This is the voltage reading between the base pot and roving pot in millivolts. The normal
polarity is the base pot connected to the negative input of the receiver and the roving pot to the
positive input of the receiver. The sign of the voltage reading, whether positive or negative, is to be
stated explicitly on the data sheet, i.e., +150. not just 150.
(g) Reversed Voltage:
Record the voltage reading between the base pot and roving pot with reverse polarity, i.e., the
base pot connected to the positive receiver input, and the roving pot to the negative input. The sign of
the voltage is again recorded explicitly. The reversed voltage should be equal in magnitude (within +/-
5 mV) and of opposite polarity from the normal voltage. If it is not, then telluric activity should be
suspected or other problems (such as a loose connection) may exist.
(h) Base to Roving Pot Drift Voltage:
Record the voltage between the base and roving pots while placed in the copper sulfate bath.
The measurement is made at the beginning of each line, and every time the base pot is picked up at the
end of a line. The measurement is made with the normal polarity convention: the base pot connected to
the negative receiver terminal and the roving pot to the positive terminal of the receiver.

32
(i) Base Tie in Correction:
The base tie-in correction is the absolute voltage of the base from which a line is run. This value
must be added to the entire line in order to refer the voltage to the survey base. The procedure for
obtaining this value is given in Table 1.1
(j) Absolute Voltage:
This is the station voltage relative to the Survey Base in milli volts. It is calculated by adding
the normal voltage to the drift and base tie-in corrections.
(k) Remark:
Any topographic or cultural point present in the map is to be noted. Any nearby culture features
that might affect the survey, e.g., culverts, powerlines, etc., should be noted. Many comments will be
short (i.e., base station, end of line, pipeline 100m north, etc.) and will fit in this section. Do not try to
"squeeze" the information in; if more room is needed, write across the form as in While the crew's life
story is not required, in general, there cannot be too many comments. Most crews err on the side of too
few and cryptic comments. Be sure this does not apply to you. Imagine yourself trying to make sense
of another crew's comments a year hence, and write for that crew. Remember that it is frequently
necessary to relocate the survey stations at some later time. Be sure your descriptions are adequate to
allow subsequent crews to relocate these points. Always note any stations which are flagged in the
remarks, e.g. kilometer stations. Be sure to describe the location of every base station exactly and
concisely so that follow-up surveys can locate that same point.

33
Table 1.1: Example of Data sheet for SP survey
TIM
E
Tra
ver
se
Dis
tan
ce f
rom
Lin
e B
ase
(m
)
No
rma
l
Vo
lta
ge
(mV
)
Ba
se-R
ov
ing
Po
t D
rift
Vo
lta
ge
(mV
)
Ba
se T
ie-i
n
Co
rrec
tio
n
Ab
solu
te
Vo
lta
ge
(mV
)
10:00 a.m 100 20 -2 -2 (-2+2)=0 -2
10:10 am 100 40 -4 0 -4
10:25 am 100 60 -16 0 -16
10:40 am 100 80 -9 0 -9
10:55 am 100 100 -11 0 -11
11:15 am 100 120 -9 0 -9
11:25 am 100 140 -25 0 -25
11:30 am 100 160 -26 0 -26
11:35 am 100 180 25 0 25
11:40 am 100 200 35 0 35
11:45 am 100 220 54 0 54
11:50 am 100 240 84 0 84
11:55 am 100 260 110 0 110
12:00 am 100 280 109 0 109
12:10 pm 100 300 108 0 108
12:15 pm 100 320 111 0 111
12:30 pm 100 340 101 0 101
12:45 pm 100 360 104 0 104
12 :55 pm 100 380 110 0 110
01:00 pm 100 400 128 0 128
03:00 pm 100 420 143 0 143
Date : 17/2/2015
Area :DHOLERA
Location : Near petrol-pump

34
3.3 Acquiring the Data
(a) Survey Base Location:
Move to the location of the proposed survey base. The survey base is the location to which
all measurements refer and will normally be located by the responsible geophysicist. The base may be
marked on the field map, given to the crew, or chosen during the reconnaissance of the prospect at the
beginning of the survey by the geophysicist. The survey base is chosen to:
1. lie outside any area of known or suspected mineralization.
2. be away from areas of cultural disturbances.
3. be in an area not unduly subject to disturbance by animals or humans.
4. be above the water table and away from areas where reducing (low Eh - high pH)
conditions, e.g. swamps, marshes, bogs, etc. might prevail.
Investigate the survey base location for obvious difficulties at this time. High tension lines within 500
m, a buried gas pipeline with 500 m, and housing developments with associated pipelines within 500
m are all examples of problems which may necessitate moving the survey base location. The survey
base may only be relocated with the prior knowledge and consent of the responsible geophysicist.
Once a suitable survey base has been found, the telluric monitor should be deployed in the immediate
vicinity
Fig 3.1(a): Preparing a base pot in the field

35
Fig 3.1(b): Preparing a base pot in the field
In Figure 3.1(a) & (b): we dig a hole deeper than the length of the pot .Cover the sides of the pot with
dirt (but not the top), and. Pack dirt around the edges of an insulating sun shield to prevent air
circulation. Weight the shield with rocks and tie the wire to a tree or bush.
(b) Measure the Drift Voltage:
Immediately before and after each line, check the drift voltage between the roving pot and the
base pot. To do this, place both pots in the porous pot bath. While keeping the pot and the interior of
the bath out of the sun, connect the base pot to the negative terminal of the IPR-10 A IP Receiver, and
the roving pot to the positive terminal. Measure the voltage that exists between the pots. This voltage
is called the drift voltage and should be less than +/-5 mV. If greater than +/- 5 mV is measured, use a
different pair of pots which have been filled with copper sulfate crystals and water and left in the bath
for at least 12 hours. If this procedure does not reduce the drift voltage to less than 5 mV, mix the
copper sulfate solutions of the roving and base pots together and clean the ceramic bases. The pots and

36
the bath used for the survey must contain undissolved copper sulfate crystals to insure the solution is
saturated.
(b) Plant the Base Pot:
While keeping the bath shaded, remove the base pot (the pot with the large base) and dry the
terminal post. Place the base pot in a hole sufficiently deep that moist soil is reached and the entire pot
is below ground level, but well above the water table, i.e., no water should trickle into the hole. Push
dirt around the sides of the pot to hold it securely in the bottom of the hole. Do not allow the copper
post on the top of the pot to contact dirt from the side of the hole, and be sure the copper sulfate bath
solution has been dried off from the contact post as it may cause spurious contact potentials. Do not
expose the pot to sunlight at any time. Connect the free end of the wire from the wire reel to the base
pot. Cover the pot with a styro foam sheet. Weight the styro foam sheet with a rock and cover the edge
with dirt to prevent air circulation. In this fashion, the base pot is reasonably isolated from temperature
changes, photoelectric effects, and drying of the ground around the base pot while the line is being
run. Be specific, complete, and accurate in your location description.
Tie the wire around a tree or large rock to prevent the base pot from being pulled as
the wire is being unreeled. After tying the wire, weight it down so that it lies as flat on the ground as
possible. This is to minimize the possibility of automobiles or animals catching the wire and breaking
it. On driving lines, mount the wire reel in the back of the vehicle so that it may be unreeled as the
vehicle drives down the road .The reel should be placed so that it is securely fastened and need not be
moved for the duration of the survey. For walking lines, the breast reel should be carried in the most
comfortable and convenient manner.

37
(c) Measurement Station Locations:
Begin unreeling the wire by driving or walking to the first measurement station. The
operator monitors the wire as it is being unreeled and watches for the distance marks. Stations are
normally taken every 200 m when exploring for porphyry sulfides. However, in areas where the
potential relative to the survey base is lower than -100 mV, stations must be occupied every 100 m.
The minimum sampling interval for any survey can be determined using the Nyquist sampling
theorem. If the expected target is one kilometer across, then stations must be taken at least every 0.5
km to define the anomaly, i.e. the maximum station interval is equal to one-half the target width. In
theory, if the target is a 10 m wide dike, then the station interval should be 5 m. In practice, however,
the SP anomaly will be larger than the causative body so that for a 10 m mineralized dike the SP
anomaly will probably be approximately 20 m across. In this case, a station interval of 10 m would
suffice for reconnaissance, though a smaller sampling interval would be desirable when doing a
detailed survey of the anomaly. The time, and hence the cost, of any SP survey is critically dependent
on the station interval. Use the largest practical station interval as indicated by prior experience even
though this station interval may violate the Nyquist sampling theorem. On the other extreme, it is
seldom practical to use a station interval greater than 200 m due to risks of broken wire, target size,
and other operational problems which usually make it advisable to stop every 200 m and take a
reading .At the measurement station, place the roving pot in the most conductive ground within 10 m
of the distance mark on the wire. Dry off the terminal post when the roving pot is removed from the
bath. Dig a hole sufficiently deep to reach moist soil. Insert the pot by pressing it downward and
twisting. Make sure it is kept in the shade at all times. Do not water the pots at anytime. Do not touch
the copper post on the top of the electrode with the hand while making a voltage reading since these
changes the impedance of the circuit and affects the voltage reading on the receiver by producing
spurious potentials.

38
(b)Normal Polarity Voltage Measurement:
NORMAL VOLTAGE:
Measure the voltage between the base and roving pots with normal polarity. The normal
polarity is defined to be the base pot wire attached to the negative terminal of the receiver, and the
roving pot connected to the positive terminal. Record this measurement in the "Normal Voltage"
column with the sign explicitly given, i.e., +150, not just 150.
TIME:
Record the time of the normal polarity measurement in Column 1 of the data sheet. Use 24 hour
local time (e.g., 0000 to 2359 hours).
(c) Reverse Polarity Voltage Measurement:
Reverse the polarity of the input leads at the receiver (i.e., base pot to positive lead,
roving pot to negative lead) and take another measurement. Record the reverse polarity measurement
in the proper column on the data sheet. If the normal and reverse polarities do not agree to within 5
mV, something is wrong and must be corrected. The most likely cause is a broken wire. Recheck the
resistance with the polarity reversed. Check the wire connections to make sure they are secure.
(d) Clean the Roving Pot:
After the voltage reading is completed, remove the porous pot from the shaded hole, fill
the hole with dirt, clean the pot base with a stiff bristled brush while keeping it in the shade, and place
it in the porous pot bath. This keeps the copper sulfate bath clean, reduces the drift, and minimizes
electrochemical reactions between different soil types as the survey moves along. Cover the ceramic
tips with a plastic cap if the pot bath is inaccessible (as on walking lines) to protect it and keep it clean.
(e) Move to the Next Station:
Drive or walk to the next station, repeat the measurement station procedure, then move to
the next station until the line is completed. Flag at least every 1,000 meter station, or every 10th station,
with line number, distance, and date. These stations are to be re-occupied when picking up the wire.

39
Flagged holes should be annotated as flagged on the data sheet, and should be filled in with dirt after
completing the measurement to prevent the hole from drying out.
(f) Establish a New Base:
When the end of the wire is reached, and a line is to be continued, a new base should normally be
established in the same hole as the last measurement station on a line; however, a base can be
established in a flagged hole other than the last measurement station if conditions, such as steep SP
gradients, warrant. A hole where a new base is to be established should be farther away from the road
shoulder and in less rocky ground that the average roving pot hole, and should be made deep enough
to accommodate a base pot. It must also be above the water table and away from marshy or swampy
ground, bogs, old beaver dams, peat, streams, or any other areas where reducing (low Eh - high pH)
conditions might exist. A location on a hillside in sandy loam is an ideal site, but may seldom be
found. Do not put the base pot in road fill material, mine tailings or dumps, earth dams, or other
disturbed areas.
(g) Beginning a New Line:
Repeat the procedure used to do the initial line given above. Make sure that the base pot is placed
in exactly the same hole as used for the final measurement station on the previous line. By knowing
the base tie-in correction for the new line, the operator will know when absolute voltages are below -
100 mV, requiring a change from 200 to 100 m station spacings. At the end of each line, mark the last
station recorded with a reference point on the map and in the "Map Reference Point" column.
Complete the data sheet by marking the line, e.g., line A-B, at the top of the data sheet.
40
3.4 Data acquisition at the Survey location area:
The data is acquired as per the field procedure explained below:
The base point 0/0 is fixed over a bund and base line of 1.3 km is laid in
N30°E in Dholera block. Traverses were laid orthogonal to it at an interval of 100m and marked as
S100, S200.....upto S600 in southern side of 0/0 and N100, N200....upto N600 in northern side.
Stations were staked 20m apart and marked as E20, E40….. in the east and W20, W40…….. in the
west
The baseline in Islampur block has been laid with bearing of N320 E. The
traverse from the basepoint 0/0 located near a reference point of old Sareli fort in the study area is
extended in the northern and southern direction. The stations on the traverse are put at an interval of 20
metres and have been designated as E20, E40… W20, W40… according to the east or west to the base
line.
Now, at the base line we put both the porous pots which are filled with solution of copper
sulphate in a pit to make the electrode pots stable and connected to the IPR 10 A IP RECEIVER to
measure the potential difference between them at same point. The potential difference should be zero.
The small pits at the interval of 20mts in both the east and west were watered about 2 to 3 hrs prior to
take the reading. The study area have the dry fine grained soil that absorbs the water very quickly.
After making all the adjustment, we started taking reading by fixing the one pot at the base point
which must be –ve and move +ve electrode pot 20m apart and so on in the east direction and same for
west direction. The total length that was covered about 520 mts each in the west and east direction
from the traverse line on which the reading was taken. After completing the first traverse it was
connected with the traverse in the south by moving the instrument and keeping the negative NP
electrode at the new line with positive NP electrode at the first line. Similarly all the succeeding
traverse were connected for the acquisition of data.

41
Chapter- 4
DATA REDUCTION
4.1 Absolute Voltage relative to the survey base:
(a) Base Tie –in Correction:
The base tie-in correction is the absolute voltage of the base from which a line is run. This is the
value that must be added to the entire line to refer the voltage to the survey base. The base tie-in
correction for lines run off the survey base is, by definition, zero. All other lines will most likely have
a non-zero tie-in correction. The tie-in correction is determined by finding the drift-corrected absolute
voltage of the last station of the previous line. Since this station is normally used as the base station of
the current line the absolute voltage of the new base station is known. Absolute voltage (Vabs) for any
other station on a line is determined by adding the normal voltage (Vnorm) at that station to the
appropriate drift (Cdrift) and tie-in corrections (Cbase).
(Vabs = Vnorm + Cdrift + Cbase).
Compute the absolute voltage for all stations by adding the normal voltage to the base tie-in and drift
corrections (Vabs = Vnorm + Cbase + Cdrift). Record the absolute voltage of each station in the designated
column.
4.2 Plotting Profiles:
If anomalies with amplitudes of -100 mV or more were encountered during the day, plot the
absolute voltages for the day's work in profile. These profiles will allow the field crew and the
geophysicist to evaluate the data quickly, and to design follow-up survey lines. The profiles are to be
marked with the survey name, date, line designations, and reference marks. The scale on the profiles
for mineral surveys should be 100 mV/inch extending from +100 to -1,000 mV vertically, and 1
km/inch horizontally. The future design of the survey is critically dependent on delineating the
anomalies encountered as soon as possible. This is best done on the plotted profiles. The field crew
must keep the profiles of any anomalous areas up to date.

42
4.3 Data processing & maps:
The processing of data acquired using self-potential method. The profiles of the traverse were
made by the data being processed using the Microsoft excel and the maps were plotted using SURFER
9 software. A brief overview of software is:
Surfer 9:
Surfer a powerful contouring, gridding, and surface mapping package for scientists, engineers,
educators, or anyone who needs to generate maps quickly and easily. Producing publication quality
maps has never been quicker or easier. Maps can be displayed and enhanced in Surfer. Adding
multiple map layers, customizing the map display, and annotating with text can create publication
quality maps. Virtually all aspects of maps can be customized to produce exactly the presentation we
need.
Surfer is a grid-based mapping program that interpolates irregularly spaced XYZ data into a regularly
spaced grid. Grids may also be imported from other sources, such as the United States Geological
Survey (USGS). The grid is used to produce different types of maps including contour, vector, image,
shaded relief, 3D surface, and 3D wireframe maps. Many gridding and mapping options are available
allowing you to produce the map that best represents the data.
The interface provides visual data links that enable you to dynamically connect data in the
spread sheet, Profile, Map and ArcGIS MXD views. DAT technology enables the interface to use a
variety of grid and image formats in Oasis Montaj (Geosoft Software).
Introduction to Map Layers:
In Surfer 8, the process of overlaying maps included creating two separate maps, selecting both
maps, and using the Map / Overlay Maps command. In Surfer 9, this process has been
improved. There are now two ways to overlay map layers; by dragging a map layer from one map
object to another map object in the Object Manager, or by selecting a map and using the Map | Add
command to add a map layer.

43
It is possible to combine several maps created from related data to create one map object with
multiple map layers. You can add any combination of contour, base, post, image, shaded relief, vector,
or 3D surface maps. Maps can contain only one 3D wireframe layer,
FIG 4.1: Map object in surfer

44
Plate 3: Layout map of Dholera Block

45
Figure 4.2: Showing the profile along Base line, N100, N200 in Dholera Block
-40
-30
-20
-10
0
10
20
-600 -400 -200 0 200 400 600
SP READING (BASE LINE)
-60
-50
-40
-30
-20
-10
0
10
20
30
-600 -400 -200 0 200 400 600
SP DATA TRAVERSE N100
-120
-100
-80
-60
-40
-20
0
20
-600 -400 -200 0 200 400 600
SP DATA TRAVERSE N200

46
Figure 4.3: Showing the profile along N300, N400, N500 in Dholera Block
-150
-100
-50
0
50
-600 -400 -200 0 200 400 600
SP DATA TRAVERSE N300
-100
-80
-60
-40
-20
0
20
-600 -400 -200 0 200 400 600
SP DATA TRAVERSE N400
-70
-60
-50
-40
-30
-20
-10
0
-600 -500 -400 -300 -200 -100 0 100 200
SP DATA TRAVERSE N500

47
Figure 4.4: Showing the profile along N600 in Dholera Block
4.4 Description of profile in Northern part (Dholera block) of study area:
The above profile is made after the acquired data in the study area of Dholera
block. The relative comparison between the profiles shows that the traverse in the north-
western part of the study area shows an increase in amplitude. The profile at base line 0/0 from
the station W300 to W 400 shows an increase in SP value (-35). The profile at N100 again
shows a gradual increase in SP value to -48 between the stations W320 to W440. Similarly the
increase in SP values is observed in both the traverse of N200 and N300. The SP value at these
traverse increases to the maximum from the preceding traverse respectively -102 and -106.
Thereafter, a decrease in the SP value is observed in the profile at N400 and N500 between the
stations W220 and W480. The maximum value observed in traverse N600 i.e (-35) shows a
decline in trend of the respective anomalous zone in the study area. The overall pattern
observed of the anomalous zone may be oval shape in having a closure in the Northern part of
the study area.
-40
-30
-20
-10
0
10
20
30
40
50
60
-600 -400 -200 0 200 400 600
SP DATA TRAVERSE N600

48
Figure 4.5: Showing the profile along S100, S200, S300 in Dholera Block
-20
-15
-10
-5
0
5
10
-600 -400 -200 0 200 400 600
SP READING Traverse S100
-40
-30
-20
-10
0
10
20
30
-600 -400 -200 0 200 400 600
SP DATA TRAVERSE S200
0
5
10
15
20
25
-600 -400 -200 0 200 400 600
SP DATA TRAVERSE S300

49
Figure 4.6: Showing the profile along S400, S500, S600 in Dholera Block
-15
-10
-5
0
5
10
15
20
25
-600 -400 -200 0 200 400 600
SP DATA TRAVERSE S400
-40
-30
-20
-10
0
10
20
-600 -400 -200 0 200 400 600
SP DATA TRAVERSE S500
-60
-40
-20
0
20
40
-600 -400 -200 0 200 400 600
SP DATA TRAVERSE S600

50
4.5 Description of profile in Southern part (Dholera block) of study area:
The profile prepared south of the base line 0/0 is named as S100, S200..etc, shows a shift in the SP
values obtained from the northern part of the study area. The distance between the traverse is 100 mts
with variable values obtained along the traverses. As can be seen in the prepared graph S100 the SP
values is maximum of (-15) at station W380, while the East part of the Surveyed traverse have +ve
values. Similarly in the traverse at S200, SP value along the east part is +ve, with highest SP value
observed -30 in the western part of the study area. In the traverse along the S300 the SP values
observed are generally +ve within the block. The increase in negative value of SP is observed in
traverse S500 between the stations W360 to W400, and E100 to E200 with SP values in negative goes
to the maximum -30. In the last traverse at S600 the values observed in the east part increases from
station E80 to E300 with maximum being -50.

51
Plate 4: SP Contour Map of Dholera Area

52
4.6 Conclusions from profiles and contour map:
Self Potential survey was conducted over 20m X 100m grid in the area. The results of SP
survey in the area are presented in the form of contour map (PLATE-4). The SP values in the area vary
from +60 mV to -106 mV. Mainly one low SP anomaly zone was observed in the northwest part of the
area with maximum amplitude at station W440 over traverse N300. It is extending from traverse N150
to N500 and lying between stations W260 and W540. In the traverse S500 and S600 at station E0 to E
520 an anomalous zone can be seen with higher –ve contour increasing more between the station E120
to E220 respectively.

53
Plate 5: Layout Map of Islampur area

54
Figure 4.7: Showing the profile along Base line, N100, N200 in Islampur Block
-140
-120
-100
-80
-60
-40
-20
0
20
-600 -400 -200 0 200 400 600
SP DATA BASE LINE
-160
-140
-120
-100
-80
-60
-40
-20
0
20
-600 -400 -200 0 200 400 600
SP DATA TRAVERSE N100
-250
-200
-150
-100
-50
0
-600 -400 -200 0 200 400 600 800
SP DATA TRAVERSE N200

55
Figure 4.8: Showing the profile along N300, N400, N500 in Islampur Block
-250
-200
-150
-100
-50
0
-600 -400 -200 0 200 400 600
SP DATA TRAVERSE N300
-300
-250
-200
-150
-100
-50
0
-600 -400 -200 0 200 400 600
SP DATA TRAVERSE N400
-160
-140
-120
-100
-80
-60
-40
-20
0
-600 -400 -200 0 200 400 600
SP DATA TRAVERSE N500

56
Figure 4.9: Showing the profile along N600, N700, N800 in Islampur Block
-250
-200
-150
-100
-50
0
50
100
150
-600 -400 -200 0 200 400 600
SP DATA TRAVERSE N600
-200
-150
-100
-50
0
-600 -400 -200 0 200 400 600
SP DATA TRAVERSE N700
-60
-40
-20
0
20
40
60
80
100
120
-600 -400 -200 0 200 400 600
SP DATA TRAVERSE N800

57
Figure 4.10: Showing the profile along N1000, N1100, N1200 in Islampur Block
-40
-20
0
20
40
60
80
100
120
-600 -400 -200 0 200 400 600
SP DATA TRAVERSE N1000
-40
-20
0
20
40
60
80
100
-300 -200 -100 0 100 200 300 400 500 600
SP DATA TRAVERSE N1100
-40
-20
0
20
40
60
80
100
-300 -200 -100 0 100 200 300 400 500 600
SP DATA TRAVERSE N12OO

58
Figure 4.11: Showing the profile along N1300 Islampur Block
Figure 4.12: Showing the profile along Base line, S100 in Islampur Block
-50
0
50
100
150
200
250
-200 -100 0 100 200 300 400 500 600
SP DATA TRAVERSE N1300
-140
-120
-100
-80
-60
-40
-20
0
20
-600 -400 -200 0 200 400 600
SP DATA BASE LINE
-140
-120
-100
-80
-60
-40
-20
0
20
-600 -400 -200 0 200 400 600
SP DATA TRAVERSE S100

59
Figure 4.13: Showing the profile along N200, N300, N400 in Islampur Block
-150
-100
-50
0
50
100
150
200
-600 -400 -200 0 200 400 600
SP DATA TRAVERSE S200
-120
-100
-80
-60
-40
-20
0
20
40
60
-600 -400 -200 0 200 400 600
SP DATA TRAVERSE S300
-140
-120
-100
-80
-60
-40
-20
0
-600 -400 -200 0 200 400 600
SP DATA TRAVERSE S400

60
Figure 4.14: Showing the profile along S500, S600, S700 in Islampur Block
-200
-150
-100
-50
0
-600 -500 -400 -300 -200 -100 0 100 200 300 400 500
SP DATA TRAVERSE S500
-80
-60
-40
-20
0
20
40
60
80
-600 -400 -200 0 200 400 600
SP DATA TRAVERSE S600
0
20
40
60
80
100
120
140
160
180
0 100 200 300 400 500 600
SP DATA TRAVERSE S700
SP DATA TRAVERSE S700

61
Figure 4.15: Showing the profile along S800, S900, S1000 in Islampur Block
-40
-20
0
20
40
60
0 100 200 300 400 500 600
SP DATA TRAVERSE S800
0
20
40
60
80
100
120
0 100 200 300 400 500 600
SP DATA TRAVERSE S 900
0
10
20
30
40
50
60
70
80
0 100 200 300 400 500 600
SP DATA TRAVERSE S1000

62
Figure 4.16: Showing the profile along S1100, S1200 in Islampur Block
0
10
20
30
40
50
60
70
80
90
0 100 200 300 400 500 600
SP DATA TRAVERSE S1100
0
20
40
60
80
100
-600 -400 -200 0 200 400 600
SP DATA TRAVERSE S1200

63
Plate 6: SP Contour Map of Islampur Area

64
4.7 Conclusions from SP Profiles and contour map of Islampur area:
Self-potential survey was conducted over 20m x 100m grid in the area. The
result of SP survey is presented in the form of contour map (Plate-6) and in the profile from (Plate- to).
The SP values in the study area vary from minimum -252 mV to maximum of 205 mV. The map
shows the prospective anomalous zones with a total of 6 zones in the western, eastern and central part.
The western part has probably 2 mineralized zones extending in traverse N300 to N700 lying in
between the station -200 to -520 and S400 to S500 lying in between the station -320 to -520.In
the eastern side the conductive anomalous zone is observed in the traverse N0 to N700 and lying from
station 260 to 520, S400 to S500 and lying in station 260 to 320 and also observed in S900, extending
from station 220 to 320. In the central part of the study area the anomalous zone lies in the traverse
S500 extending from -40 to -200 in the western line.
The general strike direction of the study area is N320 E. The structural disturbance in
the sub-surface is also reflected across the traverse. The presence of alignment of contour in traverse
S600 may be minor fault, fracture or shear zone extending in the east-west direction. There is also a
disturbance witnessed in the northern side along the traverse N700 to N800, probably being a slip or
minor fault running in east-west direction.

65
CONCLUSION AND RECOMMENDATION:
The following conclusion may be drawn on the basis of geophysical survey conducted during
the study of Islampur and Dholera block of the study area.
1. Alignment of SP values indicates the presence of formational contact/fault in the area.
2. Based on the geophysical studies the SP anomalous zone may further be recommended for
investigation by IP pseudo-section method.

66
REFERENCES
Blakely Richard J. Potential theory in gravity and magnetic applications, Cambridge
University Press (UK), January, 1995.
Corry CE (1985) Spontaneous Sulphide mineralization associated with porphyry
sulphide mineralization, Geophysical prospecting 56: 269-282
Charles E. Corry Gregory T. DeMoully, Michael T. Gerety. Field Procedure Manual for
Self-Potential Survey Original: December, 1980 Revised: February, 1982 by Zonge
Engineering & Research Organization Tucson, Arizona
Government of India, Geological survey of India, Standard Operational Procedure
(SOP) For, Ground Geophysical Surveys.
Sheriff, R.E., 1994: Encyclopaedic dictionary of exploration geophysics (3rd edition).
SEG – Society of Exploration Geophysics.
Telford, W.M., Geldart, L.P. & Sheriff, R.E. (1990) Applied Geophysics, 2nd edition,
Cambridge University Press, Cambridge.
Kearey, Philip, Brooks, Michael & Hill, Ian (2002) A Introduction to Geophysical
Exploration, 3rd edition.
Sato, M. & Mooney, H.M. (1960) The electrochemical mechanism of sulphide self-
potentials, Geophysics.

67