disease-specific event reduction “plausibility indicators” the reasons for widespread...
TRANSCRIPT

Disease-Specific Event Reduction
“Plausibility Indicators”The reasons for widespread
marketplace acceptance

© DMPC www.dismgmt.com 2006
Agenda
• Logic
• Dealing with Populations Subject to Trend
• Examples
• Acceptance

© DMPC www.dismgmt.com 2006
Reprise of Ariel’s Definition: Logic
• An asthma nurse is talking to asthma patients about asthma. Much if not most of the reduction in claims should be in asthma. It is not plausible to say, “We earned a 2:1 ROI in asthma” with a pre-post if there was no significant reduction in asthma admissions/ER visits (“plausibility”)

© DMPC www.dismgmt.com 2006
Pre-post Analysis vs. Event-Based “plausibility analysis”
• Example: Babies• Suppose you want to reduce your plan’s
birth rate (now 10,000 babies a year) by instituting free contraception and family planning
• For a pre-post analysis, to find eligibles, you take everyone with a claim for a birth during the last two years– That is the cohort with which you are working
© DMPC www.dismgmt.com 2006
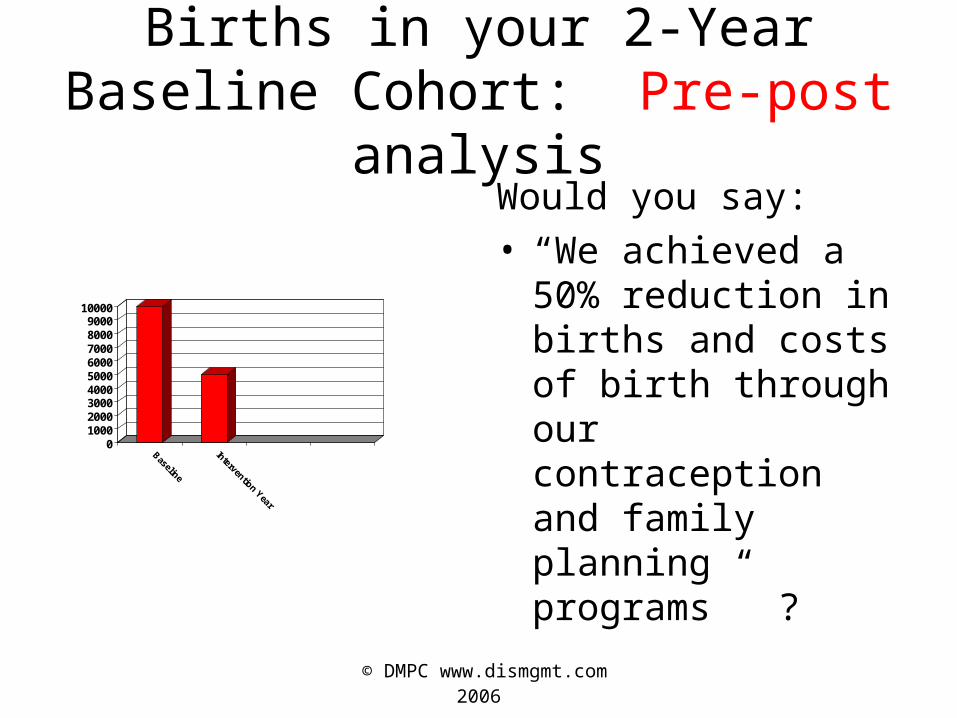
Births in your 2-Year Baseline Cohort: Pre-post analysis
0100020003000400050006000700080009000
10000
Baseline
Intervention Year
Would you say:• “We achieved a 50%
reduction in births and costs of birth through our contraception and family planning programs” ?

© DMPC www.dismgmt.com 2006
Of course not. You would say:
• “This is absurd…you would never just measure births in a cohort. You’d measure in the entire plan.”– Measuring the entire plan is an event-based
plausibility analysis to check the pre-post, as in this example

© DMPC www.dismgmt.com 2006
Births in your entire Health Plan: The event-based plausibility analysis
0
2000
4000
6000
8000
10000
12000
Baseline
Intervention Year
Births taking placemore than two yearsago
Births in first-timemoms
# Births in 2-yearbaseline cohort

© DMPC www.dismgmt.com 2006
Births in your entire Health Plan: The event-based plausibility analysis
0
2000
4000
6000
8000
10000
12000
Baseline
Intervention Year
Births taking placemore than two yearsago
Births in first-timemoms
# births IN ORIGINALCOHORT
These people getMissed in a pre-post

© DMPC www.dismgmt.com 2006
Babies vs. chronic disease
• “This is absurd…you would never just measure births in a cohort. You’d measure in the entire plan.”
But this is precisely what you do when you measurepre-post for chronic disease and then track your performance vs. the baseline. Let’s use a hypotheticalfrom a chronic disease and include cost and show how Pre-post gives you a much different – and much less Valid – result than a plausibility-based event measurement

© DMPC www.dismgmt.com 2006
Example from AsthmaFirst asthmatic has a $1000 IP claim in 2004
2004 (baseline)
2005 (contract)
Asthmatic #1
1000
Asthmatic #2
Cost/asthmatic

© DMPC www.dismgmt.com 2006
Example from AsthmaSecond asthmatic has an IP claim in 2005 while
first asthmatic goes on drugs (common post-event)
2004 (baseline)
2005 (contract)
Asthmatic #1
1000 100
Asthmatic #2
0 1000
Cost/asthmatic
© DMPC www.dismgmt.com 2006
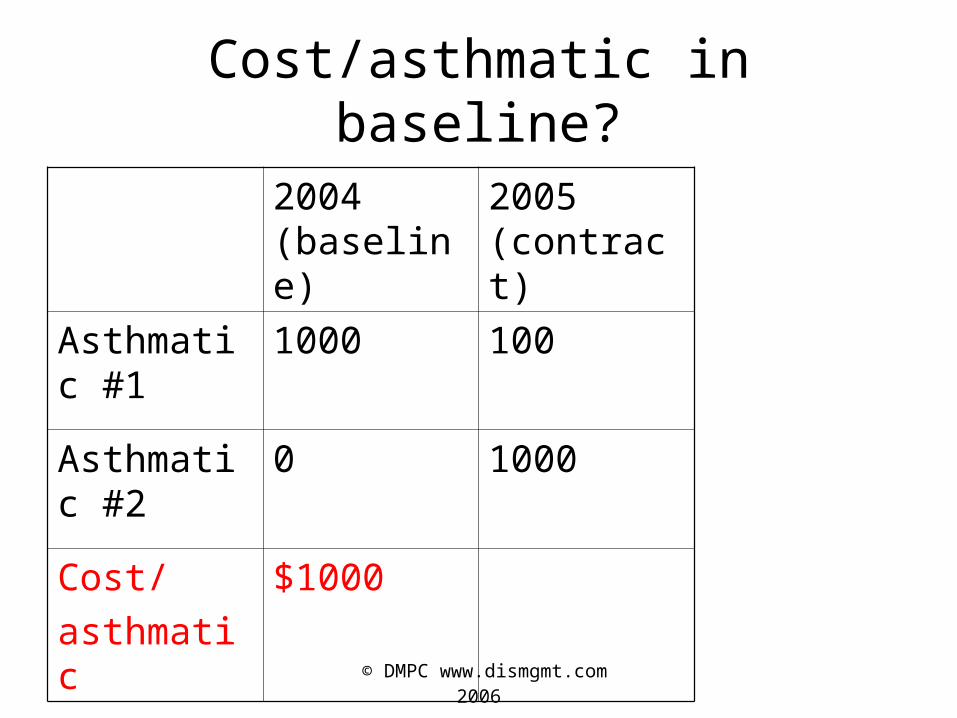
Cost/asthmatic in baseline?
2004 (baseline)
2005 (contract)
Asthmatic #1
1000 100
Asthmatic #2
0 1000
Cost/
asthmatic
$1000

© DMPC www.dismgmt.com 2006
Cost/asthmatic in contract period?
2004 (baseline)
2005 (contract)
Asthmatic #1
1000 100
Asthmatic #2
0 1000
Cost/asthmatic
$1000 $550

© DMPC www.dismgmt.com 2006
Using “event-based plausibility indicator” of
total primary asthma IP codes
2004 (baseline)
2005 (contract)
Asthmatic #1
1000 100
Asthmatic #2
0 1000
Number of IP codes
1 1

© DMPC www.dismgmt.com 2006
Conclusion
• The “plausibility analysis” showed no change in asthma events
• Invalid pre-post financial results caused by the unfound asthmatic in base year (just like unfound people getting pregnant in previous example)– This is very common—many people with a condition
don’t have disease-identifiable claims every year
• No money was saved despite pre-post “result” (costs went up)

© DMPC www.dismgmt.com 2006
Difference between babies and chronic disease
• Better-established trends in babies
• Unlikely to miscode a birth (though miscoding primary IP/ER events generally is a wash year over year)

© DMPC www.dismgmt.com 2006
What Can Happen to Move Chronic Disease Trend
• Change in demographics of plan (adding a large municipality, for example)
• Major change in usual care
• Major change in physician behavior
• Change in underlying rate of disease-specific events (due to prevalence or usual care)
Next slide will show that these tend to move the line in small percentages while DM should create large percentage declines
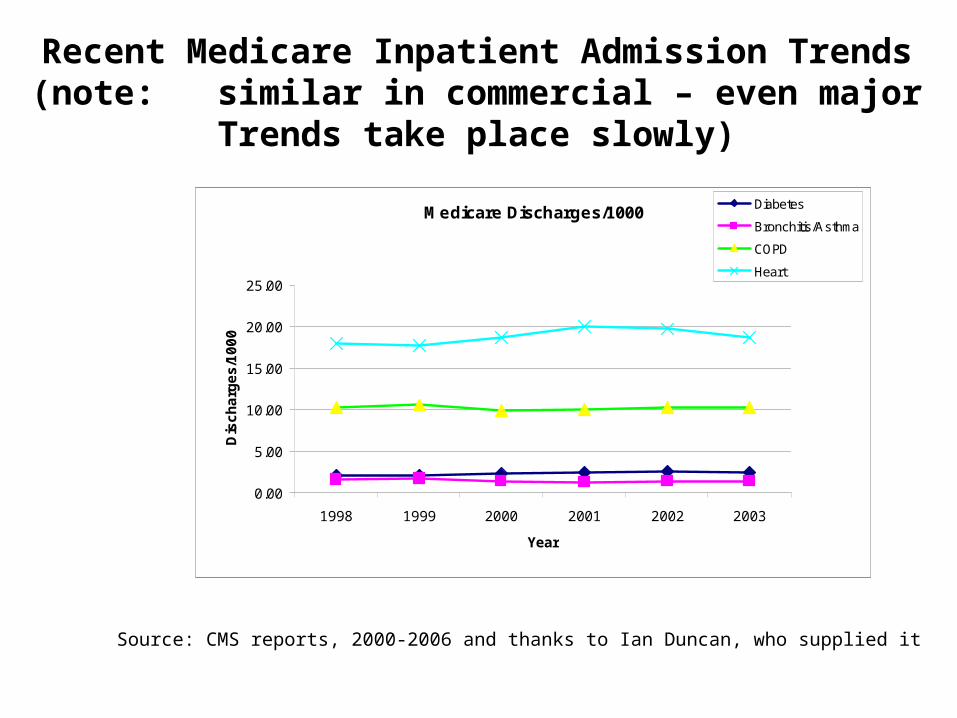
Recent Medicare Inpatient Admission Trends(note: similar in commercial – even major
Trends take place slowly)
Medicare Discharges/1000
0.00
5.00
10.00
15.00
20.00
25.00
1998 1999 2000 2001 2002 2003
Year
Dis
ch
arg
es
/10
00
Diabetes
Bronchitis/Asthma
COPD
Heart
Source: CMS reports, 2000-2006 and thanks to Ian Duncan, who supplied it

Enlarging the picture…
Medicare Discharges/1000
1.00
1.20
1.40
1.60
1.80
2.00
2.20
2.40
2.60
1998 1999 2000 2001 2002 2003
Year
Dis
ch
arg
es
/10
00
Diabetes
Bronchitis/Asthma
Annualized trends: Diabetes: 2.1%; Asthma: -2.8%;COPD: 0.2%; Heart: 0.8%

© DMPC www.dismgmt.com 2006
Agenda
• Logic• Dealing with Populations Subject to Trend• Examples
– Note that the vendor report example would require major inflections of trend
– Note that it is events only, not procedures (which are discontinuous)
– Note that it is consistent with Ariel’s research showing that significant event rate changes needed to get ROI
• Acceptance

© DMPC www.dismgmt.com 2006
Example of just looking at Diagnosed people in pre-post: Vendor Report of
Asthma Cost/patient Reductions
-25%
-20%
-15%
-10%
-5%
0%
1st year 2nd year
ER ER
IP
IP
© DMPC www.dismgmt.com 2006
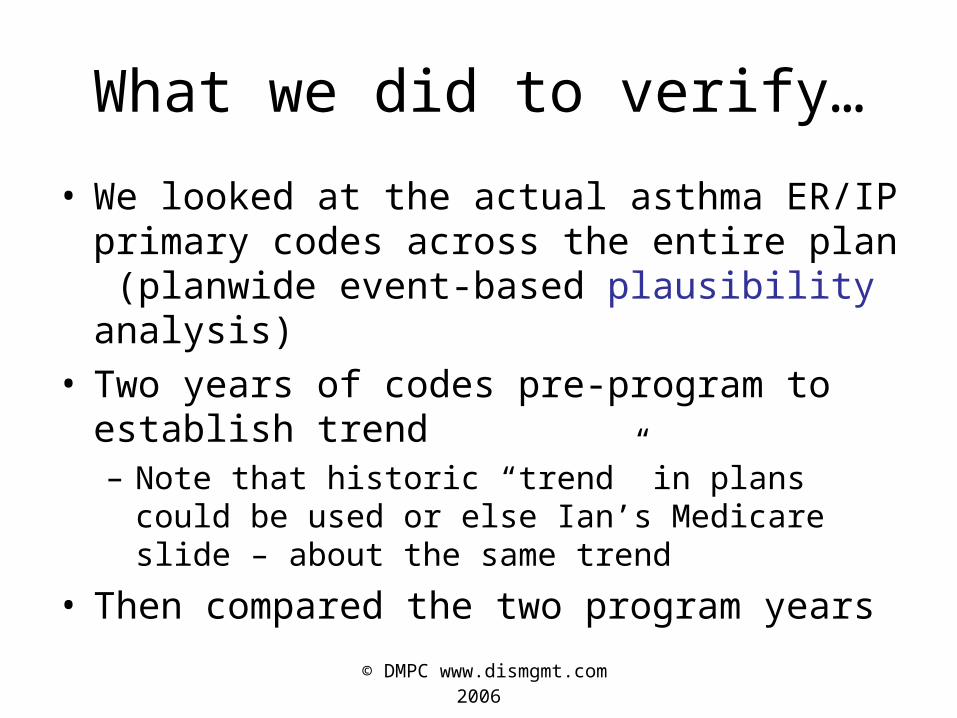
What we did to verify…
• We looked at the actual asthma ER/IP primary codes across the entire plan (planwide event-based plausibility analysis)
• Two years of codes pre-program to establish trend– Note that historic “trend” in plans could be used or
else Ian’s Medicare slide – about the same trend
• Then compared the two program years

© DMPC www.dismgmt.com 2006
Two years’ Baseline health plan trend for asthma ER and IP Utilization
493.xx Primary-coded ER visits and IP stays/1000 planwide
0
0.2
0.4
0.6
0.8
1
1.2
1.4
1.6
1.8
2
1999(baseline)
2000(baseline)
ER ER
IP IP

© DMPC www.dismgmt.com 2006
If pre-post was accurate, plausibility expectation is something like…
(493.xx primary-coded ER visits and IP stays/1000 planwide)
0
0.2
0.4
0.6
0.8
1
1.2
1.4
1.6
1.8
2
1999(baseline)
2000(baseline)
2001 (study)2002 (study)
ER ER ER ER
IP IP IP IP

© DMPC www.dismgmt.com 2006
Plausibility indicator Actual: Validation for Asthma savings from same plan
including ALL CLAIMS for asthma(493.xx ER visits and IP stays/1000 planwide)
0
0.2
0.4
0.6
0.8
1
1.2
1.4
1.6
1.8
2
1999(baseline)
2000(baseline)
2001 (study)2002 (study)
ER ER ER ER
IP IP IP IP

© DMPC www.dismgmt.com 2006
Two more Plausibility Examples
• IBM (Matria) CAD
• Pacificare (Alere) CHF

© DMPC www.dismgmt.com 2006
IBM Angina “Plausibility Analysis”Hosp Admits ICD-9 '413.xx' per 1000 MM
0.1404
0.12830.1172
0.0913
0.0000
0.0200
0.0400
0.0600
0.0800
0.1000
0.1200
0.1400
0.1600
2001 2002 Expected2003
Actual 2003
2001
2002
Expected 2003
Actual 2003

© DMPC www.dismgmt.com 2006
Acute MI “Plausibility Analysis” Hosp Admits ICD-9 '410.xx' per 1000 MM
0.1469
0.13560.1251
0.1051
0.0000
0.0200
0.0400
0.0600
0.0800
0.1000
0.1200
0.1400
0.1600
2001 2002 Expected2003
Actual 2003
2001
2002
Expected 2003
Actual 2003
© DMPC www.dismgmt.com 2006
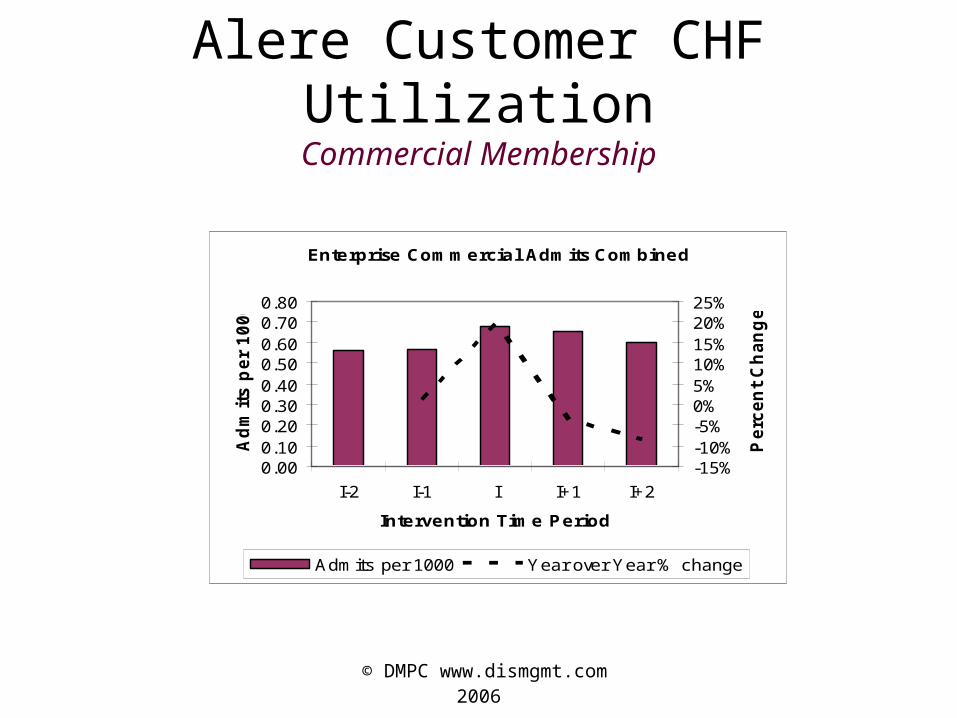
Alere Customer CHF UtilizationCommercial Membership
Enterprise Commercial Admits Combined
0.000.100.200.300.400.500.600.700.80
I-2 I-1 I I+1 I+2
Intervention Time Period
Ad
mit
s p
er
10
00
-15%-10%-5%0%5%10%15%20%25%
Pe
rce
nt
Ch
an
ge
Admits per 1000 Year over Year % change
© DMPC www.dismgmt.com 2006
Agenda
• Logic
• Dealing with Populations Subject to Trend
• Examples
• Acceptance of event-based plausibility

© DMPC www.dismgmt.com 2006
Number of Payors Using This Approach
0
5
10
15
20
25
30
35
2004 2005 2006 2007 Est
2004
2005
2006
2007 Est

© DMPC www.dismgmt.com 2006
Partial list of Payors using this methodology (DMPC certified only)
Blue Cross of Alabama
Blue Cross of Delaware
Blue Cross of Vermont
Bluegrass Family Health Plan
CareFirst
Capital District Physicians' Health Plan, Inc. (CDPHP)
CHA Health
Connecticare
Empire Blue Cross
Georgia Department of Community Health (Medicaid)
Great-West Health Care
Harvard Pilgrim Health Care
Health First Health Plans
Health Net
HealthPartners (MN)
IBM
Illinois Department of Family Health
Pacificare
PreferredOne
Premera Blue Cross
Procter & Gamble
State Teachers Retirement System of Ohio
SummaCare
Wyoming Medicaid

© DMPC www.dismgmt.com 2006
Conclusion
• In “normal” situations any financial result should be tested with an event-based plausibility analysis. If the financial result shows significant savings but the event rate trend didn’t change noticeably, there is likely a mistake in the financial result– Preferable to have both analyses show consistent
results
• Make sure to understand demographic trend changes before reaching that conclusion