discussion paper november 2010 - kyushu … discussion paper november 2010 no.45 a model for...
TRANSCRIPT
1
DISCUSSION PAPER
November 2010
No.45
A Model for Recycling Target Policy under Imperfect
Competition With and Without Cooperation Between Firms
Satoshi Honma Ming-Chung Chang
Faculty of Economics Department of Banking and Finance
Kyushu Sangyo University Kainan University
1
A Model for Recycling Target Policy under Imperfect
Competition With and Without Cooperation Between Firms
November 2010
Honma, Satoshi *, Faculaty of Economics, Kyushu Sangyo University, Japan
Chang, Ming-Chung, Department of Banking and Finance, Kainan University, Taiwan
Abstract: The purpose of this paper is to develop a general theoretical model that
describes production and recycling in an n-firm oligopoly market in which firms can
cooperate for recycling. We use a three-stage game to analyze a specific recycling issue.
In stage 0, the government sets a target recycling rate as well as virgin material and final
disposal tax rates. In stage 1, n identical firms simultaneously invest to reduce the cost of
recycling given the recycling target. Here we treat this activity as a type of R&D.
Furthermore, we consider three kinds of R&D activities depending on what firms maximize
in stage 1, namely, industry-wide cooperation, within-group cooperation, and
non-cooperation. In stage 2, firms engage in a Cournot competition.
Surprisingly, positive virgin material taxes or positive final disposal taxes discourage
firms from engaging in recycling R&D efforts in normal situations, regardless of whether
R&D cooperation takes place. We compare second-best social welfare levels under the
three regimes described above. We find that both non-cooperation and within-group
* Corresponding author. Faculty of Economics, Kyushu Sangyo University 2-3-1 Matsukadai, Higashi-ku
Fukuoka 813-8503, Japan. E-mail: [email protected]; Tel: +81-092-673-5280.
2
cooperation are inferior from a welfare perspective to industry-wide cooperation.
Furthermore, in the case of within-group cooperation, the symmetric division of firms
induces the lowest welfare for all ranges of a given spillover parameter.
Keywords: Recycling, Cooperation, Cournot Competition.
JEL Classification Q53, L13, O32
1. Introduction
In recent decades, the amount of electrical and electronic equipment (EEE) produced
worldwide has significantly increased. The resulting increase in the amount of waste
electrical and electronic equipment (WEEE) has lead to a major increase in environmental
pollution. In 2005, the European Union implemented an environmental directive named
2002/96/EC to management WEEE. This regulation requires manufacturers to charge a
fee when they help consumers dispose of WEEE that originates from their own products.
However, the earliest implementation of a WEEE recycling system occurred not in the EU
but in Japan. The Japanese WEEE recycling system was initiated in 2001. According to
Japan’s Recycling Law, the Japanese WEEE recycling system only recycles six types of
home appliances.1 In contrast, the EU WEEE directive encompasses a wider variety of
products.
1 In 2001, the designated appliances were CRT-based televisions, air conditioners, refrigerators and freezers,
and washing machines. Liquid crystal and plasma televisions and clothes driers were added in 2009.
3
In both the EU and Japan, it is the responsibility of the manufacturers to recycle their
own products. To promote the efficiency of the recycling system, the EU WEEE directive
encourages each manufacturer to participate in a collective scheme called the Producer
Responsibility Organization (PRO). The WEEE Directive states that “the producer can
choose to fulfill this financing obligation either individually or by joining a collective
scheme” (Article 8.2). PROs have been established in many EU countries. Under Japan’s
recycling system, manufacturers have formed two recycling groups. Both of them have
independent recycling systems for the collection and handling of WEEE. Although
Japan’s recycling law does not regulate any type of competition between these two groups,
the Japanese government likes to see cooperative environmental R&D aimed at reducing
recycling costs occurring between these two groups. These two recycling groups in Japan
are comprised of 24 firms (“group A”) and 21 firms (“group B”). In Japan’s recycling
regime, each group establishes its own recycling systems, but they cooperate to collect and
recycle WEEE. The most critical problem in the WEEE recycling systems of both the EU
and Japan is that the cost of recycling is high. High recycling costs not only discourage
manufacturers from investing in a recycling system but also lead to lower social welfare.
In this paper, we establish an environment R&D model to analyze firm behavior in
reducing the costs of recycling.
Many theoretical articles have investigated the issue of waste recycling given a perfect
competition market, including Walls and Palmer (2001), Shinkuma (2007) and Koide
(2008). However, the market structure of WEEE recycling regimes in the EU and Japan is
an oligopoly market rather than a perfect competition market. Fleckinger and Glachant
4
(2010) investigated the government’s waste policy in a product-differentiated duopoly
model. They compared the results between competitive and cooperative PRO models and
revealed some collusion problems in PROs. In this paper, we also discuss the issue of
WEEE recycling in an imperfect competition market structure. A crucial difference
between their model and our own is that in their model, firms have a responsibility to
recycle their own products that are thrown out, but they do not use the waste as an input
material in their model. In our model, we assume that firms not only collect their own
waste but also use the waste as an input material. Furthermore, we assume that the
percentage of recycled material used is in concordance with the government’s target
recycling rate. These assumptions match the current situation in Japan. For example,
Sony electronics usually uses the waste plastic extracted from their own waste products
such as TVs, washing machines, air conditioners, and refrigerators as input in the
production process. Generally, this recycled material is used on the inside of new
products. For exaple, waste plastic from old TVs is used as an input to produce new TVs.
Additionally, and in keeping with our assumptions, all Japanese electronics firms must
comply with the regulated target recycling rate that is set by the government.
Oligopoly firms, such as EEE manufacturers, always compete in the product market,
though it is possible for them to cooperate in R&D activities. A pioneering study by
d’Aspremont and Jacquemin (1988) showed that if a spillover effect is large, then the
output level, R&D level, and social welfare in the case of R&D cooperation are larger than
in the case of R&D non-cooperation. Other studies that have investigated the connection
between R&D and social welfare include articles by Suzumura (1992) and Leathy and
5
Neary (1997). Some articles on environmental economics have focused on the role of
R&D in reducing pollution emissions rather than reducing production costs. Katsoulacos
and Xepapadeas (1996) showed that firms engage in environmental R&D when emission
taxes are introduced. They also found that the optimal emission tax rate is lower than the
marginal environmental damage. Chiou and Hu (2001) examined environment R&D
levels and spillover effects in several different cooperation models. Poyago-Theotoky
(2007) showed that the level of social welfare in the case of an R&D cartel is larger
(smaller) than that in the case of independent R&D if the amount of environmental damage
is small (large).
Based on the above articles, it is clear that many studies have investigated the effect of
firm R&D on reducing pollution. However, to the best of our knowledge, no studies have
investigated the effects of firm R&D on reducing recycling costs. Undoubtedly, the
government’s target recycling rate also affect firm R&D efforts that are aimed at reducing
recycling costs. Therefore, the competitive regime of firm R&D influences both
firm-level recycling performance as well as social welfare. Furthermore, because most
previous models dealing with environmental R&D assume duopolies, the effect of
cooperation on environmental R&D within each group, rather than in an entire industry, has
not been examined.
The purpose of this paper is to examine how cooperation affects social welfare and
recycling. Our model provides a general recycling framework in an n-firm oligopoly, of
which theoretical studies are still quite scarce. We also consider how taxes and subsidies
affect firm eagerness to engage in recycling programs.
6
In this paper, we use a three-stage game to analyze the issue of recycling. In stage 0,
the government sets a recycling target rate in addition to virgin material and final disposal
tax rates. In stage 1, n identical firms simultaneously invest to reduce recycling costs
given the government-set recycling target. We consider this activity to be a type of R&D.
We also consider three kinds of R&D activity depending on what firms chose to maximize
in stage 1, namely, industry-wide cooperation, within-group cooperation, and
non-cooperation. In stage 2, firms engage in a Cournot competition. The equilibrium
level of R&D under a cooperative strategy is always larger than under a non-cooperative
strategy. Surprisingly, virgin material and final disposal taxes discourage firm R&D
efforts relating to recycling in usual cases, regardless of whether R&D cooperation takes
place. This is because higher virgin material or final disposal tax rates raise firm marginal
costs. Consequently, such taxes decrease output, thus decreasing firm incentives to invest
in recycling. Accordingly, the government should instead use virgin material or final
disposal subsidies to achieve an optimal outcome, the rates of which are derived in our
theoretical analysis under both cooperation and non-cooperation. The inefficiency and
high recycling fees of Japan’s current recycling scheme have been noted previously.2
Our numerical simulation compares welfare under conditions of industry-wide cooperation
and within-group cooperation. The latter describes the current Japanese recycling regime
in which firms are divided into two groups and chose R&D levels aimed at maximizing the
joint profit of the group. This result suggests that welfare under the two-group regime is
smaller than what would occur under industry-wide cooperation because the latter
2 See Hosoda (2008) and Koide (2008).
7
generates more spillover effects and R&D incentives than the former. Moreover, a
symmetric two-group case of within-group cooperation results in the lowest welfare
because of an oligopoly-specific phenomenon. Therefore, the current two-group regime
in Japan should be changed to an industry-wide regime. Our results shed light on the
effect of group formations for cooperative recycling on social welfare.
The remainder of this paper is organized as follows. Section 2 presents the model
set-up. Section 3 discusses equilibrium R&D expenditures and outputs. Section 4
provides numerical results. Finally, Section 5 concludes the paper.
2. Model Setup
We use a three-stage game to explore the Cournot competition between n identical firms
working under a recycling target policy, where n 2. In stage 0, the government sets a
target recycling rate that is defined as [0, 1]. Target recycling policies dictate that
each firm has to recycle their own products that are collected after consumption3. The
firm-level waste recycling ratio is defined as the amount (in weight) of recycled waste
divided by the total input (the sum of the amount of virgin material and waste recycling),
which must meet at a minimum.
According to the model described by Higashida and Jinji (2006), firms can use one unit
of virgin material, recycled material or a mix made from virgin and recycled materials to
produce one unit of final good. We assume that the price of virgin material is wv, which is 3 In the real world, the government or retailers collect the waste products at designated collection sites. For
simplification, we assume that a firm itself collects and recycles its own products that are discarded by
consumers.
8
treated as a constant in this paper. The cost of recycling one unit of waste for firm i is
defined as ci, which is always higher than wv, where i = 1,…,n. Hence, the marginal cost
for firm i is
MCi = ci + (1 - )wv. (1)
Equation (1) indicates that each firm bears an additional recycling cost (ci-wv) when the
firm uses one unit of mixed material to produce one unit of final good. This recycling cost
can be interpreted two ways. One interpretation is that it is the cost incurred when a firm
collects waste products, extracts recycled material from them, and uses this material as an
input in place of virgin material during the production process. Another interpretation is
that the cost of easy recycling when a firm produces goods lowers the recycling cost. We
admit that these interpretations lead to wider policy implications. In reality, consumers
pay recycling fees when they purchase new appliances (i.e., an advanced disposal fee) or
when they discard old ones. Obviously, the amount of recycling cost that firms can pass
along to the consumers depends on the slope of the demand curve. Unless we assume
illegal dumping occurs, a recycling hiding fee would be irrelevant. To focus specifically
on recycling effort, we do not explicitly denote recycling fees and assume that firms load a
part of the additional recycling cost.
Because we do not represent the reduced form of the optimal recycling target rate with
respect to firm behavior, our model is essentially a two-stage game. In stage 1, firm i
chooses a R&D investment level that is defined as xi. For describing either a cooperative
or non-cooperative R&D scenario among firms, we assume firm i’s ci is reduced by both its
own R&D input factor and its rival’s R&D input factor. Hence, ci is defined as
9
ci = - (xi + ij
jx ), (2)
where > 0 is a constant, and [0, 1] is defined as a spillover coefficient. If n firms
adopt a cooperative strategy, then the parameter is equal to unity.4 If firms in the
industry use common stockyards for discarded products and operate using the same lines, it
is reasonable to assume full spillover. In contrast, if firm i adopts a non-cooperative
strategy with its rival firm j in a business operation, then the parameter is a number
between zero and unity that depends on the spillover effect. In this case, a firm operates
its own recycling system, though each firm imperfectly learns recycling techniques and
operations from other firms. Finally, the cost of R&D investment is defined as xi2 / 2,
where > 0.
Although the term “R&D” may seem an odd choice to some readers, the reason we
use it is to capture the increasing property of the cost of recycling efforts and to allow for
comparison between existing environmental R&D models and our own.
In stage 2, n firms compete in a production market under Cournot competition.
The inverse demand function is given by
P = a - bQ, (3)
where Q = q1 + + qn, a > 0, b > 0, and qi is an output level for firm i. Based on the
model above, firm i’s profit can be represented as
i = (P(Q) - MCi)qi - xi2 / 2. (4)
We use backward induction to obtain the sub-game perfect Nash equilibrium (SPNE) of the
game. It is important to note that though there is a time lag between the purchase of a
4 This case can be called an environmental research joint venture as defined by Poyago-Theotoky (2007).
10
final good and waste recycling, we do not consider the time lag in this paper. If we
consider such a time lag, then we should consider strategic behavior in an infinite Cournot
competition. Without loss of generality, we assume that the market exists in a long-run,
steady-state equilibrium. This kind of model setup is frequently employed in recycling
studies (Palmer and Walls 2001; Higashida and Jinji, 2006).
3. The Model Analysis
In this section, we calculate the equilibrium R&D level and quantity for non- and
full-cooperation, and then we examine how policy instruments affect social welfare in the
two cases. Finally, we calculate the R&D level in the case of within-group cooperation.5
3.1 Non-cooperative Strategy in R&D and Output First, we consider a case of
non-cooperation. In stage 2, each firm simultaneously chooses an output level to
maximize its profit given the R&D investment level and other firm output levels.
Maximizing Eq. (4) and solving the symmetric Nash-Cournot equilibrium, we obtain
qin =
)1(
nb
MCnMCaij
ji
. (5)
Substituting Eq. (5) into Eq. (4) and differentiating it with respect to xi, we obtain the first
order condition
5 Because studying R&D levels in the case of within-group cooperation is very complex, we only show the
equilibrium level here.
11
i
i
ij i
j
j
i
i
i
i
i
i
i
xx
q
qx
q
qdx
d
=0. (6)
The first term on the right-hand side of Eq. (6) is zero because it is the first-order condition
of the profit maximization. The second term is called the strategic effect. It shows that
firm i’s profit is indirectly affected by its rivals’ outputs and that the outputs of rivals are
affected by firm i’s R&D investment. The third term is the profit effect, which shows that
firm i’s profit is affected by its marginal cost and that firm i’s marginal cost is affected by
its R&D investment level.
Next, we use Eq. (6) to solve the symmetric equilibrium R&D investment level in
stage 1. Here we let di / dxi = 0 and obtain the symmetric solutions for R&D investment
levels.6 They are represented as follows.
7
21
))1((2
nxn
i , (7)
where ω = a - α - (1 - )wv, 222
1 2)1( nnb , and
)1()
4
3)
2
1(()1(2 22
2 nn > 0.8
If no R&D is performed, the Nash-Cournot equilibrium output is given by ω/b(n+1). In
the second stage, firm i’s output can be rewritten as
21
)1(
nqn
i . (8)
6 We assume that firm i’s profit function satisfies the second-order condition, i.e., 2(n - (n - 1))
2 - b(n +
1)2 < 0.
7 At first glance, Eq. (7) seems to be complex; however, if we set =1, wv=0, and n=2, it corresponds to the
non-cooperative solution x* in the study by d’Aspremont and Jacquemin (1988, p.1134). Here, the first two
substitutions essentially reduce our recycling model to the ordinary cost-reducing R&D model, and the last
substitution reduces our model to a duopoly. 8 This is the case if we assume the interior solution of R&D level under the cooperative case as solved in the
next subsection (i.e., the sign of Δ1) is positive.
12
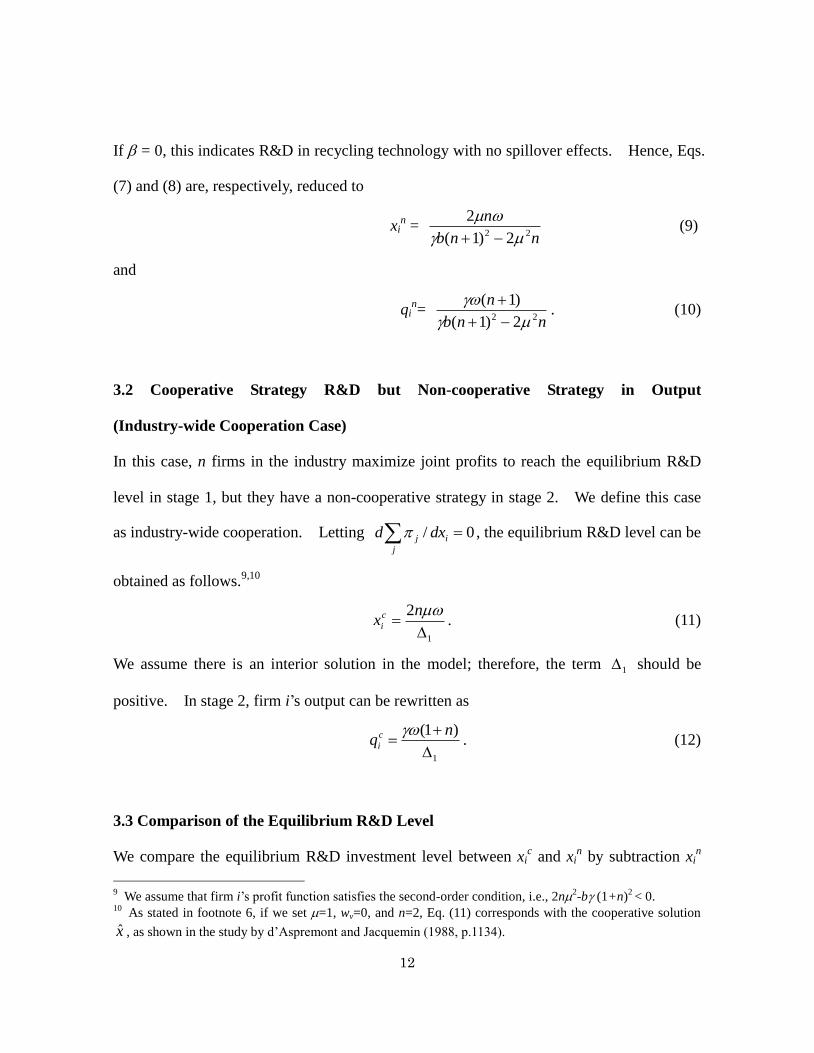
If = 0, this indicates R&D in recycling technology with no spillover effects. Hence, Eqs.
(7) and (8) are, respectively, reduced to
xin =
nnb
n22 2)1(
2
(9)
and
qin=
nnb
n22 2)1(
)1(
. (10)
3.2 Cooperative Strategy R&D but Non-cooperative Strategy in Output
(Industry-wide Cooperation Case)
In this case, n firms in the industry maximize joint profits to reach the equilibrium R&D
level in stage 1, but they have a non-cooperative strategy in stage 2. We define this case
as industry-wide cooperation. Letting j
ij dxd 0/ , the equilibrium R&D level can be
obtained as follows.9,10
1
2
nxc
i . (11)
We assume there is an interior solution in the model; therefore, the term 1 should be
positive. In stage 2, firm i’s output can be rewritten as
1
)1(
nqc
i
. (12)
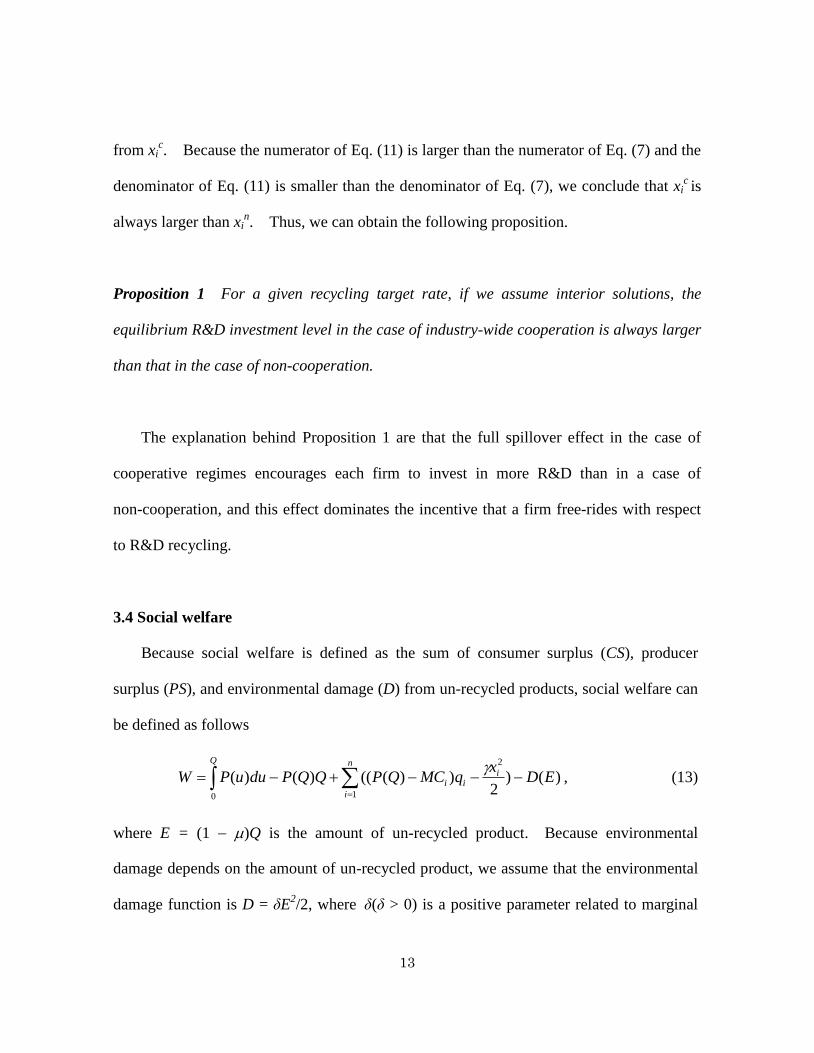
3.3 Comparison of the Equilibrium R&D Level
We compare the equilibrium R&D investment level between xic and xi
n by subtraction xi
n
9 We assume that firm i’s profit function satisfies the second-order condition, i.e., 2n2
-b (1+n)2 < 0.
10 As stated in footnote 6, if we set =1, wv=0, and n=2, Eq. (11) corresponds with the cooperative solution
x̂ , as shown in the study by d’Aspremont and Jacquemin (1988, p.1134).
13
from xic. Because the numerator of Eq. (11) is larger than the numerator of Eq. (7) and the
denominator of Eq. (11) is smaller than the denominator of Eq. (7), we conclude that xic is
always larger than xin. Thus, we can obtain the following proposition.
Proposition 1 For a given recycling target rate, if we assume interior solutions, the
equilibrium R&D investment level in the case of industry-wide cooperation is always larger
than that in the case of non-cooperation.
The explanation behind Proposition 1 are that the full spillover effect in the case of
cooperative regimes encourages each firm to invest in more R&D than in a case of
non-cooperation, and this effect dominates the incentive that a firm free-rides with respect
to R&D recycling.
3.4 Social welfare
Because social welfare is defined as the sum of consumer surplus (CS), producer
surplus (PS), and environmental damage (D) from un-recycled products, social welfare can
be defined as follows
)()2
))((()()(0 1
2
EDx
qMCQPQQPduuPW
Q n
i
iii
, (13)
where E = (1 )Q is the amount of un-recycled product. Because environmental
damage depends on the amount of un-recycled product, we assume that the environmental
damage function is D = δE2/2, where δ(δ > 0) is a positive parameter related to marginal
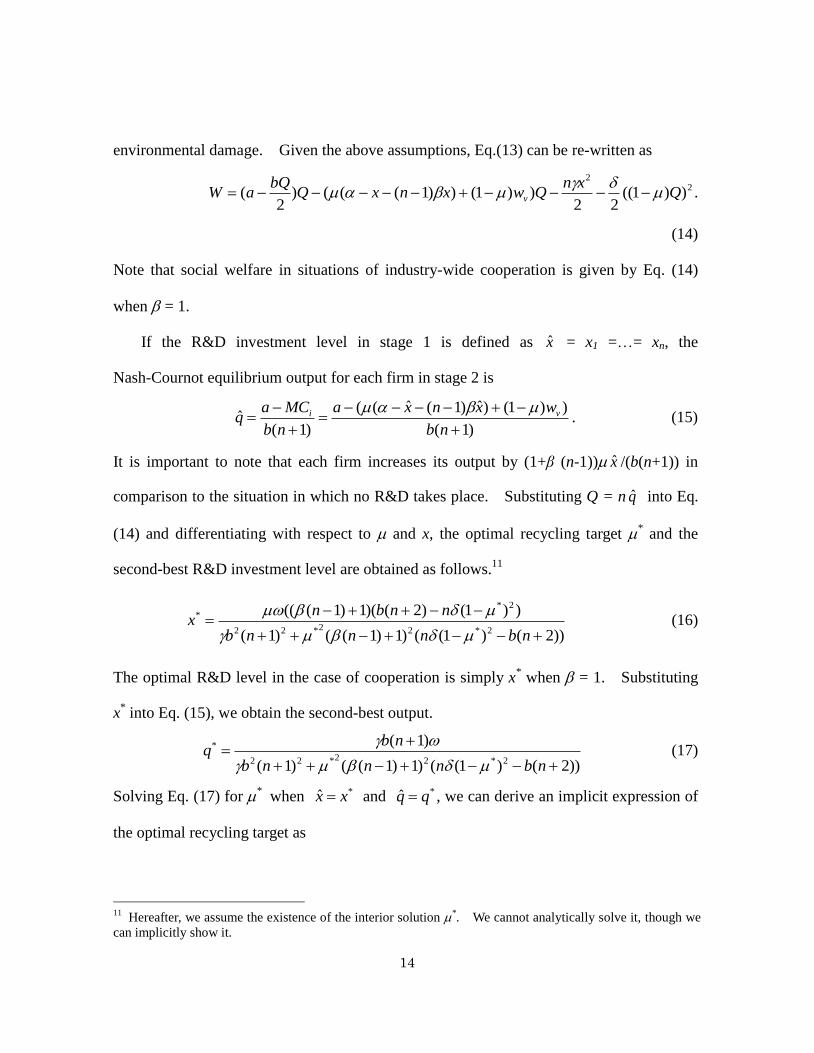
14
environmental damage. Given the above assumptions, Eq.(13) can be re-written as
22
))1((22
))1())1((()2
( Qxn
QwxnxQbQ
aW v
.
(14)
Note that social welfare in situations of industry-wide cooperation is given by Eq. (14)
when = 1.
If the R&D investment level in stage 1 is defined as x̂ = x1 =…= xn, the
Nash-Cournot equilibrium output for each firm in stage 2 is
)1(
))1()ˆ)1(ˆ((
)1(ˆ
nb
wxnxa
nb
MCaq vi
. (15)
It is important to note that each firm increases its output by (1+β (n-1)) x̂ /(b(n+1)) in
comparison to the situation in which no R&D takes place. Substituting Q = n q̂ into Eq.
(14) and differentiating with respect to and x, the optimal recycling target * and the
second-best R&D investment level are obtained as follows.11
))2()1(()1)1(()1(
))1()2()(1)1(((
2*22*22
2**
nbnnnb
nnbnx
(16)
The optimal R&D level in the case of cooperation is simply x* when = 1. Substituting
x* into Eq. (15), we obtain the second-best output.
))2()1(()1)1(()1(
)1(
2*22*22
*
nbnnnb
nbq
(17)
Solving Eq. (17) for * when *ˆ xx and *ˆ qq , we can derive an implicit expression of
the optimal recycling target as
11
Hereafter, we assume the existence of the interior solution *. We cannot analytically solve it, though we
can implicitly show it.
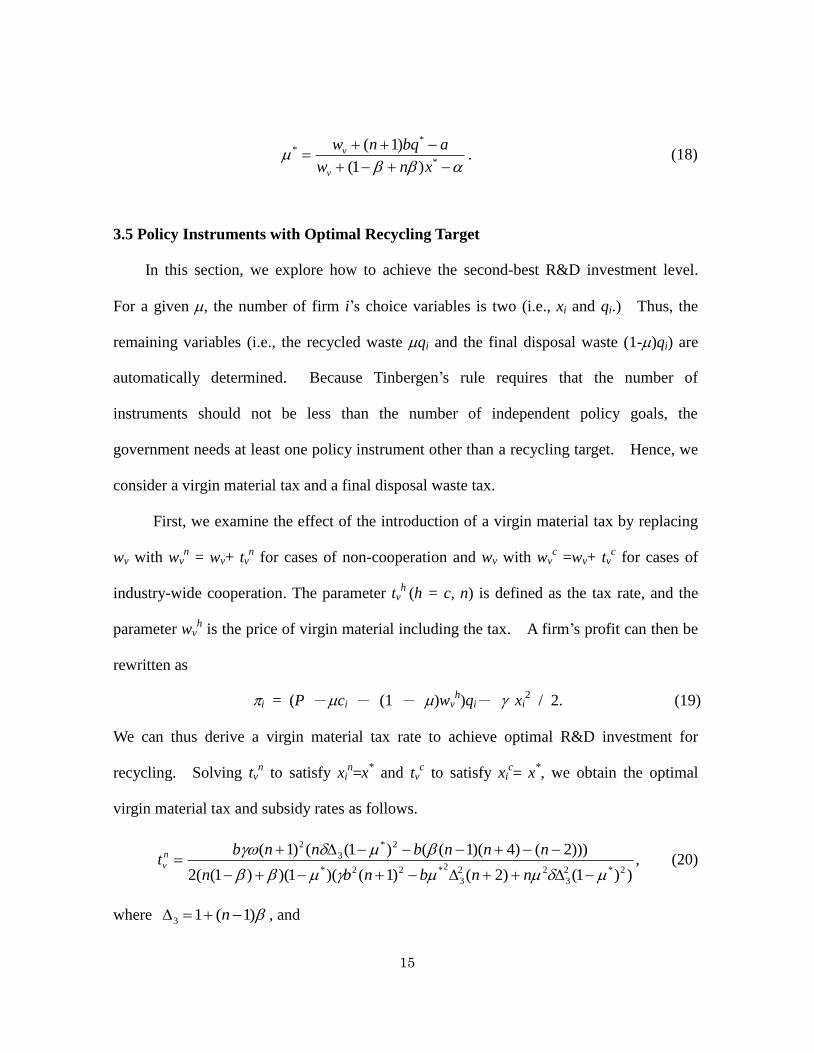
15
*
**
)1(
)1(
xnw
abqnw
v
v . (18)
3.5 Policy Instruments with Optimal Recycling Target
In this section, we explore how to achieve the second-best R&D investment level.
For a given , the number of firm i’s choice variables is two (i.e., xi and qi.) Thus, the
remaining variables (i.e., the recycled waste qi and the final disposal waste (1-)qi) are
automatically determined. Because Tinbergen’s rule requires that the number of
instruments should not be less than the number of independent policy goals, the
government needs at least one policy instrument other than a recycling target. Hence, we
consider a virgin material tax and a final disposal waste tax.
First, we examine the effect of the introduction of a virgin material tax by replacing
wv with wvn = wv+ tv
n for cases of non-cooperation and wv with wv
c =wv+ tv
c for cases of
industry-wide cooperation. The parameter tvh
(h = c, n) is defined as the tax rate, and the
parameter wvh is the price of virgin material including the tax. A firm’s profit can then be
rewritten as
i = (P -ci - (1 - )wvh)qi- xi
2 / 2. (19)
We can thus derive a virgin material tax rate to achieve optimal R&D investment for
recycling. Solving tvn to satisfy xi
n=x
* and tv
c to satisfy xi
c= x
*, we obtain the optimal
virgin material tax and subsidy rates as follows.
))1()2()1()(1)()1((2
)))2()4)(1(()1(()1(
2*2
3
22
3
2*22*
2*
3
2
nnbnbn
nnnbnnbt n
v , (20)
where )1(13 n , and
16
))1()2()1()(1(2
))1(()1(
2*2*32*222*
2*2
nnbnnb
bnbnt c
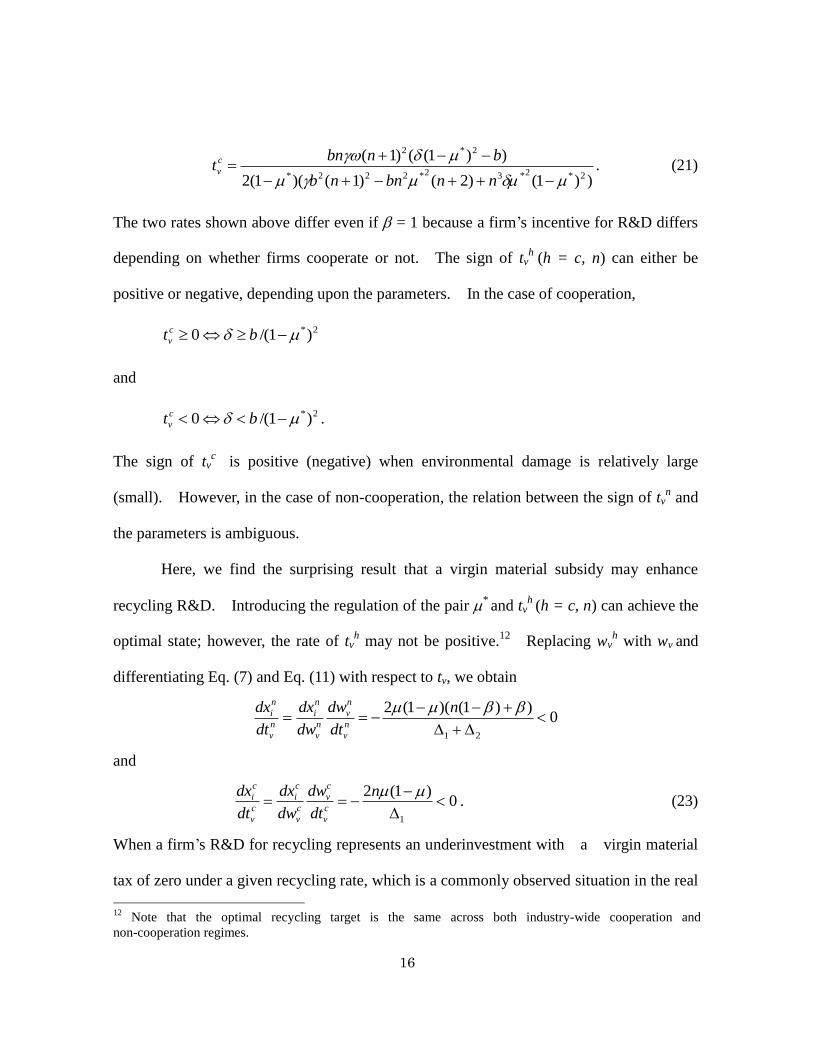
v . (21)
The two rates shown above differ even if = 1 because a firm’s incentive for R&D differs
depending on whether firms cooperate or not. The sign of tvh
(h = c, n) can either be
positive or negative, depending upon the parameters. In the case of cooperation,
2*)1/(0 bt c
v
and
2*)1/(0 bt c
v .
The sign of tvc
is positive (negative) when environmental damage is relatively large
(small). However, in the case of non-cooperation, the relation between the sign of tvn and
the parameters is ambiguous.
Here, we find the surprising result that a virgin material subsidy may enhance
recycling R&D. Introducing the regulation of the pair * and tv
h (h = c, n) can achieve the
optimal state; however, the rate of tvh may not be positive.
12 Replacing wv
h with wv and
differentiating Eq. (7) and Eq. (11) with respect to tv, we obtain
0))1()(1(2
21
n
dt
dw
dw
dx
dt
dxn
v
n
v
n
v
n
i
n
v
n
i
and
0)1(2
1
n
dt
dw
dw
dx
dt
dxc
v
c
v
c
v
c
i
c
v
c
i . (23)
When a firm’s R&D for recycling represents an underinvestment with a virgin material
tax of zero under a given recycling rate, which is a commonly observed situation in the real
12
Note that the optimal recycling target is the same across both industry-wide cooperation and
non-cooperation regimes.
17
world, a positive virgin material tax discourages recycling R&D investment. Therefore,
we establish the following proposition, which concentrates on a counterintuitive result
under the second-best recycling rate.
Proposition 2 Suppose that xic < x
c* (xi
n < x
n*) for each i under = *
. In this case, the
optimal virgin material tax rate tvc (tv
n) is negative. In other words, governments should
not introduce a virgin material tax but rather a subsidy to achieve the optimal state.
It is well known that if the government levies a virgin material tax in a perfect competition
market, it will decrease the amount of virgin material used and increase the amount of
recycled material used (Walls and Palmer, 2001). Proposition 2 states the opposite result
in an oligopoly context. A high virgin material tax rate actually discourages
environmental R&D investment under both cooperative and non-cooperative strategies
when R&D levels are smaller than optimal; this is the normal situation. This implies that
if the government levies a positive virgin material tax, then firms will reduce their R&D
investment level. The reason for this is that a positive virgin material tax increases a
firm’s marginal production cost. However, a higher marginal production cost results in a
reduction in the firm’s output. In turn, this decrease in output leads to a decrease in the
amount of recycling. It dampens a firm’s incentive to invest in R&D aimed at reducing
the marginal cost of recycling.
We also consider a final disposal tax. Suppose that firms face a waste disposal tax
rate teh, with h = c, n, per unit of final waste. For this purpose, we examine the effect of
18
the introduction of a waste disposal tax by replacing wv with wen = wv+ te
n for cases of
non-cooperation and wv with wec =wv+ te
c for cases of industry-wide cooperation. Then a
firm’s profit can be re-written as
i = (P -ci - (1 - )weh)qi- xi
2 / 2. (24)
The only difference between Eqs. (19) and (24) is the replacement of virgin material price,
including the tax/subsidy wwh with we
h, which represents the virgin material price plus the
disposal tax. In our steady state assumption, wwh
and weh have the same effect on a firm’s
profit. Solving xin
= x* and xi
c = x
* for te
n and te
c, respectively, we obtain the optimal
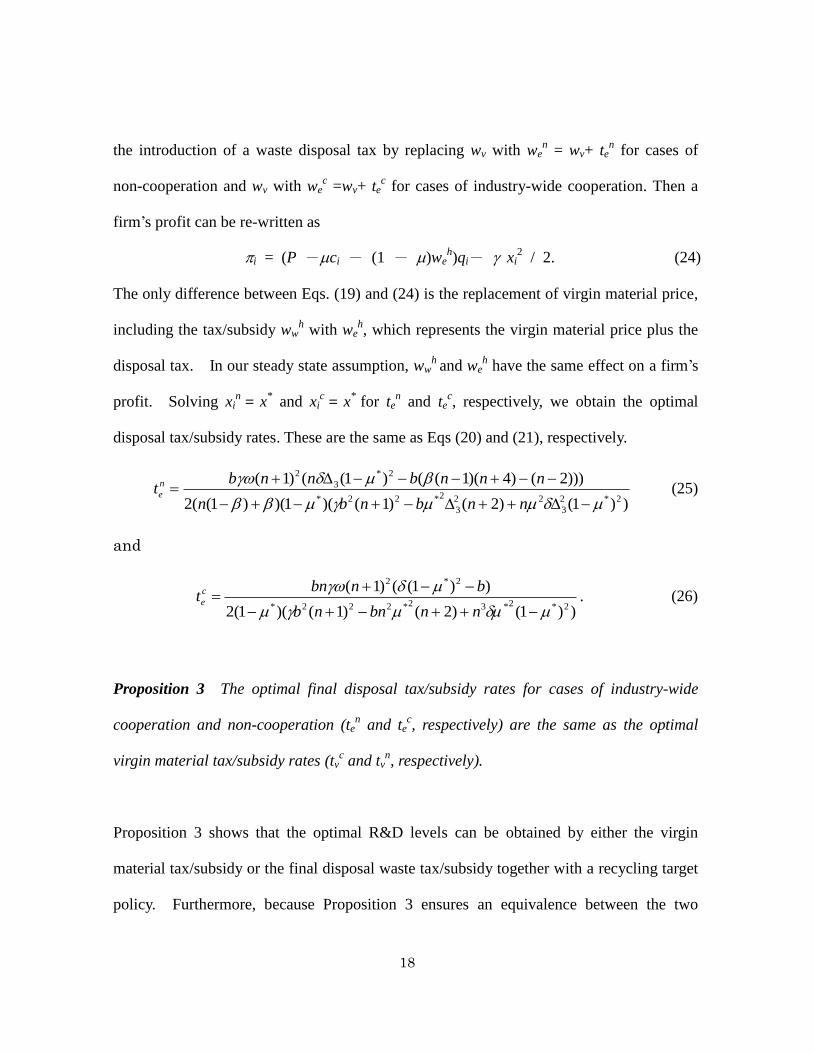
disposal tax/subsidy rates. These are the same as Eqs (20) and (21), respectively.
))1()2()1()(1)()1((2
)))2()4)(1(()1(()1(
2*2
3
22
3
2*22*
2*
3
2
nnbnbn
nnnbnnbt n
e (25)
and
))1()2()1()(1(2
))1(()1(
2*2*32*222*
2*2
nnbnnb
bnbnt c
e . (26)
Proposition 3 The optimal final disposal tax/subsidy rates for cases of industry-wide
cooperation and non-cooperation (ten and te
c, respectively) are the same as the optimal
virgin material tax/subsidy rates (tvc and tv
n, respectively).
Proposition 3 shows that the optimal R&D levels can be obtained by either the virgin
material tax/subsidy or the final disposal waste tax/subsidy together with a recycling target
policy. Furthermore, because Proposition 3 ensures an equivalence between the two
19
policy instruments, the following counterintuitive result holds.
Corollary Suppose that xic < x
c* (xi
n < x
n*)for each i under = *
. In this case, the
optimal final disposal waste tax rate tvc (tv
n) is negative. In other words, the governments
should not introduce a waste tax but rather a subsidy to achieve the optimal state.
3.6 The case of within-group cooperation
In this section, we consider the case of within-group cooperation, which describes a joint
PRO by several firms in the EU and the current Japanese recycling scheme. In this case,
we assume that firms are divided into two groups, namely, group A and group B. Group A
consists of firm 1 to m. Group B consists of firm m+1 to n. If firm i and firm j belong to
the same group, then firm i’s R&D investment level xi will reduce firm j’s marginal
recycling cost by xi. In other words, if two firms are in the same group, then the spillover
effect in the same group is equal to unity. This is because firms in the same group use the
same collecting sites and recycling plants. In contrast, if two firms belong to different
groups, then firm i’s R&D investment level xi will reduce firm j’s marginal recycling cost
by βxi. In other words, the inter-group spillover effect is . In summary, if firm i
belongs to group K, with K=A, B, then the marginal recycling cost of firm i is ci = xi
ijKj
jx Kj
jx .
To avoid complexity, we only show the equilibrium R&D investment level in the
second stage with respect to a typical case in which the two groups consist of the same
number of firms (m = n/2).
20
)2)1()(1()1(4
)2)1((2222
nnnb
nnx g
i (27)
We can solve to obtain the second-best R&D level and policy instrument for the case of
within-group cooperation. However, to avoid unnecessary complexity, we omit this
calculation here13
.
4 Social Welfare Comparison
We employ a numerical analysis in this section because it is difficult to obtain a reduced
form of the optimal recycling target rate. Introducing suitable policy instruments, such as
a virgin material tax/subsidy or a final disposal waste tax/subsidy together with recycling
target as denoted in the previous section, the second-best level of social welfare can be
attained in each case. Accordingly, we compare second-best welfare levels in the case of
industry-wide cooperation, within-group cooperation, and non-cooperation, and we
consider the effect of varying group size in the case of within-group cooperation. Here
we let a = = 100, b = wv =1, = 10, δ = 5, n = 10 and m = 5. The numbers of
parameters are not randomly selected but rather are chosen to emphasize the difference in
the three kinds of R&D investment level.
[Insert Figure 1 here]
[Insert Figure 2 here]
13
The authors can provide detailed results upon request.
21
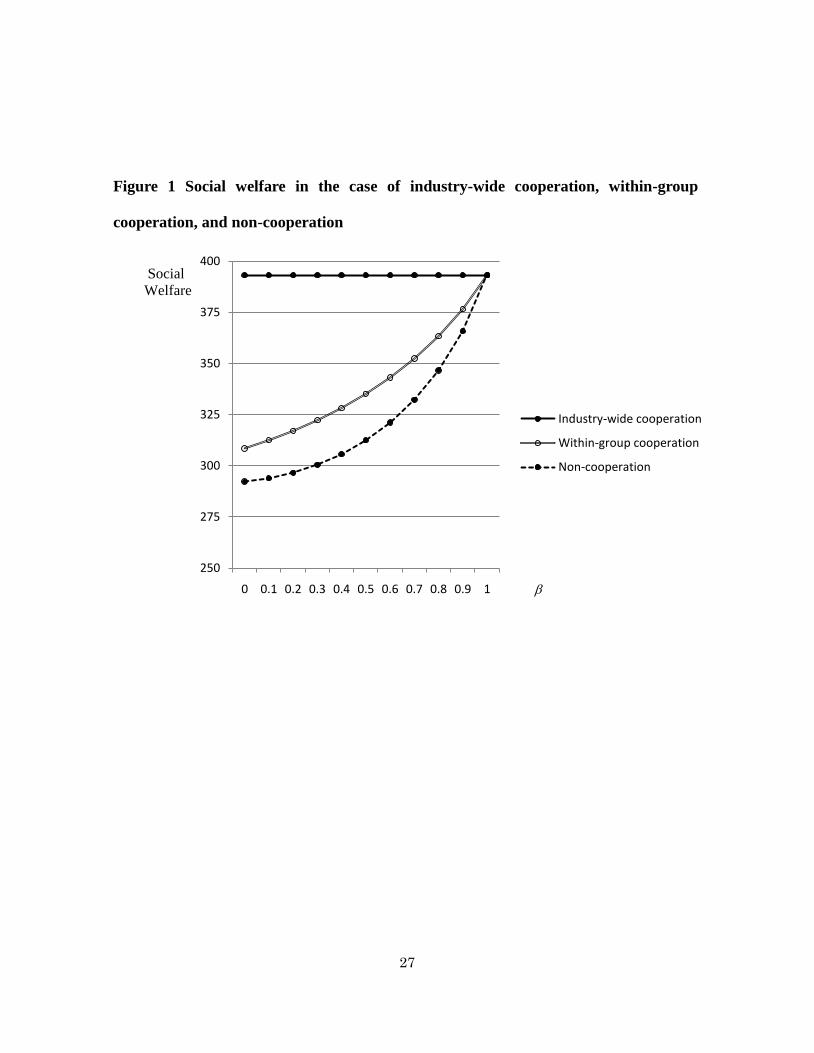
As Figure 1 shows, the level of welfare in the case of industry-wide cooperation is constant
for and is always larger than the level of welfare in the case of both within-group
cooperation and non-cooperation, except = 1 where the welfare levels of all cases
coincide. An increase in the spillover rate induces two opposite effects. One has a
negative impact on R&D efforts because the benefit of free-riding on the R&D effort of
other firms becomes more attractive. The other is positive because a higher spillover rate
reduces the marginal recycling cost for firms; in turn, this leads to a larger output and
larger recycling R&D effort. In the case of both within-group cooperation and
non-cooperation, the latter effect dominates the former at equilibrium.
Figure 1 shows that the two-group regime is inferior in terms of welfare to the
industry-wide cooperation regime. This suggests that the current Japanese recycling
system, under which firms are divided into two groups, should be changed to an
industry-wide cooperation system.
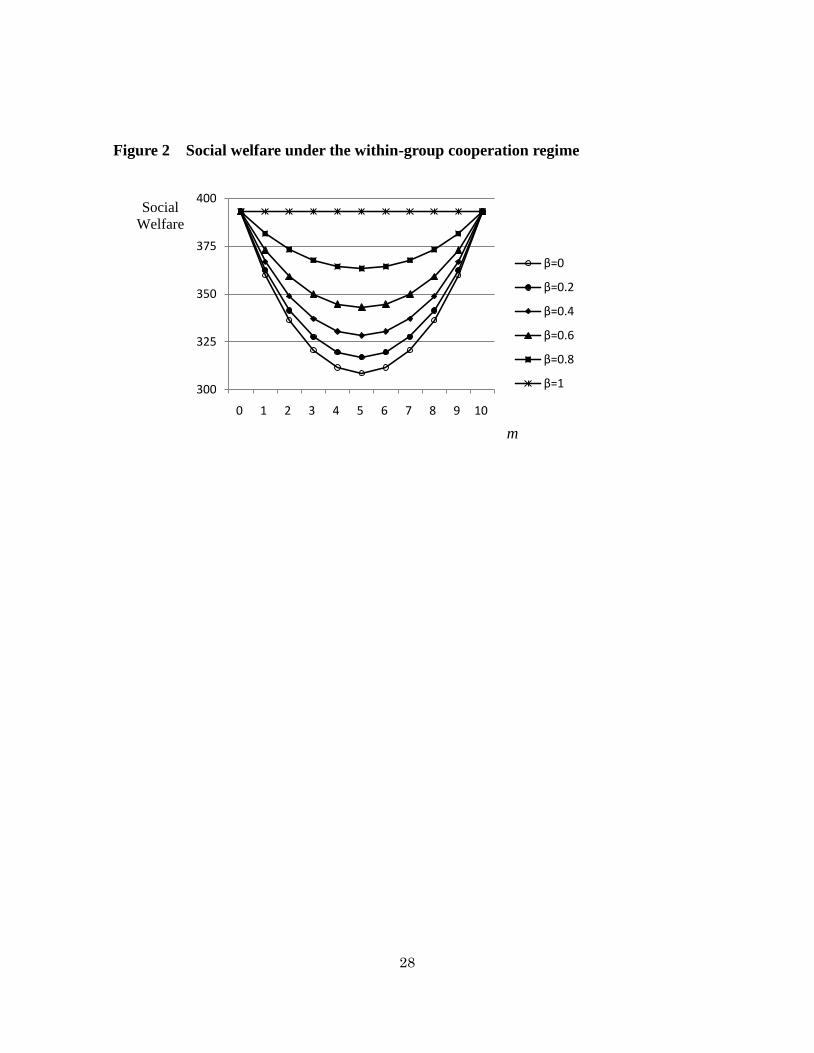
Until now, we have only considered a symmetric two-group case under within-group
cooperation. Now, we examine what happens if the size of each group changes. Figure
2 shows the welfare levels for various spillover rates when the size of a group changes.
Here we assume that the total number of firms between the two groups is fixed to ten, and
we only change the number of firms in one group m. Obviously, once the value of m is
determined, the number of firms in the other group size is automatically determined.
When m = 0 or m = 10, the within-group cooperation regime reduces to the industry-wide
cooperation regime. Figure 2 reveals a counterintuitive result in which the symmetric
22
two-group case induces the lowest level of welfare. In other words, the level of welfare
is concave with respect to group size. The more group size grows, the higher is the
number of firms that benefit from full spillover with others in the same group. This
reduces the marginal recycling cost and increases the production of each firm in the group.
This is the reason why a more asymmetric group division leads to more welfare. This is
similar to a phenomenon in which an unequal treatment of homogeneous firms within a
oligopoly market generates an aggregate cost-saving effect. This was originally
described by Bergstrom and Varian (1985a, 1985b) and was extended by Salant and
Shaffer (1999), Amir and Nannerup (2004), and Honma (2009). To summarize the
results shown in Figure 2, splitting groups into roughly equal sizes deteriorates social
welfare through the effect described above that is specific to oligopolies. Thus, the
government should encourage an industry-wide cooperation recycling regime.
5 Concluding Remarks
We have developed a general theoretical model that describes production and recycling in
an n-firm oligopoly market in which firms can cooperate for recycling. We have shown
that both a virgin material tax and a final disposal tax harms a firm’s R&D effort with
respect to recycling under normal parameter ranges, regardless of whether R&D
cooperation takes place. Furthermore, using numerical simulations, we have compared
levels of social welfare under three recycling regimes, including industry-wide cooperation,
within-group cooperation, and non-cooperation. The comparison has demonstrated the
23
superiority of the industry-wide cooperation scenario. It has shown that the symmetric
division of firms induces the lowest welfare for all spillover parameter ranges under
within-group cooperation. The results of the numerical simulation strongly support that
industry-wide cooperation should be adopted as a country-level recycling regime.
This study suggests two lines of further research. First, post-consumer home
appliances in developed countries, such as EU and Japan, are not only recycled
within-country, but they are also exported to developing countries as second-hand products
or recyclable resources. For simplicity, we focused only on domestic recycling in the
present model. Incorporating the international trade of recyclable resources into the
model could provide useful insights into cross-border recycling between developed and
developing countries. Second, the concept of within-group cooperation presented in this
paper can be extended to other environmental economic models, such as pollution
emissions reduction and energy-saving models. Furthermore, various forms of
cooperation can also be considered. Under our assumption of within-group cooperation,
firms were divided into two groups. However, there are many possible situations in
which three or more groups (i.e., coalitions) cooperatively undertake environmental R&D
within each group. The remaining firms outside of these groups would then
non-cooperatively and independently undertake R&D activity. It would be interesting to
explore how the co-existence of cooperation and noncooperation as well as the spillover
effects among groups and firms affect social welfare and environmental damage.
24
Acknowledgements
The authors thank Takayoshi Shinkuma, Hideo Koide, and the seminar participants in the
Annual Meeting of the Japanese Economic Association and the Society for Environmental
Economics and Policy Studies.
References
Amir, R. and Nannerup, N., 2005. “Asymmetric Regulation of Identical Polluters in
Oligopoly Models.” Environmental and Resource Economics 30(1):35-48.
d’Aspremont, C. and Jacquemin, A., 1988. “Cooperative and Non-cooperative R&D in
Duopoly with Spillovers,” American Economic Review 78 (5): 1133-1137.
Bergstrom, T. C. and Varian, H. R., 1985a. “Two Remarks on Cournot Equilibria.”
Economics Letters 19(1): 5-8.
Bergstrom, T. C. and Varian, H. R., 1985b. “When are Nash Equilibria Independent of the
Distribution of Agents’ Characteristics?” Review of Economic Studies 52(4): 715-718.
Chiou, J.R. and Hu, J.L., 2001. “Environmental Research Joint Ventures under Emission
Taxes,” Environmental and Resource Economics, 20(2): 129-146.
Fleckinger, P. and Glachant, M., 2010. “The Organization of Extended Producer
Responsibility in Waste Policy with Product Differentiation,” Journal of Environmental
Economics and Management, 59(1): 57-66.
Higashida, K. and Jinji, N., 2006. “Strategic Use of Recycled Content Standards under
25
International duopoly,” Journal of Environmental Economics and Management, 51(2):
242-257.
Honma, S., 2009. “Pollution Tax and Social Welfare in an Oligopoly: Asymmetric
Taxation of Homogeneous Polluters,” Agricultural and Resources Economics,
6(1): .47-68.
Hosoda, E. 2008. Resource recycling society (Shigen Junkangata Shakai), Keio Gijuku
University (in Japanese).
Katsoulacos, Y. and Xepapadeas, A. 1996. Environmental Innovation, Spillover and
Optimal Policy Rule, in Carraro, C., Katsouslacos, Y. and Xepapadeas, A.ed.,
Environmental Policy and Market Structure, Kluwer Academic Publishers, Dordrecht:
Chapter 8.
Koide, H. 2008. Resource Circulation Economy and Internalization of Externalities
(Shigen Junkan Keizai to Gaibusei no Naibuka, in Japanese), Keiso Shobo, Tokyo.
Leahy, D., Neary, P. 1997. “Public Policy towards R&D in Oligopolistic Industries,”
American Economic Review, 87(4): 642-662.
Poyago-Theotoky, J.A. 1995. “Equilibrium and Optimal Size of a Research Joint Venture
in an Oligopoly with Spillovers,” Journal of Industrial Economics, 43(2), 209-226.
Poyago-Theotoky, J.A. 2007, “The organization of R&D and environmental policy,”
Journal of Economic Behavior & Organization, 62(1): 63-75.
Salant, S. W. and Shaffer, G.E., 1999. “Unequal Treatment of Identical Agents in Cournot
Equilibrium.” American Economic Review, 89(3): 585-604.
Shinkuma, T. 2007. “Reconsideration of an advance disposal fee policy for end-of-life
26
durable goods,” Journal of Environmental Economics and Management, 53(1):
110-121.
Suzumura, K. 1992. “Cooperative and Non-cooperative R&D in Oligopoly with
Spillovers,” American Economic Review, 82(5): 1307-1320.
Walls, M. and Palmer, K. 2001. “Upstream Pollution, Downstream Waste Disposal and
the Design of Comprehensive Environmental Policies,” Journal of Environmental
Economics and Management, 41(1): 94-108.
27
Figure 1 Social welfare in the case of industry-wide cooperation, within-group
cooperation, and non-cooperation
250
275
300
325
350
375
400
0 0.1 0.2 0.3 0.4 0.5 0.6 0.7 0.8 0.9 1
Social
Welfare
Industry-wide cooperation
Within-group cooperation
Non-cooperation
28
Figure 2 Social welfare under the within-group cooperation regime
300
325
350
375
400
0 1 2 3 4 5 6 7 8 9 10
Social
Welfare
m
β=0
β=0.2
β=0.4
β=0.6
β=0.8
β=1