discussion paper no. 01/2005 outreach of credit institutes
TRANSCRIPT
Discussion Paper No. 01/2005
Outreach of credit institutes and households'
access constraints to formal credit in
Northern Vietnam
Thomas Dufhues and Gertrud Buchenrieder
Department of Agricultural Development Theory and Policy
Forschung zur Entwicklungsökonomie und -politik Research in Development Economics and Policy
Universität Hohenheim - Tropenzentrum Institut für Agrar- und Sozialökonomie in den Tropen und Subtropen University of Hohenheim – Centre for Agriculture in the Tropics and Subtropics Institute of Agricultural Economics and Social Sciences in the Tropics and Subtropics
Thomas Dufhues and Gertrud Buchenrieder: Outreach of credit institutes and households' access constraints to formal credit in Northern Vietnam.
Institute of Agricultural Economics and Social Sciences in the Tropics and Subtropics (Ed.), Forschung zur Entwicklungsökonomie und -politik – Research in Development Economics and Policy, Discussion Paper No. 01/2005.
ISSN 1439-4952
2005 Institut für Agrar- und Sozialökonomie in den Tropen und Subtropen Universität Hohenheim (490), 70593 Stuttgart, Germany E-mail: [email protected]
All rights reserved.
Printed in Germany. Druck: F. u. T. Müllerbader GmbH Forststr. 18, 70794 Filderstadt, Germany
VERLAG ULRICH E. GRAUER Linsenhofer Str. 44, 72660 Beuren, Germany Tel.: +49 (0)7025 842140, Fax: +49 (0)7025 842499 Internet: http://www.grauer.de/, E-mail: [email protected]
Centre for Agriculture in the Tropics and Subtropics Institute of Agricultural Economics and Social Sciences in the Tropics and Subtropics
• Department of Agricultural Development Theory and Policy (490a) • Department of International Agricultural Trade and Food Security
(490b) • Department of Farming and Rural Systems (490c) • Josef G. Knoll-Visiting Professorship for Development Studies
Discussion papers in this series are intended to stimulate discussion among researchers, practitioners and policy-makers. The papers mostly reflect work in progress. This paper has been reviewed by Prof. Dr. Dr. h.c. Franz Heidhues, University of Hohenheim, Prof. Dr. Manfred Zeller, University of Göttingen and Dr. Daniel Müller, Humboldt University Berlin. We gratefully acknowledge contributions from the Father and Son Eiselen Foundation, Ulm, towards the printing costs.
i
Table of Contents 1 Introduction....................................................................................................................... 1 2 Methodology and data ...................................................................................................... 3
2.1 Access constraints to formal rural credit - the conceptual framework....................... 3 2.2 Measuring outreach and access: econometric models................................................ 5 2.3 Regional focus and sampling procedures................................................................. 10
3 Outreach of and access to formal rural lenders in Vietnam............................................ 12 3.1 Collateral use............................................................................................................ 12 3.2 Effective formal credit demand................................................................................ 14 3.3 Credit outreach ......................................................................................................... 17 3.4 Credit-constrained households ................................................................................. 20
4 Conclusions and policy recommendations ..................................................................... 25 References ................................................................................................................................ 28 Annex ....................................................................................................................................... 31
List of Tables Table 1 Variables for the binary logistic regression model on credit access ....................... 8 Table 2 Research areas and sample composition ............................................................... 11 Table 3 Depth of outreach of formal lender clients............................................................ 18 Table 4 Outreach of formal credit by poverty group.......................................................... 19 Table 5 Parameters influencing households’ access to formal credit - binary logit
estimation .............................................................................................................. 21 Table 6 Classification of correctly predicted access to formal credit-constrained
households ............................................................................................................. 22 Table 7 Descriptive statistics of the independent variables for the binary logistic
regression model on credit access ......................................................................... 31
List of Figures Figure 1 Conceptual framework - the capital-collateral system............................................ 4 Figure 2 Percentage of households using different credit sectors ....................................... 15 Figure 3 Access-constrained households (formal financial sector) ..................................... 15 Figure 4 Interest rates per month of formal and informal credits ........................................ 16 Figure 5 Formal and informal credit terms.......................................................................... 16 Figure 6 Loan size of formal and informal credits in VND millions .................................. 17 Figure 7 Loan term of formal credits in years ..................................................................... 20 Figure 8 Loan amount of formal credits .............................................................................. 20 Figure 9 Decision tree of the effective credit demand in the formal sector......................... 32 Figure 10 Principal Component Indicators............................................................................ 32
ii
Abstract Most policy and research interest regarding rural credit markets revolves around the
perception that poor households in developing countries lack access to credit, which is
believed to have negative consequences for household welfare. An important feature of the
rural credit market is that access to credit is easier for some groups than for others. The
Vietnamese government supplied credit on preferential terms, particularly to rural households,
through state-owned financial intermediaries. The share of the informal sector was thus
considerably reduced from 78% (1992/93) of all outstanding loans to 54% (1997/98) in favor
of the formal sector. However, there is evidence from other developing countries that credit
constraints persist despite the expansion of rural finance. Hulme and Mosley (1996) state that
there is increasing evidence that the poorest 20% of the population are excluded from rural
credit programs. Thus, even in Vietnam the question remains: did the Vietnamese government
succeed in reaching the poor, or do groups of people exist who are still access-constrained?
Quantitative (N=260) and qualitative data collection took place between March 2000 and
2001. The quantitative data comprise cross-sectional household-level data from two different
districts in Northern Vietnam. The poverty outreach of formal rural lenders was analyzed
using Principal Component Analysis, while access to formal credit was investigated using a
binary logit analysis. The poverty outreach of the formal lenders is quite satisfactory since
about 50% of all predominantly poor rural households have access to formal credit. However,
the poorest households are seldom clients of formal lenders. Yet, it is not their extreme
general poverty that determines their access to formal credit. The results indicate that only
certain aspects of poverty, e.g. low quality of housing, have an important influence on access
to formal credit in Vietnam. The poorest households simply have much less demand for
formal credit. Offering new credit products would only slightly improve the credit coverage
of poorer households. More promising would be a specialized pro-poor extension service to
widen the scope of their investment ideas and possibilities, combined with general
improvement of the infrastructure. All in all, the most appropriate tool to incorporate poorer
households into the formal financial system would be mobilization of savings. Nevertheless,
the number of access-constrained households is surprisingly low. One reason for the low
number is the weakening or eradication of former access constraints. Some access barriers do
still exist, e.g. towards ethnic minorities or female-led households. To reduce these access
barriers, the actions to be taken should be catering to the specific needs and the circumstances
of those households that lack access.
1
Outreach of credit institutes and households' access constraints to formal credit in Northern Vietnam
Thomas Dufhues, Gertrud Buchenrieder
1 Introduction1 Most policy and research interest regarding rural credit markets revolves around the
perception that poor households in developing countries lack adequate access to credit, which
is believed to have significant negative consequences for various household-level outcomes.
During the past 40 years, most developing countries and donors have set up credit programs
aiming at improving rural households’ access to credit. The vast majority of these programs,
especially the so-called ‘agricultural development banks’, have failed both to achieve their
objectives to serve the poor and to be financially sustainable institutions. An important feature
of the rural credit market is that access to credit is far easier for some groups than for others.
Meanwhile, most rural households in developing countries continue to rely on the informal
market for their inter-temporal transfer of resources. Therefore, outreach of the financial
institution and access to financial services have become a major issue in microfinance, and
particularly in rural finance (Diagne et al. 2000, Sarap 1990).2
Formal rural credit is considered by Vietnamese government agencies to be a powerful tool
for poverty reduction (Sida-MARD 1998). During the early 1990s, informal credit accounted
for almost 80% of total outstanding loans in Vietnam (GSO 1995). The Vietnamese
government tried to break the dominance of the informal sector and push development by
supplying credit on preferential terms, particularly to rural households. The preferential credit
was delivered mainly by state-owned financial intermediaries such as the Vietnam Bank for
Agriculture and Rural Development (VBARD), the Vietnam Bank for the Poor (VBP) and the
People’s Credit Funds (PCFs).3 In addition, the State Treasury implemented special sector
1 The research for this paper was carried out within the framework of the German-Thai-Vietnamese Collaborative Research Program ‘Sustainable Land Use and Rural Development in Mountainous Regions of Southeast Asia’ also known as Uplands Program. The funding from the Deutsche Forschungsgemeinschaft (DFG) and the co-funding from the Ministry of Science, Technology, and Environment of Vietnam is gratefully acknowledged. 2 The performance of financial intermediaries in terms of breadth and depth of poverty outreach is partly a function of a range of internal factors such as the type of services provided, the use of screening methods to identify the poor, the financial scope of the program, and the marketing strategy of the program (Zeller et al. 2003). Although there are more dimensions than depth and breadth of outreach (for a detailed overview see Navajas et al. (2000) and Schreiner (2002)), this research will focus mainly on depth and breadth of outreach. Since society places more weight on the poor than on the rich, poverty is a good proxy for depth (Navajas et al. 2000). The poorer the clients reached by the financial institute, the deeper the outreach (Zeller et al. 2003). 3 On March 11, 2003, the VBP and the PCFs were replaced by the Vietnam Bank for Social Policies (VBSP) (Vietnam Economy 2003, World Bank 2003).
2
credit programs, e.g. the 120 Program to promote employment (Dufhues et al. 2004a). Initial
signs of success of formal credit outreach were reported by the Vietnamese Living Standard
Surveys, which stated that the share of the informal sector had been considerably reduced
from 78% (1992/93) of all outstanding loans to 54% (1997/98) in favor to the formal sector
(GSO 1995, GSO 2000). There is evidence from other developing countries that credit
constraints persist despite the expansion of microfinance. For instance, Amin et al. (2003)
find that microfinance institutes (MFIs) in Bangladesh do not really reach those who are
credit-constrained. Recent research suggest that, in Vietnam, the success of pro-poor policies
will depend on easing structural constraints such as access to credit (Glewwe et al. 2002,
Livingstone 2000). However, deeper outreach usually increases not only social value but also
social cost. As income and wealth decrease, it becomes more costly to a lender to judge the
risk of a loan. This happens because, compared with the rich, the poor are more
heterogeneous and less able to signal their ability and willingness to repay (Conning 1999).
Moreover, the provision of income-generating credit leads to a bias in favor of the less poor,
because they have better opportunities to use the loan profitably (Hulme and Mosley 1996).
While modern microcredit programs are definitely more successful at reaching the poor than
their predecessors, they are less successful at reaching the vulnerable poor.4 Hulme and
Mosley (1996) state that there is increasing evidence that the poorest 20% of the population
are effectively excluded from microcredit programs.
While the Vietnamese government has so far failed to create sustainable rural financial
institutions, it has succeeded in providing a huge share of the population with formal credit.
However, despite the immense formal outreach, the distribution of formal credit in the
northern provinces of Vietnam is very heterogeneous. In some villages, over 90% of
households are served by formal credit, while in others just a few or none at all (Dufhues et al.
2002). The question thus remains: did the Vietnamese Government succeed in reaching the
poor, or do groups of people still exist who are access-constrained?
The second section describes the conceptual framework, the analytical methods used and the
sample composition. Section two starts with a discussion of collateral use in Vietnam and
then continues with a description of the effective credit demand of the sample households.
The last two chapters of this section discuss the outreach of rural lenders and access to formal
4 Even with the use of group lending schemes, which are believed to have a good poverty outreach, the evidence suggests that the poorest people are excluded (Montgomery 1996).
3
loans by the households in this sample. The paper concludes with policy recommendations for
improving outreach to access-constrained households.
2 Methodology and data The following section describes the conceptual framework, followed by a description of the
methodology used for the data analysis. Finally, the sample composition is presented.
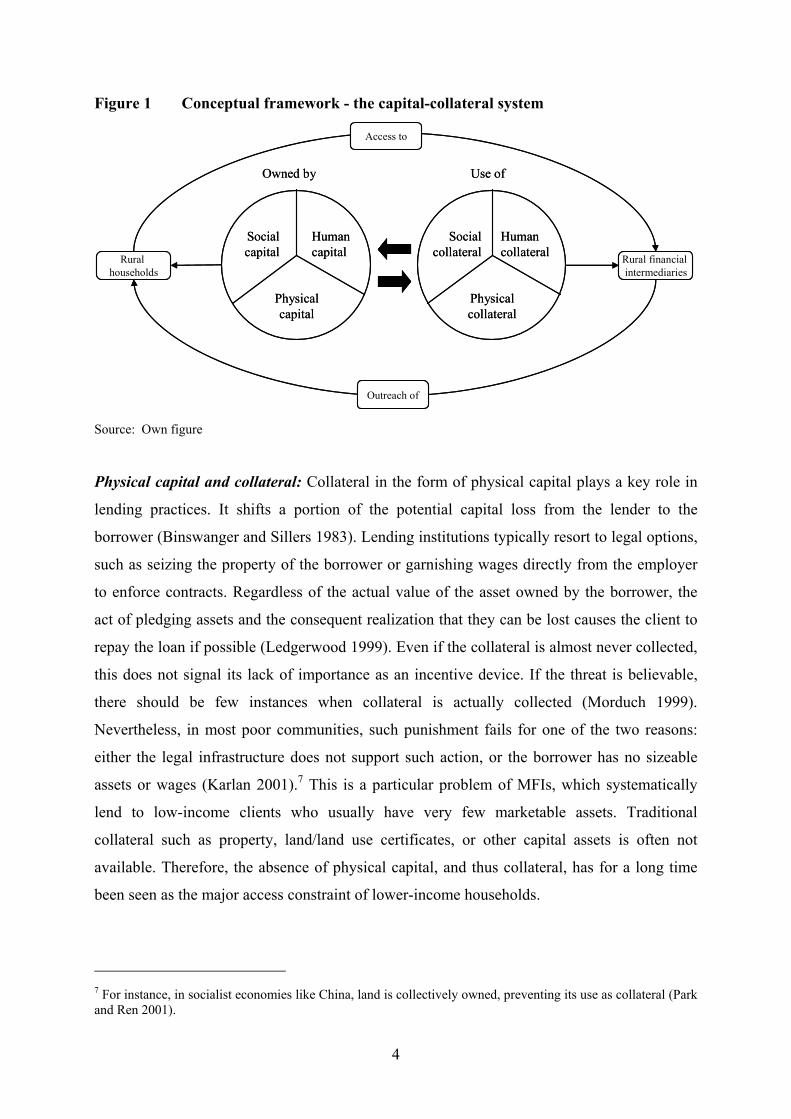
2.1 Access constraints to formal rural credit - the conceptual framework While the term outreach refers to the perspective of the financial intermediary and access
refers to the point of view of the household, they both relate to the same thing: who is getting
the credit (Vaessen 2001). Access constraints at the household level are mostly related to a
lack of collateral (physical, human and/or social capital).5 The capital endowment of a
household is of enormous importance for the household’s access to formal credit and to the
outreach of rural lenders. Capital can be classified into three different categories, physical,
human and social capital. The term physical capital refers to any non-human, infrastructural,
financial, or natural asset needed to support livelihoods. Human capital represents the skills,
knowledge, ability to labor and good health of individuals or households. Social capital is
defined here according to Coleman (1999), who states that social capital is not a single entity
but a variety of different entities, with two elements in common: they all consist of some
aspect of social structures, and they facilitate certain actions of individuals who are within the
structure. The characteristics of human and social capital are identified as ‘capital’ in order to
underline the need for continuous investment and to emphasize the importance of these
factors in generating future income, particularly for the poor.
Figure 1 shows the different kinds of capital/collateral. Different kinds of capital/collateral
can substitute each other, but only to a certain degree. Nevertheless, the capital endowment of
a household represents the basis for the collateral used by the lender. Informal lenders, for
instance, in the absence of physical collateral, have always used human and social collateral.
Formal lenders usually rely on physical collateral that can be easily sold, are not moveable,
are of sizeable value, and ideally carry a legal title, such as land and buildings.6
5 Access constraints can also be intermediary-based, in other words influenced for example by business policies or staff attitudes, hard and soft skills. A conceptual framework of client-related barriers versus program-related barriers is presented in Evans et al. (1999) and Vaessen (2001). However, this analysis focuses on the household level and rather neglects intermediary-based issues as they are reflected in the households’ access constraints. 6 Physical collateral has several functions, e.g. signaling credit worthiness. However its two main functions are: First, it insures the lenders’ loan portfolio in case of default by borrowers. Second, it represents an incentive, enhancing the borrower’s willingness to repay his loan (Bester 1987, Stiglitz and Weiss 1981).
4
Figure 1 Conceptual framework - the capital-collateral system
Rural households
Rural financial intermediaries
Outreach of
Access to
Socialcapital
Human capital
Physicalcapital
Socialcollateral
Human collateral
Physicalcollateral
Owned by Use of
Rural households
Rural financial intermediaries
Outreach of
Access to
Socialcapital
Human capital
Physicalcapital
Socialcollateral
Human collateral
Physicalcollateral
Owned by Use of
Source: Own figure
Physical capital and collateral: Collateral in the form of physical capital plays a key role in
lending practices. It shifts a portion of the potential capital loss from the lender to the
borrower (Binswanger and Sillers 1983). Lending institutions typically resort to legal options,
such as seizing the property of the borrower or garnishing wages directly from the employer
to enforce contracts. Regardless of the actual value of the asset owned by the borrower, the
act of pledging assets and the consequent realization that they can be lost causes the client to
repay the loan if possible (Ledgerwood 1999). Even if the collateral is almost never collected,
this does not signal its lack of importance as an incentive device. If the threat is believable,
there should be few instances when collateral is actually collected (Morduch 1999).
Nevertheless, in most poor communities, such punishment fails for one of the two reasons:
either the legal infrastructure does not support such action, or the borrower has no sizeable
assets or wages (Karlan 2001).7 This is a particular problem of MFIs, which systematically
lend to low-income clients who usually have very few marketable assets. Traditional
collateral such as property, land/land use certificates, or other capital assets is often not
available. Therefore, the absence of physical capital, and thus collateral, has for a long time
been seen as the major access constraint of lower-income households.
7 For instance, in socialist economies like China, land is collectively owned, preventing its use as collateral (Park and Ren 2001).
5
Human capital and collateral: At the household level, human capital is a factor of the
amount and quality of available labor, which usually is defined in terms of the health and
education levels of individuals. Lack of human capital is seen as an access constraint from the
household side, as there is often a need to fill in application forms or draw up small business
plans, and this requires a certain amount of human capital (see for instance Panjaitan-
Drioadisuryo and Cloud (1999)). Human capital can compensate for a lack of physical
collateral. Then, the decision of whether or not to grant the credit is based mainly on the
profitability of the investment. However, this practice is still very uncommon among rural
lenders. Usually staff lacks the appropriate skills to assess an investment reliably.
Social capital and collateral: The poor seldom have physical collateral to offer. The most
common way to deal with this problem is by using social collateral. Here, the borrowers’
reputation, or the social (and political) networks to which they belong, replace traditional
physical collateral (Bastelaer van 2003, Panjaitan-Drioadisuryo and Cloud 1999). Usually this
results in applying credit group schemes with joint liability.8 Under an individual lending
contract, if the borrower defaults, all he has to fear is the penalties the bank can impose,
which, in the absence of collateral, simply means the denial of future loans. In group lending,
he may also be exposed to the wrath of other group members (Besley and Coate 1995).
Infrastructure: The rural infrastructure influences both access to and outreach of credit
equally, and is therefore not depicted in Figure 1. Infrastructure not only refers to the ‘hard’
infrastructure, like roads, but also to ‘soft’ infrastructure, such as legal frameworks. For
instance, Fabbri and Padula (2003) found in a recent paper that lax legal enforcement
increases the probability of poor people being access-constrained to formal credit in Italy.
2.2 Measuring outreach and access: econometric models Principal Component Analysis (PCA):9 The breadth of outreach of a microfinance institution
is easy to measure (one simply counts the clients), but other dimensions of outreach,
particularly poverty outreach, are more difficult to measure (Woller et al. 1999). A poverty
assessment tool was developed in the late 1990s by the International Food Policy Research
Institute (IFPRI), which uses the PCA as econometric instrument. The objective was to design
8 Despite its popularity, group lending-oriented microfinance is not a panacea for solving all problems of access to financial services for the poor in developing countries. Not only specialized agricultural development banks are prone to the difficulties due to information asymmetries and moral hazard pointed out by institution economics; these problems can also occur in group lending. For a critical view of group lending see, e.g., Heidhues et al. (1997) and Schmidt and Zeitinger (1994). 9 The next section is based on a review by Häuser et al. (2005).
6
a tool to assess the poverty level of the clients of a microfinance institution in relation to their
non-clients (who represent the general population in its area of operation) to give a reliable
assessment of the poverty outreach of the institution (Zeller et al. 2001, Zeller et al. 2005).
The PCA is a multivariate technique and its main objective is to reduce the dimension of the
observations (Härdle and Simar 2003). Different correlated variables are aggregated into
fewer uncorrelated principal components, which can be seen as indices. With this technique,
most of the information contained in the data is represented in the new indices. The analysis
can be viewed as a ‘data reduction technique’, since the set of original m variables is reduced
to n principal components (PC), with n«m. This smaller number of components can then be
used for interpretation purposes or for further data analysis. The procedure carried out by the
analysis is to calculate new uncorrelated principal components by linear combinations of the
original, correlated variables. This is done by deriving (standardized) weights for each
indicator. In algebraic terms this means that:
PC1 = w11 v1 + w12 v2 + … + w1m vm PC2 = w21 v1 + w22 v2 + … + w2m vm PCm = wm1 v1 + wm2 v2 + … + wmm vm With: w = calculated weight v = variable
Applied to poverty assessment, the PCA determines a subset of indicators that measure the
relative poverty level of a household. In the end, a single indicator for each household is
created that reflects the household’s poverty status in relation to all other households of the
sample (Zeller et al. 2005). With the weights of the PC1 and the respective indicators, the
poverty index is calculated for each household. Relative comparisons can then be drawn by
ordering the households according to their poverty index. In this way, it is possible to identify
which households are better or worse off than others. By creating terciles, quartiles or
quintiles using the index, different wealth groups can be derived. The most important
advantage of the PCA is that on the one hand it creates a single indicator that is easy to use for
analysis, while at the same time this single indicator is not limited to the monetary aspect
addressed by household expenditures as the conventional method of (income) poverty. The
PCA technique allows to take the multiple dimensions of poverty into account and to integrate
qualitative with quantitative variables. Therefore, indicators capturing different dimensions
are included that measure changing conditions at different levels of welfare. These indicators
can be categorized into three groups (Henry et al. 2003):
7
1. Means to achieve welfare
This category includes indicators that reflect the earning capacities of a household.
They are subdivided into human capital, social capital and ownership of assets.
2. Basic needs
These indicators show the fulfillment of basic needs, such as health status, food,
shelter and clothing, partly obtained by questions asking the respondent about his or
her self-assessment of the situation.
3. Other aspects of welfare
Security, self-assessment of (subjective) poverty, social status and the environment are
captured in this group.10
Binary logit analysis: This research collects household-level credit market information to
determine whether or not households are constrained as regards access to formal credit.
Whether or not a household is access-constrained is depicted in the decision tree of effective
credit demand (see Figure 9 in the Annex). Households that had access to formal credit were
considered not to be access-constrained regardless of whether or not they originally wanted to
borrow more than they were lent. In particular, non-borrowing households were asked their
reasons for not borrowing or for having been rejected. Diagne et al. (2000) and Zeller and
Sharma (2000) state that households may have chosen not to borrow even when they had
access to credit, while others may have wanted to borrow, but had no access. For these
reasons, one cannot equate observed demand with access. Finally, the sample households
were classified into households with and without access to formal credit.
Regression models describe the relationship between a dependent variable and independent
explanatory variables (Backhaus et al. 1996). Ordinary least square regression models
consider the dependent variable to be continuous in nature, while the explanatory variables
can be either continuous or categorical. But it is not uncommon that a dependent variable is
binary in nature, i.e., that it can only have two possible values, one for the occurrence of an
event, zero otherwise. In this case, the dependent (binary) variable is one for all households
with access to formal credit and zero otherwise. A mixture of continuous and categorical
variables may explain this dependent binary variable. Therefore, the econometric model used
in this research work is a binary logit regression. In the binary logit regression model, the
10 The adapted list of poverty indicators used in this research work can be found in Figure 10 the Annex.
8
predicted probabilities for the dependent variable will never be less than (or equal to) zero, or
greater than (or equal to) one, regardless of the values of the independent variables.
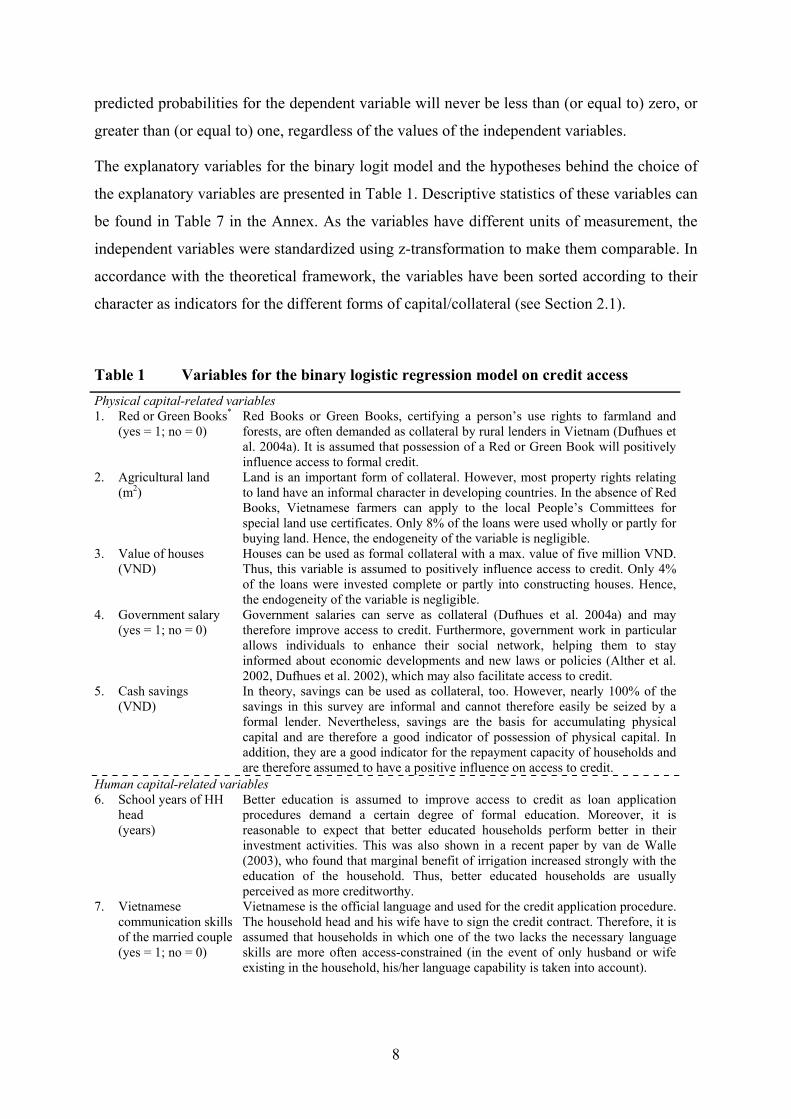
The explanatory variables for the binary logit model and the hypotheses behind the choice of
the explanatory variables are presented in Table 1. Descriptive statistics of these variables can
be found in Table 7 in the Annex. As the variables have different units of measurement, the
independent variables were standardized using z-transformation to make them comparable. In
accordance with the theoretical framework, the variables have been sorted according to their
character as indicators for the different forms of capital/collateral (see Section 2.1).
Table 1 Variables for the binary logistic regression model on credit access Physical capital-related variables 1. Red or Green Books*
(yes = 1; no = 0) Red Books or Green Books, certifying a person’s use rights to farmland and forests, are often demanded as collateral by rural lenders in Vietnam (Dufhues et al. 2004a). It is assumed that possession of a Red or Green Book will positively influence access to formal credit.
2. Agricultural land (m2)
Land is an important form of collateral. However, most property rights relating to land have an informal character in developing countries. In the absence of Red Books, Vietnamese farmers can apply to the local People’s Committees for special land use certificates. Only 8% of the loans were used wholly or partly for buying land. Hence, the endogeneity of the variable is negligible.
3. Value of houses (VND)
Houses can be used as formal collateral with a max. value of five million VND. Thus, this variable is assumed to positively influence access to credit. Only 4% of the loans were invested complete or partly into constructing houses. Hence, the endogeneity of the variable is negligible.
4. Government salary (yes = 1; no = 0)
Government salaries can serve as collateral (Dufhues et al. 2004a) and may therefore improve access to credit. Furthermore, government work in particular allows individuals to enhance their social network, helping them to stay informed about economic developments and new laws or policies (Alther et al. 2002, Dufhues et al. 2002), which may also facilitate access to credit.
5. Cash savings (VND)
In theory, savings can be used as collateral, too. However, nearly 100% of the savings in this survey are informal and cannot therefore easily be seized by a formal lender. Nevertheless, savings are the basis for accumulating physical capital and are therefore a good indicator of possession of physical capital. In addition, they are a good indicator for the repayment capacity of households and are therefore assumed to have a positive influence on access to credit.
Human capital-related variables 6. School years of HH
head (years)
Better education is assumed to improve access to credit as loan application procedures demand a certain degree of formal education. Moreover, it is reasonable to expect that better educated households perform better in their investment activities. This was also shown in a recent paper by van de Walle (2003), who found that marginal benefit of irrigation increased strongly with the education of the household. Thus, better educated households are usually perceived as more creditworthy.
7. Vietnamese communication skills of the married couple(yes = 1; no = 0)
Vietnamese is the official language and used for the credit application procedure. The household head and his wife have to sign the credit contract. Therefore, it is assumed that households in which one of the two lacks the necessary language skills are more often access-constrained (in the event of only husband or wife existing in the household, his/her language capability is taken into account).
9
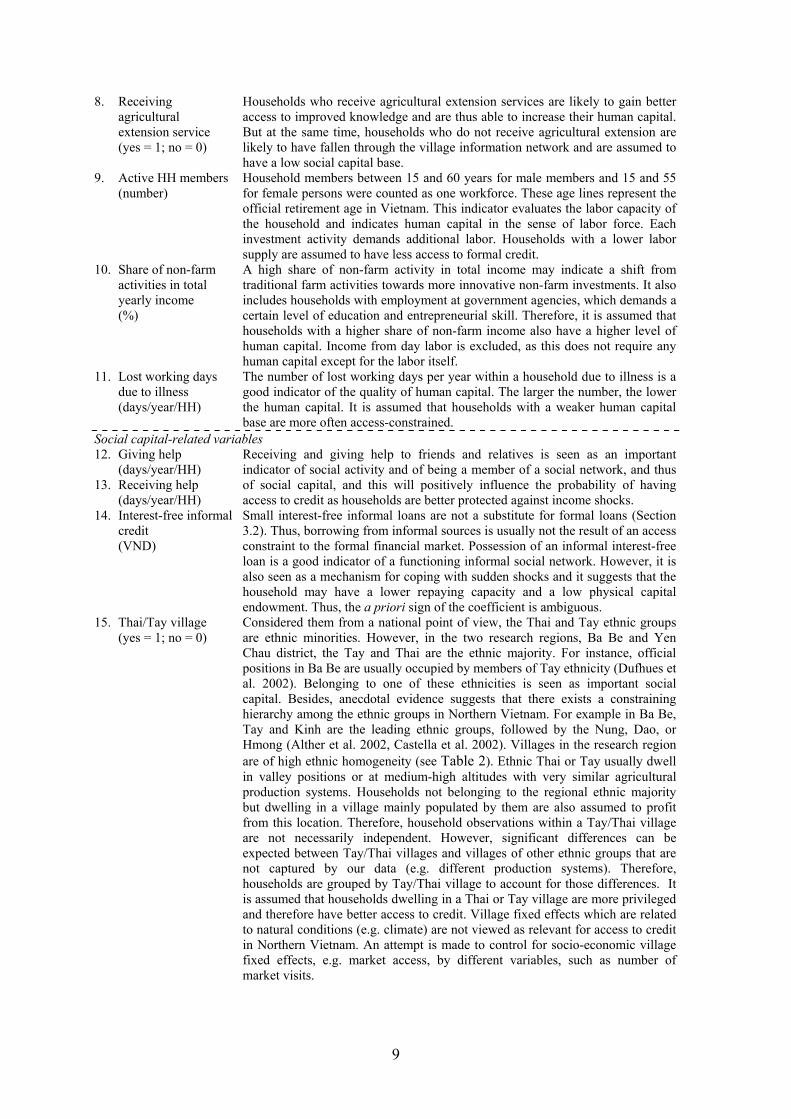
8. Receiving agricultural extension service (yes = 1; no = 0)
Households who receive agricultural extension services are likely to gain better access to improved knowledge and are thus able to increase their human capital. But at the same time, households who do not receive agricultural extension are likely to have fallen through the village information network and are assumed to have a low social capital base.
9. Active HH members (number)
Household members between 15 and 60 years for male members and 15 and 55 for female persons were counted as one workforce. These age lines represent the official retirement age in Vietnam. This indicator evaluates the labor capacity of the household and indicates human capital in the sense of labor force. Each investment activity demands additional labor. Households with a lower labor supply are assumed to have less access to formal credit.
10. Share of non-farm activities in total yearly income (%)
A high share of non-farm activity in total income may indicate a shift from traditional farm activities towards more innovative non-farm investments. It also includes households with employment at government agencies, which demands a certain level of education and entrepreneurial skill. Therefore, it is assumed that households with a higher share of non-farm income also have a higher level of human capital. Income from day labor is excluded, as this does not require any human capital except for the labor itself.
11. Lost working days due to illness (days/year/HH)
The number of lost working days per year within a household due to illness is a good indicator of the quality of human capital. The larger the number, the lower the human capital. It is assumed that households with a weaker human capital base are more often access-constrained.
Social capital-related variables 12. Giving help
(days/year/HH) 13. Receiving help
(days/year/HH)
Receiving and giving help to friends and relatives is seen as an important indicator of social activity and of being a member of a social network, and thus of social capital, and this will positively influence the probability of having access to credit as households are better protected against income shocks.
14. Interest-free informal credit (VND)
Small interest-free informal loans are not a substitute for formal loans (Section 3.2). Thus, borrowing from informal sources is usually not the result of an access constraint to the formal financial market. Possession of an informal interest-free loan is a good indicator of a functioning informal social network. However, it is also seen as a mechanism for coping with sudden shocks and it suggests that the household may have a lower repaying capacity and a low physical capital endowment. Thus, the a priori sign of the coefficient is ambiguous.
15. Thai/Tay village (yes = 1; no = 0)
Considered them from a national point of view, the Thai and Tay ethnic groups are ethnic minorities. However, in the two research regions, Ba Be and Yen Chau district, the Tay and Thai are the ethnic majority. For instance, official positions in Ba Be are usually occupied by members of Tay ethnicity (Dufhues et al. 2002). Belonging to one of these ethnicities is seen as important social capital. Besides, anecdotal evidence suggests that there exists a constraining hierarchy among the ethnic groups in Northern Vietnam. For example in Ba Be, Tay and Kinh are the leading ethnic groups, followed by the Nung, Dao, or Hmong (Alther et al. 2002, Castella et al. 2002). Villages in the research region are of high ethnic homogeneity (see Table 2). Ethnic Thai or Tay usually dwell in valley positions or at medium-high altitudes with very similar agricultural production systems. Households not belonging to the regional ethnic majority but dwelling in a village mainly populated by them are also assumed to profit from this location. Therefore, household observations within a Tay/Thai village are not necessarily independent. However, significant differences can be expected between Tay/Thai villages and villages of other ethnic groups that are not captured by our data (e.g. different production systems). Therefore, households are grouped by Tay/Thai village to account for those differences. It is assumed that households dwelling in a Thai or Tay village are more privileged and therefore have better access to credit. Village fixed effects which are related to natural conditions (e.g. climate) are not viewed as relevant for access to credit in Northern Vietnam. An attempt is made to control for socio-economic village fixed effects, e.g. market access, by different variables, such as number of market visits.
10
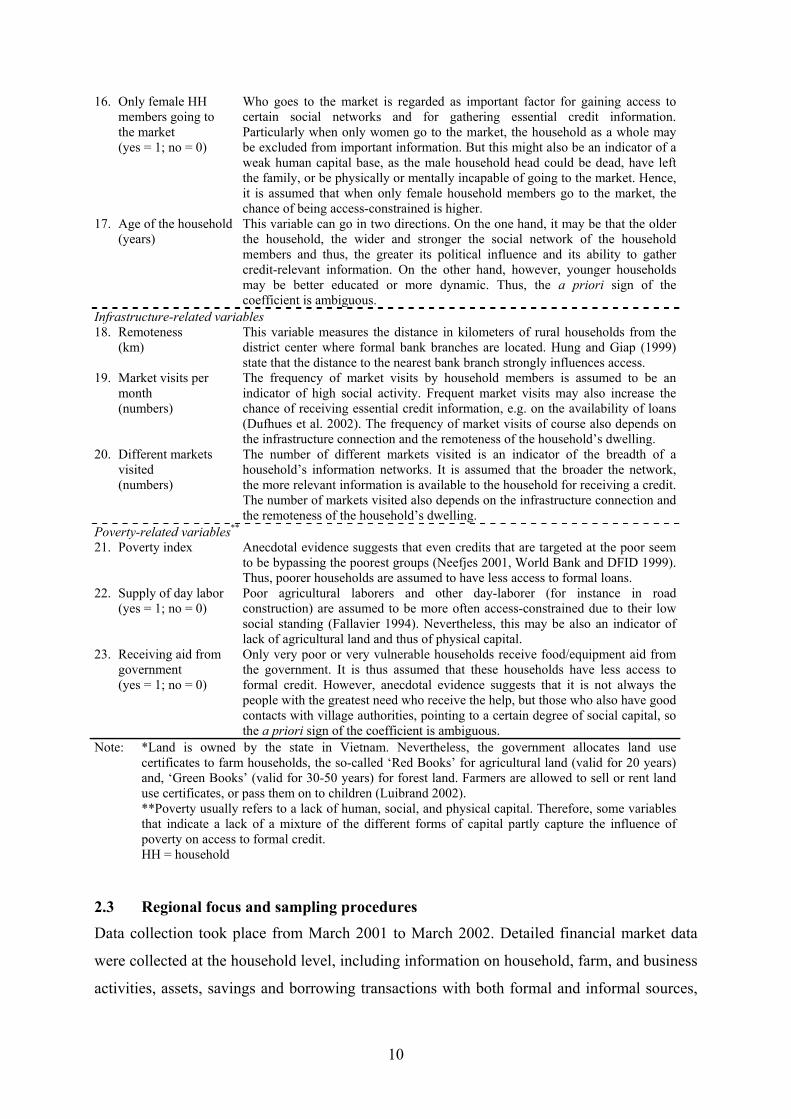
16. Only female HH members going to the market (yes = 1; no = 0)
Who goes to the market is regarded as important factor for gaining access to certain social networks and for gathering essential credit information. Particularly when only women go to the market, the household as a whole may be excluded from important information. But this might also be an indicator of a weak human capital base, as the male household head could be dead, have left the family, or be physically or mentally incapable of going to the market. Hence, it is assumed that when only female household members go to the market, the chance of being access-constrained is higher.
17. Age of the household (years)
This variable can go in two directions. On the one hand, it may be that the older the household, the wider and stronger the social network of the household members and thus, the greater its political influence and its ability to gather credit-relevant information. On the other hand, however, younger households may be better educated or more dynamic. Thus, the a priori sign of the coefficient is ambiguous.
Infrastructure-related variables 18. Remoteness
(km) This variable measures the distance in kilometers of rural households from the district center where formal bank branches are located. Hung and Giap (1999) state that the distance to the nearest bank branch strongly influences access.
19. Market visits per month (numbers)
The frequency of market visits by household members is assumed to be an indicator of high social activity. Frequent market visits may also increase the chance of receiving essential credit information, e.g. on the availability of loans (Dufhues et al. 2002). The frequency of market visits of course also depends on the infrastructure connection and the remoteness of the household’s dwelling.
20. Different markets visited (numbers)
The number of different markets visited is an indicator of the breadth of a household’s information networks. It is assumed that the broader the network, the more relevant information is available to the household for receiving a credit. The number of markets visited also depends on the infrastructure connection and the remoteness of the household’s dwelling.
Poverty-related variables** 21. Poverty index Anecdotal evidence suggests that even credits that are targeted at the poor seem
to be bypassing the poorest groups (Neefjes 2001, World Bank and DFID 1999). Thus, poorer households are assumed to have less access to formal loans.
22. Supply of day labor (yes = 1; no = 0)
Poor agricultural laborers and other day-laborer (for instance in road construction) are assumed to be more often access-constrained due to their low social standing (Fallavier 1994). Nevertheless, this may be also an indicator of lack of agricultural land and thus of physical capital.
23. Receiving aid from government (yes = 1; no = 0)
Only very poor or very vulnerable households receive food/equipment aid from the government. It is thus assumed that these households have less access to formal credit. However, anecdotal evidence suggests that it is not always the people with the greatest need who receive the help, but those who also have good contacts with village authorities, pointing to a certain degree of social capital, so the a priori sign of the coefficient is ambiguous.
Note: *Land is owned by the state in Vietnam. Nevertheless, the government allocates land use certificates to farm households, the so-called ‘Red Books’ for agricultural land (valid for 20 years) and, ‘Green Books’ (valid for 30-50 years) for forest land. Farmers are allowed to sell or rent land use certificates, or pass them on to children (Luibrand 2002).
**Poverty usually refers to a lack of human, social, and physical capital. Therefore, some variables that indicate a lack of a mixture of the different forms of capital partly capture the influence of poverty on access to formal credit.
HH = household
2.3 Regional focus and sampling procedures Data collection took place from March 2001 to March 2002. Detailed financial market data
were collected at the household level, including information on household, farm, and business
activities, assets, savings and borrowing transactions with both formal and informal sources,
11
and households’ perceptions of their formal sector borrowing opportunities. The survey also
documented household consumption and labor market participation.
Two research sites were selected, namely Bac Kan province (Ba Be district) and Son La
province (Yen Chau district). Both provinces are located in the mountainous regions of
Northern Vietnam and are among the poorest provinces of the country (World Bank 1999).
Ba Be district is a very remote area and has only recently (in 1999/2000) gained access to
regional and interregional markets. Farmers produce mainly for subsistence and a large
proportion of them may be considered poor. Due to the creation of the Ba Be National Park
(close to Ba Be town), huge resettlements took place, aggravating the socio-economic
problems in the region. The Yen Chau district has a much better connection to regional
markets (Son La town) and even to greater Hanoi, and therefore offers a good contrast to the
situation in Ba Be district.
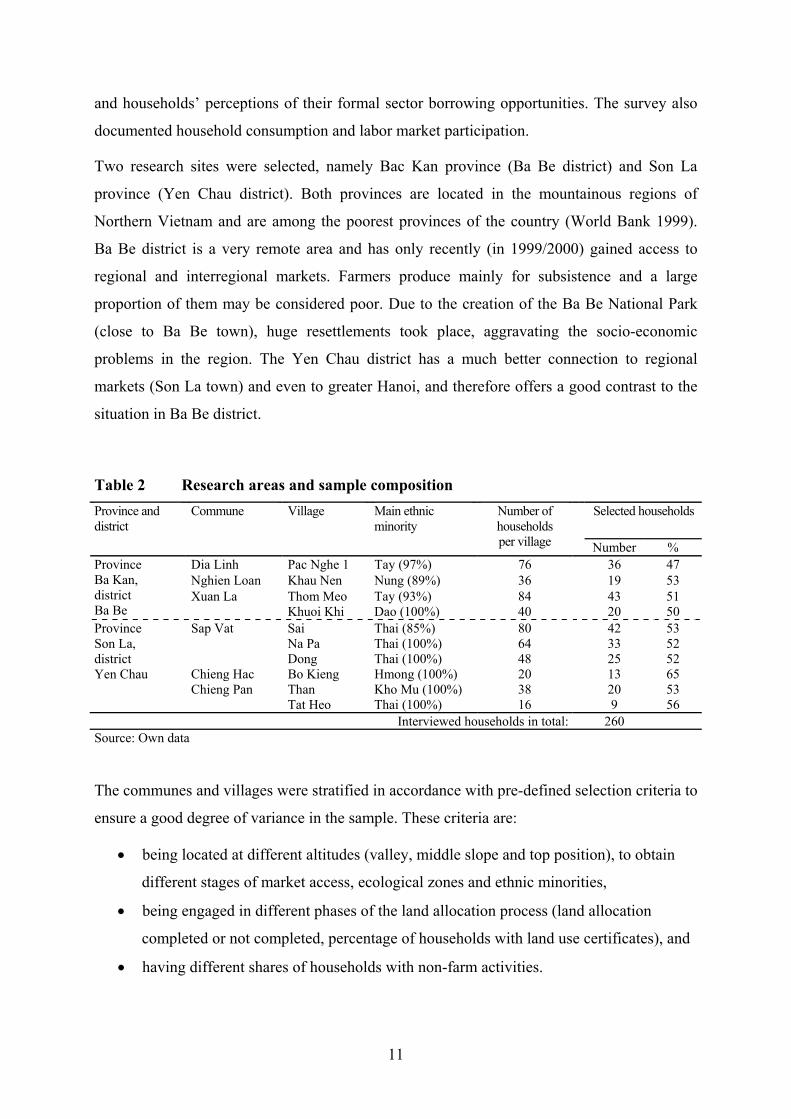
Table 2 Research areas and sample composition Selected households Province and
district Commune Village Main ethnic
minority Number of households per village
Number % Dia Linh Pac Nghe 1 Tay (97%) 76 36 47 Nghien Loan Khau Nen Nung (89%) 36 19 53
Province Ba Kan, district Ba Be
Xuan La Thom Meo Khuoi Khi
Tay (93%) Dao (100%)
84 40
43 20
51 50
Sap Vat Sai Na Pa Dong
Thai (85%) Thai (100%) Thai (100%)
80 64 48
42 33 25
53 52 52
Province Son La, district Yen Chau Chieng Hac Bo Kieng Hmong (100%) 20 13 65 Chieng Pan Than
Tat Heo Kho Mu (100%) Thai (100%)
38 16
20 9
53 56
Interviewed households in total: 260 Source: Own data
The communes and villages were stratified in accordance with pre-defined selection criteria to
ensure a good degree of variance in the sample. These criteria are:
• being located at different altitudes (valley, middle slope and top position), to obtain
different stages of market access, ecological zones and ethnic minorities,
• being engaged in different phases of the land allocation process (land allocation
completed or not completed, percentage of households with land use certificates), and
• having different shares of households with non-farm activities.
12
An overview of the sample in both regions is given in Table 2. Half of all households in each
village were randomly selected after being stratified according to their living standard into
five categories using official poverty data from the village headmen.11
3 Outreach of and access to formal rural lenders in Vietnam The following section first discusses the general use of collateral by formal lenders in
Northern Vietnam. The situation as regards effective credit demand is then presented in
Section 3.2, followed by the outreach of rural lenders (Section 3.3) and econometric analysis
of access-constrained households (Section 3.4).
3.1 Collateral use The main collateral demanded by lenders in Vietnam is physical collateral in the form of land
use certificates (Red and Green Books). Social collateral in the form of references is also a
widespread requirement, particularly in Northern Vietnam, and both forms are often
intermingled.12
In Vietnam, lenders face enormous difficulty in enforcing pledges and mortgages (Riedel
2000, UNDP 1999). Banks are not usually allowed to seize land from defaulting farmers,
even if the use rights have been pledged. It is more or less impossible to evict farmers and
auction their land because of the lack of legal infrastructure and resistance from local
authorities (Wolz 1997). Only a few cases exist where land has been liquidated in the event of
a farmer’s collapse (Duong and Izumida 2002). It appears that the underdeveloped legal
framework does not prove effective for the use of physical collateral as a risk management
tool (Gottwald and Klump 1999). Nevertheless, the VBARD still insists on land use
certificates as collateral and relies mainly on the psychological pressure related to the
possibility of losing land.13
As the liquidation of collateral is almost impossible in practice
(although this may not be known to the farmers), rescheduling of the loan is often the only
possibility for the credit officer to avoid designating a loan as overdue, not performing, or
lost. Therefore, rescheduling of loans in VBARD/VBP is extremely high (Izumida and Duong
2001, VBARD and Danida 1999). According to Binswanger and Sillers (1983), farmers, and
11 The Vietnamese government classifies every household once a year according to its living standard into one of five categories: hungry, poor, medium, better-off, and rich (Dufhues et al. (2002) and Geppert and Dufhues (2003)). 12 A detailed description of the use of different kinds of physical collateral in the credit procedures of rural lenders in Vietnam can be found in Dufhues et al. (2004a). 13 In contrast to VBARD practice, the government and VBARD headquarters state that households can take out loans of less than ten million VND without any collateral (see VBARD (2001)).
13
particularly poor farmers, in developing countries are almost universally risk-averse and often
reluctant to put their assets at stake as collateral for a loan. However, as Dufhues et al.
(2004a) found, even poor farmers in Northern Vietnam are not afraid to pledge their land use
certificates as collateral. They may be convinced that their investment will not fail or, more
likely, they believe that the bank will not seize the land even if they have difficulty repaying
their loan.
Officially, the VBP uses solely group lending schemes with joint liability for delivering its
loans (VBP 1999).14 Anecdotal evidence, however, revealed that in some cases of so-called
‘hungry’ households, which are officially excluded from access to VBP loans as they are
considered too poor, the credit officers insist on collateral in the form of land use certificates,
too. In this sample, over 25% of all VBP credits (N=94) were secured by physical collateral in
various forms. The so-called joint liability credit groups are not working effectively, as some
of the regulations enforced by the VBP seem to neutralize the peer pressure that is important
for good credit repayment records. In everyday practice, the group members are not held
liable for each other; the person who fails to repay the loan is simply expelled from the group
and no negative consequences are imposed on the other group members. As joint liability
does not work in the case of VBP, and physical collateral fails to achieve its intended purpose
in the case of VBARD, both require guarantees from local authorities in the form of
‘certificates of good conduct’ and they rely on an extensive network of non-bank local
officials, who support the banks in screening, monitoring, and enforcing the loans (Dufhues et
al. 2002). However, supervision of these structures can be difficult. For instance, Todd (1996)
reported that when a loan officer who was at the same time president of the local political
committee resigned, 100 borrowers defaulted as a result. Thus, the delegated task of putting
pressure on borrowers does not always work, as the substitution of physical collateral by
social collateral leads to a delegation problem in which the lender must concern itself with
whether or not the third party charged with imposing social sanctions will actually carry out
this task (Bond and Rai 2002).
In summary, physical collateral works solely through the psychological pressure it exerts. The
social collateral of joint liability groups does not work at all. The only form of collateral that
seems to work is social collateral in the form of pressure exerted by local authorities and in
the form of denial of future credit in the event of default. However, it remains questionable
14
how long this pressure can be maintained. Anecdotal evidence from the World Bank (2003,
2004b) suggests that in poor communes 70% of households default in their installment
payments to VBSP, while around 30% default in their payments to VBARD.
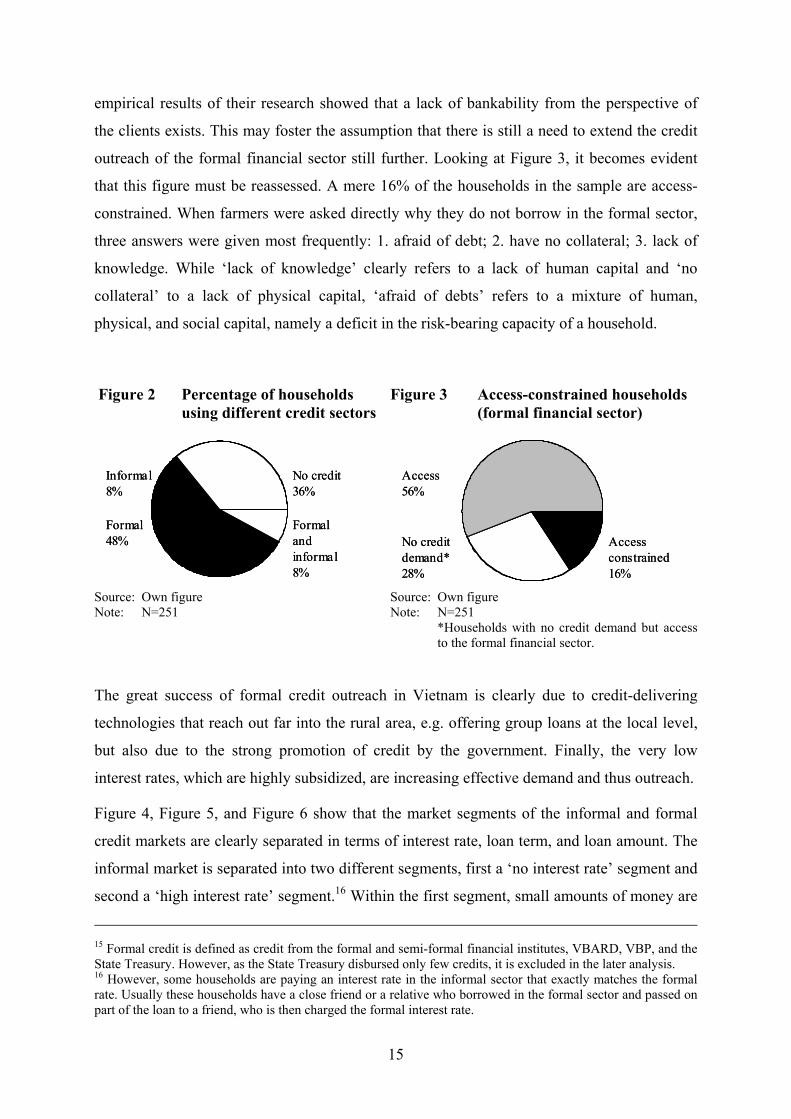
3.2 Effective formal credit demand15 In total, 56% of all households in the sample (total N=251) have had an effective demand for
formal credit (Figure 2). This clearly demonstrates the enormous breadth of outreach of the
formal financial sector in Vietnam. Only a mere 16% of households are involved in the
informal market and 23% of the total loans in this sample are borrowed in the informal sector.
Duong and Izumida (2002) found that in their survey an even lower number, namely 17% of
all loans, were extended by informal sources, and the World Bank (2003) states that the
majority of households have access to formal credit in one way or another. These figures
stand in contrast to the observations made in many other developing countries, where the
informal sector is still the biggest supplier of financial services. As one important factor for
the reduction of the informal sector from about 80% in the early 1990s to around 20% today,
McCarty (2001) mentioned ‘crowding out’ by the VBARD and VBP, both of which have
extended their outreach enormously in recent years. Nevertheless, the VBP has done this at
the cost of financial sustainability. On the one hand, crowding out moneylenders who charge
usury interest rates is a very welcome effect. However, not all moneylenders charge usury
interest rates. So, crowding out the informal sector can have very negative effects by
destroying informal financial networks without replacing them with a sustainable formal
alternative. In Vietnam these informal structures have been replaced by formal ones, but the
questions remains: are they sustainable in the long run? The VBP was recently replaced by
the VBSP, which will continue the policy of the VBP. It is just a matter of time when the
VBSP will become unsustainable, as its interest policy cannot cover its costs. Diagne et al.
(2000) state that policies and financial institutions should be designed to complement the
informal market rather then to replace it.
Over 40% of households are not engaged in the formal financial sector. Zeller and Sharma
(1998) state that some rural households simply do not apply for a loan because of the
expectation that they will be turned down. This statement was supported by the work of
Buchenrieder and Theesfeld (2001) in a similar research setting in Northern Vietnam. The
14 The VBSP, the successor of the VBP, will continue to provide physical collateral-free loans to certain target groups (Vietnam Economy 2003).
15
empirical results of their research showed that a lack of bankability from the perspective of
the clients exists. This may foster the assumption that there is still a need to extend the credit
outreach of the formal financial sector still further. Looking at Figure 3, it becomes evident
that this figure must be reassessed. A mere 16% of the households in the sample are access-
constrained. When farmers were asked directly why they do not borrow in the formal sector,
three answers were given most frequently: 1. afraid of debt; 2. have no collateral; 3. lack of
knowledge. While ‘lack of knowledge’ clearly refers to a lack of human capital and ‘no
collateral’ to a lack of physical capital, ‘afraid of debts’ refers to a mixture of human,
physical, and social capital, namely a deficit in the risk-bearing capacity of a household.
Figure 2 Percentage of households using different credit sectors
Figure 3 Access-constrained households (formal financial sector)
Formal48%
Informal8%
No credit36%
Formal and informal8%
Formal48%
Informal8%
No credit36%
Formal and informal8%
Access 56%
No credit demand*28%
Access constrained16%
Access 56%
No credit demand*28%
Access constrained16%
Source: Own figure Note: N=251
Source: Own figure Note: N=251 *Households with no credit demand but access
to the formal financial sector.
The great success of formal credit outreach in Vietnam is clearly due to credit-delivering
technologies that reach out far into the rural area, e.g. offering group loans at the local level,
but also due to the strong promotion of credit by the government. Finally, the very low
interest rates, which are highly subsidized, are increasing effective demand and thus outreach.
Figure 4, Figure 5, and Figure 6 show that the market segments of the informal and formal
credit markets are clearly separated in terms of interest rate, loan term, and loan amount. The
informal market is separated into two different segments, first a ‘no interest rate’ segment and
second a ‘high interest rate’ segment.16 Within the first segment, small amounts of money are
15 Formal credit is defined as credit from the formal and semi-formal financial institutes, VBARD, VBP, and the State Treasury. However, as the State Treasury disbursed only few credits, it is excluded in the later analysis. 16 However, some households are paying an interest rate in the informal sector that exactly matches the formal rate. Usually these households have a close friend or a relative who borrowed in the formal sector and passed on part of the loan to a friend, who is then charged the formal interest rate.
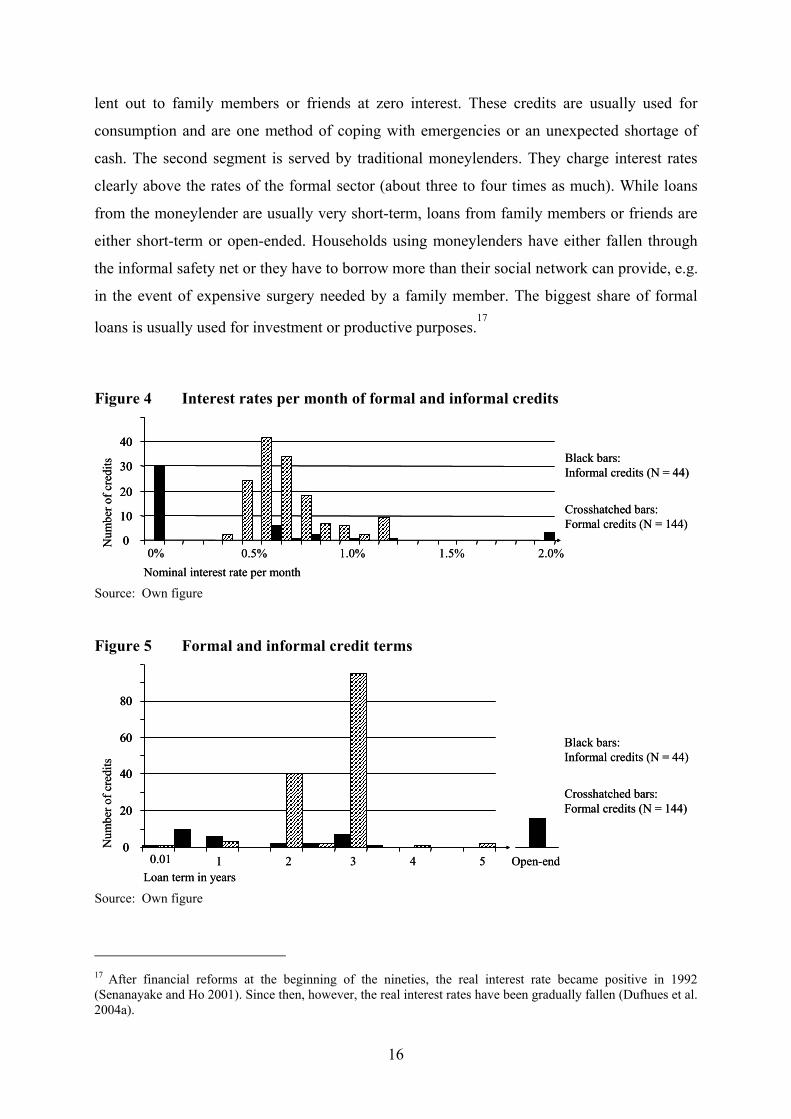
16
lent out to family members or friends at zero interest. These credits are usually used for
consumption and are one method of coping with emergencies or an unexpected shortage of
cash. The second segment is served by traditional moneylenders. They charge interest rates
clearly above the rates of the formal sector (about three to four times as much). While loans
from the moneylender are usually very short-term, loans from family members or friends are
either short-term or open-ended. Households using moneylenders have either fallen through
the informal safety net or they have to borrow more than their social network can provide, e.g.
in the event of expensive surgery needed by a family member. The biggest share of formal
loans is usually used for investment or productive purposes.17
Figure 4 Interest rates per month of formal and informal credits
0
10
20
30
40
Nominal interest rate per month2.0%1.0%0% 0.5% 1.5%
Num
ber o
f cre
dits Black bars:
Informal credits (N = 44)
Crosshatched bars:Formal credits (N = 144)
0
10
20
30
40
0
10
20
30
40
Nominal interest rate per month2.0%1.0%0% 0.5% 1.5%
Num
ber o
f cre
dits Black bars:
Informal credits (N = 44)
Crosshatched bars:Formal credits (N = 144)
Source: Own figure
Figure 5 Formal and informal credit terms
0
20
40
60
80
Open-end Loan term in years
Num
ber o
f cre
dits
30.01 1 52 4
Black bars:Informal credits (N = 44)
Crosshatched bars:Formal credits (N = 144)
0
20
40
60
80
0
20
40
60
80
Open-end Loan term in years
Num
ber o
f cre
dits
30.01 1 52 4
Black bars:Informal credits (N = 44)
Crosshatched bars:Formal credits (N = 144)
Source: Own figure
17 After financial reforms at the beginning of the nineties, the real interest rate became positive in 1992 (Senanayake and Ho 2001). Since then, however, the real interest rates have been gradually fallen (Dufhues et al. 2004a).
17
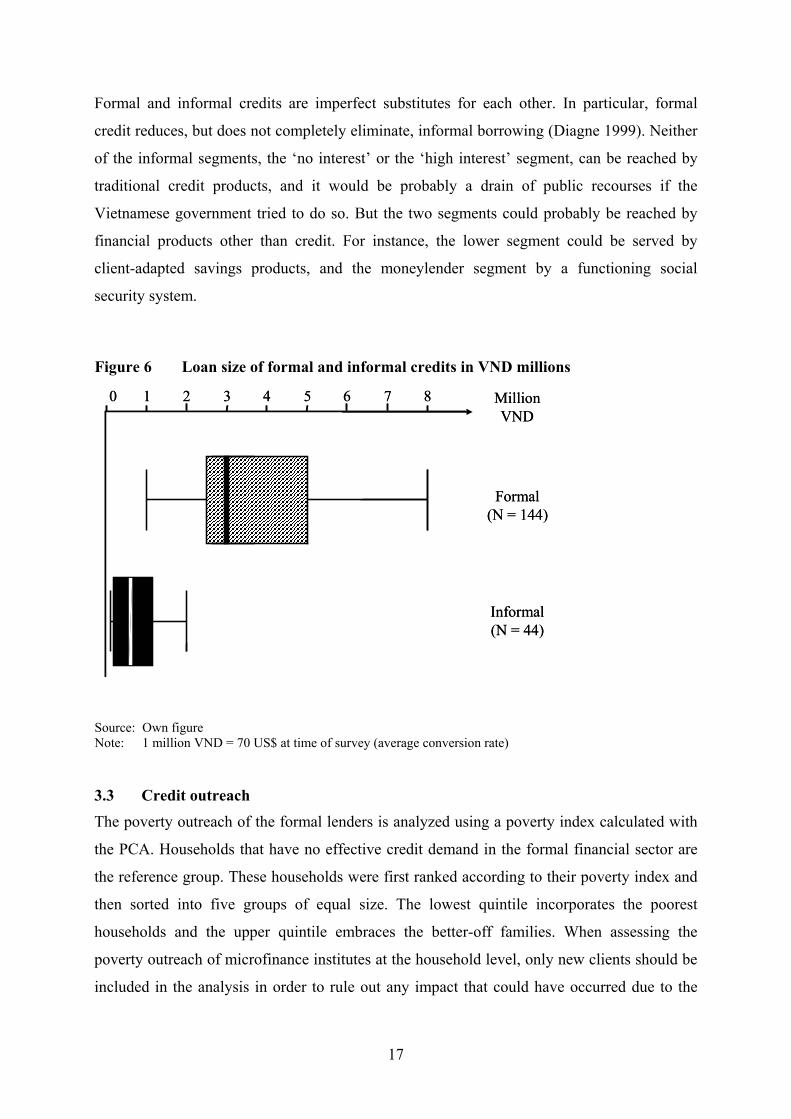
Formal and informal credits are imperfect substitutes for each other. In particular, formal
credit reduces, but does not completely eliminate, informal borrowing (Diagne 1999). Neither
of the informal segments, the ‘no interest’ or the ‘high interest’ segment, can be reached by
traditional credit products, and it would be probably a drain of public recourses if the
Vietnamese government tried to do so. But the two segments could probably be reached by
financial products other than credit. For instance, the lower segment could be served by
client-adapted savings products, and the moneylender segment by a functioning social
security system.
Figure 6 Loan size of formal and informal credits in VND millions
876543210
Informal(N = 44)
Formal(N = 144)
MillionVND
876543210
Informal(N = 44)
Formal(N = 144)
MillionVND
Source: Own figure Note: 1 million VND = 70 US$ at time of survey (average conversion rate)
3.3 Credit outreach The poverty outreach of the formal lenders is analyzed using a poverty index calculated with
the PCA. Households that have no effective credit demand in the formal financial sector are
the reference group. These households were first ranked according to their poverty index and
then sorted into five groups of equal size. The lowest quintile incorporates the poorest
households and the upper quintile embraces the better-off families. When assessing the
poverty outreach of microfinance institutes at the household level, only new clients should be
included in the analysis in order to rule out any impact that could have occurred due to the
18
financial services obtained from the lender and that could have led to a change in the poverty
status of the client (Matin et al. 1999).18
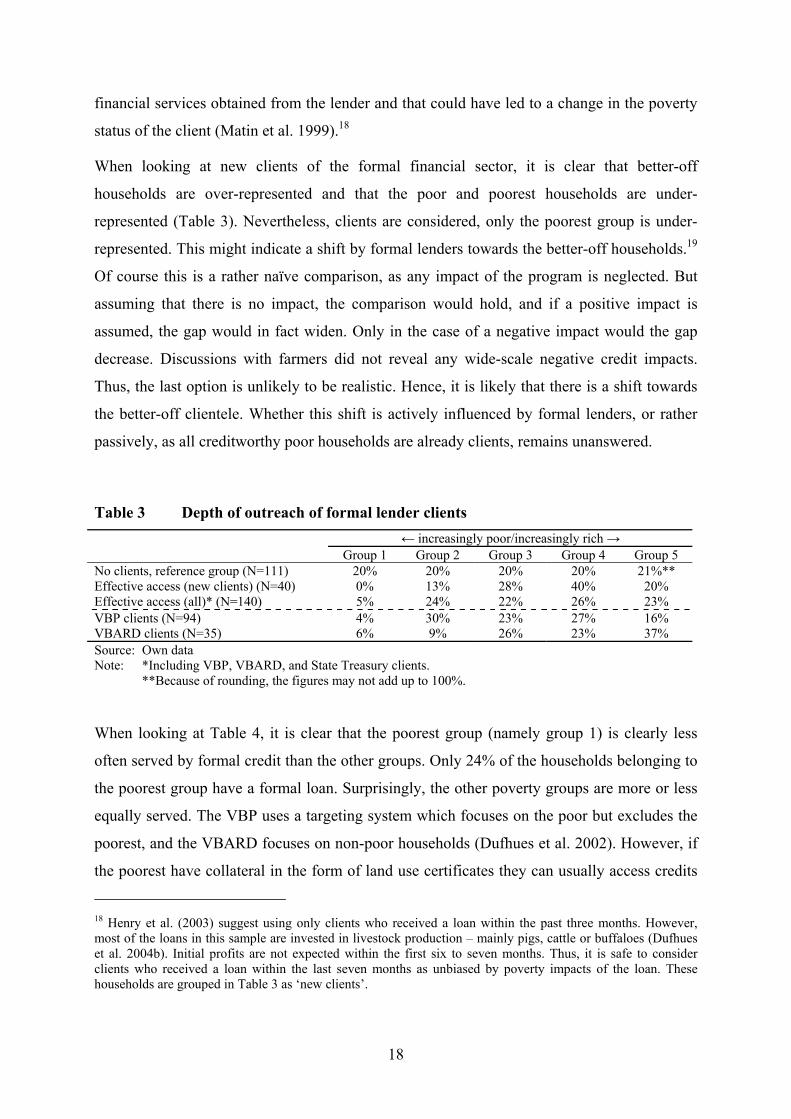
When looking at new clients of the formal financial sector, it is clear that better-off
households are over-represented and that the poor and poorest households are under-
represented (Table 3). Nevertheless, clients are considered, only the poorest group is under-
represented. This might indicate a shift by formal lenders towards the better-off households.19
Of course this is a rather naïve comparison, as any impact of the program is neglected. But
assuming that there is no impact, the comparison would hold, and if a positive impact is
assumed, the gap would in fact widen. Only in the case of a negative impact would the gap
decrease. Discussions with farmers did not reveal any wide-scale negative credit impacts.
Thus, the last option is unlikely to be realistic. Hence, it is likely that there is a shift towards
the better-off clientele. Whether this shift is actively influenced by formal lenders, or rather
passively, as all creditworthy poor households are already clients, remains unanswered.
Table 3 Depth of outreach of formal lender clients ← increasingly poor/increasingly rich → Group 1 Group 2 Group 3 Group 4 Group 5 No clients, reference group (N=111) 20% 20% 20% 20% 21%** Effective access (new clients) (N=40) 0% 13% 28% 40% 20% Effective access (all)* (N=140) 5% 24% 22% 26% 23% VBP clients (N=94) 4% 30% 23% 27% 16% VBARD clients (N=35) 6% 9% 26% 23% 37% Source: Own data Note: *Including VBP, VBARD, and State Treasury clients. **Because of rounding, the figures may not add up to 100%.
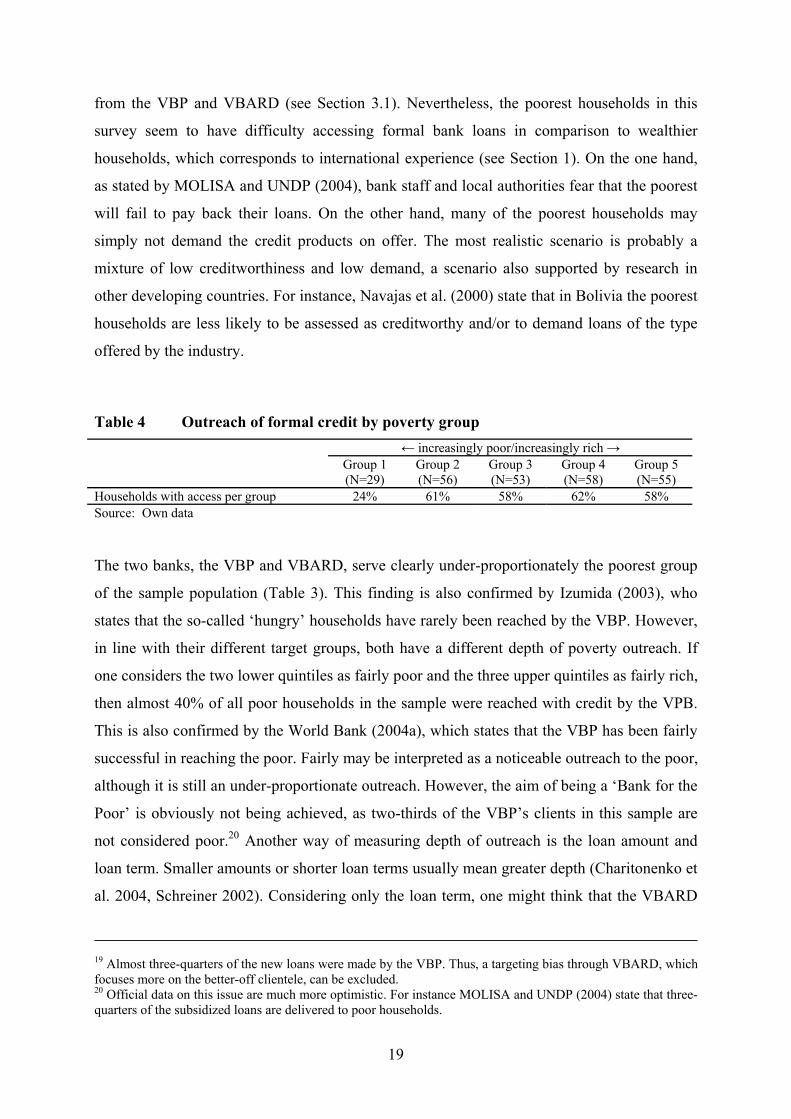
When looking at Table 4, it is clear that the poorest group (namely group 1) is clearly less
often served by formal credit than the other groups. Only 24% of the households belonging to
the poorest group have a formal loan. Surprisingly, the other poverty groups are more or less
equally served. The VBP uses a targeting system which focuses on the poor but excludes the
poorest, and the VBARD focuses on non-poor households (Dufhues et al. 2002). However, if
the poorest have collateral in the form of land use certificates they can usually access credits
18 Henry et al. (2003) suggest using only clients who received a loan within the past three months. However, most of the loans in this sample are invested in livestock production – mainly pigs, cattle or buffaloes (Dufhues et al. 2004b). Initial profits are not expected within the first six to seven months. Thus, it is safe to consider clients who received a loan within the last seven months as unbiased by poverty impacts of the loan. These households are grouped in Table 3 as ‘new clients’.
19
from the VBP and VBARD (see Section 3.1). Nevertheless, the poorest households in this
survey seem to have difficulty accessing formal bank loans in comparison to wealthier
households, which corresponds to international experience (see Section 1). On the one hand,
as stated by MOLISA and UNDP (2004), bank staff and local authorities fear that the poorest
will fail to pay back their loans. On the other hand, many of the poorest households may
simply not demand the credit products on offer. The most realistic scenario is probably a
mixture of low creditworthiness and low demand, a scenario also supported by research in
other developing countries. For instance, Navajas et al. (2000) state that in Bolivia the poorest
households are less likely to be assessed as creditworthy and/or to demand loans of the type
offered by the industry.
Table 4 Outreach of formal credit by poverty group ← increasingly poor/increasingly rich → Group 1
(N=29) Group 2 (N=56)
Group 3 (N=53)
Group 4 (N=58)
Group 5 (N=55)
Households with access per group 24% 61% 58% 62% 58% Source: Own data
The two banks, the VBP and VBARD, serve clearly under-proportionately the poorest group
of the sample population (Table 3). This finding is also confirmed by Izumida (2003), who
states that the so-called ‘hungry’ households have rarely been reached by the VBP. However,
in line with their different target groups, both have a different depth of poverty outreach. If
one considers the two lower quintiles as fairly poor and the three upper quintiles as fairly rich,
then almost 40% of all poor households in the sample were reached with credit by the VPB.
This is also confirmed by the World Bank (2004a), which states that the VBP has been fairly
successful in reaching the poor. Fairly may be interpreted as a noticeable outreach to the poor,
although it is still an under-proportionate outreach. However, the aim of being a ‘Bank for the
Poor’ is obviously not being achieved, as two-thirds of the VBP’s clients in this sample are
not considered poor.20 Another way of measuring depth of outreach is the loan amount and
loan term. Smaller amounts or shorter loan terms usually mean greater depth (Charitonenko et
al. 2004, Schreiner 2002). Considering only the loan term, one might think that the VBARD
19 Almost three-quarters of the new loans were made by the VBP. Thus, a targeting bias through VBARD, which focuses more on the better-off clientele, can be excluded. 20 Official data on this issue are much more optimistic. For instance MOLISA and UNDP (2004) state that three-quarters of the subsidized loans are delivered to poor households.
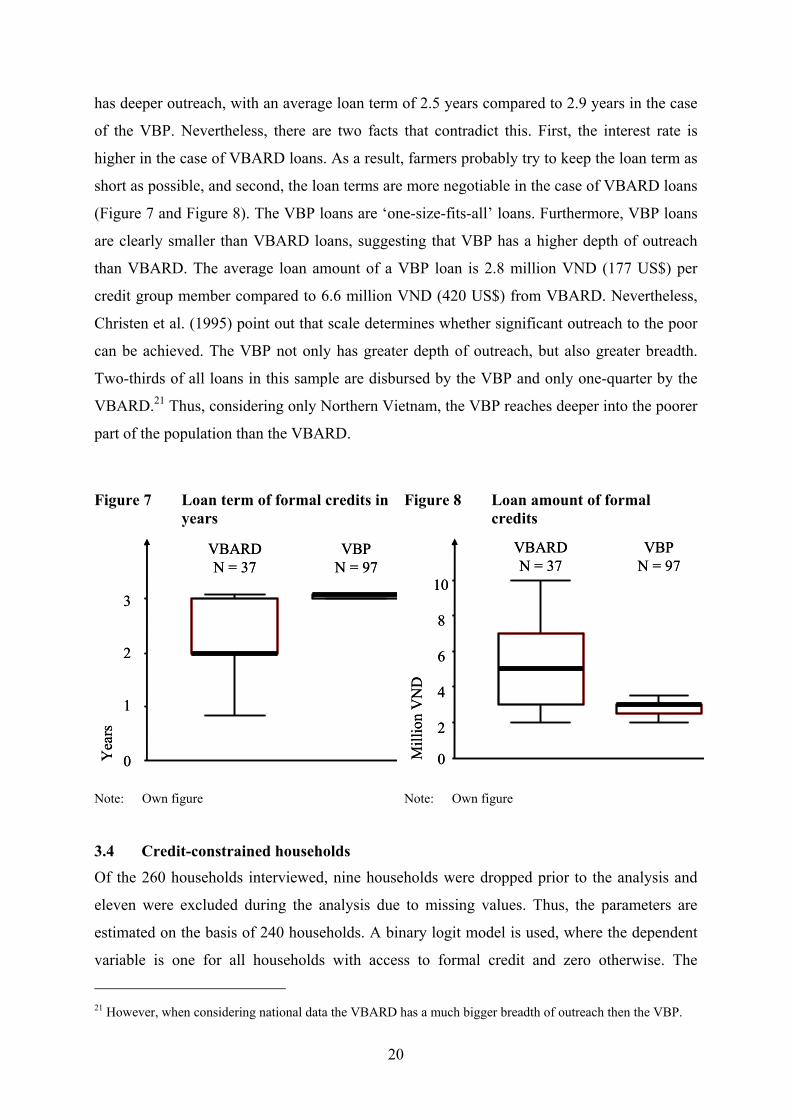
20
has deeper outreach, with an average loan term of 2.5 years compared to 2.9 years in the case
of the VBP. Nevertheless, there are two facts that contradict this. First, the interest rate is
higher in the case of VBARD loans. As a result, farmers probably try to keep the loan term as
short as possible, and second, the loan terms are more negotiable in the case of VBARD loans
(Figure 7 and Figure 8). The VBP loans are ‘one-size-fits-all’ loans. Furthermore, VBP loans
are clearly smaller than VBARD loans, suggesting that VBP has a higher depth of outreach
than VBARD. The average loan amount of a VBP loan is 2.8 million VND (177 US$) per
credit group member compared to 6.6 million VND (420 US$) from VBARD. Nevertheless,
Christen et al. (1995) point out that scale determines whether significant outreach to the poor
can be achieved. The VBP not only has greater depth of outreach, but also greater breadth.
Two-thirds of all loans in this sample are disbursed by the VBP and only one-quarter by the
VBARD.21 Thus, considering only Northern Vietnam, the VBP reaches deeper into the poorer
part of the population than the VBARD.
Figure 7 Loan term of formal credits in years
Figure 8 Loan amount of formal credits
VBPN = 97
VBARDN = 37
Yea
rs
3
2
1
0
VBPN = 97
VBARDN = 37
Yea
rs
3
2
1
0
VBPN = 97
VBARDN = 37
Mill
ion
VN
D
10
8
6
4
2
0
VBPN = 97
VBARDN = 37
Mill
ion
VN
D
10
8
6
4
2
0
Note: Own figure Note: Own figure
3.4 Credit-constrained households
Of the 260 households interviewed, nine households were dropped prior to the analysis and
eleven were excluded during the analysis due to missing values. Thus, the parameters are
estimated on the basis of 240 households. A binary logit model is used, where the dependent
variable is one for all households with access to formal credit and zero otherwise. The
21 However, when considering national data the VBARD has a much bigger breadth of outreach then the VBP.
21
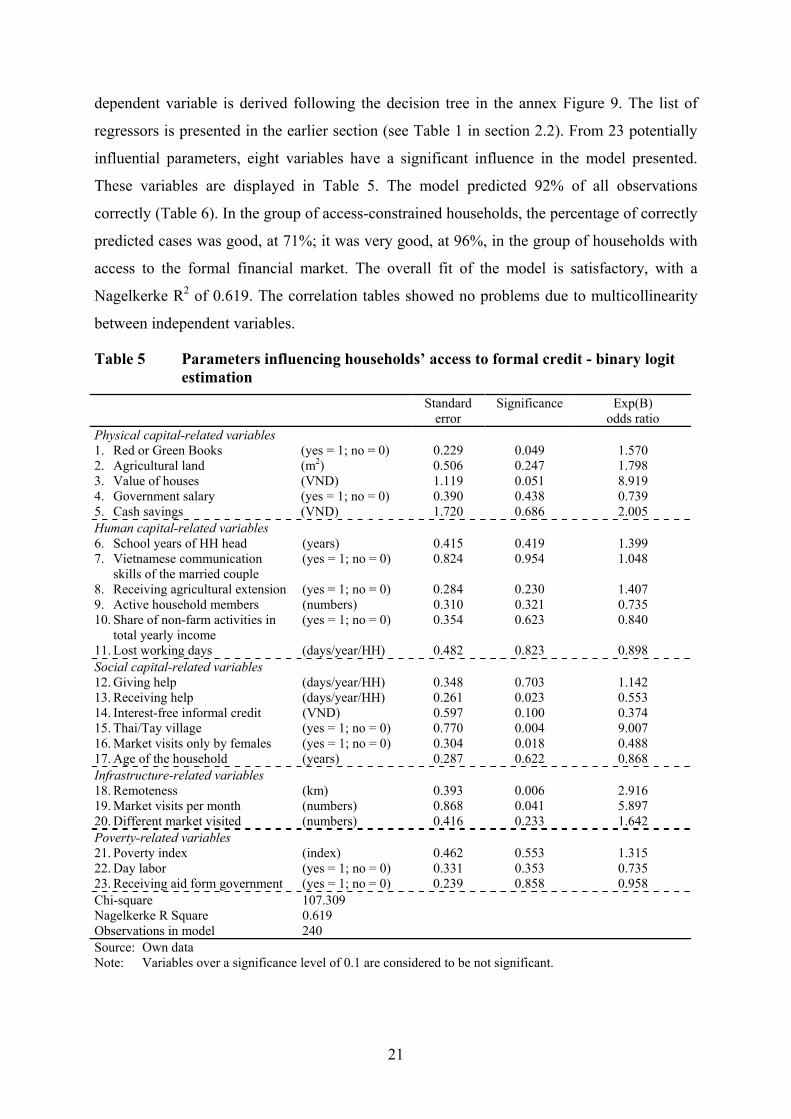
dependent variable is derived following the decision tree in the annex Figure 9. The list of
regressors is presented in the earlier section (see Table 1 in section 2.2). From 23 potentially
influential parameters, eight variables have a significant influence in the model presented.
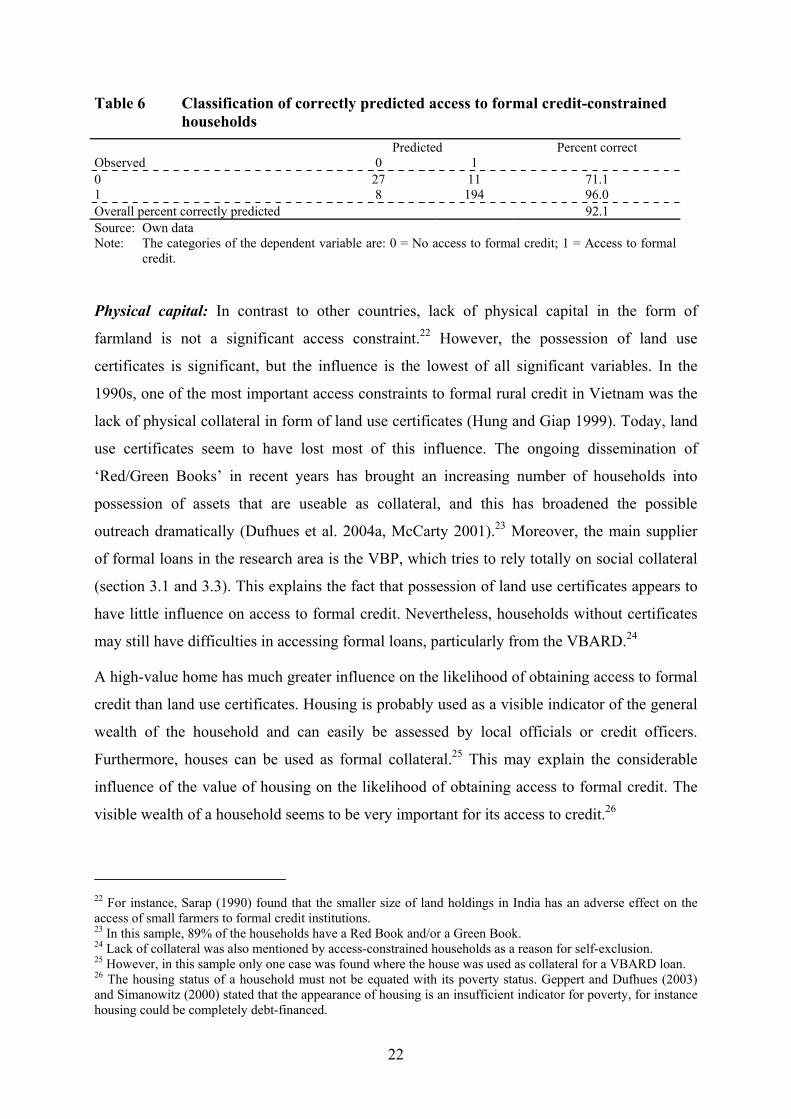
These variables are displayed in Table 5. The model predicted 92% of all observations
correctly (Table 6). In the group of access-constrained households, the percentage of correctly
predicted cases was good, at 71%; it was very good, at 96%, in the group of households with
access to the formal financial market. The overall fit of the model is satisfactory, with a
Nagelkerke R2 of 0.619. The correlation tables showed no problems due to multicollinearity
between independent variables.
Table 5 Parameters influencing households’ access to formal credit - binary logit estimation
Standard error
Significance Exp(B) odds ratio
Physical capital-related variables 1. Red or Green Books (yes = 1; no = 0) 0.229 0.049 1.570 2. Agricultural land (m2) 0.506 0.247 1.798 3. Value of houses (VND) 1.119 0.051 8.919 4. Government salary (yes = 1; no = 0) 0.390 0.438 0.739 5. Cash savings (VND) 1.720 0.686 2.005 Human capital-related variables 6. School years of HH head (years) 0.415 0.419 1.399 7. Vietnamese communication
skills of the married couple (yes = 1; no = 0) 0.824 0.954 1.048
8. Receiving agricultural extension (yes = 1; no = 0) 0.284 0.230 1.407 9. Active household members (numbers) 0.310 0.321 0.735 10. Share of non-farm activities in
total yearly income (yes = 1; no = 0) 0.354 0.623 0.840
11. Lost working days (days/year/HH) 0.482 0.823 0.898 Social capital-related variables 12. Giving help (days/year/HH) 0.348 0.703 1.142 13. Receiving help (days/year/HH) 0.261 0.023 0.553 14. Interest-free informal credit (VND) 0.597 0.100 0.374 15. Thai/Tay village (yes = 1; no = 0) 0.770 0.004 9.007 16. Market visits only by females (yes = 1; no = 0) 0.304 0.018 0.488 17. Age of the household (years) 0.287 0.622 0.868 Infrastructure-related variables 18. Remoteness (km) 0.393 0.006 2.916 19. Market visits per month (numbers) 0.868 0.041 5.897 20. Different market visited (numbers) 0.416 0.233 1.642 Poverty-related variables 21. Poverty index (index) 0.462 0.553 1.315 22. Day labor (yes = 1; no = 0) 0.331 0.353 0.735 23. Receiving aid form government (yes = 1; no = 0) 0.239 0.858 0.958 Chi-square 107.309 Nagelkerke R Square 0.619 Observations in model 240 Source: Own data Note: Variables over a significance level of 0.1 are considered to be not significant.
22
Table 6 Classification of correctly predicted access to formal credit-constrained households
Predicted Observed 0 1
Percent correct
0 27 11 71.1 1 8 194 96.0 Overall percent correctly predicted 92.1 Source: Own data Note: The categories of the dependent variable are: 0 = No access to formal credit; 1 = Access to formal
credit.
Physical capital: In contrast to other countries, lack of physical capital in the form of
farmland is not a significant access constraint.22 However, the possession of land use
certificates is significant, but the influence is the lowest of all significant variables. In the
1990s, one of the most important access constraints to formal rural credit in Vietnam was the
lack of physical collateral in form of land use certificates (Hung and Giap 1999). Today, land
use certificates seem to have lost most of this influence. The ongoing dissemination of
‘Red/Green Books’ in recent years has brought an increasing number of households into
possession of assets that are useable as collateral, and this has broadened the possible
outreach dramatically (Dufhues et al. 2004a, McCarty 2001).23 Moreover, the main supplier
of formal loans in the research area is the VBP, which tries to rely totally on social collateral
(section 3.1 and 3.3). This explains the fact that possession of land use certificates appears to
have little influence on access to formal credit. Nevertheless, households without certificates
may still have difficulties in accessing formal loans, particularly from the VBARD.24
A high-value home has much greater influence on the likelihood of obtaining access to formal
credit than land use certificates. Housing is probably used as a visible indicator of the general
wealth of the household and can easily be assessed by local officials or credit officers.
Furthermore, houses can be used as formal collateral.25 This may explain the considerable
influence of the value of housing on the likelihood of obtaining access to formal credit. The
visible wealth of a household seems to be very important for its access to credit.26
22 For instance, Sarap (1990) found that the smaller size of land holdings in India has an adverse effect on the access of small farmers to formal credit institutions. 23 In this sample, 89% of the households have a Red Book and/or a Green Book. 24 Lack of collateral was also mentioned by access-constrained households as a reason for self-exclusion. 25 However, in this sample only one case was found where the house was used as collateral for a VBARD loan. 26 The housing status of a household must not be equated with its poverty status. Geppert and Dufhues (2003) and Simanowitz (2000) stated that the appearance of housing is an insufficient indicator for poverty, for instance housing could be completely debt-financed.
23
Human capital: None of the human capital-related variables is significant. Particularly
surprising is the fact that the variable ‘school years of HH-head’ is not significant, as research
from other developing countries, e.g. Evans et al. (1999), Sarap (1990), and Vaessen (2001),
support the opposite notion. Moreover, illiteracy levels in Vietnam remain high among the
poor ethnic minorities, and in more remote parts of the country, especially in the northern
mountains (Bhushan et al. 2001). This may indicate that the formal credit application process
is not in itself a market entry barrier any more to poorly educated customers. Group credits
from the VBP have probably eradicated this access constraint. Within the group credit
scheme, only the credit group leader who submits the credit proposal needs a certain degree of
literacy (Dufhues et al. 2002). Furthermore, investments are not usually very innovative and
revolve mostly around conventional enterprises in animal production. Thus, a high amount of
human capital does not seem necessary to carry out those investments.
Social capital: Dwelling in a Thai/Tay village has the highest influence on the likelihood of
having access to formal credit. As mentioned above, from a national point of view Tay and
Thai are ethnic minorities. However, in the two research areas these minorities represent the
majority and occupy many key positions in the local administration, including the district
bank branches. It is not surprising, therefore, that inhabitants of non-Thai/Tay villages have a
significantly higher chance of being access-constrained then the ethnic majority in Ba Be and
Yen Chau respectively. However, privileged access to credit may be related not only to
ethnicity, but also to the fact that the predominant farming system in these villages is paddy
rice production. Paddy rice production was for long time seen by local officials and bank staff
as a farming system with a high developmental priority. Thus, inhabitants of these villages
were likely to obtain easier access to formal credit. Moreover, these villages usually have a
better market connection and are thus more easily accessed by bank staff, which also
promotes access to loans.
The numbers of days of informal help and the amount of interest-free informal loans that a
household receives from its social network may both be indicators of a functioning social
network, but they may also lower the chance of gaining access to formal credit. A functioning
informal social network has apparently no positive influence on the likelihood of obtaining
access to formal credit. But high use of the social network is obviously a strong indicator of
an income shock or a shock that negatively influences the repaying capacity of the
24
household.27 The incidence of shocks either raises the chance of being assessed by local
authorities as not creditworthy or adds to the self-exclusion tendency of households.
In households where only female persons go to the market (i.e. the wife of the household head
or a female household head), the chance of being access-constrained is higher then in other
households. On the one hand, this may be caused by a lack of human capital, as the male
household head is mentally or physically unable to go to the market. While the number of
missed working days due to illness is not significant, the permanent absence of an important
member of the workforce such as the male household head may be more important.
Moreover, the absence of the male household head can be easily observed by local authorities
or bank staff and may indicate a problem inside the household, which may lower its
creditworthiness. On the other hand, women probably have less access to official information
networks than men.28 Households of low social standing are often excluded from information
networks and thus lack important information. Vaessen (2001) draws similar conclusions
from a research study in Nicaragua. One reason mentioned by households that are access-
constrained to formal credit is lack of information.
Infrastructure: Surprisingly, the variable ‘distance to the district capital with the nearest bank
branch’ is positive. Former research in Vietnam, e.g. by Hung and Giap (1999), has shown
that remoteness is an access constraint to formal credit. Nevertheless, many programs around
the world are set up specifically to serve the under-served. They locate where financial
services have long been weak (Morduch 1999). In the case of Vietnam, those areas are/were
certainly the more remote areas. Through the VBP and special credit programs, the
Vietnamese government has pushed credit outreach for poverty reduction in favor of remote
communes. Minot (2000) states that poverty is more pronounced in places that are more
remote from markets and cities. Obviously program placement is not random, and remoter
villages or communes with a higher share of poverty are preferred. However, Alther et al.
(2002) state that the poorest villages may not necessarily be located inside the poorest
communes. Poor villages in wealthier areas may have less access to government services.
The variable with the third highest influence is ‘frequency of market visits’. The high
influence in this case may be explained by the lack of information about credit application
procedures and availability in the village, as described in Dufhues et al. (2002). Farmers use
27 The use of informal borrowing may also be seen as an indicator of poverty. However, other research, e.g. by Ruthven (2001), has shown that reciprocal lending is not necessarily related to poverty. 28 McCarty (2001) points out that the vast majority of rural loans are given to men.
25
market days not only for buying and selling, but also for exchanging information and keeping
relations and networks alive. Dufhues et al. (2002) also showed that good relations with
commune officials or the credit officer are essential for receiving credit. These contacts are
most likely to be established and maintained on market days. This finding is supported by
Vaessen (2001), who found that access to certain information and networks in Nicaragua is
essential for receiving credit. The more often a household goes to the market, the more
investment ideas the household may develop. Consequently, the bigger its demand for credit
and the lower its self-exclusion tendency is likely to be.
Poverty:29 A very surprising result is that the poverty variable does not have a significant
influence on the chance of a household being access-constrained. For instance, former
research by Duong and Izumida (2002) concluded that the poor have great difficulty in
accessing formal credits. Furthermore, the descriptive statistics in section 2.2 indicate that
particularly the poorest households tend be excluded. On the one hand, this may be explained
by the fact that the Vietnamese government has made major efforts to increase the supply of
formal credits to the rural poor, and clearly these efforts have been successful. On the other
hand, the poorest households may potentially be able to obtain access to formal credit, but
they do not demand it as their investment possibilities are very limited, their debt-taking
capacity is low and their risk-aversion is high.30
4 Conclusions and policy recommendations This research paper has contributed to enhance our understanding of the broad outreach of
formal rural lenders in Northern Vietnam. Compared to a decade ago, the informal market
29 Better access to credit potentially reduces the incidence of rural poverty via a positive impact of the credit itself and, in the case of not borrowing, via access to consumption loans at times of income shocks. Therefore, poverty is endogenous to credit access and the inclusion of a poverty index would result in biased coefficients. However, in this case study, endogenity of poverty is expected to be negligible for two reasons: first, in the past, formal Vietnamese lenders did not disburse consumption loans. Second, Quach et al. (2003, 2004) found in their studies only a very small impact of formal credit on household welfare in Vietnam. As mentioned in Section 3.3, households who received a formal loan within the last seven months are likely to be unbiased by poverty impacts of the loan. Therefore, a new model was calculated with a sub-sample of households. In this sub-sample, households that had a formal loan with duration of more than seven months were excluded. The results from this model also indicate that poverty status had no influence on the likelihood of a household being access-constrained to formal credit. 30 First the poverty index variable was squared and then multiplied by its original value, which can also be negative, to give a higher weight to the extreme cases. Second a dummy variable for the lowest quintile of the poverty index was incorporated in the regression instead of the poverty index itself to give a higher weight to the poorest households. But, in both cases the poverty variable turned out to be not significant. However, when dropping all variables except the poverty index as explanatory variable, this variable becomes significant. This indicates that poverty does play a role but its single dimensions or characteristics which are already reflected by
26
now plays only a minor role. The poverty outreach of the formal rural lenders is satisfactory
(e.g. about 50% of the households belonging to the two lower poverty quintiles have effective
credit demand). However, the outreach analysis has shown that the poorest households are
seldom clients of formal lenders. Only slightly more than 20% of the poorest households are
served by formal lenders, while among the wealthiest quintile this proportion is around 60%.
When considering access to formal credit, this figure must be re-evaluated. As the logit
analysis revealed, general poverty (as captured with the poverty index) does not significantly
influence access to formal credit. The results indicate that only certain aspects of poverty, e.g.
low quality of housing, have an important influence on access to formal credit in Vietnam.
Thus, the poorest households use formal credit less often, but are not significantly more often
access-constrained. This means that the poorest households simply have much less demand
for the types of formal credit products on offer. Improving credit products or offering new
credit lines would only slightly improve the credit coverage of poorer households. A more
promising approach would be to introduce a specialized pro-poor extension service to widen
the scope of their investment ideas and opportunities, combined with a general improvement
in the infrastructure. One factor that very positively influenced access to formal credit was the
connection to the market. A good market connection serves credit outreach in a twofold
manner: first, households have better access to credit-relevant information; and second,
through better market access they may find new investment opportunities. The most
appropriate tool to incorporate poorer households into the formal financial system would the
mobilization of savings. As stated by several scholars, all people can save, even the poorest of
the poor, and therefore deposit services have deeper outreach than credit (Charitonenko et al.
2004, Schreiner 2002, Zeller and Sharma 2000). Moreover, Dufhues et al. (2004a) revealed an
enormous and unmet demand for formal savings among the rural population in Northern
Vietnam.
Nevertheless, the number of access-constrained households is surprisingly low. One reason
for the low number is the weakening or eradication of former access constraints. A major
access constraint in the last decade was lack of collateral. Land use certificates are nowadays
widespread and they have only limited influence on access to formal credit. If the process of
issuing land use certificates is finally completed and/or if the VBARD and the VBSP enforce
their national policy of granting collateral-free loans, the number of households without
other variables in the model turn out to be more important. As mentioned above the correlation table did not reveal any problematic correlations between the independent variables.
27
access to the formal financial market due to lack of land use certificates will dwindle, and the
importance of land use certificates as physical collateral will become even less important.
Other access constraints, namely remoteness (distance to the nearest bank branch) and literacy
requirements of the household head, have been eradicated through locally disbursed group
credits. However, considering the anecdotal reports of very low repayment rates, the price of
eradicating these access constraints has likely been a decrease in sustainability of the formal
lenders. As Von Pischke (1991:83) points out:
“Binding financial constraints to the formal sector are not necessarily anti-developmental. If they stand in the way of bad investment, they are socially beneficial. For the financial system to make good loans and allocate funds for high-return investments, it must reject poor proposals, unfit applicants, and low-return investments. To generate good loans requires a highly selective screening of applicants.”
Nevertheless, some barriers to access continue to exist. To reduce these access barriers,
locally-oriented rather than general actions should be taken, catering to the needs and the
circumstances of those households which lack access, particularly ethnic minorities and
female-led households. Such measures will be particularly useful within the organizational
structure of the lenders themselves. Dufhues et al. (2002), for example, suggested employing
ethnic minority credit officers, which would create more awareness of those groups inside the
institution. Furthermore, special female credit officers for female-headed households could
work in the same direction. However, the recent efforts of the Vietnamese government, for
instance the establishment of the VBSP, represent an attempt to broaden access in general.
But this increase in outreach will go hand in hand with an increase in access to credit for non-
creditworthy households, thus resulting in decreased repayment rates. Moreover, it is
questionable whether households that do not have access today, or do not demand the existing
products, will demand credits from the VBSP. If rural lenders in Vietnam were one day
forced to work in a competitive environment according to market principles, there would be a
great chance that large parts of the population would be access-constrained as a result of
previous loan defaults.
Whether the breadth and depth of formal credit outreach that was financed by enormous
government subsidies contributes to poverty reduction, however, remains a subject for future
research. Finally, it should be borne in mind that the conclusions drawn in this paper are
based on a rather small and regionally limited sample. Therefore, further confirmation of the
results by a larger and more representative study would be desirable.
28
References Alther, C., J. C. Castella, P. Novosad, E. Rousseau, and T. T. Hieu. 2002. Impact of accessibility on the range of
livelihood options available to farm households in mountainous areas of Northern Vietnam. In Doi Moi in the mountains - Land use changes and farmers' livelihood strategies in Bac Kan Province, Vietnam. Castella, J. C. et al. (ed.): 121-146. Hanoi, Vietnam: The Agricultural Publishing House.
Amin, S., A. Rai, and G. Topa. 2003. Does microcredit reach the poor and vulnerable? Evidence from Northern Bangladesh. Journal of Development Economics 70 (1): 59-82.
Backhaus, K., B. Erichson, W. Plinke, and R. Weiber. 1996. Multivariate Analysemethoden - Eine anwendungsorientierte Einführung. Berlin, Germany: Springer-Verlag.
Barham, B. L., S. Boucher, and M. R. Carter. 1996. Credit constraints, credit unions, and small-scale producers in Guatemala. World Development 24 (5): 793-806.
Bastelaer van, T. 2003. Does social capital facilitate the poor's access to credit - A review of the microeconomic literature. Social Capital Initiative Working Paper No 8. Washington DC, USA: The World Bank.
Besley, T., and S. Coate. 1995. Group lending, repayment incentives and social collateral. Journal of Development Economics 46 (1): 1-18.
Bester, H. 1987. The role of collateral in credit markets with imperfect information. European Economic Review 31 (4): 887-899.
Bhushan, I., E. Bloom, N. H. Huu, and N. M. Thang. 2001. Human capital of the poor in Vietnam. Manila, Philippines: Asian Development Bank.
Binswanger, H. P., and D. A. Sillers. 1983. Risk aversion and credit constraints in farmers' decision-making: A reinterpretation. Journal of Development Studies 20 (1): 5-21.
Bond, P., and A. Rai. 2002. Collateral substitutes in microfinance. Mimeo. Accessed October 2004 at http://www.cid.harvard.edu/cidpublications/limits-july2.pdf.
Buchenrieder, G., and I. Theesfeld. 2001. Improving bankability of small farmers in Northern Vietnam. Savings and Development 24 (4): 385-403.
Castella, J. C., T. Q. Hoa, O. Husson, V. H. Nam, and D. D. Quang. 2002. The declining role of ethnicity in farm household differentiation: A case study from Ngoc Phai Commune, Cho Don district, Bac Kan Province, Vietnam. In Doi Moi in the mountains - Land use changes and farmers' livelihood strategies in Bac Kan Province, Vietnam. Castella, J. C. et al. (ed.): 47-71. Hanoi, Vietnam: The Agricultural Publishing House.
Charitonenko, S., A. Campion, and N. A. Fernando. 2004. Commercialization of microfinance: Perspectives from South and Southeast Asia. Manila, Philippines: Asian Development Bank (ADB).
Christen, R. P., E. Rhyne, R. Vogel, and C. McKean. 1995. Maximizing the outreach of microenterprise finance: An analysis of successful microfinance programs. Washington DC, USA: United States Agency for International Development (USAID).
Coleman, J. S. 1999. Social capital in the creation of human capital. In Social capital: A multifaceted perspective. Dasgupta, P. et al. (ed.): 13-39. Washington DC, USA: The World Bank.
Conning, J. 1999. Outreach, sustainability, and leverage in monitored and peer-monitored lending. Journal of Development Economics 60 (1): 51-77.
Diagne, A. 1999. Determinants of households' access to and participation in formal and informal credit markets in Malawi. FCND Discussion Paper No 67/1999. Washington DC, USA: International Food and Policy Research Institute (IFPRI) - Food Consumption and Nutrition Division (FCND).
Diagne, A., M. Zeller, and M. Sharma. 2000. Empirical measurements of household's access to credit and credit constraints in developing countries: Methodological issues and evidence. FCND Discussion Paper No 90/2000. Washington DC, USA: International Food and Policy Research Institute (IFPRI) - Food Consumption and Nutrition Division (FCND).
Dufhues, T., P. T. M. Dung, H. T. Hanh, and G. Buchenrieder. 2002. Information and targeting policies and their principal-agent relationships - The case of the Vietnam Bank for the Poor. Quarterly Journal of International Agriculture 41 (4): 335-362.
Dufhues, T., F. Heidhues, and G. Buchenrieder. 2004a. Participatory product design by using Conjoint Analysis in the rural financial market of Northern Vietnam. Asian Economic Journal 18 (1): 81-114.
Dufhues, T., U. Lemke, and I. Fischer. 2004b. Constraints and potential of livestock insurance schemes - A case study from Vietnam. Research in Development Economics and Policy. Discussion Paper No 05/2000. Stuttgart, Germany: Grauer Verlag.
Duong, P. B., and Y. Izumida. 2002. Rural development finance in Vietnam: A microeconomic analysis of household surveys. World Development 30 (2): 319-335.
Evans, T., A. M. Adams, R. Mohammed, and A. H. Norris. 1999. Demystifying non-participation in microcredit: A population-based analysis. World Development 27 (2): 419-430.
Fabbri, D., and M. Padula. 2003. Does poor legal enforcement make households credit-constrained? FAME Research Paper No 81. Geneva, Switzerland: International Center for Financial Asset Management and
29
Engineering (FAME). Accessed October 2003 at http//:www.nccr-finrisk.unizh.ch/media/pdf/fabbri_creditconstrained.pdf.
Fallavier, P. 1994. Developing microfinance institutions in Vietnam - Policy implications to set up an enabling environment. M.A. Thesis. Vancouver, Canada: School of Community and Regional Planning, University of British Columbia. Accessed June 2004 at http://www.arts.uwaterloo.ca/~vecon/download/fallavier/mfi_vnm.pdf.
Geppert, M., and T. Dufhues. 2003. Visualizing rural financial market research in Northern Vietnam through pictures. Research in Development Economics and Policy. Discussion Paper No 02/2003. Stuttgart, Germany: Grauer Verlag.
Glewwe, P., M. Gragnolati, and H. Zaman. 2002. Who gained from Vietnam's boom in the 1990's? Economic Development and Cultural Change 50 (4): 773-792.
Gottwald, K., and R. Klump. 1999. Financial reform in Vietnam: Lessons from the Asian crisis. Passau, Germany: Universität Passau.
GSO. 1995. Vietnamese Living Standard Survey 1992/93. Hanoi, Vietnam: General Statistical Office (GSO), Statistical Publishing House.
GSO. 2000. Vietnamese Living Standard Survey 1997/98. Hanoi, Vietnam: General Statistical Office (GSO), Statistical Publishing House.
Härdle, W., and L. Simar. 2003. Applied multivariate statistical analysis. Berlin, Germany: Springer Verlag. Häuser, I., T. Dufhues, and G. Buchenrieder. 2005. Reliability and applicability of different poverty
measurements - A case study from Northern Vietnam. Research in Development Economics and Policy. Discussion Paper (forthcoming). Stuttgart, Germany: Grauer Verlag.
Heidhues, F., and G. Schrieder. 1998. Rural development and financial markets in Romania. Paper presented at the 46th International Atlantic Economic Conference (IAES) in Boston, October 8-11, 1998. Boston, USA: IAES.
Heidhues, F., B. Sossoh, and G. Schrieder. 1997. Transaction costs of group and individual lending as an influencing factor of access: The case of poverty oriented microfinance in Cameroon. Sacramento, USA: Paper presented at the 22nd International Conference of Agricultural Economists (IAAE) on food security, diversification, and resource management: "Refocusing the role of agriculture". August 10-16, 1997.
Henry, C., M. Sharma, C. Lapenu, and M. Zeller. 2003. Microfinance poverty assessment tool. Washington DC, USA: The World Bank.
Hulme, D., and P. Mosley. 1996. Finance against poverty - Volume 1. London, UK: Routledge. Hung, B. D. V., and B. M. Giap. 1999. Country Report: Microfinance sector in Vietnam. Hanoi, Vietnam: Asian
Development Bank (ADB). Izumida, Y. 2003. Programmed lending for social policies - Challenges for the Vietnam Bank for Social Policies.
Report No. 03-F-02. Tokyo, Japan: The University of Tokyo. Izumida, Y., and P. B. Duong. 2001. Measuring the progress of rural finance in Vietnam. Savings and
Development 15 (2): 139-166. Karlan, D. S. 2001. Social capital and group banking. Cambridge, USA: Massachusetts Institute of Technology
(MIT), Department of Economics. Ledgerwood, J. 1999. Sustainable banking with the poor - Microfinance handbook - An institutional and
financial perspective. Washington DC, USA: The World Bank. Livingstone, I. 2000. Agriculture, small enterprise development and poverty eradication in Vietnam. Journal of
the Asia Pacific Economy 5 (3): 173-189. Luibrand, A. 2002. Transition in Vietnam - Impact of the rural reform process on an ethnic minority. Frankfurt
am Main, Germany: Peter Lang Verlag. Matin, I., D. Hulme, and S. Rutherford. 1999. Financial services for the poor and poorest: Deepening
understanding to improve provision. Finance and Development Research Programme. Working Paper No 9. Manchester, UK: University of Manchester, Institute for Development and Policy Management.
McCarty, A. 2001. Microfinance in Vietnam: A survey of schemes and issues. Hanoi, Vietnam: Department for International Development (DFID) and the State Bank of Vietnam (SBVN).
Minot, N. 2000. Generating disaggregated poverty maps: An application to Vietnam. World Development 28 (2): 319-331.
MOLISA, and UNDP. 2004. Taking stock, planning ahead: Evaluation of the national targeted program on hunger eradication and poverty reduction (135). Hanoi, Vietnam: United Nations Development Program (UNDP).
Montgomery, R. 1996. Disciplining or protecting the poor? Avoiding the social costs of peer pressure in micro-credit schemes. Journal of International Development 8 (2): 289-305.
Morduch, J. 1999. The microfinance promise. Journal of Economic Literature 37 (December): 1569-1614. Navajas, S., M. Schreiner, R. L. Meyer, and C. Gonzalez-Vega. 2000. Microcredit and the poorest of the poor:
Theory and evidence from Bolivia. World Development 28 (2): 333-346.
30
Neefjes, K. 2001. Poverty reduction amongst ethnic minorities in the mountainous areas of Vietnam - Reaching targets. Paper presented at the Poverty Task Force Workshop 17.-19.09.2001. Hanoi, Vietnam: United Nations Development Programme (UNDP).
Panjaitan-Drioadisuryo, R. D. M., and K. Cloud. 1999. Gender, self-employment and microcredit programs - An Indonesian case study. The Quarterly Review of Economics and Finance 39 (5): 769-779.
Park, A., and C. Ren. 2001. Microfinance with Chinese characteristics. World Development 29 (1): 39-62. Quach, M. H., A. W. Mullineux, and V. Murinde. 2003. Microcredit and household poverty reduction in rural
Vietnam: A cross-sectional study. Paper presented at the Development Studies Association (DSA) International Conference in Glasgow, 9-11 September 2003. Devon, UK: Development Studies Association.
Quach, M. H., A. W. Mullineux, and V. Murinde. 2004. Rural credit and household poverty reduction in Vietnam: Evidence using panel data from household surveys. Paper presented at the International Conference on Access to Finance, 28-29 October 2004. Brussels, Belgium: World Savings Bank Institutes.
Riedel, J. 2000. The role of the state and the market in the economy of Vietnam. Hanoi, Vietnam: Ministry of Planning and Investment (MIP) and United Nations Development Program (UNDP).
Ruthven, O. 2001. Money mosaics: Financial choice and strategy in West Delphi squatter settlement. Finance and Development Research Programme Working Paper No. 32. Manchester, UK: Institute for Development Policy and Management, University of Manchester.
Sarap, K. 1990. Factors affecting small farmers' access to institutional credit in rural Orissa, India. Development and Change 21 (2): 281-307.
Schmidt, R. H., and C.-P. Zeitinger. 1994. Critical issues in small and microbusiness finance. Paper presented at the seminar on financial services and the poor: U.S. and developing country experience. September 28-30. Washington DC, USA: The Brookings Institution.
Schreiner, M. 2002. Aspects of outreach: A framework for discussion on the social benefits of microfinance. Journal of International Development 14 (5): 591-603.
Senanayake, S. M. P., and D. P. Ho. 2001. What makes formal rural financial institutions successful in Vietnam? Savings and Development 15 (4): 475-489.
Sida-MARD. 1998. Strategy for rural financial services. Hanoi, Vietnam: Sweden International Development Agency (SIDA) and Ministry of Agriculture and Rural Development (MARD).
Simanowitz, A. 2000. Targeting the poor - Comparing visual and participatory methods. Small Enterprise Development 11 (1): 29-39.
Stiglitz, J. E., and A. Weiss. 1981. Credit rationing in markets with imperfect information. American Economic Review 71 (3): 393-410.
Todd, H. 1996. Cloning Grammen Bank: Replicating a poverty reduction model in India, Nepal and Vietnam. London, UK: Intermediate Technology Publications.
UNDP. 1999. Completion of Vietnam's legal framework for economic development. Hanoi, Vietnam: United Nations Development Program (UNDP).
Vaessen, J. 2001. Accessibility of rural credit in Northern Nicaragua: The importance of networks of information and recommendation. Savings and Development 25 (1): 5-32.
van de Walle, D. 2003. Are returns to investment lower for the poor? Human and physical capital interactions in rural Vietnam. Review of Development Economics 7 (4): 636-653.
VBARD. 2001. Leaflet on guidelines, pre-conditions, and procedures for loans at the VBARD (available only in Vietnamese). Hanoi, Vietnam: Vietnam Bank for Agriculture and Rural Development (VBARD).
VBARD and Danida. 1999. Agriculture sector program support - Vietnam - Component description document. Hanoi, Vietnam: Government of Vietnam and Vietnam Bank for Agriculture and Rural Development (VBARD) and Danish Ministry of Foreign Affairs (Danida).
VBP. 1999. Vietnam Bank for the Poor - Annual Report. Hanoi, Vietnam: Vietnam Bank for the Poor (VBP). Vietnam Economy. 2003. Vietnam's social policy bank established. March 12, 2003. Vietnam Economy /2003. von Pischke, J. 1991. Finance at the frontier - Debt capacity and the role of credit in the private economy.
Washington DC, USA: The World Bank. Woller, G., C. Dunford, and W. Woodworth. 1999. Where to microfinance? International Journal of Economic
Development 1 (1): 29-64. Wolz, A. 1997. The transformation of rural finance systems in Vietnam. Discussion Paper No 60. Heidelberg,
Germany: Universität Heidelberg, Forschungsstelle für Internationale Wirtschafts- und Agrarentwicklung e.V. (FIA).
World Bank. 1999. Vietnam attacking poverty - Vietnam development report 2000. Hanoi, Vietnam: The World Bank.
World Bank. 2003. Poverty - Vietnam development report 2004. Hanoi, Vietnam: The World Bank. World Bank. 2004a. Financial sector policy issue note: Vietnam Bank for Social Policies. Hanoi, Vietnam: The
World Bank. World Bank. 2004b. Governance - Vietnam development report 2005. Hanoi, Vietnam: The World Bank. World Bank, and DFID. 1999. Vietnam, voices of the poor; synthesis of participatory poverty assessments.
Hanoi, Vietnam: The World Bank and Department for International Development (DFID).
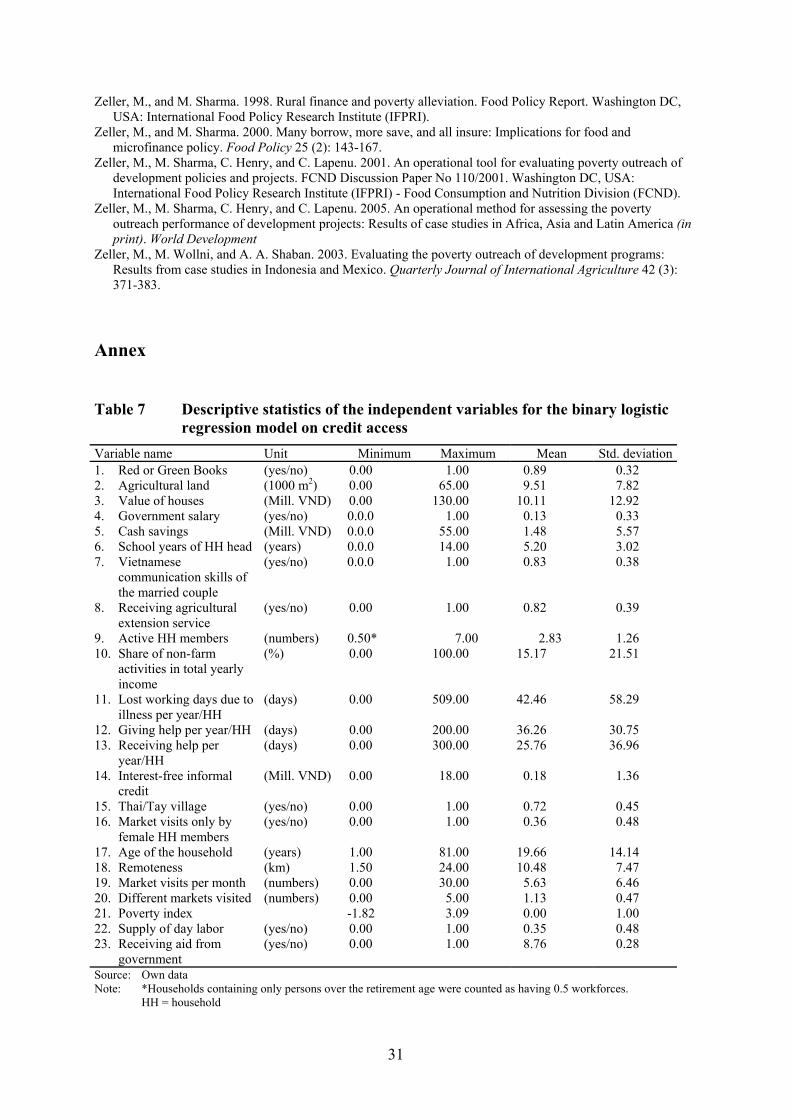
31
Zeller, M., and M. Sharma. 1998. Rural finance and poverty alleviation. Food Policy Report. Washington DC, USA: International Food Policy Research Institute (IFPRI).
Zeller, M., and M. Sharma. 2000. Many borrow, more save, and all insure: Implications for food and microfinance policy. Food Policy 25 (2): 143-167.
Zeller, M., M. Sharma, C. Henry, and C. Lapenu. 2001. An operational tool for evaluating poverty outreach of development policies and projects. FCND Discussion Paper No 110/2001. Washington DC, USA: International Food Policy Research Institute (IFPRI) - Food Consumption and Nutrition Division (FCND).
Zeller, M., M. Sharma, C. Henry, and C. Lapenu. 2005. An operational method for assessing the poverty outreach performance of development projects: Results of case studies in Africa, Asia and Latin America (in print). World Development
Zeller, M., M. Wollni, and A. A. Shaban. 2003. Evaluating the poverty outreach of development programs: Results from case studies in Indonesia and Mexico. Quarterly Journal of International Agriculture 42 (3): 371-383.
Annex
Table 7 Descriptive statistics of the independent variables for the binary logistic regression model on credit access
Variable name Unit Minimum Maximum Mean Std. deviation1. Red or Green Books (yes/no) 0.00 1.00 0.89 0.32 2. Agricultural land (1000 m2) 0.00 65.00 9.51 7.82 3. Value of houses (Mill. VND) 0.00 130.00 10.11 12.92 4. Government salary (yes/no) 0.0.0 1.00 0.13 0.33 5. Cash savings (Mill. VND) 0.0.0 55.00 1.48 5.57 6. School years of HH head (years) 0.0.0 14.00 5.20 3.02 7. Vietnamese
communication skills of the married couple
(yes/no) 0.0.0 1.00 0.83 0.38
8. Receiving agricultural extension service
(yes/no) 0.00 1.00 0.82 0.39
9. Active HH members (numbers) 0.50* 7.00 2.83 1.26 10. Share of non-farm
activities in total yearly income
(%) 0.00 100.00 15.17 21.51
11. Lost working days due to illness per year/HH
(days) 0.00 509.00 42.46 58.29
12. Giving help per year/HH (days) 0.00 200.00 36.26 30.75 13. Receiving help per
year/HH (days) 0.00 300.00 25.76 36.96
14. Interest-free informal credit
(Mill. VND) 0.00 18.00 0.18 1.36
15. Thai/Tay village (yes/no) 0.00 1.00 0.72 0.45 16. Market visits only by
female HH members (yes/no) 0.00 1.00 0.36 0.48
17. Age of the household (years) 1.00 81.00 19.66 14.14 18. Remoteness (km) 1.50 24.00 10.48 7.47 19. Market visits per month (numbers) 0.00 30.00 5.63 6.46 20. Different markets visited (numbers) 0.00 5.00 1.13 0.47 21. Poverty index -1.82 3.09 0.00 1.00 22. Supply of day labor (yes/no) 0.00 1.00 0.35 0.48 23. Receiving aid from
government (yes/no) 0.00 1.00 8.76 0.28
Source: Own data Note: *Households containing only persons over the retirement age were counted as having 0.5 workforces. HH = household
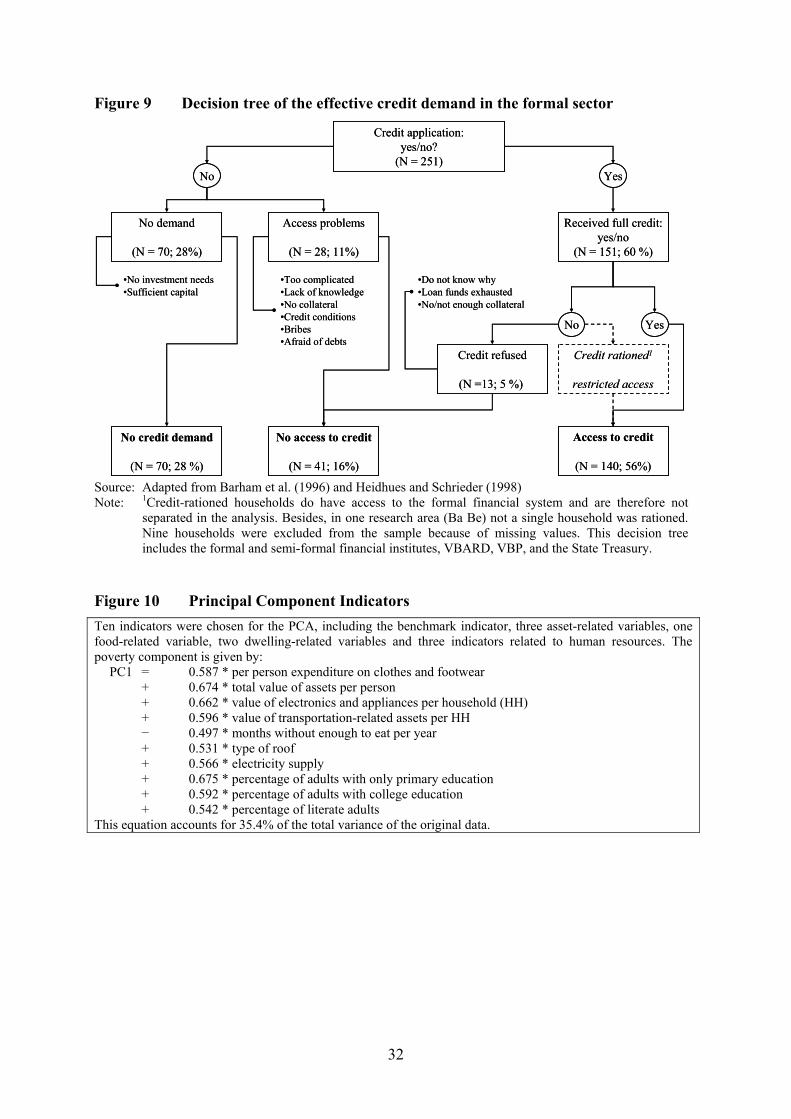
32
Figure 9 Decision tree of the effective credit demand in the formal sector
Credit application:yes/no?
(N = 251)
Received full credit:yes/no
(N = 151; 60 %)
No demand
(N = 70; 28%)
Access problems
(N = 28; 11%)
No credit demand
(N = 70; 28 %)
No access to credit
(N = 41; 16%)
No Yes
YesNo
Credit refused
(N =13; 5 %)
Credit rationed1
restricted access
Access to credit
(N = 140; 56%)
•No investment needs•Sufficient capital
•Too complicated•Lack of knowledge•No collateral•Credit conditions•Bribes•Afraid of debts
•Do not know why•Loan funds exhausted•No/not enough collateral
Source: Adapted from Barham et al. (1996) and Heidhues and Schrieder (1998) Note: 1Credit-rationed households do have access to the formal financial system and are therefore not
separated in the analysis. Besides, in one research area (Ba Be) not a single household was rationed. Nine households were excluded from the sample because of missing values. This decision tree includes the formal and semi-formal financial institutes, VBARD, VBP, and the State Treasury.
Figure 10 Principal Component Indicators Ten indicators were chosen for the PCA, including the benchmark indicator, three asset-related variables, one food-related variable, two dwelling-related variables and three indicators related to human resources. The poverty component is given by:
PC1 = 0.587 * per person expenditure on clothes and footwear + 0.674 * total value of assets per person + 0.662 * value of electronics and appliances per household (HH) + 0.596 * value of transportation-related assets per HH − 0.497 * months without enough to eat per year + 0.531 * type of roof + 0.566 * electricity supply + 0.675 * percentage of adults with only primary education + 0.592 * percentage of adults with college education + 0.542 * percentage of literate adults
This equation accounts for 35.4% of the total variance of the original data.
33
Recent Discussion Papers
No. 01/1999 Heidhues, F. and G. Schrieder, Rural Financial Market Development. No. 02/1999 Heidhues, F., C. Karege, B. Schaefer and G. Schrieder, The Social Dimension of
Policy Reforms. No. 03/1999 Heidhues, F., W. Erhardt, A. Gronski and G. Schrieder, The Social Dimension of
Policy Reforms and World Bank Case Studies. No. 04/1999 Erhardt, W., Credit for Poor and Low-Income Entrepreneurs in Urban and Rural
Northern Thailand. No. 05/1999 Senahoun, J., F. Heidhues and D. Deybe, Structural Adjustment Programs and Soil
Erosion: A Bio-Economic Modelling Approach for Northern Benin. No. 06/1999 Kyi, T. and M. von Oppen, An Economic Analysis of Technical Efficiency of Rice
Farmers at the Delta Region in Myanmar. No. 07/1999 Schrieder, G., J. Munz, and R. Jehle, Rural Regional Development in Transition
Economies: Country Case Romania. No. 08/1999 Hartwich, F. and T. Kyi, Measuring Efficiency in Agricultural Research: Strength and
Limitations of Data Envelopment Analysis (DEA). No. 09/1999 Hartwich, F., Weighting of Agricultural Research Results: Strength and Limitations of
the Analytic Hierarchy Process. No. 01/2000 Neubert, D., Poverty Alleviation as Intervention in Complex and Dynamic Social
Fields. No. 02/2000 Neef, A., C. Sangkapitux and K. Kirchmann, Does Land Tenure Security Enhance
Sustainable Land Management? - Evidence from Mountainous Regions of Thailand and Vietnam.
No. 03/2000 Breitschopf, B. and G. Schrieder, The Development of the Rural Nonfarm Sector in Transition Economies – Implication of Capital Intensity on Labor Productivity and Employment.
No. 04/2000 Erhardt, W., Urban Bias in Reverse: Have Urban Small Enterprises Been Neglected by Policy Makers and Bankers in Thailand?
No. 05/2000 Senahoun, J., F. Heidhues and D. Deybe, Impact of Agricultural Policy and Food Security: An Agricultural Sector Modelling Approach for Benin.
No. 06/2000 Heidhues, F., Globalisierung, Einkommensverteilung und ländliche Regionalentwicklung in Entwicklungsländern.
No. 07/2000 Heidhues, F., The Future of World, National and Household Food Security. No. 08/2000 Buchenrieder, G. (née Schrieder) and I. Theesfeld, Improving Bankability of Small
Farmers in Northern Vietnam. No. 09/2000 Dufhues, T.B., Economic Appraisal of Sugarcane Production in Peasant Households
in the Son La Province, Northern Vietnam. No. 10/2000 Heuft, A. and G. Buchenrieder (née Schrieder), Decentralisation in Peru’s
Agricultural Policy: A Critical Review from 1993 to 1998. No. 01/2001 Knüpfer, J., Landnutzungsentscheidungen ethnischer Minderheiten im Kontext der
institutionellen Rahmenbedingungen Nordthailands. No. 02/2001 Daude, S., WTO and Food Security: Strategies for Developing Countries. No. 03/2001 Knüpfer, J. and G. Buchenrieder, Rural Poverty Alleviation Through Non-farm
Income in Transition Economies. No. 04/2001 Dufhues, T., P.T.M. Dung, H.T. Hanh, and G. Buchenrieder, Fuzzy Information Policy
of the Vietnam Bank for the Poor in Lending to and Targeting of the Poor in Northern Vietnam.
No. 01/2002 Brüntrup, M. and F. Heidhues, Subsistence Agriculture in Development: Its Role in Processes of Structural Change.
No. 02/2002 Alker, D. and F. Heidhues, Farmers’ Rights and Intellectual Property Rights – Reconciling Conflicting Concepts.
34
No. 03/2002 Buchenrieder, G., J. Knüpfer and F. Heidhues, A Cross-Country Comparison of Non-farm Rural Employment in the Balkans.
No. 04/2002 Knüpfer, J., S. Xhema und G. Buchenrieder, Armutsreduzierung durch Einkommens-diversifizierung - Eine Studie im ländlichen Kosovo.
No. 01/2003 Dufhues, T., G. Buchenrieder, F. Heidhues and Pham Thi My Dung, Towards demand-driven financial services in Northern Vietnam: A participatory analysis of customer preferences.
No. 02/2003 Geppert, M. and T. Dufhues, Visualizing rural financial market research in Northern Vietnam through pictures.
No. 01/2004 Nguyen Manh Hai and F. Heidhues, Comparative advantage of Vietnam’s rice sector under different liberalisation scenarios – A Policy Analysis Matrix (PAM) study.
No. 02/2004 Breisinger, C. and F. Heidhues, Regional Development Perspectives in Vietnam – Insights from a 2002 Provincial Social Accounting Matrix (SAM).
No. 03/2004 Basu, A.K. and M. Qaim, On the Distribution and Adoption of Genetically Modified Seeds in Developing Countries.
No. 04/2004 Fischer, I., Media Supported Communication in Agricultural Extension and Participatory Rural Development in Northern Thailand
No. 05/2004 Dufhues, T., U. Lemke and I. Fischer, Constraints and Potential of Livestock Insurance Schemes – A Case Study from Vietnam
No. 06/2004 Neef, A. and D. Neubert, Assessing Participation in Agricultural Research Projects: An Analytical Framework
No. 01/2005 Dufhues, T. and G. Buchenrieder, Outreach of credit institutes and households’ access constraints to formal credit in Northern Vietnam