discussion on a thermometer for financial instability in ... · pdf filea thermometer for...
TRANSCRIPT
authors: R Baviera and D Lebovitz
Parma - January 29, 2015
A THERMOMETER FOR FINANCIAL INSTABILITY IN THE EURO AREA ECONOMY AND THE ROLE OF CARRY TRADE
discussant: C Sabelli
discussion on

Summary
Identification of systemic risk → macro prudential supervisory and regulatory measures.
Aim: build a financial instability indicator (FSI) which takes care of the key features of the economy under analysis.
The authors identify as key element for the EU economy the Sovereign Default risk, as it is related to the risk of a Break Up of the monetary union.
Characteristics of the FSI should be: simple, discrete and market-based.
1/5
Country index for the two largest peripheral countries of the EU area → aggregate taking the maximum between the two.
To assess the plausibility of the index they look at the “time coincidence” between Red lights and ECB unconventional measures.
The ASW spread curve measures the quality of the access to the primary marker for government bond issues.

Results: Italy
2/5
0!1!2!3!4!5!6!
Jan-07! Jan-08! Jan-09! Jan-10! Jan-11! Jan-12! Jan-13! Jan-14!
[y]!
Time!
-400!
-200!
0!
200!
400!
Jan-07! Jan-08! Jan-09! Jan-10! Jan-11! Jan-12! Jan-13! Jan-14!
[bps/y] !
Slope!
-100!0!
100!200!300!400!500!
Jan-07! Jan-08! Jan-09! Jan-10! Jan-11! Jan-12! Jan-13! Jan-14!
[bps]!
Asset Swap Spread!
ECS-1! SMP-1! SMP-2! OMT!LTRO!ECS-2!
Figure 5: Time evolution of the three indicators for Italian BTPs. We indicate with a greyshaded colour the time interval characterized by an average monthly spread constantly below20 bps (up to February ’08), called “period of relative quiet” in the text. The three zones ofmarket turbulence are identified.
300!
350!
400!
450!
500!
550!
600!
650!
700![bps]! Italian curve on 8th November 2011!
300!
350!
400!
450!
500!
550!
600!
650!
700![bps]! Italian curve on 9th November 2011!
Figure 6: We compare Asset Swap spread curve, in bps, for Republic of Italy on the twoconsecutive days, the 8th and 9th of November 2011. We observe that inversion occurs abruptly,from one day to the other.
14
Results: Spain
3/5
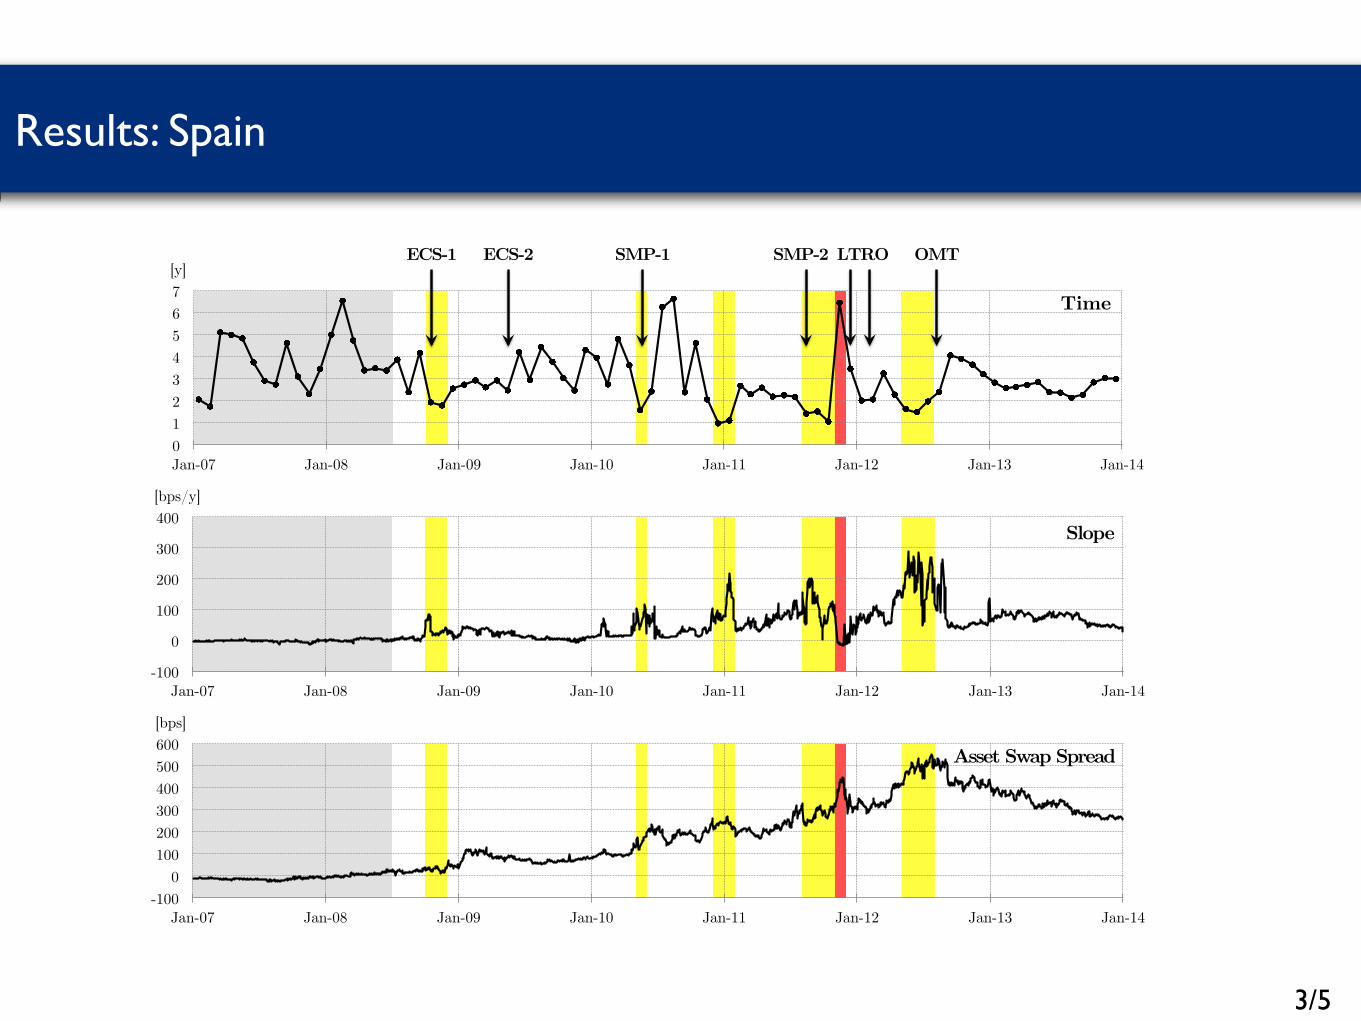
information comes from analyzing the full shape of spread curve instead of consideringjust the value of the 10y-spread (a too-coarse scalar index).
0!1!2!3!4!5!6!7!
Jan-07! Jan-08! Jan-09! Jan-10! Jan-11! Jan-12! Jan-13! Jan-14!
[y]!
Time!
-100!
0!
100!
200!
300!
400!
Jan-07! Jan-08! Jan-09! Jan-10! Jan-11! Jan-12! Jan-13! Jan-14!
[bps/y] !
Slope!
-100!0!
100!200!300!400!500!600!
Jan-07! Jan-08! Jan-09! Jan-10! Jan-11! Jan-12! Jan-13! Jan-14!
[bps]!
Asset Swap Spread!
ECS-1! SMP-1! SMP-2! OMT!LTRO!ECS-2!
Figure 7: Time evolution of the three indices for Spanish government bonds. We indicate witha grey shaded colour the period characterized by an average monthly spread constantly below 20bps (up to June ’08); we also identify the zones of market turmoil with yellow and red colours.
Results for Spain are shown in Figure 7. As in the Italian case time goes below the2year threshold for the first time after the Lehman default. The so called Greek crisisis signalled both at the beginning (in May 2010) and at the end (in December 2010 andJanuary 2011); in the Spanish case, just after the SMP-1 unconventional measure, timegoes above the 2year threshold. A financial stress is signalled again for the major-GIPSIcrisis on the second half of 2011; also for the Kingdom of Spain we observe a slope inversionin November 2011. The last crisis period is the one related to the so-called Spanish crisisthat was followed by the announcement of the OMT program.It is probably useful to observe that this last crisis is not indicated by our country-indexfor Italy, even if the 10y spread was approximately at the level reached during the apexof the crisis on previous November. However, in the first quarter of 2012 the Italiansituation was normalizing with a technocratic government lead by Mr Monti and theproposed index reveals that the observed spread movement is due to contagion. Clearlyno indicator based uniquely on the value of the 10y spread can distinguish between thetwo situations and correctly select the dysfunctional market event.
15

Results: Aggregate
4/5
3.3 ECB response to market stress events: unconventional mea-sures as a macroprudential policy instrument
Figure 8 shows how the suggested thermometer works and it is compared with ECBunconventional measures. Each month has one thermometer colour. We observe thatthe intervention of the policy maker follows the start of a yellow area for one of the twocountries.
J 08
SMP-1
SMP-2
LTRO OMTITALY
SPAINJ 09 J 10 J 11 J 12 J 13
ECS-1
ECS-2
Figure 8: Zones of restricted primary market access (Yellow) and severe market disruption(Red) highlighted by the proposed thermometer.
After the beginning of a stress event indicated by the suggested FSI, ECB adopts anunconventional measure within the next quarter, the typical intervention lag for a policymaker. In particular after the red area, ECB implemented the 3y-LTRO: the situationfully justified the relevance of this measure.The only exception to this pattern in the use of unconventional measures is the ECS-2, announced on May 2009. In this case our opinion is that ECB overreacted to thebanking crisis that followed the Lehman default, probably due to the fact that it wasoperating in uncharted territories. The apex of the crisis was probably over: on the 2nd
of April, during the G20 Leaders’ Summit on Financial Markets and the World Economy,the leaders pledged more than 1 trillion dollars to tackle the global crisis and all equitymarkets started a positive trend.
We have shown that crisis events have been followed by ECB unconventional measures,their timing and intensity – together with a smart communication – being the source oftheir e↵ectiveness. Credibility of ECB unconventional measures is a two-sided story. Onone side we have the message: ECB “is ready to do whatever it takes to preserve theeuro. And believe me, it will be enough” [11]. On the other side we have the promptresponse with an unconventional measure each time a market dysfunction (Yellow marketsignal) or even a severe market disruption (Red) takes place.In this study we show that ECB response is simple and unambiguous with an actualalignment between words and deeds: each time a market light turns to Yellow, ECB isready to put in place an unconventional measure (whatever it takes) and the mostrelevant initiative is activated (enough) when the Red light is on.
We claim that ECB unconventional measures have not been only monetary polices – i.e.related to the transmission mechanism that helps to ensure that market reference interestrate tracks the desired rate – but they have played also a macroprudential role in orderto cope with the systemic crisis.This fact should not surprise. The current crisis has underlined the need of macropruden-tial policies and authorities which should oversee systemic risk. Systemic risk regulatorshave been created with an appropriate mandate and tools to identify, assess and regulatesystemic risks in order to respond to emerging threats to the stability of the financial
16
financial distress and their severity, related to the possibility of having a seamless access tothe primary market of these two countries. The aggregate indicator at the euro area levelis just the maximum of the indicators obtained at country level. ECB unconventionalmeasures o↵er a unique opportunity for verifying the quality of the financial stress signalproduced by the proposed FSI: at the end of this section we analyse the link between thesignalled crisis episodes and ECB unconventional measures.
3.1 ECB unconventional measures
Due to the abundance of taxonomies currently available in the literature we briefly sum-marize in Table 1 the six main unconventional measures put in place by ECB.
Acronym Description Date AmountECS-1 Enhanced Credit Support (Part 1)7 Oct ’08 unquantifiableECS-2 Enhanced Credit Support (Part 2)8 May/Jun ’09 e470 blnSMP-1 Securities Market Program (Part 1)9 May ’10 e70 blnSMP-2 Securities Market Program (Part 2) Aug ’11 e140 blnLTRO 3y-Long Term Repo Dec ’11/Feb ’12 e1030 blnOMT Outright Monetary Transactions10 Aug ’12 unused
Table 1: The six sets of unconventional measures activated by ECB, with the date of announce-ment/realization and the amount involved.
The first two sets of non-standard measures are called Enhanced Credit Support, afterthe well-known speech of ECB President at the University of Munich [29], and they fo-cus mainly on the banking system, aiming at ensuring the transmission of policy rates.The Enhanced Credit Support (ECS) consists in a host of unconventional measures thatcan be divided schematically into two sets. The first part of these measures (ECS-1)was announced by ECB on the 15th of October 2008 [13], one month after Lehman’sdefault and involved: i) unlimited provision of liquidity through fixed rate tenders withfull allotment, ii) extension of the list of collateral assets and iii) liquidity provisions inUS dollars through FX swaps with Federal Reserve. The exact amount involved by thisunconventional measure is di�cult to estimate, but in any case is well below e1 trillion.With the second part of the program (ECS-2), announced on the 7th of May 2009 [14], the12month Long Term Refinancing Operation (12m-LTRO) and the Covered bond purchaseprogramme have been created. This measure had an impact on the Eurosystem’s consol-idated balance sheet of less than e500 bln11. On the 10th of May 2010 ECB announced
7Unlimited liquidity provision through fixed rate tenders with full allotment, extension of the list ofassets eligible as collateral, US dollar liquidity provision through FX swaps.
812month LTRO and Covered Bonds Purchase Program.9Measure in conjunction with the Greek Loan for e110 bln by EU/IMF.
10Measure in conjunction with the financial assistance to Spain announced by EU for e100 billions andrealized via the ESM that disbursed a total of e41.3 billions for the recapitalization of country’s bankingsector.
11The total amount allotted in the first 12m-LTRO on the 24th of June 2009 was e442 bln.
12

Some questions
Methodological: the authors build a financial stability indicator (FSI) !“[…] particularly suited for a policy maker […] a FSI should not be used as a black box to determine policy action, but as an indicator of the need of a more detailed quantitative and qualitative analysis.”
!then they assess the plausibility of their FSI !“by verifying whether the European Central Bank responded to the identified episodes of financial stress with an unconventional measure within the next quarter and by quantifying the intensity of its response.” !Are they assuming that each intervention of the ECB was appropriate and timely?
5/5
Technical: the authors seems to quantify the plausibility of their index looking at the causality relations with ECB unconventional measures. A quantitative measure of causality is feasible?
Dependence of the results on the model parameters: different choices for the Time-To-Structural-Change and Spread thresholds, or different choices of the peripheral EU countries would produce similar results?