discussion of bigbench: a proposed industry standard ... · pdf @sap.com, ... ake schema is...
TRANSCRIPT
Discussion of BigBench:A Proposed Industry Standard Performance
Benchmark for Big Data
Chaitan Baru2, Milind Bhandarkar11, Carlo Curino8, Manuel Danisch1,Michael Frank1, Bhaskar Gowda7, Hans-Arno Jacobsen9, Huang Jie7, DileepKumar4, Raghu Nambiar3, Meikel Poess10, Francois Raab6, Tilmann Rabl1,9,
Nishkam Ravi4, Kai Sachs12, Saptak Sen5, Lan Yi7, and Choonhan Youn2
1 bankmark2 Center for Large-scale Data Systems
3 Cisco Systems4 Cloudera
5 Hortonworks6 Infosizing
7 Intel Corporation8 Microsoft Corporation
9 Middleware Systems Research Group10 Oracle Corporation
11 Pivotal12 SPEC Research Group
[email protected], [email protected], [email protected],[email protected], [email protected],
[email protected], [email protected], [email protected],[email protected], [email protected], [email protected],[email protected], [email protected], [email protected],
[email protected], [email protected], [email protected]
Abstract. There is a huge interest in mining the treasures that can befound in big data. New storage systems and processing paradigms allowfor ever larger data sets to be collected and analyzed. The high demandand rapid development has led to a sizable ecosystem of big data pro-cessing systems. Due to the lack of standards and standard benchmarks,users have a hard time choosing the right systems for their requirements.To solve this problem, we have developed BigBench. BigBench is the firstend-to-end big data analytics benchmark suite. In this paper, we willanalyze the BigBench workload from technical aspects as well as froma business point of view. We will categorize the queries along differentdimensions and analyze their runtime behavior. Furthermore, we discussthe relevancy of the workload from an industrial point of view and pro-pose additional extensions to achieve extended coverage of typical bigdata processing use cases.
1 Introduction
Enterprises everywhere appear to be reaching a tipping point with data. Largeamounts of data are being accumulated; data continue to arrive from ever in-
creasing number of sources, and at increasing rates; and most applications re-quire integration of data from multiple heterogeneous sources. These data needto be queried and analyzed to support enterprise applications. Organizationsview this data as a “natural resource” from which they could potentially extractsignificant value for the enterprise. Indeed, this phenomenon, referred to as “bigdata”, is the driving force behind major commercial investments in hardwareand software. In the current landscape of enterprise big data systems, two ma-jor architectures dominate the analytics market: parallel database systems andHadoop-style batch-oriented systems. While there have been several studies thathave attempted to compare and contrast these two approaches, what is lacking isa benchmark specification that can be used to objectively compare systems witheach other. Furthermore, big data hardware and software vendors are rapidlyevolving their systems to meet the applications needs and demands of these bigdata applications. In some cases, there is a common approach emerging, suchas increased support for SQL-like functions, or better support for online queryprocessing, rather than just batch processing. As vendors begin to incorporatesimilar features and compete in the same markets, it become essential to haveobjective benchmarks that can be used to compare system performance, as wellas price/performance and energy consumption.
Thus far, due to lack of existing, accepted standards, vendors have beenforced to run ad hoc benchmarks, or simple benchmarks which may not reflect theeventual workload encountered by the systems. Furthermore, they have not hadto provide full disclosures regarding system performance. An industry standardwill be able to address such shortcomings, thus improving the overall situation.
We propose BigBench as a first, important step in moving towards a setof rigorous benchmarks for big data systems. Similar to the well-known TPCbenchmarks, BigBench is an “application-level” benchmark. It captures opera-tions performed at an application level via SQL queries and data mining oper-ations, rather than low level operations such as, say, file I/O, or performance ofspecific function such as sorting or graph traversal.
In this paper, we provide a detailed discussion of the BigBench specifica-tion, including the database and the workload. In the process of developingBigBench, we have obtained feedback from leading industry experts about therelevance as well as completeness of the workload. After a technical discussionof the benchmark and a discussion of sample runs on two different “small” and“large” platforms, we provide a summary of the feedback as well as ideas forfuture extensions to the benchmark. We recognize that “big data” is a complexas well as evolving space. BigBench represents only the first step towards pro-viding a systematic way of benchmarking big data systems. We expect that bigdata benchmarking will need to be an agile activity for the near-term future,in order to both keep pace with changing technological trends and the evolvingapplication requirements in this area.
The paper is organized as follows. Section 2 describes benchmarking effortsand activity relevant to big data and to BigBench. Section 3 provides an overviewof the BigBench benchmark, followed immediately by a description of the ex-
periments performed on the small and large test platforms in Section 4. Section5 summarizes the characteristics of the BigBench schema as well as the queriesin the workload. Section 6 discusses the community feedback that was provided.Based on this, some possible future extensions to BigBench are presented inSection 7. Including a broad range of features within a single benchmark wouldlikely make the benchmark unwieldy, difficult to understand, difficult and ex-pensive to implement and, most important, difficult to interpret the results. Ourgoal is to capture community feedback, and use the information to develop aroadmap of big data benchmarks, rather than incorporating all features into asingle unwieldy benchmark. Section 8 elaborates on the additional steps neededto make BigBench an industry standard benchmark, based on experience withbenchmarks like the TPC. Finally, the paper concludes with Section 9.
2 Related Work
A number of different efforts are currently underway for developing benchmarksfor different aspects of big data systems. For example, TPC-H [14] and TPC-DS[12] benchmarks, developed by the Transaction Processing Performance Council,have been used for benchmarking big data systems. The TPC-H benchmark hasbeen implemented in Hadoop, Pig, and Hive [18, 5]. A subset of TPC-DS hasbeen used to compare query performance with implementations using Impala andHive. However, while they have been used for measuring performance of big datasystems, both TPC-H and TPC-DS are both “pure SQL” benchmarks and, thus,do not cover the new aspects and characteristics of big data and big data systems.Indeed, several proposals have been put forward to modify TPC-DS–similar towhat we propose here for BigBench–to cover typical big data use cases. Zhao etal. propose Big DS, which extends the TPC-DS model with social marketing andadvertisement [23]. Currently, Big DS is in an early stage of design–a data modeland query set are not available. However, we believe that once the benchmarkhas been better defined, it would be possible to complement BigBench with theextensions proposed by Big DS. Another TPC-DS variant is proposed by Yiand Dai as part of the HiBench ETL benchmark suite [8]. The authors use theTPC-DS model to generate web logs similar to BigBench. Once again this canbe included in BigBench in future. Several other proposals have been made forcomponent benchmarks that test specific functions of big data systems. Notableexamples are the Berkeley Big Data Benchmark, the benchmark presented byPavlo et al. [13], and BigDataBench, a suite similar to HiBench and mainlytargeted at hardware benchmarking [20]. Although interesting and useful, thesebenchmarks do not present an end-to-end scenario and thus have a differentfocus than BigBench.
In November 2013, the TPC announced the creation of a Big Data WorkingGroup (TPC-BD) 13, which recently released the TPCx-HS benchmark (TPCExpress Benchmark for Hadoop Systems) in August 2014 14. TPCx-HS is based
13 www.tpc.org/tpcbd/14 www.tpc.org/information/other/tpcx-hs\%20press\%20release_final.pdf

on the Hadoop TeraSort benchmark, which is a relatively simple sorting-basedbenchmark. Terasort is based on an annual sorting competition15.
Additionally, there are active efforts in the database community as well asthe high-performance computing community in the area of graph benchmarks.A well-known graph benchmark is the Graph 500, developed by the HPC com-munity[11]. Official benchmark results are published in the Graph 500 list 16.Another example is LinkBench [1], a benchmark that models the social graph ofa social application. A general discussion of graph database benchmarks can befound in [6].
3 BigBench Overview
BigBench [7] is an end-to-end big data benchmark based on TPC-DS [15],TPC’s latest decision support benchmark. TPC-DS is designed with a multiple-snowflake schema populated with structured data allowing the exercise of allaspects of commercial decision support systems, built with a modern databasemanagement system. The snowflake schema is designed using a retail modelconsisting of three sales channels, store, web and catalog, plus an inventory facttable. BigBench’s schema uses the data of the store and web sales distributionchannel of TPC-DS and augments it with semi-structured and unstructureddata.
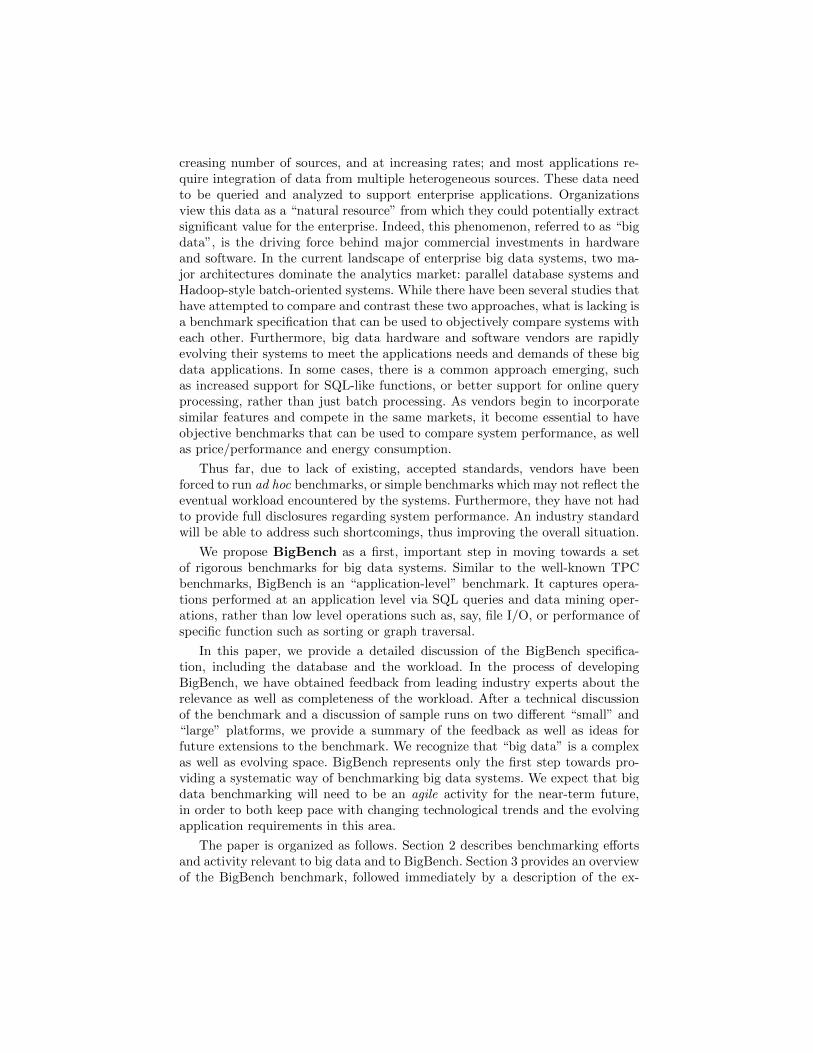
Fig. 1. BigBench Logical Data Schema
The semi-structured part captures registered and guest user clicks on theretailers website. Some of these clicks are for completing a customer order. As
15 http://sortbenchmark.org16 http://www.graph500.org/
shown in Figure 1, the semi-structured data is logically related to the WebPage, Customer and Sales tables in the structured part. The design assumesthe semi-structured data to be a key-value format, similar to Apache web serverlog format. Typically, database and MR systems would convert this format toa table with the following five columns (DateID, TimeID, SalesID, WebPageID,UserID). However, such conversion is not required as some systems may chooseto run analytics on the native key-value format.
Product reviews–a growing source of data in online retail sales–is used forpopulating BigBench’s unstructured part of its data model. Figure 1 shows prod-uct reviews on the right-hand side, and its relationship to Item, Sales, and Cus-tomer tables in the structured part. A possible implementation for the productreviews data is via a single table with the structure: (DateID, TimeID, SalesID,ItemID, ReviewRating, ReviewText).
BigBench employs a data generator that is based on PDGF [17], a paralleldata generator capable of producing large amounts of data in a scalable and highperformance fashion. PDGF plugins, which are java extensions, enable the pro-gram to generate data for any arbitrary schema. Using such plugins, PDGF cangenerate data for all three parts of the BigBench schema, viz., structured, semi-structured and unstructured. The weblogs, representing the semi-structured partof the schema, are generated using a key-value plugin. Product reviews (the un-structured part) are generated using a Markov Chain plugin. The algorithm pro-duces synthetic text by extracting key words from sample input into a dictionaryand applying Markov Chain techniques to generate arbitrary text. Sample datafor BigBench was taken from publicly available data at the Amazon website. ForBigBench, PDGF is programmed to generate any data size between 1GB and1PB, with some tables, e.g. Customers, scaling sublinearly, to avoid unrealistictable sizes, while other large tables, e.g. Sales and Returns, scale linearly.
The BigBench query workload includes 30 queries, of which ten queries thatoperate only on the structured part of the schema have been taken from theTPC-DS workload. The remaining 20 queries were adapted from a McKinseyreport on big data use cases and opportunities [9]. Of those, 7 queries run onthe semi-structured part of the schema; 6 queries run on the unstructured part;and the remaining 3 run on the structured part.
Similar to many current big data systems, BigBench also employs batch-oriented processing. Following the precedent established by other, similar bench-marking efforts, the preferred performance metric is a single, “abstract” valuethat is used for comparing end-to-end performance of different big data sys-tems. Thus, the proposed metric, which is loosely based on the TPC-DS metric,includes the following [16]:
– TL: Execution time of the loading process;
– TP : Execution time of the power test;
– TTT1 : Execution time of the first throughput test;
– TDM: Execution time of the data maintenance task.
– TTT2 : Execution time of the second throughput test;
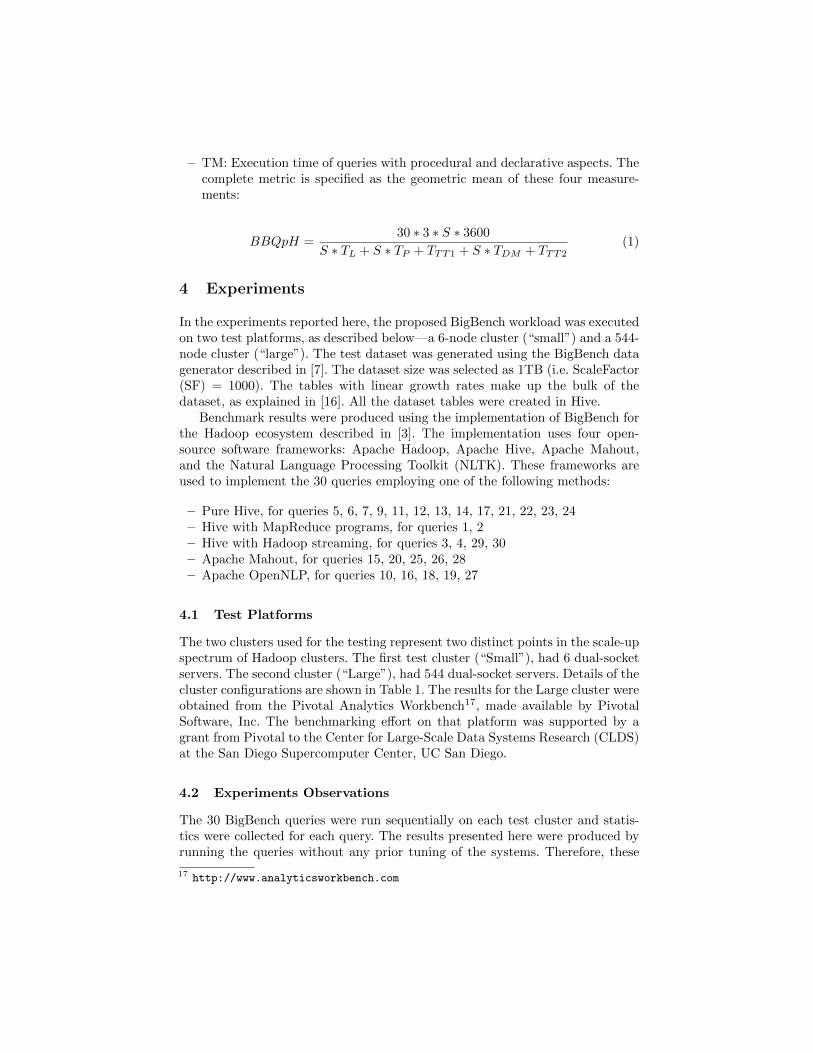
– TM: Execution time of queries with procedural and declarative aspects. Thecomplete metric is specified as the geometric mean of these four measure-ments:
BBQpH =30 ∗ 3 ∗ S ∗ 3600
S ∗ TL + S ∗ TP + TTT1 + S ∗ TDM + TTT2(1)
4 Experiments
In the experiments reported here, the proposed BigBench workload was executedon two test platforms, as described below—a 6-node cluster (“small”) and a 544-node cluster (“large”). The test dataset was generated using the BigBench datagenerator described in [7]. The dataset size was selected as 1TB (i.e. ScaleFactor(SF) = 1000). The tables with linear growth rates make up the bulk of thedataset, as explained in [16]. All the dataset tables were created in Hive.
Benchmark results were produced using the implementation of BigBench forthe Hadoop ecosystem described in [3]. The implementation uses four open-source software frameworks: Apache Hadoop, Apache Hive, Apache Mahout,and the Natural Language Processing Toolkit (NLTK). These frameworks areused to implement the 30 queries employing one of the following methods:
– Pure Hive, for queries 5, 6, 7, 9, 11, 12, 13, 14, 17, 21, 22, 23, 24– Hive with MapReduce programs, for queries 1, 2– Hive with Hadoop streaming, for queries 3, 4, 29, 30– Apache Mahout, for queries 15, 20, 25, 26, 28– Apache OpenNLP, for queries 10, 16, 18, 19, 27
4.1 Test Platforms
The two clusters used for the testing represent two distinct points in the scale-upspectrum of Hadoop clusters. The first test cluster (“Small”), had 6 dual-socketservers. The second cluster (“Large”), had 544 dual-socket servers. Details of thecluster configurations are shown in Table 1. The results for the Large cluster wereobtained from the Pivotal Analytics Workbench17, made available by PivotalSoftware, Inc. The benchmarking effort on that platform was supported by agrant from Pivotal to the Center for Large-Scale Data Systems Research (CLDS)at the San Diego Supercomputer Center, UC San Diego.
4.2 Experiments Observations
The 30 BigBench queries were run sequentially on each test cluster and statis-tics were collected for each query. The results presented here were produced byrunning the queries without any prior tuning of the systems. Therefore, these
17 http://www.analyticsworkbench.com

Table 1. Configuration of Test Clusters
Cluster Configuration Small Large
Processor per Node 2 x Xeon E5-2680 v2 @2.80GHz 2 x Xeon X5670 @2.93GHzCore/Thread per Node 20/40 12/24Main Memory per Node 128GB 48GBStorage per Node 12 x 2TB HDD 7.2Krpm 12 x 2TB HDD 7.2KrpmTotal HDFS Storage 90TB 9,420TBCluster Interconnect 10Gb Ethernet 10Gb InfinibandOS Type CentOS 6.5 RHEL 6.1 64-bitHadoop Version Cloudera CDH5 Pivotal HD 2.0.1JDK Version 1.7 1.7Name Node 1 1Data Node/Tasker Node 4 542Hive Server 1 1
results represent raw, “out of the box” performance of these two test systems.While we should expect that the performance of a number of the queries couldbe significantly improved with careful tuning, the analysis of the data collectedin this initial set of test provides useful insights into the overall characteristiscof the workload and, hence, its applicability of the benchmark.
The first step of the experiment consisted in loading a 1TB scale factor dataset into the Hive tables. On the Large cluster this operation took almost twotimes as long as on the Small cluster(87min vs. 48 min). This behavior is thefirst evidence that a 1TB scale, while appropriate for the Small cluster with4 data nodes, is vastly undersized for the Large cluster with 542 data nodes.Staging and replicating a relatively small amount of data over a large numberof Hive data nodes results in a data management overhead that dominates theperformance of the data ingestion process.
In the next step of the experiment, the queries were run in a serial sequence.The execution time was collected for each query. Table 2 presents the queryexecution times as measured on both the Small and Large clusters. Note thatsome queries executed on the Large cluster are labeled with N/C as they didnot complete successfully. It is expected that execution times will be reportedfor these queries in the camera ready version of this paper.
Comparing the query execution times between the two clusters highlightsthe lack of tuning prior to query execution as well as the over-scaling of theLarge cluster given the relatively small data set for a cluster of that size. Somequeries are highl parallelizable and are, thus, able to take advantage of the vastlysuperior resources of the larger cluster to perform queries much faster than onthe smaller cluster. However, a number of queries perform slower on the largecluster, likely due to the under-scaling of the data set and the lack of tuning.
Additional insight can be gained by examining the system utilization statis-tics collected on the Small cluster during the experiment. Two queries are pre-sented here to exemplify the two main scenarios that were observed. In the firstscenario, the query naturally takes advantage of the resources provided without
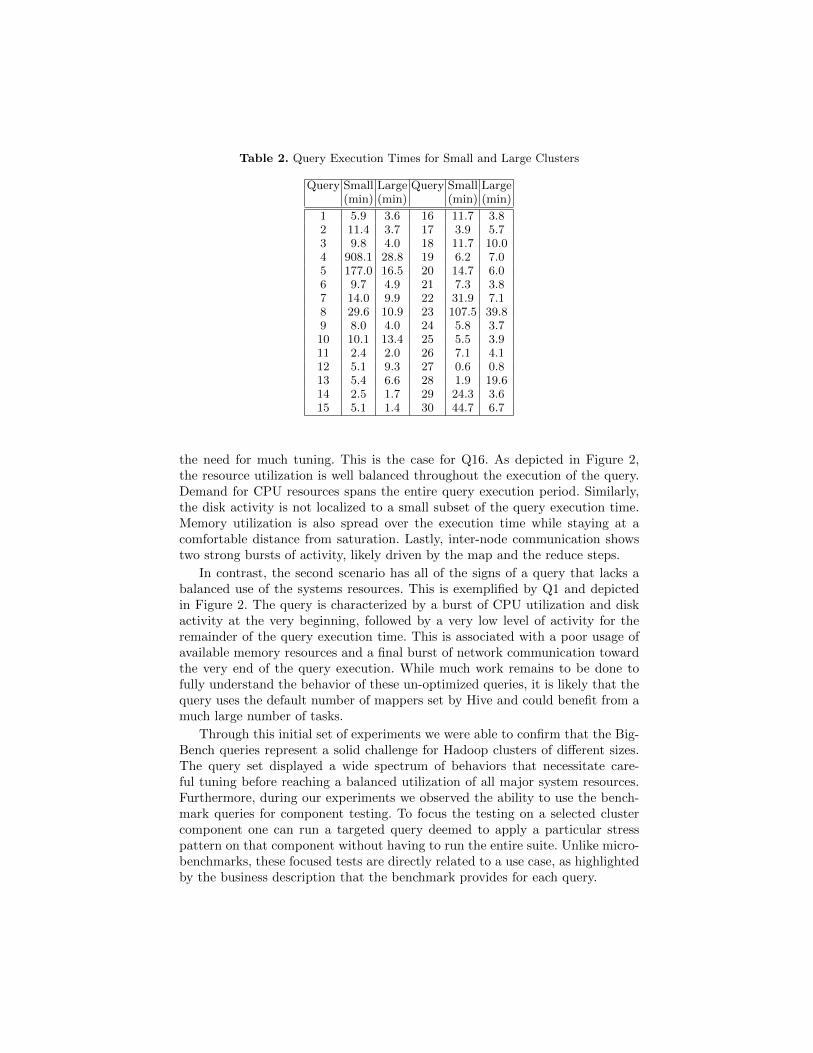
Table 2. Query Execution Times for Small and Large Clusters
Query Small Large Query Small Large(min) (min) (min) (min)
1 5.9 3.6 16 11.7 3.82 11.4 3.7 17 3.9 5.73 9.8 4.0 18 11.7 10.04 908.1 28.8 19 6.2 7.05 177.0 16.5 20 14.7 6.06 9.7 4.9 21 7.3 3.87 14.0 9.9 22 31.9 7.18 29.6 10.9 23 107.5 39.89 8.0 4.0 24 5.8 3.710 10.1 13.4 25 5.5 3.911 2.4 2.0 26 7.1 4.112 5.1 9.3 27 0.6 0.813 5.4 6.6 28 1.9 19.614 2.5 1.7 29 24.3 3.615 5.1 1.4 30 44.7 6.7
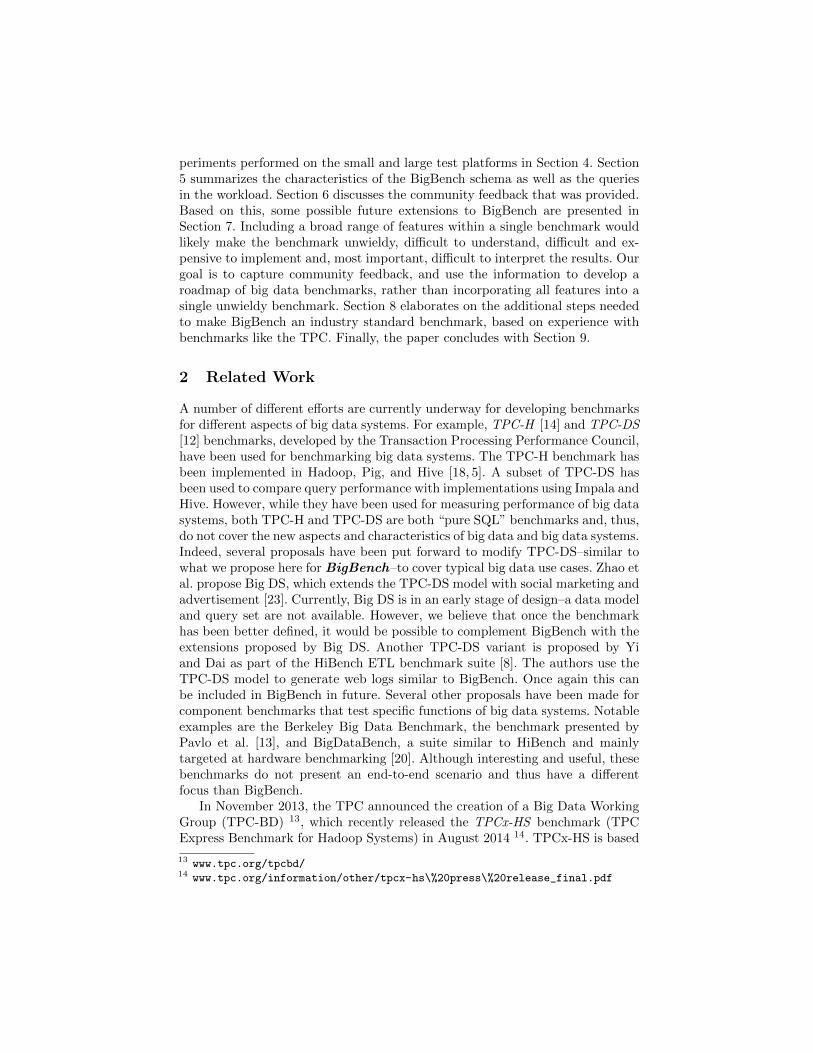
the need for much tuning. This is the case for Q16. As depicted in Figure 2,the resource utilization is well balanced throughout the execution of the query.Demand for CPU resources spans the entire query execution period. Similarly,the disk activity is not localized to a small subset of the query execution time.Memory utilization is also spread over the execution time while staying at acomfortable distance from saturation. Lastly, inter-node communication showstwo strong bursts of activity, likely driven by the map and the reduce steps.
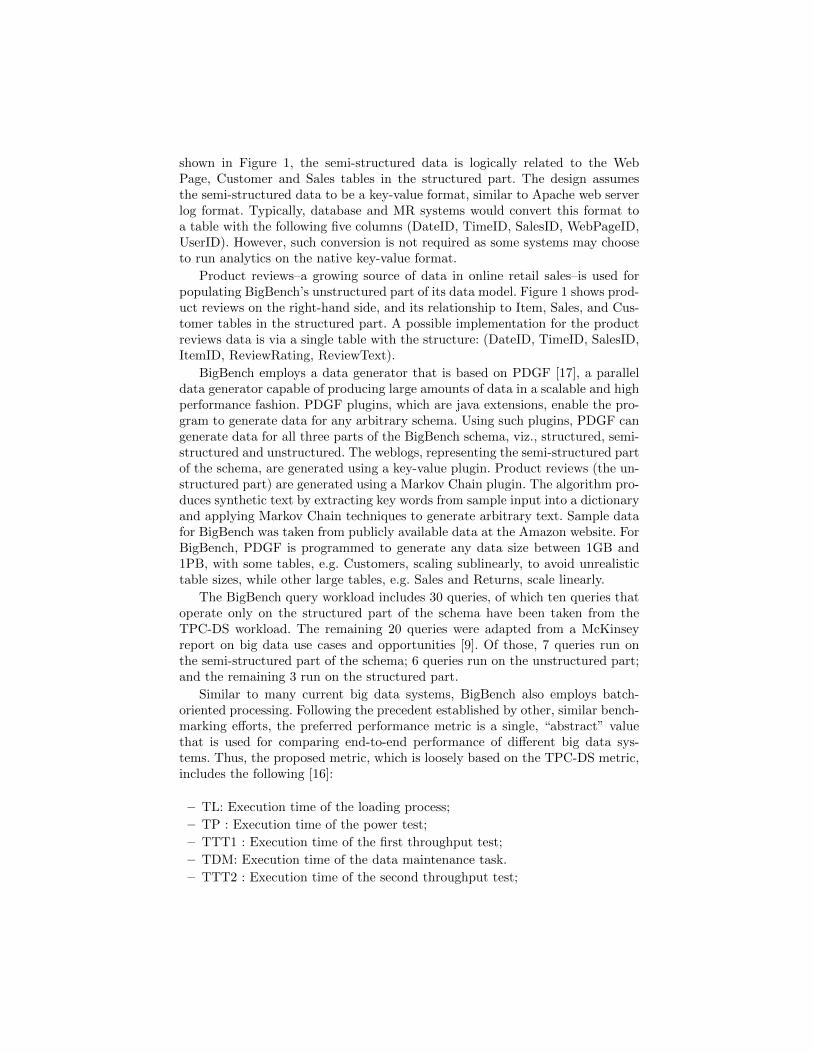
In contrast, the second scenario has all of the signs of a query that lacks abalanced use of the systems resources. This is exemplified by Q1 and depictedin Figure 2. The query is characterized by a burst of CPU utilization and diskactivity at the very beginning, followed by a very low level of activity for theremainder of the query execution time. This is associated with a poor usage ofavailable memory resources and a final burst of network communication towardthe very end of the query execution. While much work remains to be done tofully understand the behavior of these un-optimized queries, it is likely that thequery uses the default number of mappers set by Hive and could benefit from amuch large number of tasks.
Through this initial set of experiments we were able to confirm that the Big-Bench queries represent a solid challenge for Hadoop clusters of different sizes.The query set displayed a wide spectrum of behaviors that necessitate care-ful tuning before reaching a balanced utilization of all major system resources.Furthermore, during our experiments we observed the ability to use the bench-mark queries for component testing. To focus the testing on a selected clustercomponent one can run a targeted query deemed to apply a particular stresspattern on that component without having to run the entire suite. Unlike micro-benchmarks, these focused tests are directly related to a use case, as highlightedby the business description that the benchmark provides for each query.

Fig. 2. System Utilization Statistics for Q16
Running the benchmark on two different types of cluster, one with smalland limited number of dedicated nodes and another with a few hundreds multi-tenancy nodes, provides additional insights on using the benchmark to test var-ious hosting scenarios. In our experiments, one scenario involved a small clusterdedicated to running the BigBench queries and another scenario involved a largecluster hosting multiple jobs of different types executed with different prioritylevels often resulting in maximum utilization.
In this benchmark experiment, we took an approach of running in Powermode where each query is executed individually, leading to a better understand-ing of its behavior. However, the benchmark is also designed to run in Through-put mode with multiple parallel streams of queries. With results from these twomodes, the benchmark provides a single metric for the entire execution to sim-plify result comparisons without having to look at individual completion times.
5 Technical Discussion of the Workload
In this section, we discuss the technical aspects of the 30 BigBench queries. Thediscussion is separated in two parts: a description of the generic characteristicsof the workload, followed by details of a Hive-specific implementation.

Fig. 3. System Utilization Statistics for Q1
5.1 Generic Workload Characteristics
As mentioned in Section 3, the workload dataset can be separated into three cat-egories: structured, unstructured, and semi-structured data. BigBench inheritsthe general scaling properties of TPC-DS, however, unlike TPC-DS it does notrestrict scaling to discrete, predefined scale factors but has a continous scalingmodel. To keep the table sizes realistic over a wide range of scaling factors notall tables can be scaled linearly. We target a range of data sizes from 1 GB to 1PB. Linearly scaled tables will have about 1,000,000 times more records for the1 PB data set than for the 1 GB data set. Other tables (e.g. Customer/Store)use logarithmic or square root scaling. As a result, query input sizes are notnecessarily linearly dependent on the scaling factor. This can be seen in Table3 where the difference of query input sizes in SF 1 is only 7.5 (57:479MB), butis 111 for SF 1000 (2:221GB). In the table, also all input sizes and number oftables used by the queries are shown.
Out of the 30 queries, seven reference semi-structured data, six referenceunstructured data, while 17 queries reference the structured part of the data.
5.2 Workload Characteristics of the Hive Implementation
The Hadoop-based implementation uses a range of programming techniquesto implement the different queries. The workload consists of MapReduce jobs,
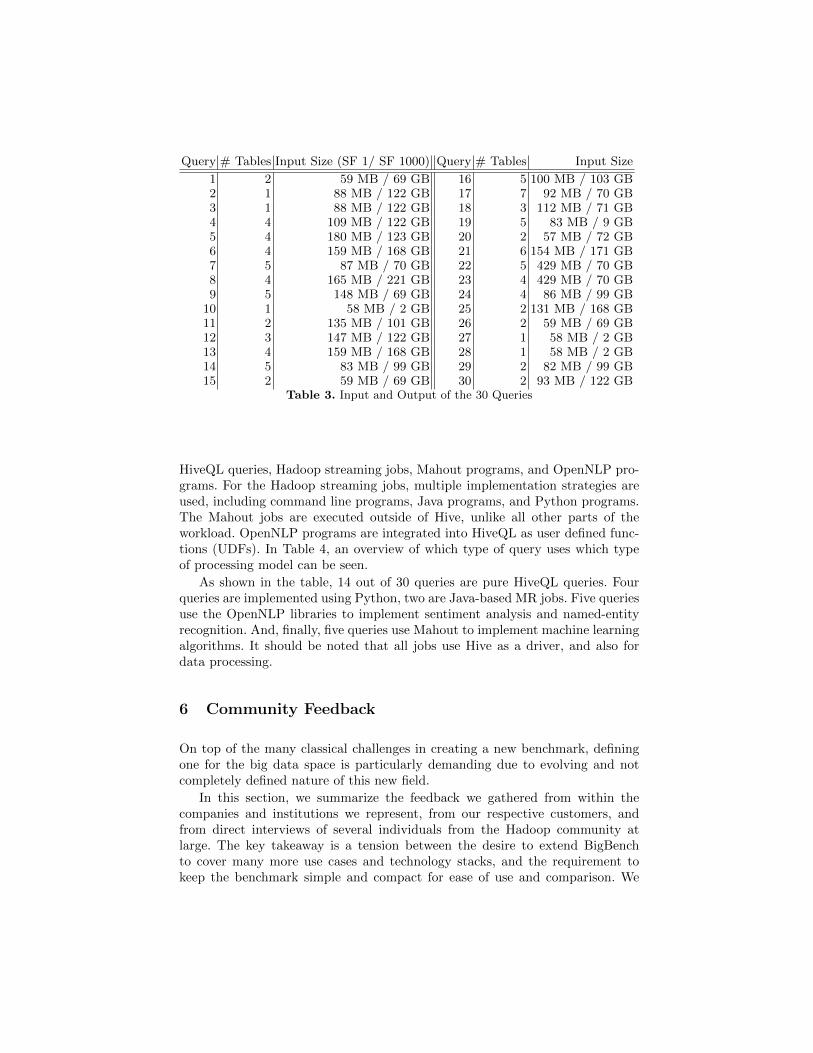
Query # Tables Input Size (SF 1/ SF 1000) Query # Tables Input Size
1 2 59 MB / 69 GB 16 5 100 MB / 103 GB2 1 88 MB / 122 GB 17 7 92 MB / 70 GB3 1 88 MB / 122 GB 18 3 112 MB / 71 GB4 4 109 MB / 122 GB 19 5 83 MB / 9 GB5 4 180 MB / 123 GB 20 2 57 MB / 72 GB6 4 159 MB / 168 GB 21 6 154 MB / 171 GB7 5 87 MB / 70 GB 22 5 429 MB / 70 GB8 4 165 MB / 221 GB 23 4 429 MB / 70 GB9 5 148 MB / 69 GB 24 4 86 MB / 99 GB
10 1 58 MB / 2 GB 25 2 131 MB / 168 GB11 2 135 MB / 101 GB 26 2 59 MB / 69 GB12 3 147 MB / 122 GB 27 1 58 MB / 2 GB13 4 159 MB / 168 GB 28 1 58 MB / 2 GB14 5 83 MB / 99 GB 29 2 82 MB / 99 GB15 2 59 MB / 69 GB 30 2 93 MB / 122 GB
Table 3. Input and Output of the 30 Queries
HiveQL queries, Hadoop streaming jobs, Mahout programs, and OpenNLP pro-grams. For the Hadoop streaming jobs, multiple implementation strategies areused, including command line programs, Java programs, and Python programs.The Mahout jobs are executed outside of Hive, unlike all other parts of theworkload. OpenNLP programs are integrated into HiveQL as user defined func-tions (UDFs). In Table 4, an overview of which type of query uses which typeof processing model can be seen.
As shown in the table, 14 out of 30 queries are pure HiveQL queries. Fourqueries are implemented using Python, two are Java-based MR jobs. Five queriesuse the OpenNLP libraries to implement sentiment analysis and named-entityrecognition. And, finally, five queries use Mahout to implement machine learningalgorithms. It should be noted that all jobs use Hive as a driver, and also fordata processing.
6 Community Feedback
On top of the many classical challenges in creating a new benchmark, definingone for the big data space is particularly demanding due to evolving and notcompletely defined nature of this new field.
In this section, we summarize the feedback we gathered from within thecompanies and institutions we represent, from our respective customers, andfrom direct interviews of several individuals from the Hadoop community atlarge. The key takeaway is a tension between the desire to extend BigBenchto cover many more use cases and technology stacks, and the requirement tokeep the benchmark simple and compact for ease of use and comparison. We

Query Processing Model Query Processing Model
1 Java MR 16 OpenNLP Sentiment Analysis2 Java MR 17 HiveQL3 Python Streaming MR 18 OpenNLP Sentiment Analysis4 Python Streaming MR 19 OpenNLP Sentiment Analysis5 HiveQL 20 Mahout k-means6 HiveQL 21 HiveQL7 HiveQL 22 HiveQL8 HiveQL 23 HiveQL9 HiveQL 24 HiveQL
10 OpenNLP Sentiment Analysis 25 Mahout K-Means11 HiveQL 26 Mahout K-Means12 HiveQL 27 OpenNLP Named-Entity Recognition13 HiveQL 28 Mahout Naive Bayes14 HiveQL 29 Python Streaming MR15 Mahout K-Means 30 Python Streaming MR
Table 4. Query Implementation Techniques
explore how we plan to balance this trade-off, and prioritize the evolution of ourbenchmark in the upcoming Section 7.
Positive feedback A significant portion of the feedback we obtained was gen-eral appreciation for creating such benchmark, and for many of the technicalchoices we made. There is positive consensus around the choice of starting froma known benchmark such as TPC-DS. The existing familiarity and possibly par-tial implementations is perceived as a clear plus. Also there is agreement that arelational-only benchmark does not capture real use cases and the non-relationalextensions we present are generally well received. Providing a reference imple-mentation also seems to be highly appreciated and while some have suggestionson the specific details of the implementation, most interviewee agree with theapproach and basic choices.
Common misunderstandings Having a reference implementation seems funda-mental to foster adoption, but makes it is easy to misconstrue the benchmarkto be specific to the combinations of frameworks selected in the implementation(e.g., Hive/Hadoop). We got the following question several times: ”Is this justa Hive benchmark?”, or ”Is this just relational?”. This shows how the existenceof an implementation biases interpretation of the benchmark goals, to the pointthat more than one individual missed the fact that our benchmark and the cur-rent implementation contains several non-relational components. We expect thatas the benchmark gains traction, and different implementations based on otherframeworks start emerging this bias will become less problematic. For the timebeing, our only line of defense is a clear description of the scope and goals ofthe benchmark, and a crisp characterization of the current implementation asreference implementation, and not a mandatory one.

Technology coverage A common set of requests is to add features to the bench-mark that stresses a specific technology:
1. Graph Analytics is probably one of the number one asks we hear form thecommunity. Different sources reported that the ability to ingest, update,analyze large graphs is an important technological challenge faced by orga-nizations todays. For example Jakob Homan from LinkedIn told us: ”Thereare the big players like FB, LI and Twitter, but pretty much every organiza-tion has some type of graph that it uses to drive engagement.”
2. Streaming is the second most cited ask for our benchmark. The ability toprocess a continuous feed of data (e.g., tweets, user posts, server logs), andperform filtering, projection, aggregations, trend detection, outlier detection,etc.. in a near real-time fashion, seems to be another key scenario peopleconsider a big data problem. Thomas Graves from Yahoo! for example askus to consider Storm [10] and Spark [22] to extend our current benchmarkto capture streaming use cases.
3. Interactive Querying. The support for fast ad-hoc queries on top of a largeset of data was another technology stack considered. The argument was to-wards supporting the large number of small interactive operations performedby data scientist while exploring a data set and devising new analysis/algo-rithms.
Beside the specific technology, people expressed strong feelings about havinga benchmark capable of capturing the following two aspects:
1. Multi-tenancy : speaking with large cluster operators, they strongly under-lined the need to exercise the multi-tenancy capabilities of a big data stack.Often benchmarks are focused on latency/throughput for a single run ofworkload performed in a dedicated set of machines. This often allows forover-tuning of the execution environment to perfectly serve a single run,making the benchmark too synthetic, and more generally does not matchthe typically operating conditions of the systems under test.
2. Fault-tolerance: another key concern for big data developers and cluster op-erators is fault-tolerance. At the typical scale of big data systems, the sheervolume of hardware/software components involved makes “faults” a com-mon condition. Capturing this in the benchmark seems to be an importantrequirement. There are two key dimensions to this problem: a functional as-pect, e.g., no data are lost despite faults, and performance one, e.g., gracefuldegradation of throughput and latency under faulty conditions. Moreovercapturing “limping” hardware beside all-or-nothing faults seem an interest-ing extra dimension.
Use case coverage A final set of concerns was related to the choice of a specificvertical use-case. The concern being that the specifics of the use case we pickedwas potentially skewing the attention towards certain functionalities more thanother. Concretely this was spelled out as a request to broaden the spectrum ofuse cases considered, particularly to include advertisement and social-networkscenarios.
Limit Complexity Most of the above comments are pushing us towards makingour benchmark richer and broader. This is balanced by the need, express implic-itly or explicitly by multiple interviewee, to maintain the size and complexityof the workload contained. Providing a reference implementation allow users tobare significantly more complexity, but the onerous cost of porting this bench-mark to an alternative technology stack grows dramatically with the complexityof the benchmark. Moreover, a benchmark that is too complex and faceted makesinterpretation and comparison of the results very problematic, reducing the valueof the benchmark as a tool to compare solutions.
In the following section, we address the above comments, and propose anagenda on how to extend the benchmark accordingly.
7 Extending BigBench
BigBench is an end-to-end benchmark that focuses on structured data anddeclarative workloads with additonal support for unstructured data and proce-dural workloads. This section highlights several possible extensions to BigBenchthat can potentially make the benchmark more representative of a broader va-riety of real-life big data workloads.
Include Concurrency. The benchmark defines a model for submitting concurrentworkload streams in parallel and for randomizing the workload across the mul-tiple query streams [16]. This is intended to cover multi-tenant scenarios wheremultiple instances of the same workload or single instances of multiple work-loads could execute in parallel. Example of a concurrent/complex workload wcomposed of two elemental workloads w1 and w2 could be: w = n1 ∗w1 +n2 ∗w2,where n1 and n2 are the number of instances of w1 and w2 respectively. The queryconcurrency models in several existing online transactional processing (OLTP)and online analytical processing (OLAP) industry standard benchmarks serveas a good starting point [14, 15, 19].
Improve Procedural Coverage. BigBench has two procedural workloads definedat the moment: K-Means and Bayes. Both are representative of the machinelearning domain and their respective specifications define a dependency on arelational database or suchlike. BigBench could be extended to include ”pure”procedural workloads that process unstructured data without requiring formatconversion. These workloads would also represent categories that are somewhatunder-represented in BigBench, including web-based and component-level bench-marks. PageRank is a good representative of web-based workloads, while Word-Count, SleepJob and Sort are excellent representatives of component level bench-marks.
Include Other Metrics. The specification and reference implementation shouldbe extended to measure other metrics important to technology choices, such asprice/performance, energy efficiency, and performance under failures. Price/per-formance and energy efficiency are already included in various industry standard

benchmarks. Performance under failures is an important consideration for bigdata systems, which run on large scale-clusters, and consequently, partial com-ponent failures such as hardware failures can be common.
Incorporate Incremental Data Uploads In real-world deployments, big data ap-plications ingest data incrementally, rather than re-loading the entire dataset.For example, tables are typically implemented as a collection of time-based parti-tions to support data refresh. Each partition stores data for a time slice, e.g., onehour or one day. Whenever new data arrive, they are loaded as new partitions,or aggregated with an existing partitions to create a new partition. Thus, therenever a need to reload the entire data. In the future, Bigbench could account forsuch partition-based data refresh strategies.
Incorporate Additional Workloads. TPC-DS is designed to evaluate the perfor-mance of decision-support style queries of data warehouse systems. However,BigBench need not be constrainted to execute only OLAP queries. Many real-world big data systems, also encounter periodic workloads, i.e. workloads thatrepeat hourly, daily, or even weekly, which are different from OLAP queries. Apossible extension to BigBench is to include such kind of workloads to better sim-ulate the real-world Big Data systems. Some good candidates of such workloadsinclude the off-line collaborative filtering analysis of all items [21], unstructureddata indexing and ranking for intranet search service, user authority or similarityanalysis, etc.
8 Towards an Industry Standard Benchmark
As with the development of any software product, the process of turning abenchmark idea into a product is not trivial. The three most recognized in-dustry standard consortia, namely the Standard Performance Evaluation Cor-poration (SPEC), the Transaction Processing Performance Council (TPC) andthe Storage Performance Council (SPC) have developed processes to organizebenchmark development; deal with benchmark evolution, i.e., versioning; andpublish benchmark results to ensure successful benchmarking. The TPC, hasmanaged to retain continuity of benchmarks over a few decades, while keepingthe benchmarks comparable. This has provided companies the ability to com-pare benchmark results over a very long time period and across many products.In this section, we describe the necessary steps and discuss the advantages anddisadvantages of developing an industry specification that is similar to TPC.
All TPC benchmark specifications developed so far have been technologyagnostic, i.e., they specify a workload without using terms of any particular ar-chitecture or implementation by defining a set of functional requirements thatcan be run on any system, regardless of hardware, database management soft-ware or operating system. Furthermore, they follow a similar methodology and,consequently, follow a similar structure. It is the responsibility of those measur-ing the performance of systems using TPC benchmarks, a.k.a. the test sponsor,

to implement their setup compliant with the benchmark specification and tosubmit proof that it meets all benchmark requirements, i.e., that the implemen-tation complies with the specification. The proof has to be submitted with everybenchmark publication in form of a full disclosure report. The intent of the fulldisclosure report is to enable other parties to reproduce the performance mea-surement. This methodology allows any vendor, using ”proprietary” or ”open”systems, to implement TPC benchmarks while still guaranteeing end-users thatthe measurement is comparable.
The above approach to benchmarking broadens the applicability of bench-mark specifications to many architecture and allows for the optimal implemen-tation of a specific product on a specific platform. At the same time it makesthe first benchmark publication very costly, often too costly, because any newimplementation needs to be reviewed by an independent auditor. As a conse-quence the TPC has started to develop a novel way to specify benchmarks. Thenew benchmark category is labeled TPC Express so that it can easily be dis-tinguished from the traditional category, which is labeled TPC Enterprise. TPCExpress benchmarks are based on predefined, executable benchmark kits thatcan be rapidly deployed and measured. Providing a benchmark kit focuses ona critical subset of system, trading the ability to demonstrate absolute optimalperformance for improved ease and costs of benchmarking.
Summarizing the differences between enterprise and express benchmark spec-ifications, it seems that enterprise benchmark have a higher price tag, and aremore time consuming compared to express benchmarks. However their imple-mentation is limited to the technology that is supported in the KIT.
The express benchmark model is very promising as it will lower the entry costinto benchmarking as well as per benchmark publication costs. The big hurdle forexpress benchmarks is the development of a KIT. BigBench defines queries usingfunctional specifications [2] allowing BigBench to accommodate the diverse andrapidly evolving nature of big data technologies (e.g., MapReduce, Hive, Spark,etc.). Currently, BigBench includes a Hive-based reference implementation. Theintent is that for each query there could be multiple implementations satisfy-ing the benchmark’s functional specification. To increase rapid adoption of thebenchmark, it would be beneficial to make all valid implementations availableas open source to a central repository. The resulting repository can be used toaid a BigBench express KIT.
The specification will be extended to provide implementation guidelines toensure that the essential big data principles are maintained. For example, all fileformats used in an implementation must demonstrate the expected flexibility ofbeing able to be created, read, and written from multiple popular engines on theHadoop stack, e.g., (MapReduce, Pig, Hive). Such formats ensure that all data isimmediately query-able, with no delays for ETL. Costly data format conversionis unnecessary and thus no overhead is incurred.
In addition to having a KIT, for a possible TPC big data express benchmarkone will need to develop the following sections:
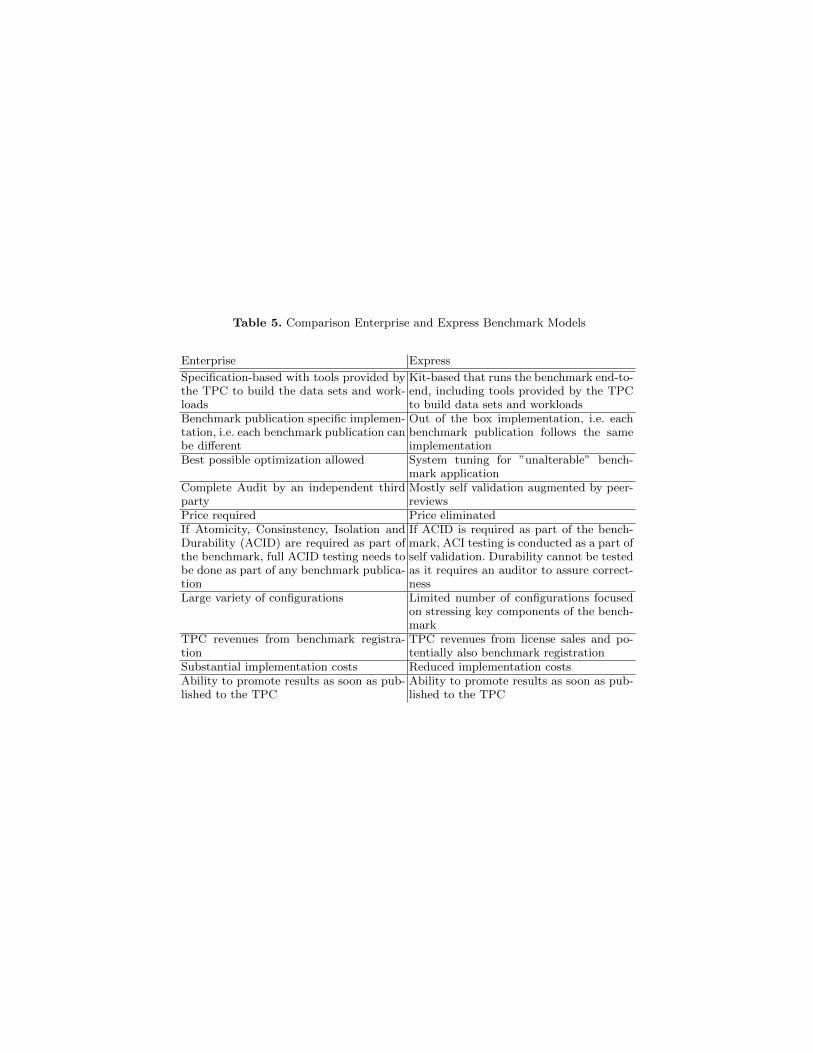
Table 5. Comparison Enterprise and Express Benchmark Models
Enterprise Express
Specification-based with tools provided bythe TPC to build the data sets and work-loads
Kit-based that runs the benchmark end-to-end, including tools provided by the TPCto build data sets and workloads
Benchmark publication specific implemen-tation, i.e. each benchmark publication canbe different
Out of the box implementation, i.e. eachbenchmark publication follows the sameimplementation
Best possible optimization allowed System tuning for ”unalterable” bench-mark application
Complete Audit by an independent thirdparty
Mostly self validation augmented by peer-reviews
Price required Price eliminatedIf Atomicity, Consinstency, Isolation andDurability (ACID) are required as part ofthe benchmark, full ACID testing needs tobe done as part of any benchmark publica-tion
If ACID is required as part of the bench-mark, ACI testing is conducted as a part ofself validation. Durability cannot be testedas it requires an auditor to assure correct-ness
Large variety of configurations Limited number of configurations focusedon stressing key components of the bench-mark
TPC revenues from benchmark registra-tion
TPC revenues from license sales and po-tentially also benchmark registration
Substantial implementation costs Reduced implementation costsAbility to promote results as soon as pub-lished to the TPC
Ability to promote results as soon as pub-lished to the TPC

– Introduction/Preamble. This section includes a high level introduction tothe benchmark and general implementation guidelines. The implementationguidelines if adopted from the TPC exists as a boilerplate in every bench-mark, and can be used with minor modifications. However, special imple-mentation guidelines can be easily incorporated. For instance, in order togive multiple popular engines access to the data without incurring costlydata conversion overhead, it might be beneficial to provide guidelines in theBigBench specifications to ensure that the data formats used in benchmarkimplementations ensure that essential big data principles are maintained.For example, all file formats used in an implementation must demonstratethe expected flexibility of being able to be created, read, and written frommultiple popular engines on the Hadoop stack, e.g., (MapReduce, Pig, Hive).
– Data/Database Design: Requirements and restrictions on how to implementthe database schema. In case of the express model this section can be rela-tively short as only modifications to the KIT need to be discussed. Otherwisethe KIT is what needs to be run.
– Workload Scaling: Tools and methodology on how to scale the workload.This would include a description and usage of the tools plus methods toscale the data and potentially the workload.
– Metric and Execution Rules: Again the KIT will serve as a reference im-plementation of the metric and execution rules. This section only needs todescription, on a high level, how to execute the benchmark and how to derivemetrics. Additionally, it needs to describe any deviations allowed from theexecution implemented in the KIT. This section would also include exten-sions to BigBench to measure other metrics important to technology choices,such as performance-per-cost, energy efficiency, and performance subject tofailures. Performance-per-cost and energy efficiency are already included invarious industry standard benchmarks. Performance subject to failures is animportant metric as big data technologies run on large scale clusters, andconsequently, partial component failures such as hardware failures can becommon.
– Pricing: This section will cover pricing related wording specific to BigBench.Generic pricing rules are already available TPC’s pricing specification.
– Full Disclosure Report (FDR): Every TPC benchmark publication includesan FDR that allows anybody to reproduce the benchmark. In case of an ex-press benchmark only allowed deviations from the KIT and system specificsneed to be included in the FDR and, hence, the specification wording islimited to that.
– Audit Requirements: Minimum requirements for the audit process that needto be followed. In case of an express benchmark, self auditing scripts thatshow correct implementation and execution of the benchmark need to beincluded and, if desired, rules for peer-auditing.
9 Conclusion
As big data analytics becomes an important part of todays data managementecosystem, there is a need for an industry standard benchmark that can mea-sure the performance and price-performance aspects total system under realisticworkloads. In this paper, we propose a framework for an end to end big dataanalytics benchmark based on BigBench. The benchmark is intended to repre-sent todays data management ecosystem which is implemented as an extensionof enterprise DW application (structured data) with new data sources (semi-structured and unstructured). The paper presents 30 queries representative ofreal life scenarios, their characteristics and experiment results. This paper ispresented as a proposal to the TPC to create the next generation industry stan-dard benchmark that can be developed as an Express benchmark or Enterprisebenchmark.
BigBench currently incorporates a retail industry use case. Recent customersurveys reveal additional important and common use cases from other industries,e.g., the financial industry [4]. Hence, as additional surveys and empirical dataemerge, BigBench will be extended to incorporate additional use cases.
10 Acknowledgements
Portions of the research in this paper use results obtained from the PivotalAnalytics Workbench, made available by Pivotal Software, Inc. Work performedby co-authors Baru and Youn was partially supported via industry sponsorshipfrom Pivotal and Intel of the Center for Large Scale Data Systems Research(CLDS) at the San Diego Supercomputer Center, UC San Diego and by a grantfrom the Information Technology Laboratory (ITL) of the National Institute forStandards and Technology (NIST).
References
1. Armstrong, T.G., Ponnekanti, V., Borthakur, D., Callaghan, M.: LinkBench: aDatabase Benchmark Based on the Facebook Social Graph. In: SIGMOD. pp.1185–1196 (2013)
2. Chen, Y., Raab, F., Katz, R.: From TPC-C to Big Data Benchmarks: A FunctionalWorkload Model. In: WBDB (2012)
3. Chowdhury, B., Rabl, T., Saadatpanah, P., Du, J., Jacobsen, H.A.: A BigBenchImplementation in the Hadoop Ecosystem. In: WBDB (2013)
4. Costley, J., Lankford, P.: Big Data Cases in Banking and Securities - A Reportfrom the Front Lines. Tech. rep., STAC (2014)
5. Dean, J., Ghemawat, S.: MapReduce: Simplified Data Processing on Large Clus-ters. Communications of the ACM 51(1), 107–113 (2008)
6. Dominguez-Sal, D., Martinez-Bazan, N., Muntes-Mulero, V., Baleta, P., Larriba-Pey, J.L.: A Discussion on the Design of Graph Database Benchmarks. In: TPCTC.pp. 25–40. Springer (2011)
7. Ghazal, A., Rabl, T., Hu, M., Raab, F., Poess, M., Crolotte, A., Jacobsen., H.A.:BigBench: Towards an Industry Standard Benchmark for Big Data Analytics. In:SIGMOD (2013)

8. Huang, S., Huang, J., Dai, J., Xie, T., Huang, B.: The HiBench Benchmark Suite:Characterization of the MapReduce-Based Data Analysis. In: ICDEW (2010)
9. Manyika, J., Chui, M., Brown, B., Bughin, J., Dobbs, R., Roxburgh,C., Byers, A.H.: Big data: The Next Frontier for Innovation, Compe-tition, and Productivity. Tech. rep., McKinsey Global Institute (2011),http://www.mckinsey.com/insights/mgi/research/technology_and_innovation/big_data_the_next_frontier_for_innovation
10. Marz, N.: Storm - Distributed and Fault-Tolerant Realtime Computation, http://www.storm-project.net/
11. Murphy, R.C., Wheeler, K.B., Barrett, B.W., Ang, J.A.: Introducing the Graph500. Cray Users Group (CUG) (2010)
12. Nambiar, R.O., Poess, M.: The making of tpc-ds. In: Dayal, U., Whang, K.Y.,Lomet, D.B., Alonso, G., Lohman, G.M., Kersten, M.L., Cha, S.K., Kim, Y.K.(eds.) VLDB. pp. 1049–1058. ACM (2006)
13. Pavlo, A., Paulson, E., Rasin, A., Abadi, D.J., DeWitt, D.J., Madden, S., Stone-braker, M.: A Comparison of Approaches to Large-Scale Data Analysis. In: SIG-MOD. pp. 165–178 (2009)
14. Poss, M., Floyd, C.: New tpc benchmarks for decision support and web commerce.SIGMOD Record 29(4), 64–71 (2000)
15. Poss, M., Nambiar, R.O., Walrath, D.: Why You Should Run TPC-DS: A WorkloadAnalysis. In: VLDB. pp. 1138–1149 (2007)
16. Rabl, T., Frank, M., Danisch, M., Gowda, B., Jacobsen, H.A.: Towards A CompleteBigBench Implementation. In: WBDB (2014), (in print)
17. Rabl, T., Frank, M., Sergieh, H.M., Kosch, H.: A Data Generator for Cloud-ScaleBenchmarking. In: TPCTC. pp. 41–56 (2010)
18. Thusoo, A., Sarma, J.S., Jain, N., Shao, Z., Chakka, P., Anthony, S., Liu, H., Wyck-off, P., Murthy, R.: Hive: A Warehousing Solution Over a Map-Reduce Framework.PVLDB 2(2), 1626–1629 (2009)
19. Transaction Processing Performance Council: TPC Benchmark C - Standard Spec-ification (2010), version 5.11
20. Wang, L., Zhan, J., Luo, C., Zhu, Y., Yang, Q., He, Y., Gao, W., Jia, Z., Shi, Y.,Zhang, S., Zhen, C., Lu, G., Zhan, K., Li, X., Qiu, B.: BigDataBench: a Big DataBenchmark Suite from Internet Services. In: HPCA (2014)
21. Yi, L., Dai, J.: Experience from Hadoop Benchmarking with HiBench: from Micro-Benchmarks toward End-to-End Pipelines. In: WBDB (2013)
22. Zaharia, M., Chowdhury, M., Das, T., Dave, A., Ma, J., McCauley, M., Franklin,M.J., Shenker, S., Stoica, I.: Resilient Distributed Datasets: a Fault-Tolerant Ab-straction for In-Memory Cluster Computing. In: NSDI. pp. 2–2 (2012)
23. Zhao, J.M., Wang, W., Liu, X.: Big Data Benchmark - Big DS. In: WBDB (2013)