discrete choice models for incident prediction donald e. brown calcott professor & chair,...
Post on 21-Dec-2015
213 views
TRANSCRIPT

Discrete Choice Models for Incident Prediction
Donald E. Brown
Calcott Professor & Chair, Department of Systems & Information Engineering

Systems Engineering UVA
AGENDA
• Incident Prediction
• Spatial Models
• Preferential Point Process Models
• Discrete Choice Models
• Application for Incident Prediction
• Conclusions
Systems Engineering UVA
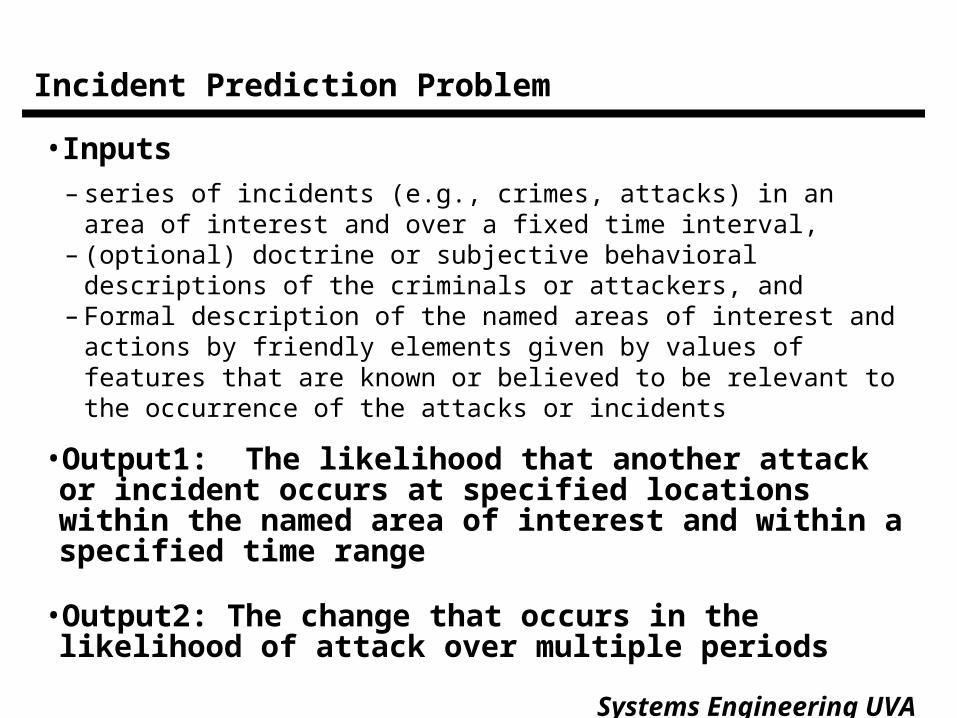
Incident Prediction Problem
• Inputs– series of incidents (e.g., crimes, attacks) in an area of interest and
over a fixed time interval, – (optional) doctrine or subjective behavioral descriptions of the
criminals or attackers, and– Formal description of the named areas of interest and actions by
friendly elements given by values of features that are known or believed to be relevant to the occurrence of the attacks or incidents
•Output1: The likelihood that another attack or incident occurs at specified locations within the named area of interest and within a specified time range
•Output2: The change that occurs in the likelihood of attack over multiple periods

Systems Engineering UVA
Spatial Models
• Grid region into discrete cells
• Cells show measurements and are vector valued
• As with time, space is correlated. Points that are close in space are more similar in their measurements than far away points.
x11 x12 x13 x14 x15 x16
x21 x22 x23 x24 x25 x26
x31 x32 x33 x34 x35 x36
x41 x42 x43 x44 x45 x46
x51 x52 x53 x54 x55 x56
x61 x62 x63 x64 x65 x66
Systems Engineering UVA
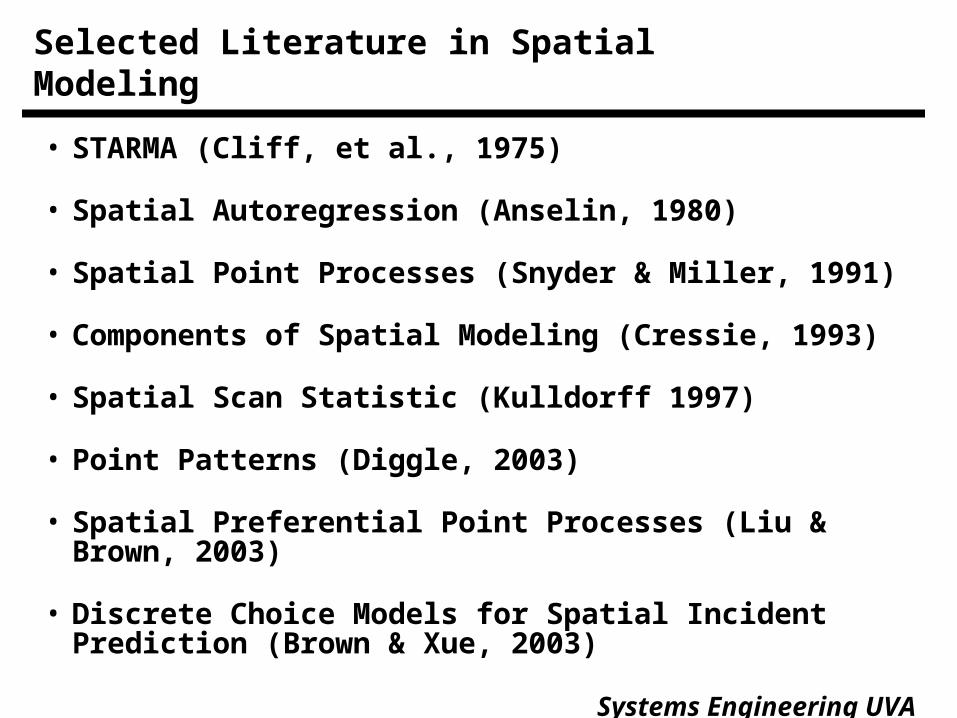
Selected Literature in Spatial Modeling
• STARMA (Cliff, et al., 1975)
• Spatial Autoregression (Anselin, 1980)
• Spatial Point Processes (Snyder & Miller, 1991)
• Components of Spatial Modeling (Cressie, 1993)
• Spatial Scan Statistic (Kulldorff 1997)
• Point Patterns (Diggle, 2003)
• Spatial Preferential Point Processes (Liu & Brown, 2003)
• Discrete Choice Models for Spatial Incident Prediction (Brown & Xue, 2003)
Systems Engineering UVA
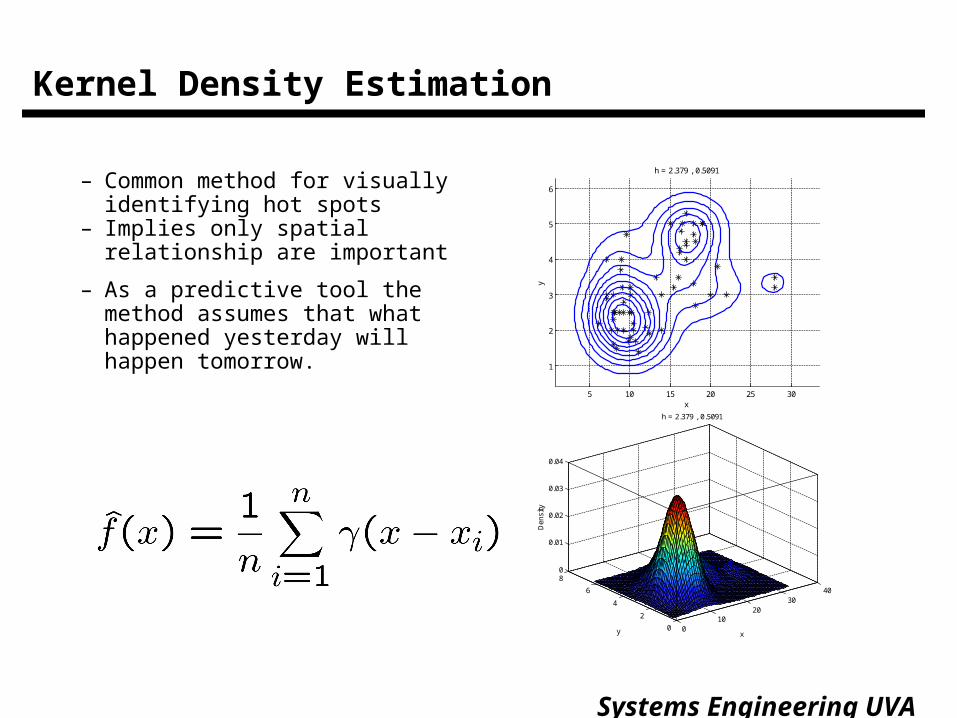
Kernel Density Estimation
– Common method for visually identifying hot spots
– Implies only spatial relationship are important
– As a predictive tool the method assumes that what happened yesterday will happen tomorrow. 5 10 15 20 25 30
1
2
3
4
5
6
y
h = 2.379 , 0.5091
x
010
2030
40
0
2
4
6
80
0.01
0.02
0.03
0.04
x
h = 2.379 , 0.5091
y
Den
sity

Systems Engineering UVA
• Given a realization of a marked space-time shock point process {s D, t T, Xs,t }, locations, times, and feature values - where
– D is the study region or geographical space; – T is the study horizon; – p is the feature space
• Estimate transition density n(sn+1 ,tn+1| Dn, Tn, n) where
– Dn = {s1 , s2 , …, sn}
– Tn = {t1 , t2 , …, tn} and
– n = {X1 , X2 , …, Xn}
Preferential Point ProcessesPreferential Point Processes

Systems Engineering UVA
Preferential Point Processes Model ConstructionPreferential Point Processes Model Construction
• First decomposition - separating space and time, we model each aspect with a conditional density function
Assumptions:
1. Feature space does not contain temporal features;
2. Temporal evolution does not depend on spatial evolution (not essential).
Ã(1)n (sn+1jDn ;tn+1;Tn ;Ân) ¢Ã(2)n (tn+1jTn)
Ãn(sn+1;tn+1jDn ;Tn ;Ân) =

Systems Engineering UVA
Model Components
A set of preferences, a clique, Â(j )n ; j = 1;:: : ; J
Corresponding sets in spaceand time, D(j )n ;T (j )n
Corresponding sets in spaceand time, D(j )n ;T (j )n
Corresponding sets in spaceand time, D(j )n ;T (j )n
Second decomposition { randomization &
separateestimation of 1st & 2nd order

Systems Engineering UVA
Components of Preferential Point Process Model
F A set of preferences, a clique, Â(j )n ; j = 1;:: : ; JF Corresponding sets in spaceand time, D(j )
n ;T (j )nF Second decomposition {
randomization & separateestimation of1st & 2nd order spatial e®ects
Ã(1)n (sn+1jDn;Ân;tn+1;Tn) =®¢Ã(11)n (X̂ n+1jÂn)P Jj =1
Ã(12)n (sn+1jD(j )n ;T (j )n ;tn+1)P r(X n+1 2 Â
(j )n )
AssumesF Static set of preferences in the timehorizonF \Quasi-Markov" point patterns in feature space

Systems Engineering UVA
Point Processes in Feature Space
• Each event location in space/time maps to a location in feature space
• Some feature values (key features) are related to the occurrence of events
0 t1 t2 t3 t4 t5 t6 t7 TTimeAxis
. . .
f1
f2
fi
fp
...
.
..FeatureSpace
x1 x3
x4
x2x5
x6
x7
GeographicSpace
s1
s2s1 s3
s4
s2 s5
s6 s7
• Cliques in key feature space define site selection preferences
• Models in feature space enable us to predict events outside the hot spot regions: Anticipate!

Systems Engineering UVA
Example Applications
•Law enforcement– Breaking and entering analysis for Richmond, VA (Liu and Brown
2003) showed significant improvement over kernel density estimates for predicting criminal incidents
•Counter-Terrorism– Model developed for suicide bombings in Israel– Significant performance improvements over kernel density estimates
(Brown, et al., 2004)
Systems Engineering UVA
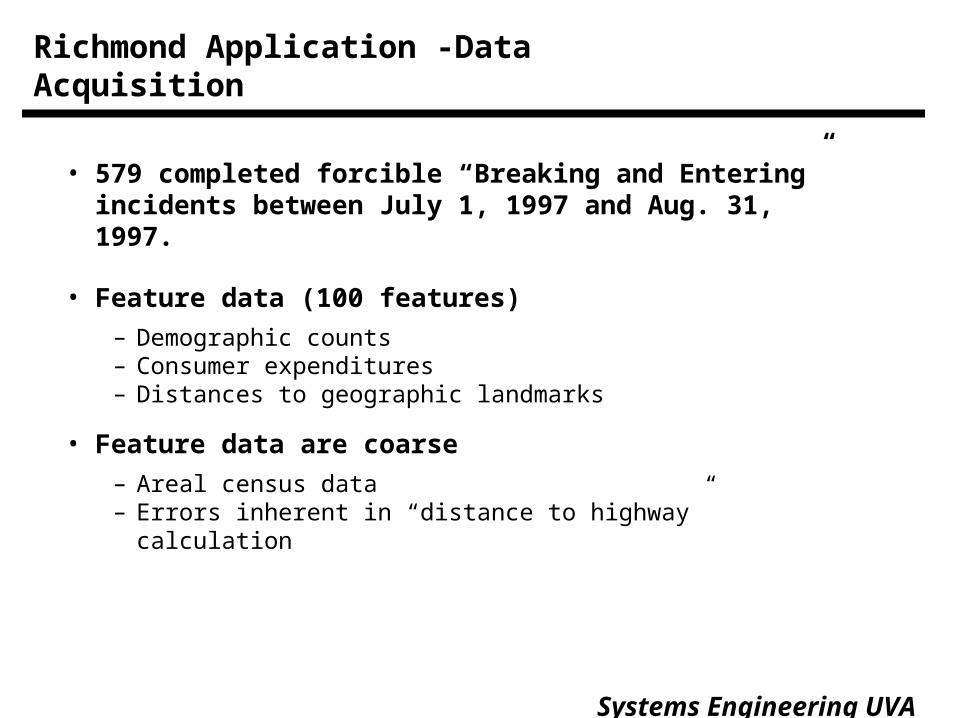
Richmond Application -Data Acquisition
• 579 completed forcible “Breaking and Entering” incidents between July 1, 1997 and Aug. 31, 1997.
• Feature data (100 features)
– Demographic counts– Consumer expenditures– Distances to geographic landmarks
• Feature data are coarse
– Areal census data– Errors inherent in “distance to highway” calculation

Systems Engineering UVA
Preferential Point Process (Mixture)
• Training: July 7-20; Testing: following 1 week & 2 weeks.

Systems Engineering UVA
Preferential Point Process (WPK)
• Training: July 7-20; Testing: following 1 week & 2 weeks.

Systems Engineering UVA
Preferential Point Process (FPK)
• Training: July 7-20; Testing: following 1 week & 2 weeks.
Systems Engineering UVA
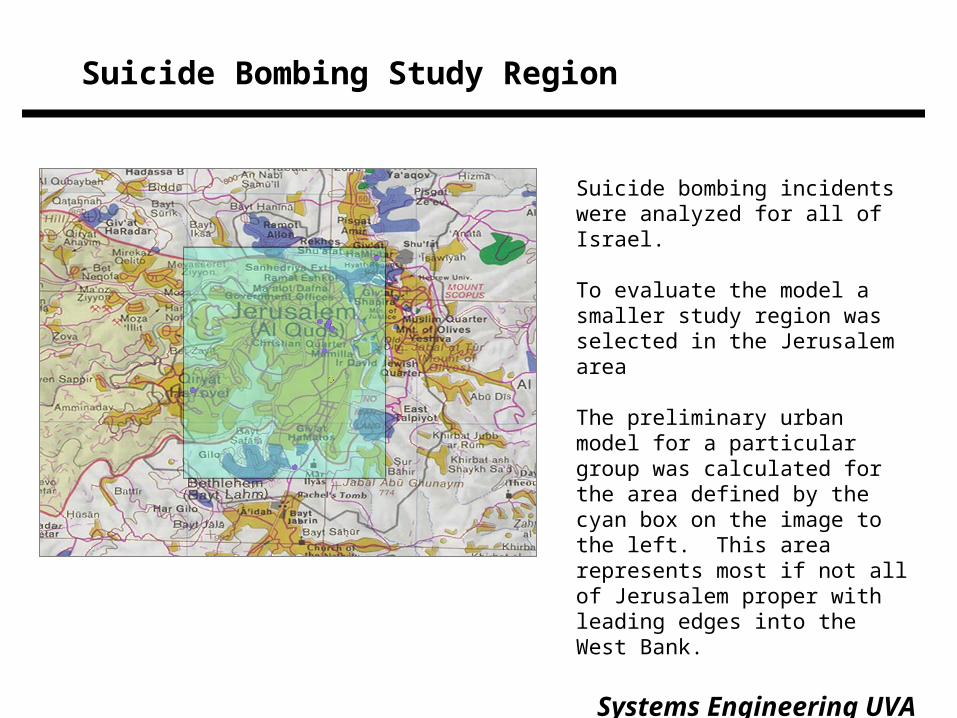
Suicide Bombing Study Region
Suicide bombing incidents were analyzed for all of Israel.
To evaluate the model a smaller study region was selected in the Jerusalem area
The preliminary urban model for a particular group was calculated for the area defined by the cyan box on the image to the left. This area represents most if not all of Jerusalem proper with leading edges into the West Bank.
Systems Engineering UVA
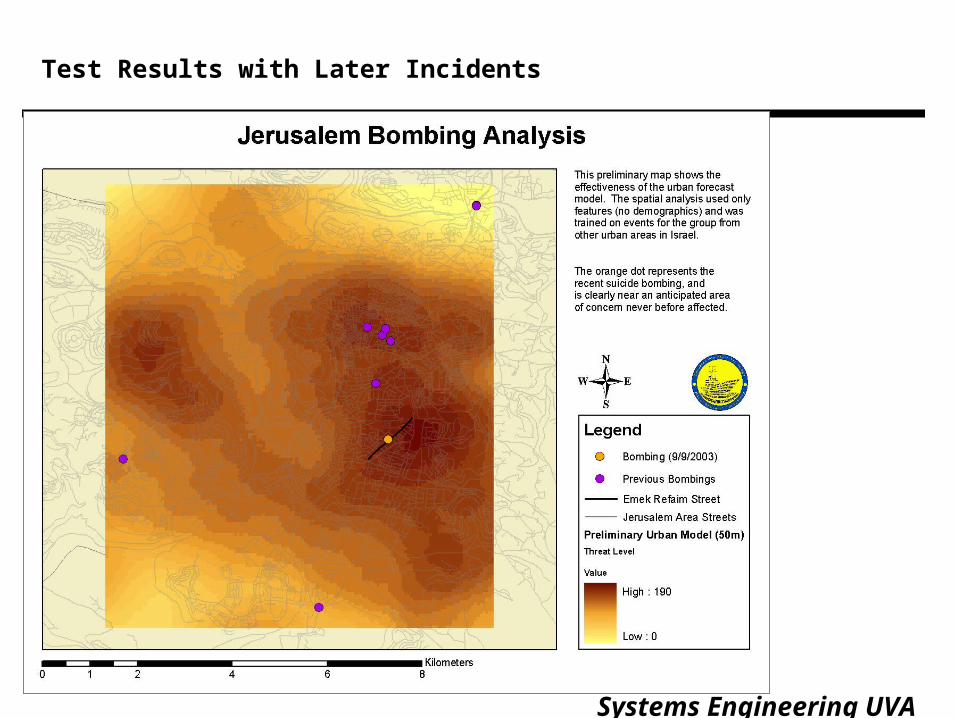
Test Results with Later Incidents
Systems Engineering UVA
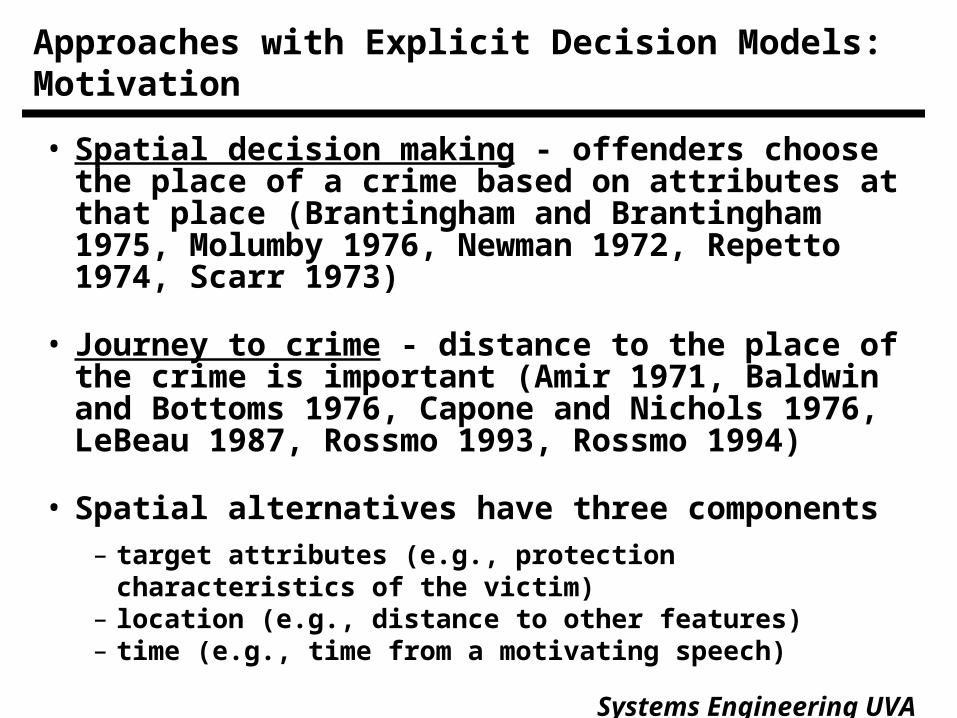
Approaches with Explicit Decision Models: Motivation
• Spatial decision making - offenders choose the place of a crime based on attributes at that place (Brantingham and Brantingham 1975, Molumby 1976, Newman 1972, Repetto 1974, Scarr 1973)
• Journey to crime - distance to the place of the crime is important (Amir 1971, Baldwin and Bottoms 1976, Capone and Nichols 1976, LeBeau 1987, Rossmo 1993, Rossmo 1994)
• Spatial alternatives have three components– target attributes (e.g., protection characteristics of the victim)– location (e.g., distance to other features)– time (e.g., time from a motivating speech)

Systems Engineering UVA
Random Utility Maximization
F RandomUtility Maximization (McFadden, 1973)F U(d;si ) = V(d;si ) +"(d;si )
I Individual d, location, siI V (d;si ) is deterministicI "(d;si ) is stochastic
F With choiceset A, common assumptions lead toP (ai jA;d) =
exp(V (d;si ))Pa j 2 A
exp(V (d;sj ))

Systems Engineering UVA
Modeling Criminal & Terrorist Spatial Decisions
• Derived from discrete choice model
• Alternatives are discrete spatial and temporal points
• The number of alternatives is very large– Depends on the size of the grid– Feature components: spatial alternatives’ characteristics
• Aggregate alternatives– Decision makers are not considering all possible alternatives– “Chunk” alternatives using clustering– Hierarchical DCM
• Aggregation based on feature selection

Systems Engineering UVA
Feature Selection
• Feature selection methods– Simple attribute ranking– Forwards and backward selection– Branch-and-bound selection– Clustering
• Example feature selection criteria– Gini index– Entropy
Systems Engineering UVA
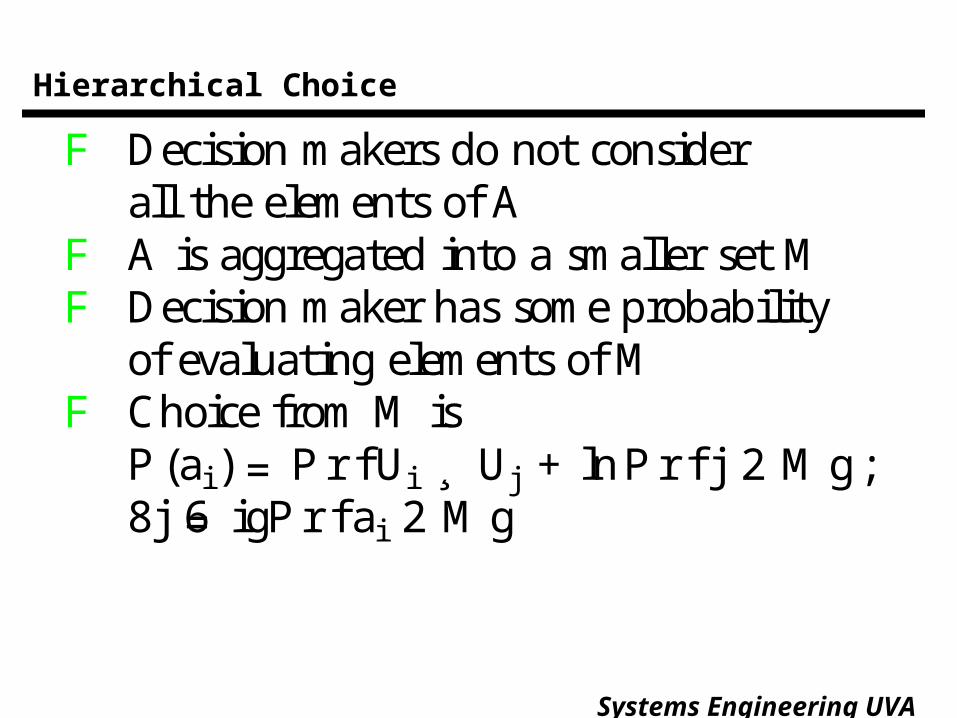
Hierarchical Choice
F Decision makers do not considerall theelements of A
F A is aggregated into a smaller set MF Decision maker has someprobability
of evaluating elements of MF Choice fromM is
P (ai ) = P r fUi ¸ Uj +lnP r f j 2 M g;8j 6= igP r fai 2 M g
Systems Engineering UVA
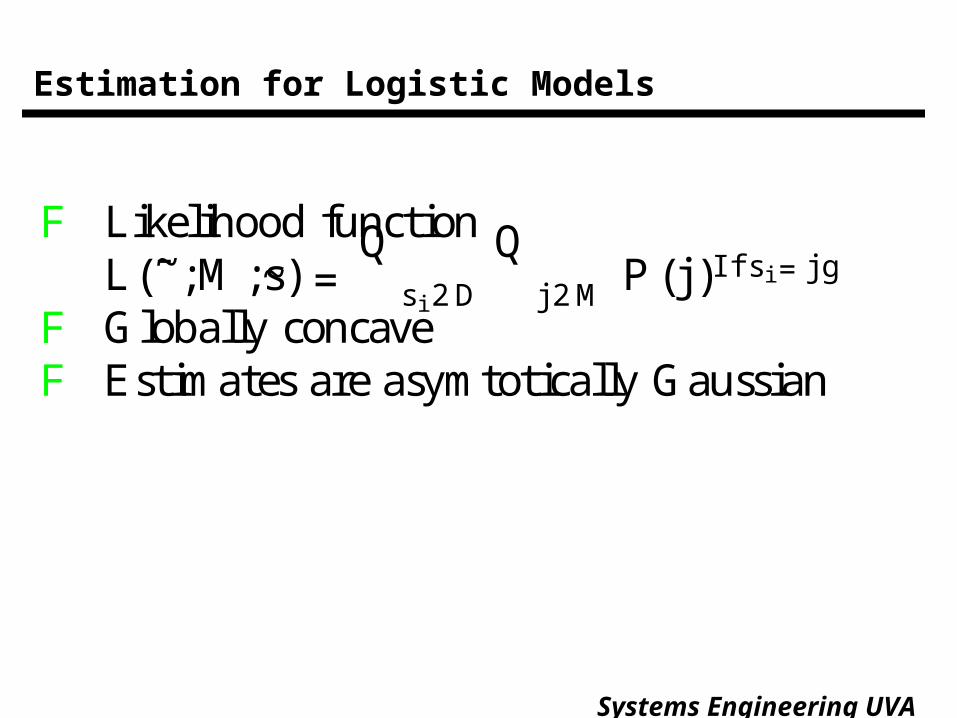
Estimation for Logistic Models
F Likelihood functionL(~̄;M ;~s) =
Qsi 2D
Qj 2M P (j )I f si =j g
F Globally concaveF Estimates areasymtotically Gaussian
Systems Engineering UVA
Models Considered
• Logistic Models– main effects– quadratic– interaction
• Tree-based
• Generalized Additive Models

Systems Engineering UVA
Modeling Nonlinearities in the Choice Process
Generalized Additive Models (GAM) provide a mechanism to model nonlinearities in the relationship between the spatial features and the probability a location is chosen for the attack. The nonlinear functions are shown as f(Xi).

Systems Engineering UVA
Splines in GAM
• We use restricted cubic splines for f(Xi).
• Spline Components– Connection points are called knots and their number can vary
depending on the data– Cubic splines fit curved data better than linear splines– Cubic spines can be made to join at the knots– Constraining the function to be linear in the tails improves
performance

Systems Engineering UVA
Geographic Information System Implementation
•••
Layer=1
Layer=2
Layer=L
•••
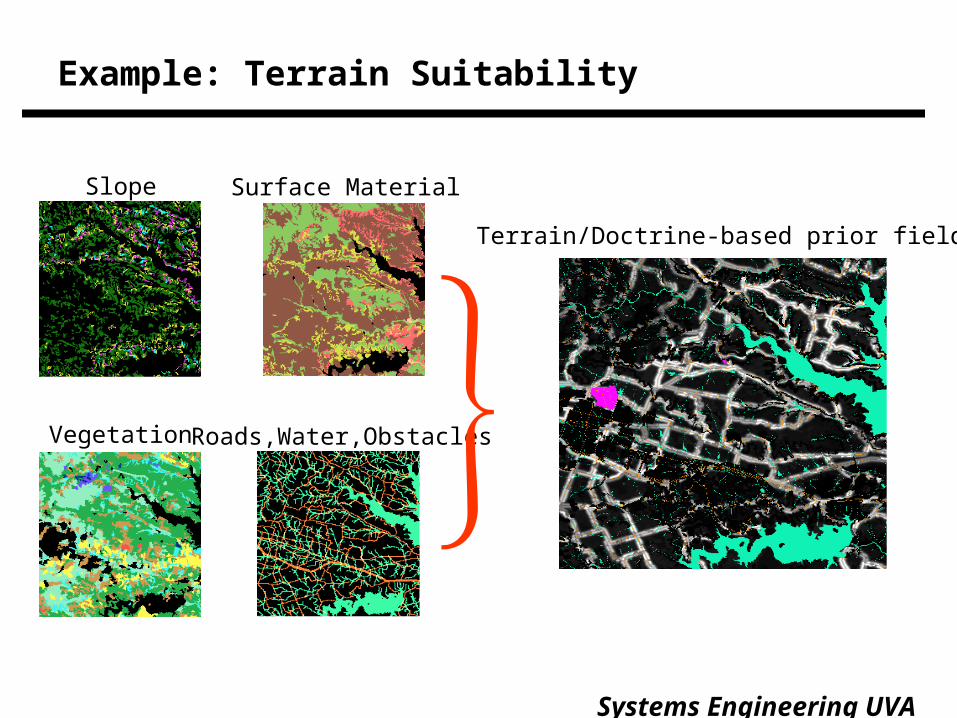
We use multiple GIS layers (topography, transportation networks, demographics,
economic features, etc.) to construct a discrete suitability surface representation
Algorithm searches over cells and scores them accordingly
Systems Engineering UVA
Example: Terrain Suitability
Slope Surface Material
Vegetation Roads,Water,ObstaclesTerrain/Doctrine-based prior field
Systems Engineering UVA
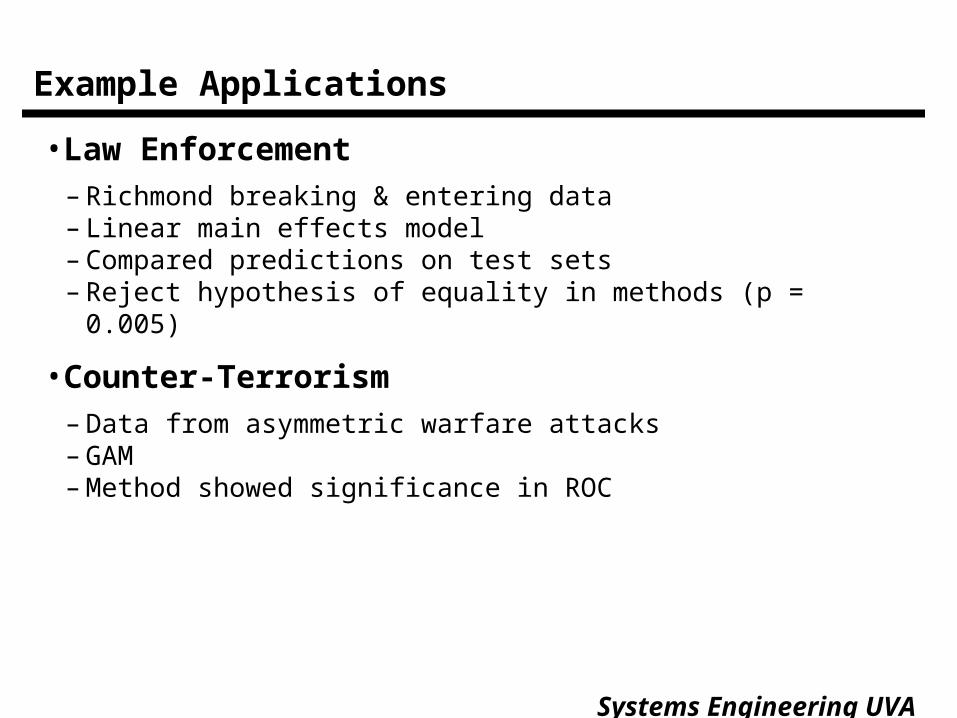
Example Applications
•Law Enforcement– Richmond breaking & entering data– Linear main effects model– Compared predictions on test sets– Reject hypothesis of equality in methods (p = 0.005)
•Counter-Terrorism– Data from asymmetric warfare attacks– GAM– Method showed significance in ROC

Systems Engineering UVA
Richmond Choice Model Results
Systems Engineering UVA
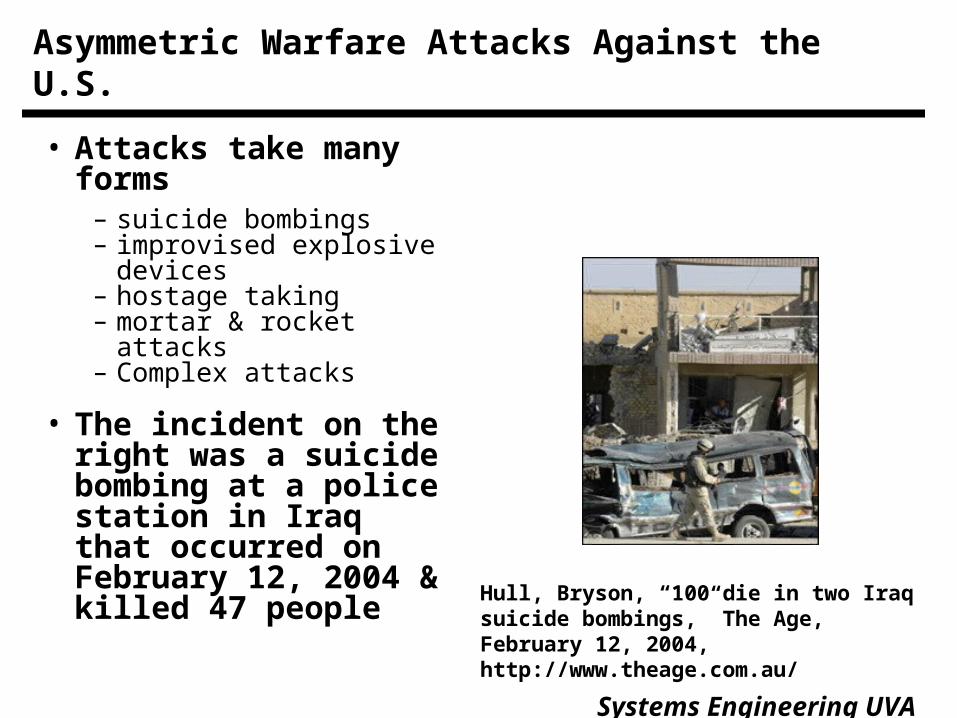
Asymmetric Warfare Attacks Against the U.S.
• Attacks take many forms– suicide bombings– improvised explosive
devices– hostage taking– mortar & rocket attacks– Complex attacks
• The incident on the right was a suicide bombing at a police station in Iraq that occurred on February 12, 2004 & killed 47 people
Hull, Bryson, “100 die in two Iraq suicide bombings,” The Age, February 12, 2004, http://www.theage.com.au/
Systems Engineering UVA
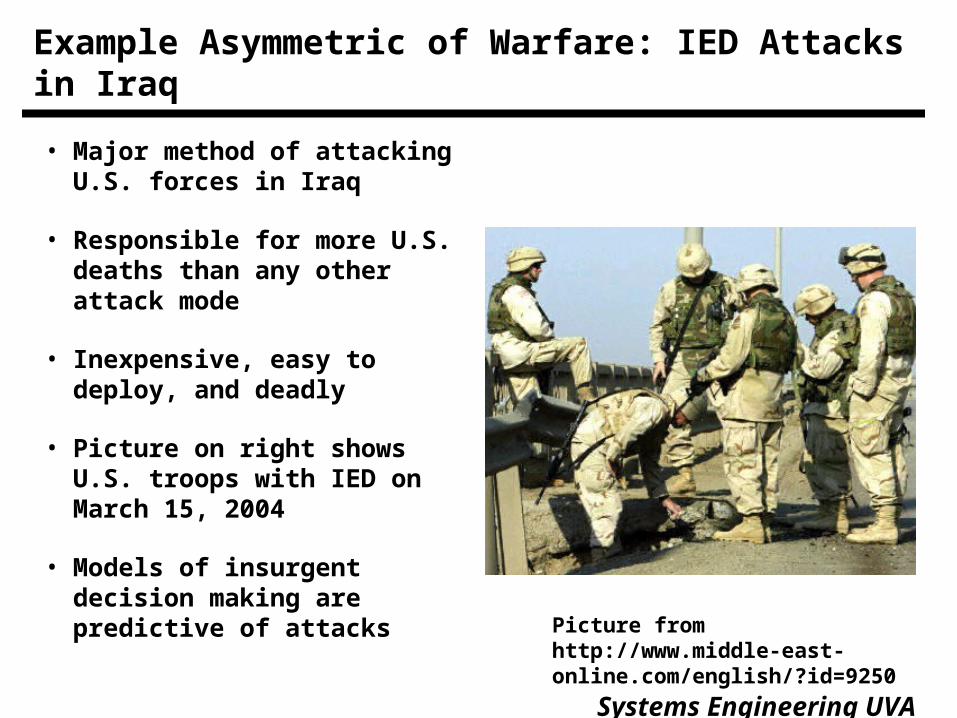
Example Asymmetric of Warfare: IED Attacks in Iraq
• Major method of attacking U.S. forces in Iraq
• Responsible for more U.S. deaths than any other attack mode
• Inexpensive, easy to deploy, and deadly
• Picture on right shows U.S. troops with IED on March 15, 2004
• Models of insurgent decision making are predictive of attacks
Picture from http://www.middle-east-online.com/english/?id=9250
Systems Engineering UVA
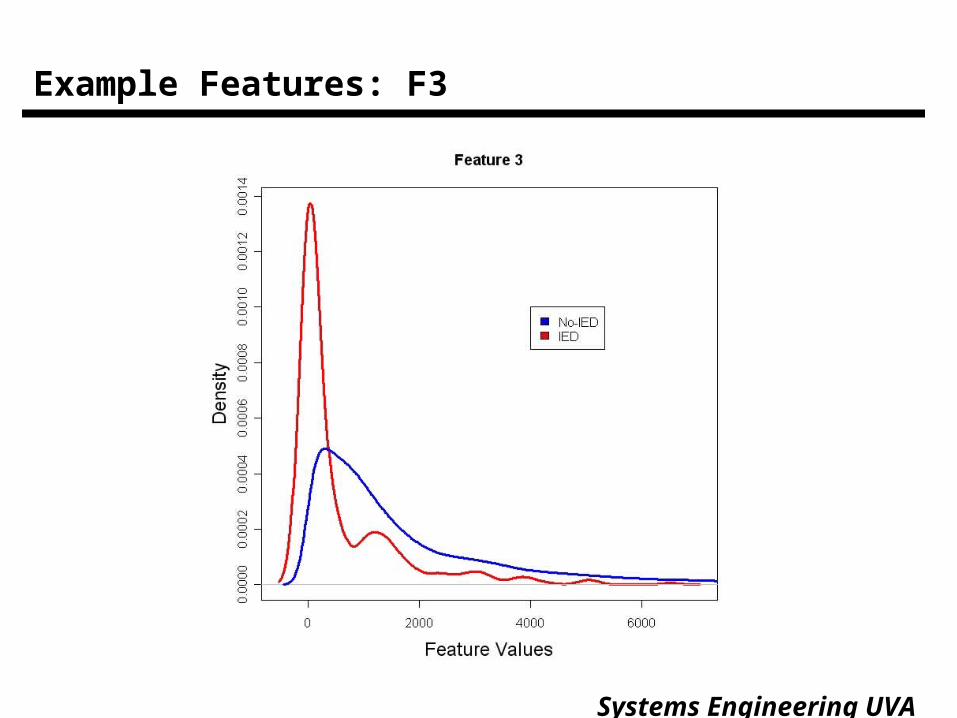
Example Features: F3
Systems Engineering UVA
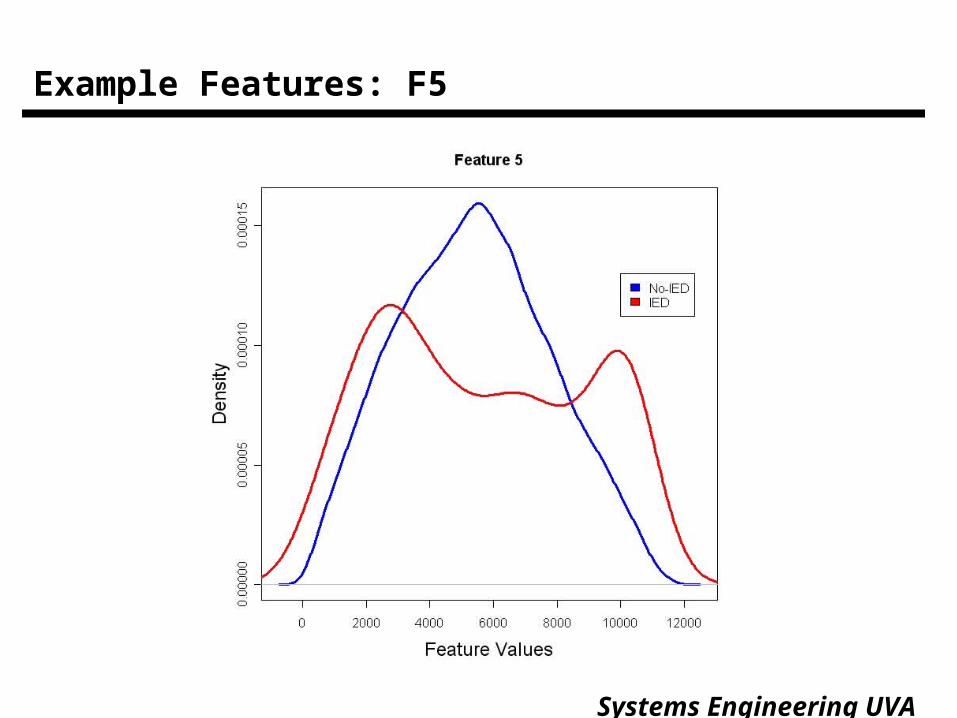
Example Features: F5

Systems Engineering UVA
October Threat Surface

Systems Engineering UVA
October Surface with Attack Points

Systems Engineering UVA
Evaluating Predictive Models
0.0 0.2 0.4 0.6 0.8
0.0
0.2
0.4
0.6
0.8
1.0
ROC for IED Models
False Positive
Tru
e P
osi
tive
InteractionDensityGAM
ROC Curve

Systems Engineering UVA
DCM Evaluation with KDE
• Comparison of density (surface) values at actual attack points
• KDE and DCM were normalized to 1
• Hypotheses
– H0: D – K = 0– Ha : D – K > 0
• DCM results show we can reject H0
– Wilcoxon: p < .01
• Results true for multiple DCM forms

Systems Engineering UVA
Conclusions
• Process models that account for preference can perform incident prediction
• Discrete choice models provide explicit representations of an opponents’ utility functions
• Both modeling approaches have shown good results on real data from law enforcement and terrorism
• Models can account for multiple decision making groups but performance has yet to be tested

Systems Engineering UVA
Questions?