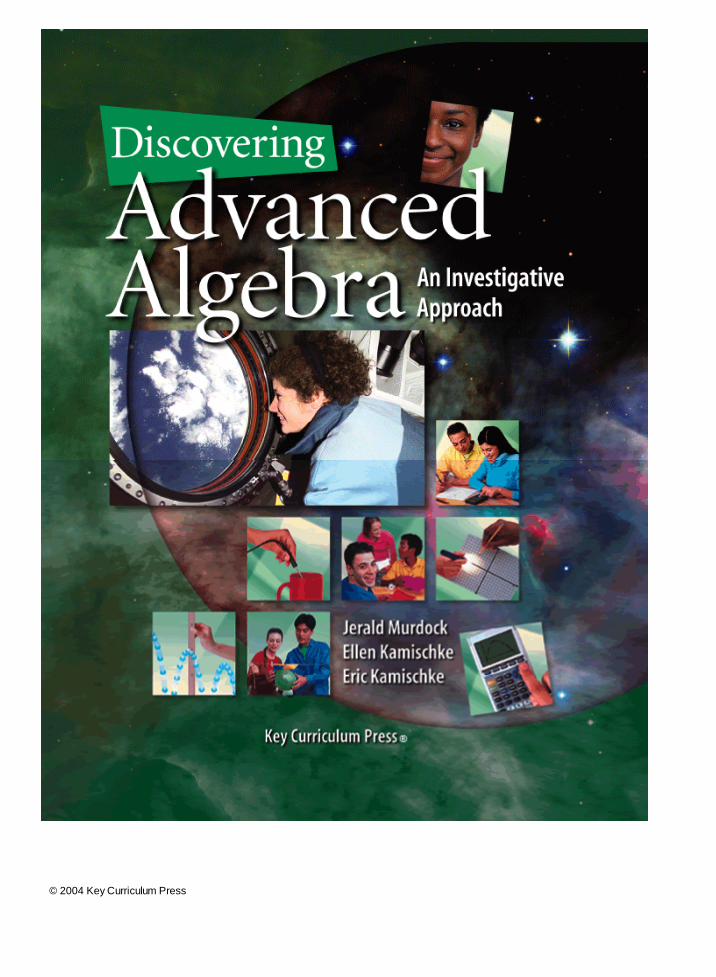
discovering advanced algebra...
TRANSCRIPT
© 2004 Key Curriculum Press
Discovering Advanced Algebra i http://acr.keypress.com/KeyPressPortalV3.0/ImportingCourses/DAA/fr...
1 de 1 31-03-2009 18:42
© 2004 Key Curriculum Press
Discovering Advanced Algebra i http://acr.keypress.com/KeyPressPortalV3.0/ImportingCourses/DAA/c...
1 de 1 31-03-2009 18:43

Project EditorLadie MalekProject AdministratorShannon MillerEditorsChristian Aviles-Scott, Josephine NoahEditorial AssistantsErin Gray, Eric Martin, Susan Minarcin, Sigi Nacson,Jason TaylorEditorial ConsultantsLarry Copes, Fred Decovsky, Heather Dever, DanDitty, David RasmussenMathematical Content ReviewerJames Wilson, Ph.D., University of Georgia, Athens,GeorgiaMulticultural and Equity ReviewerSwapna Mukhopadhyay, Ph.D., Portland StateUniversity, Portland, OregonTeacher ReviewersJennifer North Morris, Santa Rosa High School, SantaRosa, CaliforniaWilliam Putnam, John Marshall High School,Rochester, Minnesota Scientific Content ReviewerArt Fortgang, Mills High School, Millbrae, CaliforniaAccuracy CheckersDudley Brooks, Cavan Fang, Monica Johnston,Abby TanenbaumEditorial Production ManagerDeborah CoganProduction EditorChristine OsborneCopyeditorMargaret Moore Production DirectorDiana Jean RayProduction CoordinatorAnn RothenbuhlerCover DesignerJill KongabelText DesignerMarilyn PerryArt EditorJason LuzPhoto EditorMargee Robinson
Art and Design CoordinatorCaroline AyresIllustratorsRobert Arnow, Pamela Hobbs, William Pasini, Sue ToddTechnical ArtMatt Perry, Jason LuzCompositor and PrepressTSI GraphicsPrinterVon Hoffmann Press
Executive EditorCasey FitzSimonsPublisherSteven Rasmussen
© 2004 by Key Curriculum Press. All rights reserved.No part of this publication may be reproduced, stored in aretrieval system, or transmitted, in any form or by any means,electronic, photocopying, recording, or otherwise, withoutthe prior written permission of the publisher.®The Geometer’s Sketchpad, Dynamic Geometry, and KeyCurriculum Press are registered trademarks of KeyCurriculum Press. ™The Discovering Mathematics logo andSketchpad are trademarks of Key Curriculum Press.™Fathom Dynamic Statistics is a trademark ofKCP Technologies.All other trademarks are held by their respective owners.This material is based upon work supported by the NationalScience Foundation under award number MDR9154410.Any opinions, findings, and conclusions or recommendationsexpressed in this publication are those of the authors and donot necessarily reflect the views of the National ScienceFoundation.Key Curriculum Press1150 65th StreetEmeryville, CA [email protected] in the United States of America10 9 8 7 6 5 4 3 2 1 08 07 06 05 04 03ISBN 1-55953-606-3
© 2004 Key Curriculum Press
Contribute http://acr.keypress.com/KeyPressPortalV3.0/ImportingCourses/DAA/c...
1 de 1 31-03-2009 18:43
Creating a textbook and its supplementary materials is a team effort involvingmany individuals and groups. We are especially grateful to thousands of
Advanced Algebra Through Data Exploration and Discovering Algebra teachers andstudents, to teachers who participated in the summer institutes and workshops,and to manuscript readers, all of whom provided suggestions, reviewed material,located errors, and most of all, encouraged us to continue with the project.
Our students, their parents, and our administrators at Interlochen Arts Academyhave played an important part in the development of this book. Most importantly,we wish to thank Carol Murdock, our parents, and our children for their love,encouragement, and support.
As authors we are grateful to the National Science Foundation for supportingour initial technology-and-writing project that led to the 1998 publication ofAdvanced Algebra Through Data Exploration. Discovering Advanced Algebra hasbeen developed and shaped by what we learned during the writing and publicationof both Advanced Algebra Through Data Exploration and Discovering Algebra, andour work with so many students, parents, and teachers who were searching for amore meaningful algebra curriculum.
Over the course of our careers, many individuals and groups have beeninstrumental in our development as teachers and authors. The Woodrow WilsonNational Fellowship Foundation provided the initial impetus for involvement inleading workshops. Publications and conferences produced by the NationalCouncil of Teachers of Mathematics and Teachers Teaching with Technology haveguided the development of this curriculum. Individuals such as Ron Carlson,Helen Compton, Frank Demana, Arne Engebretsen, Paul Foerster, Christian Hirsch,Glenda Lappan, Richard Odell, Heinz-Otto Peitgen, James Sandefur, James Schultz,Dan Teague, Charles VonderEmbse, Bert Waits, and Mary Jean Winter haveinspired us.
The development and production of Discovering Advanced Algebra has been acollaborative effort between the authors and the staff at Key Curriculum Press.We truly appreciate the cooperation and valuable contributions offered by theEditorial and Production Departments at Key Curriculum Press. Finally, a specialthanks to Key’s president, Steven Rasmussen, for encouraging and publishing atechnology-enhanced Discovering Mathematics series that offers groundbreakingcontent and learning opportunities.
Jerald MurdockEllen KamischkeEric Kamischke
© 2004 Key Curriculum Press iii
Acknowledgments iii http://acr.keypress.com/KeyPressPortalV3.0/ImportingCourses/DAA/a...
1 de 1 31-03-2009 18:44
The algebra you find in this book won’t look quite like the algebra you may haveseen in older textbooks. The mathematics we learn and teach in school has to
change continually to reflect changes in our world. Our workplaces are changing,and technology is present everywhere, fundamentally changing the work we do.There are some new topics that are now possible to explore with technology, andsome standard topics that can be approached in new ways. As the NationalCouncil of Teachers of Mathematics (NCTM) Technology Principle says, “Whentechnological tools are available, students can focus on decision making, reflection,reasoning, and problem solving.” This has been the focus of the authors and theKey Curriculum Press editorial team in the creation of Discovering AdvancedAlgebra: An Investigative Approach. As you progress through this book, you’ll seethat graphing calculators and other technologies are used to explore patterns andto make, test, and generalize conjectures.
When Key Curriculum Press published the first version of this text, AdvancedAlgebra Through Data Exploration: A Graphing Calculator Approach, in 1998, fewbooks were available that had a similar foundation in technology. In this revision,you’ll see that that foundation has been enriched with projects, explorations,and exercises that utilize not only graphing calculators, but also the powerfulanalysis tools The Geometer’s Sketchpad® and Fathom Dynamic Statistics™.Based on feedback from users and reviewers, this revision is reorganized andeasier to read. Discovering Advanced Algebra also completes the fully updatedDiscovering Mathematics series. All of the features that make Discovering Algebraand Discovering Geometry innovative and exciting are now incorporated into thisbook as well, to make a coherent and streamlined series.
Investigations are at the heart of each book. Through the investigations, you’llexplore interesting problems and generalize concepts. And if you, as a student,forget a concept, formula, or procedure, you can always re-create it—because youdeveloped it yourself the first time! You’ll find that this approach allows you toform a deep and conceptual understanding of advanced algebra topics.
As Glenda Lappan, mathematics professor at Michigan State University and formerNCTM president, said about the first edition of this book, “Students coming outof a year with this text . . . will know the mathematics they know in deeper, moreflexible ways. They will have developed a set of mathematical habits of mind thatwill serve them very well as students or users of mathematics. They will emergewith a sense of mathematics as a search for regularity that allows prediction.”
If you are a student, we hope that what you learn this year will serve you well inlife. If you are a parent, we hope you will enjoy watching your student developmathematical confidence. And if you are a teacher, we hope Discovering AdvancedAlgebra greatly enriches your classroom. The professional team at Key CurriculumPress wishes you success and joy in the lifetime of mathematics ahead of you.We look forward to hearing about your experiences.
Steven Rasmussen, PresidentKey Curriculum Press
iv © 2004 Key Curriculum Press
A Note from the Publisher iv http://acr.keypress.com/KeyPressPortalV3.0/ImportingCourses/DAA/a...
1 de 1 31-03-2009 18:44
A Note to Students from the Authors xiii
CHAPTER Problem Solving 1
0.1 Pictures, Graphs, and Diagrams 2Investigation: Camel Crossing the Desert 3
0.2 Symbolic Representation 7Investigation: Problems, Problems, Problems 10Project: Create Your Own Computer Icon 13
0.3 Organizing Information 14Investigation: Who Owns the Zebra? 17
Chapter 0 Review 22Take Another Look 25Assessing What You've Learned 26
CHAPTER Patterns and Recursion 271.1 Recursively Defined Sequences 28
Investigation: Monitoring Inventory 311.2 Modeling Growth and Decay 38
Investigation: Looking for the Rebound 391.3 A First Look at Limits 45
Investigation: Doses of Medicine 451.4 Graphing Sequences 51
Investigation: Match Them Up 51Exploration:Recursion in Geometry 59
Activity: Two Spirals 591.5 Loans and Investments 62
Investigation: Life’s Big Expenditures 62Project: The Pyramid Investment Plan 66
Exploration:Refining the Growth Model 67Activity: Cornering the Market 68
Chapter 1 Review 71Take Another Look 74Assessing What You’ve Learned 75
© 2004 Key Curriculum Press v
Contents Page V http://acr.keypress.com/KeyPressPortalV3.0/ImportingCourses/DAA/co...
1 de 1 31-03-2009 18:44
CHAPTER Describing Data 762.1 Measures of Central Tendency and Box Plots 77
Investigation: Pulse Rates 802.2 Measures of Spread 85
Investigation: A Good Design 852.3 Histograms and Percentile Ranks 94
Investigation: Eating on the Run 98Project: Stem-and-Leaf Plots 104
Exploration:Census Microdata 105Activity: Different Ways to Analyze Data 106
Chapter 2 Review 108Take Another Look 111Assessing What You’ve Learned 112
CHAPTER Linear Models and Systems 1133.1 Linear Equations and Arithmetic Sequences 114
Investigation: Match Point 1163.2 Revisiting Slope 121
Investigation: Balloon Blastoff 1223.3 Fitting a Line to Data 128
Investigation: The Wave 131Project: Talkin’ Trash 134
3.4 The Median-Median Line 135Investigation: Spring Experiment 138Project: Counting Forever 141
3.5 Residuals 142Investigation: Airline Schedules 143
Exploration:Residual Plots and Least Squares 149Activity: A Good Fit? 149
3.6 Linear Systems 151Investigation: Population Trends 152
3.7 Substitution and Elimination 157Investigation: It All Adds Up 159
Chapter 3 Review 164Mixed Review 166Take Another Look 169Assessing What You’ve Learned 170
vi © 2004 Key Curriculum Press
Contents Page VI http://acr.keypress.com/KeyPressPortalV3.0/ImportingCourses/DAA/co...
1 de 1 31-03-2009 18:44
CHAPTER Functions, Relations, and Transformations 1714.1 Interpreting Graphs 172
Investigation: Graph a Story 1744.2 Function Notation 178
Investigation: To Be or Not to Be (a Function) 180Project: Step Functions 185
4.3 Lines in Motion 186Investigation: Movin’ Around 186
4.4 Translations and the Quadratic Family 193Investigation: Make My Graph 195
4.5 Reflections and the Square Root Family 201Investigation: Take a Moment to Reflect 201
Exploration: Rotation as a Composition of Transformations 208Activity: Revolution 208
4.6 Stretches and Shrinks and the Absolute-Value Family 209Investigation: The Pendulum 212
4.7 Transformations and the Circle Family 217Investigation: When Is a Circle Not a Circle? 219
4.8 Compositions of Functions 225Investigation: Looking Up 226Project: Boolean Graphs 232
Chapter 4 Review 233Take Another Look 235Assessing What You’ve Learned 236
CHAPTER Exponential, Power, and Logarithmic Functions 2375.1 Exponential Functions 238
Investigation: Radioactive Decay 238Project: The Cost of Living 244
5.2 Properties of Exponents and Power Functions 245Investigation: Properties of Exponents 245
5.3 Rational Exponents and Roots 252Investigation: Getting to the Root 252Project: Powers of 10 260
5.4 Applications of Exponential and Power Equations 2615.5 Building Inverses of Functions 266
Investigation: The Inverse 2665.6 Logarithmic Functions 273
Investigation: Exponents and Logarithms 2735.7 Properties of Logarithms 279
Investigation: Slide Rule 2805.8 Applications of Logarithms 286
Investigation: Cooling 289Project: Income by Gender 292
© 2004 Key Curriculum Press vii
Contents Page VII http://acr.keypress.com/KeyPressPortalV3.0/ImportingCourses/DAA/co...
1 de 1 31-03-2009 18:45
Exploration: The Number e 293Activity: Continuous Growth 293Project: All About e 294
Chapter 5 Review 295Take Another Look 297Assessing What You’ve Learned 298
CHAPTER Matrices and Linear Systems 2996.1 Matrix Representations 300
Investigation: Chilly Choices 3016.2 Matrix Operations 307
Investigation: Find Your Place 310 6.3 Row Reduction Method 318 Investigation: League Play 320
6.4 Solving Systems with Inverse Matrices 327Investigation: The Inverse Matrix 328
6.5 Systems of Linear Inequalities 336Investigation: Paying for College 336
6.6 Linear Programming 344Investigation: Maximizing Profit 344Project: Nutritional Elements 350
Chapter 6 Review 351Mixed Review 353Take Another Look 357Assessing What You’ve Learned 358
CHAPTER Quadratic and Other Polynomial Functions 3597.1 Polynomial Degree and Finite Differences 360
Investigation: Free Fall 3637.2 Equivalent Quadratic Forms 368
Investigation: Rolling Along 371 7.3 Completing the Square 377 Investigation: Complete the Square 379
7.4 The Quadratic Formula 385Investigation: How High Can You Go? 387Project: Calculator Program for the Quadratic Formula 390
7.5 Complex Numbers 391Investigation: Complex Arithmetic 393Project: The Mandelbrot Set 397
7.6 Factoring Polynomials 398Investigation: The Box Factory 400
7.7 Higher-Degree Polynomials 405Investigation: The Largest Triangle 406
7.8 More About Finding Solutions 412
viii © 2004 Key Curriculum Press
Contents Page VIII http://acr.keypress.com/KeyPressPortalV3.0/ImportingCourses/DAA/co...
1 de 1 31-03-2009 18:45
Chapter 7 Review 419Take Another Look 421Assessing What You’ve Learned 422
CHAPTER Parametric Equations and Trigonometry 4238.1 Graphing Parametric Equations 424
Investigation: Simulating Motion 4268.2 Converting from Parametric to Nonparametric Equations 432
Investigation: Parametric Walk 4328.3 Right Triangle Trigonometry 439
Investigation: Two Ships 441Exploration: Parametric Equations for a Circle 447
Activity: Variations on a Circle 4488.4 Using Trigonometry to Set a Course 452
Investigation: Motion in a Current 452Project: Viewing Angle 459
8.5 Projectile Motion 460Investigation: Basketball Free Throw 463
8.6 The Law of Sines 468Investigation: Oblique Triangles 468
8.7 The Law of Cosines 476Investigation: Around the Corner 478Project: Catapult 482
Chapter 8 Review 483Take Another Look 486Assessing What You’ve Learned 486
CHAPTER Conic Sections and Rational Functions 4879.1 Using the Distance Formula 488
Investigation: Bucket Race 4889.2 Circles and Ellipses 496
Investigation: A Slice of Light 502 9.3 Parabolas 507
Investigation: Fold a Parabola 5119.4 Hyperbolas 514
Investigation: Passing By 518Exploration: Constructing the Conic Sections 523
Activity: From Circles to the Ellipse 5239.5 The General Quadratic 525
Investigation: Systems of Conic Equations 529Exploration: The Rotation Matrix 534
Activity: Around We Go 5349.6 Introduction to Rational Functions 536
Investigation: The Breaking Point 536
© 2004 Key Curriculum Press ix
Contents Page IX http://acr.keypress.com/KeyPressPortalV3.0/ImportingCourses/DAA/co...
1 de 1 31-03-2009 18:45
9.7 Graphs of Rational Functions 544Investigation: Predicting Asymptotes and Holes 545Project: Going Downhill Fast 550
9.8 Operations with Rational Expressions 551Project: Cyclic Hyperbolas 557
Chapter 9 Review 558Mixed Review 560Take Another Look 562Assessing What You’ve Learned 563
CHAPTER Trigonometric Functions 56410.1 Defining the Circular Functions 565
Investigation: Paddle Wheel 56610.2 Radian Measure and Arc Length 573
Investigation: A Circle of Radians 57310.3 Graphing Trigonometric Functions 583
Investigation: The Pendulum II 58510.4 Inverses of Trigonometric Functions 594
Investigation: Exploring the Inverses 595Project: Design a Picnic Table 600
10.5 Modeling with Trigonometric Equations 601Investigation: A Bouncing Spring 603Project: A Dampened Sine Curve 608
10.6 Fundamental Trigonometric Identities 609Investigation: Pythagorean Identities 610
10.7 Combining Trigonometric Functions 615Investigation: Sound Wave 616
Exploration:Polar Coordinates 622Activity: Rose Curves 623
Chapter 10 Review 625Take Another Look 627Assessing What You’ve Learned 628
x © 2004 Key Curriculum Press
Contents Page X http://acr.keypress.com/KeyPressPortalV3.0/ImportingCourses/DAA/co...
1 de 1 31-03-2009 18:46
CHAPTER Series 62911.1 Arithmetic Series 630
Investigation: Arithmetic Series Formula 63211.2 Infinite Geometric Series 637
Investigation: Infinite Geometric Series Formula 63811.3 Partial Sums of Geometric Series 644
Investigation: Geometric Series Formula 645Exploration: Seeing the Sum of a Series 650
Activity: A Geometric Series 650Chapter 11 Review 652
Take Another Look 653Assessing What You’ve Learned 654
CHAPTER Probability 65512.1 Randomness and Probability 656
Investigation: Flip a Coin 657Exploration: Geometric Probability 666
Activity: The Coin Toss Problem 66612.2 Counting Outcomes and Tree Diagrams 668
Investigation: The Multiplication Rule 669Exploration: The Law of Large Numbers 677
Activity: A Repeat Performance 67712.3 Mutually Exclusive Events and Venn Diagrams 679
Investigation: Addition Rule 68112.4 Random Variables and Expected Value 687
Investigation: “Dieing” for a Four 68712.5 Permutations and Probability 694
Investigation: Order and Arrange 69412.6 Combinations and Probability 703
Investigation: Winning the Lottery 70612.7 The Binomial Theorem and Pascal’s Triangle 710
Investigation: Pascal’s Triangle and Combination Numbers 710Chapter 12 Review 719
Take Another Look 722Assessing What You’ve Learned 722
© 2004 Key Curriculum Press xi
Contents Page XI http://acr.keypress.com/KeyPressPortalV3.0/ImportingCourses/DAA/co...
1 de 1 31-03-2009 18:46
CHAPTER Applications of Statistics 72313.1 Probability Distributions 724
Investigation: Pencil Lengths 725Project: Simpson’s Paradox 733
13.2 Normal Distributions 734Investigation: The Bell 734
Exploration: Normally Distributed Data 743Activity: Is This Normal? 743
13.3 z-Values and Confidence Intervals 745Investigation: Areas and Distributions 745
13.4 The Central Limit Theorem 752Investigation: Means of Samples 752
Exploration: Confidence Intervals for Binary Data 760Activity: Polling Voters 760
13.5 Bivariate Data and Correlation 763Investigation: Looking for Connections 764Project: Correlation vs. Causation 771
13.6 The Least Squares Line 772Investigation: Relating Variables 773
13.7 Nonlinear Regression 780Investigation: A Leaky Bottle Experiment 783Project: Making It Fit 787
Chapter 13 Review 788Mixed Review 790Take Another Look 794Assessing What You’ve Learned 795
Selected Answers 796
Glossary 848
Index 860
Photo Credits 872
xii © 2004 Key Curriculum Press
Contents Page XII http://acr.keypress.com/KeyPressPortalV3.0/ImportingCourses/DAA/co...
1 de 1 31-03-2009 18:46

Jerald Murdock
Ellen Kamischke
Eric Kamischke
The goal of this stage of your mathematical journey is to develop advancedalgebraic tools and the mathematical power that will help you participate
fully as a productive citizen in a changing world. On this journey you will makeconnections between algebra and the world around you.Important decision-making situations will confront you in life, and your ability touse mathematics and algebra can help you make informed decisions. You’ll needskills that can evolve and be adapted to new situations. You’ll need to interpretnumerical information and use it as a basis for making decisions. And you’ll needto find ways to solve problems that arise in real life, not just in textbooks. Successin algebra is also a recognized gateway to many varied career opportunities.You’ve already found out that learning algebra is more than memorizing facts,theories, and procedures. With your teacher as a guide, you’ll learn algebra bydoing mathematics. You’ll make sense of important algebraic concepts, learnessential skills, and discover how to use algebra. This requires a far biggercommitment than just “waiting for the teacher to show you” or studyingworked-out examples.Your personal involvement is critical to successful group work duringInvestigations. Keep your measurements, data, and calculations neat and accurateto make your work easier and the concepts clearer in the long run. Talk aboutalgebra, share ideas, and learn from and with your fellow group members. Workand communicate with your teammates to strengthen your understanding of themathematical concepts. To enjoy and gain respect in your role as a team player,honor differences among group members, listen carefully when others are sharing,stay focused during the process, be responsible and respectful, and share yourown ideas and suggestions.The right technology can help you explore new ideas and answer questions thatcome up along the way. Using a graphing calculator, you will be able to manipulatelarge amounts of data quickly so that you can see the overall picture. Throughoutthe text you can refer to Calculator Notes for information that will help you usethis tool. Technology is likely to play an important role in your life and futurecareer. Learning to use your graphing calculator efficiently today, and being ableto interpret its output, will prepare you to use other technologies successfully insituations to come.The book itself will be a guide, leading you to explore ideas and ponder questions.Read it carefully—with paper, pencil, and calculator close at hand—and take goodnotes. Concepts and problems you have encountered before can help you solve newproblems. Work through the Examples and answer the questions that are askedalong the way. Some Exercises require a great deal of thought. Don’t give up. Makea solid attempt at each problem that is assigned. Sometimes you’ll make correctionsand fill in details later, after you discuss a problem in class. Features called Project,Improving Your . . . Skills, and Take Another Look will challenge you to extendyour learning and to apply it in creative ways.
© 2004 Key Curriculum Press xiii
A Note to Students from the Authors xiii http://acr.keypress.com/KeyPressPortalV3.0/ImportingCourses/DAA/a...
1 de 1 31-03-2009 18:48

Just as this book is your guide, your notebook can be a log of your travels throughadvanced algebra. In it you will record your notes and your work. You may alsowant to keep a journal of your personal impressions along the way. And just asevery trip results in a photo album, you can place some of your especially notableaccomplishments in a portfolio that highlights your trip. Collect pieces of work inyour portfolio as you go, and refine the contents as you make progress on yourjourney. Each chapter ends with Assessing What You’ve Learned. This featuresuggests ways to review your progress and prepare for what comes next: organizingyour notebook, writing in your journal, updating your portfolio, and other ways toreflect on what you have learned.
You should expect struggles, hard work, and occasional frustration. Yet, as yougain more algebra skills, you’ll overcome obstacles and be rewarded with a deeperunderstanding of mathematics, an increased confidence in your own problem-solvingabilities, and the opportunity to be creative. From time to time, lookback to reflect on where you have been. We hope that your journey throughDiscovering Advanced Algebra will be a meaningful and rewarding experience.
And now it is time to begin. You are about to discover some pretty fascinatingthings.
xiv © 2004 Key Curriculum Press
A Note to Students from the Authors xiv http://acr.keypress.com/KeyPressPortalV3.0/ImportingCourses/DAA/a...
1 de 1 31-03-2009 18:48
© 2004 Key Curriculum Press
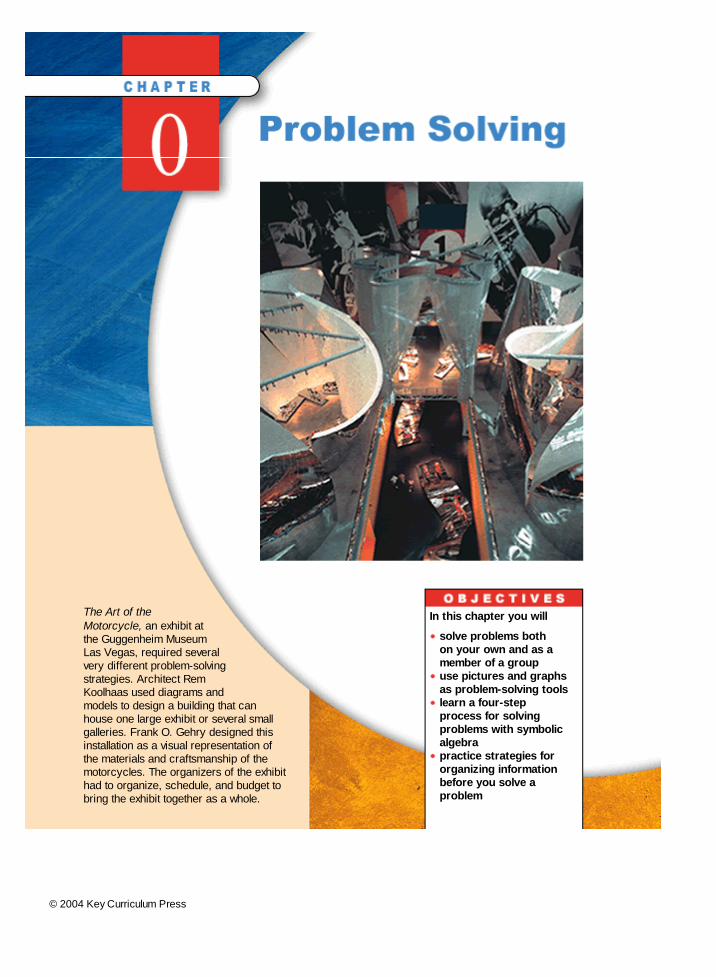
The Art of theMotorcycle, an exhibit atthe Guggenheim MuseumLas Vegas, required severalvery different problem-solvingstrategies. Architect RemKoolhaas used diagrams andmodels to design a building that canhouse one large exhibit or several smallgalleries. Frank O. Gehry designed thisinstallation as a visual representation ofthe materials and craftsmanship of themotorcycles. The organizers of the exhibithad to organize, schedule, and budget tobring the exhibit together as a whole.
In this chapter you will
solve problems bothon your own and as amember of a groupuse pictures and graphsas problem-solving toolslearn a four-stepprocess for solvingproblems with symbolicalgebrapractice strategies for
organizing informationbefore you solve aproblem
Chapter 0 Page 1 http://acr.keypress.com/KeyPressPortalV3.0/ImportingCourses/DAA/ch...
1 de 1 31-03-2009 18:48
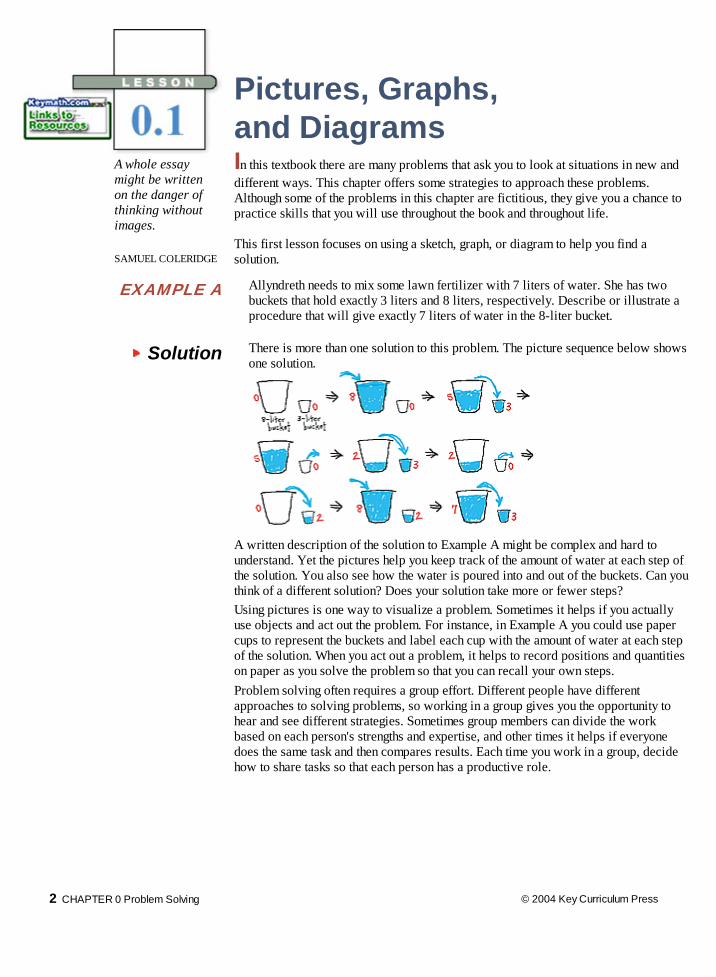
A whole essaymight be writtenon the danger ofthinking withoutimages.
SAMUEL COLERIDGE
Pictures, Graphs,and Diagrams
In this textbook there are many problems that ask you to look at situations in new anddifferent ways. This chapter offers some strategies to approach these problems.Although some of the problems in this chapter are fictitious, they give you a chance topractice skills that you will use throughout the book and throughout life.
This first lesson focuses on using a sketch, graph, or diagram to help you find asolution.
EXAMPLE A Allyndreth needs to mix some lawn fertilizer with 7 liters of water. She has twobuckets that hold exactly 3 liters and 8 liters, respectively. Describe or illustrate aprocedure that will give exactly 7 liters of water in the 8-liter bucket.
Solution There is more than one solution to this problem. The picture sequence below showsone solution.
A written description of the solution to Example A might be complex and hard tounderstand. Yet the pictures help you keep track of the amount of water at each step ofthe solution. You also see how the water is poured into and out of the buckets. Can youthink of a different solution? Does your solution take more or fewer steps?
Using pictures is one way to visualize a problem. Sometimes it helps if you actuallyuse objects and act out the problem. For instance, in Example A you could use papercups to represent the buckets and label each cup with the amount of water at each stepof the solution. When you act out a problem, it helps to record positions and quantitieson paper as you solve the problem so that you can recall your own steps.
Problem solving often requires a group effort. Different people have different
approaches to solving problems, so working in a group gives you the opportunity tohear and see different strategies. Sometimes group members can divide the workbased on each person's strengths and expertise, and other times it helps if everyonedoes the same task and then compares results. Each time you work in a group, decidehow to share tasks so that each person has a productive role.
2 CHAPTER 0 Problem Solving © 2004 Key Curriculum Press
Lesson http://acr.keypress.com/KeyPressPortalV3.0/Viewer/Lesson.htm
1 de 5 31-03-2009 18:49
© 2004 Key Curriculum Press LESSON 0.1 Pictures, Graphs, and Diagrams 3
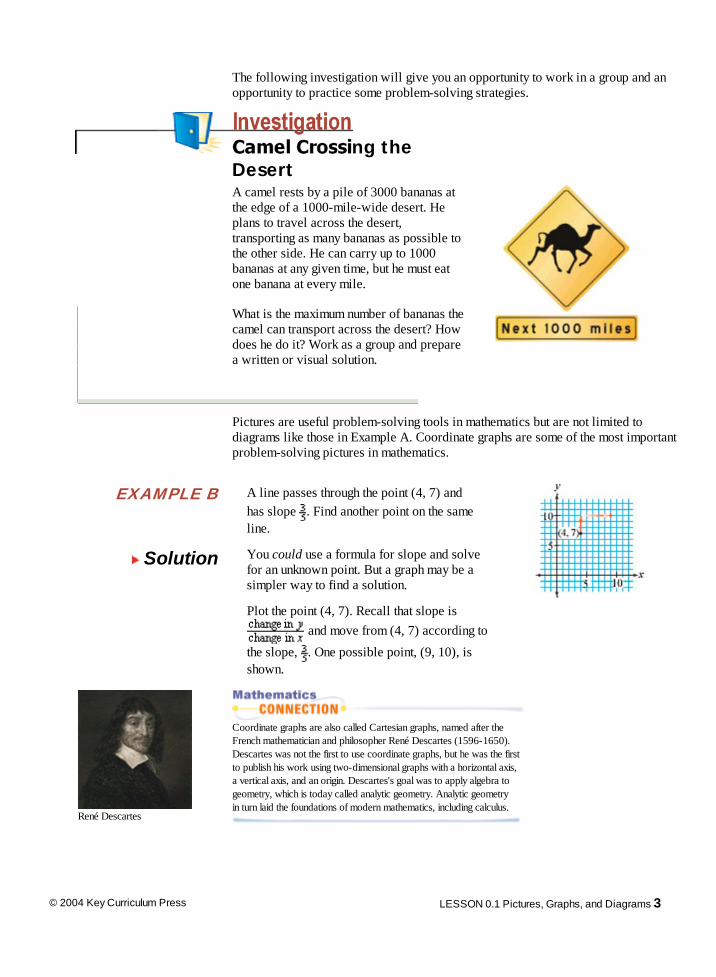
The following investigation will give you an opportunity to work in a group and anopportunity to practice some problem-solving strategies.
A camel rests by a pile of 3000 bananas at
the edge of a 1000-mile-wide desert. Heplans to travel across the desert,transporting as many bananas as possible tothe other side. He can carry up to 1000bananas at any given time, but he must eatone banana at every mile.
What is the maximum number of bananas thecamel can transport across the desert? Howdoes he do it? Work as a group and preparea written or visual solution.
Pictures are useful problem-solving tools in mathematics but are not limited to
diagrams like those in Example A. Coordinate graphs are some of the most importantproblem-solving pictures in mathematics.
EXAMPLE B A line passes through the point (4, 7) and has slope . Find another point on the same
line.
Solution You could use a formula for slope and solvefor an unknown point. But a graph may be asimpler way to find a solution.
Plot the point (4, 7). Recall that slope is and move from (4, 7) according to
the slope, . One possible point, (9, 10), isshown.
René Descartes
Coordinate graphs are also called Cartesian graphs, named after theFrench mathematician and philosopher René Descartes (1596-1650).Descartes was not the first to use coordinate graphs, but he was the firstto publish his work using two-dimensional graphs with a horizontal axis,a vertical axis, and an origin. Descartes's goal was to apply algebra togeometry, which is today called analytic geometry. Analytic geometryin turn laid the foundations of modern mathematics, including calculus.
Camel Crossing theDesert
Lesson http://acr.keypress.com/KeyPressPortalV3.0/Viewer/Lesson.htm
2 de 5 31-03-2009 18:49
Although pictures and diagrams have been the focus of this lesson, problem solving requires that you use avariety of strategies. As you work on the exercises, don't limit yourself. You are always welcome to use anyand all of the strategies that you know.
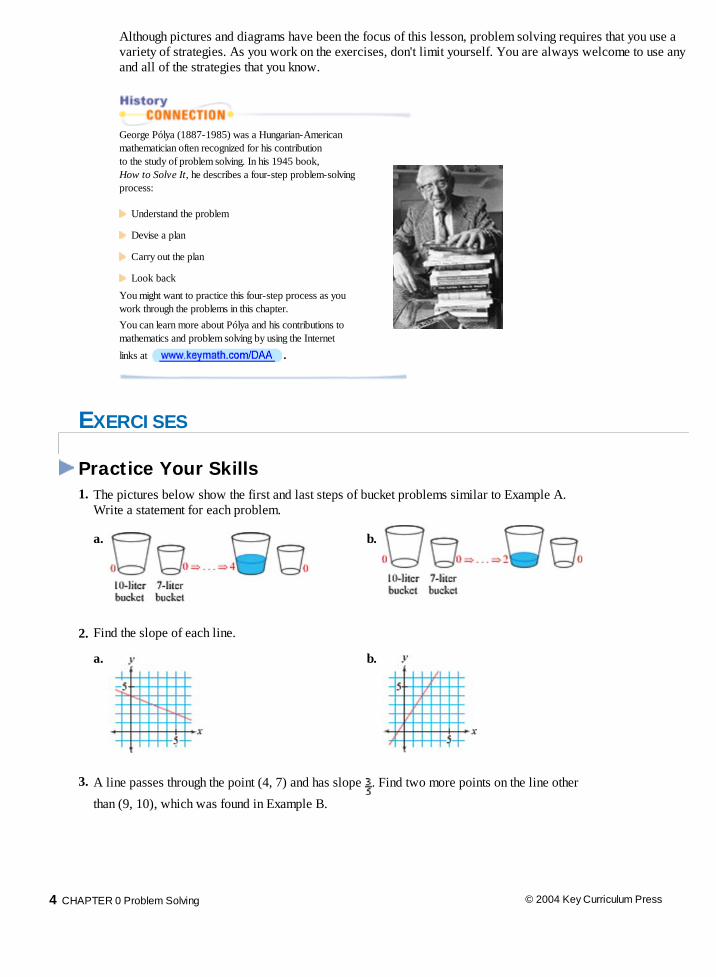
George Pólya (1887-1985) was a Hungarian-Americanmathematician often recognized for his contributionto the study of problem solving. In his 1945 book,How to Solve It, he describes a four-step problem-solvingprocess:
Understand the problem
Devise a plan
Carry out the plan
Look back
You might want to practice this four-step process as youwork through the problems in this chapter.
You can learn more about Pólya and his contributions tomathematics and problem solving by using the Internetlinks at .
EXERCISES
Practice Your Skills 1. The pictures below show the first and last steps of bucket problems similar to Example A.
Write a statement for each problem. a. b.
2. Find the slope of each line.
a. b.
3. A line passes through the point (4, 7) and has slope . Find two more points on the line other
than (9, 10), which was found in Example B.
4 CHAPTER 0 Problem Solving © 2004 Key Curriculum Press
Lesson http://acr.keypress.com/KeyPressPortalV3.0/Viewer/Lesson.htm
3 de 5 31-03-2009 18:49
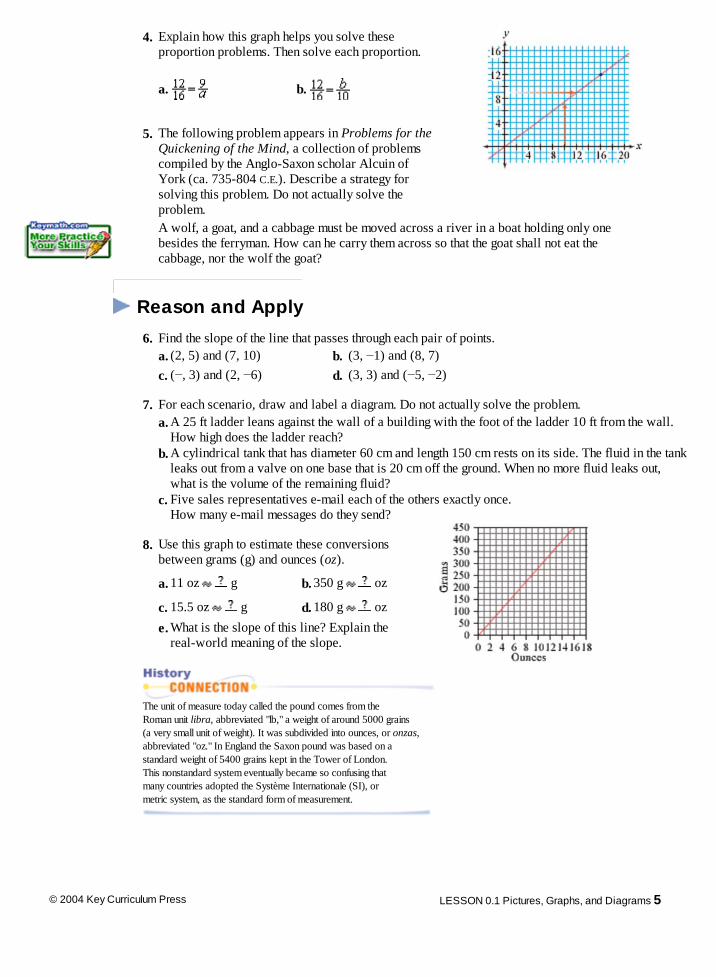
4. Explain how this graph helps you solve theseproportion problems. Then solve each proportion.
a. b.
5. The following problem appears in Problems for theQuickening of the Mind, a collection of problemscompiled by the Anglo-Saxon scholar Alcuin ofYork (ca. 735-804 C.E.). Describe a strategy forsolving this problem. Do not actually solve theproblem.
A wolf, a goat, and a cabbage must be moved across a river in a boat holding only onebesides the ferryman. How can he carry them across so that the goat shall not eat thecabbage, nor the wolf the goat?
Reason and Apply
6. Find the slope of the line that passes through each pair of points. a. (2, 5) and (7, 10) b. (3, −1) and (8, 7)
c. (−, 3) and (2, −6) d. (3, 3) and (−5, −2)
7. For each scenario, draw and label a diagram. Do not actually solve the problem. a. A 25 ft ladder leans against the wall of a building with the foot of the ladder 10 ft from the wall.
How high does the ladder reach? b. A cylindrical tank that has diameter 60 cm and length 150 cm rests on its side. The fluid in the tank
leaks out from a valve on one base that is 20 cm off the ground. When no more fluid leaks out,what is the volume of the remaining fluid?
c. Five sales representatives e-mail each of the others exactly once.How many e-mail messages do they send?
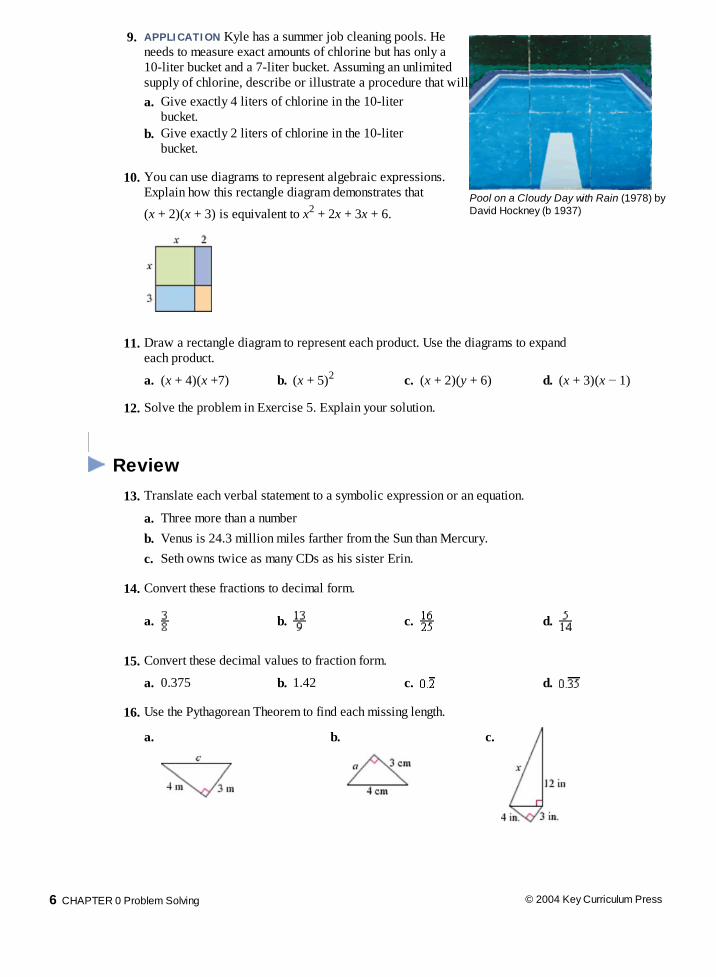
8. Use this graph to estimate these conversionsbetween grams (g) and ounces (oz).
a. 11 oz g b. 350 g oz
c. 15.5 oz g d. 180 g oz
e. What is the slope of this line? Explain thereal-world meaning of the slope.
The unit of measure today called the pound comes from theRoman unit libra, abbreviated "lb," a weight of around 5000 grains(a very small unit of weight). It was subdivided into ounces, or onzas,abbreviated "oz." In England the Saxon pound was based on astandard weight of 5400 grains kept in the Tower of London.This nonstandard system eventually became so confusing thatmany countries adopted the Système Internationale (SI), ormetric system, as the standard form of measurement.
© 2004 Key Curriculum Press LESSON 0.1 Pictures, Graphs, and Diagrams 5
Lesson http://acr.keypress.com/KeyPressPortalV3.0/Viewer/Lesson.htm
4 de 5 31-03-2009 18:49
9. APPLICATION Kyle has a summer job cleaning pools. Heneeds to measure exact amounts of chlorine but has only a10-liter bucket and a 7-liter bucket. Assuming an unlimitedsupply of chlorine, describe or illustrate a procedure that will
Pool on a Cloudy Day with Rain (1978) byDavid Hockney (b 1937)
a. Give exactly 4 liters of chlorine in the 10-literbucket.
b. Give exactly 2 liters of chlorine in the 10-liter
bucket.
10. You can use diagrams to represent algebraic expressions.Explain how this rectangle diagram demonstrates that
(x + 2)(x + 3) is equivalent to x2 + 2x + 3x + 6.
11. Draw a rectangle diagram to represent each product. Use the diagrams to expandeach product.
a. (x + 4)(x +7) b. (x + 5)2 c. (x + 2)(y + 6) d. (x + 3)(x − 1)
12. Solve the problem in Exercise 5. Explain your solution.
Review
13. Translate each verbal statement to a symbolic expression or an equation.
a. Three more than a number b. Venus is 24.3 million miles farther from the Sun than Mercury. c. Seth owns twice as many CDs as his sister Erin.
14. Convert these fractions to decimal form.
a. b. c. d.
15. Convert these decimal values to fraction form.
a. 0.375 b. 1.42 c. d.
16. Use the Pythagorean Theorem to find each missing length. a. b. c.
6 CHAPTER 0 Problem Solving © 2004 Key Curriculum Press
Lesson http://acr.keypress.com/KeyPressPortalV3.0/Viewer/Lesson.htm
5 de 5 31-03-2009 18:49
Symbolic Representation The customer service team had planned to
double the number of calls answered thesecond day, but they exceeded that by threedozen. Seventy-five dozen customer servicecalls in two days set a new record.
....................................... You can translate the paragraph
above into an algebraic equation.Although you don't know how manycalls were answered each day, anequation will help you figure it out.
For many years, problems like thiswere solved without writing equations.
Then, around the 17th century, the development of symbolic algebra madewriting equations and finding solutions much simpler. Verbal statementscould then be translated into symbols by representing unknown quantitieswith letters, called variables, and converting the rest of the sentence intonumbers and operations. (You will actually translate this telephone callproblem into algebraic notation when you do the exercises.)
The postage stampabove depictsal-Khwārizm and wasissued in the formerSoviet Union. At left isthe title page ofal-Khwārizm 's treatiseon algebra.
Muhammad ibn M s al-Khw rizm(ca. 780-850 C.E.), an Iraqi mathematician, wrote the first algebra treatise. The wordalgebra comes from the treatise's title,Kitāb al-jabr wa'al-muq balah, which translatesto The Science of Completion and Balancing.Al-Khw rizm wanted the algebra in this treatiseto address real-world problems that affectedthe everyday lives of the people, such asmeasuring land and doing trade. You canlearn more about Al-Khw rizm and thehistory of algebra by using the links at
.
Language is very complex and subtle, designed for general descriptions andqualitative communication. For quantitative communication, translating words intosymbols can be a very helpful problem-solving skill. The symbols stand for numbersthat vary or remain constant, that are given in the problem, or that are unknown. Inapplications, the numbers quantify data such as time, weight, or position.
© 2004 Key Curriculum Press LESSON 0.2 Symbolic Representation 7
Lesson http://acr.keypress.com/KeyPressPortalV3.0/Viewer/Lesson.htm
1 de 7 31-03-2009 18:49
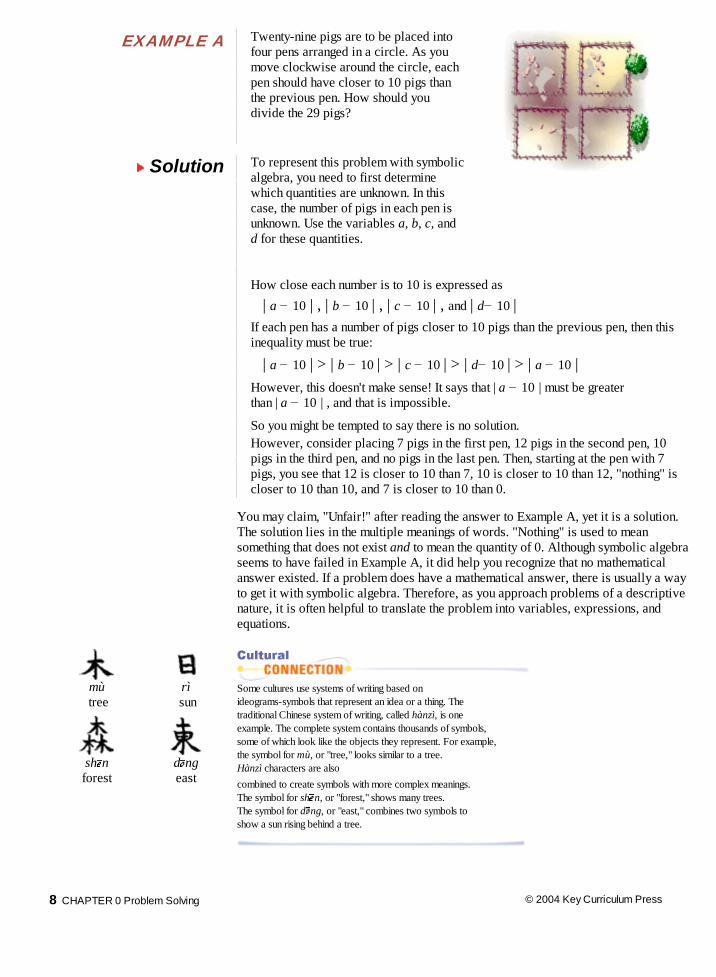
EXAMPLE A Twenty-nine pigs are to be placed intofour pens arranged in a circle. As youmove clockwise around the circle, eachpen should have closer to 10 pigs thanthe previous pen. How should youdivide the 29 pigs?
Solution To represent this problem with symbolicalgebra, you need to first determinewhich quantities are unknown. In thiscase, the number of pigs in each pen isunknown. Use the variables a, b, c, andd for these quantities.
How close each number is to 10 is expressed as | a − 10 | , | b − 10 | , | c − 10 | , and | d− 10 | If each pen has a number of pigs closer to 10 pigs than the previous pen, then this
inequality must be true: | a − 10 | > | b − 10 | > | c − 10 | > | d− 10 | > | a − 10 | However, this doesn't make sense! It says that | a − 10 | must be greater
than | a − 10 | , and that is impossible. So you might be tempted to say there is no solution. However, consider placing 7 pigs in the first pen, 12 pigs in the second pen, 10
pigs in the third pen, and no pigs in the last pen. Then, starting at the pen with 7pigs, you see that 12 is closer to 10 than 7, 10 is closer to 10 than 12, "nothing" iscloser to 10 than 10, and 7 is closer to 10 than 0.
You may claim, "Unfair!" after reading the answer to Example A, yet it is a solution.The solution lies in the multiple meanings of words. "Nothing" is used to meansomething that does not exist and to mean the quantity of 0. Although symbolic algebraseems to have failed in Example A, it did help you recognize that no mathematicalanswer existed. If a problem does have a mathematical answer, there is usually a wayto get it with symbolic algebra. Therefore, as you approach problems of a descriptivenature, it is often helpful to translate the problem into variables, expressions, andequations.
mù
tree rì
sun
sh nforest
d ngeast
Some cultures use systems of writing based onideograms-symbols that represent an idea or a thing. Thetraditional Chinese system of writing, called hànzì, is oneexample. The complete system contains thousands of symbols,some of which look like the objects they represent. For example,the symbol for mù, or "tree," looks similar to a tree.Hànzì characters are alsocombined to create symbols with more complex meanings.The symbol for sh n, or "forest," shows many trees.The symbol for d ng, or "east," combines two symbols toshow a sun rising behind a tree.
8 CHAPTER 0 Problem Solving © 2004 Key Curriculum Press
Lesson http://acr.keypress.com/KeyPressPortalV3.0/Viewer/Lesson.htm
2 de 7 31-03-2009 18:49
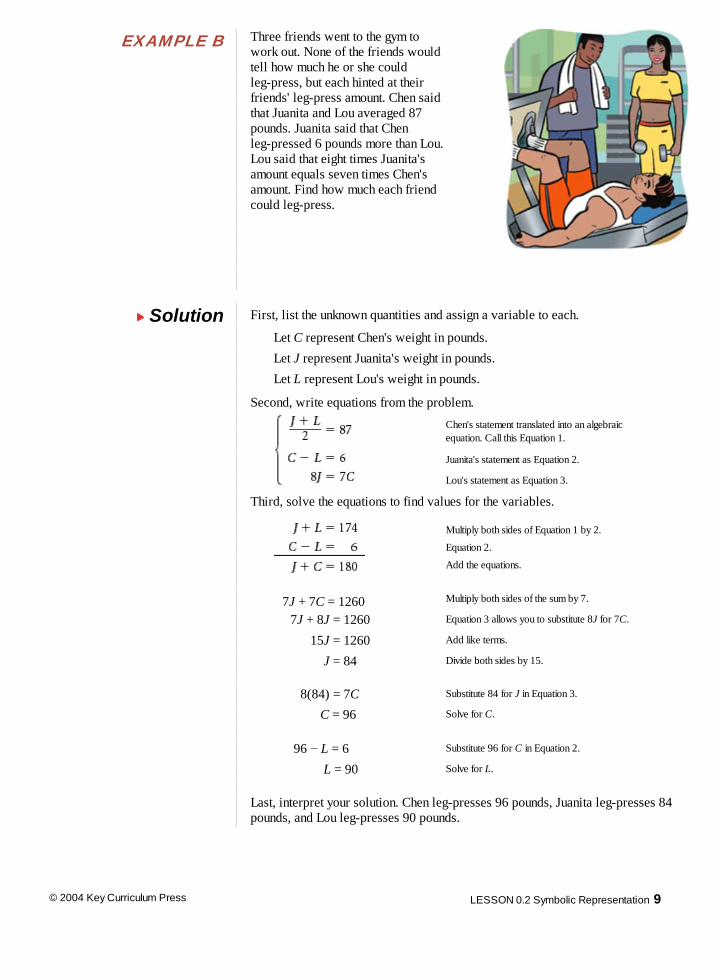
EXAMPLE B Three friends went to the gym towork out. None of the friends wouldtell how much he or she couldleg-press, but each hinted at theirfriends' leg-press amount. Chen saidthat Juanita and Lou averaged 87pounds. Juanita said that Chenleg-pressed 6 pounds more than Lou.Lou said that eight times Juanita'samount equals seven times Chen'samount. Find how much each friendcould leg-press.
Solution First, list the unknown quantities and assign a variable to each.
Let C represent Chen's weight in pounds. Let J represent Juanita's weight in pounds. Let L represent Lou's weight in pounds. Second, write equations from the problem.
Chen's statement translated into an algebraic
equation. Call this Equation 1.
Juanita's statement as Equation 2.
Lou's statement as Equation 3.
Third, solve the equations to find values for the variables.
Multiply both sides of Equation 1 by 2.
Equation 2.
Add the equations.
7J + 7C = 1260 Multiply both sides of the sum by 7.
7J + 8J = 1260 Equation 3 allows you to substitute 8J for 7C.
15J = 1260 Add like terms.
J = 84 Divide both sides by 15.
8(84) = 7C Substitute 84 for J in Equation 3.
C = 96 Solve for C.
96 − L = 6 Substitute 96 for C in Equation 2.
L = 90 Solve for L.
Last, interpret your solution. Chen leg-presses 96 pounds, Juanita leg-presses 84pounds, and Lou leg-presses 90 pounds.
© 2004 Key Curriculum Press LESSON 0.2 Symbolic Representation 9
Lesson http://acr.keypress.com/KeyPressPortalV3.0/Viewer/Lesson.htm
3 de 7 31-03-2009 18:49
10 CHAPTER 0 Problem Solving © 2004 Key Curriculum Press
You may notice that Example B used a four-step solution process. Theinvestigation will give you a chance to try these four steps on your own orwith a group.
Select one or more of the problems below, and use these four steps to find a solution.
Step 1 List the unknown quantities, and assign a variable to each.
Step 2 Write one or more equations that relate the unknown quantities to conditions of theproblem.
Step 3 Solve the equations to find a value for each variable.
Step 4 Interpret your solution according to the context of the problem.
When you finish, write a paragraph answering this question: Which of the four problem-solving steps was hardest for you? Why?
Problem 1 When Adam and his sister Megan arrive at a party, they see that there is 1 adult chaperone
for every 4 kids. Right behind them come 30 more boys, and Megan notices that the ratio isnow 2 boys to 1 girl. However, behind the extra boys come 30 more girls, and Adamnotices that there are now 4 girls for every 3 boys. What is the final ratio of adultchaperones to kids?
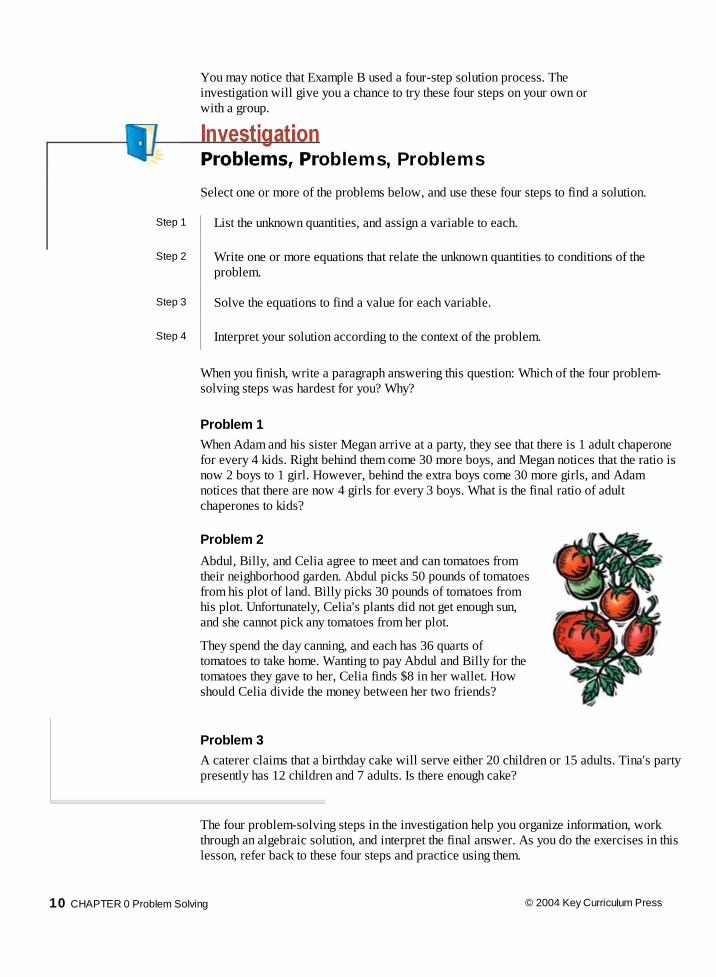
Problem 2 Abdul, Billy, and Celia agree to meet and can tomatoes fromtheir neighborhood garden. Abdul picks 50 pounds of tomatoesfrom his plot of land. Billy picks 30 pounds of tomatoes fromhis plot. Unfortunately, Celia's plants did not get enough sun,and she cannot pick any tomatoes from her plot.
They spend the day canning, and each has 36 quarts oftomatoes to take home. Wanting to pay Abdul and Billy for thetomatoes they gave to her, Celia finds $8 in her wallet. Howshould Celia divide the money between her two friends?
Problem 3 A caterer claims that a birthday cake will serve either 20 children or 15 adults. Tina's party
presently has 12 children and 7 adults. Is there enough cake?
The four problem-solving steps in the investigation help you organize information, workthrough an algebraic solution, and interpret the final answer. As you do the exercises in thislesson, refer back to these four steps and practice using them.
Problems, Problems, Problems
Lesson http://acr.keypress.com/KeyPressPortalV3.0/Viewer/Lesson.htm
4 de 7 31-03-2009 18:49
EXERCISES You will need Geometry software
for Exercise 16 Practice Your Skills
1. Explain what you would do to change the first equation to the second.
a. a + 12 = 47 b.5b = 24 c. −18 + c =28 d.
a = 35 b = 4.8 c =46 d = – 67.5
2. Which equation would help you solve the following problem? Each member of the committee made three copies of the letter to the senator. Adding these to the 5
original letters, there are now a total of 32 letters. How large is the committee? A. 5 + c = 32 B. 3 + 5c = 32 C. 5 + 3c = 32
3. Solve each equation. a. 5 + c = 32 b. 3 + 5c = 32 c. 5 + 3c = 32
4. Which equation would help you solve this problem? What does x represent?
The customer service team had planned to double the number of calls answered the second day, butthey exceeded that by three dozen. Seventy-five dozen customer service calls in two days set a newrecord.
A. x + 3 = 75 B. x + 2x + 3 = 75 C. 2x + 3 = 75
5. Solve each equation. a. x + 3 = 75 b. x + 2x + 3 = 75 c. 2x + 3 = 75
Reason and Apply
6. Here is a problem and three related equations.Anita buys 6 large beads and 20 small beadsto make a necklace. Ivan buys 4 large and25 small beads for his necklace. Jill selects8 large and 16 small beads to make an anklebracelet. Without tax, Anita pays $2.70,and Ivan pays $2.85. How much will Jill pay?
This necklace was crafted around the3rd to 2nd millennium B.C.E. in the southwestAsian country of Bactria (now in Afghanistan).
a. What do the variables L, S, and J represent?
b. What are the units of L, S, and J ?
c. What does Equation 1 represent?
© 2004 Key Curriculum Press LESSON 0.2 Symbolic Representation 11
Lesson http://acr.keypress.com/KeyPressPortalV3.0/Viewer/Lesson.htm
5 de 7 31-03-2009 18:49
7. Follow these steps to solve Exercise 6. a. Multiply Equation 1 by negative two. b. Multiply Equation 2 by three. c. Add the resulting equations from 7a and b. d. Solve the equation in 7c for S. Interpret the real-world meaning of this solution. e. Use the value of S to find the value of L. Interpret the real-world meaning of the value of L.
f. Use the values of S and L to find the value of J. Interpret this solution.
8. The following problem appears in Liber abaci (1202), or Book of Calculations, by the Italian mathematicianLeonardo Fibonacci (ca. 1170-1240).
If A gets 7 denarii from B, then A's sum is fivefold B's. If B gets 5 denarii from A, then B's sum is sevenfold A's.How much has each?
a. What does a represent? b. What does b represent? c. Explain Equation 1 with words. d. Explain Equation 2 with words.
9. Use Equations 1 and 2 from Exercise 8. a. Explain how to get b + 5 = 7((5b −42) −5) b. Solve the equation in 9a for b. c. Use your answer from 9b to find the value of a. d. Use the context of Exercise 8 to interpret the values of a and b.
10. According to Mrs. Randolph's will, each of her great-grandchildren living in Georgia received $700 more thaneach of her great-grandchildren living in Florida. In all, $206,100 was divided between 36 great-grandchildren.The Georgian great-grandchildren decide that the will wasn't really fair, so they each contribute $175 to bedivided among the Floridian great-grandchildren. If all great-grandchildren now have an equal share, how manygreat-grandchildren live in Georgia?
a. List the unknown quantities and assign a variable to each. b. Write one or more equations that relate the variables to conditions of the problem. c. Solve the equations to find a value for each variable. d. Interpret the value of each variable according to the context of the problem.
Review 11. APPLICATION A 30°-60°-90° triangle and a
45°-45°-90° triangle are two drafting tools usedby people in careers such as engineering,architecture, and drafting. The angles in bothtriangle tools are combined to make a variety ofangle measures in hand-drawn technicaldrawings, such as blueprints. Describe orillustrate a procedure that will give thefollowing angle measures.
a. 15° b. 75° c. 105°
12 CHAPTER 0 Problem Solving © 2004 Key Curriculum Press
Lesson http://acr.keypress.com/KeyPressPortalV3.0/Viewer/Lesson.htm
6 de 7 31-03-2009 18:49
© 2004 Key Curriculum Press LESSON 0.2 Symbolic Representation 13
12. Rewrite each expression without parentheses. a. 3(x + 7) b. −2(6 − n) c. x(4 − x)
13. Substitute the given value of the variable(s) in each expression and evaluate. a. 47 + 3x when x = 17 b. 29 − 34n + 14m when n = −1 and m = −24
14. Find the slope of the line that passes through each pair of points. a. (4, 7) and (8, 7) b. (2, 5) and (−6, 3)
15. Rudy is renting a cabin on Lake Tahoe. He wants to make a recipe for hot chocolate that calls for 1cup of milk. Unfortunately, the cabin is not well stocked, and he has only a 1-gallon container of milk,a 4-cup saucepan, and an empty 12-ounce soda can. Describe or illustrate a process that Rudy can useto measure exactly 1 cup of milk. (There are 8 ounces per cup and 16 cups per gallon.)
16. Technology Use geometry software to construct a line through two points. Measure the coordinatesof the points and use them to calculate the slope. Observe how the value of the slope changes as youmove one of the points. What is the slope when the line is horizontal? Vertical? What otherobservations can you make?
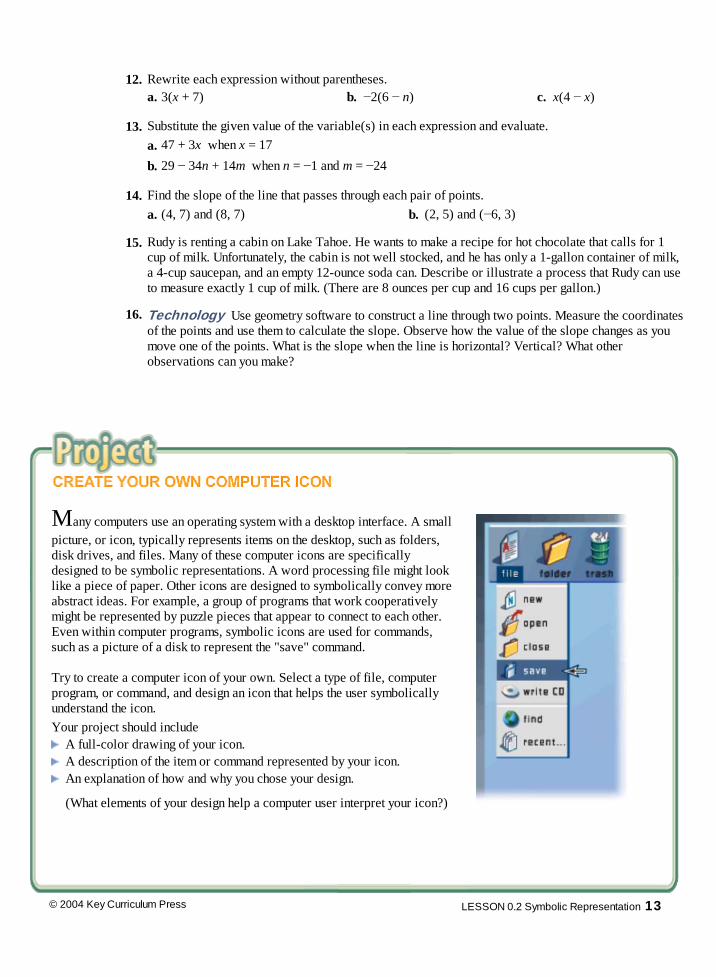
Many computers use an operating system with a desktop interface. A small
picture, or icon, typically represents items on the desktop, such as folders,disk drives, and files. Many of these computer icons are specificallydesigned to be symbolic representations. A word processing file might looklike a piece of paper. Other icons are designed to symbolically convey moreabstract ideas. For example, a group of programs that work cooperativelymight be represented by puzzle pieces that appear to connect to each other.Even within computer programs, symbolic icons are used for commands,such as a picture of a disk to represent the "save" command. Try to create a computer icon of your own. Select a type of file, computerprogram, or command, and design an icon that helps the user symbolicallyunderstand the icon.Your project should include
A full-color drawing of your icon.A description of the item or command represented by your icon.An explanation of how and why you chose your design.
(What elements of your design help a computer user interpret your icon?)
Lesson http://acr.keypress.com/KeyPressPortalV3.0/Viewer/Lesson.htm
7 de 7 31-03-2009 18:49
Know Need to know Speed of first lap: 50 mi/h Speed of second lap (in mi/h): s
Average speed for both laps: 100 mi/h Length of each lap (in mi): l
Time for first lap (in h): t1
Time for second lap (in h): t2
Everybody gets somuch informationall day long thatthey lose theircommon sense.
GERTRUDE STEIN
Organizing Information
If one and a half chickens lay one and a half eggs in one and a half days, then howlong does it take six monkeys to make nine omelets?
............................................... What sort of problem-solving strategy can you apply to the silly problem above?
You could draw a picture or make a diagram. You could assign variables to all sortsof unknown quantities. But do you really have enough information to solve theproblem? Sometimes the best strategy is to begin by organizing what you know andwhat you want to know. With the information organized, you may then find a way toget to the solution.
There are different methods of organizing information. One valuable technique usesthe units in the problem to help you see how the information fits together.
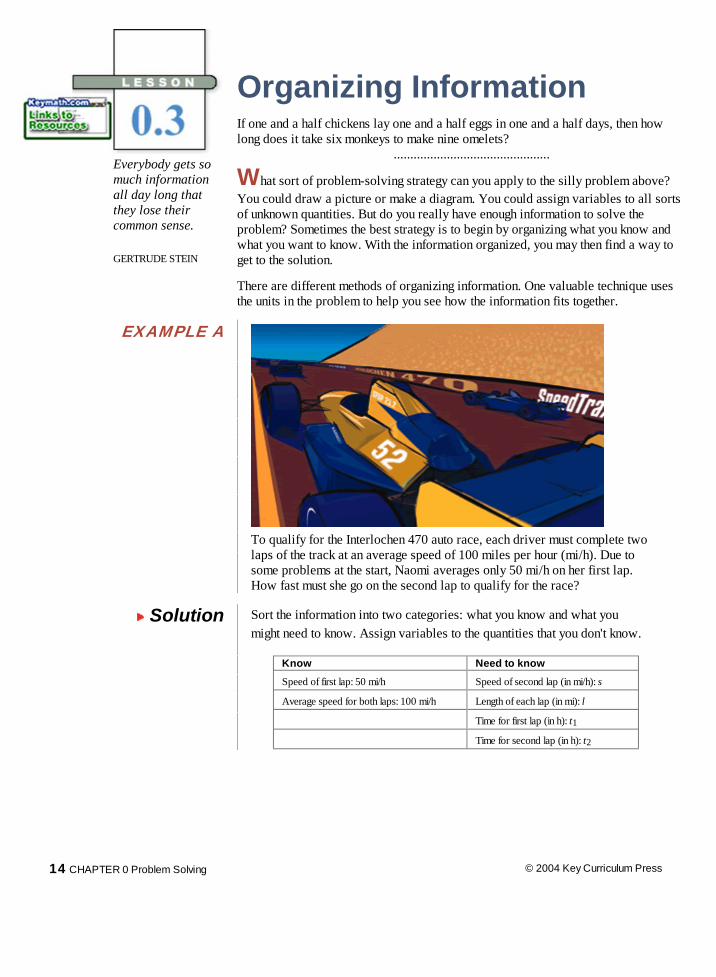
EXAMPLE A To qualify for the Interlochen 470 auto race, each driver must complete two
laps of the track at an average speed of 100 miles per hour (mi/h). Due tosome problems at the start, Naomi averages only 50 mi/h on her first lap.How fast must she go on the second lap to qualify for the race?
Solution Sort the information into two categories: what you know and what you might need to know. Assign variables to the quantities that you don't know.
14 CHAPTER 0 Problem Solving © 2004 Key Curriculum Press
Lesson http://acr.keypress.com/KeyPressPortalV3.0/Viewer/Lesson.htm
1 de 8 31-03-2009 18:50
Next, look at the units to find connections between the pieces of information. Speed ismeasured in miles per hour and therefore calculated by dividing distance by time, soyou can write these equations:
The speed, distance, and time for the first lap. The second lap. The average speed needed for both laps to qualify.
You can write the first and third equations as
This means that the time for the first lap, t1, and the time for both laps together (t1 + t2), are the same and t2 = 0. There is no time at all to complete the second lap.
It is not possible for Naomi to qualify for the race.
In Example A, it was easy to find relationships between the known and unknown quantitiesbecause the units were miles, hours, or miles per hour. Sometimes you will need to usecommon knowledge to make the intermediate connections between the units.
EXAMPLE B How many seconds are in a calendar year?
Solution First, identify what you know and
This fragment of an ancient Roman calendar showsmonths, days, and special events. You can learnhow to read Roman calendars, or fasti, with anInternet link at
.
what you want to know.
Know Need to know
1 year Number of seconds
It may seem like you don't have enoughinformation, but consider these commonlyknown facts:
1 year = 365 days (non-leap-year) 1 day = 24 hours 1 hour = 60 minutes 1 minute = 60 seconds You can write each equality as a fraction
and multiply the chain of fractions suchthat the units reduce to leave seconds.
There are 31,536,000 seconds in a non-leap-year calendar year.
© 2004 Key Curriculum Press LESSON 0.3 Organizing Information 15
Lesson http://acr.keypress.com/KeyPressPortalV3.0/Viewer/Lesson.htm
2 de 8 31-03-2009 18:50
Some problems overwhelm you with lots of information. Identifying and categorizing what youknow is always a good way to start organizing information.
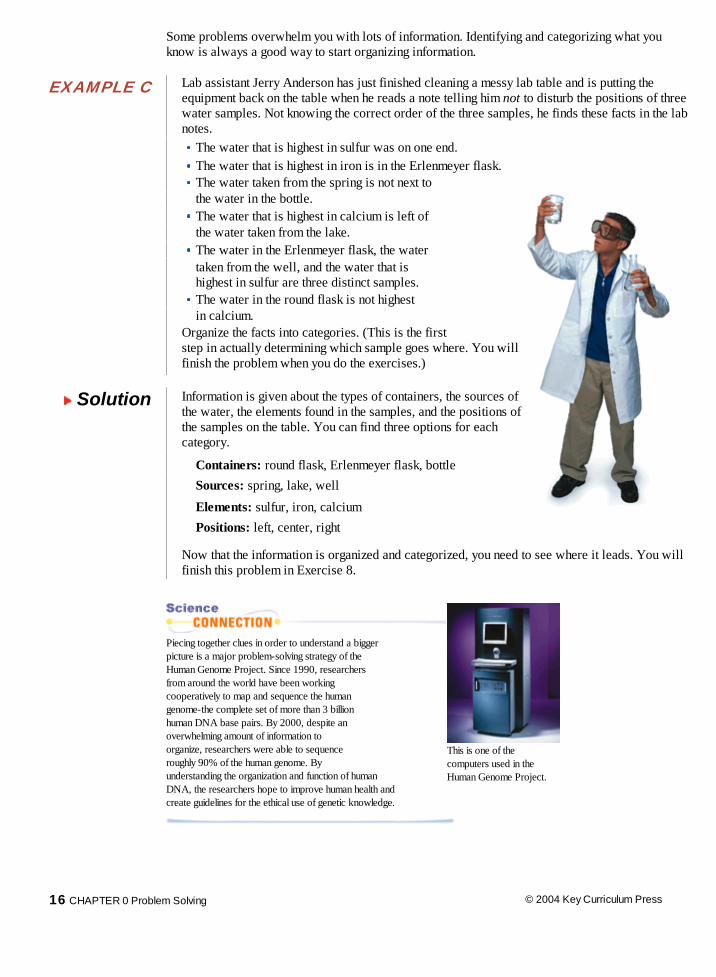
EXAMPLE C Lab assistant Jerry Anderson has just finished cleaning a messy lab table and is putting theequipment back on the table when he reads a note telling him not to disturb the positions of threewater samples. Not knowing the correct order of the three samples, he finds these facts in the labnotes.
The water that is highest in sulfur was on one end. The water that is highest in iron is in the Erlenmeyer flask. The water taken from the spring is not next to
the water in the bottle. The water that is highest in calcium is left of the water taken from the lake. The water in the Erlenmeyer flask, the water
taken from the well, and the water that ishighest in sulfur are three distinct samples.
The water in the round flask is not highest in calcium. Organize the facts into categories. (This is the first
step in actually determining which sample goes where. You willfinish the problem when you do the exercises.)
Solution Information is given about the types of containers, the sources ofthe water, the elements found in the samples, and the positions ofthe samples on the table. You can find three options for eachcategory.
Containers: round flask, Erlenmeyer flask, bottle Sources: spring, lake, well
Elements: sulfur, iron, calcium Positions: left, center, right
Now that the information is organized and categorized, you need to see where it leads. You willfinish this problem in Exercise 8.
This is one of thecomputers used in theHuman Genome Project.
Piecing together clues in order to understand a biggerpicture is a major problem-solving strategy of theHuman Genome Project. Since 1990, researchersfrom around the world have been workingcooperatively to map and sequence the humangenome-the complete set of more than 3 billionhuman DNA base pairs. By 2000, despite anoverwhelming amount of information toorganize, researchers were able to sequenceroughly 90% of the human genome. Byunderstanding the organization and function of humanDNA, the researchers hope to improve human health andcreate guidelines for the ethical use of genetic knowledge.
16 CHAPTER 0 Problem Solving © 2004 Key Curriculum Press
Lesson http://acr.keypress.com/KeyPressPortalV3.0/Viewer/Lesson.htm
3 de 8 31-03-2009 18:50
© 2004 Key Curriculum Press LESSON 0.3 Organizing Information 17
Use this investigation as an opportunity to practice categorizing and organizinginformation as you did in Example C.
There are five houses along one side of Birch Street, each of a unique color. The
home-owners each drive a different car, and each has a different pet. The owners allread a different newspaper and plant only one thing in their garden.
The family with the station wagon lives in the red house.
The owner of the SUV has a dog.
The family with the van reads the Gazette.
The green house is immediately to the left of the white house.
The Chronicle is delivered to the green house.
The man who plants zucchini has birds.
In the yellow house they plant corn.
In the middle house they read the Times.
The compact car parks at the first house.
The family that plants eggplant lives in the house next to the house with cats.
In the house next to the house where they have a horse, they plant corn.
The woman who plants beets receives the Daily News.
The owner of the sports car plants okra.
The family with the compact car lives next to the blue house.
They read the Bulletin in the house next to the house where they plant eggplant.
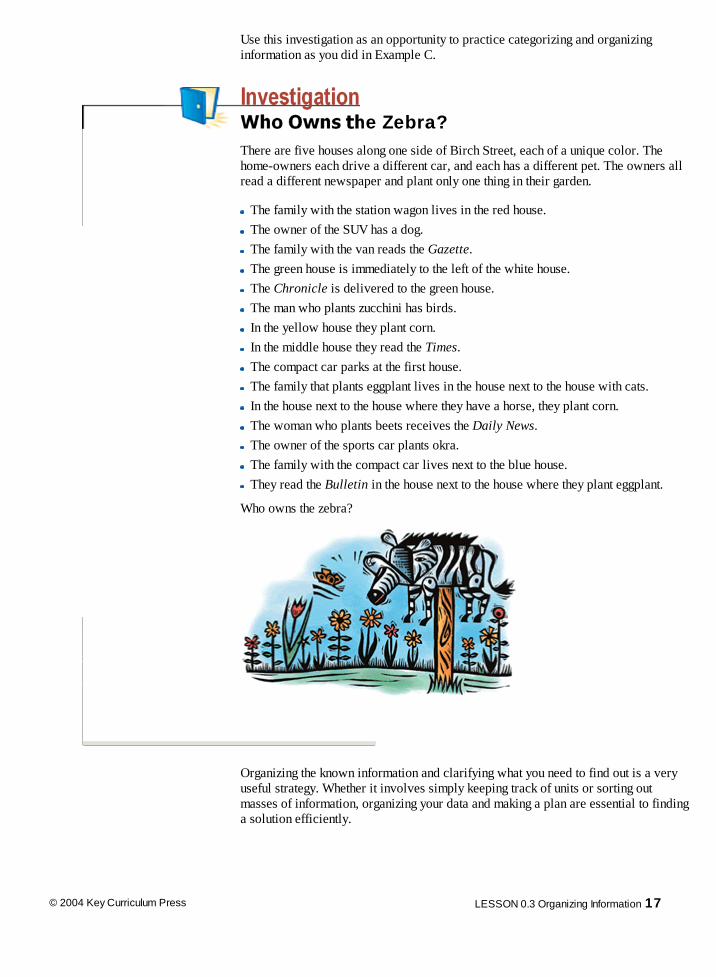
Who owns the zebra?
Organizing the known information and clarifying what you need to find out is a very
useful strategy. Whether it involves simply keeping track of units or sorting outmasses of information, organizing your data and making a plan are essential to findinga solution efficiently.
Who Owns the Zebra?
Lesson http://acr.keypress.com/KeyPressPortalV3.0/Viewer/Lesson.htm
4 de 8 31-03-2009 18:50
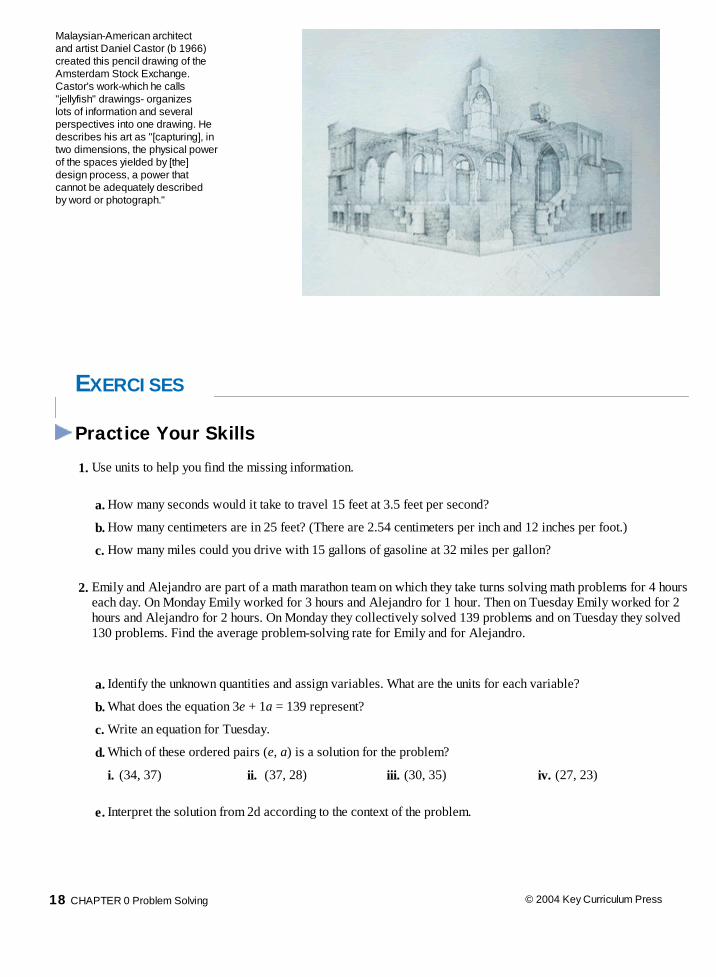
Malaysian-American architectand artist Daniel Castor (b 1966)created this pencil drawing of theAmsterdam Stock Exchange.Castor's work-which he calls"jellyfish" drawings- organizeslots of information and severalperspectives into one drawing. Hedescribes his art as "[capturing], intwo dimensions, the physical powerof the spaces yielded by [the]design process, a power thatcannot be adequately describedby word or photograph."
EXERCISES Practice Your Skills
1. Use units to help you find the missing information.
a. How many seconds would it take to travel 15 feet at 3.5 feet per second?
b. How many centimeters are in 25 feet? (There are 2.54 centimeters per inch and 12 inches per foot.)
c. How many miles could you drive with 15 gallons of gasoline at 32 miles per gallon?
2. Emily and Alejandro are part of a math marathon team on which they take turns solving math problems for 4 hourseach day. On Monday Emily worked for 3 hours and Alejandro for 1 hour. Then on Tuesday Emily worked for 2hours and Alejandro for 2 hours. On Monday they collectively solved 139 problems and on Tuesday they solved130 problems. Find the average problem-solving rate for Emily and for Alejandro.
a. Identify the unknown quantities and assign variables. What are the units for each variable?
b. What does the equation 3e + 1a = 139 represent?
c. Write an equation for Tuesday.
d. Which of these ordered pairs (e, a) is a solution for the problem?
i. (34, 37) ii. (37, 28) iii. (30, 35) iv. (27, 23)
e. Interpret the solution from 2d according to the context of the problem.
18 CHAPTER 0 Problem Solving © 2004 Key Curriculum Press
Lesson http://acr.keypress.com/KeyPressPortalV3.0/Viewer/Lesson.htm
5 de 8 31-03-2009 18:50
3. To qualify for the Interlochen 470 auto race, each driver must complete two laps of the track at anaverage speed of 100 mi/h. Benjamin averages only 75 mi/h on his first lap. How fast must he go on thesecond lap to qualify for the race?
4. Use the distributive property to expand and combine like terms when possible.
a. 7.5(a − 3) b. 12 + 4.7(b + 6)
c. 5c − 2(c − 12) d. 8.4(35 − d) + 12.6d
5. Solve each equation. a. 4.5(a − 7) = 26.1 b. 9 + 2.7(b + 3) = 20.7
c. 8c − 2(c − 5) = 70 d. 8.4(35 − d) + 12.6d = 327.6
Reason and Apply
6. APPLICATION Alyse earns $15.40 per hour, and she earns time and a half for workingpast 8:00 P.M. Last week she worked 35 hours and earned $600.60. How many hoursdid she work past 8:00 P.M.?
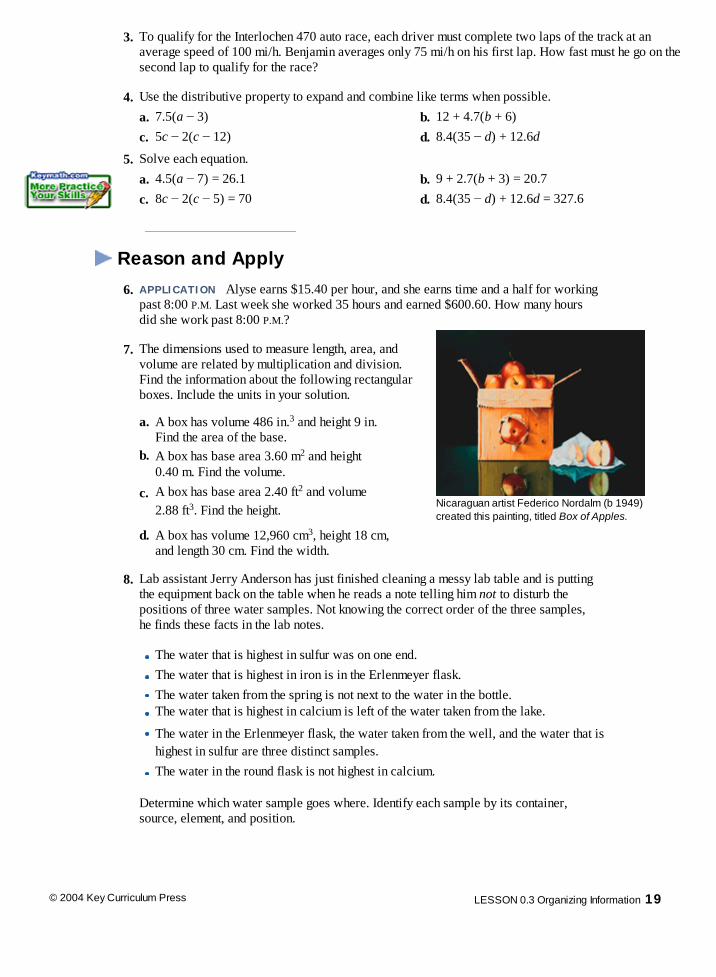
Nicaraguan artist Federico Nordalm (b 1949)created this painting, titled Box of Apples.
7. The dimensions used to measure length, area, andvolume are related by multiplication and division.Find the information about the following rectangularboxes. Include the units in your solution.
a. A box has volume 486 in.3 and height 9 in.
Find the area of the base.b. A box has base area 3.60 m2 and height
0.40 m. Find the volume. c. A box has base area 2.40 ft2 and volume
2.88 ft3. Find the height.
d. A box has volume 12,960 cm3, height 18 cm, and length 30 cm. Find the width.
8. Lab assistant Jerry Anderson has just finished cleaning a messy lab table and is puttingthe equipment back on the table when he reads a note telling him not to disturb thepositions of three water samples. Not knowing the correct order of the three samples,he finds these facts in the lab notes.
The water that is highest in sulfur was on one end.
The water that is highest in iron is in the Erlenmeyer flask.The water taken from the spring is not next to the water in the bottle.
The water that is highest in calcium is left of the water taken from the lake.
The water in the Erlenmeyer flask, the water taken from the well, and the water that is highest in sulfur are three distinct samples.
The water in the round flask is not highest in calcium.
Determine which water sample goes where. Identify each sample by its container,source, element, and position.
© 2004 Key Curriculum Press LESSON 0.3 Organizing Information 19
Lesson http://acr.keypress.com/KeyPressPortalV3.0/Viewer/Lesson.htm
6 de 8 31-03-2009 18:50
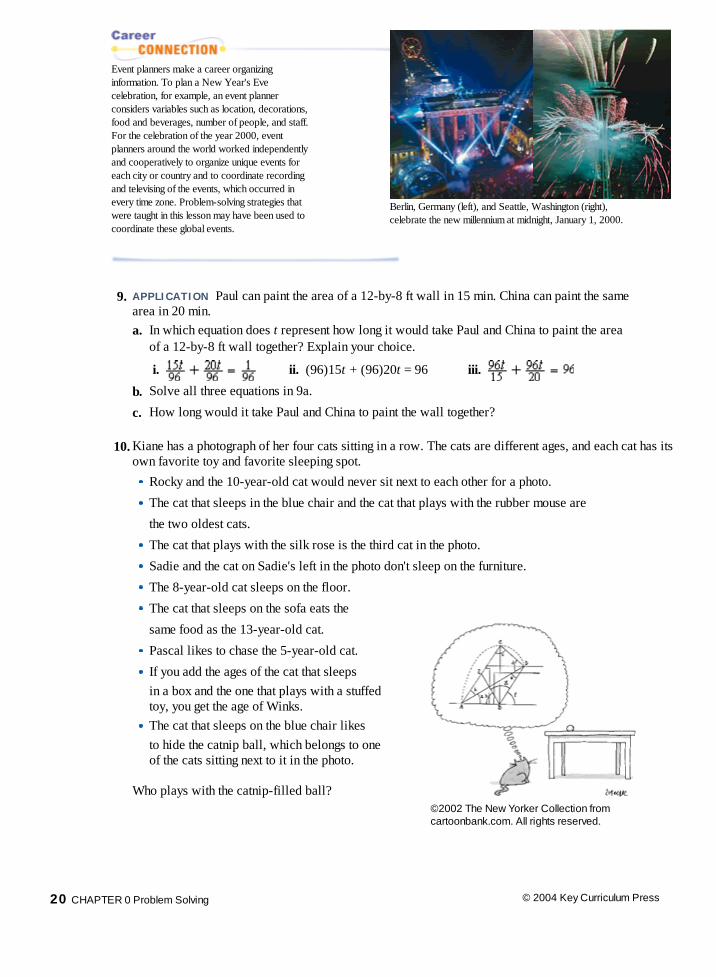
Berlin, Germany (left), and Seattle, Washington (right),celebrate the new millennium at midnight, January 1, 2000.
Event planners make a career organizinginformation. To plan a New Year's Evecelebration, for example, an event plannerconsiders variables such as location, decorations,food and beverages, number of people, and staff.For the celebration of the year 2000, eventplanners around the world worked independentlyand cooperatively to organize unique events foreach city or country and to coordinate recordingand televising of the events, which occurred inevery time zone. Problem-solving strategies thatwere taught in this lesson may have been used tocoordinate these global events.
9. APPLICATION Paul can paint the area of a 12-by-8 ft wall in 15 min. China can paint the samearea in 20 min.a. In which equation does t represent how long it would take Paul and China to paint the area
of a 12-by-8 ft wall together? Explain your choice.
i. ii. (96)15t + (96)20t = 96 iii.
b. Solve all three equations in 9a.
c. How long would it take Paul and China to paint the wall together?
10. Kiane has a photograph of her four cats sitting in a row. The cats are different ages, and each cat has itsown favorite toy and favorite sleeping spot.
Rocky and the 10-year-old cat would never sit next to each other for a photo.
The cat that sleeps in the blue chair and the cat that plays with the rubber mouse are
the two oldest cats. The cat that plays with the silk rose is the third cat in the photo.
Sadie and the cat on Sadie's left in the photo don't sleep on the furniture.
The 8-year-old cat sleeps on the floor.
©2002 The New Yorker Collection fromcartoonbank.com. All rights reserved.
The cat that sleeps on the sofa eats the
same food as the 13-year-old cat.
Pascal likes to chase the 5-year-old cat.
If you add the ages of the cat that sleeps
in a box and the one that plays with a stuffedtoy, you get the age of Winks.
The cat that sleeps on the blue chair likesto hide the catnip ball, which belongs to oneof the cats sitting next to it in the photo.
Who plays with the catnip-filled ball?
20 CHAPTER 0 Problem Solving © 2004 Key Curriculum Press
Lesson http://acr.keypress.com/KeyPressPortalV3.0/Viewer/Lesson.htm
7 de 8 31-03-2009 18:50
© 2004 Key Curriculum Press LESSON 0.3 Organizing Information 21
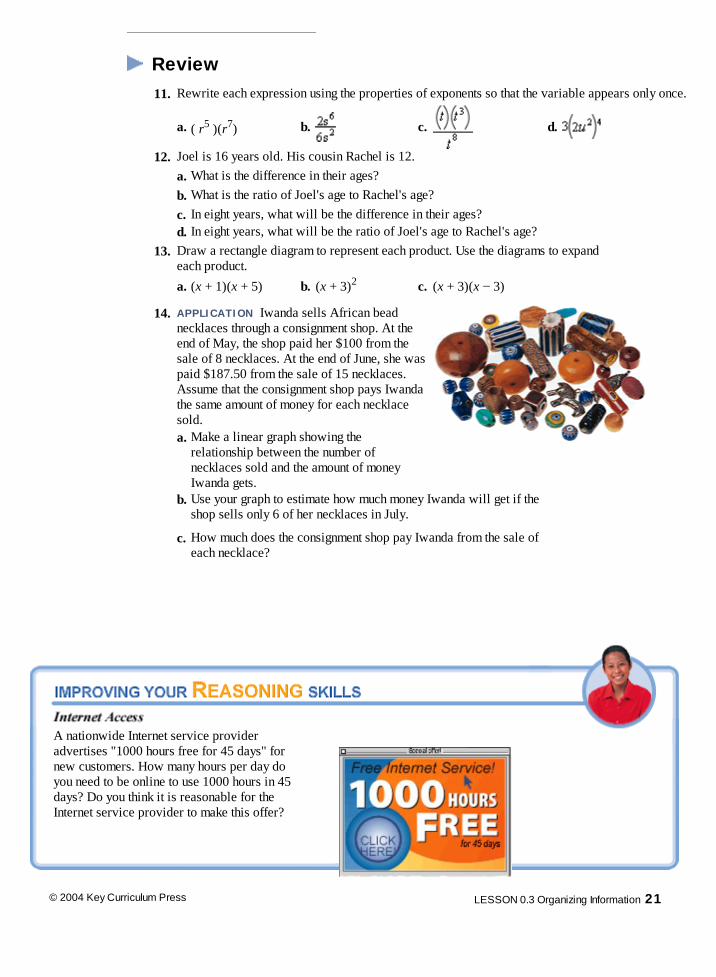
Review
11. Rewrite each expression using the properties of exponents so that the variable appears only once.
a. ( r5 )(r7) b. c. d.
12. Joel is 16 years old. His cousin Rachel is 12.
a. What is the difference in their ages?
b. What is the ratio of Joel's age to Rachel's age?c. In eight years, what will be the difference in their ages?
d. In eight years, what will be the ratio of Joel's age to Rachel's age?
13. Draw a rectangle diagram to represent each product. Use the diagrams to expandeach product.
a. (x + 1)(x + 5) b. (x + 3)2 c. (x + 3)(x − 3)
14. APPLICATION Iwanda sells African beadnecklaces through a consignment shop. At theend of May, the shop paid her $100 from thesale of 8 necklaces. At the end of June, she waspaid $187.50 from the sale of 15 necklaces.Assume that the consignment shop pays Iwandathe same amount of money for each necklacesold.
a. Make a linear graph showing the
relationship between the number ofnecklaces sold and the amount of moneyIwanda gets.
b. Use your graph to estimate how much money Iwanda will get if the
shop sells only 6 of her necklaces in July.
c. How much does the consignment shop pay Iwanda from the sale of
each necklace?
A nationwide Internet service provideradvertises "1000 hours free for 45 days" fornew customers. How many hours per day doyou need to be online to use 1000 hours in 45days? Do you think it is reasonable for theInternet service provider to make this offer?
Lesson http://acr.keypress.com/KeyPressPortalV3.0/Viewer/Lesson.htm
8 de 8 31-03-2009 18:50
22 CHAPTER 0 Problem Solving © 2004 Key Curriculum Press
EXERCISES 1. You are given a 3-liter bucket, a 5-liter bucket, and an unlimited supply of water. Describe
or illustrate a procedure that will give exactly 4 liters of water in the 5-liter bucket. 2. Draw a rectangle diagram to represent each product. Use the diagrams to expand each product. a. (x + 3)(x + 4) b. (2x)(x + 3) c. (x + 6)(x − 2) d. (x − 4)(2x − 1) 3. Use the Pythagorean Theorem to find each missing length. a. b.
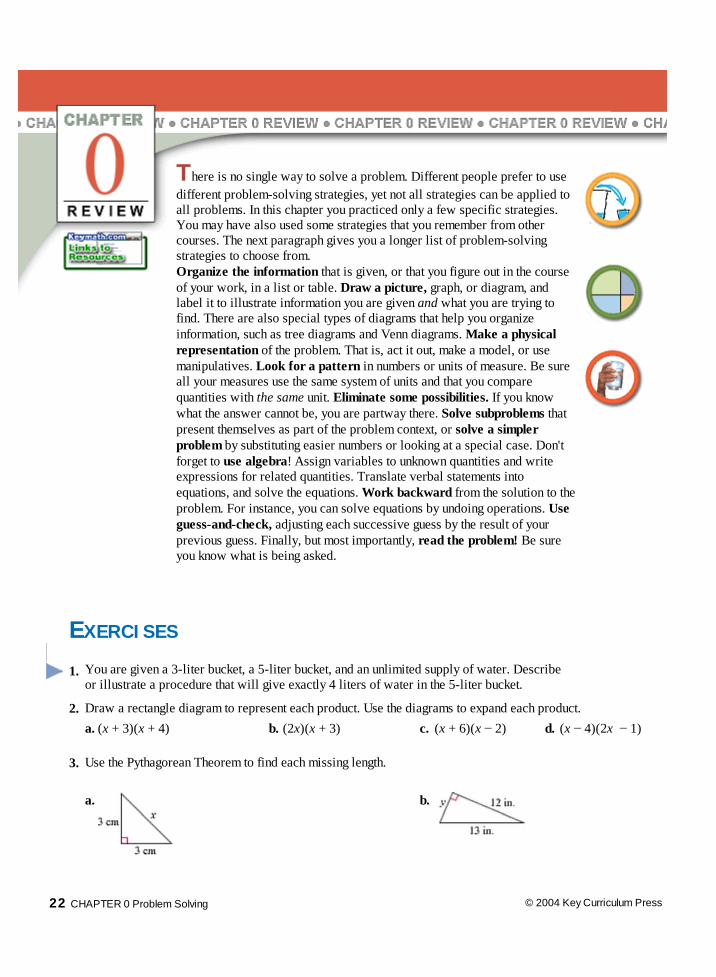
There is no single way to solve a problem. Different people prefer to usedifferent problem-solving strategies, yet not all strategies can be applied toall problems. In this chapter you practiced only a few specific strategies.You may have also used some strategies that you remember from othercourses. The next paragraph gives you a longer list of problem-solvingstrategies to choose from.Organize the information that is given, or that you figure out in the courseof your work, in a list or table. Draw a picture, graph, or diagram, andlabel it to illustrate information you are given and what you are trying tofind. There are also special types of diagrams that help you organizeinformation, such as tree diagrams and Venn diagrams. Make a physicalrepresentation of the problem. That is, act it out, make a model, or usemanipulatives. Look for a pattern in numbers or units of measure. Be sureall your measures use the same system of units and that you comparequantities with the same unit. Eliminate some possibilities. If you knowwhat the answer cannot be, you are partway there. Solve subproblems thatpresent themselves as part of the problem context, or solve a simplerproblem by substituting easier numbers or looking at a special case. Don'tforget to use algebra! Assign variables to unknown quantities and writeexpressions for related quantities. Translate verbal statements intoequations, and solve the equations. Work backward from the solution to theproblem. For instance, you can solve equations by undoing operations. Useguess-and-check, adjusting each successive guess by the result of yourprevious guess. Finally, but most importantly, read the problem! Be sureyou know what is being asked.
Lesson http://acr.keypress.com/KeyPressPortalV3.0/Viewer/Lesson.htm
1 de 5 31-03-2009 18:50
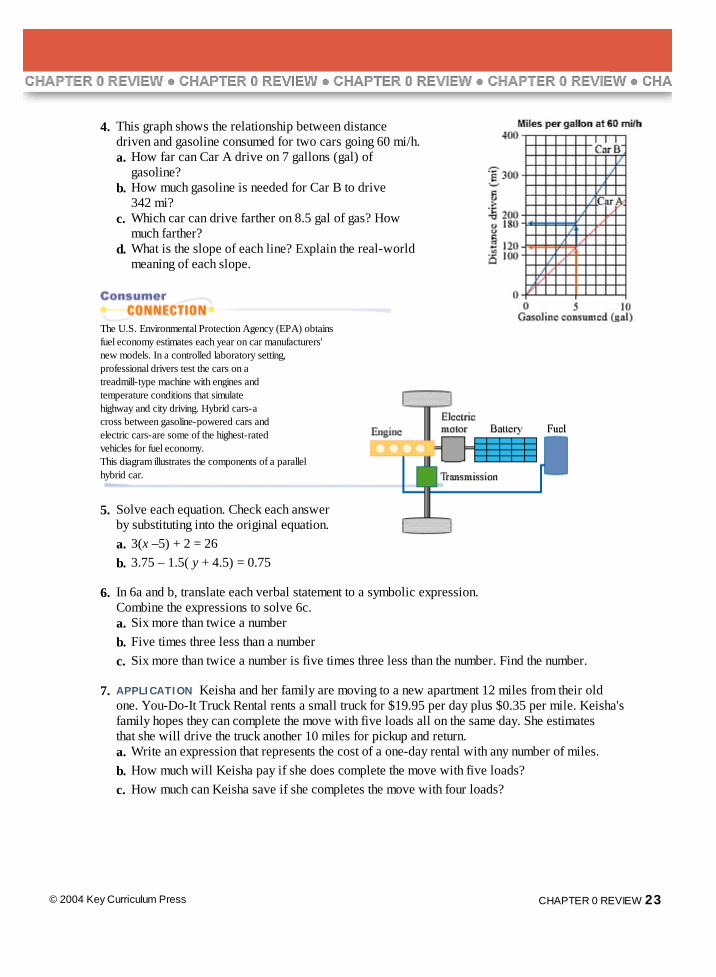
4. This graph shows the relationship between distancedriven and gasoline consumed for two cars going 60 mi/h.
a. How far can Car A drive on 7 gallons (gal) ofgasoline?
b. How much gasoline is needed for Car B to drive342 mi?
c. Which car can drive farther on 8.5 gal of gas? Howmuch farther?
d. What is the slope of each line? Explain the real-worldmeaning of each slope.
The U.S. Environmental Protection Agency (EPA) obtainsfuel economy estimates each year on car manufacturers'new models. In a controlled laboratory setting,
professional drivers test the cars on atreadmill-type machine with engines andtemperature conditions that simulatehighway and city driving. Hybrid cars-across between gasoline-powered cars andelectric cars-are some of the highest-ratedvehicles for fuel economy.This diagram illustrates the components of a parallelhybrid car.
5. Solve each equation. Check each answer
by substituting into the original equation. a. 3(x –5) + 2 = 26 b. 3.75 – 1.5( y + 4.5) = 0.75
6. In 6a and b, translate each verbal statement to a symbolic expression.Combine the expressions to solve 6c.
a. Six more than twice a number b. Five times three less than a number c. Six more than twice a number is five times three less than the number. Find the number.
7. APPLICATION Keisha and her family are moving to a new apartment 12 miles from their oldone. You-Do-It Truck Rental rents a small truck for $19.95 per day plus $0.35 per mile. Keisha'sfamily hopes they can complete the move with five loads all on the same day. She estimatesthat she will drive the truck another 10 miles for pickup and return.
a. Write an expression that represents the cost of a one-day rental with any number of miles. b. How much will Keisha pay if she does complete the move with five loads? c. How much can Keisha save if she completes the move with four loads?
© 2004 Key Curriculum Press CHAPTER 0 REVIEW 23
Lesson http://acr.keypress.com/KeyPressPortalV3.0/Viewer/Lesson.htm
2 de 5 31-03-2009 18:50
8. Toby has only a balance scale, a single 40 g mass, and a stack of both white and red blocks.(Assume that all white blocks have the same mass and all red blocks have the same mass.) Toby discovers thatfour white blocks and one red block balance two white blocks, two red blocks,and the 40 g mass. He also finds that five white blocks and two red blocks balance one whiteblock and five red blocks.
a. List the unknown quantities and assign a variable to each. b. Translate Toby's discoveries into equations. c. Solve the equations to find a value for each variable.
d. Interpret the solution according to the context of the problem.
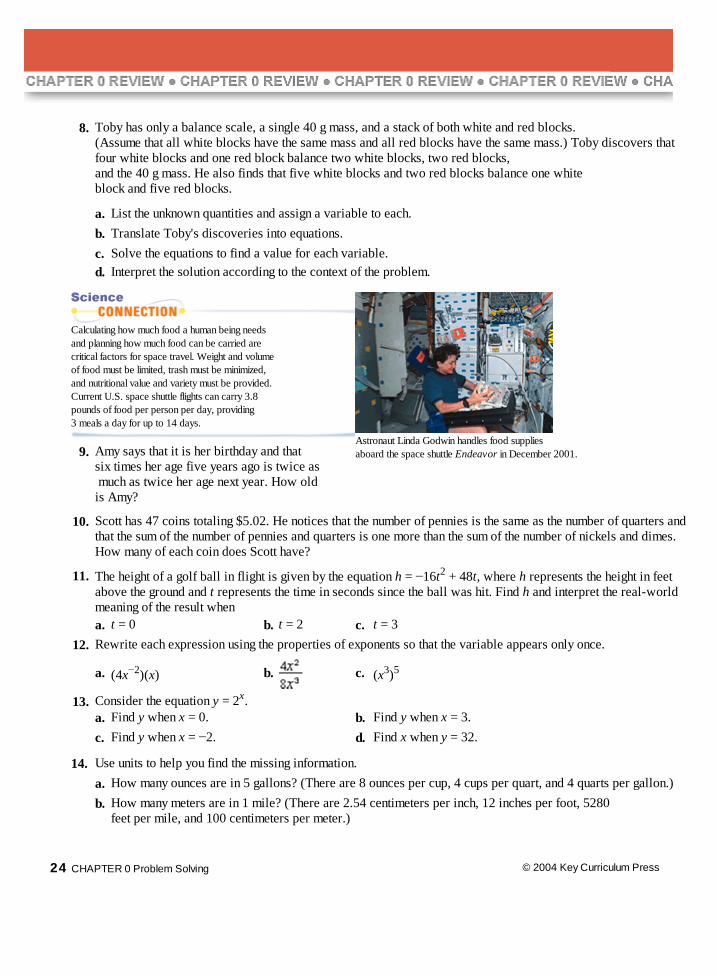
Calculating how much food a human being needsand planning how much food can be carried arecritical factors for space travel. Weight and volumeof food must be limited, trash must be minimized,and nutritional value and variety must be provided.Current U.S. space shuttle flights can carry 3.8pounds of food per person per day, providing3 meals a day for up to 14 days.
Astronaut Linda Godwin handles food suppliesaboard the space shuttle Endeavor in December 2001. 9. Amy says that it is her birthday and that
six times her age five years ago is twice as much as twice her age next year. How oldis Amy?
10. Scott has 47 coins totaling $5.02. He notices that the number of pennies is the same as the number of quarters andthat the sum of the number of pennies and quarters is one more than the sum of the number of nickels and dimes.How many of each coin does Scott have?
11. The height of a golf ball in flight is given by the equation h = −16t2 + 48t, where h represents the height in feetabove the ground and t represents the time in seconds since the ball was hit. Find h and interpret the real-worldmeaning of the result when
a. t = 0 b. t = 2 c. t = 3
12. Rewrite each expression using the properties of exponents so that the variable appears only once.
a. (4x−2)(x) b. c. (x3)5
13. Consider the equation y = 2x. a. Find y when x = 0. b. Find y when x = 3.
c. Find y when x = −2. d. Find x when y = 32.
14. Use units to help you find the missing information.
a. How many ounces are in 5 gallons? (There are 8 ounces per cup, 4 cups per quart, and 4 quarts per gallon.)
b. How many meters are in 1 mile? (There are 2.54 centimeters per inch, 12 inches per foot, 5280feet per mile, and 100 centimeters per meter.)
24 CHAPTER 0 Problem Solving © 2004 Key Curriculum Press
Lesson http://acr.keypress.com/KeyPressPortalV3.0/Viewer/Lesson.htm
3 de 5 31-03-2009 18:50
15. Bethany Rogers temps as a sales assistant. She learns that all three sales representatives have importantmeetings with clients, but she only uncovers these clues.
Mr. Bell is a sales representative although he is not meeting with Mr. Green.
Ms. Hunt is the client who will be meeting in the lunch room.
Mr. Green is the client with a 9:00 A.M. appointment.
Mr. Mendoza is the sales representative meeting in the conference room.
Ms. Phoung is a client, but she will not be in the 3:00 P.M. meeting.
Mrs. Plum is a sales representative, but not the one meeting at 12:00 noon.
The client with the 9:00 A.M. appointment is not meeting in the convention hall.
Help Bethany figure out which sales representative is meeting with which client, where, and when. TAKE ANOTHER LOOK
1. You have seen that the multiplication expression (x + 2)(x + 3) can be represented with arectangle diagram in which the length and width of the rectangle represent the factors andthe area represents the product. Find a way to represent the multiplication of three factors,such as (x + 2)(x + 3)(x + 4). Explain how the geometry of the diagram represents the product.
2. Recall Jerry Anderson's problem with the water samples (Exercise 8 in Lesson 0.3). Notice that the table
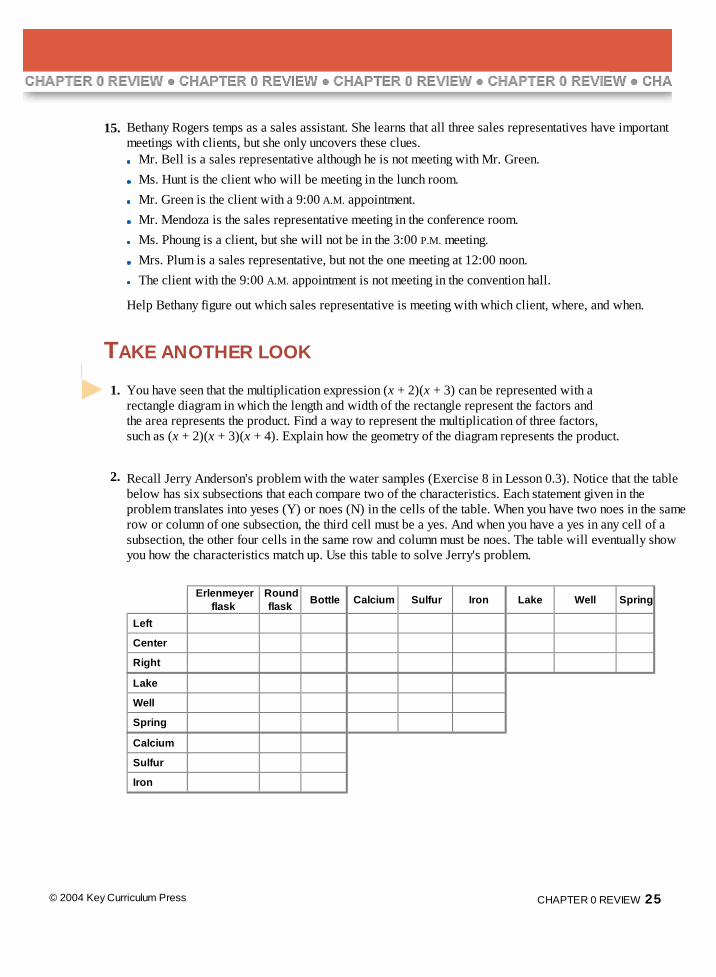
below has six subsections that each compare two of the characteristics. Each statement given in theproblem translates into yeses (Y) or noes (N) in the cells of the table. When you have two noes in the samerow or column of one subsection, the third cell must be a yes. And when you have a yes in any cell of asubsection, the other four cells in the same row and column must be noes. The table will eventually showyou how the characteristics match up. Use this table to solve Jerry's problem.
Erlenmeyer
flask Round
flask Bottle Calcium Sulfur Iron Lake Well Spring
Left Center Right Lake Well Spring Calcium Sulfur Iron
© 2004 Key Curriculum Press CHAPTER 0 REVIEW 25
Lesson http://acr.keypress.com/KeyPressPortalV3.0/Viewer/Lesson.htm
4 de 5 31-03-2009 18:50
3. Find a way to use the distributive property to rewrite (x + 2)(x + 3) without parentheses. Compare and contrastthis method to the rectangle diagram method. Look back at Exercise 11 in Lesson 0.1, and explain how youcould use the distributive property for each multiplication.
4. Use your graphing calculator or geometry software to explore the slopes of lines. What is the slope of ahorizontal line? Of a vertical line? What slopes create a diagonal line at a 45° angle from the x-axis? For whichslopes does the line increase from left to right? For which slopes does it decrease? Can you estimate a line'sslope simply by looking at a graph? Write a short paper summarizing your findings.
Assessing What You've Learned WRITE IN YOUR JOURNAL Recording your thoughts about the mathematics you are learning, as
well as about areas of confusion or frustration, help point out when you should seek assistance fromyour teacher and what questions you could ask. Keeping a journal is a good way to collect theseinformal notes, and if you write in it regularly, you'll track the progress of your understandingthroughout the course. Your journal can also remind you of interesting contributions to make in class orprompt questions to ask during a review period.
Here are some questions you might start writing about.
How has your idea about what algebra is changed since you finished your first-year course in algebra? Do you have particular expectations about what you will learn in
advanced algebra? If so, what are they? What are your strengths and weaknesses as a problem-solver? Do you
consider yourself well organized? Do you have a systematic approach? Give aneveryday example of problem solving that reminds you of work you did in this chapter.
GIVE A PRESENTATION In the working world, most people will need to give a presentation
once in a while or contribute thoughts and opinions at meetings. Making a presentation to your classgives you practice in planning, conveying your ideas clearly, and adapting to the needs of an audience.
Choose an investigation or a problem from this chapter, and describe the problem-solving strategiesyou and your group used to solve it. Here are some suggestions to plan your presentation. (Evenplanning a presentation requires problem solving!)
Work with a partner or team. Divide tasks equally. Your role should use skills that are well established, as well as stretch your abilities in new areas.
Discuss the topic thoroughly. Connect the work you did on the problem with the objectives of the chapter.
Outline your talk, and decide what details to mention for each point and what charts, graphs, or pictures would clarify the presentation.
Speak clearly and loudly. Reveal your interest in the topic you chose by making eye contact with listeners.
26 CHAPTER 0 Problem Solving © 2004 Key Curriculum Press
Lesson http://acr.keypress.com/KeyPressPortalV3.0/Viewer/Lesson.htm
5 de 5 31-03-2009 18:50