disclosures dashboards to improve quality and
TRANSCRIPT

Platforms for Performance: Clinical Dashboards to Improve Quality and
Safety
Tuesday, December 6, 2011
2:00 PM – 4:30 PM
1
Disclosures
The program chair and presenters for this continuing pharmacy education activity report no relevant financial relationships.
2
Introduction to Clinical Performance Measure Dashboards: Evidence and
Required Resources
Jannet Carmichael, Pharm.D., BCPS, FCCP, FAPhA
VISN 21 Pharmacy Executive
VA Sierra Pacific Network
Learning Objectives Explain the evidence in support of the use of clinical
performance metrics to achieve outcomes
Identify the resources and personnel necessary for the implementation of clinical analysis measure dashboards
Generate a strategy to determine appropriate clinical measures Generate a strategy to determine appropriate clinical measures to met the needs of a healthcare system
Execute effective programs to gain support for the use of clinical dashboards by providers in patient care
Systematize processes of multi-disciplinary and pharmaceutical care using Clinical Analysis metrics and dashboards
Why are We Trying to Improve?
5
70%80%90%
100%
Gaps in CareIncentive structures need to support appropriate utilization and Incentive structures need to support appropriate utilization and improved improved qualityquality
A system can’t deliver evidencedA system can’t deliver evidenced‐‐based health care without the support based health care without the support of evidenced managementof evidenced management
Patients Receiving Evidence‐based Care
$ $ $ $
53.5% 56.1% 54.9% 49.5%
0%10%20%30%40%50%60%
Acute Chronic Preventive Preventive -65+
Source: McGlynn et al, “The Quality of Health Care Delivered to Adults in the United States,” NEJM, 2003; To Err Is Human, Institute of Medicine, 1998
Source: Pham et al, “Delivery of Preventive Services to Older Adults by Primary Care Physicians ,” JAMA, July 27, 2005
$ $ $ $
Platforms for Performance: Clinical Dashboards to Improve Quality and Safety
© 2011 American Society of Health-System Pharmacists
2011 Midyear Clinical Meeting
Page 1 of 7
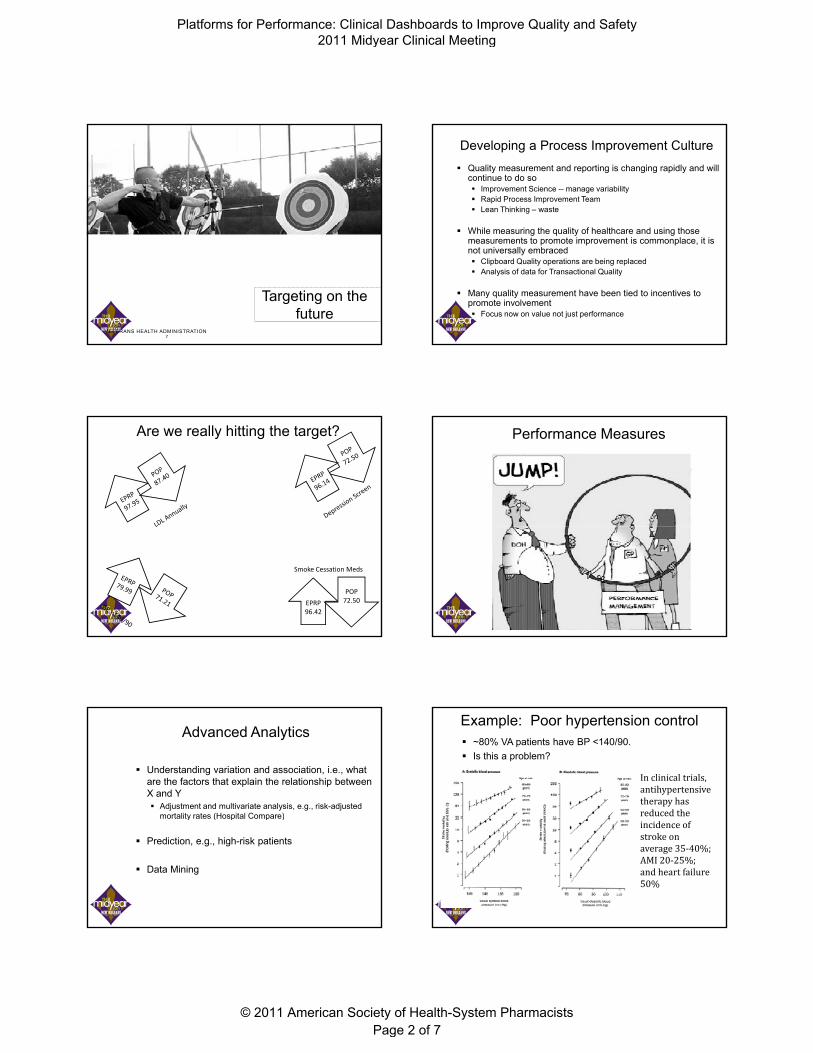
Targeting on the future
7VETERANS HEALTH ADMINISTRATION
Developing a Process Improvement Culture
Quality measurement and reporting is changing rapidly and will continue to do so Improvement Science -- manage variability Rapid Process Improvement Team Lean Thinking – waste
While measuring the quality of healthcare and using those g q y gmeasurements to promote improvement is commonplace, it is not universally embraced Clipboard Quality operations are being replaced Analysis of data for Transactional Quality
Many quality measurement have been tied to incentives to promote involvement Focus now on value not just performance
Are we really hitting the target?
EPRP96.42
POP 72.50
Smoke Cessation Meds
Performance Measures
Advanced Analytics
Understanding variation and association, i.e., what are the factors that explain the relationship between X and Y Adjustment and multivariate analysis, e.g., risk-adjusted
mortality rates (Hospital Compare)mortality rates (Hospital Compare)
Prediction, e.g., high-risk patients
Data Mining
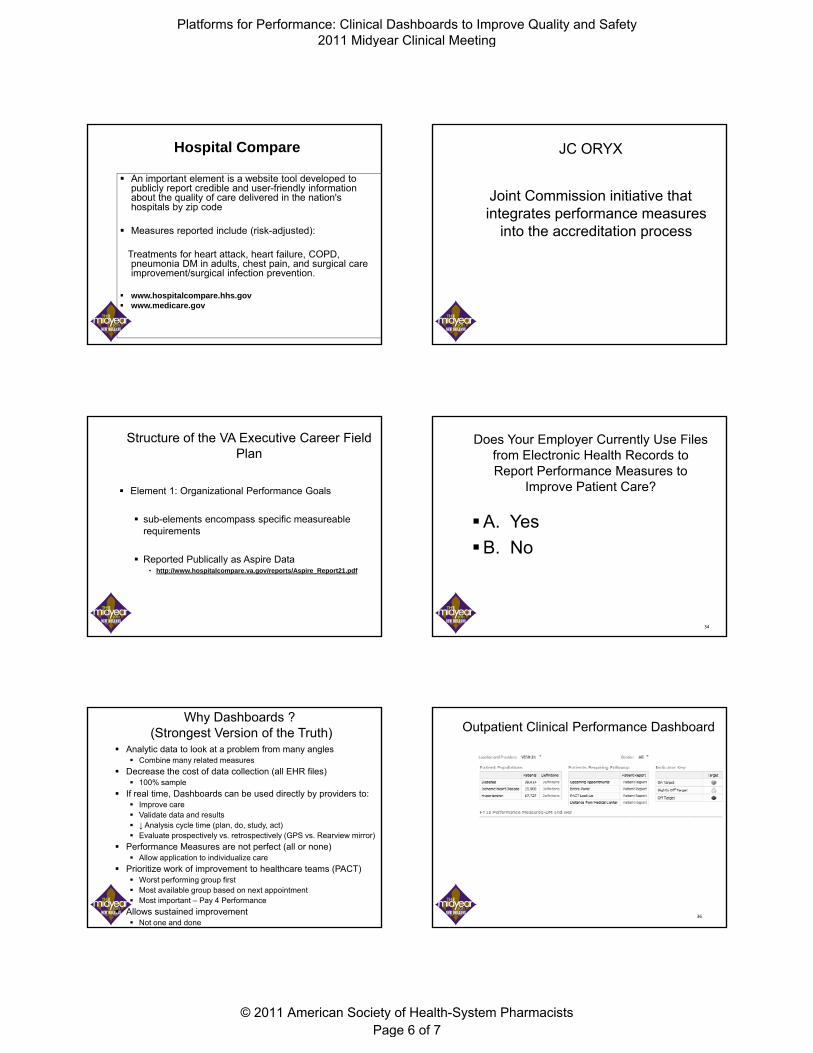
Example: Poor hypertension control ~80% VA patients have BP <140/90.
Is this a problem?
Inclinicaltrials,antihypertensivetherapyhasreducedtheincidenceofstrokeonaverage35‐40%;AMI20‐25%;andheartfailure50%
Platforms for Performance: Clinical Dashboards to Improve Quality and Safety
© 2011 American Society of Health-System Pharmacists
2011 Midyear Clinical Meeting
Page 2 of 7
Question: Why? What additional data might be helpful
Data about providers Do all teams, providers achieve equivalent control?
Are providers not adjusting therapy appropriately?
Data about patients Are certain patients more likely to be in poor control (elderly,
women, with mental health diagnosis)?
Is poor control related to poor adherence to meds?
Data about facility level factors
Is it a Provider Problem?SBP<140andDBP<90 82%SBP<150andDBP<65 21%IndexSBP<150andon≥3moderatedoseBPmeds 15%Appropriateclinicalactionwithin90days↑dosecurrentBPmed,startnewmed,orswitch
class33%
classRepeatSBP<140andDBP<90 21%
Meetsnewmeasure 94%
Nationally26%ofdiabeticpatientswithBP<140/65,ofwhomnearly80,000‐ or~8%‐werepotentiallybeingover‐treated.E Kerr et al, Ann Arbor VAMC
• Continuous improvement is embraced as a core operating principle
• Improving our work is our work !– Requires accurate and timely data about quality, cost,
access and satisfaction
Th id i d d di d
Building Value in the Delivery System
– The system must provide time and resources dedicated to doing improvement work
• The goal is to operate in a high reliability healthcare system
For the past 12 years the VHA has emphasized“Quality” as the main “Corporate” goal
Value is the management of Quality, Safety and Reliability
Value = Technical Quality + Pt. SatisfactionUnit Cost + Appropriateness
Background You Bring to this Topic?
A. IT Pharmacist interested in Analytics
B. Pharmacist Clinician
C. Administrator
D. Other
17
ansform
ation
Learning Reporting
Improved outcomes
Elements for Tra
Leadership
Inform
ation System
Platforms for Performance: Clinical Dashboards to Improve Quality and Safety
© 2011 American Society of Health-System Pharmacists
2011 Midyear Clinical Meeting
Page 3 of 7

Definitions
Provider = any of the various levels of healthcare in the system whose performance may be evaluated, usually an individual practitioner, group, sight of care
M t i i di t Measure = metric = indicator
User = intended consumer of the information, such as providers, administrator, quality managers
Criteria to Measure New Metrics *1. Must be based on a strong foundation of research showing
the process to improve will lead to improved clinical outcomes Similar to process recommended for practice guidelines
2. The measurement strategy must accurately capture whether evidence-based care has been delivered ASA, ß-blocker or ACE/ARB at discharge If not titrated to target dose after discharge there may be no
i d d d liassociated decreased mortality
3. The measure should address a process quite proximal to the desired outcome with few intervening processes in between Scheduled Mammography or Pap smears Couple with timeliness of f/u
4. The measure should have no or minimal unintended adverse consequences ↓ A1C and hypoglycemia
* Chassin MR et al. Accountability Measures – Using Measurement to promote quality improvement. NEJM . 2010 363;7.
Types of Measures
Outcome – typically refer to clinical events such as mortality, morbidity, and quality of life Need risk adjustment, usually low frequency
Process – reflect what is actually done for a patient in terms of diagnosis, treatment, and other support servicesservices Require careful consideration contraindications, most common
Structure – describe component or characteristics of the care delivery system thought to have an influence on healthcare delivery or outcomes e.g. physical facilities, staff qualifications, case volume or use of HER Indirect measure of care
Other -- Patient Satisfaction, Appropriateness, Resources (cost) associated with healthcare
Criteria for Selecting and Evaluating Performance Measures
Trade off between importance and feasibility Strategic Importance vs. What can be measured reliably
Reliability – true differences (signal) and chance variation (noise)
Man t pes Constr ct Face Criterion Precisions/Reliabilit Many types – Construct, Face, Criterion, Precisions/Reliability
Evidence should link better performance with improved patient outcomes To date empirical studies have found only a modest
association between measures and outcomes*
Internal consistency of indicators
*Hospital quality for acute MI: correlation among process measures and relationship with short‐term mortality. JAMA 2006;296:72.
Accountability Measure Groups (Performance Measures
De elopment)Development)
What Performance Measure Group are You Most Familiar With?
A. Joint Commission -- ORYX
B. CMS – Hospital Compare
C. National Quality Forum (NQF)
D. NCQA – HEDIS Measures
E. Unfamiliar with them all – it’s alphabet soup to me
24
Platforms for Performance: Clinical Dashboards to Improve Quality and Safety
© 2011 American Society of Health-System Pharmacists
2011 Midyear Clinical Meeting
Page 4 of 7

HEDIS® (Health Plan Employer Data and Information Set)
HEDIS is NCQA's tool used by health plans to collect data about the quality of care and service they provide.
HEDIS consists of a set of performance measures that tell how wellHEDIS consists of a set of performance measures that tell how well health plans perform in key areas: quality of care, access to care and member satisfaction with the health plan and doctors.
HEDIS requires health plans to collect data in a standardized way so that comparisons are fair and valid.
CLINICAL PERFORMANCE INDICATOR
Breast cancer screening
Cervical cancer screening
Colorectal cancer screening
LDL Cholesterol < 100 after AMI, PTCA, CABG
LDL Cholesterol < 130 after AMI, PTCA, CABG
Beta blocker on discharge after AMI
Diabetes: HgbA1c done past year
Diabetes: Poor control HbA1c > 9.0% (lower is better)
Diabetes: Cholesterol (LDL C) Screening
VHA Continues to exceed HEDIS in
the vast majority of common measures
Diabetes: Cholesterol (LDL-C) Screening
Diabetes: Cholesterol (LDL-C) controlled (<100)
Diabetes: Cholesterol (LDL-C) controlled (<130)
Diabetes: Eye Exam
Diabetes: Renal Exam
Hypertension: BP <= 140/90 most recent visit
Smoking Cessation Counseling (5)
CLINICAL PERFORMANCE INDICATOR
Immunizations: influenza, (note patients age groups) (6) (7)
Immunizations: pneumococcal, (note patients age groups) (6)
The National Quality Forum (NQF)
The mission of the National Quality Forum is to improve the quality of American healthcare by setting national priorities and goals for performance improvementpriorities and goals for performance improvement, endorsing national consensus standards for measuring and publicly reporting on performance, and promoting the attainment of national goals through education and outreach programs.
National Quality Forum
Goal of Performance Measures: to achieve quality care
How do we know we’re getting quality?How do we know we re getting quality?
Three step process: Measure
Report
Improve
NQF-Endorsed Standards – 615
NQF Three Steps
Define quality with uniform standards and measures
**Draft Guidance for Measure Testing and Evaluating Scientific Acceptability of Measure Properties
http://www.qualityforum.org/WorkArea/linkit.aspx?LinklIdentifier=id&ItemID=46901
Information gleaned from measuring performance is reported and analyzed to pinpoint where patient care falls short
Caregivers examine information about the care they are providing and use it to improve
Centers for Medicare & Medicaid Services (CMS)
The Hospital Quality Alliance: Improving Care Through Information (HQA) is a public-private collaboration to improve the quality of care provided by the nation's hospitals by
i d bli l ti th tmeasuring and publicly reporting on that care
CMS Medication MeasuresMedicaid and Medicare Part D
Platforms for Performance: Clinical Dashboards to Improve Quality and Safety
© 2011 American Society of Health-System Pharmacists
2011 Midyear Clinical Meeting
Page 5 of 7
Hospital Compare
An important element is a website tool developed to publicly report credible and user-friendly information about the quality of care delivered in the nation's hospitals by zip code
Measures reported include (risk-adjusted):p ( j )
Treatments for heart attack, heart failure, COPD, pneumonia DM in adults, chest pain, and surgical care improvement/surgical infection prevention.
www.hospitalcompare.hhs.gov www.medicare.gov
JC ORYX
Joint Commission initiative that integrates performance measures
into the accreditation processinto the accreditation process
Structure of the VA Executive Career Field Plan
Element 1: Organizational Performance Goals
sub-elements encompass specific measureable requirements
Reported Publically as Aspire Data• http://www.hospitalcompare.va.gov/reports/Aspire_Report21.pdf
Does Your Employer Currently Use Files from Electronic Health Records to Report Performance Measures to
Improve Patient Care?
A. YesA. Yes
B. No
34
Why Dashboards ?(Strongest Version of the Truth)
Analytic data to look at a problem from many angles Combine many related measures
Decrease the cost of data collection (all EHR files) 100% sample
If real time, Dashboards can be used directly by providers to: Improve care Validate data and results ↓ Analysis cycle time (plan, do, study, act) Evaluate prospectively vs. retrospectively (GPS vs. Rearview mirror)
Performance Measures are not perfect (all or none) Allow application to individualize care
Prioritize work of improvement to healthcare teams (PACT) Worst performing group first Most available group based on next appointment Most important – Pay 4 Performance
Allows sustained improvement Not one and done
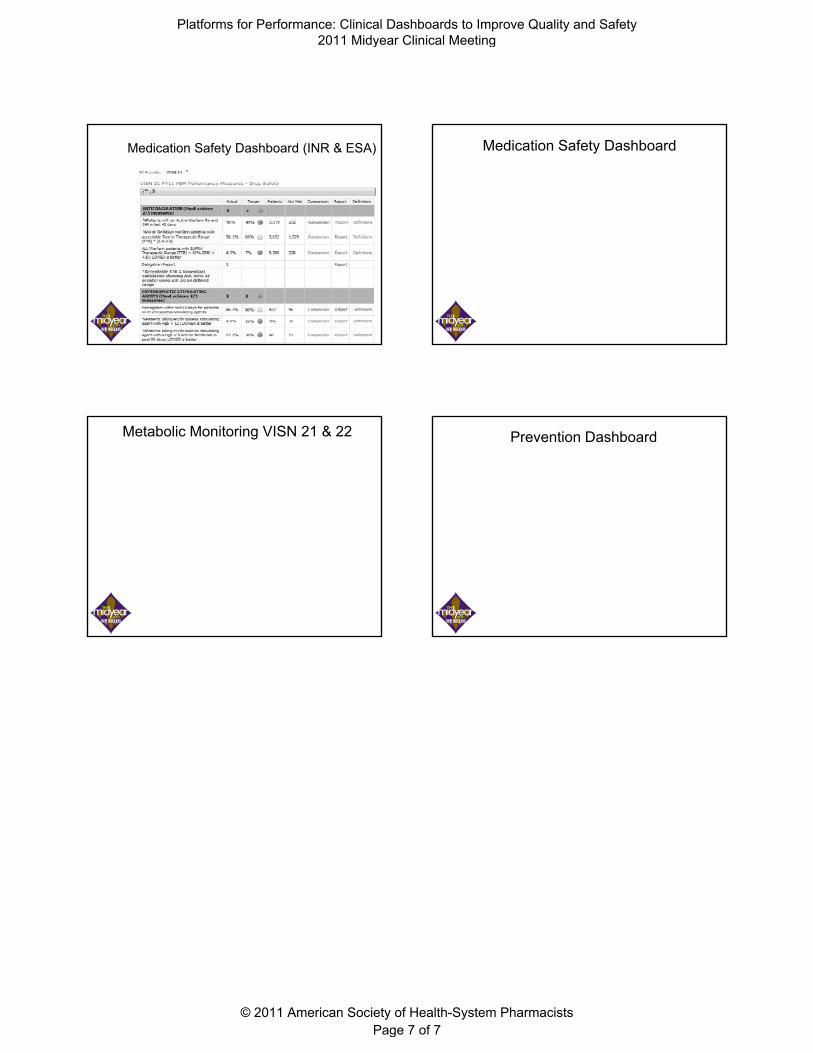
Outpatient Clinical Performance Dashboard
36
Platforms for Performance: Clinical Dashboards to Improve Quality and Safety
© 2011 American Society of Health-System Pharmacists
2011 Midyear Clinical Meeting
Page 6 of 7
Medication Safety Dashboard (INR & ESA) Medication Safety Dashboard
Metabolic Monitoring VISN 21 & 22 Prevention Dashboard
Platforms for Performance: Clinical Dashboards to Improve Quality and Safety
© 2011 American Society of Health-System Pharmacists
2011 Midyear Clinical Meeting
Page 7 of 7