disclaimer - millenniumbcp...september 30th 2016 from 11.5% at the same date in 2015 reinforcement...
TRANSCRIPT

1

2
Disclaimer
The information in this presentation has been prepared under the scope of
the International Financial Reporting Standards (‘IFRS’) of BCP Group for the
purposes of the preparation of the consolidated financial statements under
Regulation (CE) 1606/2002
The figures presented do not constitute any form of commitment by BCP in
regard to future earnings
First 9 months figures for 2015 and 2016 not audited
The business figures presented exclude the former Banco Millennium Angola
Assumes maintenance of the framework regulating the limits to the
deductions of credit impairment effective as at 31 December 2015

3
Highlights
Group
• Profitability
• Liquidity
• Capital
Portugal
International operations
Conclusions
Agenda

4
Highlights
* Non-usual items in 9M16: gains on Visa transaction, devaluation of corporate restructuring funds and additional impairment charges to
increase coverage; non-usual items in 9M15: capital gains on Portuguese sovereign debt and devaluation of corporate restructuring funds. |
** By loan-loss reserves, expected loss gap and collaterals.|*** Core net income = net interest income + net fees and commission income –
operating costs, core income = net interest income + net fees and commission income.
Asset quality
Coverage reinforced
significantly
• NPL>90d ratio fell to 11.0% as at September 30th 2016 from 11.5% as at the
same date of 2015; NPL>90d total coverage** strengthened to 119.3%
(coverage by loan-loss reserves: 65.5%).
• Booking of €100 million of additional impairment charges in Portugal in
3Q16 (€400 million in 9M16), resulting in NPE total coverage** strengthening
to 99% (91% as at September 30th 2015), supporting the target of <€7.5
billion NPE for December 2017.
Profitability and
efficiency
Continued improvement
of recurring earnings
• Core net income*** up 8.4% to €665.8 million, resulting in cost to core
income*** improving to 52.0% (cost to income of 46.0%).
• Earnings excluding non-usual items* improved to +€74.5 million (€6.5
million in the same period of 2015). Total results were negative due to the
impact of non-usual impairment charges: -€53.8 million in the 3rd quarter
of 2016, -€251.1 million in the first 9 months of 2016.
Summary
• Earnings excluding non-usual items* improves by €67.9 million, efficiency
improves by 3pp and balance sheet strengthens, with NPE total coverage**
now at 99%; total earnings significantly affected by non-usual impairment
charges related to the legacy portfolio, aimed at reinforcing credit coverage.
5
Highlights
Business
performance
Healthy balance sheet
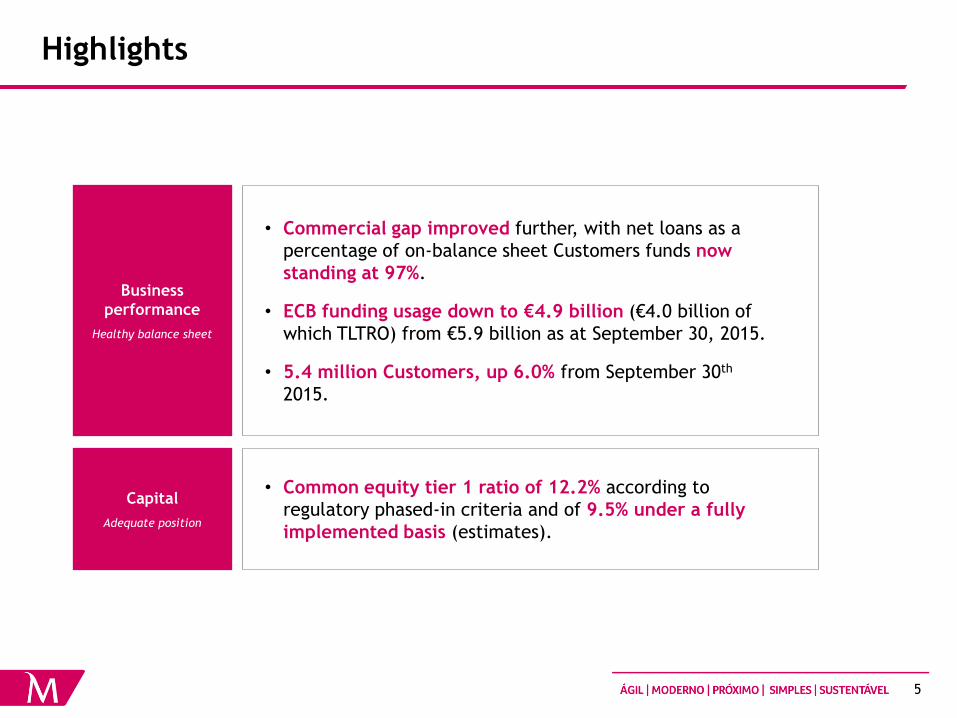
• Commercial gap improved further, with net loans as a
percentage of on-balance sheet Customers funds now
standing at 97%.
• ECB funding usage down to €4.9 billion (€4.0 billion of
which TLTRO) from €5.9 billion as at September 30, 2015.
• 5.4 million Customers, up 6.0% from September 30th
2015.
Capital
Adequate position
• Common equity tier 1 ratio of 12.2% according to
regulatory phased-in criteria and of 9.5% under a fully
implemented basis (estimates).

6
105% 100%
9M15 9M16
Highlights
Core net income*
(Million euros)
Net income excluding non-usual items**
(Million euros)
Loans to deposits ratio*** Phased-in capital ratio (CET1 – CRD IV / CRR)****
614.1
665.8
9M15 9M16
13.2% 12.2%
Sep 15 Sep 16
+51.7
264.5 -251.1 Net income
* Core net income = net interest income + net fees and commission income – operating costs. | ** Non-usual items in 9M16: gains on Visa
transaction, devaluation of corporate restructuring funds and additional impairment charges to increase coverage; non-usual items in 9M15:
capital gains on Portuguese sovereign debt and devaluation of corporate restructuring funds. | *** Based on Customer deposits and net loans
to Customers. | **** Estimates.
6.5
74.5
9M15 9M16
+67.9
100% 97%
-5pp
10.0% 9.5% Fully loaded Net loans to on-BS Customers funds

7
Highlights
Core income (net interest income + net commissions)
(Million euros)
Core net income*
(Million euros)
Loans impairment in Portugal Operating costs
(Million euros)
* Core net income = net interest income + net fees and commission income – operating costs.
370.6 421.5
9M15 9M16
+13.7%
(Million euros)
545.4
816.7
9M15 9M16
+49.7% 172bp 270bp
Cost of
risk
476.8 464.7
9M15 9M16
-2.5% 56.3% 52.4%
Cost to core
income
847.4
886.1
9M15 9M16
+4.6%

8
Highlights
Mobile
banking
Residents
abroad
“Best Private Banking ”
in Portugal by The Banker
magazine
Over 575,000 active users;
#1 in Customer satisfaction
with internet and mobile
banking (Marktest)
20,000 new Customers in
2016, a 37% growth YoY
Individuals Companies
Customers
Portugal
2020
1/3 of the approved
projects are from Millennium
bcp Customers
Roadshow Portugal 2020 with
over 1,000 Customers
Small
companies
New production of over €1bn
in loans to small companies
until September 2016
Start ups
New €70 million protocol with
EIB to finance Portuguese
start-ups
Acquired over 100,000 new
Customers in 2016, (+7%
YoY)
Digital Private Banking Companies
“Best Consumer Digital Bank”
in Portugal by Global Finance “Best bank (overall) for
companies”, “Most
Convenient” and “Most
Innovative” by DATA E

9
Highlights
Group
• Profitability
• Liquidity
• Capital
Portugal
International operations
Conclusions
Agenda

10
Earnings excluding non-usual items improve
* Impairment charges in excess of 120bp cost of risk, to reinforce NPE coverage.
(million euros) 9M15 9M16Impact on
earnings
Core net income 614.1 665.8 +51.7
Mandatory contributions (Portugal and Poland) -47.6 -96.4 -48.9
Other operating income 141.5 189.2 +47.7
Operating net income (bef. impairment and provisions) 708.0 758.5 +50.5
Impairment and provisions -709.5 -584.5 +125.1
Net income before income tax -1.5 174.1 +175.6
Income taxes, non-controlling interests and disc. operations 8.1 -99.6 -107.7
Net income excluding non-usual items 6.5 74.5 +67.9
Gains on Visa transaction 0.0 47.1 +47.1
Capital gains on Portuguese sovereign debt in 2015 272.9 0.0 -272.9
Devaluation of corporate restructuring funds -14.9 -90.6 -75.7
Additional impairment charges (to increase coverage)* 0.0 -282.0 -282.0
Total non-usual items, net of taxes 258.0 -325.6 -583.6
Net income 264.5 -251.1 -515.6

11
Earnings excluding non-usual items improve...
(Million euros)
264.5 -272.9
-282.0
-75.7 +47.1
+67.9
-251.1
Net income 9M15
Impact of lower gains on
Portuguese sovereign debt
Impact of additional
impairment to increase coverage
Impact of devaluation
corporate restr funds
Impact of Visa transaction
Improvement to earnings excluding
non-usual items
Net income 9M16
Total impact : -583.6
-515.6

12
… as well as core net income, reflecting strong performance
in Portugal
* Core net income = net interest income + net fees and commission income – operating costs.
(Million euros)
Core net income*
Consolidated
Portugal
International operations
243.5 244.3
9M15 9M16
370.6 421.5
9M15 9M16
+13.7%
+0.3%
614.1 665.8
9M15 9M16
+8.4%
+15.6% w/o
FX impact

13
Net interest income: impact of the significant decrease of
Euribor rates dampened by a lower cost of deposits...
(Million euros)
Net interest income
Consolidated
Portugal
Operações internacionais
Net interest margin 1.7% 1.9%
Excluding CoCos 1.8% 2.0%
876.6 907.0
9M15 9M16
+3.5%
362.9 364.0
9M15 9M16
+0.3%
Net interest margin 1.4% 1.6%
Net interest margin 2.6% 2.7%
513.7 543.0
9M15 9M16
+5.7%
+17.5%
w/o FX impact

14
… whereas FX devaluation led to lower commissions
(Million euros)
333.7 343.2
9M15 9M16
Fees and commissions
Consolidated
164.3 138.0
9M15 9M16
-16.0%
Portugal
International operations
+2.8%
-4.6% w/o
FX impact
9M15 9M16 YoY
Banking fees and commissions 402.5 391.7 -2.7%
Cards and transfers 119.6 107.8 -9.8%
Loans and guarantees 122.1 119.8 -1.9%
Bancassurance 56.5 57.9 +2.5%
Customer account related 62.2 68.1 +9.5%
Other fees and commissions 42.1 38.0 -9.6%
Market related fees and commissions 95.4 89.5 -6.2%
Securities operations 65.5 61.2 -6.6%
Asset management 29.9 28.3 -5.4%
Total fees and commissions 498.0 481.1 -3.4%

15
Performance of other income influenced by gains on PT sovereign debt in 2015, and
by gains on the Visa transaction and higher regulatory contributions in 2016
(Million euros)
Other income
Consolidated
Portugal
International operations
73.2 85.3
9M15 9M16
481.0
183.8
9M15 9M16
-61.8%
407.8
98.5
9M15 9M16
-75.8%
+16.5%
Gains on PT sov.
debt in 2015 387.1 0.0
Visa transaction 0.0 91.0
Reg. contributions
(PT and PL) -47.6 -96.4

16
Cost reduction continues...
(Million euros)
Operating costs
Consolidated
476.8 464.7
9M15 9M16
283.7 257.7
9M15 9M16
-2.5%
Portugal
Operações internacionais
Cost to core
income 56.3% 52.4%
Cost to core
income 53.8% 51.3%
-9.2%
+5.9% w/o
FX impact
430.2 410.4
289.3 274.9
41.0 37.0
760.5 722.4
9M15 9M16
-9.7%
-5.0%
-4.6%
-5.0%
Staff costs
Other
administrative
costs
Depreciation
Cost to core
income 55.3% 52.0%

17
... making Millennium bcp one of the most efficient banks in
Portugal and in the Eurozone
* Core income = net interest income + net fees and commissions.
Cost to core income*
Bank 1
Bank 2
Bank 3
Bank 4
Latest available data
vs. peers in
Portugal
vs. Euro-zone
banks 85.7%
64.0% 55.0% 52.0%
2013 2014 2015 9M16
Cost to core income*
-34pp
Cost to core income*
61%
56%
65%
64%
75%
52%
85.7%
52.0%
78.5% 75.2%
2013 2014 2015 9M16
75%
93%
95%
86%
59%
52%
Cost-income
46.0%

18
We have reinforced the balance sheet with a significant
amount of additional impairment and provision charges... (Million euros)
613.6
870.2
117.0
242.8
730.7
1,113.0
9M15 9M16
Impairment and provisions
Consolidated
Portugal
International operations
545.4 816.7
114.1
234.2 659
1,051
9M15 9M16
+59.4%
+52.3%
148bp 221bp
Loan impairment,
net of recoveries
Cost of risk
Other impairment
and provisions
68.2 53.4
3.0 8.6
71.2 62.1
9M15 9M16
-12.8%
71bp 58bp
Loan impairment,
net of recoveries
Cost of risk
Other impairment
and provisions
Loan impairment,
net of recoveries
Cost of risk
Other impairment
and provisions
172bp 270bp
Additional impairment
(to reinforce coverage) 0.0 400.0
Devaluation of
corporate restr funds 21.1 128.6
+1.6% w/o
FX impact

19
6,334 5,808
Sep 15 Sep 16
… with lower delinquency and increased coverage
(Million euros)
Loan loss reserves Credit quality
Total coverage*
11.5% 11.0% % of
NPL>90d 55.5% 65.5%
-8.3%
* By loan-loss reserves, expected loss gap and collaterals.
Decrease in NPL>90d ratio to 11.0% at
September 30th 2016 from 11.5% at the
same date in 2015
Reinforcement of total coverage* of
NPL>90d to 119.3% (117.1% at
September 30, 2015).
117.1% 119.3%
Sep 15 Sep 16
3,566 3,804
Sep 15 Sep 16
NPL>90d %

20
Diversified and collaterised portfolio
Mortgage 46%
Consumer/ other 8%
Companies46%
59% 33% 8%
Real guarantees Other guarantees Unsecured
Loan portfolio
Loans by collateral
Consolidated
LTV of mortgage portfolio in Portugal
Loans to companies accounted for 46% of the loan portfolio at September 30, 2016, including 10% to
construction and real-estate sectors
92% of the loan portfolio is collateralised
Mortgage accounted for 46% of the loan portfolio, with low delinquency levels and an average LTV of 67%
Real estate accounts for 87% of total collateral value
82% of the real estate collateral is residential
14% 10% 13% 27% 10% 14% 12%
0-40 40-50 50-60 60-75 75-80 80-90 >90

21
Highlights
Group
• Profitability
• Liquidity
• Capital
Portugal
International operations
Conclusions
Agenda

22
Deposits influenced by FX impact in international operations;
individuals in Portugal stand out (Million euros)
Customer deposits in international op.
14,684 14,603
Sep 15 Sep 16
-0.5%
Customer deposits in Portugal
17,897 21,031
31,267 27,906
2,322 1,638
12,271 12,779
63,757 63,354
Sep 15 Sep 16
-0.5%
Customer funds
Consolidated
+6.7% w/o
FX impact
On a comparable basis: excludes Millennium bcp Gestão de Activos, following the discontinuation processes.
32,359 32,535
2,120 1,799
34,480 34,334
Sep 15 Sep 16
+0.5%
-0.4%
-15.2%
On-
demand
deposits
Term
deposits
Other BS
funds
Off-BS
funds
Companies
and
Individuals
Other (inc
public sector)

23
Credit portfolio reflects support to the economy in key
business sectors (Million euros)
Loans to Customers (gross)
25,951 24,263
3,897 4,074
25,289 24,273
55,137 52,610
Sep 15 Sep 16
-4.6%
Consolidated
International operations
12,872 12,319
Sep 15 Sep 16
-4.3%
Portugal
+2.2% w/o
FX impact
16.3% Market share among
exporting companies 15.8%
21,276 19,916
2,297 2,473
18,692 17,902
42,265 40,291
Sep 15 Sep 16
-4.7% Reduction of exposure
to construction/real
estate activities (-17%);
strong performance of
mining and
manufacturing
industries (+ 4% vs
banking system -1%) and
commerce (+3% vs
banking system -2%)
Companies
Consumer
and other
Mortgage Companies
Consumer / other
Mortgage

24
Continued improvement of the liquidity position
Commercial gap* Loans to deposits ratio*
(Billion euros)
* Based on Customer deposits and net loans to Customers.
Net loans to BS Customer
funds
Difference between BS
Customer funds and net loans
Liquidity ratios (CRD IV/CRR)
Commercial gap narrows €2.6 billion
from September 30th, 2015
Loans to deposit ratio at 100%, 97% if
all BS Customer funds are included
Liquidity ratios CRD IV/CRR higher
than the required 100%
113% 135%
NSFR (Net stable funding ratio)
LCR (Liquidity coverage ratio)
-2.5
+0.1
Sep 15 Sep 16 +2,6
-0.1
+1.8 105% 100%
Sep 15 Sep 16
100% 97%
-5pp

25
Lower refinancing needs in the medium to long term, Customer
deposits are the main funding source
Improved funding structure
3.3
0.4 0.5 1.6 1.3
Average 2009-2015
9M16 4Q16 2017 >2017
Debt repayments (medium-long term)
(Billion euros, CoCos not included)
ECB funding
(Billion euros)
77% 78%
23% 22%
Sep 15 Sep 16
Net usage of ECB funding at €4.9 billion (€4.0 billion
related to TLTRO), compared to €5.9 billion at the end
of the 3rd quarter of 2015 (TLTRO: €1.5 billion)
€13.1 billion (net of haircut) of eligible assets available
for refinancing operations with ECB, with a €8.2 billion
buffer
Customer deposits account for 78% of funding
Future debt repayments (medium-long term)
significantly lower than in the past
TLTRO
Other
Already repaid To be repaid
Customer
deposits
Other
4.4
0.9
1.5
4.0
5.9 4.9
Sep 15 Sep 16

26
Highlights
Group
• Profitability
• Liquidity
• Capital
Portugal
International operations
Conclusions
Agenda

27
Capital at adequate levels
* Estimates.
Common equity Tier 1 ratio of 12.2% on a phased-in
basis and 9.5% on a fully Implemented basis
Capital indicators in line with European benchmarks
on a phased-in basis
Common Equity Tier 1 ratio Phased-in, latest available data
vs. Euro-zone
banks
Common Equity Tier 1 ratio*
Phased-in Fully implemented
43.9 38.3 43.3 37.8 RWAs (€MM)
13.2% 12.2% 10.0% 9.5%
Sep 15 Sep 16 Sep 15 Sep 16
11.5%
11.9%
12.7%
11.7%
12.2%

28
6.9% 6.2%
5.3% 4.8%
Sep 15 Sep 16 Sep 15 Sep 16
Capital above minimum requirements, with high leverage
ratios and RWA density
(Million euros, September 2016)
+750
-829 -284 -217
+78
4,067 3,565
Equity CoCos DTAs EL gap Stakes >10%
Other CET1 fully imp.
From equity to CET1 capital RWA density RWAs as % of assets, latest available information
Phased-in Fully implemented
Deductions 9.5% CET1 ratio
fully imp.
Phased-in: 12.2%
Leverage ratio Leverage ratio
Phased-in, latest available information
Minimum required phased-in CET1 (SREP): 8.15% in 2017
26% 28%
45% 46% 52%
FR DE ES IT
3.6% 3.9%
6.0% 5.8% 6.2%
FR DE ES IT

29
Highlights
Group
• Profitability
• Liquidity
• Capital
Portugal
International operations
Conclusions
Agenda

30
11,538 13,618
22,942 20,716
2,226 1,539
10,844 11,428
47,550 47,301
Sep 15 Sep 16
Portugal: deleveraging improves liquidity position
On a comparable basis: excludes Millennium bcp Gestão de Activos, following the discontinuation processes.
(Million euros)
Loans to Customers (gross) Customer funds
-0.5%
21,276 19,916
2,297 2,473
18,692 17,902
42,265 40,291
Sep 15 Sep 16
-4.7%
On-demand
deposits
Term
deposits
Other BS
funds
Off-BS
funds
Companies
Consumer
and other
Mortgage

31
Earnings excluding non-usual items improve
(Million euros)
Net income excluding non-usual items
Non-usual items
-157.5
-42.5
9M15 9M16 +115.0
* Impairment charges in excess of 120bp cost of risk, to reinforce NPE coverage.
-394.3 Net income 100.5
0.0 Gains on Portuguese sovereign debt in 2015 272.9
20.9 Gains on the Visa transaction 0.0
Net income of -€394.3 million in the first
nine months of 2016.
Net income of -€42.5 million in the first
nine months 2016 excluding non-usual
items, a €115.0 million improvement
compared to -€157.5 million in the same
period of 2015.
Non-usual items in the first nine months
of 2016: gains on Visa transaction,
devaluation of corporate restructuring
funds and additional impairment charges
to increase coverage; Non-usual items in
the first nine months of 2015: capital
gains on Portuguese sovereign debt and
devaluation of corporate restructuring
funds.
-42.5 Net income excluding non-usual items -157.5
-90.6 Devaluation of corporate restructuring funds -14.9
-282.0 Add. impairment charges (increase coverage)* 0.0
-351.8 Total of non-usual items, net 258.0
-394.3 Net income 100.5
9M16 9M15

32
Improvement trend on core income and operating costs in
Portugal continues
* Core net income = net interest income + net fees and commission income – operating costs.
Core Income
Commissions
Net interest
income
Core income increases to €886 million in
the 1st nine months of 2016
Operating costs down to €465 million in
the same period
Continuation of the core net income*
expansion trend, to €421 million in the 1st
nine months of 2016
Core net income*
Operating costs
513.7 543.0
333.7 343.2
847.4 886.1
9M15 9M16
370.6 421.5
9M15 9M16
476.8 464.7
9M15 9M16
-2.5%
+13.7% +4.6%
(Million euros) (Million euros)
(Million euros)

33
Lower cost of deposits partially offset by the decrease of credit
volumes and Euribor
Net interest income (Million euros)
Breakdown of net interest income (Million euros)
Increase in net interest income compared to the first nine months of 2015, reflecting the
impact of the consistent reduction of the cost of term deposits and the reduction of overdue
loans, more than compensating the negative effect of the reduction of Euribor rates and of
lower credit volumes, as well as of the lower contribution from the securities portfolio
Decrease in net interest income compared to the previous quarter, mainly attributable to the
lower credit volume and lower contribution from the securities portfolio, more than offseting
the positive impact of the continuation of the reduction of the cost of term deposits and of
lower funding costs, the latter partially offset by the effect of the reduction of Euribor rates
on loan interest
1.4% 1.6%
513.7 543.0
9M15 9M16
NIM
+5.7%
3Q16 vs.
2Q16
9M16
vs.9M15
Commercial margin
Loans volume effect -4.7 -47.6
Effect of lower Euribor on credit -3.7 -74.2
Effect of cost of time deposits +4.5 +125.2
Funding and other +4.0 +27.9
Total commercial margin +0.0 +31.2
Securities -1.8 -31.6
NPL effect -0.4 +27.7
Other +0.4 +1.8
Total -1.8 +29.3

34
Continued effort to reduce the cost of deposits
Continued improvement of the spread of the
portfolio of term deposits: from -1.3% in the first
nine months of 2015 to -0.9% in the same period of
2016; September’s front book priced at an average
yield of 29bp, substantially below current back
book’s
Spread on the total loan book at 2.9% in the 1st
nine months of 2016 (3.0% at the same period of
2015)
NIM stood at 1.6% (1.4% in the 1st nine months of
2015)
Spread on the performing loan book
-1.3%
-0.9%
9M15 9M16
(vs 3m Euribor)
Spread on the book of term deposits (vs 3m Euribor)
3.0% 2.9%
9M15 9M16
NIM
1.4% 1.6%
9M15 9M16

35
Increased commissions
(Million euros)
9M15 9M16 YoY
Banking fees and commissions 293.1 300.7 +2.6%
Cards and transfers 73.9 74.5 +0.8%
Loans and guarantees 90.7 80.9 -10.8%
Bancassurance 56.5 57.9 +2.5%
Customer account related 62.2 68.1 +9.5%
Other fees and commissions 9.9 19.4 +96.0%
Market related fees and commissions 40.6 42.5 +4.5%
Securities operations 35.6 38.1 +6.9%
Asset management 5.0 4.4 -12.4%
Total fees and commissions 333.7 343.2 +2.8%

36
Continuous reduction of costs, in line with the new
commercial approach
Employees
Branches
(Million euros)
279.7 273.9
174.2 169.5
22.9 21.2
476.8 464.7
9M15 9M16
-7.4%
-2.7%
-2.1%
-2.5%
Operating costs
679 634
Sep 15 Sep 16
-45
7,555 7,429
Sep 15 Sep 16
-126
Staff costs
Other
administrative
costs
Depreciation
Cost to core
income 56.3% 52.4%

37
Credit ratio Sep15 Sep 16
NPL>90d 14.0% 13.5%
Coverage ratio Sep 15 Sep 16
NPL>90d 52.2% 62.5%
Reinforced coverage of NPL>90d
(Million euros)
NPL>90d Loan loss reserves
172bp 270bp
Loan impairment (net of recoveries) NPL>90d buildup
Cost of
risk Sep 16 vs.
Sep 15
Sep 16 vs.
Jun 16
Opening balance 5,917 5,755
+/- Net entries 294.8 -106.9
- Write-offs -529.5 -95.6
- Sales -227.9 -98.7
Ending balance 5,454 5,454
3,091 3,408
Sep 15 Sep 16
5,917 5,454
Sep 15 Sep 16
545.4
816.7
9M15 9M16

38
NPEs are decreasing, coverage is increasing and prospects are
favourable
Measures implemented in the last years with
positive impact on NPEs: strengthening of the
monitoring of credit quality, implementation and
development of new assessment models, new
internal regulations and recovery model,
improvement to the risk management governance
model.
Increase of NPE total coverage* to 99%,
supporting the target of <€7.5 billion at
December 2017.
Key measures under the plan to bring down the
level of NPEs:
– Stepping up write-offs;
– Loan sales, especially strongly-collateralised
corporates and, for individuals, loans with low
likelihood of recovery;
– Preventing mortgage cases from reaching
courts and reducing the recovery period for
cases handled by external law offices.
NPE total coverage*
NPEs (Million euros)
NPL>90d
Other
NPEs
* By loan-loss reserves, expected loss gap and collaterals.
6,213 6,134 5,917 5,572 5,454
12,783 10,921 10,327 9,777 9,257
Dec 13 Dec 14 Sep 15 Dec 15 Sep 16
86%
90% 91% 93%
99%
Dec 13 Dec 14 Sep 15 Dec 15 Sep 16

39
Foreclosed assets sold above book value
1,061
1,475
248
210
1,309
1,685
Sep 15 Sep 16
18.9% 12.5%
Net Value
Impairment
Foreclosed assets (Million euros)
Coverage
Number of properties sold
Book value of sold properties
(Million euros)
Sale value 175 145
156 131
9M15 9M16
-16.0%
1,621 1,568
9M15 9M16
-3.3%

40
Highlights
Group
• Profitability
• Liquidity
• Capital
Portugal
International operations
Conclusions
Agenda

41
Contribution from international operations
(Million euros)
Note: subsidiaries’ net income presented for 2015 at the same exchange rate as of 2016 for comparison purposes, without FX effect.
Significant FX
impact
Contribution
from
international
operations
increases on a
comparable basis
* Contribution of the Angolan operation.
149.3 -5.7 -28.7
114.8
134.8
Contribution 9M15 15.4% Poland FX Effect 9M15 comparable Contribution 9M16
+17.4%
9M15 9M16
Δ %
local
currency
Δ %
eurosROE
International operations
Poland 112.8 130.3 +15.5% +9.7% 11.4%
Mozambique 42.5 51.8 +21.9% -23.3% 21.6%
Angola* 20.2 28.5 +40.9% -1.0%
Other 9.7 6.5 -33.3% -34.4%
Net income 185.3 217.0 +17.2% -3.6%
Non-controlling interests Poland and Mozambique -64.7 -82.3
Exchange rate effect 28.7 --
Total contribution international operations 149.3 134.8 -9.7%
On a comparable basis:
Millennium Poland shareholding at 50.1% in 1Q15 143.5 134.8 -6.1%
Same as above without FX effect 114.8 134.8 +17.4%

42
Poland: growing Customer funds
3,285 3,282
1,279 1,423
6,463 6,359
11,028 11,063
Sep 15 Sep 16
+0.3%
-1.6%
+11.2%
-0.1%
(Million euros)
Loans to Customers (gross) Customer funds
Companies
Consumer
and other
Mortgage
On-
demand
deposits
Term
deposits
Other BS
funds
Off-BS
funds
+5.3%
+19.7%
-4.7%
+36.6%
-2.3%
FX effect excluded. €/Zloty constant at September 2016 levels: Income Statement 4.37407778; Balance Sheet 4.3192.
5,217 6,246
6,634
6,325
73 100 1,574
1,537 13,498
14,208
Sep 15 Sep 16

43
New banking tax and Visa Europe transaction strongly
impact net earnings
185.6 189.9
9M15 9M16
112.8 130.3
9M15 9M16
+15.5%
(Million euros)
Net income
Operating costs
ROE 11.1% 11.4%
+2.3%
FX effect excluded. €/Zloty constant at September 2016 levels: Income Statement 4.37407778; Balance Sheet 4.3192.
Net earnings increased by 15.5%, as the new banking tax
(€29.2 million) was more than compensated by the
aggregate impact in the amount (€42.3 million) of the
gains on the Visa transaction with booking additional
provisions, both in the first half of the year
Increasing in banking income (16.0%), driven by the gains
on the Visa transaction and also by the expansion of the
net interest income
Operating costs up by 2.3%
Common equity tier 1 ratio of 17.8% at the end of the 1st
nine months of 2016
Banking income
372.6 432.3
9M15 9M16
+16.0%

44
104.2 97.0
26.8 72.6
131.0
169.6
9M15 9M16
Stronger net interest income, other income impacted by Visa
Europe transaction
* Pro forma data. Margin from derivative products, including those from hedging FX denominated loan portfolio, is included in net interest
income, whereas in accounting terms, part of this margin (€9.4 million in 9M15 and €7.4 million in 9M16) is presented in net trading income.
FX effect excluded. €/Zloty constant at September 2016 levels: Income Statement 4.37407778; Balance Sheet 4.3192.
94.0 95.4
91.6 94.5
185.6 189.9
9M15 9M16
Net interest income*
Commissions and other income
Operating costs
Branches Employees
+2.3%
410 381
Sep 15 Sep 16
5,917 5,839
Sep 15 Sep 16
-78 -29
241.6 262.7
9M15 9M16
+8.7%
(Million euros)
Staff costs
Other admin.
costs +
depreciation
+29.5%
Commissions
Other
NIM 2.2% 2.4% Cost to income 49.8% 43.9%
-6.9%
+170.7%
+1.5%
+3.2%

45
44.7 35.9
9M15 9M16
Improved credit quality and coverage
NPL>90d
Loan impairment (net of recoveries)
Loan loss reserves
(Million euros)
NPL>90d ratio improved to 2.7% of total credit as
at September 30, 2016 from 2.9% on the same
date of the previous year
Provision coverage of NPL>90d increased to 107%
from 103% at the end of the first 9 months of
2015
Lower provisioning effort, as reflected by cost of
risk decreasing to 45bp (57bp in the first 9
months of 2015)
Credit ratio Sep 15 Sep 16
NPL>90d 2.9% 2.7%
Coverage ratio Sep 15 Sep 16
NPL>90d 103% 107%
333 323
Sep 15 Sep 16
325 302
Sep 15 Sep 16
Cost of risk
57bp 45bp
-19.7%
FX effect excluded. €/Zloty constant at September 2016 levels: Income Statement 4.37407778; Balance Sheet 4.3192.

46
575
774
162
178
11
11
748
964
Sep 15 Sep 16
Mozambique: strong volume growth
+28.8%
+9.8%
+34.6%
(Million euros)
Loans to Customers (gross) Customer funds
Companies
Consumer
and other
Mortgage
515 659
416
513 12
0
943
1,172
Sep 15 Sep 16
On-
demand
deposits
Term
deposits
Other BS
funds
+27.9%
+23.4%
+24.3%
FX effect excluded. €/Metical constant at September 2016 levels: Income Statement 65.50361111; Balance Sheet 87.5700.
+2.6%

47
Increasing net income in a complex environment
42.5 51.8
9M15 9M16
+21.9%
(Million euros)
Net income
Operating costs
117.8
152.1
9M15 9M16
+29.1% ROE 20.2% 21.6%
FX effect excluded. €/Metical constant at September 2016 levels: Income Statement 65.50361111; Balance Sheet 87.5700.
Net income up by 21.9%, with ROE at
21.6%, in spite of an increased tax
burden
Increase of 29.1% in banking income
due to higher net interest income
Operating costs up by 19.7%
Banking income
51.8 62.0
9M15 9M16
+19.7%

48
23.6 28.0
22.5 27.8
5.6 6.2 51.8
62.0
9M15 9M16
2,364 2,385
Sep 15 Sep 16
Growth in core income partially offset by the increase in
operating costs
+19.7%
(Million euros)
* Excludes employees from SIM (insurance company)
Net interest income
Commissions and other income
Operating costs
Branches Employees*
Staff costs
Other admin.
costs
Depreciation
68.8
101.4
9M15 9M16
+47.5%
168 173
Sep 15 Sep 16
+21 +5
22.7 23.4
26.3 27.3
49.0 50.6
9M15 9M16
+3.4%
Commissions
Other
+3.1%
+3.6%
+18.5%
+23.5%
+9.3%
NIM 6.3% 7.8%
Cost to income 44.0% 40.7%
FX effect excluded. €/Metical constant at September 2016 levels: Income Statement 65.50361111; Balance Sheet 87.5700.

49
Credit quality and coverage
NPL>90d
Loan impairment (net of recoveries)
Loan loss reserves
(Million euros)
NPL>90d ratio of 5.3% as at September 30th, 2016
with reinforced coverage: 129% at the end of the
first 9 months of 2016
Increased provisioning effort, as reflected by a
179bp cost of risk in 9M16, up from 164bp in the
same period of 2015
Credit ratio Sep 15 Sep 16
NPL>90d 6.2% 5.3%
Coverage ratio Sep 15 Sep 16
NPL>90d 95% 129%
44.1 66.5
Sep 15 Sep 16
Cost of risk 164bp 179bp
12.3
17.3
9M15 9M16
FX effect excluded. €/Metical constant at September 2016 levels: Income Statement 65.50361111; Balance Sheet 87.5700.
46.6 51.5
set 15 set 16

50
Highlights
Group
• Profitability
• Liquidity
• Capital
Portugal
International operations
Conclusions
Agenda

51
Road to 2018: targets
* Estimates.
** Includes gains on Portuguese sovereign debt (€387.1 million).
Consolidated
9M15 9M16 2018
148 bp
8.1%
13.2% phased
10.0% fully
104%
55.3%
41.0%**
221 bp
-7.7%
12.2%* phased
9.5%* fully
100%
52.0%
46.0%
< 75 bp
> 11% With a 11% fully implemented CET1
> 11%
< 100%
< 50%
< 43%
Cost of risk
ROE
CT1 / CET1
Loans to
Deposits
Cost - Core
Income
Cost - Income

52
Appendix

53
Sovereign debt portfolio
(Million euros)
Sovereign debt portfolio totals €8.1 billion, €1.6 billion of which maturing in less than 1 year
The value of Polish sovereign portfolios increased from September 30th 2015; exposure to
Portuguese, Angolan and Mozambican sovereign debt decreased
Sovereign debt maturity Sovereign debt portfolio
(September 2016)
≤1year 19%
>1year, ≤2years
20%
>2years, ≤5years
30%
>5years, ≤8years
25%
>8years, ≤10years
6%
>10years 0%
Portugal 5,049 5,331 4,355 -14% -18%
T-bills 199 1,261 827 +315% -34%
Bonds 4,850 4,070 3,528 -27% -13%
Poland 1,722 2,740 3,406 +98% +24%
Angola 468 0 0
Mozambique 499 302 246 -51% -19%
Other 92 92 89 -3% -2%
Total 7,830 8,465 8,097 +3% -4%
QoQSep 15 Sep 16 YoYJun 16

54
Sovereign debt portfolio
(Million euros, September 2016)
* Includes financial assets held for trading at fair value through net income (€146 million).
** Includes AFS portfolio (€7,730 million) and HTM portfolio (€50 million).
Portugal Poland Mozambique Other Total
Trading book* 184 96 0 37 317
≤ 1 year 6 13 0 36 55
> 1 year and ≤ 2 years 118 5 0 0 123
> 2 years and ≤ 5 years 57 54 0 0 111
> 5 years and ≤ 8 years 0 10 0 0 10
> 8 years and ≤ 10 years 3 14 0 0 17
> 10 years 0 0 0 0 1
Banking book** 4,172 3,310 246 52 7,780
≤ 1 year 822 530 149 0 1,501
> 1 year and ≤ 2 years 408 986 33 50 1,477
> 2 years and ≤ 5 years 527 1,712 64 0 2,303
> 5 years and ≤ 8 years 2,015 7 0 1 2,023
> 8 years and ≤ 10 years 399 75 0 1 475
> 10 years 1 0 0 0 2
Total 4,355 3,406 246 89 8,097
≤ 1 year 827 543 149 36 1,556
> 1 year and ≤ 2 years 525 991 33 50 1,600
> 2 years and ≤ 5 years 584 1,766 64 0 2,413
> 5 years and ≤ 8 years 2,015 17 0 1 2,034
> 8 years and ≤ 10 years 402 89 0 1 492
> 10 years 2 0 0 0 2

55
Consolidated earnings
(million euros) 9M15 9M16Impact on
earnings
Net interest income 876.6 907.0 +30.4
Net fees and commissions 498.0 481.1 -16.8
Other operating income 481.0 183.8 -297.2
Of which: Visa transaction 0.0 91.0 +91.0
Of which: Mandatory contributions in Portugal -32.6 -51.7 -19.1
Of which: Capital gains on Portuguese sovereign debt 387.1 0.0 -387.1
Banking income 1,855.6 1,571.9 -283.7
Staff costs -430.2 -410.4 +19.8
Other administrative costs and depreciation -330.3 -311.9 +18.3
Operating costs -760.5 -722.4 +38.1
Operating net income (before impairment and provisions) 1,095.1 849.5 -245.6
Of which: core net income 614.1 665.8 +51.7
Loans impairment (net of recoveries) -613.6 -870.2 -256.6
Other impairment and provisions -117.0 -242.8 -125.8
Of which: Devaluation of corporate restructuring funds -21.1 -128.6 -107.4
Impairment and provisions -730.7 -1,113.0 -382.3
Net income before income tax 364.4 -263.5 -627.9
Income taxes -67.1 68.2 +135.3
Non-controlling interests -105.0 -101.0 +3.9
Net income from discontinued or to be discontinued operations 72.2 45.2 -27.0
Net income 264.5 -251.1 -515.6

56
Consolidated balance sheet
(Million euros)
30 September
2016
30 September
2015
Assets
Cash and deposits at central banks 2,618.3 1,514.5
Loans and advances to credit institutions
Repayable on demand 421.9 984.0
Other loans and advances 1,628.2 976.1
Loans and advances to customers 48,805.8 52,478.2
Financial assets held for trading 1,090.8 1,481.1
Financial assets available for sale 10,680.0 11,556.6
Assets with repurchase agreement 20.0 10.5
Hedging derivatives 106.1 85.1
Financial assets held to maturity 415.6 432.9
Investments in associated companies 574.6 313.9
Non current assets held for sale 2,112.8 1,674.5
Investment property 61.9 147.6
Property and equipment 463.5 673.5
Goodwill and intangible assets 188.8 206.3
Current tax assets 35.0 39.9
Deferred tax assets 2,790.7 2,505.4
Other assets 882.1 904.9
73,041.6 75,985.0
30 September
2016
30 September
2015
Liabilities
Amounts owed to credit institutions 11,302.7 10,288.9
Amounts owed to customers 48,937.1 50,643.8
Debt securities 3,919.2 4,909.7
Financial liabilities held for trading 610.5 828.4
Hedging derivatives 383.1 549.0
Provisions for liabilities and charges 280.0 300.8
Subordinated debt 1,682.9 1,683.8
Current income tax liabilities 5.5 7.3
Deferred income tax liabilities 2.2 16.7
Other liabilities 970.0 1,020.1
Total Liabilities 68,093.2 70,248.5
Equity
Share capital 4,094.2 4,094.2
Treasury stock (3.1) (1.1)
Share premium 16.5 16.5
Preference shares 59.9 59.9
Other capital instruments 2.9 2.9
Legal and statutory reserves 245.9 223.3
Fair value reserves (66.1) 9.0
Reserves and retained earnings (22.8) 50.8
Net income for the year attrib. to Shareholders (251.1) 264.5
Total equity attrib. to Shareholders of the Bank 4,076.3 4,720.0
Non-controlling interests 872.0 1,016.5
Total Equity 4,948.4 5,736.5
73,041.6 75,985.0

57
(Million euros)
Consolidated income statement Per quarter
Net interest income 305.1 314.0 292.4 308.4 306.2
Dividends from equity instruments 0.3 6.2 2.0 3.8 1.2
Net fees and commission income 161.8 162.3 163.9 156.4 160.8
Other operating income -12.3 -66.4 -12.4 -75.6 -8.3
Net trading income 26.9 33.5 28.3 154.5 29.7
Equity accounted earnings 4.5 -1.6 13.9 23.8 22.9
Banking income 486.4 447.9 488.1 571.3 512.5
Staff costs 141.6 143.7 138.4 135.2 136.7
Other administrative costs 94.4 100.0 91.8 93.1 90.1
Depreciation 13.3 13.1 12.8 12.7 11.5
Operating costs 249.3 256.8 243.1 241.0 238.3
Operating net income bef. imp. 237.1 191.1 245.1 330.3 274.2
Loans impairment (net of recoveries) 150.0 204.2 160.7 458.0 251.5
Other impairm. and provisions 25.5 43.0 15.4 182.6 44.9
Net income before income tax 61.7 -56.1 69.1 -310.3 -22.2
Income tax 21.0 -29.4 15.0 -93.3 10.1
Non-controlling interests 36.1 20.7 36.4 43.1 21.5
Net income (before disc. oper.) 4.5 -47.3 17.7 -260.2 -53.8
Net income arising from discont. operations 19.3 18.1 29.0 16.2 0.0
Net income 23.8 -29.2 46.7 -243.9 -53.8
Quarterly
3Q 15 3Q 162Q 161Q 164Q 15

58
Income statement (Portugal and International operations)
For the 9-month periods ended 30th September, 2015 and 2016
(Million euros)
Sep 15 Sep 16 Δ % Sep 15 Sep 16 Δ % Sep 15 Sep 16 Δ % Sep 15 Sep 16 Δ % Sep 15 Sep 16 Δ % Sep 15 Sep 16 Δ %
Interest income 1,631 1,430 -12.3% 1,036 882 -14.9% 594 547 -7.9% 418 389 -6.9% 172 154 -10.6% 4 4 4.0%
Interest expense 754 523 -30.7% 523 339 -35.1% 231 183 -20.7% 173 134 -22.8% 63 52 -16.5% -5 -3 40.8%
N et interest inco me 877 907 3.5% 514 543 5.7% 363 364 0.3% 244 255 4.4% 109 101 -7.2% 9 7 -19.6%
Dividends from equity instruments 3 7 99.6% 3 6 >100% 1 0 -20.5% 1 0 -20.2% 0 0 -25.5% 0 0 --
Intermediat io n margin 880 914 3.8% 517 549 6.4% 363 364 0.3% 245 256 4.4% 109 101 -7.2% 9 7 -19.6%
Net fees and commission income 498 481 -3.4% 334 343 2.8% 164 138 -16.0% 110 97 -11.6% 36 23 -35.2% 19 18 -4.9%
Other operating income -54 -96 -80.0% -52 -47 9.9% -1 -49 <-100% -11 -53 <-100% 10 4 -65.7% -1 0 17.8%
B asic inco me 1,325 1,299 -1.9% 798 846 5.9% 526 453 -13.9% 343 300 -12.6% 156 128 -17.6% 27 24 -9.6%
Net trading income 506 213 -58.0% 432 88 -79.5% 74 124 66.9% 40 98 >100% 31 24 -24.6% 3 2 -36.3%
Equity accounted earnings 25 61 >100% 25 51 98.9% 0 10 >100% 0 0 100.0% 0 0 -- 0 10 --
B anking inco me 1,856 1,572 -15.3% 1,255 985 -21.6% 600 587 -2.2% 383 398 4.1% 187 152 -18.8% 30 37 20.4%
Staff costs 430 410 -4.6% 280 274 -2.1% 151 136 -9.3% 99 95 -3.6% 38 28 -25.5% 14 13 -6.5%
Other administrative costs 289 275 -5.0% 174 170 -2.7% 115 105 -8.4% 74 73 -1.8% 36 28 -22.3% 5 5 -7.5%
Depreciation 41 37 -9.7% 23 21 -7.4% 18 16 -12.6% 9 9 6.1% 9 6 -31.2% 0 0 -17.4%
Operat ing co sts 760 722 -5.0% 477 465 -2.5% 284 258 -9.2% 182 178 -2.4% 82 62 -24.7% 19 18 -6.8%
Operat ing net inco me bef . imp. 1,095 850 -22.4% 778 520 -33.2% 317 330 4.1% 200 221 10.1% 105 90 -14.1% 11 19 66.0%
Loans impairment (net of recoveries) 614 870 41.8% 545 817 49.7% 68 53 -21.7% 49 35 -27.8% 20 17 -11.8% 0 1 >100%
Other impairm. and provisions 117 243 >100% 114 234 >100% 3 9 >100% 2 9 >100% 1 0 <-100% 0 0 <-100%
N et inco me befo re inco me tax 364 -263 <-100% 119 -531 <-100% 245 267 9.0% 149 177 18.2% 85 73 -13.9% 11 18 57.2%
Income tax 67 -68 <-100% 19 -136 <-100% 48 68 41.1% 31 46 51.5% 16 20 26.0% 1 1 -10.1%
Non-contro lling interests 105 101 -3.7% 0 0 29.4% 105 101 -3.8% 0 0 -- 1 1 -24.6% 104 101 -3.6%
N et inco me (befo re disc. o per.) 192 -296 <-100% 101 -394 <-100% 92 98 6.7% 119 130 9.7% 68 52 -23.3% -95 -84 11.1%
Net income arising from discont. operations 72 45 -37.4% 57 37 -35.9% 57 37 -35.9%
N et inco me 265 -251 <-100% 149 135 -9.7% -37 -47 -27.5%
M illennium bim (M o z.)
Internat io nal o perat io ns
Gro up P o rtugal T o tal B ank M illennium (P o land) Other int . o perat io ns

59
We continue to innovate and to modernise the Bank
Modern Digital
30% of the branch
network renovated
26 branches with new
format and service model
Paperless banking for
+50% of service processes
Free wifi available in all
branches
Online account opening
M2020: only available App
to manage EU funds
projects
Fully online personal
credit application
process
Millennium mobile app
with new functionalities

60
Glossary (1/2)
Capitalisation products – includes unit linked saving products and retirement saving plans (“PPR”, “PPE” and “PPR/E”).
Commercial gap – total loans to customers net of BS impairments accumulated minus on-balance sheet customer funds.
Cost of risk, gross (expressed in bp)- ratio of impairment charges accounted in the period to customer loans (gross).
Cost of risk, net (expressed in bp)- ratio of impairment charges (net of recoveries) accounted to customer loans (gross).
Cost to income – operating costs divided by net operating revenues.
Cost to core income - operating costs divided by the net interest income and net fees and commission income.
Core income - net interest income plus net fees and commission income.
Core net income - corresponding to net interest income plus net commissions deducted from operating costs.
Coverage of credit at risk by balance sheet impairments – total BS impairments accumulated for risks of credit divided by credit at risk (gross)
Coverage of credit at risk by balance sheet impairments and real/financial guarantees –total BS impairments accumulated for risks of credit plus real and financial
guarantees divided by credit at risk (gross).
Coverage of non-performing loans by balance sheet impairments – total BS impairments accumulated for risks of credit divided by NPL
Credit at risk – definition broader than the non performing loans which includes also restructured loans whose changes from initial terms have resulted in the bank being
in a higher risk position than previously; restructured loans which have resulted in the bank becoming in a lower risk position (e.g. reinforced collateral) are not
included in credit at risk.
Credit at risk (net) – credit at risk deducted from BS impairments accumulated for risks of credit.
Customer spread – Difference between the spread on the loans to customers book over 3 months Euribor and the spread on the customers’ deposits portfolio over 3
months Euribor.
Debt securities - debt securities issued by the Bank and placed with customers.
Dividends from equity instruments - dividends received from investments in financial assets held for trading and available for sale.
Equity accounted earnings - results appropriated by the Group related to the consolidation of entities where, despite having a significant influence, the Group does not
control the financial and operational policies.
Loan book spread - average spread on the loan portfolio over 3 months Euribor.
Loan to value ratio (LTV) – Mortgage amount divided by the appraised value of property.
Loan to Deposits ratio (LTD) – Total loans to customers net of accumulated BS impairments for risks of credit to total customer deposits.
Net interest margin - net interest income for the period as a percentage of average interest earning assets.
Net operating revenues - net interest income, dividends from equity instruments, net commissions, net trading income, equity accounted earnings and other net
operating income.
Net trading income - net gains/losses arising from trading and hedging activities, net gains/losses arising from available for sale financial assets, net gains/losses
arising from financial assets held to maturity.
Non-performing loans – Overdue loans more than 90 days including the non-overdue remaining principal of loans, i.e. portion in arrears, plus non-overdue remaining
principal.
Non-performing loans ratio (net) – Loans more than 90 days overdue and doubtful loans reclassified as overdue for provisioning purposes less BS impairments
accumulated for credit risk divided by total loans (gross).
Non-performing loans coverage ratio – total BS impairments accumulated for credit risk divided by overdue and doubtful loans divided.

61
Glossary (2/2)
Loans more than 90 days overdue coverage - total BS impairments accumulated for risk of credit divided by total amount of loans overdue with instalments of capital
and interest overdue more than 90 days.
Operating costs - staff costs, other administrative costs and depreciation.
Other impairment and provisions - other financial assets impairment, other assets impairment, in particular provision charges related to assets received as payment in
kind not fully covered by collateral, goodwill impairment and other provisions.
Other net income – net commissions, net trading income, other net operating income, dividends from equity instruments and equity accounted earnings.
Other net operating income - other operating income, other net income from non-banking activities and gains from the sale of subsidiaries and other assets.
Overdue loans - loans in arrears, not including the non-overdue remaining principal.
Overdue loans coverage ratio – total BS impairments accumulated for risks of credit divided by total amount of loans overdue with instalments of capital and interest
overdue.
Overdue and doubtful loans - loans overdue by more than 90 days and the doubtful loans reclassified as overdue loans for provisioning purposes.
Return on equity (ROE) – Net income (including the minority interests) divided by the average attributable equity, deducted from preference shares and other capital
instruments.
Return on average assets (ROA) – Net income (including minority interests) divided by the average total assets.
Securities portfolio - financial assets held for trading, financial assets available for sale, assets with repurchase agreement, financial assets held to maturity and other
financial assets held for trading at fair value through net income.
Spread on term deposits portfolio – average spread on terms deposits portfolio over 3 months Euribor.
Total customer funds - amounts due to customers (including debt securities), assets under management and capitalisation products.
Total operating income – net interest income, dividends from equity instruments, net fees and commissions income, trading income, equity accounted earnings and
other operating income.

62