discharge velocities in culverts i - arlis.org · discharge velocities in culverts that ensure...
TRANSCRIPT

ArcticHIro1o8tcConsu1tants
ARCTIC GRAYLING
(Thymallus arcticus)
.0.DOUGlAS, ALASKA 99824..
DISCHARGE VELOCITIES IN CULVERTS
THAT ENSURE PASSAGE OF
P.o Box 80214 • Fairbanks, Alaska • 99708

IIIIIIII'I~I
IIII~i J.u
r--00('I)r--LDCOoooLDLDr--('I)
('I)
DISCHARGE VELOCITIES IN CULVERTS
THAT ENSURE PASSAGE OF
ARCTIC GRAYLING
(Thymallus arcticus)
Prepared For:
Alaska Department of Fish and GameHabitat DivisionFairbanks, Alaska
Prepared By:
Arctic Hydrologic ConsultantsP.O. Box 80214
Fairbanks, Alaska 99708
May 10, 1985
~Lb~.SlQ))51
-I q&,~
ARLIS _Alaska Resources Library & Information Se
Library Building, Suite 1113211 Providence Drive
Anchorage, AK 99508-4614

where:
EXECUTIVE SUMMARY
Using the values suggested above, the equation reduces to:
V = 12.483 - 4.972 log (CL)
design culverts to pass adultand when the data required to
for the particular stream ofof Fish and Game (ADF&G) has
equation tohigh water,unavailable
Departmentthat:
1
determine the instantaneous discharge of the meanannual spring flood peak,determine the velocity in the culvert at the peakdischarge,
the water temperature (T) be assumed to be 37 degreesFahrenheit (2.78 degrees C),the grayling fork length (FL) be assumed to be 9-1/2inches (241mm),the percent passing be specified as 75 percent, andthe velocity predicted with the above equation be takenas the allowable velocity during the instantaneous peakof the mean annual spring flood.
(1)
(2)
(1)
(2)
(3)(4)
Based on the above equation, the allowable velocity for variousculvert lengths, and the approximate 67 and 95 percent confidencelimits are presented in Table I.
V is the average water velocity in a culvert at whichgrayling can pass,
CL is culvert length in feet,FL is fork length of grayling class in millimeters,T is water temperature in degrees Celsius (C), andP is percentage of grayling in a given length class
(FL) required to pass the culvert, in percent.
To design a culvert to ensure that the maximum allowable velocityfor adult grayling is not exceeded during the mean annual springflood, the following steps should be taken:
V = O.S41-4.972log(CL)+S.7S7log(FL)+O.786log(T)-1.129log(P+1)
When using the abovegrayling during springuse the equation areinterest, the Alaskasuggested (Post, 1981)
An equation has been developed to predict the average velocity atwhich a specified percentage of a specified length class ofArctic grayling (Thymallus arcticus), in a culvert of specifiedlength, can pass. The equation was developed using datacollected by MacPhee and Watts (1976), and multiple linearregression techniques. The equation is:
[- ~
~rL[
[~
f~
[
CT~L.
[
b[
E[
[
b{ .
L
t[

2
Although it was beyond the scope of this project to quantify thedelay associated with various combinations of errors, it is notedthat such combinations will occur. ,For this reason, as well asfor others, it is stated that the sensitivity analysis onlyprovides an indication of the approximate magnitude of the impactthat could occur.
In analyzing the six sources of variability, it is shown that inall cases the average maximum delay (for 9-1/2 inch grayling andthe range of culvert lengths analyzed) due to any single sourceof variability is less than 3.6 days, 90 percent of the time. Itis noted that 50 percent of the time there is no delay (for 9-1/2inch grayling) when considering any single source of variability.
Due to the economic and ecological ramifications of either overor under- design, further studies are recommended. Specificrecommendations are also made concerning additional designpractices that might be used to ensure grayling passage.Finally, recommendations are made concerning the interpretationof the results obtained from the equations developed herein,during design review and culvert monitoring.
calculate the maximum allowable velocity using one ofthe above equations, and _" __ensure that the velocity in the culvert will be lessthan or equal to the maximum allowable grayling passagevelocity.
(3)
(4)
Since use of the above described design technique involves theuse of a regression relationship and typical values of the inputparameters, there will be circumstances where the predictedvelocity will cause actual fish passage to be either morerestrictive or less restrictive than desired. Although thenumber of cases of under- and over-design can be expected to beapproximately equal, the impact on the fisheries population isnot equal. For this reason a sensitivity analysis was performedto determine the impact due to under-design as a result of usingthe average regression relationship and the specified values ofthe parameters. The analysis suggests that there are sevenpossible sources of variability, and that six can be analyzed ina semiquantitative manner.
The sensitivity analysis also notes that when the maximumallowable velocity is exceeded for a given period of time, only aportion of the spawning population will appear at the culvertduring that time. An analysis of the MacPhee and Watts data(1976), suggests that an average of 16 percent of the spawnersapproached the culvert on the day of the migration peak. Of thespawners that do approach the culvert during the time when theallowable velocity is exceeded, the analysis showed thatapproximately 24 percent or more of the adult grayling will passthrough unrestricted, 90 percent of the time.
[, 1.
-
[
[
['
f'r'r'CJ
r.[
[
[
[
E[
[
L(
Lft
L

~,-,--,._--
[- It
rTABLE OF CONTENTS
Page
............................................
[
r[
EXECUTIVE SUMMARY
TABLE OF CONTENTS
LIST OF FIGURES
• • • • • • • • • • • • • • • • • • • • • • • • • • • • • • • • • • • • • • • • • •
• • • • • • • • • • • • • • • • • • • • • • • • • • • • • • • • • • • • • • • • • •
1
3
5
INTRODUCTION •••••••.•••••.•••••••••••.•••••••••.•••••••••••LLIST OF TABLES ....•.....•.....•................•.........••. 6
7
L Problem • • • • • • • • • • • • • • • • • • • • • • • • • • • • • • • • • • • • • • • • • • • • • • • 7
Objective .•••..•.••••••••••.•••••••••••••••.••••••...• 7
Typical Conditions For Use In Design ••••••••••••••••••
..............................................................................
7
12
12
14
WhichAt.......................Water VelocitiesCulverts
Equation For AverageGrayling Can Pass
RESULTS AND DISCUSSION
METHOD OF ANALYSIS[
[
-r~
LL
Implications For A Typical Spawning Population
Impact Of ActualThe Assumed
·..........................................
·..........................................
16
15
19
17
18
18
17
16
........Varying From...........................Conditions
Conditions
·..........................................·..........................................
·..........................................
·............ ..............................
Case 6
Case 4
Case 5
Case 1
Case 2
Case 3
L
L
[
[
L
Some Final Thoughts
..................... .. .... . . . . . ... . . .. . . . . . .. ..•
Case 7LLL
RECOMMENDATIONS
Design
·........................................................................
............................................
19
20
21
21
L 3

Review and Culvert Monitoring
[
r~Design
Future Studies
• • • • • • • • • • • • • • • • • •
................. ..-. - - .22
23
[ REFERENCES • • • • • • • • • • • • • • • • • • • • • • • • • • • • • • • • • • • • • • • • • • • • • • • • • 25
[
[
f'
L[-f~
~-..--..:
[
L[
[
[
[
LLL[
ACKNOWLEDGEMENTS • • • • • • • • • • • • • • • • • • • • • • • • • • • • • • • • • • • • • • • • • • •
..
4
26

[
r[
[
[
[
['
cT'
1-=
[~
[
[
t[
[
LLt[
£
Figure
1
2
3
-- -
LIST OF FIGURES
MEDIAN DIMENSIONLESS HYDROGRAPH
RELATIVE FLOW PROPERTIES OF CIRCULAR CONDUITS
"DISTRIBUTION OF THE TOTAL NUMBER OF SPAWNINGSIZE GRAYLING SAMPLED IN 1973, 74 & 75ON POPLAR GROVE CREEK
5
Page
27
28
29

Lr[
[
Lr'L
['
[
[l~.o'
[
[
[
[
[
[
l{
LI •t
L
Table
1
2
3
4
5
6
LIST OF TABLES
ACCEPTABLE DISCHARGE VELOCITIES FOR GRAYLINGPASSAGE DURING TYPICAL DESIGN CONDITIONS
SENSITIVITY ANALYSIS OF ERRORS IN ESTIMATING"DISCHARGE VELOCITY AT WHICH GRAYLING CAN PASSVARIOUS CULVERT LENGTHS
PERCENTAGE OF 9-1/2 INCH AND LARGER GRAYLINGMOVING EACH DAY OF THE SPAWNING MIGRATIONON POPLAR GROVE CREEK
SENSITIVITY ANALYSIS OF ERROR IN PREDICTINGVELOCITY IN CULVERT
SENSITIVITY ANALYSIS OF ERROR IN PREDICTINGMEAN ANNUAL DISCHARGE
THE DELAY LIKELY TO BE INCURRED BY 9-1/2 INCHGRAYLING EXPECTED TO PASS WITH NO DELAY ATTHE MEAN ANNUAL FLOOD BUT ENCOUNTERING ALARGER FLOOD
6
Page
30
31
32
33
34
35
•

INTRODUCTION
One species of fish in particular, the Arctic grayling (Thymallusarcticus), migrates to its spawning beds during spring runoff. Atemporary blockade, such as high water velocities in a culvert,may prevent the grayling from reaching suitable habitat beforespawning. When forced to spawn in habitat that is less thansuitable, egg survival is likely to be significantly reduced andthe fisheries resource for the entire stream may be seriouslyimpacted. Therefore, it is necessary to-design culverts toensure that an acceptable number of grayling are able to migrateupstream during peak flows.
Culverts, which are otherwise properly designed,combination of stream bed conditions and waterexcess of those negotiable by fish. Such a
, seriously impact the fisheries resource of a
[,
[
[
[
[
[
['
[
Problem
may createvelocitiessituation
stream.
ain
can
7
METHOD OF ANALYSIS
The objectives of this study are as follows.
Objective
whichduring
Document a method of predicting the velocity atadult grayling can pass a particular culvertthe mean annual spring flood.
2)
3) Make recommendations for design, design review andculvert monitoring, and future studies of fi~h passagecriteria.
1) Develop a relationship with a known error that relatesthe average water velocity at which grayling of variouslengths can negotiate culverts, to parameters thatappear to influence the performance of grayling.
To develop a relationship between the average water velocity atwhich grayling can negotiate a culvert and the parameters whichappear to influence the ability of grayling to negotiateculverts, the BMDP Biomedical Computer Pr~grams (UCLA, 1979) were
The discharge velocities at which grayling can negotiate aculvert are not well understood. A study by MacPhee and Watts(1976) relates swimming ability to fork length< and watertemperature for 60-foot and lOO-foot culverts. However,thestudy does not present the error associated with therelationship, nor does it suggest a means of determining anacceptable velocity for culverts of other lengths.
LLL
[
[
Lt:f'b
[
I~
·C'~~L

--- ~"~~-~-""-~--"-----------------
MacPhee and Watts (1976) performed a total of 44 tests over athree-year period to determine the ability of grayling to ascendculverts under various conditions. In each test, the generalprocedure was:
used. In particular, a multiple linear stepwise regressionprogram, BMDP-2R, was used to determine the relationship whichbest describes the velocity at which grayling can "pass a culvert.The analysis was conducted using the data collected by MacPheeand Watts (1976).
The data were categorized according to fish length to produce 466cases. The parameters measured during each of the tests andconsidered herein, included: average water velocity in theculvert, fish length, culvert length, percent of graylingpassing the culvert, water temperature, and the headwater depthto culvert diameter ratio (HW/D). The range over which each ofthe variables was measur~d is as follows:
to block the upstream migration of grayling with a dam,capture the grayling in a riffle and pool area close tothe dam,place the grayling in the tail box below the culvert,andcount the grayling that successfully ascended or failedto ascend the culvert in a 24-hour period.
(1)(2)
(3)
(4)
r"'I-L_
co
[
r'[
[[-
[[~
In the regression analysis, velocity is designated as thedependent variable and fish length, percent passing, culvertlength, water temperature, and HW/D are designated as theindependent variables. Correlation coefficients are determinedfor each of the pairs of variables to ensure the independence ofthe independent variables. Each of the 466 cases is weightedaccording to the number of fish observed in each case.
The independent variables were entered (one each step) into theregression equation in a stepwise manner. At each step, thevariable with the highest F ratio was added (Younger, 1979); and anew equation was formed. The equation which had the least errorassociated with the estOimate (i.e., standard error of theestimate, SEE) was chosen. If a particular variable had a smallrange, it was removed from the equation, if its removal did notincrease the SEE substantially.
[
[
LEL[
L
Velocity:Culvert Length:Fish Length:Temperature:Headwater Depth/Diameter:
2.0-6.2 feet per second.60 feet and 100 feet.96-360 millimeters.2-14 degrees Celsius (C).0.3-0.8 feet per foot.
Lf
t
It should be noted that percent passing might haveproperly (in a statistical sense) designated as thevariable. However, velocity was designated as thevariable for the following reasons.
~
been moredependentdependent
[ 8

[i
r:[
r[
[
[
[
E[
[
[
I:LCbLf '
t
[
(1) Designation of percent passing as the dependentvariable does not present an equation which yeildsvelocities at which grayling £an-pasa culverts that aresignificantly different from those yielded from theabove described analysis.
(2) The approach taken in this study enables a morestraight forward analysis of the consequences resultingfrom the errors associated with use of an acceptablegrayling pa~sage veloc~ty equation.
The approximate 67 percent confidence limits for the velocitiespredicted with the best-fit regression equation we~e calculatedas follows. The upper limit was calculated by adding onestandard error of the estimate (SEE) to the predicted velocity.The lower limit was calculated by subtracting one SEE from thepredicted velocity. The approximate 95 percent confidence limitswere calculated in a similar manner using two standard errors ofthe estimate. However, it should be noted that these confidencelimits are only approximate, as the error will increase beyondthat stated above as the conditions represented by theindependent paramet~rs deviate from the average condition.
In order to use the regression equation for culvert design,without obtaining site specific information, it is necessary tomake some assumptions as to the typical value of each of theindependent parameters. Typical values were provided by theAlaska Department of Fish and Game (Post, 1981).
In order to analyze the impact of using the regression equationand typical parameter values in culvert design, a sensitivityanalysis was performed. To do this, the possible sources oferror were identified and the possibility of quantifying theerror determined.
For the quantifiable sources of error, an attempt is made toaetermine the impact of an error in terms of: (1) the time thedesign length class of grayling is delayed, (2) the percentage ofa typical spawning population likely to pass at the peakdischarge despite the error, and (3) the percentage of thespawning population affected by the adverse conditions. Adverseconditions are defined as those conaitions which are more severe(in terms of velocity) than those considered acceptable fordesign purposes. The Poplar Grove Creek grayling population isassumed typical and the data available for it (MacPhee and Watts,1976) are used in this portion of the analysis.
In order to determine the amount of time the design length classof grayling is delayed, the time necessary for the velocity inthe culvert to drop to an acceptable velocity was determined. Todo this, a median dimensionless flood hydrograph (Figure I) and ahydraulic elements chart (Figure II) were used. The mediandimensionless flood hydrograph shown in Figure I was developedfrom 41 individual flood hydrographs on the following ninestreams:
9
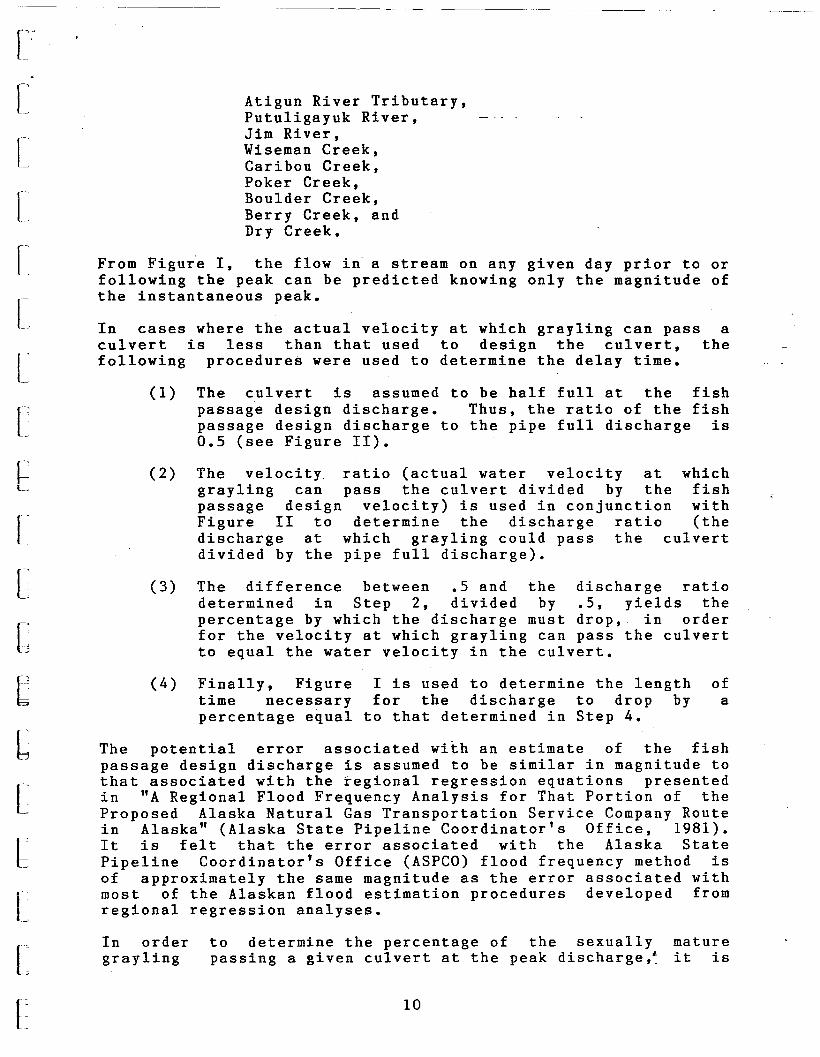
In cases where the actual velocity at which grayling can pass aculvert is less than that used to design the culvert, thefollowing procedures were used to determine the delay time.
From Figure I, the flow in a stream on any given day prior to orfollowing the peak can be predicted knowing only the magnitude ofthe instantaneous peak.
(4) Finally, Figure I is used to determine the length oftime necessary for the discharge to drop by apercentage equal to that determined in Step 4.
(1) The culvert is assumed to be half full at the fishpassage design discharge. Thus, the ratio of the fishpassage design discharge to the pipe full discharge is0.5 (see Figure II).
The velocity. ratio (actual water velocity at whichgrayling can pass the culvert divided by the fishpassage design velocity) is used in conjunction withFigure II to determine the discharge ratio (thedischarge at which grayling could pass the culvertdivided by the pipe full discharge).
(2)
(3) The difference between .5 and the discharge ratiodetermined in Step 2, divided by .5, yields thepercentage by which the discharge must drop, in orderfor the velocity at which grayling can pass the culvertto equal the water velocity in the culvert.
Atigun River Tributary,Putuligayuk River,Jim River,Wiseman Creek,Caribou Creek,Poker Creek,Boulder Creek,Berry Creek, andDry Creek.
The potential error associated with an estimate of the fishpassage design discharge is assumed to be similar in magnitude tothat associated with the regional regression equations presentedin "A Regional Flood Frequency Analysis for That Portion of theProposed Alaska Natural Gas Transportation Service Company Routein Alaska" (Alaska State Pipeline Coordinator's Office, 1981).It is felt that the error associated with the Alaska StatePipeline Coordinator's Office (ASPCO) flood frequency method isof approximately the same magnitude as the error associated withmost of the Alaskan flood estimation procedures developed fromregional regression analyses.L
[~..
['
[
[
[
[
[
[
~L
[~
[
C~
6bL
f'
lIn ordergrayling
to determine the percentage of the sexually maturepassing a given culvert at the peak discharge,~ it is
[ 10

[,
r[
[
L[~
['
[r e
,
lL"
[
[
[
t[
C
LLLL
"~-----~----------_._----~-------------~-~~--- _.~--------------------"'- --.--------------
necessary to adjust the size-frequency distribution of ripegrayling suggested by the MacPhee and Watts (1976) data for thePoplar Grove grayling population. Th~adjus~ment is necessarydue to the fact that ripeness as defined by MacPhee and Watts(1976) does not include all grayting that will spawn in the yearin which the ripeness determination is made. In other words, thefact that a particular grayling is not ripe at the time it issampled does not mean it will not spawn that year.
Using the data on grayling ripeness presented by MacPhee andWatts (1976) and by accounting for the error in estimating thesexual maturity of males and females, an average size-frequencydistribution (Figure III) for the sexually mature Poplar GroveCreek grayling was developed. The error in estimating the sexualmaturity of males and females was partially accounted for byassuming that all grayling in the 10.6 inches (270 mm) or greaterlength classes were sexually mature. Additionally, the number ofripe males in all length classes less than 10.6 inches (270 mm)was increased by 12 percent (Chihu1y, 1982), and the percentageof ripe females was assumed equal to the percentage of ripe males(Chihu1y, 1982). The percentage of each length class (sexuallymature grayling) passing a culvert for a given set ofcircumstances is determined using the equation to predict theaverage allowable velocity. By summing the percentage ofsexually mature grayling in each length class that can pass theculvert, the total percentage of sexually mature graylingpassing the culvert at the peak discharge is determined.
To determine the approximate percentage of the primary spawningsize grayling affected by the adverse conditions, the PoplarGrove Creek data (MacPhee and Watts, 1976) on the number of 9-1/2inch (241 mm) or larger grayling approaching the culvert each dayof the run were utilized. The average percentage of grayling, inthe 9-1/2 inch (241 mm) or larger size classes, approaching theculvert on each day of the run was determined from the threeyears of data presented by MacPhee and Watts (1976). It isassumed that the migration and discharge peaks coincide, and thatthe time period during which the adverse conditions prevailed isequal to the time the design length class of grayling (i.e. 9-1/2inch grayling) would be delayed.
It should be noted that there is a difference in the size ofgrayling used to determine the percentage of sexually maturegrayling able to pass the culvert during the adverse conditionsand the percentage of fish approaching the culvert during theadverse conditions. Ideally, both of these analyses would haveconsidered grayling down to 7.5 inches (190 mm) in size, as thisis the minimum size of grayling thought to be capable of spawning(in this system). However, due to the manner in which the PoplarGrove Data were presented (MacPhee and Watts, 1976), this was notpossible.
To estimate the percentage of sexually mature grayling unable tomove through the culvert unrestricted, during adverse conditions,the percentage of sexually mature grayling not able to pass
11

---_._-----_.-.~.----
[i
['
r-
['
[
['
[
[
~L.
[
[
[
cr~
['
LLI'
t£
L
through the culvert during the peak flow is multiplied by thepercentage of primary spawning size grayling approaching theculvert during the adverse conditions.- Although this procedurewill tend to mildly over-estimate the number of sexually maturegrayling which are delayed, data needed to do a more preciseestimate were not available from the MacPhee and Watts (1976)report.
Finally, to estimate the amount of time 9-1/2 inch (241 mm)grayling would be delayed during floods larger than the meanannual flood, the index me~hod flood peak ratios developed by theAlaska State Pipeline Coordinator's Office (1981) were used. Theratios represent the relative magnitude of the flood of interestto the mean annual flood. Since different sets of ratios weredeveloped to describe the streams that are located north andsouth of the Yukon River, along the proposed gas pipeline route,the ratios were averaged for this study. Using the averageratios and the median dimensionless hydrograph, the delay timefor 9-1/2 inch (241 mm) grayling was computed.
RESULTS AND DISCUSSION
Equation For Average Water Velocities At Which GraylingCan Pass Culverts
To establish an acceptable relationship for predicting thevelocity at which grayling can pass a specified length ofculvert, three different regression equations were considered.Each equation and the reasons for selecting one equation as beingbetter than the others is presented below.
The first equation is a linear function of the untransformedvariables and is as follows.
EQUATION 1:
V = 5.04-0.024(CL)+0.011(FL)+0.025(T)-O.023(P+1)-1.60(HW/D)
where:
V is water velocity in feet per second (fps),CL is culvert length in feet,FL is grayling fork length in millimeters,T is water temperature in degrees Celsius,P is percentage of fish ascending the culvert in
percent, andHW/D is headwater depth to culvert diameter ratio.
The standard error of the estimate (SEE), the mean samplevelocity (VEL), the correlation coefficient (R), and thecoefficient of determination (R-square) are as follows:
SEE = 0.758 fpsVEL = 3.57 fps
12
---.-~--.,,----~-..-.._-_._---.---- -_._---_.__..~ ..._-~---_.~--_._- _..~~------~----------~-~----------_._-----
13
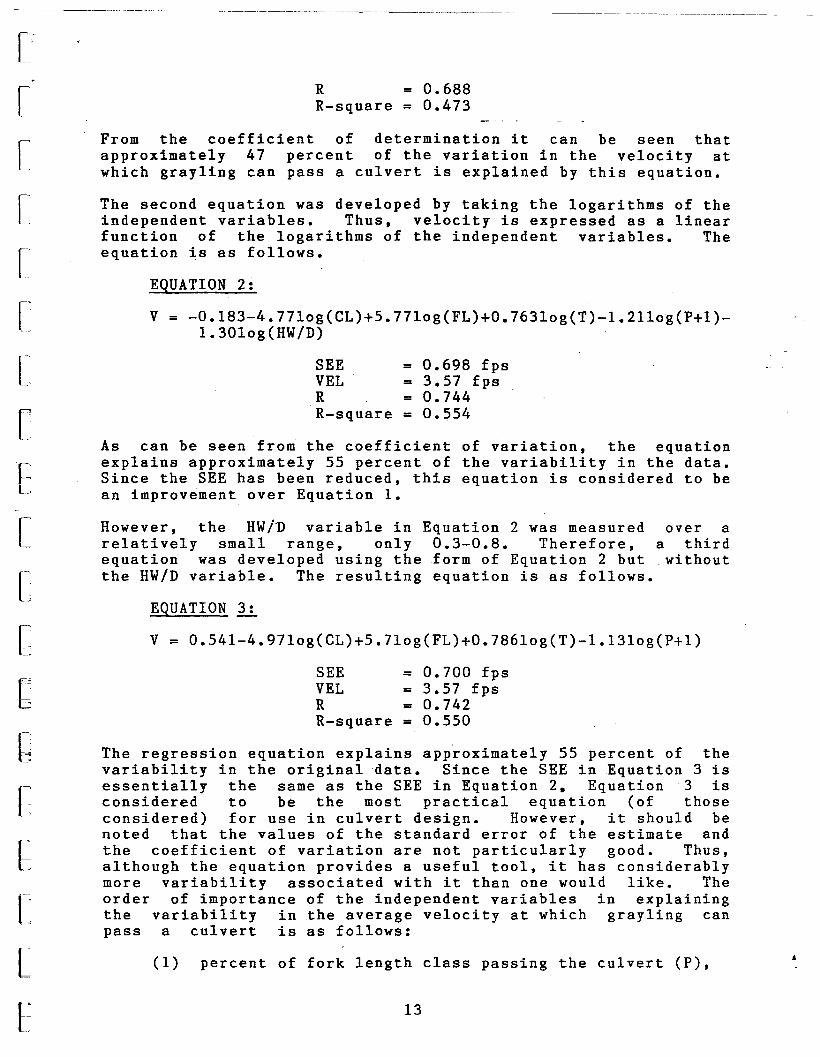
(1) percent of fork length class passing the culvert (P),
EQUATION ~
V = 0.541-4.97Iog(CL)+5.710g(FL)+0.78610g(T)-1.1310g(P+l)
From the coefficient of determination it can be seen thatapproximately 47 percent of the variation in the velocity atwhich grayling can pass a culvert is explained by this equation.
•
over aa third. without
Equation 2 was measured0.3-0.8. Therefore,£orm of Equation 2 butequation is as follows.
= 0.688= 0.473
= 0.700 fps= 3.57 fps= 0.742= 0.550
= 0.698 fps= 3.57 fps= 0.744= 0.554
SEEVELRR-square
RR-square
SEEVELRR-square
EQUATION 2:
V = -0.183-4.77log(CL)+5.77log(FL)+0.763log(T)-1.21log(P+l)L 30log(HW/D)
The regression equation explains approximately 55 percent of thevariability in the original data. Since the SEE in Equation 3 isessentially the same as the SEE in Equation 2. Equation 3 isconsidered to be the most practical equation (of thoseconsidered) for use in culvert design. However, it should benoted that the values of the standard error of the estimate andthe coefficient of variation are not particularly good. Thus,although the equation provides a useful tool, it has considerablymore variability associated with it than one would like. Theorder of importance of the independent variables in explainingthe variability in the average velocity at which grayling canpass a culvert is as follows:
As can be seen from the coefficient of variation, the equationexplains approximately 55 percent of the variability in the data.Since the SEE has been reduced, this equation is considered to bean improvement over Equation 1.
However, the HW!n variable inrelatively small range, onlyequation was developed using thethe HW/D variable. The resulting
The second equation was developed by taking the logarithms of theindependent variables. Thus, velocity is expressed as a linearfunction of the logarithms of the independent variables. Theequation is as follows.
[
~
[
[
[
L['
[
E[
[
[
Cr.Jt:~
LLLLr:

14
Typical Conditions For Use In Design
Therefore, to design a culvert to ensure that the allowablevelocity is not exceeded during the mean annual spring flood, thefollowing steps must be taken during culvert design:
In order to simplify the design effort when the typicalconditions apply, Table 1 was prepared using Equation 4. InTable 1, the allowable velocity for vario~s culvert lengths, and
degrees(2.78= 37 degrees .FahrenheitCelsius),
= 9-1/2 inches (241 mm)= 75
determine the peak discharge of the mean annual springflood,determine the velocity in the culvert at the dischargedetermined in Step 1,calculate the allowable velocity using Equation 3 (ifsite specific information is available) or usingEquation 4 (if site specific information isunavailable), andensure that the velocity in the culvert will be lessthan or equal to the allowable velocity.
'cri tical grayling size,water temperature during the critical migration period,average percentage of the critical grayling sizeexpected to pass the culvert unrestricted, anddischarge during the critical migration period.
(4)
(1)
(2)
(3)
v = 12.483 - 4.972 log (CL)
EQUATION 4:
(1)(2)(3)
(4)
Temperature
Fish LengthPercentage Passing
Using these values, Equation 3 reduces to
(2) average grayling fork length in class (FL),(3) culvert length (CL), and.(4) water temperature (T).
The Alaska Department of Fish and Game (Post, 1981) hasdetermined that typically the most critical conditions occurduring the spawning run, that the spawning run usually occursduring spring breakup, and that it is necessary to pass, on theaverage, 75 percent of the practical minimum size of spawninggrayling without delay. Thus, ADF&G has suggested (Post, 1981)that the following typical values be used with Equation 3, wheresite specific information is unavailable.
In order to use the above equation to ensure that grayling willbe capable of passing a culvert installation, during the designof the culvert, some additional information and guidance isnecessary. Specifically, information is needed concerning the:
[
t[
b[
[
LLLL
r~"
rL"
f'[
L'['
['
J=L
[
[
[
[
[
L[
[
G
[
[
[
LC[
LLr~
l~
L
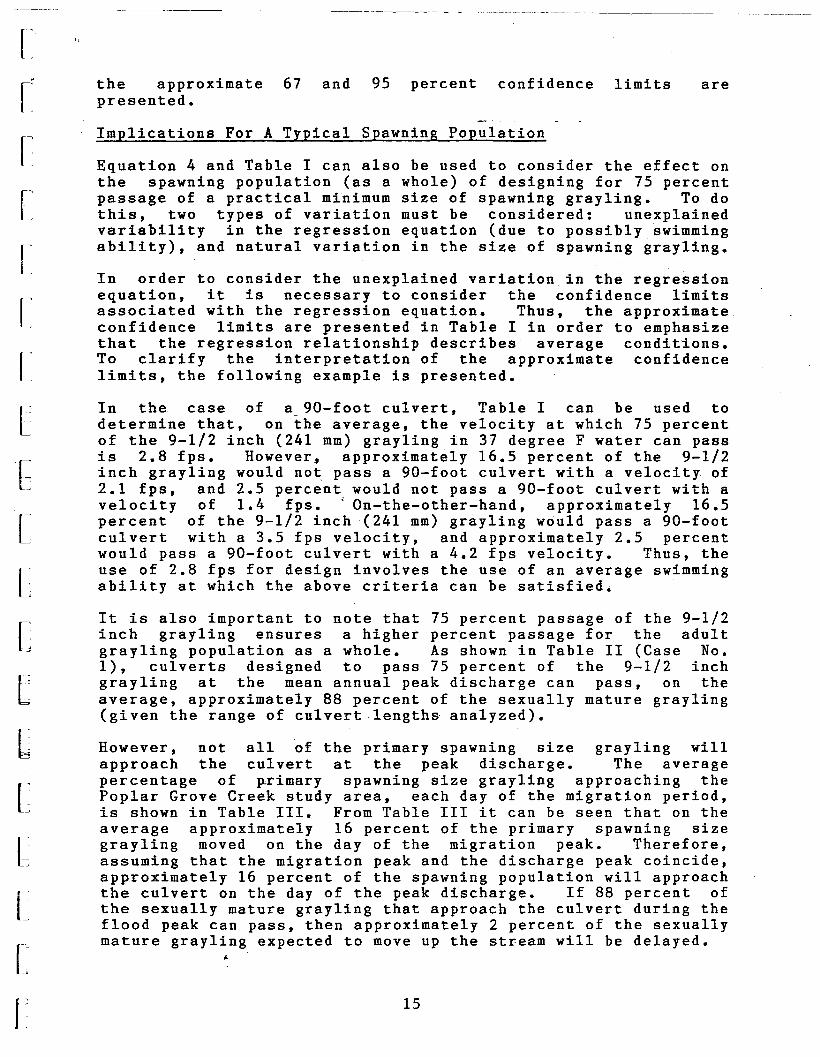
the approximate 67 and 95 percent confidence limits arepresented.
Implications For A Typical Spawning Population
Equation 4 and Table I can also be used to consider the effect onthe spawning population (as a whole) of designing for 75 percentpassage of a practical minimum size of spawning grayling. To dothis, two types of variation must be considered: unexplainedvariability in the regression equation (due to possibly swimmingability), and natural variation in the size of spawning grayling.
In order to consider the unexplained variation in the regressionequation, it is necessary to consider the confidence limitsassociated with the regression equation. Thus, the approximateconfidence limits are presented in Table I in order to emphasizethat the regression relationship describes average conditions.To clarify the interpretation of the approximate confidencelimits, the following example is presented.
In the case of a_ 90-foot culvert, Table I can be used todetermine that, on the average, the velocity at which 75 percentof the 9-1/2 inch (241 mm) grayling in 37 degree F water can passis 2.8 fps. However, approximately 16.5 percent of the 9-1/2inch grayling would not pass a 90-foot culvert with a velocity of2.1 fps, and 2.5 percent would not pass a 90-foot culvert with avelocity of 1.4 fps. < On-the-other-hand, approximately 16.5percent of the 9-1/2 inch (241 mm) grayling would pass a 90-footculvert with a 3.5 fps velocity, and approximately 2.5 percentwould pass a 90-foot culvert with a 4.2 fps velocity. Thus, theuse of 2.8 fps for design involves the use of an average swimmingability at which the above criteria can be satisfied.
It is also important to note that 75 percent passage of the 9-1/2inch grayling ensures a higher percent passage for the adultgrayling population as a whole. As shown in Table II (Case No.1), culverts designed to pass 75 percent of the 9-1/2 inchgrayling at the mean annual peak discharge can pass, on theaverage, approximately 88 percent of the sexually mature grayling(given the range of culvert lengths analyzed).
However, not all of the primary spawning size grayling willapproach the culvert at the peak discharge. The averagepercentage of ~rimary spawning size grayling approaching thePoplar Grove Creek study area, each day of the migration period,is shown in Table III. From Table III it can be seen that on theaverage approximately 16 percent of the primary spawning sizegrayling moved on the day of the migration peak. Therefore,assuming that the migration peak and the discharge peak coincide,approximately 16 percent of the spawning population will approachthe culvert on the day of the peak discharge. If 88 percent ofthe sexually mature grayling that approach the culvert during theflood peak can pass, then approximately 2 percent of the sexuallymature grayling expected to move up the stream will be delayed.
•
15

_._-_..__.. _-~_._-_..'---~--~'----'~------_._-----,---~_.__.~~---~ --.'.._---,- - ~- -~-----~--~--- - ---~----
16
Case 1
Impact Of Actual Conditions Varying From The Assumed Conditions
the assumption that Equation 4 applies to all"grayling populat~ons as well as it applies to thePoplar Grove Creek population,the assumption that the water temperature is 37degrees F,the assumption that the practical minimum size ofspawner is 9-1/2 inches (241 mm),the unexplained variability in Equation 4 (expressedas confidence limits),the ability to calculate the expected velocity in aculvert during design.the unexplained variability of the method used topredict the mean annual flood (usually expressed asconfidence limits), andthe variability in severity of flood that actuallyoccurs from one year to the next (i.e. 1-, 2-, 5- yearflood).
of Equation 3 on streams other than Poplar Grove Creekthat the grayling populations of the other streams areto the Poplar Grove grayling population. However, the
of variation from one population to another is unknown,data from only one population were used in this study.
(7)
(2)
(3)
(4)
(5)
(6)
(1)
The useassumessimilaramountsince
Each of the above referenced sources of possible variation isdiscussed briefly below.
It should be noted that the numbers presented for delay times andpercentage of grayling affected are averages, based on theculvert lengths analyzed. The actual delay times and percentageof grayling affected at a particular culvert vary depending onthe culvert length (all other parame~ers being as assumed in theanalysis). To determine the effect of culvert length, Tables II,IV and V should be consulted.
In each case there is an equal chance that the variation willenhance or hinder fish passage. To analyze the effect on thegrayling population, of sizing culverts using the proceduressuggested above, ~ an attempt is made to quantify the possiblevariability. Only variations from the average that would hinderfish passage are considered in the analyses. However, it must beremembered that approximately 50 percent of the time thevariation from assumed conditions will enhance fish passage.
The above discussion assumes that the·~ctual spawning populationand environmental conditions are as specified in the typicalconditions. However, actual conditions may vary from the assumedconditions in a particular year and/or on a particular stream.Therefore, in using Equation 4 to design culverts to ensure agiven level of grayling passage, there are seven possible sourcesof variability that should be considered:
"rLL['
L[
[
[
'CI .L~
[
[
[
CfJ..b
[
bLLL

[' '1
.
[
[
[
[
[
[
Cf~
( -IL_..J
[
[
[
E[
[
LLr-t:
[
-.__._-------_.._.__._.~_._-._------_ .._-_.._---~._--_._ ..~-~._--- ---------------------- -.._--~----=--
Therefore, when applying the regression equation to populationson streams other than Poplar Grove Creek, it should be rememberedthat there is no way of knowing whether the_ populations aresimilar. Since only one population was studied, the possiblevariability cannot be quantified.
Case 2
For design purposes, it has been suggested that the watertemperature be assumed to be 37 degrees F. This represents theaverage water temperature, at the peak of the spring flood, on anumber of streams for which data were available. However, inapproximately 10 percent of the cases analyzed, the temperaturewas 33 degrees F or less at the peak discharge. Thus,_ if thewater temperature is really 33 degrees F, the effect of designinga culvert assuming a water temperature of 37 degrees F ispresented in Table II as Case No.2.
As can be seen in Table II, the result of such an error is thatapproximately 25 percent of the primary spawning size graylingmight be expected to approach the culvert during a period whenconditions were more severe than anticipated. However,approximately 47 percent of the sexually mature graylingapproaching the culvert at the instantaneous peak discharge willpass the culvert successfully.
Therefore, in 90% of the cases where an error occurs due to thewater temperature being different than assumed, less thanapproximately 13 percent of the sexually mature grayling will bedelayed. Furthermore, the average maximum delay time for 9-1/2inch (241 mm) grayling will be less than approximately 1.5 days.In 50 percent of the cases where an error occurs due to - thewater temperature being different than assumed, less thanapproximately 2 percent of the sexually mature grayling will bedelayed, and grayling 9-1/2 inches (241 mm) or larger will not bedelayed.
Case 3
It has also been suggested that for design purposes the practicalminimum length of spawner is typically 9-1/2 inches (241 mm), andthat the design be based on this - length class of grayling.However, it seems reasonable that the practical minimum length ofspawner will vary from one stream to another. In discussionswith the Alaska Department of Fish and Game (Chihuly~ 1981), itwas suggested (based on experience) that on approximately 10% ofthe streams along the Dalton, Richardson and Alaska highways thepractical minimum length of spawner is probably equal to or lessthan 9 inches (229 mm).
Thus, if the practical minimum length of spawner in a particularstream is 9 inches (229 mm), the effect of designing a culvertassuming a practical minimum length of 9-1/2 inches (241 mm) ispresented in Table II as Case No.3. As can be seen in Table II,the percentage of primary spawning size grayling approaOhing a
17

[
[
[
[
[
[
L[
['IL_J
[
L[
[
[
[
[
[
LL
"
culvert during a period when a significant portion of 9-inch (229mm) grayling could not pass through unrestricted, isapproximately 12 percent. Although it-~~s no~ pOssible (withoutassuming a new spawning size frequency distribution) to analyzethe percentage of the population passing the culvert immediately,it is expected that it would be nearly as good as in Case No.1,since the practical minimum size has been only slightly reduced.
Therefore, in 90 percent of the cases in which the practicalminimum size of spawner is less than the assumed size, the numberof sexually mature grayl~ng actually delayed will probably besubstantially less than 12 percent. The average maximum delayfor 9-inch (229 mm) grayling is expected to be on the order of0.33 days. In 50 percent of the cases, less than approximately 2percent of the spawning population are likely to be delayed, andgrayling 9-1/2 inches (241 mm) or larger will not be delayed.
Case 4
Another potential source of error is the unexplained variabilityin Equation 4. This variability is due to the fact that Equation4 does not completely explain the average water velocity at whichthe Poplar Grove Creek grayling can pass a culvert.
For this reason, the unexplained variability in Equation 4 isanalyzed to determine the effect of this variability on any givendesign. The situation analyzed is such that 90% of the time theeffect due to unexplained variability in Equation 4 is less thanthat for the situation examined. The results of this analysisare presented in Table II as Case No.4.
As can be seen in Table II, approximately 47 percent of theprimary spawning size grayling are likely to approach the culvertwhen the conditions exceed those at which 75 percent of the 9-1/2inch (241 mm) grayling can pass. Approximately 24 percent of thesexually mature grayling approaching the culvert at thein~tantaneous peak discharge will pass the culvert successfully.
Therefore, in 90 percent of the cases where an error occurs dueto the unexplained variability in Equation 4, less thanapproximately 36 percent of the sexually mature grayling will bedelayed. The average maximum delay for 9-1/2 inch (241 mm)grayling will probably be less than 3.6 days. In 50 percent ofthe cases where an error occurs due to the unexpiainedvar~ability in Equation 4, less than approximately 2 percent ofthe spawning population will be delayed, and grayling 9-1/2inches (241 mm) or larger will not be delayed.
Case 5
Another potential source of error is in estimating the watervelocity in a culvert at the instantaneous peak of the meanannual spring flood. In order to quantify the effect of thispotential source of error it was assumed (based on experience)that 90 percent of the time the error would be less than 20
18
[
L[
[
[
[~
L[
[It.._ ....
[
[
[
[
[
rLLLL
'1
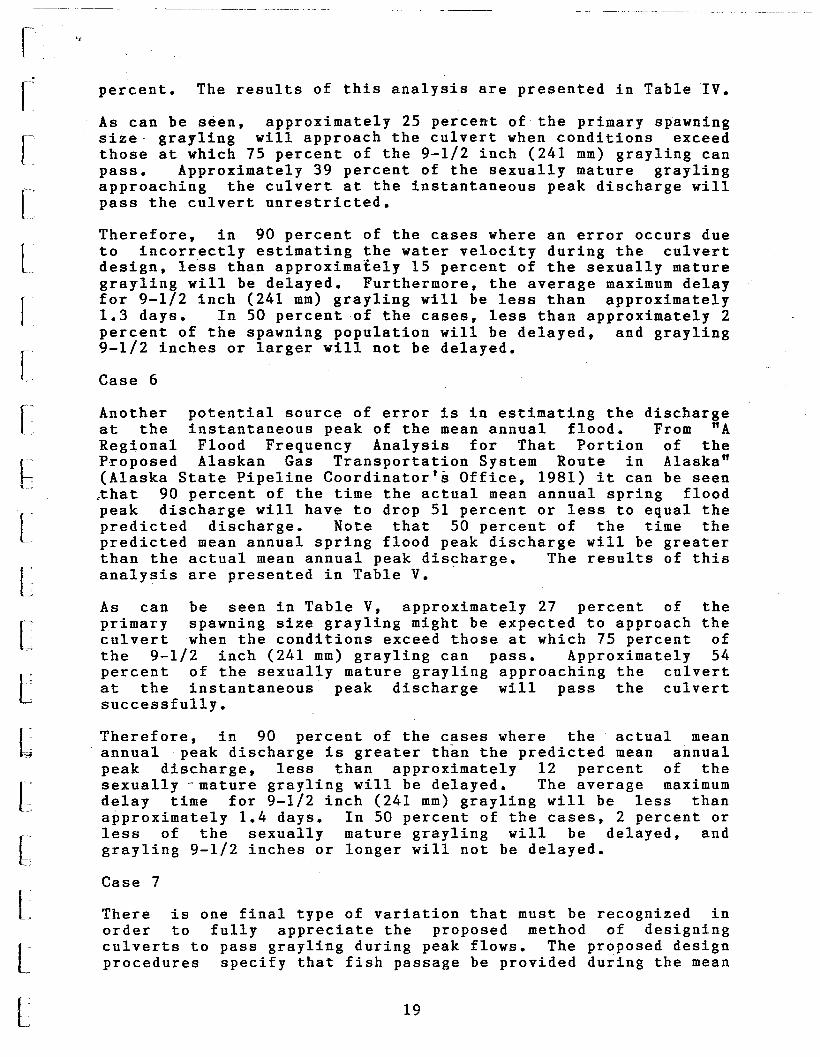
percent. The results of this analysis are presented in Table IV.
As can be seen, approximately 25 percent of the primary spawningsize- grayling will approach the culvert when conditions exceedthose at which 75 percent of the 9-1/2 inch (241 mm) grayling canpass. Approximately 39 percent of the sexually mature graylingapproaching the culvert at the instantaneous peak discharge willpass the culvert unrestricted.
Therefore, in 90 percent of the cases where an error occurs dueto incorrectly estimating the water velocity during the culvertdesign, le~s than approximately 15 percent of the sexually maturegrayling will be delayed. Furthermore, the average maximum delayfor 9-1/2 inch (241 mm) grayling will be less than approximately1.3 days. In 50 percent of the cases, less than approximately 2percent of the spawning population will be delayed, and grayling9-1/2 inches or larger will not be delayed.
Case 6
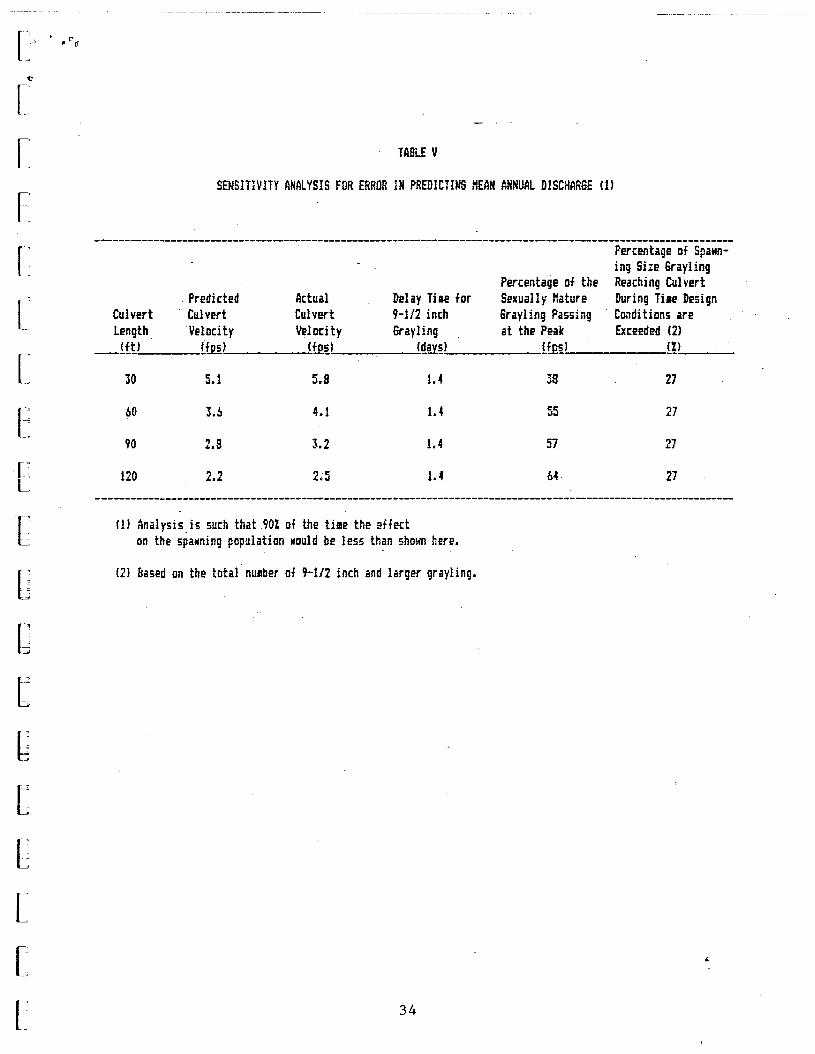
Another potential source of error is in estimating the dischargeat the instantaneous peak of the mean annual flood. From "ARegional Flood Frequency Analysis for That Portion of theProposed Alaskan Gas Transportation System Route in Alaska"(Alaska State Pipeline Coordinator's Office, 1981) it can be seen~hat 90 percent of the time the actual mean annual spring floodpeak discharge will have to drop 51 percent or less to equal thepredicted discharge. Note that 50 percent of the time thepredicted mean annual spring flood peak discharge will be greaterthan the actual mean annual peak discharge. The results of thisanalysis are presented in Table V.
As can be seen in Table V, approximately 27 percent of theprimary spawning size grayling might be expected to approach theculvert when the conditions exceed those at which 75 percent ofthe 9-1/2 inch (241 mm) grayling can pass. Approximately 54percent of the sexually mature grayling approaching the culvertat the instantaneous peak discharge will pass the culvertsuccessfully.
Therefore, in 90 percent of the cases where the actual meanannual peak discharge is greater than the predicted mean annualpeak discharge, less than approximately 12 percent of thesexually -mature grayling will be delayed. The average maximumdelay time for 9-1/2 inch (241 mm) grayling will be less thanapproximately 1.4 days. In 50 percent of the cases, 2 percent orless of the sexually mature grayling will be delayed, andgrayling 9-1/2 inches or longer will not be delayed.
Case 7
There is one final type of variation that must be recognized inorder to fully appreciate the proposed method of designingculverts to pass grayling during peak flows. The proposed designprocedures specify that fish passage be provided during the mean
19

[
['
f'f'r~
L'
r-'- ~
[
c.
annual spring flood. However, it should be noted that 50 percentof the time the spring flood will be larger than the mean annualspring flood, and 50 percent of the ~ime it will be smaller.Using the relationships presented in "A Regional Flood FrequencyAnalysis for That Portion of the Proposed Alaska Natural GasT~ansportation System Route in Alaska," the delay time associatedwith 9-1/2 inch (241 mm) grayling caught in a flood larger thanthe mean annual flood is presented in Table VI. Thus, on theaverage, once every 5 years we might expect the delay time for 91/2 inch (241 mm) grayling to be 0.6 days or longer and onceevery 10 years we might expect the delay to be 1.5 days orlonger, all other things be-ing as assumed in the design.
Some Final Thoughts
The above analyses have considered the effect of each potentialsource of error separately. However, in reality, there will betimes when errors from different sources will combine: sometimesto negate each other, and sometimes to fur'ther hinder fishpassage. When errors combine to further hinder fish passage, thedelay times may be longer than those suggested by the aboveanalyses.
It should also be noted that the number of assumptions necessaryto perform the sensitivity analyses are almost overwhelming.Thus, the numbers are only representative of the order ofmagnitude of the effects discussed.
Furthermore, note should be made of the fact that the dischargeand migration peaks were assumed to coincide. From the MacPheeand Watts (1976) data presented in Figures 2, 3 and 4 of thatreport, it can be seen that in two of the three years thegrayling migration occurred primarily before or after theoccurrence of the peak discharge. Thus, the delays predicted canbe expected to happen less frequently than if the migration anddischarge peaks actually coincided every year.
20
..
the fish passagefor the single
sources studied.1 and 7) fromimpact on fish
the fish passage velocity relationship,the estimation of the velocity in the culvert,the water temperature assumption,the estimation of the mean annual spring flood peakdischarge, andthe practical minimum spawner length assumption.
(1)(2)(3)(4)
(5)
Finally, it should be noted that the error invelocity relationship presents the potentiallargest impact on fish passage, of the errorThe sources of error (excluding Case Numberslargest to smallest in terms of magnitude ofpassage are as follows:
[IL~
[
[
[
>
";-~
E[
['
LLLL

[,
[
[
[
[
rr'e-e'LI..~
T~
[
[
r'-·:·-~
':..J
[
LL
'.
RECOMMENDATIONS
Design
The recommendations for design include two types ofrecommendations. The first type includes four possiblealternative actions, when the intended culvert will not providean acceptable velocity for grayling passage. The second typeinvolves an action that should be taken during culvert designwhich' is unrelated to the discharge velocity at which graylingcan pass ~ culvert, but which significantly affects fish passage.Each recommendation is discussed below.
When the intended culvert cannot meet the velocity criteria,there will generally be four possible alternative approachesinvolving the use of culverts. If only circular culverts havebeen considered, the design should consider pipe-arch culvertsand possibly open-arch culverts. Pipe-arches provide a largerproportion of cross-sectional area at lower flows and will helpminimize the velocities during flows substantially less than theculvert design flow. This may provide some benefit at fishpassage design flows (i.e. the mean annual flood) when theculvert has been designed for a 10- to 50-year flood. Open-archculverts will generally provide a larger proportion of crosssectional area at lower flows, than will either circular £ulvertsor pipe-arches.
Secondly, if these approaches are infeasible and there issufficient width between the banks, consideration should be givento the use of multiple culverts. The use of a number of slightlysmaller culverts, rather than one large culvert, will sometimesprovide lower velocities during critical fish passage periodswhile still accommodating culvert design flows.
Thirdly, consideration should be given to using a shorter culvertwith headwalls and tailwalls. The allowable velocity becomessignificantly larger as the length of culvert decreases. Byusing headwalls and tailwalls, the culvert will only need to beslightly longer than the width of the driving lanes and shoulder.In a high fill area, this could shorten the length of the culvertconsiderably.
Fourthly, where a culvert cannot meet the velocity criteria andall else fails,' consideration should be given to the u.e ofbaffles. Baffles have not received much attention due to thepotential ice and debris problems. However', they have proveneffective in the Pacific Northwest region of the United States(McClellan, 1970) and thus, merit consideration where all otheralternatives (short of a bridge) are unacceptable.
does notwithin a
flood (orEquation ischange the
It is important to note that changing the culvert slopenormally change the peak velocities, since the flowculvert during a flood the size of the mean annuallarger) is not normally uniform. Although Manning'soften used to show that changing the slope does
21
LLL

c '..
[
L[
[
[
I'[
[,L---
[
[
[
L[
LLLft
L
velocity, Manning~s Equation assumes uniform flow (i.e. the bedslope, water surface slope and energy slope are all parallel).When the flow is not uniform, it: is the energy- slope rather thanthe bed slope that must be considered in determining thevelocity.
It is also important to note that changing the culvert diameterwill not normally have a significant effect on the dischargevelocity during the mean annual flood. The reason for this isthat the culvert is being' sized for a much larger flood.Therefore, the mean annual flood only occupies the lower portionof the cu1"vert, and the area and depth of the flow do not changesignificantly with relatively small diameter changes.
Finally, it is extremely important to ensure that a scour holedoes not form at the outlet end of the culvert, which in timewill cause the culvert to become perched. A culvert which hasacceptable velocities but is perched, is of little help inprotecting the fishery upstream of the culvert. On a number oftrips along the Dalton Highway in 1981, in which it was desiredto find a culvert with unacceptable fish passage velocities andno other problems, it was impossible to find a suitable culvertwithout a perched outlet (Shideler, 1981). The search finallyencompassed, to a much more limited degree, all the roads in theInterior. Even then, the investigators were unable to find aculvert with .a grayling passage velocity problem that was notalso perched at the outlet. Therefore, an attempt should be madeduring the design of a culvert (that must pass grayling) toensure that the stream bed will be stable throughout the life ofthe culvert, and if necessary, to design an apron that willensure stability. During the design and construction of theapron, it is important to ensure that flow will be over the topof the apron. Aprons designed and/or constructed such that thedischarge at low flow passes entirely within the apron rock, willpresent a fish block. . Setting the culvert invert below thestream bed will also prevent a perched culvert in somesituations.
Design Review And Culvert Monitoring
In using the regression equation developed in this report toregulate the acceptable velocity in a culvert, a number ofpoints should be considered. Each of these is presented below.
First, it should be noted that motivation is a large factoraffecting the performance of grayling in negotiating a culvert.Not all of the grayling approaching the culvert in the MacPheeand Watts study (1976) were ripe. Thus, it seems likely that notall of the grayling were highly motivated to pass through theculvert. Since no distinction was made between motivated andunmotivated grayling in developing the regression equation, itis likely that the regression equation under-estimates thedischarge velocity at which highly motivated grayling can pass aculvert. Therefore, culverts with velocities slightly in excessof~ those suggested by the equation may not seriously affect the
22

[
[
[
['
['
L['
[
LL ..,
[
[
[
E[
[
[( .
L
tL
"
number of ripe (and presumably highly motivated) grayling passinga culvert.
The amount of acceptable increase is probably less for the largergrayling than it is fur the smaller grayling, as a higherpercentage of the larger grayling were ripe. For 9-1/2 inch (241mm) grayling a reasonable tolerance might be 0.5 fps. Note thatthe magnitude of this tolerance is based strictly on judgement.Nevertheless, it is recommended that the values computed usingthis equation be considered mildly conservative estimates of thevelocity at which highly motivated grayling can pass culverts.
Finally, caution should be exercised in using the equation toextrapolate the discharge velocity negotiable by grayling inculverts with lengths less than 60 feet or greater than 100 feet.For culverts greater than 100 feet in length, the velocitycalculated with the equation should be compared with thevoluntary cruising speed for grayling (MacPhee and Watts, 1976).If the acceptable velocity predicted using the regressionequation is less than the voluntary cruising speed for grayling,the voluntary cruising speed should probably be used.
Future Studies
Making recommendations for future studies is very difficult.Certainly the variability associated with the regression equationsuggests that a lot more refinement is possible. However, due tothe cost involved in many of the possible studies, substantialthought should be given to exactly what will be gained prior toan expenditure of time and money. The important question islikely to be similar to the following. Is the particularrefinement being considered likely to change the dischargevelocity at which grayling can pass a culvert by enough tojustify the expense of the study? With this in mind thefollowing is presented.
With regard to refining the regression equation, some thoughtshould be given to a means of removing from the sample, thosecases suffering from a lack of motivation. For instance, onemeans of estimating the velocity at which motivated graylingcould pass culverts might be to repeat the analyses presentedherein using only those data that-showed an increase in thepercent passing, as fish length increased (assuming all otherparameters are equal).
As mentioned earlier, the present study does not considervariation in swimming ability from one stream to another.Therefore, some consideration should be given to duplicating thestudy as performed by MacPhee and Watts (1976), on anotherstream. The test should probably be performed with at least oneculvert length being the same as that used in the MacPhee andWatts study. Consideration should also be given to performingthe test on a stream with cooler water temperatures and formeasuring additional parameters, such as turbulence and ripenessof each fish. Remember that only 55 percent of the variation was
23

r[
[.
['
[:
[
[~
[
.[L,
[
LCEL[
[f'
L_
LL
explained by the current parameters.
An investigation should also be made as to· tne ·possibility ofusing a prefabricated footing with open bottomed structural platepipe arch culverts. In situations where the stream bed willremain stable during the life of the culvert, open bottomedstructural plate pipe arch culverts might provide a suitablesolution for fish passage problems. In the past, such culvertshave often been rejected due to the need to provide a concretefooting. However, the U.S. Forest Service (McClellan, 1970) hasused a prefabricated foot~ng consisting of structural steel teesections, with the tee stems punched to receive bolts. The archplates are bolted to the structural steel tee sections, and thefooting is backfilled with crushed rock and topped with largerrock.
Research should also be conducted to determine the amount ofdelay migrating grayling can withstand without detriment to thefishery. If for instance, such a study would suggest that it ispossible to delay spawning grayling for three days during themean annual flood (a criteria which is used in Canada), themagnitude of the discharge during which fish passage must beaccommodated w~uld be cut in half on some streams •
Finally, research should also be conducted on the use of baffles.Although debris and ice problems would certainly appear <to bepotential problems, baffles are used successfully in the PacificNorthwest. Given the lack of other alternatives for preventingfish passage problems, that involve such a low construction cost,it seems appropriate to study this alternative. The study shouldinclude a review of current practice in the Pacific Northwest,construction ofa baffled culvert installation, and monitoring ofthe installation. Detailed monitoring should take place throughthe first breakup. Thereafter, the installation should bemonitored in the spring to determine its ability to function whenthe upstream grayling migration arrives, and to determine theimpact of debris and bedload on the baffles.
£
24

25
REFERENCES
..
Fish Passage Through Highway Culverts.of Transportation, Federal Highway
National Technical Information Center. PB
Alaska State Pipeline Coordinator's Office. 1981. A RegionalFlood Frequency Analysis for That Portion of the ProposedAlaska Natural Gas Transportation System Route in Alaska.Alaska Department of Natural Resources, Fairbanks.Unpublished Paper. 38p.
Younger, M.S. 1979. Handbook for Linear Regression. Wadsworth,Inc., Belmont, California. 569p.
University of California. 1979. BMDP Biomedical ComputerPrograms. Health Sciences Computing Facility, Department ofBiomathematics, School of Medicine, University ofCalifornia, Los Angeles. University of California Press.878p.
Shideler, D. 1981. Personal Communication. Alaska Departmentof Fish and Game.
McClellan, T.J. 1970.U.S. DepartmentAdministration.204 983. 16p •
MacPhee, C. and F.J. Watts. 1976. Swimming Performance ofArctic Grayling in Highway Culverts. Prepared by theUniversity of Idaho Forest, Wildlife and Range ExperimentStation for the U.S. Fish and Wildlife Service, ,Anchorage,Alaska. 41p.
Post, R. 1981. Personal Communication. Alaska Department ofFish and Game.
Chihuly, M. 1982. Personal Communication. Alaska Departmentof Fish and Game.
Portland Cement Association. 1964. Handbook of Concrete CulvertPipe Hydraulics. Skoki~, Illinois. 265p.
[; "
[
[
[
L:
rl~
['.[l--i
'[
[
[
E[
L[t'
LfL
L

[;
[
L[
L[
[
[
[L
[
C[G[
[
LLf'
L
Lt,
ACKNOWLEDGEMENTS
This rep~rt presents work started by the Alaska State PipelineCoordinator's Office (ASPCO). Although most of the calculationswere finished, the report was not finalized prior to the closingof the office in 1982. The following individuals contributedsubstantially to the work done by the ASPCO: John Belcourt, MikeChihuly, Roger Post, Dick Shideler, Carl Yanagawa, John Johansen,and Al Ott. Their conscientiousness and contributions areacknowledged here.
Acknowledgement is also given to Northwest Alaskan PipelineCompany for providing the funding for the work performed by theAlaska State Pipeline Coordinator's Office.
26

" .. c·",·•..:,,_c·~.:.... ,··~ " ._".'Jo •. ':~ .>-'"-- "~ ,-::;:_:_",;~~~~, ".' , . --.,'" ";"':.<., '-,_.~,'-,.:..;.. ....-~'-;> .. ~..:. , ..• ,.•.. -'._ ~J*, .. ' .....~•..:.. • __,,,_~.~••- •••.~
MEDIAN DIMENSTONLEKS HYDROGRAPH
L\
[
Lr~
[
f-
L'[f'LL;
[
[
[
E[
[
L
1.00
0.90
Q)
00
~ 0.80.cu(/)
'M~
~ 0.70tilQ)
p..
(/)
g 0.60Q)
t::ttl+Jt::
.B 0.50(/)
t::H
0
Eo-< 0.40Q)
00I-<ttl.c~ 0.30
'M~
4-l0
o 0.20"M+Jttl
p::
0.10
FIGURE I
+
InstantaneousDischarge
+ Mean DailyDischarge
r ..
L 0.00-4.00 -3.00 -2.00 -1.00 0.00 1.00 2.00 3.00 4.00 5.00
Lt,
Days Before And After Peak
27
..
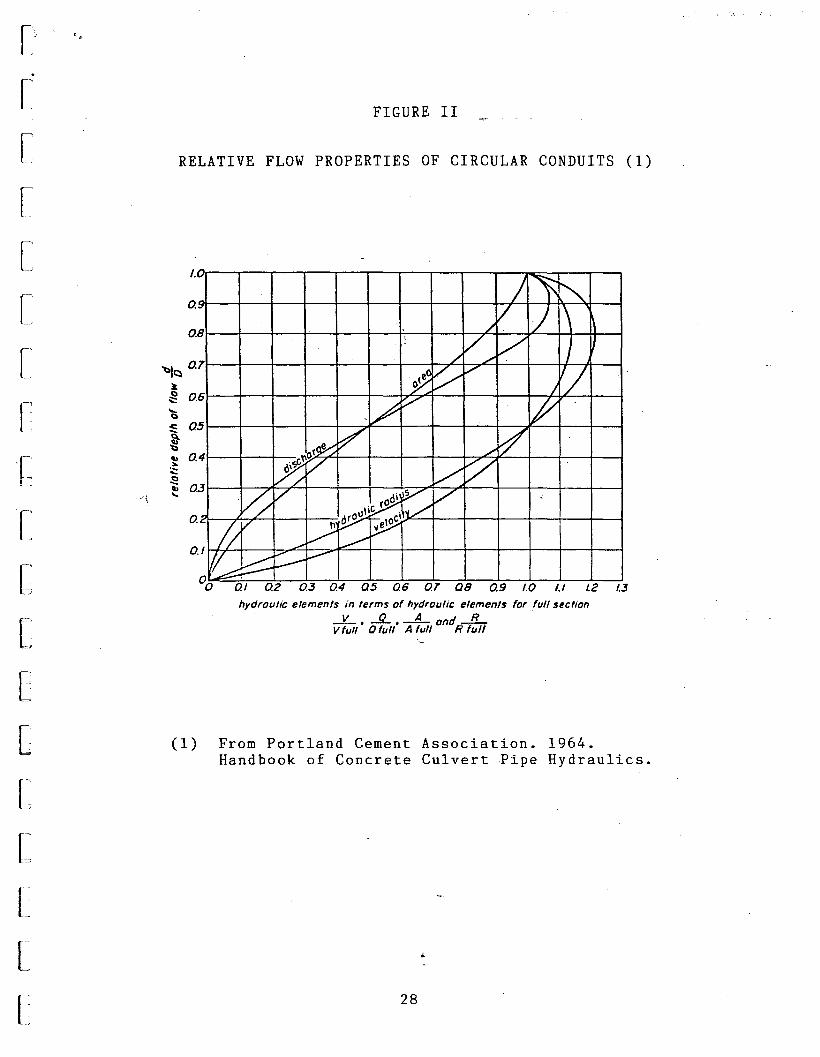
RELATIVE FLOW PROPERTIES OF CIRCULAR CONDUITS (1)
(1) From Portland Cement Association. 1964.Handbook of Concrete Culvert Pipe Hydraulics.
1.----,.-.----r~--r-ITT7r~11.0
,U-+-+--+-i-+-H-itt1l\1\l0.9
o.eLt--+-+-+-+-+-l-lCTb11TTl
'-
1.31.2o 0102 03 04 QS 06 07 Q8 0.9 1.0 1.1
O./~
ohydraulic elements in terms of hydraulic elements for fIJI/section
--'L • ...JL •-!L and -l1..-Vfull Oful/ Aful/ Rfull
28
FIGURE II
..
~0.7 ~~ 0.61--+--+-+-+--i--1-?4--t--t--r-n'Ci~ 051--l----l----f--+---::;7F-i--t--r---jr-:;,f2-"b~ 0.41--+--+---=.~
""-oS!~ 031--+---,.-F-r+-+--r-~r;:;;rr~
0.2I---~,.?__-+--+-~
'"\
[
L[
[
LLLLLL
[~
[
L[r-'l._j
L['
[
[Lc

L~
.[
r[
r['
['
[·rLL
[
[
[
LlLLlLL
"
FIGURE III
DISTRIBUTION OF TOTAL NUMBER OF SPAWNING SIZE GRAYLINGSAMPLED IN 1973, 74 & 75 ON POPLAR GROVE CREEK
1400 i ,
1200
1000
00c::
'r-!800..-l
>.col-<
C>
~
0
l-<600Q)
.0E::l
Z
400
200
o I rt(lI I/fl! "(11 r l / II ·rt(1I "~" !lV' "/" "(11 rrrn I
190 210 230 250 270 290 310 330 350 370Fork Length Of Grayling (mm)
IllZ 7/1 Sexually Mature 1\ \ \ \ \I Sexually Immature..
29

[>.
f'[
[
[
r~
['
[
.[
[
[
[
c[
L[f -
L
LL
.,
TABLE I
ACCEPTABLE DISCHARGE VELOCITIES FOR GRAYLINGPASSAGE DURING TYPICAL DESIGN CONDITIONS (1,2>
--------------------------~-------------------------------------CULVERT ACCEPTABLE 677- 957-LENGTH VELOCITY CONFIDENCE CONFIDENCE
_____lf~l lf~l_ _ b!~!I§ b!~!I§ _
40 4.5 3.8 - 5.2 3.1 - 5.950 4.0 3.3 - 4.7 2.6 - 5.460 3.6 2.9 - 4.3 2.2 - 5.070 3.3 2.6 - 4.0 1.9 - 4.780 3.0 2.3 - 3.7 1.6 - 4.490 2.8 2.1 - 3.5 1.4 - 4.2
100 2.5 1.8 - 3.2 1.1 - 3.9110 . 2.3 1.6 - 3.0 0.9 - 3.7120 2.2 1.5 - 2.9 0.8 - 3.6
----------------------------------------------------------------
(I> Design condi~ions are:
(1) 9-1/2 inch fish leng~h
(2) 37 degrees Fahrenhei~ wa~er ~empera~ure
(3) 75k passing
(2) No~e ~ha~ accep~able veloci~ies for culver~ leng~hs
less ~han 60 fee~ or grea~er ~han 100 fee~ represen~
ex~rapolations beyond the range of the original data.
30

TABLE II
SENSITIVITY ANALYSIS FOR ERRORS IN ESTIMATINGVELOCITY AT WHICH GRAYLING CAN PASS VARIOUS LENGTH CULVERTS (1)
CASE NO.4: ERROR IN FISH PASSAGE VELOCITY REGRESSION EQUATION
30 5.1 4.2 1.2 26 276.0 3.6 2.7 2.4 26 3890 2.8 1.9 3.8 22 48
120 2.2 1.3 7.1 21 73
Percentage of Spawning Size Grayling
Percentage of the Reaching CulvertAcceptable Velocity Acceptable Velocity Delay Tile for Sexually Hature_ During Ti.e Design
Culvert Assuling Design Considering Actual 9-1/2 inch Grayling Passing Conditions areLength Conditions Conditions Grayling at the Peak Exceeded (2)
__itt} ifJ!.~} ifJ!.~} ic!!n) ill i~,-)____._
oooo
88
1616
16162738
51514443
90909085
oooo
0.2 (3)
0.2 (3)
0.4 1310.5 (3)
0.60.92.02.6
5.1
2.0
5.03.52.6
4.63.12.21.6
3.62.82.2
CASE NO.1: CONDITIONS AT CULVERT EXACTLY AS ASSUMED IN DESIGN
CASE NO.3: PRACTICAL MINIMUM SPAWNER 98 INSTEAD OF 9-1/2" AS ASSUMED IN DESIGN
5.13.62.82.2
5.13.62.82.2
2.2
5.13.62.8
CASE NO.2: MATER TEMPERATURE 33 DEGREES F INSTEAD OF 37 DEGREES F AS ASSl~ED IN DESIGN'
31
;.
306090
120
306090
120
30bO90
120
131 Delay for 9 inch grayling.
III Analysis such that 90% of the tile the effect "ill be less than that shown here.
121 Based on the total number of 9-1/2 inch and larger grayling.
[,.
[
[
[
[
r~
[
[
E[
[
[
[
LL
L
LL
L

6
32
TABLE III
PERCENTAGE OF 9-1/2 INCH AND LARGER GRAYLING MOVINGEACH DAY OF THE SPAWNING MIGRATION ON POPULAR GROVE CREEK
5 07- 17- 07- 07-4 07- 87- 07- 37-3 07- 67- 07- 27-2 07- 87- 07- 37-1 127- 117- 07- 87-0 177- 157- 157- 167-1 87- 147- 137- 117-2 127- 117- 107- 117-3 137- 57- 107- 107-4 87- 87- 117- 97-5 77- 57- 107- 77-6 77- 17- 47- 47-7 77- 37- 47- 57-
<
8 57- 27- 47- 47-9 27- 17- 47- 27-
10 17- 17- . 47- 2X11 17- 3k r'I.12 27- 17-13 27- 17-14 17- 07-15 17- 07-16 17- 07-17 17- 07-18 17- 07-
3-YEAR~eY§ 12Z~ 12Z~ !2Z~ a~~Ba§5
AFTER PEAK
BEFORE PEAK
PEAK
[ , ." ~.
v
[
[
[
[
[
[
c,[
[
[
CF.c:6
G[
[
[
[
E

[ \ . "~ <I
"[
[
[
~
[
[
.[
[I L
[
[
[
C
C[
LLL[:
TABLE IV
SENSITIVITY ANALYSIS FOR ERROR IN PREDICTING VELOCITY IN CULVERT (11
----------------------------------------------------------------------------------------------------------------Percentage of Spawn-ing Size Grayling
Percentage of the Reaching CulvertPredicted Actual Delay Tile for Sexually l'Iature During Tiae Design
Culvert Culvert Culvert 9-112 inch Grayling Passing Conditions arelength Velocity Velocity Grayling at the Peak Exceeded (21
_ltt! 1~~) 1~~) 1~~.'!~) IP (~)
30 5.1 6.1 1.3 21 24
00 3.6 4.3 1.3 39 24
90 2.8 3.4 1.4 40 27
120 2.2 2.6 1.3 55 24
----------------------------------------------------------------------------------------------------------------.(11 Analysis is such that 90% of the time the effect
on the spawning population would be less than shown here.
(2) Based on the total number of 9-1/2 inch and larger grayling.
33
[,~
r~
[
r[
[
[
L.[L
• f' ~
TABLE V
SENSITIVITY ANALYSIS FOR ERROR IN PREDICTING "EAN ANNUAL DISCHARGE (1)
Percentage of Spawn-ing Size Grayling
Percentage of the Reaching Culvert. Predicted Actual Delay Tile for Sexually l'Iature During Tile Design
Culvert . Culvert Culvert 9-112 inch Grayling Passing ~ Condi tions areLength Velocity Veloci ty Grayling at the Peak Exceeded (2)
_ift) ifQ~) ifQ~} !.4~~) !.fE~) il)
30 5.1 5.8 1.4 38 27
[,0 3.6 4.1 1.4 55 27
90 2.8 3.2 1.4 57 27
120 2.2 2.5 1.4 b4 27
[
U
Cf1..•6
~
[
[
L[
L
(1) Analysis.is such that .90l of the tile the effecton the spawning population would be les5 than shown here.
(2) Based on the total nUlber of 9-1/2 inch and larger grayling.
34
..

r-".. · . (1.> • (.
'I}"
[
[
[
[
[
l'[
<[L
[
[
CLC
bLLtL
TABLE VI
THE DELAY LIKELY TO BE INCURRED BY 9-1/2 INCHGRAYLING EXPECTED TO PASS WITH NO DELAY AT THE
MEAN ANNUAL FLOOD BUT ENCOUNTERING A LARGER FLOOD
FLOODRETURN PROBABLITY SOUTH NORTH DELAYPERIOD OF RATIO RATIO AVERAGE TIME
__Y5aB§ Q~~YBBs~~5 1!1 161 BaI!Q l~aY§l _
2 .5 ~1.0 1.0 1.0 0
5 .2 1.66 1.37 1.52 0.6
10 .1 2.45 1.76 2.10 1.5
25 .04 3.97 2.35 3.16 2.6<
50 .02 5.69 2.89 4.29 4.1
100 .01 8.21 3.66 5.93 6.7
(1) Index ratios developed by the Alaska State PipelineCoordinator~s Office (1981) for areas along the proposednatural gas pipeline, south of the Yukon River.
(2) Index ratios developed by the Alaska State PipelineCoordinator's Office (1981) for areas along the proposednatural gas pipeline, north of the Yukon River.
..
35