disasters - appliedsciences.nasa.gov
TRANSCRIPT

2020 ANNUAL SUMMARY
DISASTERS
NASA Earth Science Applied Sciences Program

______________________________________________________________________________
NASA Earth Science • Applied Sciences Program: Disasters 2020 Annual Summary • 1
2020 Annual Summary
Applied Sciences Division
Lawrence Friedl, Applied Sciences Program Director
Disasters Program Management Team
David S. Green, Program Manager
John J. Murray, Associate Program Manager for ROSES
H. Michael Goodman, Associate Program Manager for ROSES [email protected]
Disasters Program Websites:
http://appliedsciences.nasa.gov/programs/disasters-program
https://disasters.nasa.gov
https://maps.disasters.nasa.gov

______________________________________________________________________________
NASA Earth Science • Applied Sciences Program: Disasters 2020 Annual Summary • 2
NASA Disasters Program 2020 Annual Summary
Table of Contents
I. Introduction .................................................................................................................... 3
II. Disaster Research ......................................................................................................... 5
A. Disaster Response and Risk Reduction (A.37) Projects .................................... 7
B. NASA ROSES 2016 GEO GWIS A.50 Global Flood Research Management Projects ......................................................................................................................... 37
C. NASA ROSES 2016 GEO GWIS A.50 Global Wildfire Information System Projects ......................................................................................................................... 47
III. Disaster Response ...................................................................................................... 56
IV. Communications Highlights .................................................................................... 65
V. Abbreviations and Acronyms .................................................................................. 67

______________________________________________________________________________
NASA Earth Science • Applied Sciences Program: Disasters 2020 Annual Summary • 3
I. Introduction
NASA's vision is to deliver science that informs choice, supports decisions, and guides action.
The Disasters Program’s mission is to foster the development, access, and translation of the best
available Earth system science into applications that equip users to help avert needless suffering
when natural hazards threaten to become disasters. Hazardous natural events such as
earthquakes, wildfires, tsunamis, droughts, and hurricanes certainly require knowledge of
geophysics, physical geography, or climatology to comprehend. However, whether a natural
event is a disaster or not ultimately depends on its location and its impact on humans.
Using the data from NASA's Earth Observation platforms and other sources, our geospatial tools
provide the ability to identify where natural hazards, infrastructure, and under-resourced and
marginalized populations converge to create areas of increased vulnerability and risk. The
Disasters Program readies tools that leverage publicly available data to visualize the interplay
between those factors and identify vulnerabilities.
Before, during, and after disasters strike, our team coordinates with decision-makers and local
governments, providing actionable data to enable recovery from disaster impacts and build
resilient communities. The Disasters Program sponsors application science to advance the
creation and distribution of rapid and accurate information, enable disaster management
practices, advance damage reduction, and build resilience. By providing information and tools to
increase understanding, we help the world address systemic disaster risk and increase sustainable
resilience throughout the disaster management cycle.
2020 was a powerful reminder that community resilience to compound hazards is vital. As the
COVID-19 pandemic made in-person logistics more challenging, NASA data and information
became even more valuable to impacted communities. In 2020, our country endured the worst
wildfire season ever recorded, with a record-shattering 18 infernos, each affecting 100,000 acres
or more across the western United States (U.S.) The year also shattered record books with the
most active Atlantic hurricane season ever observed. Five of these named tropical storms or
hurricanes made landfall in Louisiana. The National Oceanic and Atmospheric Administration
(NOAA) reported the most billion-dollar disasters in the U.S. in a single year in the four decades
they have kept track—including a powerful Midwest derecho that proved to be the costliest
thunderstorm in our nation's history.
Other parts of the world suffered as well. Bush fires that began in November 2019 in Australia
burned more than 46 million acres and took nine months to contain. A warehouse explosion in
Beirut, Lebanon left 300,000 people homeless and caused up to $15 billion in damage. Two
Category 4 hurricanes struck Nicaragua within 15 miles of each other—and just two weeks
apart—a first-time occurrence in nearly 170 years of record. The “one-two punch” of the storms
led to deadly flooding and landslides throughout Central America.
If 2020 showed us anything, it was the importance of building community resilience to combined
hazards and the cascading impacts they bring. NASA's Disasters Program rose to the challenges
by convening and working with colleagues and stakeholders from a vast range of sectors to
provide innovative approaches to reduce compound disaster risk.

______________________________________________________________________________
NASA Earth Science • Applied Sciences Program: Disasters 2020 Annual Summary • 4
When disasters occur, our researchers also become providers and distributors of images, data,
and damage assessments. The Disasters team and its network of partners and volunteers assist
with hazard assessment, evaluating severity, and identifying impacts near vulnerable
infrastructure, crops, and lifelines to help guide action. This collaboration provides cutting-edge
tools and unique perspectives for disaster responders, while also serving as a valuable real-world
research testbed.
This report illustrates numerous examples of how the Disasters Program actively developed
connections, nurtured relationships, and collaborated with organizations to engage global,
regional, and local disaster management leaders. Through these efforts, we ensure NASA's
research, expertise, and Earth observation (EO) data provide the most value and positive impact.
Disaster Research for 2020
A portfolio of diverse disaster research projects is at the program's core. These projects include
10 NASA Research Opportunities in Space and Earth Science (ROSES) Disasters A.37 Disaster
Response and Risk Reduction projects and six Group on Earth Observations (GEO) Work
Programme Projects.
Despite the global pandemic, these projects made substantial progress advancing Application
Readiness Levels (ARL). Nearly all the A.37 projects are now at ARL 5 or above, which means
they have been validated in relevant environments. Each project in our research portfolio
continues to mature swiftly toward adoption, and additional information about them is detailed in
this report.
Disaster Response for 2020
The response support area of the Disasters Program functions in a unique way within the Applied
Sciences Program, as well as the greater NASA community. The response team comprises a
NASA Headquarters-based team of program management and support personnel, emergency
managers, and geographic information system (GIS) specialists, as well as disaster coordinators
located at six NASA centers across the U.S. Assigned coordinators at each center work across
the agency as a group during disaster-response situations. Their role includes relevant
engagement with any person or group at each center who may be able to contribute relevant
information or data in a disaster-response situation.
Fostering widespread relationships within individual NASA Centers and in relevant fields is
essential. Bringing these relationships and bodies of knowledge together across centers promotes
and strengthens the program's effectiveness and reach. Such knowledge is vital to the program's
success because coordinators must be aware of all available avenues of collecting data quickly
following any particular disaster situation on a global scale.
The Disasters Program responded to 50 activations in 2020. Activations from 12 unique hazard
categories developed into disasters. Many of these disasters were massive events, demanding
extensive support over weeks or months. The Western U.S. wildfires and the rapid landfall and
resulting impacts of Hurricanes Eta and Iota in Central America are among the events

______________________________________________________________________________
NASA Earth Science • Applied Sciences Program: Disasters 2020 Annual Summary • 5
highlighted in this report that demonstrate the depth and impact of Disasters Program
contributions.
II. Disaster Research
The foundation of the Applied Sciences Program’s mission is its applied science and research,
which the NASA Disasters Program implements through a robust portfolio of collaborative
projects.
In 2020, the program’s research portfolio primarily consisted of the ten NASA ROSES Disasters
A.37 Disaster Response and Risk Reduction projects (Table 1) and six GEO Work Programme
Projects. The GEO projects include three Global Flood Risk Monitoring (GFRM) Community
Activity projects and three Global Wildfire Information System (GWIS) Initiative projects
(Table 2).
Table 1. NASA ROSES 2018 A.37 NASA Disaster Response and Risk Reduction project portfolio
Principal
Investigator
(PI) Name
Organization Proposal Title
Bedka NASA Langley
Research
Center (LaRC)
Hailstorm Risk Assessment Using Spaceborne Remote Sensing Observations
and Reanalysis Data
Glasscoe NASA Jet
Propulsion
Laboratory
(JPL)
Advancing Access to Global Flood Modeling and Alerting using the Pacific
Disaster Center (PDC) DisasterAWARE Platform and Remote Sensing
Technologies
Hilburn Colorado State
University
Coupled Interactive Forecasting of Weather, Fire Behavior, and Smoke Impact
for Improved Wildland Fire Decision-Making
Huyck ImageCat Inc. Open Critical Infrastructure Exposure for Disaster Forecasting, Mitigation,
and Response
Kirschbaum NASA Goddard
Space Flight
Center (GSFC)
Enabling Landslide Disaster Risk Reduction and Response Throughout the
Disaster Lifecycle with Multi-Scale Toolbox
Krotkov NASA GSFC Day-Night Monitoring of Volcanic Sulfur Dioxide and Ash for Aviation
Avoidance at Northern Polar Latitudes
Melgar University of
Oregon
Local Tsunami Early Warning with Global Navigation Satellite System
(GNSS) Earthquake Source Products
Meyer University of
Alaska-
Fairbanks
Integrating Synthetic Aperture Radar (SAR) Data for Improved Resilience and
Response to Weather-Related Disasters
Monaldo University of
Maryland-
College Park
Development and Implementation of Remote Sensing Techniques for Oil Spill
Monitoring and Storm Damage Assessment in an Operational Context
Yun NASA JPL Global Rapid Damage Mapping System with Spaceborne SAR Data
______________________________________________________________________________
NASA Earth Science • Applied Sciences Program: Disasters 2020 Annual Summary • 6
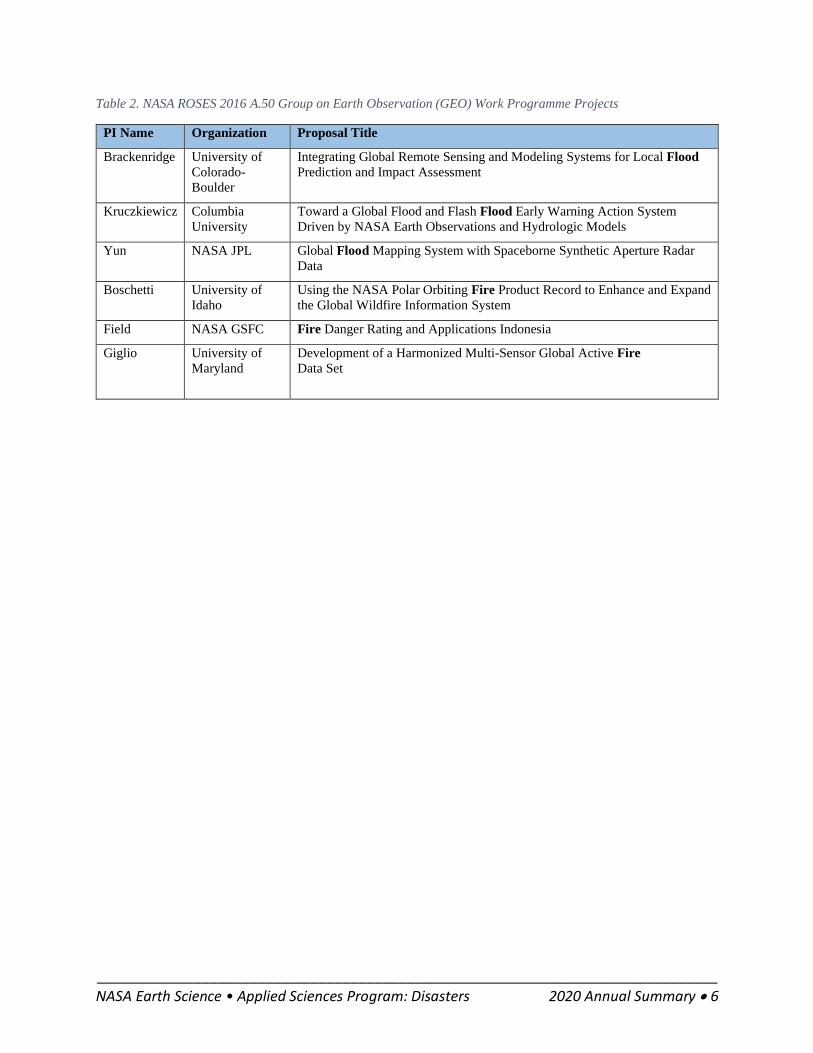
Table 2. NASA ROSES 2016 A.50 Group on Earth Observation (GEO) Work Programme Projects
PI Name Organization Proposal Title
Brackenridge University of
Colorado-
Boulder
Integrating Global Remote Sensing and Modeling Systems for Local Flood
Prediction and Impact Assessment
Kruczkiewicz Columbia
University
Toward a Global Flood and Flash Flood Early Warning Action System
Driven by NASA Earth Observations and Hydrologic Models
Yun NASA JPL Global Flood Mapping System with Spaceborne Synthetic Aperture Radar
Data
Boschetti University of
Idaho
Using the NASA Polar Orbiting Fire Product Record to Enhance and Expand
the Global Wildfire Information System
Field NASA GSFC Fire Danger Rating and Applications Indonesia
Giglio University of
Maryland
Development of a Harmonized Multi-Sensor Global Active Fire
Data Set
______________________________________________________________________________
NASA Earth Science • Applied Sciences Program: Disasters 2020 Annual Summary • 7
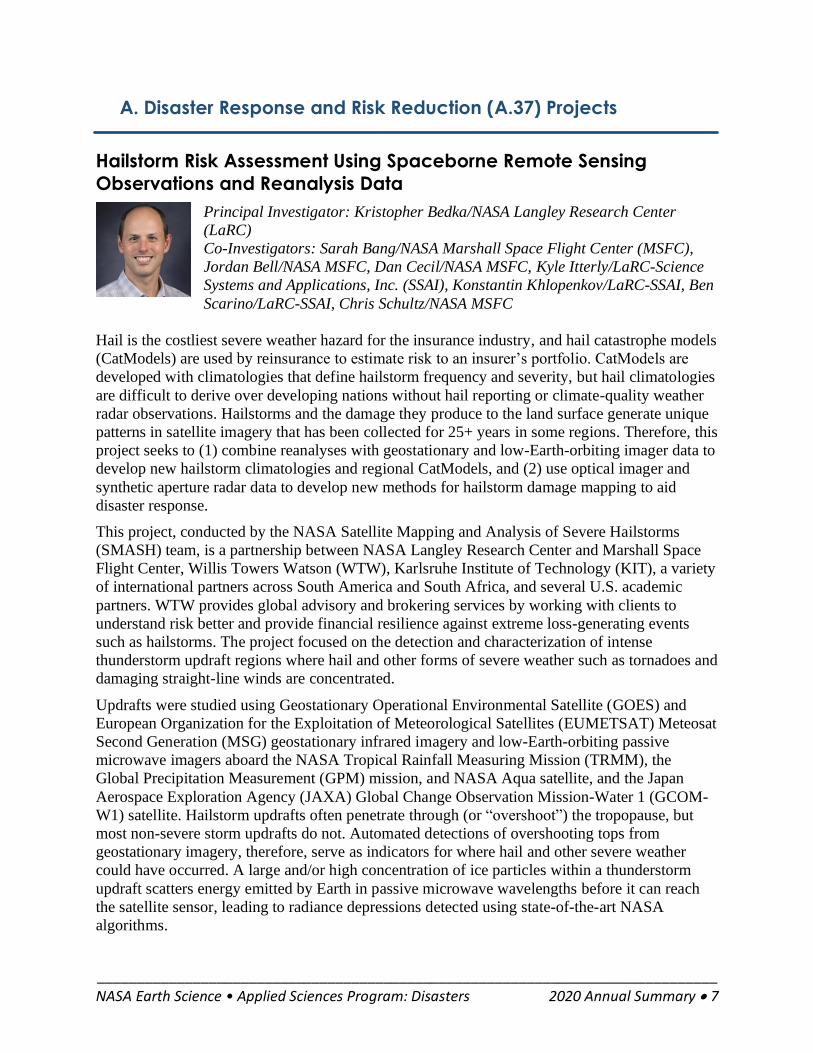
A. Disaster Response and Risk Reduction (A.37) Projects
Hailstorm Risk Assessment Using Spaceborne Remote Sensing
Observations and Reanalysis Data
Principal Investigator: Kristopher Bedka/NASA Langley Research Center
(LaRC)
Co-Investigators: Sarah Bang/NASA Marshall Space Flight Center (MSFC),
Jordan Bell/NASA MSFC, Dan Cecil/NASA MSFC, Kyle Itterly/LaRC-Science
Systems and Applications, Inc. (SSAI), Konstantin Khlopenkov/LaRC-SSAI, Ben
Scarino/LaRC-SSAI, Chris Schultz/NASA MSFC
Hail is the costliest severe weather hazard for the insurance industry, and hail catastrophe models
(CatModels) are used by reinsurance to estimate risk to an insurer’s portfolio. CatModels are
developed with climatologies that define hailstorm frequency and severity, but hail climatologies
are difficult to derive over developing nations without hail reporting or climate-quality weather
radar observations. Hailstorms and the damage they produce to the land surface generate unique
patterns in satellite imagery that has been collected for 25+ years in some regions. Therefore, this
project seeks to (1) combine reanalyses with geostationary and low-Earth-orbiting imager data to
develop new hailstorm climatologies and regional CatModels, and (2) use optical imager and
synthetic aperture radar data to develop new methods for hailstorm damage mapping to aid
disaster response.
This project, conducted by the NASA Satellite Mapping and Analysis of Severe Hailstorms
(SMASH) team, is a partnership between NASA Langley Research Center and Marshall Space
Flight Center, Willis Towers Watson (WTW), Karlsruhe Institute of Technology (KIT), a variety
of international partners across South America and South Africa, and several U.S. academic
partners. WTW provides global advisory and brokering services by working with clients to
understand risk better and provide financial resilience against extreme loss-generating events
such as hailstorms. The project focused on the detection and characterization of intense
thunderstorm updraft regions where hail and other forms of severe weather such as tornadoes and
damaging straight-line winds are concentrated.
Updrafts were studied using Geostationary Operational Environmental Satellite (GOES) and
European Organization for the Exploitation of Meteorological Satellites (EUMETSAT) Meteosat
Second Generation (MSG) geostationary infrared imagery and low-Earth-orbiting passive
microwave imagers aboard the NASA Tropical Rainfall Measuring Mission (TRMM), the
Global Precipitation Measurement (GPM) mission, and NASA Aqua satellite, and the Japan
Aerospace Exploration Agency (JAXA) Global Change Observation Mission-Water 1 (GCOM-
W1) satellite. Hailstorm updrafts often penetrate through (or “overshoot”) the tropopause, but
most non-severe storm updrafts do not. Automated detections of overshooting tops from
geostationary imagery, therefore, serve as indicators for where hail and other severe weather
could have occurred. A large and/or high concentration of ice particles within a thunderstorm
updraft scatters energy emitted by Earth in passive microwave wavelengths before it can reach
the satellite sensor, leading to radiance depressions detected using state-of-the-art NASA
algorithms.

______________________________________________________________________________
NASA Earth Science • Applied Sciences Program: Disasters 2020 Annual Summary • 8
Geostationary infrared and Low Earth Orbit (LEO) passive microwave imager data were used to
develop regional- to global-scale hailstorm climatologies. A 15-year MSG overshooting cloud
top detection database over South Africa was delivered to KIT and WTW to enable CatModel
development, an immediate business need at WTW during the first year of this project. These
detections, compiled using imagery with 3-km pixels and 15-minute frequency, were combined
throughout the lifetime of each thunderstorm event using sophisticated spatio-temporal
clustering. This storm event set was used to define the climatological characteristics and
frequency of South African hailstorms (Figure 1). The climatology was then replicated with a
model simulation extending over a 25,000-year period. This simulated storm event set is the
heart of the hail CatModel in that it is used to estimate financial impact to a given insurer's
portfolio at return periods far exceeding the length of the satellite data record, such as a 1-in-200-
year event that is commonly used
for decision-making in the insurance
industry.
The WTW CatModel became
operational in early 2021, and
development and operationalization
of the CatModel represented an
increase from ARL (Application
Readiness Level) 7 to 8, which will
later increase to ARL 9 after
sustained use. A similar workflow
will be applied to the 25+ year
GOES data record to develop a hail
CatModel over South America.
Geoffrey Saville, senior research
manager for the Willis Research
Network’s Weather and Climate
Hub said, “It is hoped that this hail
risk modeling capability will be
applied to Willis Towers Watson’s
major reinsurance clients to help
with the pricing of reinsurance contracts and assessing capital and reserves to meet regulatory
requirements. By leveraging our research relationship with academic partners at Karlsruhe
Institute of Technology in Germany and being a part of this NASA project, we can not only
provide a business rationale to develop the new techniques to assess hail risk, but also work with
clients in South Africa to manage the risks of severe storms and support business and personal
insurance.”
A global passive microwave hailstorm climatology was generated using TRMM and GPM data
from 1998 to 2019 (Figure 2). Though coarser in spatial resolution, the passive microwave
climatology was correlated with the hailstorm distribution derived over South Africa using MSG,
and to highlight other hail hotspots around the world, including the U.S. Central Plains,
southeastern South America, tropical Africa, Pakistan, and Bangladesh. These datasets can be
visualized with a custom web application built at the NASA Langley Atmospheric Science Data
Center (ASDC) using ArcGIS: https://arcg.is/0C8eXC.
Figure 1. A South Africa hailstorm climatology, depicted in terms of
hail events per year per 2 km model grid box, derived from a
combination of Meteosat Second Generation geostationary infrared
data and stochastic modeling at KIT and WTW. Graphic is courtesy
of Willis Towers Watson.

______________________________________________________________________________
NASA Earth Science • Applied Sciences Program: Disasters 2020 Annual Summary • 9
The project also analyzed several high-impact severe storm events during 2020: (1) a widespread
tornado outbreak on Easter Sunday in the Southeast U.S., (2) an extremely severe and damaging
hailstorm responsible for over $1 billion in damage in Calgary, Alberta on June 13, and (3) a
derecho wind and hail event responsible for at least $7.5 billion in damage across the Midwest
U.S. on August 10 (https://www.nasa.gov/feature/langley/nasa-researchers-help-analyze-a-
historically-powerful-costly-storm). Analyses included use of GOES-16 infrared and lightning
imagery, ground-based weather radars, passive microwave imagers, and damage maps compiled
using European Space Agency (ESA) Sentinel-1 synthetic aperture radar (SAR) and NASA
Moderate Resolution Imaging Spectroradiometer (MODIS), Visible Infrared Imaging
Radiometer Suite (VIIRS), and Landsat data.
Analyses of these events were shared with Environment and Climate Change Canada, the Iowa
and Illinois State Climatologists, and forecasters from several NOAA National Weather Service
offices. Experience with derecho event analysis has contributed significantly to automated SAR
and optical imager storm damage-mapping capabilities. Lessons learned and insights from these
events will be described in journal publications in 2021.

______________________________________________________________________________
NASA Earth Science • Applied Sciences Program: Disasters 2020 Annual Summary • 10
Project Summary: Hailstorm Risk Assessment Using Spaceborne Remote Sensing Observations and Reanalysis Data
Application Products South African CatModel, South American CatModel, Global Passive Microwave Hailstorm Detections, Web-based GIS Hailstorm Visualization Portal
ARL Advancement Current ARL 7, advancement to ARL 8 in early 2021. Goal ARL 9
Geographic Region South Africa, South America, Continental U.S., and global hailstorm climatologies
Partners Willis Towers Watson Karlsruhe Institute of Technology South African Weather Service Centro de Previsão do Tempo e Estudos Climáticos (Brazil) Servicio Meteorologico Nacional (Argentina) Universidad de Buenos Aires Universidad Nacional de Columbia University of Oklahoma Central Michigan University
Prospective Partners United States Department of Agriculture (USDA) National Agricultural Statistics Survey, Foreign Agriculture Service
2020 Journal Papers 4
2020 Media Features 7
2020 Scientific Presentations
11
Figure 2. A global climatology of
hailstorm detections per year, per
2° grid box, using the TRMM and
GPM Microwave Imagers from
1998-2019. The detection counts
are normalized to account for the
varying number of observations as
a function of latitude caused by
TRMM and GPM inclined orbits.

______________________________________________________________________________
NASA Earth Science • Applied Sciences Program: Disasters 2020 Annual Summary • 11
Advancing Access to Global Flood Modeling and Alerting using the
PDC DisasterAWARE® Platform and Remote Sensing Technologies
Primary Investigator: Margaret (Maggi) Glasscoe/NASA Jet Propulsion Laboratory (JPL) Co-Investigators: Bandana Kar/Oak Ridge National Laboratory, Doug Bausch/Pacific Disaster Center, ZhiQiang Chen/University of Missouri Kansas City, Ron Eguchi and Charlie Huyck/ImageCat, Marlon Pierce/Indiana University, Kristy Tiampo/University of Colorado Boulder, Guy
Schumann/Remote Sensing Solutions Flooding is a major hydro-meteorological event that impacts billions of people across the world daily. Models and Earth observation data are used for forecasting flood severity, extent, and depth, but these models and derived products are not globally operational, and they often provide different outputs. Therefore, we seek to rapidly classify flood severity by incorporating flood model outputs and remote-sensing-derived products from multiple platforms to help with flood risk mitigation, increase the resilience of impacted communities, and disseminate alerts using DisasterAWARE, analogous to the United States Geological Survey (USGS) Prompt Assessment of Global Earthquakes for Response (PAGER) impact analysis for earthquakes. DisasterAWARE is maintained by end-user partners the Pacific Disaster Center, a University of Hawaii Applied Research Center, which provides multi-hazard warning and situational awareness information through mobile apps and web-based platforms. Its operational version is used by multiple national and international agencies including the United Nations (U.N.), but DisasterAWARE currently lacks a global flood identification and alerting component and does not integrate remote sensing components to enable near real-time validation of simulated flood modeling results. The flood severity and impact products generated in this project will be disseminated by DisasterAWARE, thereby enhancing its capability to be a multi-hazard alerting platform. These innovative, global results will be advanced to ARL 9 using a combination of modeling, machine learning, and Earth observations, including SAR and optical sensors. Spring 2020 Africa Floods The current implementation of Model of Models (MoM) combines model outputs from the Global Flood Monitoring System (GFMS) and the Global Flood Awareness System (GloFAS) with risk score at watershed level calculated using a novel risk function algorithm. The current implementation of MoM is also deployed on a demonstration platform on DisasterAWARE that provides access to flood severity scores at watershed level across the globe daily. Using this first version of MoM, we forecasted flood severity for Africa in May 2020 and continue to do so. While the flood severity forecast and subsequent alert aid with preparedness activities, the SAR products derived for countries experiencing high severity will be used to assess impacts and for response efforts. The SAR products will be used for validation as well as determination of flood extent and depth at a finer scale. A future version of the MoM will also incorporate flood outputs derived from optical and precipitation data to forecast flooding from tropical storm events.

______________________________________________________________________________
NASA Earth Science • Applied Sciences Program: Disasters 2020 Annual Summary • 12
Project Summary: Advancing Access to Global Flood Modeling and Alerting using the PDC DisasterAWARE Platform and Remote Sensing Technologies
Application Products Model of Models EO-based Flood Extraction EO-based Damage Detection End-to-end pipeline to PDC DisasterAWARE
ARL Advancement 5
Geographic Region Global
Publications 4
Media Features 1
Conference Presentations 6
Partners Pacific Disaster Center Kirschbaum A.37 -- Enabling Landslide Disaster Risk Reduction and Response throughout the disaster life cycle with a multi-scale toolbox Huyck A.37 -- Open Critical Infrastructure Exposure for Disaster Forecasting, Mitigation and Response FEMA (Federal Emergency Management Agency) Remote Sensing Working Group
Prospective Partners Meyer A.37 -- Integrating SAR Data for Improved Resilience and Response to Weather-Related Disasters
Melgar A.37 -- Local Tsunami Early Warning with GNSS Earthquake Source Products
CEOS Flood Pilot NASA GEO GFRM projects

______________________________________________________________________________
NASA Earth Science • Applied Sciences Program: Disasters 2020 Annual Summary • 13
Coupled Interactive Forecasting of Weather, Fire Behavior and
Smoke Impact for Improved Wildland Fire Decision-Making
Principal Investigator: Kyle Hilburn/Colorado State University
Co-Investigators: Adam Kochanski and Angel Farguell/San Jose State
University (SJSU), Jan Mandel/Colorado University
The United States has entered a new era of increasing wildfire frequency and
intensity, with five of the top six largest fires in California history occurring in
2020. Fire-prone landscapes have become more densely populated and developed, resulting in
steeply rising fire-suppression costs. But fire plays a crucial ecosystem role, and its prevention
can lead to excessive fuel accumulation and catastrophic fires. Therefore, making decisions and
taking actions based on the risks and benefits associated with wildfires and prescribed burns
requires decision-support tools that integrate remote sensing with a coupled modeling framework
for fire, weather, fuel, and smoke impacts.
Figure 3. (A) Illustration of the physical coupling between fuel, fire, atmosphere, and smoke. (B) 3D visualization
of the Creek Fire (California 2020) showing two distinct updraft columns and pyro-convection clouds that
formed above the smoke (fire mesh has 33-m resolution). (C) 3D visualization of Mallard Fire (Texas 2018)
retrospective simulation showing the development of hail/graupel (light blue areas) associated with a
Pyrocumulonimbus (PyroCb). (D) Our team has embraced GIS technology for the visualization and
dissemination of WRF-SFIRE (Weather Research and Forecasting-Spread FIRE model) products. This image
shows fuel moisture maps being pushed to the NASA Disasters Portal in near real time.

______________________________________________________________________________
NASA Earth Science • Applied Sciences Program: Disasters 2020 Annual Summary • 14
As U.S. Forest Service partner, Ned Nikolov, has stated, “WRF-SFIRE offers a new paradigm to
assess and forecast the wildland fire environment, which integrates in a physically consistent
manner all components of fire behavior, i.e., local weather dynamics and their two-way
interactions with the released heat by fires, the 2-D fire spread, and fire smoke emissions and
trajectories. There is no operational tool currently available to fire and air-quality managers at
any land-management agency that can quantitatively account for these simultaneous interactions.
This makes WRF-SFIRE uniquely valuable to the field.”
WRF-SFIRE is an atmospheric model (Weather Research Forecast [WRF]) coupled with a fire
spread model (SFIRE). What makes WRF-SFIRE unique among decision-support tools is that it
is a fully coupled physical model capturing the interactions among the fuel, fire, atmosphere, and
smoke components of the system. Figure 3A illustrates how heat release from the fire provides a
heat flux that drives the atmosphere, which, in turn, drives the fire behavior through modulation
of the wind. WRF-SFIRE explicitly models the plume, unlike other models such as High-
Resolution Rapid Refresh-Smoke that parameterize the plume rise process. Pyro-convection is
one of the most extreme forms of fire-atmosphere coupling, and the ability of WRF-SFIRE to
simulate the pyro-convection observed with the Creek Fire (Figure 3B) and the Mallard Fire
(Figure 3C) is a strong demonstration of its capabilities. This year our team advanced the ARL of
our system from 4 to 5 by formalizing and documenting the workflow needed to initialize
forecasts and the development of advanced satellite data assimilation techniques using machine
learning/artificial intelligence.
An important lesson from this year is the power of GIS technology for both visualization and
dissemination of fire products. Figure 3D shows an example of GIS being used to push our
WRF-SFIRE fuel moisture analysis products to the NASA Disasters Portal. Use of the Disasters
Portal has enabled our forecasts to be accessible to more users, and our forecasts for the
California fires have shown the utility of WRF-SFIRE for supporting air operations fire
suppression activities. While satellites provide information on smoke’s geographic location,
pilots need 3D vertical information about smoke, and currently only coupled modeling can
provide that capability. These circumstances have led us to provide additional smoke and
visibility variables needed by pilots, enabling better air resources usage by emergency managers.
Our project has participated in six Disaster Application Response and Recovery Team (DARRT)
activations. The Chernobyl fires activation is leading to improvements in WRF-SFIRE by
showing the importance of extending the system for global coverage. The original system was
built for the continental United States (CONUS) because that is where the most accurate and
high-resolution fuel and fire ignition information is available. We have extended WRF-SFIRE to
use land cover information for estimating fuel conditions to enable forecasting for locations such
as Alaska, South America, and Australia, where fire information from the Joint Polar Satellite
System (JPSS), GOES, or Himawari is available. We are also improving smoke initialization
based on user feedback from DARRT activations. The project results are incorporated into the
Fire in the Earth System class taught at SJSU, engaging first-generation students, promoting
inclusive learning, and exposing racially and ethnically diversified classes to state-of-the-art fire
modeling techniques.

______________________________________________________________________________
NASA Earth Science • Applied Sciences Program: Disasters 2020 Annual Summary • 15
Project Summary: Coupled Interactive Forecasting of Weather, Fire Behavior and Smoke Impact for Improved Wildland Fire Decision-Making
Application Products WRF-SFIRE Wildland Fire Information and Forecasting System. WRF-SFIRE Smoke and Visibility WRF-SFIRE Fire Spread and Behavior WRF-SFIRE Fuel Moisture Analysis
ARL Advancement Current ARL 5, advanced one ARL level in 2020, Goal ARL 7
Geographic Region CONUS, but extended system to provide global coverage
Partners United States Forest Service (USFS) Rocky Mountain Center (RMC) for Fire-Weather Intelligence and USFS Wildland Fire-Management Research, Development & Application (WFM RD&A), National Predictive Services
Prospective Partners US Forest Service – Susan O'Neill, Richfield, Utah USFS (United States Forest Service) Office US Department of the Interior (DOI) Office of Wildland Fire – Kimber Roshelle Pederson NOAA National Weather Service – Mark Struthwolf and Darren Van Cleave Nick Nausler – National Predictive Services Louis Nguyen – NASA LaRC – NASA Earth Science Technology Office (ESTO) AIST NOS (Advanced Information System Technology New Observing Strategies) Program, Real-time data download and processing project
2020 Journal Papers 2
2020 Media Features 3
2020 Scientific Presentations
4

______________________________________________________________________________
NASA Earth Science • Applied Sciences Program: Disasters 2020 Annual Summary • 16
Open Critical Infrastructure Exposure for Disaster Forecasting,
Mitigation, and Response
Principal Investigator: Charles K. Huyck/ImageCat
Co-Investigators: Ron Eguchi/ImageCat, Shubharoop Ghosh/ImageCat, Roop
Dave/ImageCat, Mhairi O’Hara/Humanitarian Open Street Map, Tyler
Radford/OpenStreetMap, and Greg Yetman/Columbia Univ. – Center for
International Earth Science Information Network (CIESIN)
Damage to critical infrastructure from natural hazards and climate change can result in cascading
(indirect) economic impacts. These losses are often far greater than the (direct) cost to repair or
rebuild, but are poorly understood. Incorporation of economic modeling into risk analysis is
rarely achieved, given the complexity of disaggregating macro-based economic data to a spatial
resolution suitable for modeling. Therefore, we will use EO-based datasets to develop methods
of allocating production potential into a format suitable for incorporation into economic
modeling tools. This approach will yield two products: (1) the relative economic importance of
lifelines and regions of production Critical Infrastructure Interdependency Index (CIII), and (2) a
risk index based on assessing potential losses from a given peril Critical Infrastructure
Interdependency Risk Index (CIIRI).
Over the last year, the Open Critical Infrastructure Exposure for Disaster Forecasting, Mitigation
and Response project has migrated the analytical environment to the Google Earth Engine
platform, courtesy of a Google/GEO grant for the license. Now implemented, this migration has
significantly enhanced the scalability of the project. The project has isolated large industrial
production and energy generation areas associated with critical infrastructure, allocated
production from global economic models, assigned structural vulnerability, and run a full-scale
global sea-level rise and coastal flooding test using the pilot community of Vadodara, India.
This capability is achieved through the unique integration of economic and remote sensing data
sets. Although products remain in beta, they can be developed rapidly for any location on the
globe. In early 2021, results will be ported to an insurance platform (ARL 5) and used to explore
practical applications and pilot programs in the next round of discussions with key potential
users. The Global Facility for Disaster Risk Reduction (GFDRR) and WTW (Willis Towers
Watson) have been identified as key potential new collaborators. Based on discussions with
stakeholders, expected beneficiaries are anticipated to be global non-governmental organizations
(NGOs), insurers, and, surprisingly, international investment organizations, which are under new
pressure to address emerging climate risks and have limited understanding or tools to do so.
These are, ultimately, the entities that “own the risk.” Simon Young, Senior Director at WTW,
noted that “Global conglomerates are scrambling to understand their exposure to climate change
risk, and something like this properly served to end users could really be a substantial step in the
right direction. Right now, they have nothing.”
There has been significant progress on the pilot project for the city of Vadodara in Gujarat, India,
where the project team under the direction of Dr. Kristy Tiampo has continued the SAR-based
work for establishing flood extent and depth modeling using ESA’s Sentinel-1A/B satellite (C-
band SAR). The project team is investigating the potential for multi-look SAR data to assess
local flooding severity using a "red, yellow, green" alerting framework for floods. The project
team has coordinated with a local Vadodara University Professor, Dr. Sanskriti Mujumder of
Maharaja Sayajirao University (Vadodara), to provide validation for the SAR outputs and local

______________________________________________________________________________
NASA Earth Science • Applied Sciences Program: Disasters 2020 Annual Summary • 17
context. The project team is planning a virtual workshop in early to mid-April 2021 to present
the findings of the Vadodara pilot project to stakeholders, including the mayor and senior
officers in key areas of water distribution, purification, sewage, sewer management, health, etc.
This workshop will be an opportunity to present the research highlights, communicate the results
to various stakeholders with the goal of developing capacity, and explore further opportunities
beyond the project. Using Vadodara as a pilot test, our research team has been closely
collaborating and coordinating with a NASA-funded research project, "Advancing Access to
Global Flood Modeling and Alerting,” to establish the utility of extraction of flood boundaries
and dissemination of flood alerts through the DisasterAWARE platform. This collaboration is
part of the realignment plan to validate the flood severity and alerting outputs using Vadodara as
the pilot study site.
Figure 4: CIII captures the economic interdependency by isolating industrial and critical assets and allocating
production capacity. CIIRI assesses the potential global economic impact from disruption of that capacity for a
given peril, in this case, sea level rise and nuisance flooding in the year 2050. These raw results are then
aggregated to the county level and used as an index to indicate the disruption capacity. These preliminary data
demonstrate that for Northwestern India, Mumbai poses the greatest international economic risk from flooding due
to coastal flooding and sea level rise.
Following the 2020 severe wildfires in Oregon, ImageCat mapped burn areas using NASA
VIIRS data along with building and critical infrastructure data. This effort caught the attention of
Chris Vaughan, the Geospatial Information Officer at FEMA, who was interested in modeling
results for the number of burned buildings (rather than simply acreage) so they could consider
this information in the context of a disaster declaration. A review of the processes used in

______________________________________________________________________________
NASA Earth Science • Applied Sciences Program: Disasters 2020 Annual Summary • 18
national cost-benefit analysis (CBA) studies and personal communication with modelers from
the USDA (Mark Finney and Matthew Thompson) indicated that there was an opportunity for
significant advancement in this field, given the availability of increased accuracy of
temperature/intensity estimates, as well as the widespread availability of rural building density
and vegetation types. Teaming with personnel at the University of California-Irvine, whom we
have worked with in the wildfire area, we have collected and processed the data and are currently
assessing the feasibility of developing advanced damage functions, or “response functions,” as
they are known for fire. If feasible, teaming with others involved with the DARRT team may
provide opportunity to develop not only a loss-estimation tool for fire, but a tool that could be
tied to projections of burn area that are linked to weather forecasts–effectively providing a
wildfire damage forecasting system. Such a system would require sponsorship by a public or
private agency. The identification of this need and the success of this effort has come through the
DARRT team.
ImageCat has hired a Ph.D., Marina Mendoza. Dr. Mendoza is Argentinian by nationality and
identifies as Latina. Dr. Mendoza has been critical in incorporating economic modeling into the
loss modeling and EO process. The project team is also coordinating with Murtala M. Badamasi,
a native of Nigeria, to explore applications in the flood arena.
Project Summary: Open Critical Infrastructure Exposure for Disaster Forecasting, Mitigation, and Response
Application Products Critical Infrastructure Interdependency Index (CIII) and Critical Infrastructure Interdependency Risk Index (CIIRI)
ARL Advancement ARL 4, advancement to ARL 5 in early 2021
Geographic Region India, Southeast Asia
Partners Humanitarian Open Street Map Team (HOT OSM) Center for International Earth Science Information Network (CIESIN), and City of Vadodara, Gujarat, India.
Prospective Partners Willis Towers Watson (WTW) and Global Facility for Disaster Risk Reduction (GFDRR)
2020 Journal Papers 3
2020 Media Features 10
2020 Scientific Presentations
12

______________________________________________________________________________
NASA Earth Science • Applied Sciences Program: Disasters 2020 Annual Summary • 19
Enabling Landslide Disaster Risk Reduction and Response Throughout
the Disaster Life Cycle with a Multi-scale Toolbox
Principal Investigator: Dalia B. Kirschbaum/NASA GSFC
Co-Investigators: Dimitrios Zekkos/University of Michigan, Marin Clark/
University of Michigan, Robert Emberson/ Universities Space Research
Association (USRA), Thomas Stanley/USRA, Jon Godt/USGS, Doug
Bausch/Pacific Disaster Center, Chris Chiesa/Pacific Disaster Center, Ricardo
D’Orsi/City of Rio de Janeiro, Felipe Mandarino/City of Rio de Janeiro
Landslides have pervasive impacts globally and effective modeling of the hazard and exposure
of these processes is critical for accurate and dynamic impact estimates to support decision-
making throughout the disaster lifecycle. But rarely do studies approach modeling processes
from different scales with the goal of using local-scale scenario-based assessment of cascading
landslide hazards to inform global-scale modeling. Therefore, we use Earth observation data
from multiple sensor types, platforms, and spatiotemporal scales to develop a suite of tools to
model susceptibility, hazard, and risk from landslide hazards to support key decision-making and
resilience-building.
In late 2020, two major hurricanes (Eta and Iota) made landfall in Central America within only a
few days of one another. Both hurricanes brought intense rainfall to parts of Nicaragua,
Guatemala, and Honduras and led to significant landsliding. Critical infrastructure and
populations throughout the region were exposed to landslide hazards. Decision-makers both at a
national level and within multinational agencies requested information about the likely location
of landslides and potential distribution of the hazard. NASA researchers provided several
experimental products based on
Earth observation (EO) data to
highlight the potential impacts of
these events, including near real-
time modeling of landslide hazard
for each day of both hurricane
events and associated estimates of
the exposure of people and
infrastructure (Figure 5). The
Landslide Hazard Assessment for
Situational Awareness (LHASA)
Version 2.0 and exposure model
built within this system were
developed as part of this project
and have matured from research
and development (ARL 2) to
demonstrated prototype (ARL 5)
and the plan is to create a routine
sub-daily product in early 2021.
This information draws upon
satellite rainfall data and landslide
Figure 5. Map of landslide hazard and exposure calculated from
the LHASA 2.0 model for November 5 for Guatemala. The map
shows district-level model results where shades of purple represent
the hazard associated with landslides, with the darkest shades
having the highest risk. Shades of teal depict the size of the
population exposed to the risk. Areas where hazard and exposure
are both elevated may experience the most severe impacts.

______________________________________________________________________________
NASA Earth Science • Applied Sciences Program: Disasters 2020 Annual Summary • 20
susceptibility information to highlight areas where hazards and exposure are elevated. In the
immediate aftermath of the storms, the NASA team also mapped landslides that occurred due to
both storms using high-resolution, rapid-return optical data from Planet (Figure 6). The Semi-
Automatic Landslide Detection (SALaD) system has matured from ARL 3 to ARL 6 and is
currently going through open-source review at NASA. The information was provided to a
number of decision-makers in the affected areas to help inform critical decisions about landslide
impact mitigation. It was also used to identify potential hazards in more remote locations of the
countries.
In another instance, widespread landsliding occurred in southwestern Puerto Rico related to the
January 2020 Puerto Rico earthquake sequence. Landslides were concentrated nearest the
epicenter, with sparse landsliding up to 40 km away from the epicenter. Most landslides can be
attributed to the January 7, 2020, 6.7 magnitude mainshock, although foreshocks and significant
aftershocks triggered some slope failures. Critical infrastructure and populated regions
throughout the southwestern island were exposed to landslide hazards, especially near rock-fall
areas and artificially altered slopes such as road cuts. NASA researchers worked closely with the
USGS landslide hazard team that responded to the event and provided critical support to field
teams through mapping landslide occurrence with EO data and providing preliminary co-seismic
model predictions. Landslides were manually identified by NASA researchers using visual
inspection of pre-/post-event high-resolution optical satellite imagery to a minimum landslide
size of ~10 m2. This inventory was provided to a USGS field team, and subsequently revised
based on field reports, with a collaborative final inventory of slope failures released as a USGS
dataset in June 2020. A total of 309 landslide areas were mapped, along with additional point
locations of 170 displaced boulders.
Areas of elevated hazard and exposure are identified through landslide mapping from EO data
and predictive modeling using earthquake shaking inputs. While events of this magnitude are
modest, a high-quality inventory for moderate events is critical for model development and
testing because most inventories have bias toward extreme events and can lead to overprediction
Figure 6. Left: pre-event image of San Pedro Saloma, Guatemala. Right: false-color post-event image of same
location, with mapped landslides (green) using SALaD algorithm. Credits: Planet

______________________________________________________________________________
NASA Earth Science • Applied Sciences Program: Disasters 2020 Annual Summary • 21
of hazard. In particular, this event provided critical site-specific information that, with
information from our partnership with USGS collaborators, will inform hazard scenario
predictions of a future fault rupture that threatens a vulnerable population. The mechanistic
modeling has matured from ARL 3 to ARL 5 and continues to mature with testing from new
event data collected during Disaster Application Response and Recovery Team (DARRT)
responses. The information provided through mapping and model outputs was provided to
stakeholders to inform decision-making with respect to the severity and location of landslide
hazard.
Project Summary: Enabling Landslide Disaster Risk Reduction and Response Throughout the Disaster Life Cycle with a Multi-scale Toolbox
Application Products Landslide Hazard Assessment for Situational Awareness (LHASA) Semi-Automatic Landslide Detection (SALaD) Landslide Exposure Model (LEx) Co-seismic landslide model
ARL Advancement Current ARL 6, advanced two ARLs in 2020. LHASA-Rio implementation is ARL 9
Geographic Region Global and operational implementation in Rio de Janeiro (LHASA-Rio)
Partners Pacific Disaster Center (PDC) USGS National Geospatial-Intelligence Agency (NGA) Rio de Janeiro Aga Khan Agency for Habitat (AKAH) Army Geospatial Center Global Facility for Disaster Risk Reduction (GFDRR)
Prospective Partners BGC Engineering Risk Management Solutions (RMS) Google Crisis Mapper
2020 Journal Papers 5
2020 Media Features 6
2020 Scientific Presentations
22

______________________________________________________________________________
NASA Earth Science • Applied Sciences Program: Disasters 2020 Annual Summary • 22
Day-Night Monitoring of Volcanic Sulfur Dioxide and Ash for Aviation
Avoidance at Northern Polar Latitudes
Primary Investigator: Nickolay Krotkov/NASA GSFC
Co-Investigators: Vince Realmuto/ NASA JPL, Kelvin Brentzel/NASA GSFC,
Can Li/University of Maryland, David Schneider/USGS, Martin
Stuefer/University of Alaska-Fairbanks, Ben Andrews/Smithsonian Institution
Dangers that volcanic ash clouds pose to inflight air traffic safety can lead to
prolonged flight cancellations that affect the airline industry, economy, and personal travel. Low-
latency satellite observations provide crucial information for rerouting air traffic around volcanic
clouds. But ultraviolet (UV)-based ash and sulfur dioxide (SO2) monitoring are unavailable at
night or under low-light conditions. Therefore, NASA Disasters supports Earth observation
applications for advanced monitoring capabilities that better serve the private sector (aviation
control services and operational users) and the public for the ever-increasing number of flights
that operate at night or fly over the Arctic polar region. The team is now developing direct-
readout (DR) volcanic ash and SO2 products based on thermal infrared (IR) data acquired by
several operational satellite-borne instruments.
PI Nickolay Krotkov, and Co-Is Can Li, Vincent Realmuto, and Kelvin Brentzel released the
enhanced UV-based and IR-based Science Processing Algorithms (SPAs) to our partners at
Geographic Information Network of Alaska (GINA) and the Finnish Meteorological Institute
(FMI) for evaluation (ARL 6). The UV-based SPA retrieves quantitative SO2 column density and
UV Ash Index Direct Readout products from the Ozone Mapping and Profiling Suite (OMPS)
aboard the NASA-NOAA Suomi National Polar Partnership (Suomi-NPP) satellite.
At the end of 2020, Co-I Martin Stuefer at GINA installed the latest version of NASA’s Direct
Readout Laboratory (DRL) International Planetary Observation Processing Package to process
VIIRS SO2 SPA v1.2-derived data. IR-based SPA outputs the VIIRS Volcanic Brightness
Temperature Difference (BTD) Data Product (VIIRS-SO2 v1.2) and the GeoTIFF image
products (ARL 6). Enhancements included incorporating atmospheric temperature profiles and
digital elevation models (DEM) to screen for meteorological (met) clouds and reduce false
detections of volcanic clouds. The updated OMPS and VIIRS SO2 SPAs significantly improved
the quality of SO2 retrievals in a direct broadcast environment. However, false detections due to
surface emissivity and water vapor (H2O) absorption remained in the VIIRS-SO2 products
(Figure 7a). We have prototyped a new algorithm with corrections for surface emissivity and
H2O vapor for V.1.3 of the SPA (Figure 7b). The SPA supports both the Suomi-NPP and Joint
Polar Satellite System-1 (JPSS-1/NOAA-20) missions.
______________________________________________________________________________
NASA Earth Science • Applied Sciences Program: Disasters 2020 Annual Summary • 23
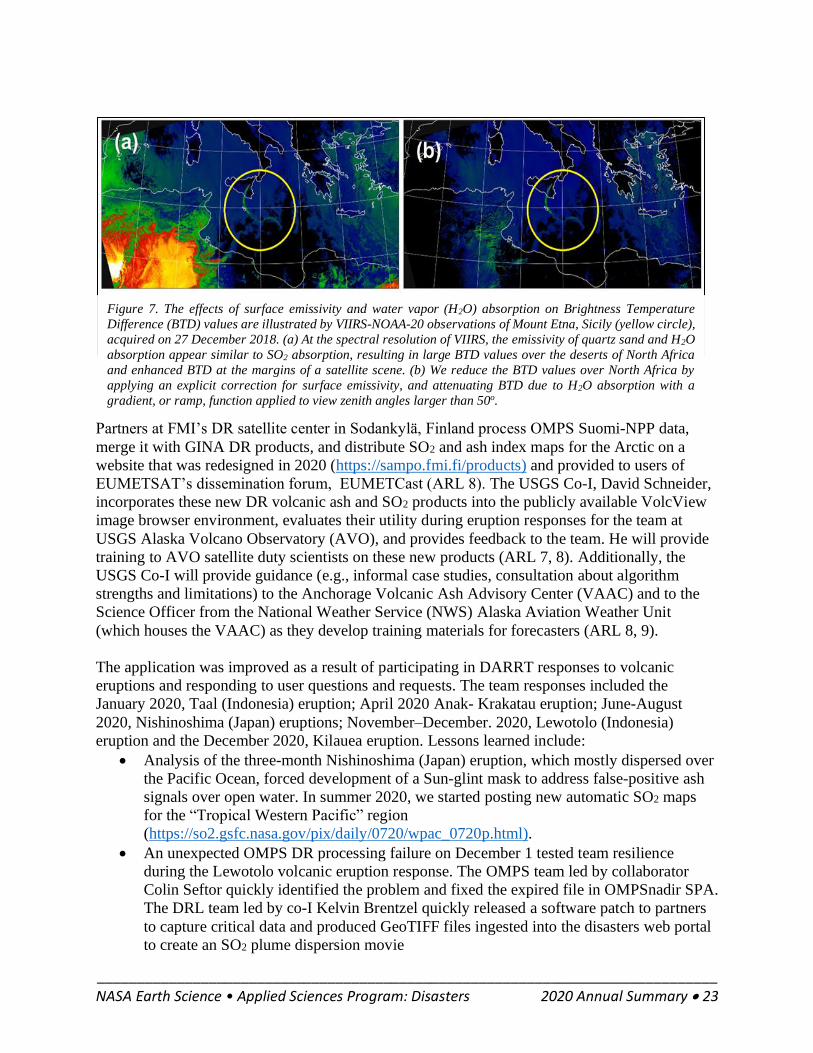
Partners at FMI’s DR satellite center in Sodankylä, Finland process OMPS Suomi-NPP data,
merge it with GINA DR products, and distribute SO2 and ash index maps for the Arctic on a
website that was redesigned in 2020 (https://sampo.fmi.fi/products) and provided to users of
EUMETSAT’s dissemination forum, EUMETCast (ARL 8). The USGS Co-I, David Schneider,
incorporates these new DR volcanic ash and SO2 products into the publicly available VolcView
image browser environment, evaluates their utility during eruption responses for the team at
USGS Alaska Volcano Observatory (AVO), and provides feedback to the team. He will provide
training to AVO satellite duty scientists on these new products (ARL 7, 8). Additionally, the
USGS Co-I will provide guidance (e.g., informal case studies, consultation about algorithm
strengths and limitations) to the Anchorage Volcanic Ash Advisory Center (VAAC) and to the
Science Officer from the National Weather Service (NWS) Alaska Aviation Weather Unit
(which houses the VAAC) as they develop training materials for forecasters (ARL 8, 9).
The application was improved as a result of participating in DARRT responses to volcanic
eruptions and responding to user questions and requests. The team responses included the
January 2020, Taal (Indonesia) eruption; April 2020 Anak- Krakatau eruption; June-August
2020, Nishinoshima (Japan) eruptions; November–December. 2020, Lewotolo (Indonesia)
eruption and the December 2020, Kilauea eruption. Lessons learned include:
• Analysis of the three-month Nishinoshima (Japan) eruption, which mostly dispersed over
the Pacific Ocean, forced development of a Sun-glint mask to address false-positive ash
signals over open water. In summer 2020, we started posting new automatic SO2 maps
for the “Tropical Western Pacific” region
(https://so2.gsfc.nasa.gov/pix/daily/0720/wpac_0720p.html).
• An unexpected OMPS DR processing failure on December 1 tested team resilience
during the Lewotolo volcanic eruption response. The OMPS team led by collaborator
Colin Seftor quickly identified the problem and fixed the expired file in OMPSnadir SPA.
The DRL team led by co-I Kelvin Brentzel quickly released a software patch to partners
to capture critical data and produced GeoTIFF files ingested into the disasters web portal
to create an SO2 plume dispersion movie
Figure 7. The effects of surface emissivity and water vapor (H2O) absorption on Brightness Temperature
Difference (BTD) values are illustrated by VIIRS-NOAA-20 observations of Mount Etna, Sicily (yellow circle),
acquired on 27 December 2018. (a) At the spectral resolution of VIIRS, the emissivity of quartz sand and H2O
absorption appear similar to SO2 absorption, resulting in large BTD values over the deserts of North Africa
and enhanced BTD at the margins of a satellite scene. (b) We reduce the BTD values over North Africa by
applying an explicit correction for surface emissivity, and attenuating BTD due to H2O absorption with a
gradient, or ramp, function applied to view zenith angles larger than 50o.

______________________________________________________________________________
NASA Earth Science • Applied Sciences Program: Disasters 2020 Annual Summary • 24
(https://maps.disasters.nasa.gov/arcgis/apps/TimeAware/index.html?appid=ee9793ee83a
b41788b6405bc47d8b4f2). As a result of this lesson, we are developing the capability to
independently process NOAA-20/OMPS volcanic SO2 as a mitigation strategy. Not only
does NOAA-20 OMPS provide higher spatial resolution, processing two OMPS
“snapshots” 50 minutes apart allows “animation” of volcanic plume movements to help
enable plume dispersion forecasting. Processing two independent OMPS instruments will
strengthen resilience in responding to future eruptions.
Dr. David Schneider of the Alaska Volcano Observatory recently noted, “The operational impact
of near real-time information on the extent and amount of SO2 gas was demonstrated during the
2019 eruption of Raikoke volcano in the Kuril Islands.” This eruption injected large amounts of
volcanic ash and gas into the atmosphere and impacted aircraft operations in the North Pacific.
The lingering SO2 gas was observed in UV and IR satellite data, and the associated sulfate
aerosol cloud was visible to pilots, who reported it as volcanic ash. The NWS Anchorage VAAC
team consulted with satellite experts at the USGS Alaska Volcano Observatory regarding these
observations and was able to greatly reduce the region covered by the Volcanic Significant
Meteorological Information (SIGMET) warning message for ash. This effort demonstrated the
economic impact of improved detection of volcanic cloud constituents.”
Project Summary: Day-Night Monitoring of Volcanic Sulfur Dioxide and Ash for Aviation Avoidance at Northern Polar Latitudes
Application Products Arctic Volcanic Plume Tracker (AVPT) 2 Applications (OMPSnadir v2.6.7, VIIRS-SO2 v1.2)
ARL Advancement Current ARL 6, advanced one ARL level in 2020.
Geographic Region Alaska, Aleutians, North Pacific, Kamchatka, Kuril Islands, Iceland, and Scandinavia but globally extensible
Partners USGS AVO, NOAA’s NWS Alaska Volcanic Ash Advisory Center (A-VAAC), European Support to Aviation Control Service, NASA Direct Readout user community, Smithsonian Institution Global Volcanology Program, Finnish Meteorological Institute
Prospective Partners Franz Mayer University of Alaska Fairbanks (UAF), Kyle Hilburn Colorado State University (CSU), Jean-Paul Vernier LaRC, Simon
Carn Michigan Technological University (MTU)
2020 Journal Papers 5
2020 Media Features 3
2020 Scientific Presentations
7

______________________________________________________________________________
NASA Earth Science • Applied Sciences Program: Disasters 2020 Annual Summary • 25
Local Tsunami Early Warning with GNSS Earthquake Source Products
Principal Investigator: Dr. Diego Melgar/Oregon State University,
Co-Investigators: Dr. Brendan Crowell/University of Washington, and Dr. Tim
Melbourne/Central Washington University
Throughout the 21st century, the world has experienced many large tsunamis
and has suffered catastrophic consequences including the loss of life and long-
lasting infrastructure damage from them. Advances in geophysical instrumentation and methods
have led to early warnings and rapid forecasts of expected impacts for many natural hazards, but
warnings for tsunamis, especially for those at the coasts closest to the earthquakes, remain an
open problem. Therefore, this project implements novel techniques that rely on measurements
from onshore Global Navigation Satellite System (GNSS) sites of the deformation produced by
the earthquake. This information is then ingested into a hydrodynamic model to produce rapid
forecasts of tsunami amplitudes.
Large earthquakes produce deformation, often on the order of several meters, which can be
measured in real time with permanent GNSS stations. As these networks have proliferated
worldwide, researchers have developed algorithms that leverage this real-time data to
characterize events as they are occurring. One of these algorithms, Geodetic-First Approximation
of Size and Timing (G-FAST), was developed by the investigators working on this project. G-
FAST can deliver real-time estimates of the magnitude of an earthquake, its geographic extent,
and details regarding the amount of motion (slip) on a fault. As part of this project’s first stage,
the code has successfully been deployed in a real-time testbed at NOAA’s Center for Tsunami
Research (CTR) and is receiving real-time GNSS data from more than 1,000 sites worldwide.
Knowledge of the earthquake,
however, is not sufficient to
develop a successful tsunami
warning. Rapid forecasts of the
expected amplitudes at the coasts
closest to the earthquake, where the
tsunami arrives in as little as 10
minutes, are of paramount
importance. In the last year, offline
tests have been conducted to
connect the G-FAST output to
NOAA’s hydrodynamic modeling
code to produce Rapid Forecast
Tsunami Amplitudes (RFTAs). The
tests have shown that it is possible to
produce these forecasts with
reliability. Over the next year, the real-
time connection between G-FAST and
the RFTAs will be built and tested. The expectation is to translate the code from the NOAA CTR
to the operational warning centers in Honolulu and Alaska to produce RFTAs for events of
consequence on the U.S. west coast in the first five minutes after the earthquake. Michael
Angove, NOAA’s Tsunami Program Director, was recently asked at a meeting of the agency’s
Figure 8. (a) U.S. West Coast sites currently being used by
NOAA (http://www.panga.org/realtime/gpscockpit/) (b)
Example of a simulated rapid forecast from an M9
earthquake obtained from modeling the real-time GNSS data

______________________________________________________________________________
NASA Earth Science • Applied Sciences Program: Disasters 2020 Annual Summary • 26
Tsunami Science and Technology Advisory Panel what were the most important advancements
necessary for tsunami warning and he said “GNSS is critical to our mission of reducing the
uncertainty of tsunami forecasts in the first five minutes.”
Large earthquakes and tsunamis are infrequent compared to other hazards such as floods or fires
that have a yearly season. This scarcity makes it challenging to develop and test real-time
solutions that model these events. The situation is especially challenging for regions that have
not seen a significant event in recent years, such as the Cascadia subduction zone in the Pacific
Northwest, where earthquakes as large as magnitude 9 (M9) are possible. As a result, the team
has benefitted significantly from participating in the response to large earthquakes occurring
around the globe in the past two years. Geophysical data from partner nations has been shared
with the team and has been used to test and refine the modeling codes. Additionally, this work
has also served to either establish or solidify partnerships with international network operators.
While the project’s immediate goal focuses on the U.S. West Coast, the expectation is that the
project’s impacts will be felt across the Pacific in all earthquake-prone regions. NOAA provides
warnings that are used by all international governments. Better and faster tsunami warnings from
NOAA will benefit many. However, there is also interest from developing nations that operate
real-time GNSS networks in becoming self-reliant. These countries do not yet have the expertise
to develop or implement real-time modeling codes. We have had conversations with many GNSS
network operators and have begun collaborations with several of them. The G-FAST codebase is
open source. We share it widely and are willing to provide training and advice as much as
possible. Specifically, the code has been shared with Chile’s Centro Sismológico Nacional, and
we are in active conversations with the network operators in Ecuador and Mexico. GNS Science
in New Zealand is now working on implementing a cloud-based version of G-FAST. This
implementation is of particular importance because New Zealand provides geophysical services
for many Pacific Island nations. The open-sourcing of G-FAST has been mutually beneficial as a
form of science diplomacy. In exchange for the code and training, countries are willing to offer
access to their real-time networks. This exchange broadens the number of regions for which
NOAA can issue faster warnings.
The project is training the next generation of diverse geodesy and tsunami scientists. These are
both fields of Earth Science that are still predominantly male and predominantly white. It has
funded Dr. Amy Williamson for one year of her postdoctoral position, Dr. Kevin Kwong for two
years of his postdoctoral position and Sean Santellanes for his Ph.D. Dr. Williamson has since
transitioned to working at NOAA’s National Tsunami Warning Center.
Project Summary: Local Tsunami Early Warning with GNSS Earthquake Source Products
Application Products Geodetic-First Approximation of Size and Timing (G-FAST) Rapid Tsunami Forecast Amplitude (RTFA)
ARL Advancement Current ARL 5, advanced one ARL level in 2020
Geographic Region Cascadia Pacific Northwest and Pacific Ocean Basin
Partners NOAA Center for Tsunami Research, NOAA Pacific Tsunami Warning Center, and NOAA National Tsunami Warning Center
Prospective Partners University of California, Berkley; USGS ShakeAlert; Centro Sismológico Nacional (Chile); GNS Science (New Zealand)
2020 Journal Papers 9
2020 Media Features 2
2020 Scientific Presentations 2

______________________________________________________________________________
NASA Earth Science • Applied Sciences Program: Disasters 2020 Annual Summary • 27
Integrating Synthetic Aperture Radar Data for Improved Resilience
and Response to Weather-Related Disasters
Principal Investigator: Franz Meyer, University of Alaska, Fairbanks
Co-Investigators: Andrew Molthan/NASA MSFC, Lori Schultz/NASA MSFC,
Jordan Bell/ NASA MSFC, Batu Osmanoglu, and MinJeon Jo, NASA/GSFC
Weather-related hazards are ubiquitous in the United States, including (1)
hurricane storm surges, (2) rapid snowmelt and heavy rainfall, (3) severe
weather leading to flash floods and tornadoes, and (4) seasonal freeze and thaw of rivers that
may lead to ice jams. In each setting, end-user partners engaged in disaster risk management
need access to data-processing tools that are helpful in mapping past and current disasters to
capture their impacts. Analysis of past events supports risk mitigation by enabling an
understanding of what has already occurred and how to alleviate impacts in the future.
Generating the same or similar products during adaptive response means that lessons learned
from risk analysis, including economic/finance implications, will carry forward to an event. SAR
data are particularly useful for these activities due to their all-weather, 24/7 monitoring
capabilities. However, complex processing and high computational costs associated with SAR
require the development of approaches that streamline product generation. To meet this need,
this project is developing a cloud-based automatic data analysis toolbox to process SAR data into
value-added products that address the mapping of meteorological and hydrological disasters. The
integration of these products into end-user decision-making workflows will improve the
capability to use SAR in response situations. Furthermore, the SAR analysis tools will help
prepare for and mitigate risk by allowing users to process image time series obtained from
NASA or from commercial entities. To ensure adoption of the developed technology, the project
partners with the U.S. Department of Agriculture Foreign Agricultural Service (USDA-FAS), the
National Weather Service Alaska-Pacific River Forecast Center (APRFC), the Federal
Emergency Management Agency, and private industry representative Corteva.
In 2020, the team worked on the development and high-ARL (ARL>5) implementation of its
main hazard information products such as the RTC30 image time series, RTC30-Color product,
HYDRO30 Surface Water extent, and FD30 Flood Depth Information. Figure 9 depicts examples
of an operational application of these products to monitor a 2020 monsoon flooding event in
South Asia. The project also spent considerable effort on the development of two cloud-based
data analysis platforms: (1) a platform to facilitate rapid production of high-ARL SAR weather-
hazards products at scale (http://hyp3.asf.alaska.edu) and (2) a cloud-based algorithm
development platform (https://opensarlab.asf.alaska.edu) that allows the team to develop and
share new algorithms without requiring data downloads or local software installations. Both
platforms are realized in the Amazon Web Services (AWS) cloud and co-located with the cloud-
based data holdings of the NASA Alaska Satellite Facility Distributed Active Archive Center
(DAAC) to maximize performance and minimize costs.

______________________________________________________________________________
NASA Earth Science • Applied Sciences Program: Disasters 2020 Annual Summary • 28
(a) (b) (c)
(d) (e)
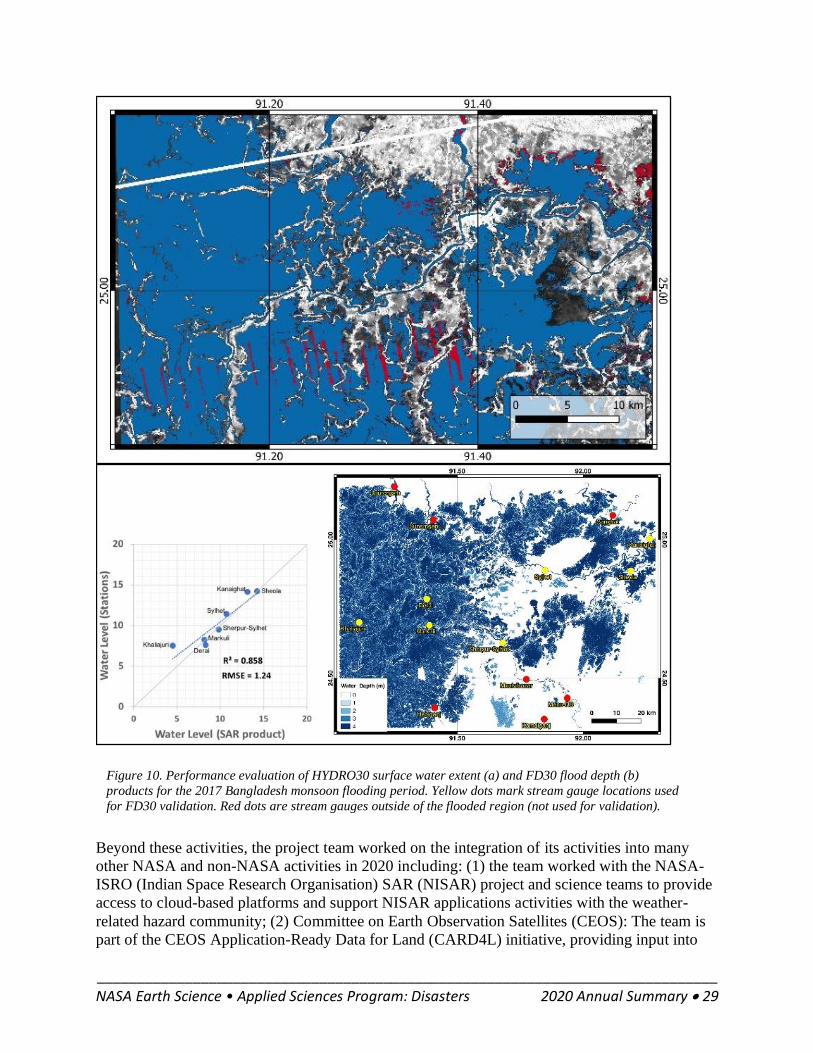
The project has extensively worked with end users on the calibration and validation of a number
of its products using test sites in the U.S. and abroad (Figure 10). The team also has worked with
NASA and end users to test its hazard products during a several event responses, including (1)
the 2019 spring floods along the Missouri River, (2) the 2020 severe weather Easter outbreak in
the U.S. Midwest, (3) the May 2020 failure of the Edenville dam in Michigan, (4) the spring
2020 breakup floods period in Alaska, (5) the 2020 flooding events in Colombia and Honduras,
(6) the 2020 monsoon flood period in South Asia (Nepal, India, Bhutan, Bangladesh), and (7) the
2020 Hurricanes Eta and Iota. For the South Asia event, the team demonstrated near real-time
product generation across a region greater than 1000 km2.
Figure 9. Examples of SAR-derived weather-hazards products for the 2020 South Asia monsoon flood event for
the area in India’s West Bengal province; (a) minimum surface water extent on June 12, 2020; (b) maximum on
July 21, 2020; (c) number of inundation days; (d) flood depth estimate for July 21, 2020; and (e) change of
surface water area.
______________________________________________________________________________
NASA Earth Science • Applied Sciences Program: Disasters 2020 Annual Summary • 29
Beyond these activities, the project team worked on the integration of its activities into many
other NASA and non-NASA activities in 2020 including: (1) the team worked with the NASA-
ISRO (Indian Space Research Organisation) SAR (NISAR) project and science teams to provide
access to cloud-based platforms and support NISAR applications activities with the weather-
related hazard community; (2) Committee on Earth Observation Satellites (CEOS): The team is
part of the CEOS Application-Ready Data for Land (CARD4L) initiative, providing input into
Figure 10. Performance evaluation of HYDRO30 surface water extent (a) and FD30 flood depth (b)
products for the 2017 Bangladesh monsoon flooding period. Yellow dots mark stream gauge locations used
for FD30 validation. Red dots are stream gauges outside of the flooded region (not used for validation).

______________________________________________________________________________
NASA Earth Science • Applied Sciences Program: Disasters 2020 Annual Summary • 30
CARD4L specifications for SAR-derived ARDs; (3) AmeriGEO: The team has integrated
workflows and materials into AmeriGEO capacity-building activities funded under NASA GEO
grant #80NSSC18K0317 (e.g., recent training through AmeriGEO Inter-American Academy of
Geosciences & Applications https://academy.amerigeoss.org); and (4) Google Earth Engine:
Team members have interfaced with Google personnel on matters related to SAR processing and
surface water extent mapping.
Closer to home, the Alaska River Forecast Center has informed the project during a joint event
response in 2020 that “Alaska is experiencing an impactful flood season this year after a cold
winter and deep snowpacks in the state's interior. The threat of COVID-19 is limiting access to
our rural communities, so we are depending on remote sensing products more than ever before.
Products generated from Sentinel-1 SAR and EO are a game-changer for the way we assess
what's happening on Alaska's rivers.”
The project team is composed of personnel with diverse backgrounds working from a dispersed
set of locations. The team includes personnel with German, Turkish, Korean, and U.S. American
backgrounds with near-even gender contribution. Team members are working from locations
across the U.S. The team has worked closely with partners all around the world. In 2020, it has
provided trainings on SAR-based weather-hazards monitoring to audiences in the Hindu Kush
Himalaya (India, Bangladesh, Bhutan, Nepal), and Central American (Honduras, El Salvador,
Central American Integration System [SICA]) regions. The team has contributed to the
development of training materials in English and Spanish. The project is supporting two graduate
students and one undergraduate student.
Project Summary: Integrating Synthetic Aperture Radar Data for Improved Resilience and Response to Weather-Related Disasters
Application Products 7 SARVIEWS Products (RTC30; RTC30-Color; CCD30; HYDRO30; FD30; AG100; AG100-IN), 1 Tool (operational cloud-based platform)
ARL Advancement Current ARL 5, advanced one ARL in 2020
Geographic Region Global with emphasis on USA, Bangladesh, India, Argentina
Partners (1) U.S. Department of Agriculture – Foreign Agriculture Service (USDA-FAS); (2) NOAA APRFC
Prospective Partners (1) Corteva Agriscience; (2) Alaska Volcano Observatory; (3) NGA; (4) AmeriGEO; (5) NASA ROSES 18 Disasters A.37 PIs Krotkov, Kirschbaum, Glasscoe have all been added as collaborators.
2020 Journal Papers 3
2020 Media Features 1
2020 Scientific Presentations 11

______________________________________________________________________________
NASA Earth Science • Applied Sciences Program: Disasters 2020 Annual Summary • 31
Development and Implementation of Remote Sensing Techniques
for Oil Spill Monitoring and Storm Damage Assessment in an
Operational Context
Primary Investigator: Francis M. Monaldo/University of Maryland, College
Park
Co-Investigators: Cathleen Jones, Ben Holt/NASA JPL, Ellen Ramirez/NOAA
Satellite Applications Branch (SAB), Sean Helfrich /NOAA National
Environmental Satellite, Data, and Information Service (NESDIS) Center for
Satellite Applications and Research (STAR), Lisa DiPinto and George
Graettinger/NOAA OR&R, Oscar Garcia-Pineda /Water Mapping, Gordon Staples/MDA,
Camilla Brekke/UiT Arctic University of Norway
Marine oil spills are a significant environmental problem whose optimal response requires
knowledge of oil thickness. The recent increase in the availability of satellite SAR imagery
offers the possibility of more frequent oil thickness measurement, but there is no operational
implementation of a validated algorithm for oil thickness. Therefore, this project will produce,
validate, and implement an oil thickness product in an operational context. The team is proud to
include racially and gender diverse team members—especially from the Hispanic community—
involved both in research and leadership. Oil spills usually have the most impact on poor and
marginalized communities. Mitigation of these effects will have a disproportionately positive
effect on individuals in such communities.
The first step to moving a product to operations at NOAA is a Requirements Allocation
Document. This document was approved in 2020. Co-Investigator Ellen Ramirez of NOAA’s
National Environmental Satellite, Data, and Information Service (NESDIS) Satellite
Figure 11. Sample oil thickness image off the coast of Louisiana computed from Sentinel-1A SAR imagery.

______________________________________________________________________________
NASA Earth Science • Applied Sciences Program: Disasters 2020 Annual Summary • 32
Applications Branch (SAB) is responsible for monitoring U.S. waters for such events. This
information is provided to the U.S. Coast Guard (USCG) and the NOAA Office of Response and
Restoration (OR&R). George Graettinger and Lisa DiPinto of OR&R are Co-Investigators and
provide stakeholder guidance. Graettinger has noted that “understanding the extent of an
impacted area and potentially exposed species and habitats is key to understanding the
implication of an oil spill; however, the identification of the greatest potential risk is critical to
minimizing injury to these resources. The ability to prioritize this risk requires timely, accurate,
oil volume and thickness data so that the response community can act effectively to mitigate risk
as quickly as possible.”
Ellen Ramirez/NOAA SAB has been collaborating with the Tradewinds Project to prepare for an
emergency oil spill. This last year SAB also provided support to attempt to identify the source of
a spill off the coast of Brazil. Our NASA oil spill project team also provided remote sensing
support for the massive oil spill from a vessel off the coast of Mauritius. Most recently, the team
studied the oil spill off the coast of Israel. The key to optimizing the deployment of resources for
response and mitigation is an assessment of not only where the oil is, but where the thickest oil
is. There are a variety of optically based sensors that provide important information to
characterize oil spills. However, such sensors are constrained by illumination angles, whether it
is day or night, and cloud cover. Synthetic Aperture Radar (SAR) imagery is a day-night, all-
weather sensor. With the launch and operations of Sentinel-1A/B and Radarsat Constellation
Mission, commercially tasked systems, and especially the upcoming launch of the NASA-ISRO
SAR (NISAR), SAR imagery of oil spills will continue to have great impact.
Over the past year, the project identified a “contrast ratio” algorithm that compares the extent of
SAR image brightness reduction in oil-covered areas with open water to estimate oil thickness.
The algorithm has been implemented in the SAR Ocean Products System (SAROPS), NOAA
SAB’s research and operations environment for SAR imagery.
PI Frank Monaldo has published extensively on using SAR imagery to make geophysical
measurements. As part of the effort to implement an operational oil thickness product, the project
is conducting field tests off the coast of Santa Barbara, California with NASA’s airborne
Uninhabited Aerial Vehicle Synthetic Aperture Radar (UAVSAR), using surface measurements
to calibrate this approach. They also plan to make measurements over known quantities of oil
deployed in annual exercises in Norway. Co-Investigator Camilla Brekke is our liaison for this
effort. Co-I Investigators Catherine Jones and Benjamin Holt/JPL provide experience in
interpreting Uninhabited Aerial Vehicle Synthetic Aperture Radar (UAVSAR) data. Oscar
Garcia of Water Mapping Inc. will make in situ oil thickness measurements. Gordon Staples at
MDA will obtain Radarsat Constellation Imagery. Sean Helfrich of NOAA will aid in the
operational approval of the oil thickness product.
The March 2020 field test was postponed due to COVID, and the test was rescheduled to May
2021. The USCG has provided the cutter Blackfin free to the program for in situ oil thickness
measurements. Dana Tulis, USCG Headquarters Director and Director, Incident Management
and Preparedness Policy (CG-5RI), plans to embark on the field test, and states that, “this data
enables the USCG to deploy the proper response equipment.” The Marine Spill Response
Corporation has agreed to fly another aircraft to help spot natural oil seeps with no cost to the
project. Use of this other aircraft will optimize tracks for the cutter and the UAVSAR.

______________________________________________________________________________
NASA Earth Science • Applied Sciences Program: Disasters 2020 Annual Summary • 33
Project Summary: Development and Implementation of Remote Sensing Techniques for Oil Spill Monitoring and Storm Damage Assessment in an Operational Context
Application Products Marine Oil Spill Thickness (MOST). NOAA’s SAROPS (SAR Ocean Product System) operationally produces synthetic aperture radar (SAR)-derived wind speed and marine oil spill extent products. Project also developing SAR-derived flood inundation, ship/platform detection, and Arctic sea-ice motion products.
ARL Advancement Current ARL 5, advanced one ARL in 2020. (Achieved ARL 6 as of publication date of this report)
Geographic Region Global
Partners University of Maryland, Earth System Science Interdisciplinary Center; NASA/JPL; NOAA/NESDIS/STAR; NOAA/NESDIS/SAB; NOAA/OR&R; Water Mapping LLC; MDA (formerly known as MacDonald, Dettwiler and Associates
Prospective Partners University of Norway; USCG; NOAA Emergency Response Division (ERD), Bureau of Safety and Environmental Enforcement (BSEE); Environment and Climate Change, Government of Canada; Marine Spill Response Corporation (MSRC) recently added to the project.
2020 Journal Papers 3
2020 Media Features 1
2020 Scientific Presentations 7
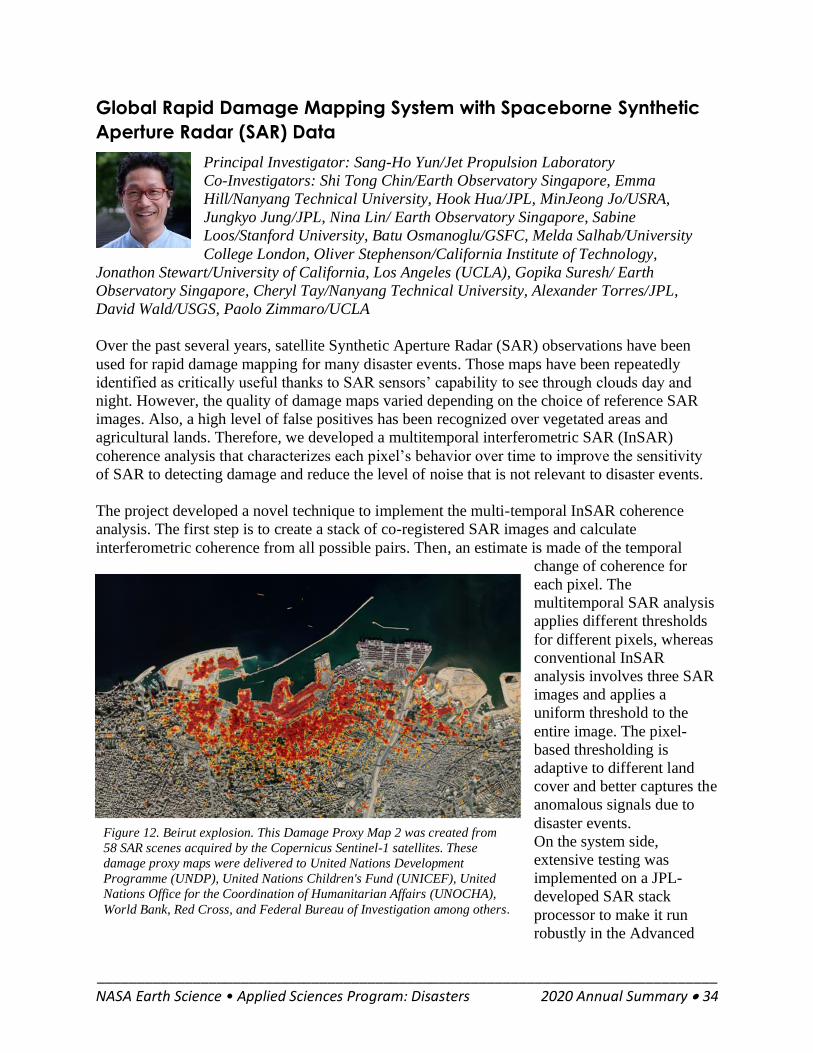
______________________________________________________________________________
NASA Earth Science • Applied Sciences Program: Disasters 2020 Annual Summary • 34
Global Rapid Damage Mapping System with Spaceborne Synthetic
Aperture Radar (SAR) Data
Principal Investigator: Sang-Ho Yun/Jet Propulsion Laboratory
Co-Investigators: Shi Tong Chin/Earth Observatory Singapore, Emma
Hill/Nanyang Technical University, Hook Hua/JPL, MinJeong Jo/USRA,
Jungkyo Jung/JPL, Nina Lin/ Earth Observatory Singapore, Sabine
Loos/Stanford University, Batu Osmanoglu/GSFC, Melda Salhab/University
College London, Oliver Stephenson/California Institute of Technology,
Jonathon Stewart/University of California, Los Angeles (UCLA), Gopika Suresh/ Earth
Observatory Singapore, Cheryl Tay/Nanyang Technical University, Alexander Torres/JPL,
David Wald/USGS, Paolo Zimmaro/UCLA
Over the past several years, satellite Synthetic Aperture Radar (SAR) observations have been
used for rapid damage mapping for many disaster events. Those maps have been repeatedly
identified as critically useful thanks to SAR sensors’ capability to see through clouds day and
night. However, the quality of damage maps varied depending on the choice of reference SAR
images. Also, a high level of false positives has been recognized over vegetated areas and
agricultural lands. Therefore, we developed a multitemporal interferometric SAR (InSAR)
coherence analysis that characterizes each pixel’s behavior over time to improve the sensitivity
of SAR to detecting damage and reduce the level of noise that is not relevant to disaster events.
The project developed a novel technique to implement the multi-temporal InSAR coherence
analysis. The first step is to create a stack of co-registered SAR images and calculate
interferometric coherence from all possible pairs. Then, an estimate is made of the temporal
change of coherence for
each pixel. The
multitemporal SAR analysis
applies different thresholds
for different pixels, whereas
conventional InSAR
analysis involves three SAR
images and applies a
uniform threshold to the
entire image. The pixel-
based thresholding is
adaptive to different land
cover and better captures the
anomalous signals due to
disaster events.
On the system side,
extensive testing was
implemented on a JPL-
developed SAR stack
processor to make it run
robustly in the Advanced
Figure 12. Beirut explosion. This Damage Proxy Map 2 was created from
58 SAR scenes acquired by the Copernicus Sentinel-1 satellites. These
damage proxy maps were delivered to United Nations Development
Programme (UNDP), United Nations Children's Fund (UNICEF), United
Nations Office for the Coordination of Humanitarian Affairs (UNOCHA),
World Bank, Red Cross, and Federal Bureau of Investigation among others.

______________________________________________________________________________
NASA Earth Science • Applied Sciences Program: Disasters 2020 Annual Summary • 35
Rapid Imaging and Analysis (ARIA) system. The test discovered several failure points; all the
identified vulnerabilities were fixed, and the stack processor is currently incorporated into the
ARIA system. This year, the project ARL increased from ARL 4 to ARL 6 (prototype
application system has been beta-tested in a simulated operational environment).
The improved damage proxy algorithm was successfully applied to support disaster response
efforts, including the January 2020 Puerto Rico earthquake, March 2020 Nashville tornado,
March 2020 Zagreb earthquake, and August 2020 Beirut explosion (Figure 12). In the Beirut
explosion analyses, about ten pre-event SAR scenes and a post-event SAR scene were acquired
by the Copernicus Sentinel-1 satellites and rapidly processed to produce a Damage Proxy Map
using multitemporal coherence analysis (DPM2). The Federal Bureau of Investigation (FBI)
Explosives team found the DPM very helpful and remarked that “There were several significant
areas of damage that we would not have located without your assist.”
Recognizing that about 8% of men and 0.5% of women are color blind or experiencing Color
Vision Deficiency (CVD), we developed a CVD-friendly color map (Figure 13) in addition to
our usual DPM colormap. The original DPM colormap uses red to indicate the most severe
damage—which would appear as green to those who are red-green color blind (a.k.a.
deuteranopia, which is 99% of CVD population).
Figure 13. Color Vision Deficiency (CVD) friendly colormap (the third column). The first column shows DPMs in the original colormap. The red color represents the most severe damage. However, to those with Deuteranopia (red-
green color blindness), the DPMs would appear as the second column figures, where the most severe damage
effectively disappears. Thus, we developed the CVD-friendly colormap (third column) which would appear as fourth
column to those who are red-green color blind.
The project team members have diverse backgrounds. There are 17 members on the team–eight
females and nine males. Principal Investigator Sang-Ho Yun mentored ten of the team members
on this project; seven of those mentored are females, and three are males, three are postdocs, four
are staff members, and three are students. Team member hail from eight different nations—
Singapore, Taiwan, Malaysia, India, Lebanon, Korea, United Kingdom, and the U.S.
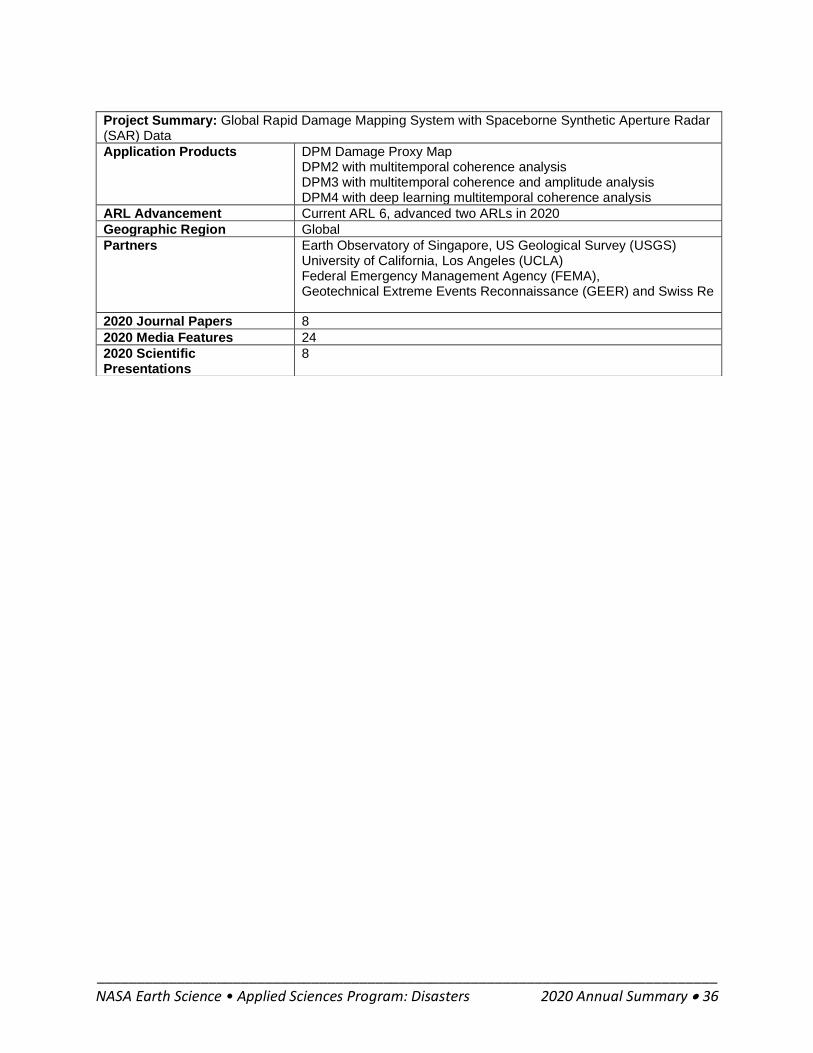
______________________________________________________________________________
NASA Earth Science • Applied Sciences Program: Disasters 2020 Annual Summary • 36
Project Summary: Global Rapid Damage Mapping System with Spaceborne Synthetic Aperture Radar (SAR) Data
Application Products DPM Damage Proxy Map DPM2 with multitemporal coherence analysis DPM3 with multitemporal coherence and amplitude analysis DPM4 with deep learning multitemporal coherence analysis
ARL Advancement Current ARL 6, advanced two ARLs in 2020
Geographic Region Global
Partners Earth Observatory of Singapore, US Geological Survey (USGS) University of California, Los Angeles (UCLA) Federal Emergency Management Agency (FEMA), Geotechnical Extreme Events Reconnaissance (GEER) and Swiss Re
2020 Journal Papers 8
2020 Media Features 24
2020 Scientific Presentations
8

______________________________________________________________________________
NASA Earth Science • Applied Sciences Program: Disasters 2020 Annual Summary • 37
B. NASA ROSES 2016 GEO GWIS A.50 Global Flood Research
Management Projects
Group on Earth Observations (GEO) Global Flood Risk Monitoring
(GFRM) Community Activity
The Disasters Program leads the GEO GFRM Community
Activity, which supports and integrates efforts that leverage
Earth observations to improve the ability to assess flood risk on global scale and translate risk
information to impacts at regional, national and sub-national levels by supporting risk-informed
decision-making. NASA Disasters funded three GEO GFRM projects in 2020, which addressed a
wide variety of technical challenges related to global flood risk monitoring and served multiple
stakeholders by providing critical EO-derived flood risk information.
Towards a Global Flood and Flash Flood Early Warning Early Action
System driven by NASA Earth Observations and Hydrologic Models
Principal Investigator: Andrew Kruczkiewicz/Columbia
University,International Research Institute
Co-Investigators: JJ Gourley/University of Oklahoma-Norman,
Humberto Vergara/University of Oklahoma-Norman, Helen
Greatrex/Columbia University
Led by Andrew Kruczkiewicz of Columbia University, International Research Institute for
Climate and Society (IRI), this project proposes to enhance disaster manager capacity to better
prepare, respond, and recover to floods. In the current state, disaster management organizations
in developing countries are not preparing sufficiently for flash floods. The lack of available,
accessible, and usable information, combined with a lack of capacity to take action, has led to a
state of insufficient preparedness.
This project team is collating and standardizing information from multiple disaster impact
datasets to illuminate existing flood datasets and create a global flash flood dataset and maps of
flash flood risk, vulnerability, and exposure. Action-based, in-depth case studies are in
development that will highlight Standard Operating Procedures/Early Action Protocols for the
lead times available to different organizations to include the Rohingya refugee camps in
Bangladesh and those conducting new case studies in Latin America.
Several new flash flood forecasting tools, including the Ensemble Framework for Flash Flood
Forecasting (EF5), are being validated and tested against observed flash floods with the intent to
see if they can forecast flash flood impact (Figure 14). All project elements will be pulled
together to create user-defined validations of flash flood forecasts, with hazard parameters,
evaluation metrics, and lead time directly informed by the disaster managers.

______________________________________________________________________________
NASA Earth Science • Applied Sciences Program: Disasters 2020 Annual Summary • 38
Figure 14. Global map of probability of at least one occurrence in any given year of a “minor” flash flood, as
determined by historical runs of the EF5 model 2000-2020. Photo Credit: Andrew Kruczkiewicz
(https://geo.floods.global)
This GFRM community activity, with the support of the three NASA GFRM research project
teams and under the guidance of the steering committee, continues to conduct outreach and
integration efforts to align existing flood-risk-related activities and leverage the global GEO
community to connect science activities with decision-making authorities.
One major highlight of the reporting period was working with interns. This effort included
graduate students from Columbia University and Lehman College (a public college in the Bronx
with a majority of students from backgrounds underrepresented in science, technology,
engineering, and math.). All students are paid. The Columbia students are funded by their
respective departments through a competitive process. The Lehman College students are funded
through a NASA Socioeconomic Data and Applications Center (SEDAC) initiative to include
non-traditional students in research.
Table 3. 2020 student interns.
Students Organization
Chris Lowrie and Lauren Mahoney Columbia University Department of Earth and Environmental Sciences, Climate and Society graduate program
Colleen Neely Columbia University School of International and Public Affairs, Master of Public Administration (MPA) in Environmental Science and Policy
Chris Aime, Hadjafatoumata Doubmouya, Raychell Velez, Nira Rahman, Dina Calderon
Lehman College
As this project is linked to the Red Cross Forecast-based Financing Program, the principal
investigator (PI) participated in the Forecast-based Financing Dialogue platforms. This
participation proved extremely useful in sharing outputs and outcomes of the GEO project with
an audience that is interested in integrated EO data into policy and practice.
Additionally, project efforts are featured in an upcoming book chapter titled, “Moving from
Availability to Use of Flood Risk and Flood Monitoring data to Inform Decision Making for

______________________________________________________________________________
NASA Earth Science • Applied Sciences Program: Disasters 2020 Annual Summary • 39
Preparedness and Response” with the PI as lead author. The chapter has been submitted to be
published in an American Geophysical Union (AGU) Monograph Series book titled, Global
Drought and Flood. A companion task to develop a related questionnaire was delayed as
COVID-19-related travel delays pushed this task back into the no-cost extension period. This
task is still part of the work plan; however, it will be assigned to the PI to be completed in the
second quarter of 2021 as part of the no-cost extension of the project.
In May 2020, a virtual workshop was facilitated with partners in Ecuador including Instituto
Nacional de Meteorología e Hidrología (INAMHI) of Ecuador, the Ecuador Red Cross, The
Red Cross Red Crescent Climate Centre, the Servicio Nacional de Gestion de Riesgos y
Emergencias (SNGRE) and Escuela Superior Politecnica del Litoral (ESPOL) – the Polytechnic
University of Ecuador). The University of Oklahoma and Columbia-IRI partners facilitated the
workshop. The workshop’s goal was to share technical information on the EF5 flash flood tool
and learn more about the actions and policies in place around participatory action for floods.
The original intention was for this workshop to take place in person in Ecuador, however
COVID-19 caused those plans to change. A visit to Ecuador to integrate the EF5 into decision-
making processes is still planned when travel can resume during the no-cost extension period.
Two recent advancements within the academic literature are noteworthy. First, an article entitled,
“Perspectives on flood forecast-based early action and opportunities for Earth observations” by
Neuman and seven co-authors including the PI was recently published in the Journal of Applied
Remote Sensing. This article highlights the opportunities and challenges of using integrated EO
data for risk and resilience programming, including use for anticipatory financing and early
action. Second, GFRM will be represented by Andrew Kruczkiewicz as guest editor in an
upcoming edition of the Journal of Flood Risk Management. The title will be “Operational Flood
Forecasting and Early Warning Systems,” and it will be co-edited by personnel from Deltares,
University of Reading, Word Meteorological Organization (WMO) Associated Programme on
Flood Management, International Research Institute for Climate and Society at Columbia
University, and the Red Cross Red Crescent Climate Centre.
Project Summary: Towards a Global Flood and Flash Flood Early Warning Early Action System driven by NASA Earth Observations and Hydrologic Models
Application Products
ARL Advancement
Geographic Region Global
Partners
2020 Journal Papers 4
______________________________________________________________________________
NASA Earth Science • Applied Sciences Program: Disasters 2020 Annual Summary • 40
Integrating Global Remote Sensing and Modeling Systems for Local
Flood Prediction and Impact Assessment
Principal Investigator: Robert Brakenridge/University of Colorado (UC)-
Boulder/Dartmouth Flood Observatory
Co-Investigators: Albert Kettner/UC-Boulder, Bob Adler/University of
Maryland-College Park, Guy Schumann/Remote Sensing Solutions Inc, and
Fritz Policelli/NASA GSFC
An automated global flood alert, measurement, and mapping system is achievable using
integrated satellite observations. The system can be developed through “Sensorweb” approaches
and would enhance societal preparedness and resilience to this lethal natural hazard. Increased
efficiency of disaster responses are anticipated due to rapid detection, localization, mapping, and
flood magnitude assessment. However, technological challenges must first be met such as (a)
improvement, interconnection, and integration of existing flood sensing systems (including
optical, SAR, and passive microwave); (b) Sensorweb links that expedite targeting of medium-
and high-resolution sensing over flooded areas; and (c) user-friendly, web-based portals where
near real-time determinations of flood locations and magnitudes and present and historical flood
extents are provided to a global community. This community includes public, humanitarian, and
development organizations such as the United Nations (UN) World Food Program (WFP), UN
Food and Agriculture Organization (FAO), and the United States Agency for International
Development (USAID), the United Nations Office for the Coordination of Humanitarian Affairs
(OCHA), international development banks, and commercial entities such as reinsurance
companies. To address these challenges, NASA funding supports many of the needed work
tasks, while also providing additional flood disaster response capabilities in the interim for
NASA and relevant GEO participants. The project builds on an international community of
practice consisting of experts and institutions (the Global Flood Partnership) who are data
providers and product end users involved in flood remote sensing and measurement, and disaster
response and preparedness.
Prior NASA support provided the University of Colorado/Dartmouth Flood Observatory (DFO)
with a state-of-the-art computer server for web-map technology. This Web Map Server (WMS)
has been put to use in the GEO GFRM project and is an essential tool for integrating automated
flood detection and mapping systems. Data layers now available at the WMS include those from
the Global Flood Monitoring System, the NASA Near Real-Time (NRT) Global Flood processor,
DFO’s additional processing of the MODIS NRT output, and the River Watch information. High
spatial resolution flood inundation is added on an event-by-event basis and also remains
permanently viewable.
Among other partner organizations involved in this project, in particular, the World Food
Program’s Automated Disaster Analysis and Mapping (ADAM)-Floods system is now directly
connected to project output and is at least at ARL 6 (validation in relevant environment). The
functionality of similar data layers has been fully demonstrated in ADAM, so an ARL of 7 may
be justified for the automated connection. WFP geospatial personnel, including those deployed in
the field, have described the utility of project information. Regarding ADAM, a WFP Geospatial
Support Unit member stated, “WFP has been receiving an unprecedented number of flood

______________________________________________________________________________
NASA Earth Science • Applied Sciences Program: Disasters 2020 Annual Summary • 41
mapping and analysis requests over the last two years because of climate change making flood
impacts more frequent and more devastating than ever. The GIS unit decided to automate this
process using the best available technologies and techniques. During 2020, the team started
developing ADAM Floods–this utilizes a data harvesting technology that pulls together
information from its partner organizations (including DFO and NASA) and uses sophisticated
geoprocessing for automatic analysis and mapping of flood impacts. ADAM Floods
accomplishes early impact estimation and floods monitoring and assists in recovery. It is not
simply mapping—it is a system designed to send timely information, analysis, and warnings for
better visualization of disasters.”
GFRM project-funded work improves and then directly connects satellite-based flood data with
ADAM and other end users. The project team is pleased that we are achieving this goal. Also,
related technical achievements partially or fully completed this past year include:
• Work to transfer the NASA MODIS Flood product to NASA-Land, Atmosphere Near
real-time Capability for Earth Observing System (EOS) (LANCE)
• Development of an automated, MODIS-based, Flood Alert data service • Installation of the Global Flood Modeling System output on the DFO Web Map Server
where it can be compared with other flood data layers • Web-published responses to over 22 major flood events in which integration approaches
were tested • Algorithm and product development for “maximum observed flood” and “mean annual
flood” GIS layers, to provide this essential information to WFP and other end users for
improved flood response and flood preparedness
In late 2020, extensive and sustained flooding occurred in southern Sudan and South Sudan. The
NASA NRT Global Flood product detected and imaged the event, but without the “masking”
layers needed to identify what was unusual versus normal for this region (the same missing
information impacts many other organizations’ flood mapping activities). This unusual and
damaging flooding affected a vast area and lasted many weeks. Thus, users did not need high
spatial resolution as much as sustained and comprehensive coverage that could locate the critical
areas. Flooding in this low-relief terrain is actually quite common every year; it is the unusual
flooding that is of most interest to relief agencies such as WFP that operate refugee camps.
DFO personnel recognized the challenge and produced displays (Figure 15) in which the mean
annual flood (blue) and the maximum observed flood extent (dark gray) were arranged together
with the “flood” information—a specially processed, MODIS NRT-based two-week (rolling
forward daily) water extent layer (white). The result shows the location and extent of unusual
flooding seen in the past 14 days. The two-week product takes advantage of gaps in the cloud
cover to provide maximum spatial coverage; it is updated daily so it also includes the most recent
information. When masked by the mean annual flood layer, the flooded areas of most concern
are highlighted. In addition, the dark gray, maximum observed flood extent shows all areas that
have previously been flooded; these areas may be vulnerable to near-future inundation during a
new flooding episode such as the one depicted in Figure 15.

______________________________________________________________________________
NASA Earth Science • Applied Sciences Program: Disasters 2020 Annual Summary • 42
Figure 15. Automated Current Flooding Display. Current unusual flooding in South Sudan (white), as imaged and
mapped in comparison to DFO’s “maximum observed flooding” layer (dark gray) and mean annual flood (blue). In
this low-relief terrain with numerous villages and refugee camps, the areas of past flooding can provide WFP and
FAO with actionable information regarding risk. Current flooding information provides the ability to estimate likely
impact on refugee camps, roads, crops and food supplies.
This experience indicated the value of providing all three data layers to WFP and UN FAO, and
the DFO Web Map Server. However, some functionality must now be built into the WMS to
allow creation of the same kind of display. Thus, appropriate positioning of the three data layers
within a stack of served data must be possible, and this capability needs to be understood by end
users. Input from the WFP indicates interest in having these layers available for other locations,
which is one of the objectives for the final phase of work.
Our efforts have also been endorsed by Neil Marsland, Senior Technical Officer, Office of
Emergencies and Resilience, Food and Agriculture Organization, United Nations in Rome, Italy,
who stated, “I can confirm that FAO is keen to enhance collaboration with DFO on flood
monitoring. For the moment, we have identified interest in improved use of historical min, mean,
max flood extent information, which could be integrated with under-development cloud-based
application for flood assessment and with other agriculture-related information for impact
assessment.”

______________________________________________________________________________
NASA Earth Science • Applied Sciences Program: Disasters 2020 Annual Summary • 43
Project Summary: Integrating Global Remote Sensing and Modeling Systems for Local Flood Prediction and Impact Assessment
Application Products NASA NRT Global Flood Mapping DFO Current Flooding Displays DFO River and Reservoir Watch DFO Flood Event Summaries DFO Web Map Server
ARL Advancement Current ARL 5 with sub-elements at 6 and 7 in 2020 Goal of ARL 7 in 2021
Geographic Region Global with emphasis on Africa, South Asia, and Latin America
Partners UN WFP and UN FAO are the most active partners
2020 Journal Papers 2

______________________________________________________________________________
NASA Earth Science • Applied Sciences Program: Disasters 2020 Annual Summary • 44
Global Rapid Flood Mapping System with Spaceborne Synthetic
Aperture Radar (SAR) Data
Principal Investigator: Sang-Ho Yun/JPL
Co-Investigators: Piyush Agram/JPL, Razi Ahmed/JPL, Hook Hua/JPL, Seung-
bum Kim/JPL, Gerald Manipon/JPL, and Susan Owen/JPL
Over the past several years, through a large number of flooding events, satellite
Synthetic Aperture Radar (SAR) observations have been used for rapid flood
extent mapping, and those maps have been repeatedly identified as critically useful due to the
sensors’ capability to see through clouds day and night. But flood mapping of urban areas has
been mostly neglected due to the high level of noise and complexity of radar reflection coming
from various orientations of building facades. Therefore, we developed a multi-temporal SAR
analysis that characterizes each pixel’s behavior over time to improve the sensitivity of SAR to
flooding in urban areas.
The Global Rapid Flood Mapping project developed a novel technique to implement the multi-
temporal SAR analysis. The first step is to create a stack of calibrated, co-registered SAR images
and calculate Bayesian probability based on estimated Gaussian parameters of dry pixels and
flooded pixels. The multi-temporal SAR analysis applies different thresholds for different pixels,
whereas conventional SAR analyses, either using one or two SAR images, apply a uniform
threshold to the entire image.
The pixel-based thresholding is adaptive to different land cover scenarios and better captures the
anomalous signals due to flooding. The Bayesian approach enables the possibility of automatic
implementation of the algorithm in the future without human intervention for threshold
determination. Further automation efforts are underway in both the algorithm side and the system
side. So far, we have increased the ARL from 2 (application concept) to 4 (components of
eventual application system have been brought together and technical integration issues have
been worked out).
The Flood Proxy Map (FPM) algorithm was successfully developed to support flood response
efforts beginning with the January 2020 Jakarta, Indonesia flash floods (Figure 16). The flooding
occurred due to heavy rain on New Year’s Day. Over 60 pre-event SAR scenes were acquired by
the Copernicus Sentinel-1 satellite, rapidly processed, and compared with the during-event SAR
scene. Thresholds were then determined by comparing with crowdsourced information provided
by Peta Bencana, a non-profit organization in Jakarta.
The project supported 11 activations in 2020. These included Tropical Cyclone (TC) Harold in
Fiji and Vanuatu, the Midland dam failure, TC Isaias in Dominican Republic, TC Eta in
Guatemala, TC Iota in Providencia, TC Yasa in Fiji, Jakarta flash floods, TC Amphan in India
and Bangladesh, and Indonesia floods.

______________________________________________________________________________
NASA Earth Science • Applied Sciences Program: Disasters 2020 Annual Summary • 45
Figure 16. Flood Proxy Map 2 derived from Copernicus Sentinel-1 SAR data using newly developed multi-
temporal SAR analysis. The light blue pixels represent areas likely flash-flooded due to heavy rains in Jakarta on
New Year’s Day 2020. Credits: https://earthobservatory.nasa.gov

______________________________________________________________________________
NASA Earth Science • Applied Sciences Program: Disasters 2020 Annual Summary • 46
Project Summary: Global Rapid Flood Mapping System with Spaceborne Synthetic Aperture Radar (SAR) Data
Application Products Flood Proxy Map FPM2 with multitemporal coherence analysis FPM3 with multitemporal coherence and amplitude analysis FPM4 with deep learning multitemporal coherence analysis
ARL Advancement Current ARL 4, advanced two ARLs in 2020
Geographic Region Global
Partners Earth Observatory of Singapore Academia Sinica NOAA Federal Emergency Management Agency (FEMA) UN World Food Programme US Air Force National Central University of Taiwan US Army SouthCom Sentinel Asia The Association of Southeast Asian Nations (ASEAN) Humanitarian Assistance (AHA) Centre
Prospective New Partners Franz Meyer/UAF, Kyle Hilburn/CSU, Jean-Paul Vernier/LaRC, Simon Carn/Michigan Technological University
2020 Journal Papers 4

______________________________________________________________________________
NASA Earth Science • Applied Sciences Program: Disasters 2020 Annual Summary • 47
C. NASA ROSES 2016 GEO GWIS A.50 Global Wildfire Information
System Projects
Using the NASA Polar Orbiting Fire Product Record to Enhance and
Expand the Global Wildfire Information System
Principal Investigator: Luigi Boschetti/University of Idaho
Co-Investigator: David Roy/Michigan State University
Fire plays an important role in determining the structure of ecosystems
worldwide, and many are becoming vulnerable due to changing human
populations and land-use practices. Regions have been subject to increasingly
extensive and severe wildfires, with mega-fires and longer fire seasons becoming more common.
In addition to their ecological and economic impacts, fires contribute to the carbon cycle,
releasing the equivalent of 22% of fossil fuel emissions. Since 2000, satellite observations have
been the primary data source for monitoring fire activity globally. The NASA MODIS MCD64
Global Burned Product is sufficiently mature to support policymaking (i.e., national and
subnational fire activity reporting and carbon inventories) but—at the time our project was
proposed—there was no service for systematic generation of summary fire activity information
(i.e., maps, statistics, charts) specifically accessible to non-technical users. Therefore, this project
has developed a new module within the Global Wildfire Information System (GWIS) to provide
global to sub-national science-quality information on fire seasonality, fire size, and annual
rankings of fire activity, in easily accessible formats. This information is derived from the NASA
MODIS Global Burned Area Product using transparent, reproducible, and documented methods.
In 2020, the project team, in collaboration with the GWIS team at the Joint Research Centre
(JRC) of the European Commission, successfully developed and deployed the proposed new
GWIS module Country Profile Application (Figure 17). After extensive beta testing, the system
is now fully functional (ARL 8, Finalized application system tested, proven operational, and
shown to operate as expected within user's environment). The system allows users to
interactively visualize maps of burned areas, tables and charts reporting fire activity metrics of
area burned, number of fires, seasonality, and fire size distribution. All source data are also
available for download.

______________________________________________________________________________
NASA Earth Science • Applied Sciences Program: Disasters 2020 Annual Summary • 48
Documentation, including a detailed user guide and a “quick start” guide, has been developed to
record the methods and help users navigate the application. The application can be freely
accessed at https://gwis.jrc.ec.europa.eu/apps/country.profile. Throughout the project, our team consulted and engaged perspective users by distributing a pre-
release version of the dataset and providing live demonstrations of the web application. This
outreach was conducted through collaboration with the Global Observation of Forest Cover
regional partners, UN Food and Agriculture Organization, and AmeriGEO. It included product
development and usage guidance for Bolivia, Guatemala, and Paraguay. The project is
specifically focused on providing datasets and readily available fire information for the
compilation of fire assessments and carbon inventories in Non-Annex I United Nations
Framework Convention on Climate Change (UNFCCC) Parties, including least developed
countries, on account of their limited capacity and high vulnerability to climate change and
natural disasters.
Figure 17. The GWIS Country Profile Application provides monthly, yearly, and multi-year burned area maps
for each country and sub-country region. Maps are generated based on a user-selected area and time period.
Users can adjust map layers and query the value of any pixel in the map. Brazil’s monthly and cumulative fire
information for 2019 is displayed here.
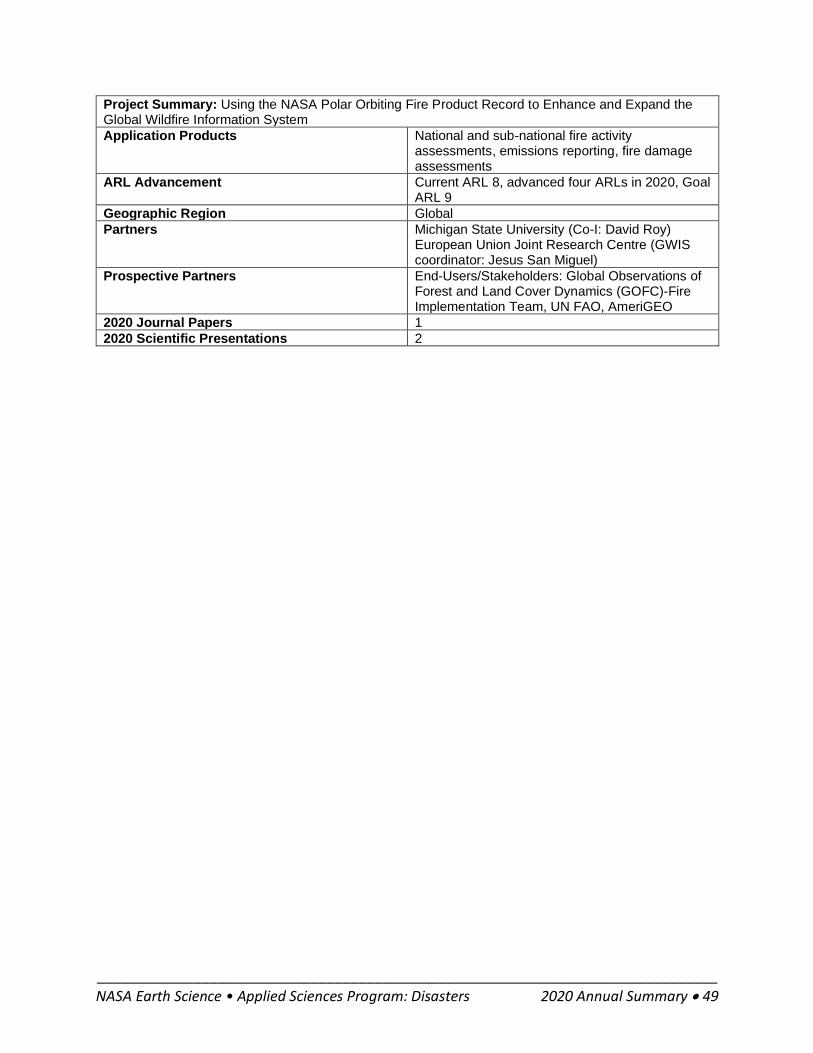
______________________________________________________________________________
NASA Earth Science • Applied Sciences Program: Disasters 2020 Annual Summary • 49
Project Summary: Using the NASA Polar Orbiting Fire Product Record to Enhance and Expand the Global Wildfire Information System
Application Products National and sub-national fire activity assessments, emissions reporting, fire damage assessments
ARL Advancement Current ARL 8, advanced four ARLs in 2020, Goal ARL 9
Geographic Region Global
Partners Michigan State University (Co-I: David Roy) European Union Joint Research Centre (GWIS coordinator: Jesus San Miguel)
Prospective Partners End-Users/Stakeholders: Global Observations of Forest and Land Cover Dynamics (GOFC)-Fire Implementation Team, UN FAO, AmeriGEO
2020 Journal Papers 1
2020 Scientific Presentations 2

______________________________________________________________________________
NASA Earth Science • Applied Sciences Program: Disasters 2020 Annual Summary • 50
Enhancements to the Global Wildfire Fire Information System: Fire
Danger Rating and Applications in Indonesia
Principal Investigator: Robert Field / Columbia University (NASA Goddard
Institute for Space Studies, GISS)
Fire danger rating systems (FDRS) are cornerstones of wildland fire
management, but fire danger data are not available in many fire-prone parts of
the world. The NASA GISS Global Fire Weather Database (GFWED),
https://data.giss.nasa.gov/impacts/gfwed) was therefore developed to meet the global fire
research and management communities’ needs for consistent fire danger data anywhere in the
world. GFWED is a small ensemble of Fire Weather Index (FWI) products using weather data
from reanalysis, weather forecasts, and satellite precipitation retrievals available from 1981-
present, and in near real-time.
In 2020, Goddard Earth Observing System-5 (GEOS-5) based fire weather forecasts from
GFWED were made available on the Global Wildfire Information System (GWIS) alongside
similar data from the European Centre for Medium Range Weather Forecasts (Figure 18). A new
GFWED ensemble member based on the blended Tropical Rainfall Measurement
Mission/Global Precipitation Measurement Mission (TRMM/GPM), Integrated Multi-satellite
Retrievals for GPM (IMERG) version-006 retrieval was added. This new ensemble member
begins in 2000, has 0.1ox 0.1o spatial resolution, and includes pole-to-pole coverage. Alongside a
comparison of fire weather data calculated from reanalysis and weather station data, the global
skill of the GEOS-5 forecasts was published, as was a book chapter describing the GPM-based
fire weather for case studies in Chile, Greece, and Indonesia.
Figure 18. Beginning in 2020, GFWED Fire Weather Index forecasts were made available on the JRC Global
Wildfire Information System. The forecasts are calculated data from the NASA GEOS-5 weather forecast model
and available in near real-time. https://gwis.jrc.ec.europa.eu/apps/gwis_current_situation/index.html

______________________________________________________________________________
NASA Earth Science • Applied Sciences Program: Disasters 2020 Annual Summary • 51
Regionally, the Indonesian FDRS run by the Indonesian Meteorology, Climatology and
Geophysical Agency is also based on the same Fire Weather Index System as GFWED. In 2020,
GPM precipitation retrievals were incorporated into the Indonesian FDRS and made publicly
available, progressing to an ARL of 8 (Figure 19).
Figure 19. Beginning in 2020, the Indonesian Agency for Meteorology, Climatology and Geophysics transitioned to
a new Fire Danger Rating System. The new version uses GPM precipitation retrievals in place of weather station
data, improving the resolution and accuracy of products. https://www.bmkg.go.id/cuaca/kebakaran-
hutan.bmkg?index=dc&wil=indonesia&day=obs
Also, in 2020, the Uruguayan Meteorological Service began evaluating GFWED for operational
use through distribution of daily maps via an internal telegram channel. The Argentine Army is
undertaking a similar evaluation. The Wildfire Emissions Inventory System based at the
Michigan Tech Research Institute began using GFWED data to estimate the fuel-moisture
dependence of smoke emissions from fires in North America.

______________________________________________________________________________
NASA Earth Science • Applied Sciences Program: Disasters 2020 Annual Summary • 52
Project Summary: Enhancements to the Global Wildfire Fire Information System: Fire Danger Rating and Applications in Indonesia
Application Products NASA GISS Global Fire Weather Database (GFWED), blended TRMM.GPM IMERGv-006, serving as a FDRS in GWIS; Indonesian FDRS
ARL Advancement Current ARL-6, advanced 2 ARLs in 2020, Goal ARL-7
Geographic Region Global & Indonesia
Partners JRC Indonesian Agency for Meteorology Climatology and Geophysics
Prospective Partners Uruguayan Meteorological Institute Argentinian Army End-users/stakeholders: fire researchers, fire managers in Indonesia
2020 Journal Papers 3
2020 Media Features 6
2020 Scientific Presentations 1

______________________________________________________________________________
NASA Earth Science • Applied Sciences Program: Disasters 2020 Annual Summary • 53
Development of a Harmonized Multi-Sensor Global Active Fire
Data Set
Principal Investigator: Louis Giglio / University of Maryland
Co-Investigator: Wilfrid Schroeder / NOAA
Fires are ubiquitous throughout the globe. Monitoring them requires a
combination of sensors with differing spatial, temporal, and radiometric
resolutions. For the past two decades, the primary sources of global fire
observations have been NASA’s Terra and Aqua polar-orbiting satellites, which carry the
Moderate Resolution Imaging Spectroradiometer (MODIS), and the NASA-NOAA Suomi-
National Polar-orbiting Partnership (S-NPP), which carries the Visible Infrared Imaging
Radiometer Suite (VIIRS). These systems are limited to between two to eight observations per
day, with acquisition times that often do not coincide with the most intense period of fire or that
are more susceptible to cloud obscuration, resulting in limited mapping of fire occurrence. The
next generation of geostationary weather satellites, which include the NOAA GOES,
EUMETSAT Meteosat Second Generation (MSG), and Japan Meteorological Agency Himawari
platforms, now include a fire monitoring capability and incorporate refinements in spatial and
temporal resolution as well as radiometric performance.
These platforms provide unrivaled temporal sampling of fire activity every 1-30 minutes, but are
operated by different agencies and carry different sensor payloads, resulting in a disparate set of
fire products in multiple formats, produced using different fire detection algorithms, thus
complicating interoperability for end users. Therefore, this project augments the existing Global
Wildfire Information System (GWIS) with the addition of a near-global, multi-platform,
harmonized geostationary fire data set that has undergone comprehensive data validation and
quality assessment. The project is also educating users about the characteristics and potential
applications of the harmonized geostationary fire data as well as the capabilities of the
underlying geostationary satellite platforms and sensors.
The harmonized fire data suite consists of a near real-time (NRT) and near-global geostationary
active fire product delivered to end users in two formats: (i) harmonized, 0.25° gridded hourly
summaries of active fire properties, including fire radiative power, and ancillary information
(e.g., cloud cover, coverage, etc.); and (ii) blended, geocoded delimited text files that preserve
the spatial and temporal resolutions of the underlying hemisphere-specific fire products.
Accomplishments in 2020 included the operational implementation of the production software
for both the gridded and blended products on the internal computing cluster, and the consistent,
rigorous validation of the underlying hemisphere-specific GOES-16 and GOES-17 Fire
Detection and Characterization (FDC) data and Himawari-8 fire data sets using more than 50,000
Landsat reference scenes (Figure 20). The operational software was delivered to our GWIS
partner in mid-2020, and for test purposes has been running continuously on a local computing
cluster for the past nine months. The Harmonized, Multi-Sensor Global Active Fire Data Sets
will be operationally released on the JRC GWIS site in the first half of 2021.

______________________________________________________________________________
NASA Earth Science • Applied Sciences Program: Disasters 2020 Annual Summary • 54
Figure 20. Top: Fire radiative power (FRP) values produced by integrating data from the FRP-PIXEL (MSG and
Himawari) and the Wildfire Automated Biomass Burning Algorithm (WF-ABBA) (GOES-16 and -17) products from
January 20, 2021. This product, available in ASCII format, maintains the native temporal and spatial resolutions of
the FRP-PIXEL and WF-ABBA active fire products. Bottom: 0.25˚ gridded product for March 8, 2020, with hourly
summaries of active fire properties, including fire radiative power, number of fire detections, and ancillary
information (e.g., cloud cover, coverage, etc.).

______________________________________________________________________________
NASA Earth Science • Applied Sciences Program: Disasters 2020 Annual Summary • 55
Project Summary: Development of a Harmonized Multi-Sensor Global Active Fire Data Set
Applications Products GWIS serving NOAA GOES, EUMETSAT MSG, and Japan Meteorological Agency Himawari fire products including fire distribution, fire spread, fire intensity surrogate, diurnal fire variation, etc.
ARL Advancement Current ARL 6, advanced three ARL levels in 2020, Goal ARL-9
Geographic Region Global
Partners European Commission-Joint Research Center (JRC) NOAA
Prospective Partners USDA Forest Service, global community using GWIS
End-Users/Stakeholders National policymakers and fire services FAO NASA Fire Information for Resource Management System (FIRMS) Conservation International (CI) Firecast United Nations Environment Programme (UNEP)

______________________________________________________________________________
NASA Earth Science • Applied Sciences Program: Disasters 2020 Annual Summary • 56
III. Disaster Response
The response portion of the Disasters Program functions in a unique way within the Applied
Sciences Program, as well as across the larger NASA community. The team consists of program
management and support personnel, emergency managers, and Geographic Information System
(GIS) specialists, as well as disaster coordinators located at six NASA centers across the United
States. Each coordinator’s role includes engagement with any person or group at their respective
centers who may be able to contribute disaster-relevant information or data. Bringing these
relationships and bodies of knowledge together across centers promotes and strengthens the
program’s effectiveness and reach, allowing the program to provide end users with improved
situational awareness before, during, and after disasters.
The Disasters Program coordinated 50 activations in 2020 and activations from 12 unique hazard
category types, (as illustrated in Figure 22) developed into disasters. Tropical
Cyclones/Hurricanes were most common, accounting for 15 of the 50 activations. There were
eight flooding, seven fire, seven earthquake, and four volcano events. Additional details and data
provided to end users can be found on the Disasters Program website and the NASA Disasters
Mapping Portal. While this number of events is less than in some past years, Disasters Program
personnel were stretched thin as many of this year’s events were large, demanding extensive
support over weeks or months. The extensive support pulled personnel away from other
endeavors such as partnership building and collaboration with external agencies and other
internal NASA programs, as well as planning holistic program improvement based on lessons
learned from these events.
Upon notification/awareness of an event, the program determines whether the event requires
monitoring or activation. Once it is determined that an activation should occur, a Core Team is
established to provide support and coordinate throughout the duration of the event and to
participate in post-support evaluations and discussions.
Figure 21. In 2020, there were 50 separate responses, covering 12 unique hazard types in eight different regions of
the world.

______________________________________________________________________________
NASA Earth Science • Applied Sciences Program: Disasters 2020 Annual Summary • 57
The program uses a multi-tiered framework to track the level of effort associated with
activations:
Tier 0: Assessment to determine initial support. The program may also choose to simply
monitor the situation and reassess later. Tangible information is often not available for events
under initial assessment or in the monitoring-only phase, so the website will not automatically
highlight such events with an Activation Page.
Tier 1: The allocation of time and resources beyond the initial monitoring and automated data
collection/distribution processes already in place. This level of effort indicates one or more
identified end users/stakeholders, the occurrence of limited intra/interagency coordination, and
the development and posting of a limited number of timely, useful, event-specific products
(typically five or fewer, including story maps). Support will have minimal or no effect on
mission priorities and will not require any additional funds outside of already-allocated internal
coordination funding.
Tier 2: Contributions of resources, information and expertise from the Disasters Program are
considerable given the extent of the disaster and will likely impact ongoing activities of NASA
centers and programs. This level of effort indicates an increased level of intra/interagency
coordination. Either there is an expectation that more than five event-specific products will be
developed and posted, or there will be continuous updating and posting of any number of
products. This tier represents a significant time commitment from program personnel. Additional
allocation or expenditure of funds may be necessary.
Tier 3: An event that directly affects national or international safety, security, or interests. All
relevant personnel review their activities to determine resources and expertise that can support
the disaster. This activity may include a reprioritization of assets and resources, as directed by
the Core Team, to focus on stakeholder requests. Should an emergency require redirection of
mission priorities, concurrence with agency leadership to refocus space and airborne assets
should be coordinated. This level of effort indicates the development and posting of numerous
event-specific products, consistent posting of updated products, extensive intra/interagency
coordination, an extensive time commitment from program personnel, and the likely need for
significant additional funding for event support.
Supplemental Designations: The supplemental designation of “A” (e.g., Tier 2A) indicates the
utilization of airborne assets during event support. The supplemental designation of “M” (e.g.,
Tier 1M) indicates a pre-event (mitigation or preparedness) activation, such as examining the
vulnerability of an area before an actual event, such as a hurricane or volcano. The supplemental
designation of “R” (e.g., Tier 1R) indicates a post-event (recovery or resilience) activation to
assist in rebuilding and restoration.
Research Only: There may also be activations strictly focused on research where the program
does not generate results specifically for stakeholder time-sensitive decision-making, but where
research objectives require additional program resources beyond usual day-to-day activities.
These events may or may not include research-based stakeholder requests and serve as an
opportunity to advance scientific research, streamline, or verify processes, support portal
advancements, identify future partnerships, etc. An event of scientific interest relevant to
ongoing NASA observations, Research and Analysis Program efforts, or Applied Science
research may not warrant active event support. This work, however, may still produce products,
further collaboration, and lead to highlighting NASA’s work through social media and web

______________________________________________________________________________
NASA Earth Science • Applied Sciences Program: Disasters 2020 Annual Summary • 58
postings, etc. If research conditions change, the Core Team will revisit the initial event screening
and tier structure categorization.
02468
101214
3
12
37
3
13
3 51
Disasters Program Activations by Region - 2020
Number of Activations
0
2
4
6
8
10
12
14
16
2 14
2 2 13
1
44
4
1 2
10
1
1
1 1
2
1
1
1
Disasters Program Activations by Hazard and Tier - 2020
Tier 0 Tier 1 Tier 2 Research Recovery Mitigation
Figure 23. Disaster Activations by Region. *Note: North America includes Canada, Mexico, and the United
States.
Figure 22. Disaster Activations by hazard and tier.

______________________________________________________________________________
NASA Earth Science • Applied Sciences Program: Disasters 2020 Annual Summary • 59
Western U.S. Fires
Throughout late Summer and early Fall 2020, the Disasters Program activated coordination
efforts in response to multiple large fires in California, Washington, Oregon, and Colorado and
worked closely with local, state, regional, and federal stakeholders to understand the impacts of
the fires and the potential risks to people, infrastructure, and the environment. NASA provided
support directly to these users through emails and virtual meetings and via data products digitally
distributed on the NASA Disasters Mapping Portal.
In addition to regularly generated near real-time fire
products such as Global Fire Emissions Database
(GFED) aerosol amounts, Fire Information for Resource
Management System (FIRMS) Active Fire Points, the
Ozone Mapping and Profiler Suite (OMPS) Aerosol
Index, and the Land Information System (LIS) Relative
Soil Moisture and Evaporative Stress Index, the NASA
Disasters Mapping Portal was used to distribute event-
specific products generated through ROSES A.37
research projects and partner programs within NASA.
For example, the NASA Disasters GIS Team produced
the first-ever 3D interactive map of Cloud-Aerosol
Lidar (Light Detection and Ranging) with Orthogonal
Polarization (CALIOP) data showing the vertical
distribution of wildfire smoke. Other mapping portal
products supporting the western U.S. fires include 2D
and 3D Multi-Angle Imaging Spectroradiometer
(MISR) plume data, a regularly updated map of
Moderate Resolution Imaging Spectroradiometer
(MODIS) Aerosol Optical Depth (AOD) organized by
California Air Basins for air quality concerns, and a
map displaying fire proximity to residential areas and
critical infrastructure using MODIS and Visible Infrared
Imaging Radiometer Suite (VIIRS) Fire Points data
provided through the ROSES A.37 project “Open
Critical Infrastructure Exposure for Disaster
Forecasting, Mitigation and Response.”
As part of the activation, the Disasters Program formed a subgroup to concentrate on air quality
and fire propagation. The group worked directly with the NASA Health and Air Quality Applied
Sciences Team (HAQAST) and provided air quality and smoke plume analyses using data from
the CALIOP and MISR instruments to the United States Forest Service (USFS). In addition, the
ROSES A.37 research project “Coupled Interactive Forecasting of Weather, Fire Behavior, and
Smoke Impact for Improved Wildland Fire Decision-Making” provided novel fire detection,
smoke modeling, and fire propagation modeling datasets, including 1-hour, 10-hour, and 100-
hour fuel moisture forecasts.
Figure 24. This map show the daily
average aerosol optical depth (AOD)
over California's 15 air basins on
September 5, 2020. AOD is a measure of
the degree to which light is absorbed or
scattered by particles in the atmosphere,
with AOD greater than 0.5 considered
hazy. The darkest coloration in northern
California represents an average AOD
of at least 1.5. Credit: Image created by
Robert Field using data from the NASA
GSFC MODIS Science Team

______________________________________________________________________________
NASA Earth Science • Applied Sciences Program: Disasters 2020 Annual Summary • 60
The MISR Active Aerosol Plume-height (AAP) Project, funded through the NASA Earth
Science Research and Analysis Program, used data from NASA's Terra satellite to map the
properties and near-source dispersion of smoke plumes from the fires. The AAP Project
compared data from MODIS, MISR, Cloud-Aerosol Lidar and Infrared Pathfinder Satellite
Observations (CALIPSO), and OMPS to conduct a more detailed analysis to thoroughly
understand the characteristics of the smoke.
In addition to satellite-based data, the program also used NASA Airborne Science data from
UAVSAR and Short-Wave Infrared (SWIR) instruments flown aboard a NASA Gulfstream C-
20A jet. The first flight on September 3 surveyed the LNU Lightning Complex burn area
northeast of San Francisco, while an additional flight on September 9 focused on fires in
southern California. Data from these flights were used for damage detection, burn scar mapping,
and hot spot detection. To assist stakeholders with situational awareness, the ROSES A.37
project “Global Rapid Damage Mapping System with Spaceborne SAR Data” provided Damage
Proxy Maps (DPMs) for the LNU
Lightning Complex from data acquired
on the September 3 flight.
Finally, Advanced Spaceborne
Thermal Emission and Reflection
Radiometer (ASTER) data and
MODIS data were provided to
stakeholders to assist in determining
fire perimeters and burn scars for the
River/Carmel Complex fires, the CZU
Lightning Complex, and the LNU
Complex. Disaster Coordinators at
NASA’s Marshall Space Flight Center
also processed optical data from the
Sentinel-2 and Landsat-8 satellites for
higher-resolution burn scar and fire
location detection.
The NASA Disasters Program supported the following stakeholders throughout the event:
California Washington Colorado Oregon Regional / Federal
• California National
Guard
• California Geological
Survey
• California State
Geographic
Information Officer
• California Office of
Emergency Services
• CalFIRE
• Washington Air
Quality
• Washington
Emergency
Management
Department
• Olympic Region
Clean Air Agency
• Washington
Department of
Ecology
• Colorado
Department
of Public
Safety
• Oregon
Office of
Emergency
Management
• US Postal Service
• US Forest Service
• US Army Corps of
Engineers
• FEMA Region IX
Figure 25. This false color image is created using the near-
infrared, red, and green channels from the ASTER instrument
allowing for the ability to easily compare healthy and burned
vegetation. The near-infrared gives the ability to see through some
thin smoke as well. Healthy vegetation is shown as red and burned
vegetation is black and gray. Credits: Advanced Spaceborne
Thermal Emission and Reflection Radiometer (ASTER) on NASA’s
Terra platform.

______________________________________________________________________________
NASA Earth Science • Applied Sciences Program: Disasters 2020 Annual Summary • 61
• Washington
Department of
Natural Resources
The NASA Disasters Program provided stakeholders with the following products:
• Fuel Moisture and Plume Data
• Global Fire Emissions (VIIRS)
• FIRMS Active Fire Points
• OMPS Aerosol Index
• LIS Soil Moisture & Relative Soil Moisture
• Soil Moisture Active Passive (SMAP) Soil Moisture
• SMAP Soil Moisture Anomaly
• Evaporative Stress Index (NASA SERVIR)
• Natural Color Daily Imagery (MODIS and VIIRS)
• True Color Daily Imagery (MODIS and VIIRS)
• 1-, 10-, and 100-hour Fuel Moisture Forecasts
• Aerosol Optical Depth (MODIS)
• ARIA Damage Proxy Maps
• ASTER Burn Scars
• MASTER (MODIS/ASTER) Fire Intensity and Burn Severity Composites
• Copernicus Sentinel-2 True Color, Natural Color, and Short-Wave Infrared (SWIR) Imagery
• Landsat-8 Difference Normalized Burn Ratio (dNBR) Imagery
• CALIPSO Plume Density
• MISR Plume Height
• Fire Proximity to Residential Areas and Critical Infrastructure
• Smoke Forecast Modeling
• Fire Propagation Modeling

______________________________________________________________________________
NASA Earth Science • Applied Sciences Program: Disasters 2020 Annual Summary • 62
Hurricanes Eta and Iota
The 2020 Atlantic Hurricane Season set records in many categories: the most named storms
observed in a year (30), the most storms to make landfall in the continental United States (12),
the most to hit Louisiana (5), and the most storms to form in September (10). Prior to 2020,
Nicaragua had recorded only two Category 4 or higher hurricanes hitting its shores. However, in
November, two storms—Eta and Iota—made landfall within 15 miles of each other, only two
weeks apart. Two Category 4 hurricanes landing this close together had not been reported in
nearly 170 years of records. When those hurricanes hit Central America, they brought deadly
flooding and landslides throughout the region, including Honduras and Guatemala. With
response teams already stretched, information that helps officials make timely and accurate
decisions became even more critical.
By laying the groundwork and fostering connections in the Americas before Eta and Iota hit,
NASA’s Disasters Program was able to organize quickly and effectively to help regional and
local officials and responders not only anticipate the initial impact of both historic storms, but
also comprehend the effects of the flooding and landslides that came with the cascading impact
of the historic storms. The program worked with long-standing partners such as the World Bank
and SERVIR to collaborate at a regional level, supporting response efforts of the Guatemalan
Coordinating Agency for Disaster Reduction (CONRED) and the Coordination Center for the
Prevention of Natural Disasters in Central America (CEPREDENAC). Relationships with
CONRED, CEPREDENAC, and other national organizations have been nurtured for the last
several years through the Disasters Program’s Latin America and Caribbean liaison to help
agencies in the region understand and utilize NASA data for disaster preparedness, response, and
recovery. Stakeholders in Nicaragua, Honduras and Guatemala, El Salvador, Belize, Costa Rica,
and Panama used NASA resources to help confront such topics as the extent of flooding in the
region, situational awareness for potential landslides, and more. Support from the Disasters
Program included damage assessment, debris management considerations, analysis of river
containment systems, and land use/land cover mapping.
The Disasters Program also collaborated with U.S. Southern Command (SOUTHCOM)
providing Damage Proxy Maps and other data products to support flood assessment and recovery
efforts for emergency humanitarian assistance and disaster relief planning. This partnership was
developed in early 2020 through the Disasters Program’s participation in SOUTHCOM’s annual
multi-national Tradewinds exercise. This partnership proved to be very beneficial, as
SOUTHCOM’s assets were some of the first resources to arrive in-country following the
hurricane landfalls and provided direct relief to residents in affected areas. During the hurricane
response for Iota, SOUTHCOM utilized the flood extent layers provided by the Disasters
Program in their Common Tactical Picture hosted on Cerebrum (SOUTHCOM’s GIS data
portal). The information was continuously displayed on the SOUTHCOM operations floor and
was referenced during mission update briefings, and by forward-deployed units based out of
SOUTHCOM’s Joint Task Force - Bravo. SOUTHCOM used the map layers to inform decisions
regarding access to specific delivery ports for supplies and the timing of airfield assessment team
deployment.

______________________________________________________________________________
NASA Earth Science • Applied Sciences Program: Disasters 2020 Annual Summary • 63
Working through the National Geospatial-Intelligence Agency (NGA) Team at SOUTHCOM,
researchers are continuing to improve processing methods and the use of different datasets by
working with NASA scientists to develop algorithms for Google Earth Engine—a platform with
massive computing power that can speed Earth data processing.
Application Spotlight: NASA's Land, Atmosphere Near real-time
Capability for EOS (LANCE)
The NASA Disasters Mapping Portal incorporates products and services to help transform not
only how Earth observing data are used, but also the worldwide accessibility of these data. One
of these resources is NASA's Land, Atmosphere Near real-time Capability for EOS (LANCE),
which provides near real-time Earth-observing system data and imagery from NASA instruments
and timely products for users interested in monitoring fires, dust storms, hurricanes, volcanic
eruptions as well as other natural and human-made phenomena.
Figure 26. The blue pixels in this
preliminary map show areas of
Izabal region, Guatemala that
were likely flooded as a result of
Hurricanes Eta and Iota. Maps
such as this were provided to
SOUTHCOM to assist in
situational awareness of flooded
areas for disaster relief and
humanitarian assistance
operations. Credits: Analyzed by
the National Central University
and NASA-JPL/Caltech ARIA
team. Part of this research was
carried out at JPL funded by
NASA Earth Applied Sciences
Disasters Program. The image
contains modified Copernicus
Sentinel data (2020).

______________________________________________________________________________
NASA Earth Science • Applied Sciences Program: Disasters 2020 Annual Summary • 64
Supported in part by the NASA Disasters Program, LANCE
distributes global satellite data and imagery within three hours of
satellite observations; this information can be used to monitor
disturbances across the globe. The NASA Disasters Program
promotes the use of LANCE near real-time (NRT) data products
and imagery from satellite instruments to support disaster risk
reduction activities before, during, and after events. The NASA
Disasters Program increases LANCE’s visibility by coordinating
with the applications community and end users to utilize current products and recommend new
products.
The NASA Disasters Program promotes the use of LANCE NRT global fire and atmosphere
products to locate fires and high-temperature heat sources and to assess the extent of air pollution
from wildfires and volcanic eruptions. The NASA Disasters Mapping Portal combines LANCE
products with relevant geospatial layers and custom-made products to improve response to, and
recovery from, natural and technological disasters. Knowledge of the geographical position and
direction of smoke plumes, fires, and lava flows provides critical information for disaster
prediction and prevention. For hurricanes and tropical cyclones, the NRT Global Flood Mapping
product, a new LANCE product partially funded by the Disasters Program, has been used to
monitor water extent change over time in disaster-impacted areas. Users can use pre- and post-
disaster maps to assess the extent of damage and to make decisions about reconstruction and
recovery activities regarding infrastructure and health on the ground.
The NASA Disasters Program provides feedback to LANCE to identify gaps and assist in
developing new NRT products; one such example was the request for NRT products in user-
friendly and GIS-analysis ready format. At the LANCE User Working Group in September
2020, the Disasters Program requested LANCE consider providing products in GeoTIFF format
based on feedback from end users. Some new products, funded through NASA A.37 ROSES
calls, have the potential to be included in LANCE in the future, including a new Ozone Mapping
and Profiler Suite (OMPS) volcanic SO2 product being developed by Dr. Nickolay Krotkov, and
an algorithm to generate NRT fire products from the GOES-16 satellite being developed by Dr.
Kyle Hilburn and Dr. Jan Mandel. The NASA Disasters Program also promotes the integration
of LANCE with satellite needs and decadal-designated observables. For instance, the NASA
Disasters Program continues to communicate with the NISAR team and the Surface Biology and
Geology (SBG) study team regarding generation and use of LANCE NRT data products.

______________________________________________________________________________
NASA Earth Science • Applied Sciences Program: Disasters 2020 Annual Summary • 65
IV. Communications Highlights
Highlights and Milestones
The Disasters Program area communications team coordinated with representatives from U.Group and the NASA Web Services Office to successfully migrate the NASA Disasters Program standalone website (https://disasters.nasa.gov) into the joint NASA Applied Sciences Program website (https://appliedsciences.nasa.gov). This effort involved migrating all relevant content and setting up redirects from the old web address to the new one, and was the culmination of many months of planning, development, and bug-testing to ensure that the new site captured all the functionality of the old site, that the new site was user-friendly, and that the transition process was seamless.
@NASAAtmosphere Twitter Account
The Disasters Program area communications team coordinated the launch of the new “NASA Atmosphere” Twitter (https://twitter.com/nasaatmosphere) and Facebook (https://facebook.com/nasaatmosphere) accounts on December 1, 2020. These new accounts replace the previous “NASA Rain” and “NASA Hurricane” accounts, and cover all aspects of how NASA studies Earth’s atmosphere, including weather, climate, air quality, and atmospheric-related disasters. This move is part of the agency-wide social media consolidation from mission-specific to thematic accounts and will provide a valuable new platform for promoting Applied Sciences Program and Disasters Program area content. The Disasters Program area communications team contributed materials and participated in several outreach events, including the 2020 American Geophysical Union Fall Meeting, Earth Day 2020 (50th Anniversary of Earth Day), and the 2020 Esri Federal GIS Conference.
Figure 27. Google Analytics pageviews for
disasters.nasa.gov from Jan. 1–Dec. 31, 2020
Figure 28. Screenshot of the new Disasters
program area homepage on the NASA Applied
Sciences website (https://science.nasa.gov/earth-
science/agu2020/big-picture)

______________________________________________________________________________
NASA Earth Science • Applied Sciences Program: Disasters 2020 Annual Summary • 66
The Disasters Program area communications team continued efforts to increase coordination with other programs, centers, missions, and the larger NASA Earth Science Division. This effort included meeting with NASA communications leadership to develop the agency’s hurricanes communication strategy, efforts to increase coordination with the Applied Program communications team, and participating in NASA-wide communications activities such as the NASA Earth Science Division Communications Virtual Retreat in July 2020. In alignment with the Agency’s diversity and inclusion goals, the Disasters Program area communications team brought on a team of student interns to aid with communications activities, including two summer-session interns and five fall/spring-session interns. The communications team worked closely with these interns to educate them about NASA and the Disasters Program area and integrate them into meetings and workflows, providing them with real-world experience as well opportunities to publish their work online, which will aid their future endeavors.
Figure 29. Screenshot from “Seeing the Big Picture,” the Earth science section of NASA’s AGU 2020 virtual
exhibit booth. The Disasters GIS team created a custom storymap showcasing maps and visualizations from
2020 that was featured on this page, along with other resources from the Applied Sciences Program
(https://science.nasa.gov/earth-science/agu2020/big-picture)
______________________________________________________________________________
NASA Earth Science • Applied Sciences Program: Disasters 2020 Annual Summary • 67
V. Abbreviations and Acronyms
AAP Active Aerosol Plume-height Project
ADAM Automated Disaster Analysis And Mapping
AGU American Geophysical Union
AHA Association of Southeast Asian Nations (ASEAN) Humanitarian
Assistance (AHA)
AIST Advanced Information System Technology
AIST NOS Advanced Information System Technology New Observing Strategies
AOD Aerosol Optical Depth
AKAH Aga Khan Agency for Habitat
APRFC Alaska-Pacific River Forecast Center
ARIA Advanced Rapid Imaging And Analysis
ARL Application Readiness Level
ASDC Atmospheric Science Data Center
ASEAN Association of Southeast Asian Nations
ASTER Advanced Spaceborne Thermal Emission and Reflection Radiometer
A-VAAC Alaska Volcanic Ash Advisory Center
AVO Alaska Volcano Observatory
AVPT Arctic Volcanic Plume Tracker
AWS Amazon Web Services
BSEE Bureau of Safety and Environmental Enforcement
BTD Brightness Temperature Difference
CALIOP Cloud-Aerosol Lidar with Orthogonal Polarization
CALIPSO Cloud-Aerosol Lidar and Infrared Pathfinder Satellite Observations
CARD4L CEOS Application-Ready Data for Land

______________________________________________________________________________
NASA Earth Science • Applied Sciences Program: Disasters 2020 Annual Summary • 68
CBA Cost-benefit Analysis
CEOS Committee on Earth Observation Satellites
CEPREDENAC Center for the Prevention of Natural Disasters in Central America
CI Conservation International
CIESIN Center for International Earth Science Information Network
CIII Critical Infrastructure Interdependency Index
CIIRI Critical Infrastructure Interdependency Risk Index
CONRED Coordinating Agency for Disaster Reduction
CONUS Continental United States
CSU Colorado State University
CTR Center for Tsunami Research
CVD Color Vision Deficiency
DAAC Distributed Active Archive Center
DARRT Disaster Application Response And Recovery Team
DEM Digital Elevation Model
DFO Dartmouth Flood Observatory
DPM Damage Proxy Map
DR Direct-Readout
DRL Direct Readout Laboratory
EF5 Ensemble Framework for Flash Flood Forecasting
EO Earth Observation
EOS Earth Observing System
ERD Emergency Response Division
ESA European Space Agency
ESPOL Escuela Superior Politecnica del Litoral
______________________________________________________________________________
NASA Earth Science • Applied Sciences Program: Disasters 2020 Annual Summary • 69
ESTO Earth Science Technology Office (NASA)
EUMETSAT European Organization for The Exploitation of Meteorological
Satellites
FAO Food And Agriculture Organization
FBI Federal Bureau of Investigation
FDC Fire Detection and Characterization
FDRS Fire Danger Rating Systems
FEMA Federal Emergency Management Agency
FIRMS Fire Information For Resource Management System
FMI Finnish Meteorological Institute
FPM Flood Proxy Map
FRP Fire Radiative Power
FWI Fire Weather Index
GCOM-W1 Global Change Observation Mission-Water 1
GEER Geotechnical Extreme Events Reconnaissance
GEO Group on Earth Observations
GEOS Goddard Earth Observing System
G-FAST Geodetic-First Approximation of Size And Timing
GFDRR Global Facility for Disaster Reduction and Recovery
GFED Global Fire Emissions Database
GFMS Global Flood Monitoring System
GFRM Global Flood Risk Monitoring
GFWED Global Fire Weather Database
GINA Geographic Information Network of Alaska
GIS Geographic Information System

______________________________________________________________________________
NASA Earth Science • Applied Sciences Program: Disasters 2020 Annual Summary • 70
GISS Goddard Institute for Space Studies
GNSS Global Navigation Satellite System
GOES Geostationary Operational Environmental Satellite
GOFC Global Observations of Forest Cover
GPM Global Precipitation Measurement
GSFC Goddard Space Flight Center
GWIS Global Wildfire Information System
H2O Water vapor
HAQAST Health And Air Quality Applied Sciences Team
HOT OSM Humanitarian Open Street Map
IMERG Integrated Multi-satellite Retrievals for GPM
INAMHI Instituto Nacional de Meteorología e Hidrología
IR Infrared
IRI Institute for Climate and Society
ISRO Indian Space Research Organisation
JAXA Japan Aerospace Exploration Agency
JPL Jet Propulsion Laboratory
JPSS Joint Polar Satellite System
JRC Joint Research Centre
KIT Karlsruhe Institute of Technology
LANCE Land Atmosphere Near real-time Capabilities for EOS
LaRC Langley Research Center
LEO Low Earth Orbit
LHASA Landslide Hazard Assessment for Situational Awareness
LIS Land Information System

______________________________________________________________________________
NASA Earth Science • Applied Sciences Program: Disasters 2020 Annual Summary • 71
MASTER MODIS/ASTER Airborne Simulator
MDA Company formerly known as MacDonald, Dettwiler & Associates
MISR Multi-angle Imaging SpectroRadiometer
MODIS Moderate Resolution Imaging SpectroRadiometer
MoM Model of Models
MOST Marine Oil Spill Thickness
MPA Master of Public Administration
MSFC Marshall Space Flight Center
MSG Meteosat Second Generation
MSRC Marine Spill Response Corporation
MTU Michigan Technological University
NASA National Aeronautics and Space Administration
NESDIS National Environmental Satellite, Data, and Information Service
NGA National Geospatial-Intelligence Agency
NGO Non-Governmental Organization
NISAR NASA-ISRO Synthetic Aperture Radar
NOAA National Oceanic and Atmospheric Administration
NRT Near Real-Time
NWS National Weather Service
OMPS Ozone Mapping and Profiler Suite
OR&R Office Of Response and Restoration
PAGER Prompt Assessment of Global Earthquakes for Response
PDC Pacific Disaster Center
PI Principal Investigator
RMC Rocky Mountain Center

______________________________________________________________________________
NASA Earth Science • Applied Sciences Program: Disasters 2020 Annual Summary • 72
RMS Risk Management Solutions
ROSES Research Opportunities in Space and Earth Science
RTFA Rapid Tsunami Forecast Amplitude
SAB Satellite Applications Branch
SAR Synthetic Aperture Radar
SAROPS SAR Ocean Products System
SARVIEWS A project to developing a fully automatic processing system for SAR
products that support disasters monitoring
SBG Surface Biology and Geology
SEDAC Socioeconomic Data And Applications Center
SERVIR Not an acronym but the name of a global network of regional partners
dedicated to environmental management.
SICA Central American Integration System
SIGMET Significant Meteorological Information
SJSU San Jose State University
SMAP Soil Moisture Active Passive
SMASH Satellite Mapping And Analysis of Severe Hailstorms
SNGRE National Risk and Emergency Management Service – Servicio
Nacional de Gestion de Riesgos y Emergencias
S-NPP Suomi National Polar-orbiting Partnership
SO2 Sulfur dioxide
SOUTHCOM Southern Command
SPA Science Processing Algorithm
SSAI Science Systems and Applications, Inc.
STAR Satellite Applications And Research
SWIR Short-Wave Infrared

______________________________________________________________________________
NASA Earth Science • Applied Sciences Program: Disasters 2020 Annual Summary • 73
TC Tropical Cyclone
TRMM Tropical Rainfall Measuring Mission
TRMM/GPM Tropical Rainfall Measurement Mission / Global Precipitation
Measurement Mission
U.S. United States
UAF University of Alaska Fairbanks
UAVSAR Uninhabited Aerial Vehicle Synthetic Aperture Radar
UC University of Colorado
UCLA University of California, Los Angeles
UN United Nations
UNDP United Nations Development Programme
UNEP United Nations Environment Programme
UNFCCC United Nations Framework Convention on Climate Change
UNOCHA United Nations Office for the Coordination of Humanitarian Affairs
US United States
USA United States of America
USAID United States Agency for International Development
USCG U.S. Coast Guard
USDA United States Department of Agriculture
USDA-FAS United States Department of Agriculture Foreign Agricultural Service
USFS United States Forest Service
USGS United States Geological Survey
USRA Universities Space Research Association
UV Ultraviolet
VAAC Volcanic Ash Advisory Centre
______________________________________________________________________________
NASA Earth Science • Applied Sciences Program: Disasters 2020 Annual Summary • 74
VIIRS Visible Infrared Imaging Radiometer Suite
WF-ABBA Wildfire Automated Biomass Burning Algorithm
WFM RD&A Wildland Fire-Management Research, Development & Application
WFP World Food Program
WMO World Meteorological Organization
WMS Web Map Server
WRF Weather Research and Forecast
WRF-SFIRE Weather Research and Forecast with fire spread model
WTW Willis Towers Watson