disaggregating the bt group asset beta report for … · disaggregating the bt group asset beta ......
TRANSCRIPT
Introduction and Executive Summary
- 1 -
Disaggregating the BT Group
Asset Beta
Report for Sky and TalkTalk
October 2013

Europe Economics is registered in England No. 3477100. Registered offices at Chancery House, 53-64 Chancery Lane, London WC2A 1QU.
Whilst every effort has been made to ensure the accuracy of the information/material contained in this report, Europe Economics assumes no
responsibility for and gives no guarantees, undertakings or warranties concerning the accuracy, completeness or up to date nature of the
information/analysis provided in the report and does not accept any liability whatsoever arising from any errors or omissions © Europe Economics.
All rights reserved. Except for the quotation of short passages for the purpose of criticism or review, no part may be used or reproduced without
permission.

Contents
1 Introduction and Executive Summary ...................................................................................................................... 1
1.1 Introduction ........................................................................................................................................................... 1
1.2 Executive Summary .............................................................................................................................................. 1
1.3 Structure of This Report ..................................................................................................................................... 1
2 Beta Disaggregation in Theory ................................................................................................................................... 3
2.1 Introduction to Beta Disaggregation ................................................................................................................ 3
2.2 Estimating Economic Value ................................................................................................................................. 3
3 Ofcom’s Proposed Approach ..................................................................................................................................... 5
3.1 Ofcom’s Proposal ................................................................................................................................................. 5
3.2 Problems with Weighting using Accounting Asset Values .......................................................................... 5
3.3 Characteristics of Openreach and the Rest of BT ....................................................................................... 8
3.4 Conclusion on Ofcom’s Proposed Approach ................................................................................................ 9
4 Determining Differences in Betas ........................................................................................................................... 11
4.1 Alternative Approaches..................................................................................................................................... 11
4.2 Our Preferred Approach — Greatest Focus upon the Adjusted RAV to EV ..................................... 12
4.3 Inferring the Appropriate Openreach Beta .................................................................................................. 12
4.4 Cross-check of Our Proposed Weighting with Changes in Operating Leverage ............................... 13
5 Conclusion .................................................................................................................................................................... 15
6 Appendix I – Precedent on Beta Disaggregation ................................................................................................. 16
6.1 Disaggregation Precedents ............................................................................................................................... 16
6.2 Conclusions on Disaggregation Precedents ................................................................................................. 19
7 Appendix II – Disaggregating Openreach .............................................................................................................. 20
8 Appendix III – Asset betas and Weights Used or Proposed in Ofcom Determinations ........................... 21
9 Appendix IV – Cross-Check of Our Proposed Weighting with Changes in Operating Leverage .......... 22
9.1 Relationship between Operating Leverage and Beta ................................................................................. 22
9.2 Calculation ............................................................................................................................................................ 22
9.3 Implications for Beta Wedge (2007/8) .......................................................................................................... 23
9.4 Implications for Beta (2013) ............................................................................................................................. 23
10 Appendix V – Asset Betas for Rest of BT at Different Asset Betas for Openreach .................................. 24

Introduction and Executive Summary
- 1 -
1 Introduction and Executive Summary
1.1 Introduction
Ofcom has indicated that it will continue to disaggregate BT Group’s asset beta to estimate the
appropriate asset beta to use in estimating Openreach’s cost of capital.
This report has been commissioned by British Sky Broadcasting Limited (“Sky”) and TalkTalk
Telecom Group Plc (“TalkTalk”) with the purpose of determining an appropriate approach to
disaggregating BT Group’s asset beta.
Ofcom’s proposed approach applies weights to Openreach’s asset beta that are too high, thereby
producing estimates of Openreach’s asset beta that are too high.
This report therefore proposes new weights to apply to Openreach and the Rest of BT in the asset
beta disaggregation exercise.
1.2 Executive Summary
Disaggregation of firms’ asset betas requires assigning weights to individual lines of business such
that the weighted average of their asset betas equals the overall group asset beta. Theory tells us
that the weights should correspond to the relative economic value of each business unit to the
overall group.
Ofcom’s proposed approach is to assign a 50 per cent weighting to Openreach and 50 per cent to
the Rest of BT, based on the relative book values of each business unit’s assets.
This report shows that book values are a poor proxy for economic value where, for one of the
business units, fixed assets are a small proportion of total value — e.g. because intangibles are large.
In such circumstances, relying on book values will lead to underestimation of the weights that
should be applied to the more intangible asset-intensive business unit.
The Rest of BT is more intangible asset-intensive than Openreach. Therefore Ofcom’s book value
approach overestimates the weights attributable to Openreach and hence overestimates the
appropriate disaggregated asset beta for Openreach.
We have considered a range of different enterprise value, asset-based and income-based weightings,
detailed in the report. Considering these in the round, we conclude that even on a highly
conservative basis, a more appropriate weighting would attribute a maximum weight of 40 per cent
(and arguably less — perhaps as little as 30 per cent) to Openreach, and a minimum weight of 60
per cent (and arguably more — perhaps as much as 70 per cent) to the Rest of BT. Using a 60:40
weighting would imply an asset beta for Openreach of 0.57, all else held equal, compared to
Ofcom’s estimate of 0.60.
1.3 Structure of This Report
This report is structured as follows:
Section 2 sets out the relevant theory of beta disaggregation.
Section 3 explains why the 50:50 weighting proposed by Ofcom significantly overestimates the
appropriate weighting attributable to Openreach.

Introduction and Executive Summary
- 2 -
Section 4 sets out our estimates of an appropriate weighting for Openreach’s beta and the
implications for estimates of Openreach’s beta. We also cross-check our results against evidence
from changes in operating leverage.
Section 5 concludes.
This report also includes a number of appendices:
Appendix I considers past precedent for beta disaggregation.
Appendix II outlines our methodology for disaggregating Openreach into the copper access
network business and “the Rest of Openreach”.
Appendix III sets out asset betas, equity betas, and weights used or proposed in Ofcom
determinations.
Appendix IV shows details of the calculation we undertook to cross-check our proposed weighting
with changes in operating leverage.
Appendix V contains possible combinations of asset betas for Openreach and the Rest of BT under
different weighting scenarios.

Beta Disaggregation in Theory
- 3 -
2 Beta Disaggregation in Theory
2.1 Introduction to Beta Disaggregation
The main focus of this report is on certain aspects of the practice of disaggregating asset betas. Here,
we discuss the theory behind such disaggregation.
It is an implication of the Modigliani-Miller theorem that, for any company, business line or project
with both debt and equity, its overall systematic risk is given by its asset beta, which is a weighted
combination of the betas of its equity and debt, where the weights are the economic values of debt
and of equity, as a proportion of the sum of the economic values of debt and equity:
βASSET = (Value of equity)/(Value of equity + Value of Debt)· βEQUITY + (Value of debt)/(Value of equity + Value
of Debt)· βDEBT
In the same way, for a group that comprises two business lines, X and Y, the group-level asset beta will
be a weighted combination of the asset betas of each business line, i.e.
βGROUP = wX· βX + wY · βY
with weights determined by the economic value of the assets in each business line (which we denote
by X and Y for the value in each business line), i.e.
wX = [X / (X + Y)] and wY = [Y / (X + Y)]
A key question addressed in this report is what is the best proxy for assessing the economic value of
Openreach’s copper access network assets (from here, “Openreach”)1, and the economic value of the
assets allocated to BT’s other business operations. The question is relevant because different
approaches for assessing the relative economic value of assets lead to different disaggregation weights,
thus implying different asset betas for the two business operations in question.
For ease of exposition in the remainder of this report we refer to an asset beta as a “beta”.
2.2 Estimating Economic Value
One way to think about economic value is as the net present value of all discounted cash flows an
investor expects to receive from an asset. The net present value of discounted cash flows from an
asset is also the maximum price an investor would be willing to pay to acquire a company.2 A
common proxy for the takeover price of a company is enterprise value (“EV”), which is the sum of the
values of all equity, debt, and preferred stock less cash and cash equivalents.3 Thus, one estimate of a
company’s economic value is its EV.
1 Openreach contains business lines other than the copper access network business. Although our arguments
here pertain to the cost of capital in Openreach’s copper access network business only, we have adopted
Ofcom’s shorthand in referring to Openreach’s copper access network business simply as “Openreach”. 2 Assuming investors are rational and markets are semi-strong efficient, if an investor paid more than the NPV
of discounted cash flows, she would realise a negative return on investment. If she offered to pay less than
the NPV of discounted cash flows, another investor would offer more for the asset until the offer price
converged to the NPV of discounted cash flows. 3 The assumption is that an investor could use cash and cash equivalents to fund the acquisition and thus these
assets should not be included in the takeover price.

Beta Disaggregation in Theory
- 4 -
In the case of BT Group we can observe the EV for BT Group as a whole from its stock market value
and balance sheet. The same is not possible for Openreach and Rest of BT, not least since they are
not separately quoted entities.
However, we can derive a good proxy for the EV of Openreach-copper. Openreach-copper is a price
regulated business. Prices are set (by Ofcom) in such a way that the present value of future profit/cash
flows equal Ofcom’s assessment of the value of the assets (known as the “RAV” – regulatory asset
value). Therefore the Openreach-copper RAV should equal or is a good estimate for the Openreach-
copper EV or economic value. The Openreach-copper RAV is approximately £6.4bn and so we can
derive the appropriate weight for Openreach-copper as 18%.
Since the RAV is a good proxy for the economic value of a company’s regulated business lines and the
EV is the economic value of the company as a whole, RAV for a particular regulated business line
divided by EV is the portion of the company’s economic value attributable to that regulated operation.
Ofcom’s Proposed Approach
- 5 -
3 Ofcom’s Proposed Approach
3.1 Ofcom’s Proposal
In its consultation on the LLU and WLR charge controls for the period April 2014 to March 2017,
Ofcom has proposed to disaggregate BT Group’s beta into betas for Openreach and the Rest of BT, in
line with regulatory practice since 2005.4
Due to recent financial turbulence and movements in the relative risk profiles of Openreach and BT’s
other operations, it is appropriate to consider how the betas of Openreach and the Rest of BT may
have altered over time. For instance, if Openreach has become more similar to other network utilities
than previously considered, or the Rest of BT has become more like other, riskier businesses, then
(for a given BT Group beta) Openreach’s beta would have fallen.
Ofcom considered this issue and adjudged the evidence to be mixed. On this basis, it left the
approach it took in the 2013 Business Connectivity Market Review (“BCMR”) Statement unchanged,
weighting BT Group’s asset beta 50:50 between Openreach and the Rest of BT on a mean capital
employed (“MCE”) basis. Maintaining this approach has meant that the weight attributed to
Openreach has risen over time, from 40 per cent in 20055 to 50 per cent in the 2013 BCMR
Statement, due to growth in Openreach’s relative MCE.
On this basis, and taking the view that Openreach is not significantly less risky than BT Group and the
Rest of BT not significantly more risky, Ofcom has proposed to set Openreach’s asset beta at 0.60,
which is 10 per cent below BT Group’s asset beta (0.67). The proposed asset beta for the Rest of BT
is therefore 0.74, 10 per cent above that of BT Group.
3.2 Problems with Weighting using Accounting Asset Values
There are significant problems with applying asset weights to business lines where physical assets are
not the primary means of delivering economic value. Indeed, as shown in our discussion of precedent
in Appendix 1, the asset-light nature of retail businesses has led Ofwat to move away from a
WACC/RAB approach for its retail price controls.
Although many assets are either physical (such as property, plant, and equipment or inventories) or
can be objectively valued (such as tax credits), firms often make use of ‘intangible assets’6. Intangible
assets include:
brands;
customer networks; and
goodwill.
Brands are a common intangible asset. This is especially true where firms sell commodity products or
close substitutes. The value of a brand is a function of how well the brand can attract or retain
customers and how well the branding signals the value of the firm. Such branding is likely to be
significantly more important in the Rest of BT — containing businesses that sell products with close
4 Ofcom (2013) “Fixed access market reviews: approach to setting LLU and WLR Charge Controls”. 5 Ofcom’s disaggregation of BT’s beta (2005). 6 The International Accounting Standards Board defines intangible assets as “an identifiable non-monetary asset
without physical substance” in Standard 38.

Ofcom’s Proposed Approach
- 6 -
substitutes — than it is in Openreach — a business that sells some products with little or no direct
substitutes.
Another common intangible is a consumer network. A consumer network can act as an asset insofar
as the network facilitates market penetration or expansion. Furthermore, a consumer network can
add value to a business to the extent that consumers in the network are willing to spread awareness
about the company to others.
A third type of intangible asset is goodwill. Goodwill is the premium paid for a company over the
market value of its assets in an acquisition. Conceptually, it can be thought of as the intangible value
acquired from a company upon acquisition and can include traditional intangibles, such as a brand, as
well as the value the acquiring company thinks the acquisition can add to existing business lines. Unlike
some intangibles, goodwill is often listed separately on a company’s balance sheet.
There are two key problems associated with the role of intangible assets when considering firms’
value:
even when intangible assets are valued and included on firms’ balance sheets, such valuations are
subject to considerable uncertainty, and could significantly underestimate the true economic value
of these assets; and
many intangible assets are not included on firms’ balance sheets.
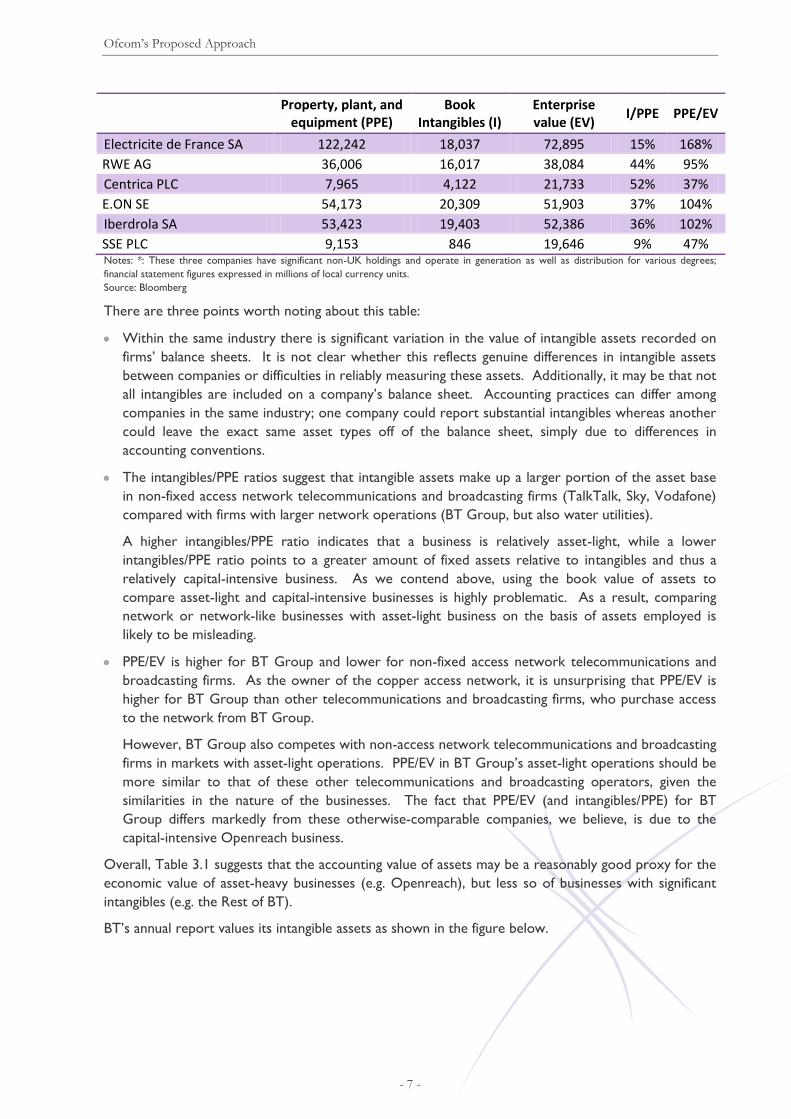
To demonstrate the difficulties of valuing intangible assets, we examine intangibles and other assets as
shown on the balance sheets of companies from a range of industries, comparing them also to the
total EV at traded valuations. This is shown in the table below.
Table 3.1: Comparison of intangible assets across sectors
Property, plant, and
equipment (PPE) Book
Intangibles (I) Enterprise value (EV)
I/PPE PPE/EV
Telecoms and broadcasting
BT Group PLC 14,388 3,127 27,837 22% 52%
TalkTalk Telecom Group PLC
292 682 2,609 234% 11%
British Sky Broadcasting Group PLC
948 1,479 13,663 156% 7%
Vodafone Group PLC 18,655 59,514 103,348 319% 18%
Water
Severn Trent PLC 6,578 161 7,863 2% 84%
Pennon Group PLC 3,084 349 4,384 11% 70%
United Utilities Group PLC 8,645 95 10,126 1% 85%
Transport
Stagecoach Group PLC 962 109 2,306 11% 42%
National Express Group PLC 787 1,263 1,937 160% 41%
Supermarkets
Tesco PLC 25,710 4,618 35,247 18% 73%
J Sainsbury PLC 9,329 160 8,545 2% 109%
WM Morrison Supermarkets PLC
7,943 303 7,652 4% 104%
Marks & Spencer Group PLC
4,790 584 7,956 12% 60%
Electricity and gas
Ofcom’s Proposed Approach
- 7 -
Property, plant, and
equipment (PPE) Book
Intangibles (I) Enterprise value (EV)
I/PPE PPE/EV
Electricite de France SA 122,242 18,037 72,895 15% 168%
RWE AG 36,006 16,017 38,084 44% 95%
Centrica PLC 7,965 4,122 21,733 52% 37%
E.ON SE 54,173 20,309 51,903 37% 104%
Iberdrola SA 53,423 19,403 52,386 36% 102%
SSE PLC 9,153 846 19,646 9% 47% Notes: *: These three companies have significant non-UK holdings and operate in generation as well as distribution for various degrees;
financial statement figures expressed in millions of local currency units.
Source: Bloomberg
There are three points worth noting about this table:
Within the same industry there is significant variation in the value of intangible assets recorded on
firms’ balance sheets. It is not clear whether this reflects genuine differences in intangible assets
between companies or difficulties in reliably measuring these assets. Additionally, it may be that not
all intangibles are included on a company’s balance sheet. Accounting practices can differ among
companies in the same industry; one company could report substantial intangibles whereas another
could leave the exact same asset types off of the balance sheet, simply due to differences in
accounting conventions.
The intangibles/PPE ratios suggest that intangible assets make up a larger portion of the asset base
in non-fixed access network telecommunications and broadcasting firms (TalkTalk, Sky, Vodafone)
compared with firms with larger network operations (BT Group, but also water utilities).
A higher intangibles/PPE ratio indicates that a business is relatively asset-light, while a lower
intangibles/PPE ratio points to a greater amount of fixed assets relative to intangibles and thus a
relatively capital-intensive business. As we contend above, using the book value of assets to
compare asset-light and capital-intensive businesses is highly problematic. As a result, comparing
network or network-like businesses with asset-light business on the basis of assets employed is
likely to be misleading.
PPE/EV is higher for BT Group and lower for non-fixed access network telecommunications and
broadcasting firms. As the owner of the copper access network, it is unsurprising that PPE/EV is
higher for BT Group than other telecommunications and broadcasting firms, who purchase access
to the network from BT Group.
However, BT Group also competes with non-access network telecommunications and broadcasting
firms in markets with asset-light operations. PPE/EV in BT Group’s asset-light operations should be
more similar to that of these other telecommunications and broadcasting operators, given the
similarities in the nature of the businesses. The fact that PPE/EV (and intangibles/PPE) for BT
Group differs markedly from these otherwise-comparable companies, we believe, is due to the
capital-intensive Openreach business.
Overall, Table 3.1 suggests that the accounting value of assets may be a reasonably good proxy for the
economic value of asset-heavy businesses (e.g. Openreach), but less so of businesses with significant
intangibles (e.g. the Rest of BT).
BT’s annual report values its intangible assets as shown in the figure below.

Ofcom’s Proposed Approach
- 8 -
Figure 3.1: Intangible assets included on BT’s balance sheet (2013, £ million)
Source: BT Annual Report 2013 p.126
Accordingly, BT’s customer relationships and brands7, together, are valued, for accounting purposes, at
only £325m. This is not a realistic estimate of the economic value of these assets. For example, BT’s
brand alone has recently been estimated to be worth around £5.6 billion.8 The issue of how to value
customer relationships featured prominently in work done for Ofcom by Oxera in the context of its
assessment of Sky’s profitability.9 It is apparent that if the same approach that Oxera used for valuing
Sky’s subscriber base was applied to that of BT, its value alone would also be substantially greater than
£325m.
Finally, the MCE figure that Ofcom uses to derive its weights includes goodwill, but appears to exclude
other intangible assets. If that is right, there is no plausible reason for such an exclusion.
The correct approach to such problems is to undertake a rigorous analysis that (a) identifies and (b)
values (using an appropriate methodology) BT Group’s intangible assets, and to allocate them among
its different lines of business. It seems relatively clear that, if such an exercise was undertaken, the
result would be a significant increase in the value of capital employed in the Rest of BT, as this is likely
disproportionately to generate value from use of BT Group’s intangible assets.
Undertaking such an exercise in this case, however, is likely to be disproportionate. In the absence of
such an analysis it is necessary to reduce the emphasis placed on weights derived from the value of
assets included on BT Group’s balance sheet, and to consider alternative approaches.
3.3 Characteristics of Openreach and the Rest of BT
To determine the extent to which issues in using accounting value of assets apply to determining
weights for Openreach and the Rest of BT, we examine the differences between these business lines.
BT divides itself into the following key businesses:
7 Brands relate to BT Group’s retail customer relationships, and therefore would not be an asset in
Openreach. 8 See 2013 Brand Z Top 100.
http://www.millwardbrown.com/brandz/2013/Top100/Docs/2013_BrandZ_Top100_Report.pdf 9 Oxera stated: ‘One of the particular characteristics of Sky’s business model that needs to be appropriately
reflected in the profitability analysis is the presence of significant intangible assets, the largest of which is the
subscriber base.’ Annex 3 to Ofcom’s Pay TV Statement, March 2010.
Goodwill, 1,339
Customer
Relationships
and Brands, 325
Telecoms
licenses and
other, 273
Internally
developed
software, 3,091
Purchased
software, 1,178

Ofcom’s Proposed Approach
- 9 -
Openreach — Openreach can be considered to be composed of two parts. Openreach’s copper
access network business sells primarily access network services, such as MPF/SMPF and WLR in the
UK. Other parts of Openreach sell Ethernet leased lines and NGA.
BT Global Services — Global Services offers network IT systems across the world.
BT Retail — BT Retail is BT’s consumer and business facing division, providing telephony and
broadband services, conferencing services, payphones, and other services, and operates in the UK
and ROI. BT Retail also operates BT Vision, BT’s growing retail pay TV business.
BT Wholesale — BT Wholesale provides (largely) wholesale equivalents of retail services to
communications providers, including BT Retail.
This brief overview shows that the asset-heavy, network-like operations are concentrated in
Openreach, confirming our impressions from the previous section.
This is consistent with Ofcom’s recognition that Openreach has “utility-like characteristics”10 and
previous research by Europe Economics. Given that it contains the access network business, and in
view of the above discussion of BT’s other business lines, Openreach as a whole is likely to be capital-
intensive relative to the Rest of BT, and rely to a limited extent on BT Group’s intangible assets. This
is confirmed when capital expenditure by segment of the different business lines is analysed, with
Openreach accounting for around 47 per cent of BT Group’s total capital expenditure in 2013, and
representing a similar proportion in 2012 and 2011.
However, the distribution of revenue across the business lines is very different. Openreach generated
around 22 per cent of BT Group’s revenues in 2013, indicating that this business line had lower
revenues per pound of capex than the Rest of BT. Openreach therefore has a substantially smaller
share of revenues than it does of capex.
Table 3.2: Capex and revenue in BT Group's business lines (per cent of total)
2013 2012
Total Openreach Rest of BT Total Openreach Rest of BT
Capex 47% 53% 41% 59%
Revenue 22% 78% 21% 79% Source: Bloomberg; BT 2013 Regulatory Financial Statements; Europe Economics’ calculations
As Openreach’s copper access network business derives most of its economic value from employing
physical assets, the accounting value of these assets is a reasonable proxy for the value of capital
employed in that business. In contrast, the rest of BT appears to derive more of its value from
intangible assets, which may not be captured by the accounting value and which will be subject to
significant uncertainty.
Thus, as well as being uncertain, the value of the Rest of BT’s assets would also be understated by
using the accounting value.
3.4 Conclusion on Ofcom’s Proposed Approach
Ofcom proposes to weight the BT Group asset beta on an MCE basis, which rests on the accounting
value of assets used in each business line. They contend that the division of capital employed between
Openreach and the Rest of BT justifies a 50:50 weighting between the two business lines.
Constructing weights on the basis of the accounting value of assets is likely to be appropriate if the
business lines are relatively capital-intensive, deriving much of their economic value from their physical
10 Ofcom (2011) “WBA charge control: charge control framework for WBA Market 1 services”, p. 99.

Ofcom’s Proposed Approach
- 10 -
assets. However, this is less obviously the case for businesses with more intangible assets. This is
because intangible assets are inherently more difficult to value and companies may differ materially in
the extent to which they report intangible assets on their balance sheets. Furthermore, comparing
business lines that are capital-intensive to business lines that are asset-light is problematic, given the
difficulties in objectively valuing the assets employed in the latter.
Ratios of the capital-intensity of a business, such as intangibles over PPE or PPE over EV, indicate that
BT Group is more capital-intensive than other telecommunications and broadcasting firms. This is due
to Openreach, the access network-like business line unique to BT Group.
The Rest of BT contains a significantly higher proportion of intangible assets, which are difficult to
objectively value. Moreover, it may be that some intangible assets are excluded from the calculation.
Weights constructed using account values of MCE may therefore overstate the relative contribution of
Openreach to BT Group’s beta and understate that of the Rest of BT.
In the next section, therefore, we consider alternative weightings, such as those based on the RAV,
revenue, EBITDA, or operating income, that may help to inform an improved judgement about the
relative economic values of Openreach and the Rest of BT.
Determining Differences in Betas
- 11 -
4 Determining Differences in Betas
4.1 Alternative Approaches
We have considered a number of alternative measures of economic value to use in deriving the
appropriate weighting for disaggregating BT’s beta. These are:
The ratio of the RAV to EV (with the RAV being used as a proxy for the Openreach-copper EV)11
An adjusted version of the ratio above, to allow for the fact that regulation may consciously allow
scope for outperformance of opex targets and “aims up” on the cost of capital12 – which means
that the economic value might be above the RAV. We have assumed a 10 per cent mark-up on the
RAV for disaggregation purposes.
Revenue
EBITDA
Operating income
Each of these measures will have weaknesses, for example they may be prone to more significant
variation than is the case for accounting values. We note that these may reflect a business’s economic
performance in one year, whereas economic value ought to take into account economic value over the
lifetime of the asset. For example, a business line could incur significant costs and make a loss in its
early years, before turning profitable in its later years; alternatively, the EV of a company could change
drastically in times of extreme market volatility.
As with many regulatory issues in the cost of capital sphere, no single measure is perfect. We
consider that an appropriate approach is to consider a number of different measures of economic
value “in the round”, rather than relying (as Ofcom does) on the book value of assets alone.
However, for reasons we shall explore below, if a single measure were to be used we would
recommend the “adjusted RAV/EV”.
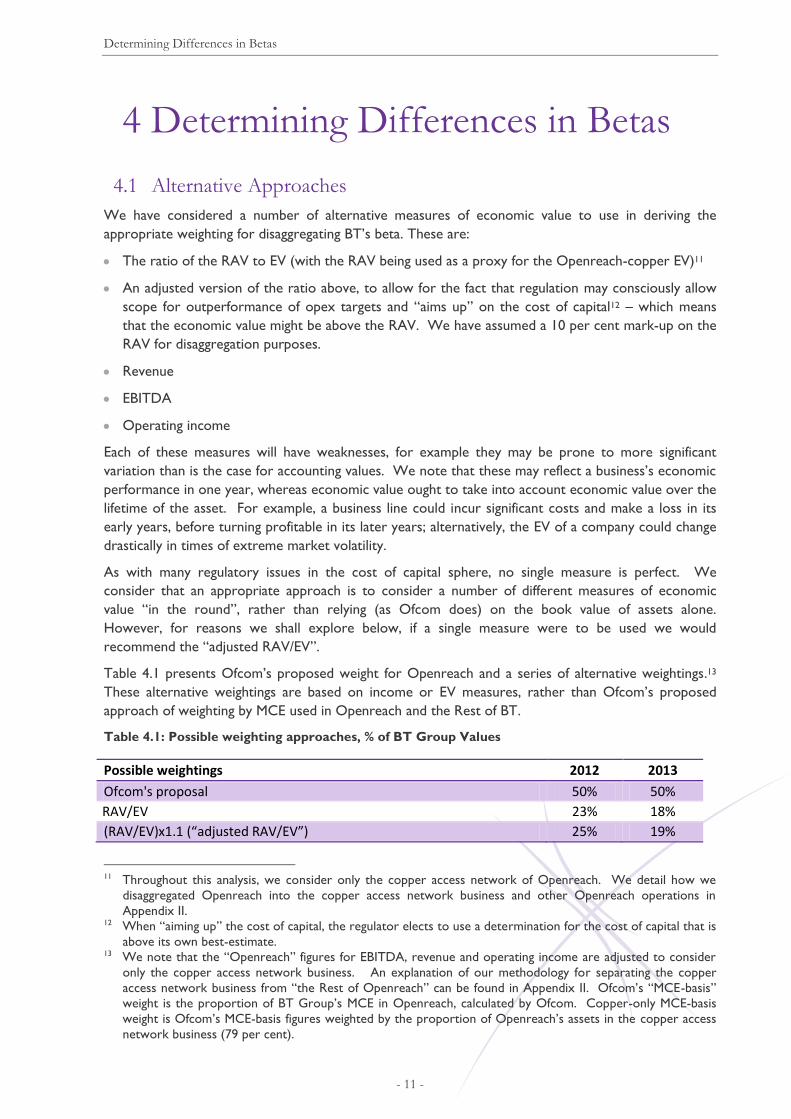
Table 4.1 presents Ofcom’s proposed weight for Openreach and a series of alternative weightings.13
These alternative weightings are based on income or EV measures, rather than Ofcom’s proposed
approach of weighting by MCE used in Openreach and the Rest of BT.
Table 4.1: Possible weighting approaches, % of BT Group Values
Possible weightings 2012 2013
Ofcom's proposal 50% 50%
RAV/EV 23% 18%
(RAV/EV)x1.1 (“adjusted RAV/EV”) 25% 19%
11 Throughout this analysis, we consider only the copper access network of Openreach. We detail how we
disaggregated Openreach into the copper access network business and other Openreach operations in
Appendix II. 12 When “aiming up” the cost of capital, the regulator elects to use a determination for the cost of capital that is
above its own best-estimate. 13 We note that the “Openreach” figures for EBITDA, revenue and operating income are adjusted to consider
only the copper access network business. An explanation of our methodology for separating the copper
access network business from “the Rest of Openreach” can be found in Appendix II. Ofcom’s “MCE-basis”
weight is the proportion of BT Group’s MCE in Openreach, calculated by Ofcom. Copper-only MCE-basis
weight is Ofcom’s MCE-basis figures weighted by the proportion of Openreach’s assets in the copper access
network business (79 per cent).
Determining Differences in Betas
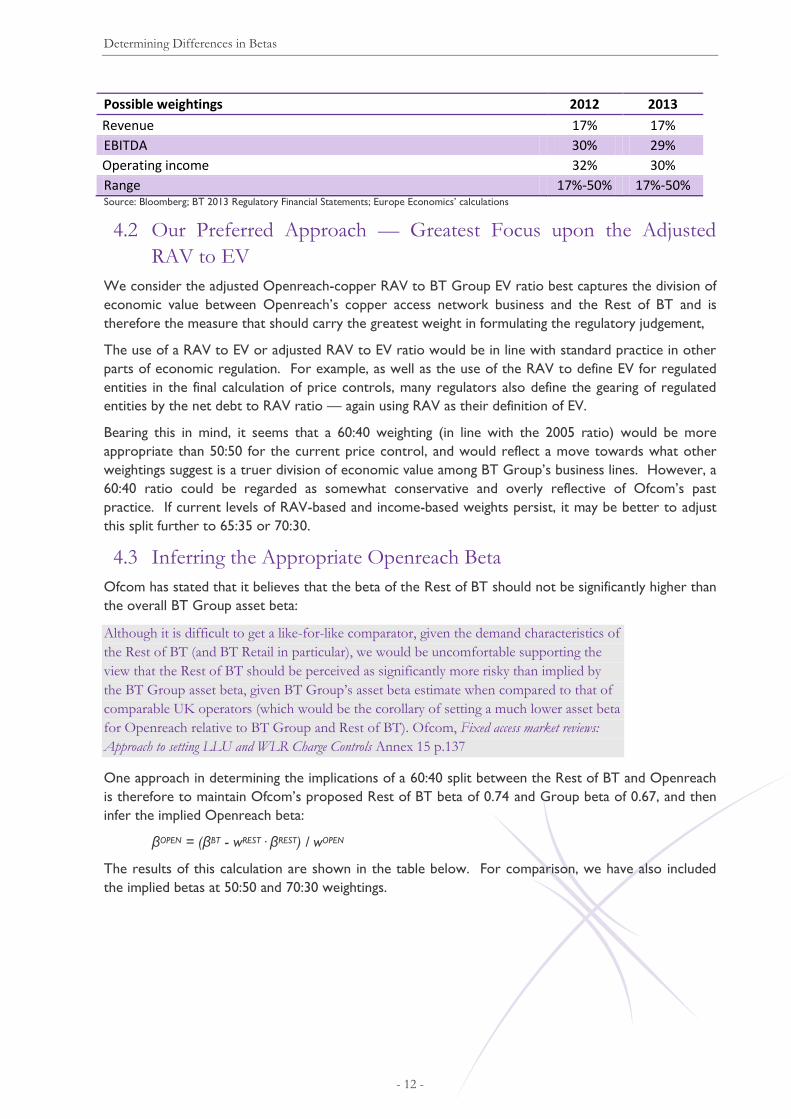
- 12 -
Possible weightings 2012 2013
Revenue 17% 17%
EBITDA 30% 29%
Operating income 32% 30%
Range 17%-50% 17%-50% Source: Bloomberg; BT 2013 Regulatory Financial Statements; Europe Economics’ calculations
4.2 Our Preferred Approach — Greatest Focus upon the Adjusted
RAV to EV
We consider the adjusted Openreach-copper RAV to BT Group EV ratio best captures the division of
economic value between Openreach’s copper access network business and the Rest of BT and is
therefore the measure that should carry the greatest weight in formulating the regulatory judgement,
The use of a RAV to EV or adjusted RAV to EV ratio would be in line with standard practice in other
parts of economic regulation. For example, as well as the use of the RAV to define EV for regulated
entities in the final calculation of price controls, many regulators also define the gearing of regulated
entities by the net debt to RAV ratio — again using RAV as their definition of EV.
Bearing this in mind, it seems that a 60:40 weighting (in line with the 2005 ratio) would be more
appropriate than 50:50 for the current price control, and would reflect a move towards what other
weightings suggest is a truer division of economic value among BT Group’s business lines. However, a
60:40 ratio could be regarded as somewhat conservative and overly reflective of Ofcom’s past
practice. If current levels of RAV-based and income-based weights persist, it may be better to adjust
this split further to 65:35 or 70:30.
4.3 Inferring the Appropriate Openreach Beta
Ofcom has stated that it believes that the beta of the Rest of BT should not be significantly higher than
the overall BT Group asset beta:
Although it is difficult to get a like-for-like comparator, given the demand characteristics of
the Rest of BT (and BT Retail in particular), we would be uncomfortable supporting the
view that the Rest of BT should be perceived as significantly more risky than implied by
the BT Group asset beta, given BT Group’s asset beta estimate when compared to that of
comparable UK operators (which would be the corollary of setting a much lower asset beta
for Openreach relative to BT Group and Rest of BT). Ofcom, Fixed access market reviews:
Approach to setting LLU and WLR Charge Controls Annex 15 p.137
One approach in determining the implications of a 60:40 split between the Rest of BT and Openreach
is therefore to maintain Ofcom’s proposed Rest of BT beta of 0.74 and Group beta of 0.67, and then
infer the implied Openreach beta:
βOPEN = (βBT - wREST· βREST) / wOPEN
The results of this calculation are shown in the table below. For comparison, we have also included
the implied betas at 50:50 and 70:30 weightings.
Determining Differences in Betas
- 13 -
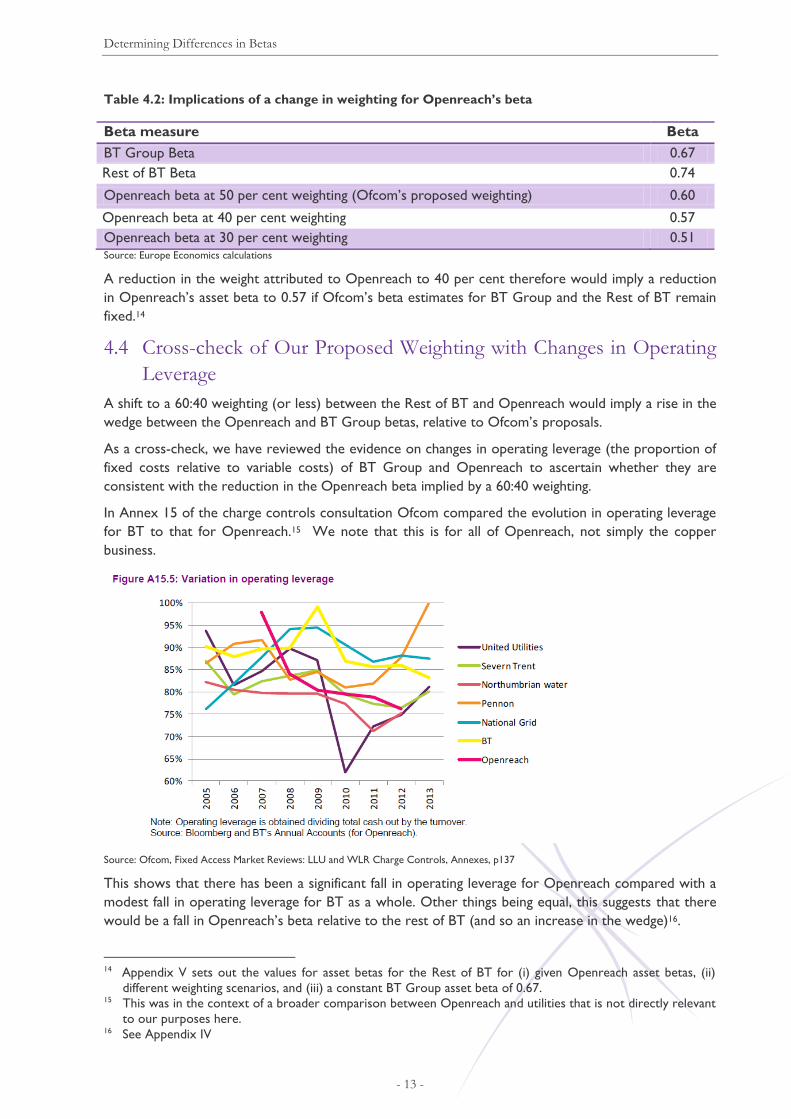
Table 4.2: Implications of a change in weighting for Openreach’s beta
Beta measure Beta
BT Group Beta 0.67
Rest of BT Beta 0.74
Openreach beta at 50 per cent weighting (Ofcom’s proposed weighting) 0.60
Openreach beta at 40 per cent weighting 0.57
Openreach beta at 30 per cent weighting 0.51 Source: Europe Economics calculations
A reduction in the weight attributed to Openreach to 40 per cent therefore would imply a reduction
in Openreach’s asset beta to 0.57 if Ofcom’s beta estimates for BT Group and the Rest of BT remain
fixed.14
4.4 Cross-check of Our Proposed Weighting with Changes in Operating
Leverage
A shift to a 60:40 weighting (or less) between the Rest of BT and Openreach would imply a rise in the
wedge between the Openreach and BT Group betas, relative to Ofcom’s proposals.
As a cross-check, we have reviewed the evidence on changes in operating leverage (the proportion of
fixed costs relative to variable costs) of BT Group and Openreach to ascertain whether they are
consistent with the reduction in the Openreach beta implied by a 60:40 weighting.
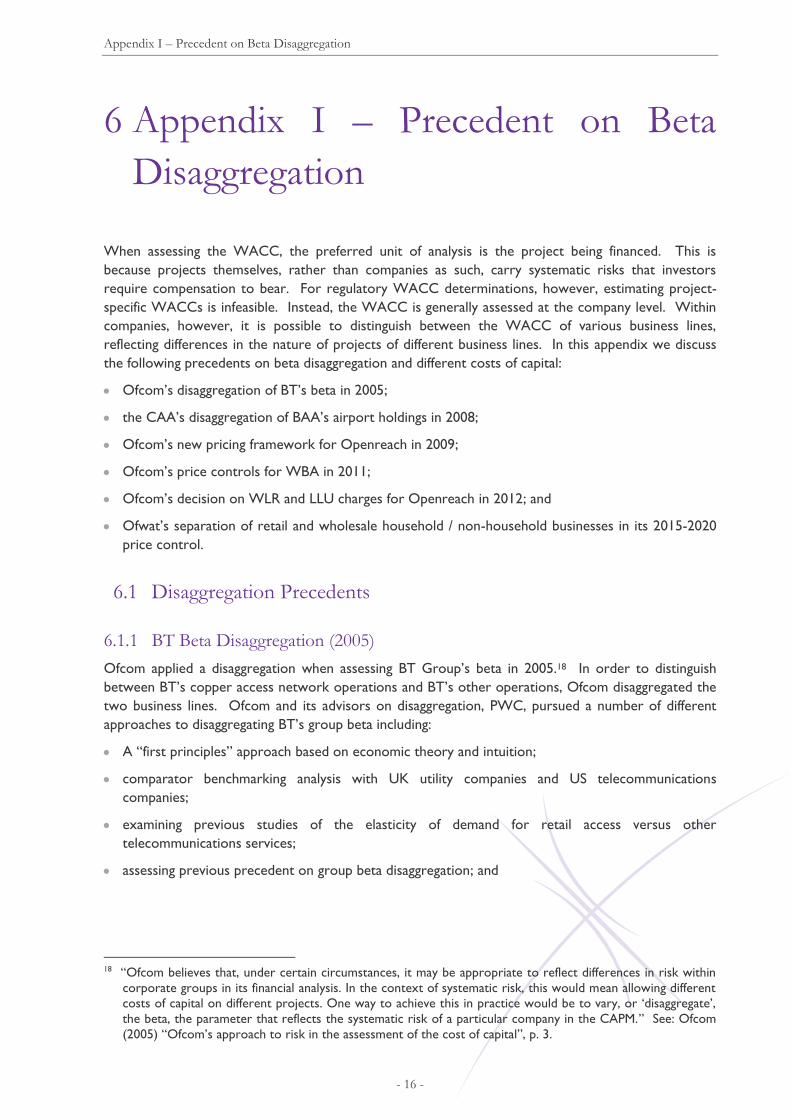
In Annex 15 of the charge controls consultation Ofcom compared the evolution in operating leverage
for BT to that for Openreach.15 We note that this is for all of Openreach, not simply the copper
business.
Source: Ofcom, Fixed Access Market Reviews: LLU and WLR Charge Controls, Annexes, p137
This shows that there has been a significant fall in operating leverage for Openreach compared with a
modest fall in operating leverage for BT as a whole. Other things being equal, this suggests that there
would be a fall in Openreach’s beta relative to the rest of BT (and so an increase in the wedge)16.
14 Appendix V sets out the values for asset betas for the Rest of BT for (i) given Openreach asset betas, (ii)
different weighting scenarios, and (iii) a constant BT Group asset beta of 0.67. 15 This was in the context of a broader comparison between Openreach and utilities that is not directly relevant
to our purposes here. 16 See Appendix IV

Determining Differences in Betas
- 14 -
Our calculations, set out in Appendix IV, show that the fall in relative operating leverage means the
wedge between Openreach and BT Group should have risen from 0.065 originally to 0.096, and that
the wedge between Openreach and the Rest of BT should have risen from 0.13 originally to 0.19.
Given the 2013 Rest of BT beta of 0.74, a rise in the beta wedge between Openreach and the Rest of
BT from 0.13 to 0.19 would imply an Openreach beta of 0.55. This figure is slightly below the 0.57
implied by a 60:40 disaggregation ratio.

Conclusion
- 15 -
5 Conclusion
Ofcom proposes to disaggregate its estimated BT Group asset beta of 0.67 into asset betas for
Openreach and the Rest of BT using a 50:50 weighting based on the book value of MCE in the two
business lines.
This report demonstrates that such an approach is a poor approximation for economic value where
business lines have significant intangible assets. Furthermore, using MCE to compare capital-intensive
and asset-light businesses will likely skew the weighting towards the capital-intensive businesses due to
difficulties in valuing intangibles.
We have considered a number of alternative methods for weighting the BT Group beta between
Openreach and the Rest of BT. Of these, the method most supportable in theory appears to be some
variant of the adjusted RAV to EV.
Taken as a whole, the evidence suggests that the Openreach economic value makes up between 17
and 32 per cent of the BT Group economic value. However, we note that the RAV to EV methods
suggest a figure in the lower part of that range.
We conclude that a ratio of weights for the Rest of BT to Openreach of 60 per cent to 40 per cent
(respectively) — in line with the 2005 weightings — would be more appropriate than Ofcom’s 50:50
proposal. Indeed, if alternative weights (and in particular the RAV to EV) hold at their current levels17,
it may be better to adjust this split further to 65:35 or 70:30.
Using Ofcom’s proposed asset betas of 0.67 for the BT Group and 0.74 for the Rest of BT as given, a
40 per cent weighting for Openreach suggests that Openreach’s asset beta is 0.57. Such a reduction in
beta relative to Ofcom’s proposal is also supported by our analysis of the implications of changes in
operating leverage, which suggests an asset beta of 0.55.
With a gearing of 40 per cent, corporation tax at 20 per cent, and a debt beta of 0.15, a 50:50
weighting results in a pre-tax nominal WACC of 8.8 per cent and pre-tax real WACC of 5.9 per cent
for Openreach.
A weighting of 60 per cent for the Rest of BT and 40 per cent for Openreach’s copper access network
business yields a nominal pre-tax WACC of 8.6 and a real pre-tax WACC of 5.8 for Openreach.
A 70:30 weighting would result in a nominal pre-tax WACC of 8.2 per cent and a real pre-tax WACC
of 5.5 per cent for Openreach.
Table 5.1: Nominal and real pre-tax WACCs for Openreach under different weighting scenarios
Parameters at 60:40 Nominal Real
Parameters at 70:30 Nominal Real
Asset beta 0.57 0.57
Asset beta 0.51 0.51
Equity beta 0.85 0.85
Equity beta 0.75 0.75
Cost of equity 8.4 5.6
Cost of equity 7.9 5.1
Cost of debt 5.8 3.0
Cost of debt 5.8 3.0
WACC 8.6 5.8
WACC 8.2 5.5
Source: Ofcom; Europe Economics’ calculations.
17 We have analysed the RAV/EV ratio from 2007-2013. The ratio was broadly stable over the period, with a
minimum of 18 per cent, a maximum of 30 per cent, and an average of 24 per cent.
Appendix I – Precedent on Beta Disaggregation
- 16 -
6 Appendix I – Precedent on Beta
Disaggregation
When assessing the WACC, the preferred unit of analysis is the project being financed. This is
because projects themselves, rather than companies as such, carry systematic risks that investors
require compensation to bear. For regulatory WACC determinations, however, estimating project-
specific WACCs is infeasible. Instead, the WACC is generally assessed at the company level. Within
companies, however, it is possible to distinguish between the WACC of various business lines,
reflecting differences in the nature of projects of different business lines. In this appendix we discuss
the following precedents on beta disaggregation and different costs of capital:
Ofcom’s disaggregation of BT’s beta in 2005;
the CAA’s disaggregation of BAA’s airport holdings in 2008;
Ofcom’s new pricing framework for Openreach in 2009;
Ofcom’s price controls for WBA in 2011;
Ofcom’s decision on WLR and LLU charges for Openreach in 2012; and
Ofwat’s separation of retail and wholesale household / non-household businesses in its 2015-2020
price control.
6.1 Disaggregation Precedents
6.1.1 BT Beta Disaggregation (2005)
Ofcom applied a disaggregation when assessing BT Group’s beta in 2005.18 In order to distinguish
between BT’s copper access network operations and BT’s other operations, Ofcom disaggregated the
two business lines. Ofcom and its advisors on disaggregation, PWC, pursued a number of different
approaches to disaggregating BT’s group beta including:
A “first principles” approach based on economic theory and intuition;
comparator benchmarking analysis with UK utility companies and US telecommunications
companies;
examining previous studies of the elasticity of demand for retail access versus other
telecommunications services;
assessing previous precedent on group beta disaggregation; and
18 “Ofcom believes that, under certain circumstances, it may be appropriate to reflect differences in risk within
corporate groups in its financial analysis. In the context of systematic risk, this would mean allowing different
costs of capital on different projects. One way to achieve this in practice would be to vary, or ‘disaggregate’,
the beta, the parameter that reflects the systematic risk of a particular company in the CAPM.” See: Ofcom
(2005) “Ofcom’s approach to risk in the assessment of the cost of capital”, p. 3.

Appendix I – Precedent on Beta Disaggregation
- 17 -
cross-sectional (UK and foreign telecommunications companies) and time series (BT-only)
regression.19
These analyses produced a variety of estimates for BT Group’s beta and business line disaggregations.
After weighing the evidence and considering responses from stakeholders, Ofcom determined that
there was sufficient evidence to support disaggregation of the BT Group beta.
Ofcom settled on an access-only beta of 0.920, a BT Group beta of 1.1, and a 40:60 weighting between
access and the Rest of BT. On the basis of these figures, Ofcom determined that the Rest of BT beta
was 1.23.
6.1.2 CAA Determination for Heathrow and Gatwick (2008)
In 2008, the CAA issued its final determination on price controls for regulated airports covering the
period 2008 to 2013.21 At the time, Heathrow, Gatwick, and Stansted were owned by BAA. Thus,
when determining the WACC for each airport, the CAA had to disaggregate BAA’s group beta into
separate betas for its airport holdings.22
In estimating the WACC, the CAA took advice from the Competition Commission (CC).23 The CC’s
approach to disaggregating the WACC was to:
Step 1 – Estimate a group asset beta for BAA prior to its 2006 delisting;
Step 2 – Disaggregate BAA’s group beta into Heathrow, Gatwick, and other activities;
Step 3 – Compare the asset beta estimates obtained with estimates for other companies, as a
sense-check; and
Step 4 – Re-lever the asset betas with a notional gearing figure (60 per cent) to obtain
disaggregated equity betas.
Although BAA argued that the CC should give more weight to international comparator precedent
than to estimates from BAA equity prices, the CC disagreed, contending that factors unique to the UK
and its regulatory environment made international comparisons too uncertain to be robust. Instead,
comparison with international peers served only as a sense-check on disaggregated BAA beta
estimates from BAA’s data.24
The CC disaggregated BAA’s beta by considering the BAA group beta as the sum of the Heathrow,
Gatwick, and other operations betas, weighted by asset value. Furthermore, the CC considered
evidence on the relative riskiness of Heathrow versus Gatwick and argued that the former was less
exposed to systematic risk than the latter. Although BAA argued that the difference between
Gatwick’s beta and Heathrow’s beta should be 0.3, the CC contended that 0.5 was the appropriate
differential. This final beta figures used by the CC were:
Heathrow – 0.47 with a standard error of 0.025;
Gatwick – 0.52 with a standard error of 0.03; and
Other operations – 0.61;
19 Ofcom (2005) “Ofcom’s approach to risk in the assessment of the cost of capital”, p. 80-81. 20 This was close to Ofcom’s analysis of US local exchange carriers and evidence submitted by Cable &
Wireless. See: Ofcom (2005) “Ofcom’s approach to risk in the assessment of the cost of capital”, p. 82. 21 CAA (2008) “Economic regulation of Heathrow and Gatwick airports 2008-2013”. 22 We discuss here the Heathrow and Gatwick determination as these were considered jointly. 23 Competition Commission (2007) “BAA Ltd - a report on the economic regulation of the London airports
companies (Heathrow Airport Ltd and Gatwick Airport Ltd) – appendix F – cost of capital”. 24 We note that this is in contrast to Ofcom’s disaggregation of Openreach which, by virtue of Openreach’s
unique monopoly status in the UK, relies heavily on international comparators.

Appendix I – Precedent on Beta Disaggregation
- 18 -
In the end, the CAA used the CC’s recommendations. It held all WACC parameters constant
between Heathrow and Gatwick but for the asset beta, in order to reflect the two airports’ different
exposure to systematic risk.
6.1.3 Ofcom on a New Pricing Framework for Openreach (2009)
In its 2009 local loop unbundling (“LLU”) services price determination for BT Group and Openreach,
Ofcom again elected to disaggregate BT Group’s beta into Openreach and other operations.25 Ofcom
commissioned The Brattle Group to compare betas of other network utilities with Ofcom’s proposed
beta for Openreach.26 On the basis of Ofcom’s analysis and evidence presented by The Brattle Group,
Ofcom concluded that Openreach’s equity beta likely lay 0.1 lower than BT Group’s equity beta.
Ofcom determined that BT Group’s equity beta was 0.86, giving Openreach an equity beta of 0.76.
These betas were lower than those used in the 2005 determination, which were 1.1 for BT Group and
0.9 for Openreach (implying a difference of 0.2 between the betas).
The division of BT Group’s equity beta between Openreach and other operations changed compared
with the 2005 determination. Whereas the 2005 determination divided BT Group’s beta according to
a 40:60 split between Openreach (called “access operations”) and the Rest of BT, the 2009
determination applied a 50:50 weighting. As with 2005, the weighting was determined on a mean
capital employed basis, suggesting that mean capital employed in Openreach had risen relative to the
Rest of BT.
6.1.4 Ofcom on BT WBA Charge Controls (2011)
In 2011, Ofcom issued its determination on price controls for BT’s wholesale broadband access
(“WBA”) business.27 In disaggregating BT Group’s beta into Openreach and the Rest of BT, it was not
clear whether WBA was more similar to Openreach’s copper access network business or to other
operations in the Rest of BT.
In previous determinations, BT’s copper access business was assessed to have less exposure to
systematic risk and, consequently, a lower asset beta than the Rest of BT. Arguments for treating
WBA similar to the copper access network business centred on the similarities between WBA and
network utilities more generally. Ofcom, however, opted to treat WBA as more similar to the Rest of
BT for price regulation purposes. It noted that WBA is in general more correlated with the economic
cycle than the copper access network business, meaning WBA has higher exposure to systematic risk.
Ofcom justified the decision by contending:
“the ability of customers to switch to different packages whilst retaining a broadband service;
the levels of broadband penetration;
empirical evidence such as econometric studies; and
evidence from BT on WBA volumes and BT forecasts for WBA services”28
all pointed to WBA being comparable with the Rest of BT’s operations. As in the 2009 decision, the
BT Group beta was split 50:50 between Openreach and BT’s other operations on a mean capital
employed basis.
25 Ofcom (2009) “A new pricing framework for Openreach: annexes”. 26 The Brattle Group (2009) “Equity beta estimates of comparator companies”. 27 Ofcom (2011) “WBA charge control: charge control framework for WBA Market 1 services”. 28 Ibid., p. 131.

Appendix I – Precedent on Beta Disaggregation
- 19 -
6.1.5 Ofcom on BT WLR and LLU Charge Controls (2012)
In 2012, Ofcom published its final determination on price controls for BT’s wholesale line rental
(“WLR”) and LLU businesses.29 The decision was based largely on evidence considered in the 2011
WBA price determination. Ofcom considered more recent data and whether financial market
conditions had changed enough to justify adjusting parameters from the WBA decision, issued only
one year earlier. After assessing evidence, Ofcom considered it appropriate to maintain the same
WACC estimates from the 2011 WBA decision for the WLR and LLU decision. The final WACC
figure applied to the WLR and LLU price controls was that estimated for Openreach (as opposed to
the Rest of BT) in the 2011 WBA decision. Additionally, Ofcom maintained the 50:50 split of BT
Group’s beta between Openreach and the Rest of BT, based on the mean capital employed in the two
business lines.
6.1.6 Ofwat on Separate Retail and Wholesale Price Controls (2015-2020)
From 2015, Ofwat will depart from its current regulatory model of applying a single company-wide
price control for each of the water or water and sewerage companies that it regulates, and instead
impose a separate binding price control on each of four business areas: wholesale water, wholesale
wastewater, retail household and retail non-household. Ofwat will continue to determine allowed
returns in the wholesale businesses by applying a WACC to the regulatory capital value (RCV) in each
business line, although all current assets, including those in retail businesses, will be assigned to the
wholesale RCV. For the asset-light retail business lines, Ofwat determined that a WACC/RCV was
inappropriate. Instead, it opted to determine retail price controls on the basis of (adjusted) average
cost to serve, with the inclusion of a net margin to remunerate capital.
6.2 Conclusions on Disaggregation Precedents
A review of the precedents on beta disaggregation in regulated industries highlights some important
points. Unlike the broadly-accepted WACC/CAPM approach to determining a company’s efficient
cost of capital, methodologies underpinning beta disaggregation remain subject to dispute. Ofcom
itself recognises this fact, commenting that “the process of disaggregation of equity betas is not an
exact science”.30 Given the uncertainty surrounding beta disaggregation, Ofcom and other regulators
have preferred to employ a number of alternative disaggregation methodologies and compare resulting
disaggregation estimates to arrive at a final figure.
Similarly, the breakdown of a group asset beta between business lines is not straightforward. Ofcom
has previously used an asset basis (MCE) to weight Openreach and other BT operations in BT Group’s
beta. Likewise, the CC weighted BAA’s group beta on an asset basis.
But, considering the ambiguity in the appropriate disaggregation methodology, other weightings may be
more appropriate. This is particularly true where there are different asset features — such as long-
term assets and fixed capital versus current assets and intangibles — associated with the capital
employed in different business lines. We believe that the uncertainty characterising the beta
disaggregation process requires a consideration of the appropriate weighting of different business lines
in the group beta.
29 Ofcom (2012) “Charge control review for LLU and WLR services: annexes”. 30 Ofcom (2009) “A new pricing framework for Openreach: annexes”, p. 165.

Appendix II – Disaggregating Openreach
- 20 -
7 Appendix II – Disaggregating
Openreach
In this paper we have disaggregated Openreach into the Openreach copper access network business
and the Rest of Openreach. We explain our disaggregation methodology below.
First, we used information from BT’s 2013 regulatory financial statements to determine the MCE and
revenues in Openreach.31 Information on MCE is available in Section 10.3 for 2013 and Section 10.4
for 2012. Openreach’s business lines considered under this price control are:
Wholesale analogue exchange line services;
Wholesale ISDN2 exchange line services;
Wholesale local access; and
LLU services contained under “Other Openreach Markets & Activities (with no SMP reporting
obligations)”
To determine the portion of MCE in this final category attributable to activities covered under this
price control, we used information on revenues from the category contained in Section 10.1 and
Section 10.2. We assumed revenue from internal LLU services and total external revenue in this
category are under the scope of this price control. In 2013, 42 per cent of revenues in the “Other
Openreach Markets & Activities (with no SMP reporting obligations)” category came from internal
LLU services and external revenue, while 47 per cent came from these activities in 2012. We used
these proportions to determine MCE attributable to the copper access network business.
Following that, we assessed the MCE in Openreach’s business lines covered by this price control as a
proportion of total MCE. We use this as a proxy for the copper access network business as a
proportion of Openreach. We estimate that the copper business comprised about 77 per cent of
Openreach in 2013 and 79 per cent in 2012. The table below details our calculations.
Table 7.1: Estimation of Openreach copper access network MCE
Mean capital employed
(£m), 2013 Mean capital employed
(£m), 2012
W/S analogue exchange line services 6,441 6,918 W/S ISDN2 exchange line services 235 244
W/S local access 2,520 2,101
Other Openreach market operations 1,060* 1,110**
Total copper-network MCE 10,256 10,373
Total MCE 13,251 13,182
Copper MCE/Total MCE 77% 79% Notes: *: represents 42 per cent of category MCE; **: represents 47 per cent of category MCE
Source: BT 2013 Regulatory Financial Statements; Europe Economics’ calculations
Figures on opex, revenues, EBITDA, and operating income come from BT statutory financial
statements. When using figures on Openreach, we weight the figures by MCE in the copper business
as a per cent of total MCE in Openreach. We include the remaining Openreach figures in “the Rest of
BT”.
31 The 2013 regulatory financial statements are available here:
http://www.btplc.com/Thegroup/RegulatoryandPublicaffairs/Financialstatements/2013/CurrentCostFinancialStatem
ents2013.pdf.

Appendix III – Asset betas and Weights Used or Proposed in Ofcom Determinations
- 21 -
8 Appendix III – Asset betas and
Weights Used or Proposed in Ofcom
Determinations
The table below shows asset betas, equity betas, and weights Ofcom has used or proposes to use in
various price determinations. In general, betas used for both Openreach and the Rest of BT have
fallen since 2005 with the exception of the most recent determination, where the proposed betas have
risen. The weighting between the Rest of BT and Openreach in 2005 was 60:40. In subsequent
determinations, the weights have shifted to 50:50. Ofcom defended this shift in 2009 by arguing that
“Openreach is now a larger proportion of BT Group (as measured by mean capital employed) than it
was in 2005, having increased from around 40 per cent in 2004 to around 50 per cent in 2007 and
2008.”32
Table 8.1 Asset betas, equity betas, and weights used or proposed in Ofcom determinations
Determination Openreach Rest of BT BT
Group Wedge
Wedge
as % of
BT
Group
beta
Asset beta Weight Asset beta Weight Asset beta
Ofcom’s disaggregation of BT’s beta (2005)*
0.59 40 0.80 60 0.72 0.21 30%
A new pricing framework for Openreach (2009)
0.55 50 0.68 50 0.61 0.13 21%
Charge control framework for WBA Market 1 services (2011)
0.48 50 0.58 50 0.53 0.1 19%
Fixed access market reviews: approach to setting LLU and WLR charge controls (2013)**
0.6 50 0.74 50 0.67 0.14 21%
Notes: *: “Higher gearing” figure chosen, where gearing was at 35%; **: proposed weights
Source: Ofcom
32 Ofcom (2009) “A new pricing framework for Openreach: annexes”, p. 166.

Appendix IV – Cross-Check of Our Proposed Weighting with Changes in Operating Leverage
- 22 -
9 Appendix IV – Cross-Check of Our
Proposed Weighting with Changes in
Operating Leverage
9.1 Relationship between Operating Leverage and Beta
A firm’s operating leverage refers to the level of its fixed costs relative to variable costs. To see how
this relates to beta, first note that the present value of an asset is equal to the present value of
revenues, less the present values of fixed and variable costs:
NPV(asset) = NPV(revenue) – NPV(fixed costs) – NPV(variable costs)
This can also be expressed with respect to the present value of revenue:
NPV(revenue) = NPV(asset) + NPV(fixed costs) + NPV(variable costs)
Given this expression, the beta of the present value of the asset’s revenue (as distinct from the beta of
the present value of the asset itself) can then be expressed as
βREV = [NPV(asset) / NPV(revenue)]· βASSET + [NPV(fixed costs) / NPV(revenue)]· βFIXED
+ [NPV(variable costs) / NPV(revenue)]· βVARIABLE
By definition, the beta of fixed costs should be approximately zero, while the betas of revenue and
variable costs should be approximately equal as they both change in response to output. Noting these,
and rearranging the above expression implies
βASSET = βREV· (1 + [NPV(fixed costs) / NPV(asset)])
This states, therefore, that firms with a high ratio of fixed costs to asset value have higher asset betas.
9.2 Calculation
We estimate the impact of this change in relevant operating leverage for BT and Openreach using the
following procedure.33 We emphasize that the procedure is focused upon how the change in
operating leverage should have been assumed to affect a business like that of BT as of the start of the
period, in 2007/8. Elsewhere, we consider the implications for BT’s current business.
We assume an asset beta, for the purposes of this illustrative calculation, of 0.4875 for Openreach
and 0.5525 for BT Group, implying 0.6175 for the Rest of BT. These were calculated from Ofcom’s
estimates of the equity beta as at May 2008, drawn from a 2009 Ofcom consultation document.34
33 Throughout this report we have preferred, where possible, to disaggregate Openreach into the copper
access network and “the Rest of Openreach”. For this analysis, we use figures for Openreach as a whole.
Adjusting according to the proportion of Openreach that is in the copper access network business would
make no difference as one would simply multiply the numerator and the denominator in the operating
leverage fraction by the same number. Thus, this analysis applies to Openreach’s copper access network
business as much as it does to Openreach as a whole. 34 Ofcom (2009) “A new pricing framework for Openreach Annex 8”, p.176. Note that we use the midpoint of
Ofcom’s proposed range.
Appendix IV – Cross-Check of Our Proposed Weighting with Changes in Operating Leverage
- 23 -
We assume an asset value of £9.150bn for Openreach and £29.352bn for BT Group, drawn from
BT’s accounts as for 31 March 2008. Similarly, we assume revenue of £5.266bn for Openreach and
£20.704bn, on the same basis.
We assume these same values apply for 2007, the first year Openreach’s operating leverage is
calculated by Ofcom in Figure A15.5.
We take values of 97.5 per cent of turnover for the Openreach operating leverage, and 90 per cent
for the BT Group operating leverage, drawn from Figure A15.5. That implies Openreach has a
fixed costs proxy of £5.134bn (97.5 per cent of £5.266bn) and BT Group a fixed costs proxy of
£18.634bn (90 per cent of £20.704bn).
Using these data and the formulae from our theoretical discussion above35, we estimate revenue
betas of 0.31 for Openreach and 0.34 for BT Group.
Next, we consider the impact of falls in operating leverage. In Figure A15.5 the Openreach
operating leverage drops to around 76 per cent and that for BT Group to around 86 per cent. If
we assume invariant turnover, that implies falls in fixed costs proxies to £4.002bn for Openreach
and £17.805bn for BT Group. Using these, unchanged asset values and the revenue betas
previously calculated, we can apply our key formula36 to obtain a new asset beta of 0.449 for
Openreach and 0.543 for BT Group.
We are interested principally in how changed relative asset betas change the wedge between BT
Group, Openreach, and the Rest of BT, rather than in asset beta impacts per se. Hence we re-
scale our final answers so that the BT Group asset beta is the same as originally — i.e. 0.5525.
That produces an asset beta of 0.457 for Openreach and 0.648 for the Rest of BT.
9.3 Implications for Beta Wedge (2007/8)
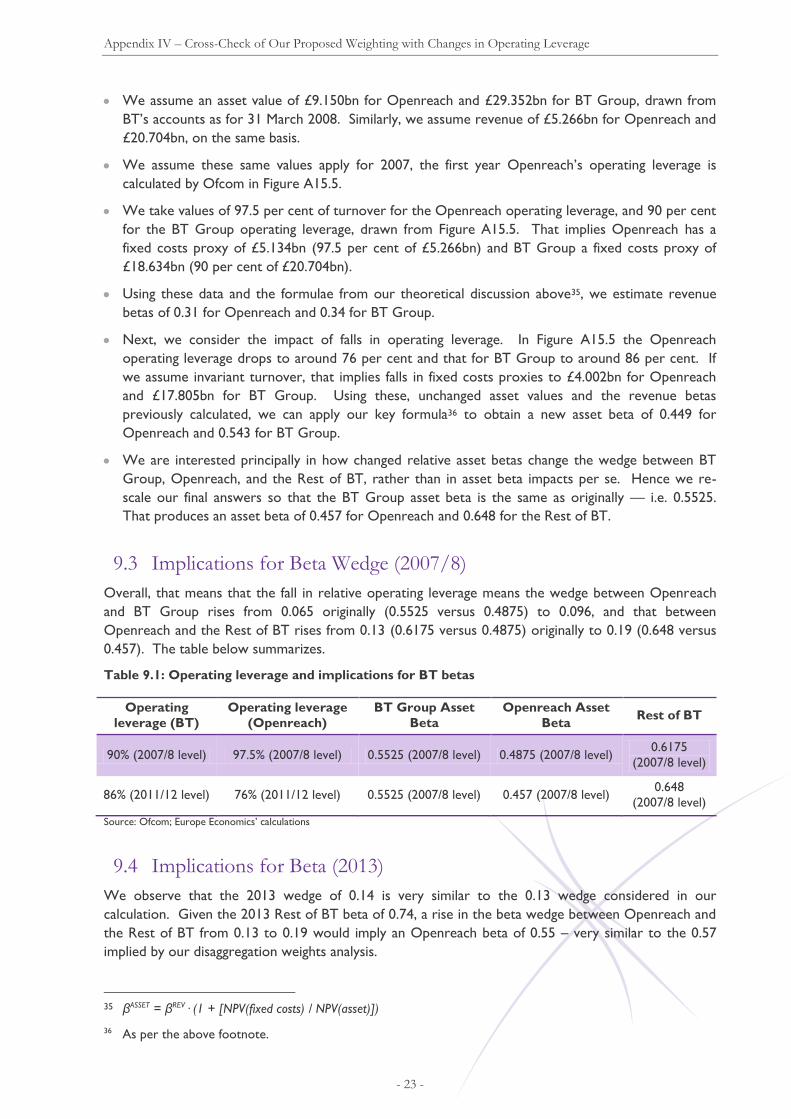
Overall, that means that the fall in relative operating leverage means the wedge between Openreach
and BT Group rises from 0.065 originally (0.5525 versus 0.4875) to 0.096, and that between
Openreach and the Rest of BT rises from 0.13 (0.6175 versus 0.4875) originally to 0.19 (0.648 versus
0.457). The table below summarizes.
Table 9.1: Operating leverage and implications for BT betas
Operating
leverage (BT)
Operating leverage
(Openreach)
BT Group Asset
Beta
Openreach Asset
Beta Rest of BT
90% (2007/8 level) 97.5% (2007/8 level) 0.5525 (2007/8 level) 0.4875 (2007/8 level) 0.6175
(2007/8 level)
86% (2011/12 level) 76% (2011/12 level) 0.5525 (2007/8 level) 0.457 (2007/8 level) 0.648
(2007/8 level)
Source: Ofcom; Europe Economics’ calculations
9.4 Implications for Beta (2013)
We observe that the 2013 wedge of 0.14 is very similar to the 0.13 wedge considered in our
calculation. Given the 2013 Rest of BT beta of 0.74, a rise in the beta wedge between Openreach and
the Rest of BT from 0.13 to 0.19 would imply an Openreach beta of 0.55 – very similar to the 0.57
implied by our disaggregation weights analysis.
35 βASSET = βREV· (1 + [NPV(fixed costs) / NPV(asset)])
36 As per the above footnote.
Appendix V – Asset Betas for Rest of BT at Different Asset Betas for Openreach
- 24 -
10 Appendix V – Asset Betas for Rest
of BT at Different Asset Betas for
Openreach
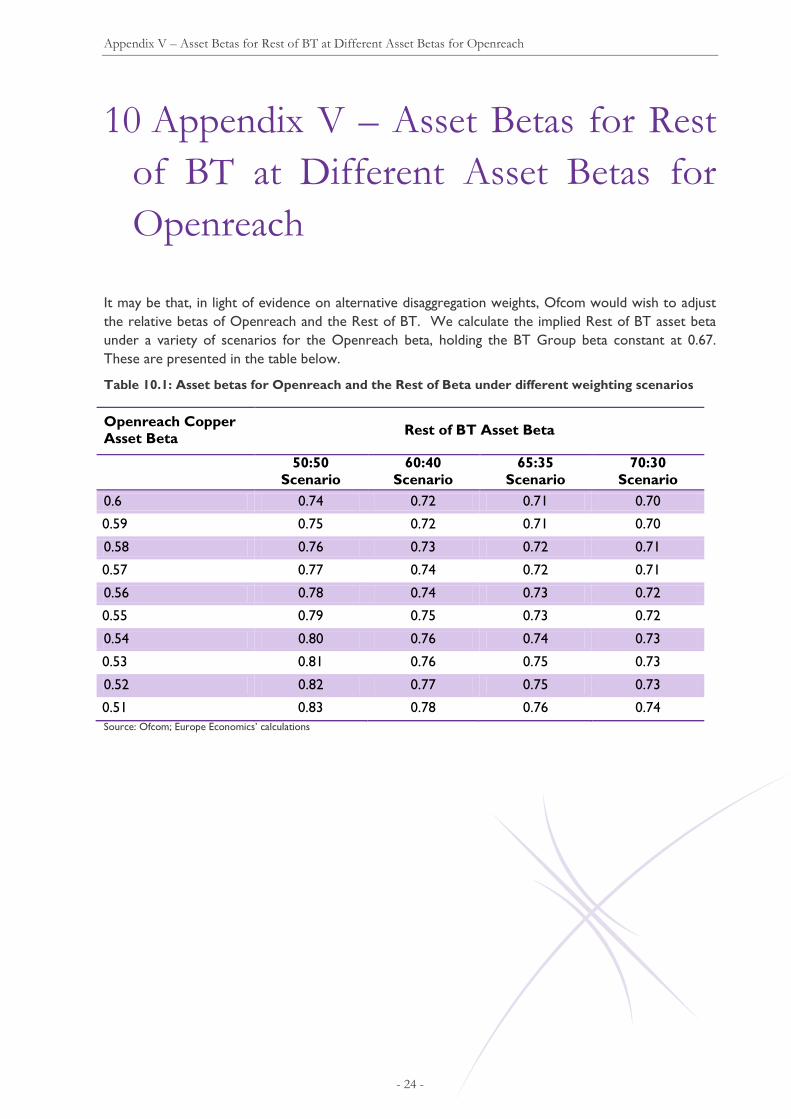
It may be that, in light of evidence on alternative disaggregation weights, Ofcom would wish to adjust
the relative betas of Openreach and the Rest of BT. We calculate the implied Rest of BT asset beta
under a variety of scenarios for the Openreach beta, holding the BT Group beta constant at 0.67.
These are presented in the table below.
Table 10.1: Asset betas for Openreach and the Rest of Beta under different weighting scenarios
Openreach Copper
Asset Beta Rest of BT Asset Beta
50:50
Scenario
60:40
Scenario
65:35
Scenario
70:30
Scenario
0.6 0.74 0.72 0.71 0.70
0.59 0.75 0.72 0.71 0.70
0.58 0.76 0.73 0.72 0.71
0.57 0.77 0.74 0.72 0.71
0.56 0.78 0.74 0.73 0.72
0.55 0.79 0.75 0.73 0.72
0.54 0.80 0.76 0.74 0.73
0.53 0.81 0.76 0.75 0.73
0.52 0.82 0.77 0.75 0.73
0.51 0.83 0.78 0.76 0.74
Source: Ofcom; Europe Economics’ calculations

Error! No text of specified style in document.
- 25 -