disability statistics in myanmar - unsd — welcome to … disability statistics in the context of...
TRANSCRIPT
Improving Disability Statistics in the
context of the 2030 Agenda for Sustainable Development
Disability Statistics in
Myanmar Highlight from 2014 Population &
Housing Census
9 March 2017, 01:15 -02:30 pm
Venue: Conference Room 7
United Nations Headquarters, New York

Contents:
Background: Country context
Source of Disability Statistics in Myanmar
Disability Statistics from Census
Opportunities and Constraints of Census
for producing disability statistics
Background: country context
Government of Myanmar made strong
commitments to support PWD, especially over
the past decade.
2008: Constitution of the Republic of the Union of
Myanmar: “the Union shall care for mothers and
children, orphans, fallen Defence Services personnel’s
children, the aged and the disabled’ (Article 32).
2010: National Plan of Action for PWD 2010-2012
2011: Myanmar ratified the CRPD
2011: Committed to Bali Declaration on the
Enhancement of the Role and Participation of the PWD
in ASEAN Community and Mobilization Framework of
the ASEAN Decade of PWD 2011-2020.
2012: Committed to the Asia and Pacific Decade of
PWD, 2013-2020 & the 2012 Incheon Strategy to
‘Make the Right Real’
2014: National Social Protection Strategic Plan:
Identified PWD “are among the most vulnerable and
marginalized groups, and they face specific risks and
vulnerabilities” (page 52)
2015: Law on Rights of PWD
Indirectly through other social policies, e.g. child
The inclusion of four questions on disability in the 2014
Census served the need to gather information for
policy development for disabled persons.
Background: country context

Source of Statistics on Disability
The first ever survey of persons with disabilities in
Myanmar was carried out in 2009 and 2010 with a large
sample size of 108,000 HHs in 120 Townships across
the 15 States/Regions of the country.
Results - disability prevalence of 2.3%
This study used, “the Myanmar perspective” and the
definition of persons with disabilities was “an individual
who is limited in function and/or ability to conduct
activities in daily living and to participate in society due
to physical, seeing, hearing and intellectual or learning
impairment”
Highly localized definition and hence, its capability for
international comparison is limited.
Representativeness of the study sample remains
uncertain.

In 2010, UNICEF in collaboration with the Department of
Social Welfare, did a situation analysis on the living
condition of children with a disability in Myanmar.
The aim - to identify ‘the barriers created by society and
the physical environment that prevent a child with
disabilities from enjoying its human rights’.
2,547 households in 28 townships.
1,271 HHs had children with disabilities and 1,276 HHs
with children without disabilities.
Case studies on the prevalence of disability were done in
five townships, 3 in Mon State, one in Yangon Region
and one in Rakhie State
The study used the six domains of activities of the
Washington Group.
Source of Statistics on Disability

Source of statistics on disability
The 2014 Myanmar Population and Housing
Census (provides the first nationally
representative situation of disability, as well as
baseline information for monitoring the progress
on the implementation of national and
international development frameworks on
disability.)
the Labour Force, Child Labour and School To
Work Transition Survey 2015 conducted by
ILO.

Disability in Census
Short set of 4 questions on
disability for Census
developed by the WG
there are some limitations
for analysis as the
remaining two - self-care
and communicating
Levels of disability
No disability: ‘all domains coded as ‘no difficulty’
Mild: at least one domain coded as ‘some difficulty’
Moderate: at least one domain coded as ‘a lot of difficulty’
Severe: at least one domain coded as ‘cannot do at all’
Multiple disabilities: at least two domains coded as … <some/a
lot/cannot> … difficulty

Disability in Census
1. training modules developed both as manuals and
DVDs (over 30,000 copies were distributed)
2. Training materials for the enumerators to remember
not to ask "are there any person with disability in the
household?" , rather to ask all the list of disability
related questions to all members of each household.
3. Not only training materials provided, but also training
of trainers were also conducted
There were steps taken to ask disability related
questions in 2014 census:
Measurement of disability
For the 2010 round of Censuses, the WG
recommended that “the sub-population disabled
includes everyone with at least one domain that is
coded as a lot of difficulty or cannot do at all”, or in
other words, the use of ‘moderate or higher’ to
define the population with disabilities (Washington
Group, 2010, 2).
It is important to note that for the construction of
the Incheon Strategy Indicators, the same division
is used and that the World Report on Disability
also used the same distinction.

2014 Census show
that Myanmar has
2,311,250 persons, or
4.6% of its population,
living with some form
of disability.
More than a quarter
of this population with
disabilities have
multiple disabilities.
Disability Statistics from 2014 Census
4.6
1.1
0.4
4.4
1.1
0.4
4.8
1.1
0.4
0.0
1.0
2.0
3.0
4.0
5.0
6.0
Mild Moderate Severe
Pre
vale
nce
rat
e
Total Male Female
The country has 559,880 persons, or 1.11% of the population, who
live with a moderate or higher level of disability, and 216,062
persons, or 0.43% of the population, who live with severe disabilities.
At the household level, there are more than 1.7 million households,
or nearly 16% of conventional households, with at least one person
living with a disability.

1.92
0.20
0.09
0.97
0.16
0.08
1.25
0.35
0.19
1.11
0.26
0.18
2.35
0.26
0.13
1.18
0.19
0.09
1.46
0.35
0.20
1.31
0.28
0.18
- 0.50 1.00 1.50 2.00 2.50
Some Difficulties
A lot of Difficulties
Cannot do at all
Some Difficulties
A lot of Difficulties
Cannot do at all
Some Difficulties
A lot of Difficulties
Cannot do at all
Some Difficulties
A lot of Difficulties
Cannot do at all
Seei
ngH
eari
ngW
alki
ngRe
mem
beri
ng
Percentage
Male Female
Disability prevalence from 2014
Census
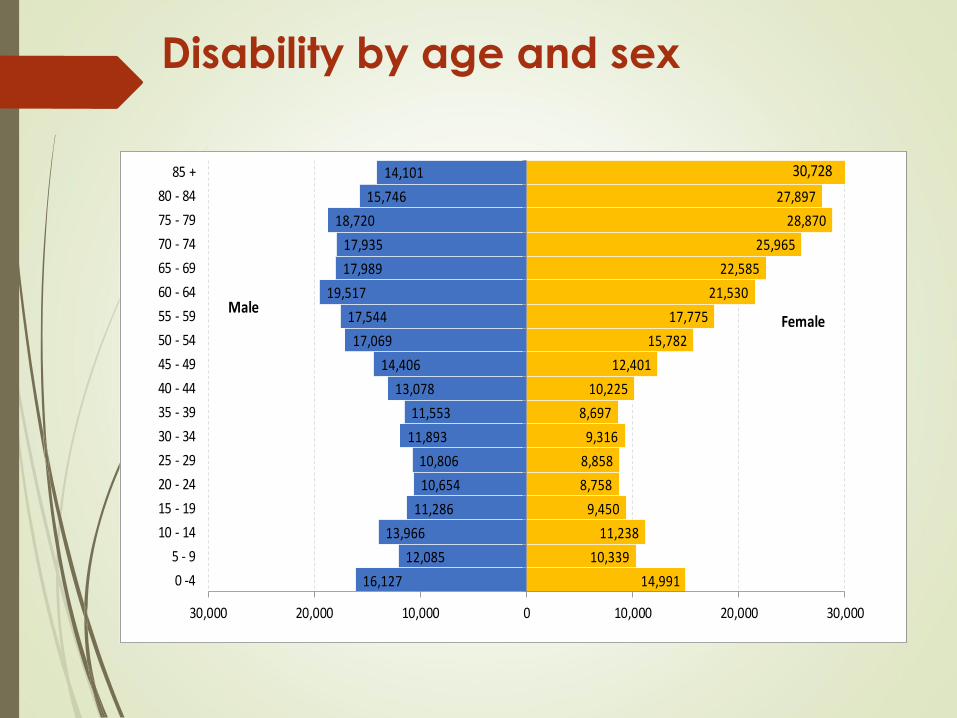
16,127
12,085
13,966
11,286
10,654
10,806
11,893
11,553
13,078
14,406
17,069
17,544
19,517
17,989
17,935
18,720
15,746
14,101
14,991
10,339
11,238
9,450
8,758
8,858
9,316
8,697
10,225
12,401
15,782
17,775
21,530
22,585
25,965
28,870
27,897
30,000 20,000 10,000 0 10,000 20,000 30,000
0 -4
5 - 9
10 - 14
15 - 19
20 - 24
25 - 29
30 - 34
35 - 39
40 - 44
45 - 49
50 - 54
55 - 59
60 - 64
65 - 69
70 - 74
75 - 79
80 - 84
85 +
MaleFemale
30,728
Disability by age and sex

0
2
4
6
8
10
12
14P
reva
len
ce (
%)
Seeing
Hearing
Walking
Remembering/concentrating
Disability prevalence by age and
domain of disability

1.66
2.35
0.75
1.22
1.03
1.49
0.74
1.41
0.15
0.27
0.11
0.20
0.28
0.38
0.18
0.31
0.08
0.12
0.07
0.09
0.18
0.21
0.14
0.19
0.00 0.50 1.00 1.50 2.00 2.50
Urban
Rural
Urban
Rural
Urban
Rural
Urban
RuralSe
ein
gH
ear
ing
Wal
kin
gR
emem
ber
ing
Percent
Cannot do at all
A lot of problems
Some Problems
Disability data by residence and
domain of disability
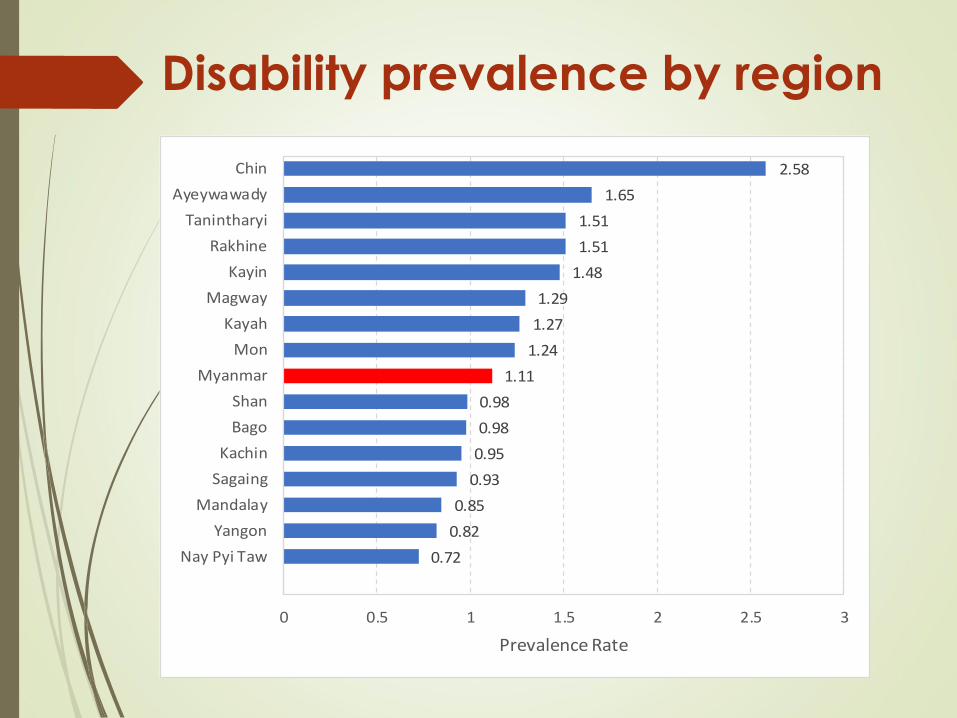
Disability prevalence by region
0.72
0.82
0.85
0.93
0.95
0.98
0.98
1.11
1.24
1.27
1.29
1.48
1.51
1.51
1.65
2.58
0 0.5 1 1.5 2 2.5 3
Nay Pyi Taw
Yangon
Mandalay
Sagaing
Kachin
Bago
Shan
Myanmar
Mon
Kayah
Magway
Kayin
Rakhine
Tanintharyi
Ayeywawady
Chin
Prevalence Rate

Disability prevalence from Census:
Comparison with LFS
0.23
0.11
0.17
0.09
0.35
0.20
0.27
0.18
0.40
0.10
0.20
0.00
0.40
0.20
0.20
0.00
0.20
0.20
0.20
0.10
- 0.10 0.20 0.30 0.40 0.50
A lot of Difficulties
Cannot do at all
A lot of Difficulties
Cannot do at all
A lot of Difficulties
Cannot do at all
A lot of Difficulties
Cannot do at all
A lot of Difficulties
Cannot do at all
A lot of Difficulties
Cannot do at all
Se
ein
gH
ea
rin
gW
alk
ing
Re
me
mb
er
ing
Se
lf-c
are
Co
mm
un
ica
tin
g
Percentage
2014 Census
2015 LFS
The ‘mild disability’
prevalence rate from
LFS:. 7.7% for both
sex, 6.9% for males
and 8.4%for females.
Significantly higher
than the mild
prevalence rate in the
Census (4.6%),
May partly be due to
the fact that LFS
collected for all six
functional domains
against four in the
Census.

2.9
3.2
3.1
2.6
2.9
3.0
2.8
2.7
15.3
15.4
15.3
14.1
16.0
16.4
14.0
15.0
0 2 4 6 8 10 12 14 16 18
World
High-income countries
African
Americas
South-East Asia
European
Eastern Mediterranean
Western Pacific
Percentage
Severe disability Moderate and severe disability
Disability Prevalence Comparison

Disability Prevalence Comparison
20.0 20.0
12.3
10.0
8.0 7.0
6.4 6.3 5.6
5.0 4.9 4.6 4.5 4.0 4.0 3.5 3.5 3.5 3.4 3.0 3.0 2.8 2.5 2.1 2.0 1.7 1.6 1.2 1.0 1.0 0.7
0
5
10
15
20
25
Pre
va
len
ce
of
dis
ab
ility
Country
According to the 2006 UNESCAP survey, disability prevalence in
Myanmar, was 2.8 per cent (UNESCAP, 2012b).
This level of disability is relatively low compared with other countries
in the region. This low prevalence is based on a narrow definition
which defines disability as, “a restriction or lack of ability because of
impairment”.

Evaluation of disability
prevalence
It is important to evaluate whether the disability prevalence
rate of 1.1 per cent is an acceptable estimate of the national
prevalence of disability
Large difference between the prevalence rates of the World
Report on Disability and results of the 2014 Census.
The moderate and severe disability prevalence of 1.1 per cent
in Myanmar is almost fifteen times smaller than the regional
level.
Given Myanmar’s level of economic development and health
system, compared to many of the other countries in the
region, one would expect that the prevalence of disability
would be high than the regional average The prevalence
rates based on the 2014 census was underestimate the true
level.
The opportunities and constraints of
Census for producing disability
statistics?
Could reach to all households and population at once.
The power of the Census - information on disability
can be related to persons’ demographic, social,
economic and household characteristics
Provide internationally comparable data within the
International Classification of Functioning, Disabilities
and Health framework and this satisfies the
requirement to monitor progress towards the goals of
the CRPD.
Opportunities –

The opportunities and constraints of
Census for producing disability
statistics?
Opportunities –
The 2014 Census provides clear evidence that the
population with disabilities lag behind in the achievement
of national, regional, and global development goals.
Myanmar has achieved several educational development
goals, but persons with disabilities are still far behind.
Literacy rates, school attendance of primary and
secondary school children, and education completion
rates of persons with disabilities were all much lower
than for persons without disabilities.
Similarly, labour force participation rates and the
employment-to-population ratios were lower among
persons with disabilities compared to persons without
disabilities.

The opportunities and constraints of
Census for producing disability
statistics?
Constraints – Need thorough preparation
The questions do not completely cover psychological
disabilities, social disables and disabilities connected
to upper body movement.
The ESCAP Guide on Disability Indicators for the
Incheon Strategy cautions that the WG-questions in
Censuses may not be appropriate to identify disability
among children younger than 10 years of age.
Only four out of six possible WG-questions are used
in 2014 Census - lead to an underestimation of the
disability prevalence rate - no questions on self-care
and communicating were asked in this Census,

The opportunities and constraints of
Census for producing disability
statistics?
Constraints –
Often limited by the negative connotations related to
disability and the cultural hesitation by both respondent
and interviewers.
relying on enumerators who are mostly primary
teachers majority of them don't have any knowledge
around disabilities and it's sensitivity.
Enumerator errors (including errors of not asking, only
asking household head and inter-enumerator variation)
Moreover, the Census failed to address the vocational
training issue, which would be very important for
persons with disabilities.

Are the data enough for monitoring of
key areas of disability inclusive
development?
Need more data for implementation and monitoring of
inclusive development or mainstreamed development.
For example - agriculture and disabilities. 70% of
population live in rural Myanmar and more population
with disabilities are also there.
Financial sector - if micro finance could access by
PWDs, if not they should come up with ideas and
innovations how that sector could do, modify for them.

Who are the key producers of the
data on disability in national statistical
systems? Are there coordination
mechanisms for producing statistics
on disability?
Ministry of Social Welfare
Census/Surveys
INGOs/NGOs
UCSB (Union Civil Service Board) is making a
number of reforms to train civil servants and in
doing this inclusion of disabilities in their training
and continued learning as part of their capacity
building and professional development.

How can national capacity to produce
statistics for monitoring progress towards
inclusion of persons with disabilities in
development programmes be
strengthened? Registration of persons with disabilities is
emphasized so that they can receive medical check-
ups, and probably receive other benefits from the
Government, as well as improve statistics on
disability.
Formations of Associations of persons with
disabilities are allowed and they should be registered.
Private schools, private vocational training centres,
and private rehabilitation centres can be opened and
registered at the DSW of the Ministry of Social
Welfare Relief and Resettlement. (the Myanmar Law on
the Rights of Persons with Disabilities, Government of Myanmar,
2015)

Conclusion
The fact that disability is underreported in the
Myanmar Census, does not mean that the data
cannot be used to describe the group of disabled
persons in the country.
As mentioned before, 559,880 persons indicated to
have a moderate or severe disability.
If we assume that this group has the same
characteristics as the group who were not identified
as being disabled, then the characteristics of the
enumerated disabled will be representative for the
total group.
This means that the strength of the Census will be
more in its ability to make a clear description of the
living conditions of the vulnerable group of disabled
persons, rather than to quantify its size.

Thank you!