disability in french prisons - pop.upenn.edu 2004e.pdf · , and other questions, irrelevant to life...
TRANSCRIPT

Disability in French PrisonsHow Does the Situation Differ from That
of the General Population?
Aline DÉSESQUELLES*
By extending the HID (Handicaps, Incapacités, Dépendance)disability and dependency survey to the prison population, it be-came possible for the first time to compare data on the health ofprison inmates with the results obtained for the population ingeneral. In this article, Aline DÉSESQUELLES presents the resultsof the survey conducted in 2001 on around 1,300 inmates of thirtydifferent prisons.
All types of impairment or deficiency identified by the sur-vey, which may or may not result in restriction of activity, aremuch more frequent among prisoners than in the general popula-tion. Beyond an incontestable selection effect at entry into prison,the author demonstrates the specific effect of duration of impris-onment on the onset or aggravation of disabilities. Last but notleast, the study classifies prisoners into different categoriesaccording to the types of disability suffered and the correspondingtypes of assistance or adaptation required. Such information iskey to addressing the problem of disability in the prison environ-ment.
Over recent years, the health of the French prison population hasbeen a regular focus of attention. In 1997, a special issue of the Revuefrançaise des affaires sociales (French welfare policy journal) was de-voted to this question. At that time, Olivier Obrecht (Obrecht, 1998) notedthat:
“The prison environment has altered radically over the last twenty years,with a significant change in the sociological profile of the prison popula-tion. Generally speaking, there are fewer simple thieves and a growingnumber of drug addicts, sex offenders and illegal immigrants. Thesechanges have been accompanied by a concomitant decline in the state ofhealth of prisoners.”
* Institut National d’Études Démographiques, Paris.Translated from the French by Catriona Dutreuilh.
Population-E 2005, 60(1-2),

2 A. D
ÉSESQUELLES
When asked if “prisons have become centres for the medical treatment ofthe socially marginalized, the poor and all those that society is increasinglyincapable of integrating” he gave an immediate affirmative response, shar-ing the view expressed by Michèle Colin and Jean-Paul Jean that “prisonshave become receptacles for the marginal members of society” (Colin andJean, 1997). In 1997, 5% of new prisoners were homeless, 10% lived in in-secure housing and 18% had no social protection (Mouquet et al., 1999).Individuals facing economic insecurity — often synonymous with limitedaccess to healthcare, inadequate hygiene and preventive care, and high-riskbehaviour — are especially prone to disability and disease. For example, thesurvey of homeless users of assistance services (de la Rochère, 2003)showed that the frequency of illness or injury in this population is doublethat of the population as a whole.
The growing economic insecurity of the prison population is associ-ated with a second observation: its ageing. In 2001, there were slightlymore than 5,000 prisoners aged 50 or over in France and, though thisfigure is still relatively low, it has more than doubled since the early 1990s(Kensey, 2001). This trend is the result of a legislative amendment relatingto the term of limitation for sex offences(1) which has led to the convictionof older offenders, longer prison sentences following the introduction ofthe new penal code, and fewer conditional discharges.
A third and last observation concerns the lack of information on thestate of health of prisoners, in relation to disability in particular.
“There is a lack of serious information on the state of health of prisoners.[…] For example, though prisoners with disabilities constitute a clear ca-tegory with specific needs, no quantitative data concerning them areavailable.” (Guillonneau and Kensey, 1997).
Against this background, the survey of disability and dependency inthe prison population (Handicap-Incapacité-Dépendance HID-prisons)whose results are presented in this article, provided an opportunity to fill acertain void. Instigated by INSEE in 1998, the survey was designed andcoordinated by INED(2). The main objective was to assess the situation inFrench prisons with regard to disability and, profiting from the availabilityof identical data relating to ordinary households and institutions, to com-pare the prison population with the general population. Another aim wasto determine the scope and nature of needs of assistance among prisoners.After a brief description of the survey methodology(3), the main results ofthis operation are presented and analysed.
(1) Act 94-89 of 1 February 1994.(2) The survey is the result of a partnership — notably financial —between INED, INSEE,
and the French Ministries of Justice, of Employment and Solidarity and of Health.(3) For further details, refer to the article published in Courrier des Statistiques
(Désesquelles, 2003).

D
ISABILITY IN
F
RENCH
P
RISONS
3
I. Presentation of the HID-prisons survey:an extension of the HID survey of the general population
The HID-prisons survey is an extension of the 1999 INSEE survey ofpersons living in ordinary households (HID-ménages) and the 1998 surveyof persons in residential care institutions (HID-institutions). These twosurveys now serve as references in France for the study of handicap anddisability (Mormiche, 1998). HID-ménages and HID-institutions con-cerned a total sample of 22,000 people of all ages, representative of themajority of the population living in metropolitan France. Certain sub-populations were outside the scope of this survey however. Hence the ideaof organizing a specific operation for the prison population. Surveys relat-ing specifically to mental health problems in the prison environment, or toother pathologies or risk behaviours common among prisoners (AIDS,hepatitis C, drug addiction, alcohol consumption) have been conductedrecently. The originality and interest of the HID-prisons survey lies in thescope of the problems covered, the range of suggested explanatory factorsand the opportunities it provides for comparing the results obtained withthose of the general population.
1. From impairment to handicap: theoretical framework
To guarantee this comparability, we first ensured that the HID-prisons survey questionnaire was as similar as possible to those of theHID-ménages and HID-institutions surveys. In fact, the HID-prisons ques-tionnaire most closely resembles the latter. A prison is “almost” an institu-tion like any other, except for the fact that inmates are not free to comeand go as they please. For this reason, the formulation of certain questionswas substantially modified(4), and other questions, irrelevant to life inprison, were removed(5).
More generally, the HID questionnaire was designed to identify thewidest possible range of disabilities, whatever their physical, mental oreven cultural origin(6). The underlying theoretical model is the classifica-tion defined by Wood (WHO, 1980), which establishes a relation of cau-sality between the following aspects of disability:
—an impairment is any loss or abnormality of psychological, physio-logical, or anatomical structure or function. In the HID questionnaire,impairments are detected by the following question: “Do you experienceany physical, sensory, intellectual or mental difficulties in your everydaylife as a result of an accident, a chronic illness, a birth defect, an infirmity,old age, etc.?” Persons who replied yes to this question were invited to
(4) Questions about movements for example.(5) Questions about purchases or holidays for example.(6) Difficulties with reading or writing, language problems.
4 A. D
ÉSESQUELLES
specify the nature and the origin of these impairments. As the informationobtained in this way was very heterogeneous, it was reformulated by ateam of specially trained physicians to distinguish the impairments fromtheir origins (disease, accident, congenital malformation, etc.).
—disability corresponds to any restriction or lack of ability to per-form an activity in the manner or within the range considered normal for ahuman being. An entire module of the questionnaire was devoted to identi-fying these disabilities. Five major realms were identified: 1) washing,dressing and eating; 2) using the toilet; 3) transfers and movement (mov-ing from one seat to another, moving around by oneself); 4) seeing, hear-ing, speaking (difficulties due to a sensory problem); 5) joint mobility andobject grasping (use of fingers, hands, feet). In this article, the term physi-cal disability designates the existence of difficulties in at least one of theserealms. This is incorrect usage, since some of these disabilities are proba-bly due to a mental problem. But it serves to distinguish them from disa-bilities of exclusively mental origin which are identified by questions ontemporal(7) or spatial(8) orientation and on behavioural problems (commu-nication difficulties not linked to a sensory problem, aggressive or impul-sive behaviour, self-endangerment).
The way the questions were answered also provides a means to dis-tinguish between severe disabilities (performs unaided with substantialdifficulty/requires partial or total assistance) and moderate disabilities(performs unaided with some difficulty). In this article, only severe disa-bilities are taken into account.
—handicap results from an impairment or a disability that limits orprevents the fulfilment of a normal role, depending on age and other fac-tors. So handicap does not depend solely on the physical or mental state ofa person, but also on his environment: type of housing, availability of as-sistance, adaptation of means of transport and living environment, etc. Inthe survey questionnaire, handicap is approached via several modules con-cerning aspects such as school enrolment, employment and relations withthe family.
2. Collection protocol and results
Despite constraints specific to the prison environment, efforts weremade to ensure that the questionnaires were administered under conditionsas similar as possible to those applied for the general population. But fromthe very first tests, a second objective also emerged: to limit non-response.
In the general population, the HID survey questionnaire was admi-nistered face-to-face by INSEE interviewers. For ordinary households, theHID questionnaire was preceded by a “Daily Life and Health” (Vie Quoti-
(7) Not remembering what time of day it is.(8) Having difficulty finding one’s way around.

D
ISABILITY IN
F
RENCH
P
RISONS
5
dienne et Santé – VQS) screening survey whose purpose was two-fold: toidentify persons with disabilities and to constitute a control sample. In theend, the most satisfactory protocol for prison inmates turned out to be verysimilar to the one used for ordinary households. Despite the expected highprevalence of disabilities, it was decided to maintain the screening phasevia a short questionnaire (VQS-prisons questionnaire) practically identicalto the one used for households. But instead of being self-administered, itwas filled in by INSEE interviewers through face-to-face interviews(9).The HID questionnaire was administered immediately afterwards to per-sons who satisfied the following screening criterion: a positive answer toone of the 13 questions relating to the presence of disabilities, restrictionof activity, a handicap or a need of assistance linked to a health problem.
The survey was conducted in May 2001 after randomly selecting32 establishments (25 remand prisons(10), 6 detention centres(11) and1 high-security prison(12)) from among all penal institutions located inmetropolitan France. For each establishment, the interviewers drew a sam-ple of 50 to 100 inmates. Three categories of prisoners were excludedfrom the sample:
—minors, who could not be interviewed without parental consent;
—prisoners on partial release(13) who were not available during theauthorized interview periods;
—hospitalized inmates, since the aim of the survey was to identifychronic disabilities, while hospital patients generally suffer from tempo-rary disabilities. This choice tallies with the choice made for the generalpopulation, since only long-stay hospital units were included in the HID-institutions survey. So comparison is not affected — quite the contrary— bythe exclusion of this sub-population.
At 1 May 2001, the population included in the scope of the surveytotalled almost 44,000 people. The initially selected sample comprised2,800 inmates, of which 2,031 (1,951 men and 80 women) first answeredthe VQS-prisons questionnaire. The failure rate was 27.5%, with 20.9%due to refusals and 6.6% due to circumstances that made the interview im-possible(14). The variation in participation rates between establishments(from 47% to 96%) is very large. As a general rule, they were higher (82%on average) in prisons with fewer than 150 inmates, where it is easier tomobilize personnel and prisoners, than in larger establishments.
(9) For the survey of ordinary households, the questionnaire—distributed at the time of thegeneral population census—was self-administered.
(10) Remand prisons receive remand prisoners and convicted prisoners with less than oneyear to serve.
(11) Detention centres receive convicts serving terms of one year and over and consideredto have the best prospects of social rehabilitation.
(12) High-security prisons receive the toughest convicts.(13) A special detention regime under which prisoners spend only the night in prison.(14) Prisoners transferred/released between the time of sample design and the time of inter-
view, prisoners deemed dangerous, prisoners not authorized to communicate, prisoners in the dis-ciplinary wing.
6 A. D
ÉSESQUELLES
Out of the 2,031 prisoners who answered the VQS-prisons question-naire, 950 satisfied the screening criterion. This sample was associatedwith a control sample of 364 individuals who did not satisfy the screeningcriterion. So a final total of 1,314 persons were invited to answer the HIDquestionnaire and 1,284 interviews were actually conducted. 13 peoplerefused to reply and 17 were deemed incapable of doing so, most oftenbecause of a language problem (12 cases), and more rarely because of ahealth problem (4 cases). All the results presented in this article concernthis sample of 1,284 prisoners who, thanks to the inclusion of a controlsample and, of course, after weighting to correct for the distortion intro-duced by screening, is representative of the population included in thescope of the survey.
Given the relatively high failure rate for face-to-face surveys, therewas a significant risk of major bias due to a selection effect. It was fearedthat healthy prisoners, believing that the survey did not concern them,would decide not to take part or that, conversely, prisoners in very poorhealth would be excluded because they were unable to come to the visitingroom. To reduce the risk of bias, an additional information gathering pro-cess was organized. The physicians of the 32 participating establishmentsagreed to assess the individual state of health of all initially selected pri-soners, whether or not they subsequently answered the VQS questionnaire.This four-level assessment (excellent/good/poor/very poor health) wasgenerally based on the prisoners’ medical files. The information thus ob-tained, cross-checked against available data on survey participation,showed that there was no selection of surveyed prisoners in relation tothei r general s ta te of heal th as assessed by the pr ison physic ians(Désesquelles, 2003).
II. Prisoners are clearly disadvantaged
To compare the situation of prisoners with that of the “free” popula-tion(15), differences in the age structure of these two sub-populations mustbe taken into account. In May 2001, the median age of the prison popula-tion was 31, compared with 45 for the rest of the population. Moreover,analysis of data from the HID-ménages and HID-institutions surveys hasrevealed major disparities in terms of disability between men and women(Mormiche et al., 2000; Cambois et al., 2003). As women only represent4% of the prison population, all figures relating to the general populationpresented here are calculated on the basis of an age and sex structurestandardized to that of the prison population.
(15) Also referred to in this article as the “general population”.

D
ISABILITY IN
F
RENCH
P
RISONS
7
1. Impairments are twice as frequent in prison
Two out of three prisoners have at least one impairment (Table 1).For a similar age and sex structure, this proportion is double that of thegeneral population. Intellectual and mental impairments are the most fre-quent. They concern 45% of the prison population, a proportion threetimes higher than that of the general population. Other studies have ob-tained similar findings for the extent of this type of problem in the prisonenvironment. According to the DREES survey of mental health among newprisoners, 55% of new arrivals suffer from at least one psychiatric disorder(Coldefy et al., 2002). Situations grouped under the heading “intellectualor mental impairments” appear to be very varied. In particular, it is proba-ble that not all are attributable to a mental illness but correspond, asdescribed below, to symptoms of anxiety and depression which may be in-dicators of psycho-social distress (La Rosa, 1998).
The other impairments identified by the survey are also much morecommon in prison than in the general population, though generally aroundtwice as frequent.
—One in four prisoners has a motor impairment, most often a backproblem (11% of the prison population vs. 6% of the general po-pulation). It is well known that injuries are very common inprison. The causes are varied: risk behaviour before imprison-ment, injury when committing an offence or during arrest, acci-dents in prison (sports or work accidents, fights between inmates)or self harm (Lalande, 1997).
—One in five prisoners has a visceral or metabolic impairment. Theprevalence of this type of impairment is particularly high amongprisoners aged 50 and above (2 in 5), exceeding that of intellec-tual and mental impairments. Respiratory and cardiovascular im-pairments each affect 7% of the prison population, compared with2% of the general population.
—One prisoner in five has at least one sensory impairment. Visualand auditory impairments each concern one prisoner in ten, with aprevalence double that observed in the general population. Thedifference between the two populations is even more pronouncedfor language and speech impairments (5% of prisoners vs. 1% ofthe general population).
Lastly, dental problems(16) are also very common (6% of the prisonpopulation), beyond age 50 especially (18% of this age group). The linkbetween economic insecurity and poor oral and dental health is well estab-lished (Hassoun, 1998) and can be explained by inadequate oral and dental
(16) A specific coding system was used for this type of impairment in the HID-prisons sur-vey due to the high frequency of problems reported. No equivalent data is available for the gen-eral population.

8A
. D
ÉSE
SQU
EL
LE
S
TABLE 1.– TYPES OF IMPAIRMENT IN THE PRISON POPULATION: PREVALENCE BY AGE AND COMPARISONWITH THE POPULATION AS A WHOLE (%)
Type of impairment(a) Age 18-29 Age 30-49 Age 50 or over All prisoners All free population(b)
Motor impairment 18.4 29.2 30.9 24.6 11.3of which:
Trunk impairment 7.1 13.8 13.3 10.8 5.9Impairment of one arm 4.5 5.6 6.7 5.2 1.9Impairment of one leg 4.2 6.2 3.3 5.0 1.8
Visual impairment 5.9 10.2 20.2 9.5 4.3Auditory impairment 5.3 11.4 29.9 10.9 5.0Language or speech impairment 4.5 4.4 6.1 4.7 1.4Visceral or metabolic impairment 11.7 23.8 39.1 20.3 8.8of which:
Cardiovascular impairment 2.3 8.0 21.7 7.1 2.2Respiratory impairment 4.7 7.2 12.1 6.7 2.2Impairment of the digestive tract and organs 2.4 6.7 6.3 4.8 2.6
Intellectual or mental impairment 45.8 45.7 36.8 44.7 14.6of which:
Behaviour disorder, personality disorder,impairment of relational capacities 17.0 13.6 6.0 14.2 0.3Loss of intellectual capacities, memory impairment,spatial/temporal disorientation 11.3 13.6 9.4 12.1 1.2
Other impairment 4.2 11.4 22.7 9.6 3.0of which:
Dental problems 1.7 6.6 17.5 5.7 n.a.Vertigo 1.3 1.5 2.2 1.5 0.1Aesthetic impairments 0.6 1.8 2.0 1.3 1.0
Unknown 3.0 3.2 7.9 3.7 1.2At least one impairment 60.8 70.8 82.5 67.8 32.8(a) This table lists the major groups of deficiencies identified by the survey and, for each one, the most frequently reported impairments.(b) The free population includes the population living in ordinary households and in residential care institutions. The prevalence rates have been standardized according tothe age and sex structure of the prison population.Source: HID-prisons survey 2001, HID 1998 and 1999 surveys.

D
ISABILITY IN
F
RENCH
P
RISONS
9
hygiene and limited access to healthcare (Dargent-Paré et al., 2000). Pro-longed and regular drug abuse, which concerns one incoming prisoner inthree (Mouquet et al., 1999), also has a likely impact(17).
The prevalence of impairments increases with age. Of course, this in-crease is linked to biological ageing, though other factors are also in-volved. The difference between the general population and the prisonpopulation is more pronounced at ages 18-29 than at age 50 and above,with the prevalence ratio falling from 2.1 (60.8% vs. 28.5%) in the firstage group, to 1.6 (82.5% vs. 51.8%) in the second. This does not signifythat people age faster on the outside than in prison. Prisoners aged 50 ormore have not all spent many years in prison. Though the average periodof imprisonment is higher in this age group (3.8 years) than amongyounger prisoners (2.1 years for the 18-29 age group), more than two-thirds of prisoners aged 50 or over have been in prison for less than fiveyears. The trend observed more probably corresponds to a “selection” atentry into prison of sub-populations more disadvantaged in terms of healthat younger ages than at older ones. This is borne out by the fact that, un-like other impairments, the prevalence of intellectual and mental impair-ments is higher among the under-50 age group (46%) than amongprisoners aged 50 and above (37%).
The origin of impairments reported in prison (Table 2) is quite dif-ferent from that observed among the general population(18). While half ofthe people in the general population (for an age and sex structure equiva-lent to that of the prison population) attribute their impairment to illness,the proportion falls to slightly over one-third among the prison populationwith at least one impairment. Accidental causes are more frequent inprison (27% vs. 20% in the general population). Analysis at a finer levelshows that this result is also valid for traffic accidents (10% vs. 3%), butnot for occupational injury (4% vs. 8%). It is in the somewhat heteroge-neous “other causes” category that most of the reported impairments areclassified. This category includes personal and family problems (30% inprison vs. 23% in the general population), ageing, which is cited by 7% ofpersons with impairments in both the prison and general populations, andalcohol and drug consumption (8% vs. 1%). It comes as no surprise thataddictive behaviours, which have numerous impacts on physical and men-tal health, are over-represented in the prison environment. According tothe survey of new prisoners already mentioned above (Mouquet et al.,1999), one in ten regularly consumes excessive amounts of alcohol andone in three regularly takes drugs.
(17) Consumption of heroin and neuroleptics provokes tooth decay.(18) It is not a question of the prevalence of these different causes among the prison popu-
lation, but of the proportion, among all prisoners with at least one impairment, of those who at-tribute the impairment to a given cause. A single impairment may have several causes, and asingle prisoner may have impairments due to multiple causes. Consequently, the sum of the pro-portions given in Table 2 is not 100%.

10 A. D
ÉSESQUELLES
TABLE 2.– ORIGIN OF IMPAIRMENTS IN PRISON AND COMPARISONWITH THE GENERAL POPULATION(19) (%)
Lastly, 28% of prisoners blame their impairment on “stress”(20). Intwo-thirds of cases, the prisoners specified that this stress was linked totheir detention, though this type of problem is already strongly repre-sented at the time of entry into prison: 55% of disorders identified amongnew prisoners are anxiety disorders (Coldefy et al., 2002). So it is perhapsmore accurate to talk about stress linked to prison entry rather than todetention. The consequences of these anxiety states should not be under-estimated as they form the clinical framework for most cases of self-destructive behaviour, self-harm and suicide (de Beaurepaire, 1997).
2. The gap is even wider for disabilities
Slightly more than one prisoner in five has at least one physical disa-bility (Table 3). For a similar age and sex structure, the proportion is al-most three times that of the general population, and hence even higherthan for the presence of an impairment. So although not all impairmentsresult in disability, it would appear that this is more frequently the caseamong the prison population than among the general population. This isespecially true for disabilities linked to a sensory problem: the differencein prevalence between the two populations (17% vs. 6%) is much larger
Cause of impairment Age 18-29 Age 30-49 Age 50 or over All prisoners All free
population(a)
Accident 24.7 31.4 18.1 26.8 20.1of which:
Occupational injury 0.8 6.1 6.9 4.1 7.6Traffic accident 9.8 11.9 3.6 9.9 3.2
Pregnancy complication 7.0 6.4 5.7 6.5 7.7Congenital malformation 3.0 4.1 0.7 3.1 4.4Disease 20.3 41.1 59.0 35.5 49.1Other causes 53.1 54.7 60.1 54.8 39.4of which:
Ageing 0.1 6.2 25.1 6.5 7.8Personal and family problems 31.2 28.8 23.3 28.9 22.7Alcoholism, drug addiction 10.7 7.5 1.3 7.9 0.9Stress 25.1 31.1 27.7 28.2 n. a.
(a) Prevalence rates standardized according to the age and sex structure of the prison population.Scope: Persons who reported at least one impairment.Source: HID-prisons survey 2001, HID 1998 and 1999 surveys.
(19) The results presented in this table are very different from the results presented previ-ously in Insee-première no. 854 (Désesquelles et al., 2002), as the sources used for the two tablesare different. In the present case, the table gives information on the origin of impairments col-lected during administration of the HID questionnaire. In the case of Insee-première, the data wasbased on replies to a question in the VQS questionnaire on the origin of reported restrictions ofactivity.
(20) This was the term used by the prisoners themselves.

DISA
BIL
ITY
IN F
RE
NC
H P
RISO
NS
TABLE 3.– PREVALENCE OF DISABILITIES IN PRISON COMPARED WITH THE GENERAL POPULATION (%)
Proportion of persons who reported: Age 18-29 Age 30-49 Age 50 or over All prisoners All free population(a)
Difficulties washing and/or dressing and/or eating 0.4 2.3 4.4 1.7 1.4Difficulties in using the toilet 0.7 0.6 2.9 0.9 0.7Difficulties with transfers and/or movements 1.7 4.0 9.1 3.6 1.4Visual, auditory or speech difficulties 11.1 18.5 36.2 17.3 5.7Joint mobility and/or object grasping difficulties 3.3 6.5 13.3 5.9 2.9
At least one physical disability 14.7 24.5 45.1 22.7 8.1
Temporal disorientation 12.1 12.9 10.1 12.3 2.1Spatial disorientation 0.8 2.1 1.1 1.8 1.0Communication difficulties 1.1 1.9 1.8 1.5 0.5Other behaviour problems 37.2 32.7 24.6 33.7 12.4(b)
At least one disability 45.8 49.2 59.5 48.9 13.0(b)
A restriction of activity due to a health problem 22.9 31.3 41.3 29.0 4.8(b)
An officially recognized level of disability 3.2 9.7 16.2 7.6 6.7(a) Prevalence rates standardized according to the age and sex structure of the prison population.(b) The figure given for comparison only concerns persons in ordinary households.Source: VQS-prisons and HID-prisons survey 2001, HID surveys 1998 and 1999, VQS-ménages survey 1999.
11

12 A. DÉSESQUELLES
than for sensory impairments (21% vs. 10%). Compared with the pro-por t ion of pr isoners wi th a motor impairment (25% of pr isoners ,cf. Table 1), the prevalence of disabilities liable to be caused by sensoryimpairment appears to be very low: 2% of prisoners have difficulty wash-ing, dressing and feeding, 6% have problems of joint mobility or objectgrasping and 4% have transfer or movement problems. Altogether, 8% ofprisoners have one of these types of disability.
Problems of temporal orientation are especially frequent in prison(more than one prisoner in ten). They may well be a direct consequence ofdetention, since prisoners tend to have a distorted sense of time, notably inremand prisons where “they are always waiting for something: a transferto another cell, a place in a sports activity, a job, permission to see a visi-tor or a lawyer, a trial etc. In a remand prison, time stands still. Time be-comes a arbitrary succession of moments” (Plichart and Golse, 1997). Thegap between the prison population and the general population is substan-tially smaller for the much less frequent problems of spatial orientationand communication(21), though prisoners are always disadvantaged. Theother behaviour problems concern one prisoner in three. More precisely,27% of prisoners reported that they were sometimes over-aggressive orimpulsive, and 18% that they had put themselves in danger through theirbehaviour. Unfortunately, in the HID-institutions survey, questions relat-ing to such behaviour were only put to interviewees aged under 15. Socomparison is only possible with the population living in ordinary house-holds. Given the probable high frequency of such behaviour in insti-tutions, the large gap observed (34% vs. 12%) probably overestimates thereal difference between the prison population and the rest of the popu-lation.
Lastly, one prisoner in two has at least one disability. The prevalenceof restriction of activity due to a health problem (29% vs. 5% in ordinaryhouseholds) is lower, since the presence of a disability does not neces-sarily lead to restriction of activity (Ravaud et al., 2002). Moreover, 8% ofprisoners have an officially recognized level of disability, a proportionvery close to that observed among the general population. Of course, offi-cial recognition of a level of disability only partly reflects the severity ofthis disability; it also measures the person’s ability to go through the pro-cedures for obtaining such recognition.
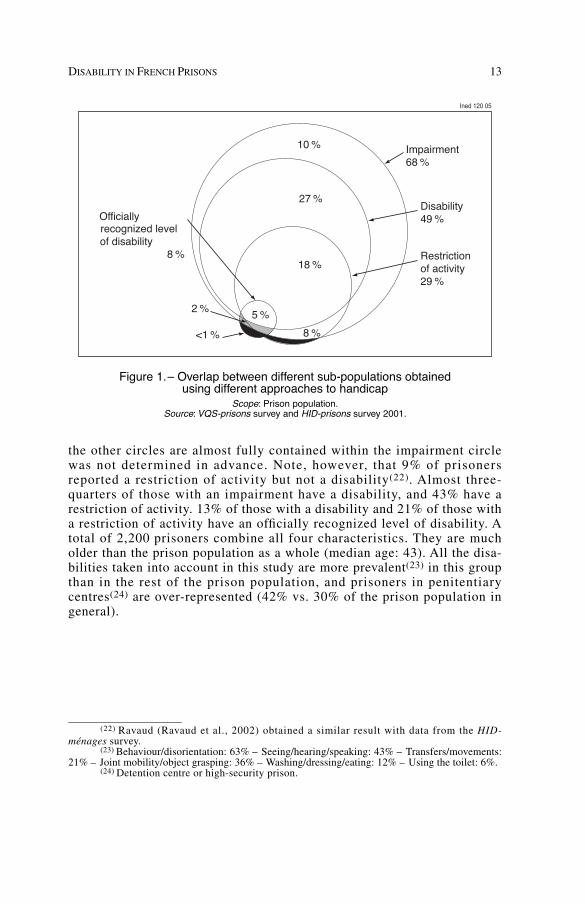
Figure 1 shows the intersections between the various sub-populations.A total of 68% of prisoners have at least one impairment, one disability,one restriction of activity or one recognized level of disability. The inclu-sion of the group with at least one disability in the group of persons with atleast one impairment is linked to the structure of the questionnaire: all per-sons reporting a disability were asked to give the cause. But the fact that
(21) For ordinary households, only people who needed help to fill in the questionnaire wereasked about communication difficulties (excluding sensory problems). We assumed that thosewho were able to fill in the questionnaire without help did not have any difficulties in this respect.
DISABILITY IN FRENCH PRISONS 13
the other circles are almost fully contained within the impairment circlewas not determined in advance. Note, however, that 9% of prisonersreported a restriction of activity but not a disability(22). Almost three-quarters of those with an impairment have a disability, and 43% have arestriction of activity. 13% of those with a disability and 21% of those witha restriction of activity have an officially recognized level of disability. Atotal of 2,200 prisoners combine all four characteristics. They are mucholder than the prison population as a whole (median age: 43). All the disa-bilities taken into account in this study are more prevalent(23) in this groupthan in the rest of the prison population, and prisoners in penitentiarycentres(24) are over-represented (42% vs. 30% of the prison population ingeneral).
(22) Ravaud (Ravaud et al., 2002) obtained a similar result with data from the HID-ménages survey.
(23) Behaviour/disorientation: 63% – Seeing/hearing/speaking: 43% – Transfers/movements:21% – Joint mobility/object grasping: 36% – Washing/dressing/eating: 12% – Using the toilet: 6%.
(24) Detention centre or high-security prison.
Impairment68 %
Disability49 %
Restrictionof activity29 %
Officiallyrecognized levelof disability
8 %
10 %
27 %
18 %
8 %
5 %
<1 %
2 %
Ined 120 05
Figure 1.– Overlap between different sub-populations obtainedusing different approaches to handicap
Scope: Prison population.Source: VQS-prisons survey and HID-prisons survey 2001.

14 A. DÉSESQUELLES
III. Selection at entryor damaging effects of detention?
In this presentation of the survey results, a number of hypotheseshave been put forward to explain the differences observed between theprison population and the general population. A more detailed analysiswill now be made, distinguishing between two main types of explanatoryfactor:
—Factors which correspond to a selection effect at entry into prison.In other words, the prison “recruits” on a selective basis from among per-sons suffering from disabilities or who are liable to develop disabilities(vulnerability);
—Factors corresponding to a damaging effect of detention.
1. Selection effect
There is clearly a direct link between a person’s criminal record andhis or her state of health. For example, alcohol consumption, whose damag-ing effects on health are well known, plays an important role in criminaloffences against individuals. The same is true for drug abuse, which is initself a criminal offence. Lastly, as mentioned earlier, it is often the verycircumstances of the crime or arrest which, due to their violence, areresponsible for the injuries and disabilities suffered.
Beyond this obvious link between criminality/delinquency andbehaviour that is damaging to health, selection at entry could also occurmore indirectly, given the increasingly disadvantaged profile of newprisoners, as pointed out in the introduction to this article. It is well-knownthat there are major social inequalities in relation to disability (Mormicheet al., 2000). As is the case for mortality, the scale of disability risk is amirror image of the social hierarchy. Moreover, the over-representation ofpersons from the working classes is well-established (Kensey et al., 2000).So there are good grounds for believing that these two factors combine inprison to produce the observed differences. What happens if, in addition toage, the socio-occupational category is also taken into account? In a previ-ous article (Désesquelles et al., 2002), it was shown that for a similarsocio-occupational category, the prevalence of disabilities remains muchhigher in prison than outside. An identical result is obtained for impair-ments (Figure 2). The gap between the prison population and the generalpopulation is smaller for practically all socio-occupational categories how-ever, indicating the non-zero influence of this effect.
Selection by socio-occupational category at entry into prison doesnot explain, or to be more precise, only very partially explains the higherprevalence of disabilities in prison. This nuance is necessary, since thedemonstration presents certain weaknesses. Firstly, due to an inadequate

DISABILITY IN FRENCH PRISONS 15
sample size, the chosen socio-occupational categories are broad and hencerelatively heterogeneous. Moreover, persons’ occupations(25) are recordedwithout taking account of their employment status. For any given occupa-tion, the proportion of prisoners who were unemployed is likely to behigher than on the outside, and among the unemployed, the proportion ofthose in a situation of severe economic insecurity is probably higheramong the prison population.
2. Specific effect of detention
A period of imprisonment is liable to affect the physical and mentalhealth of prisoners and hence the existence of impairments or disabilities.Certain authors (Lalande, 1997) highlight the “pathogenic” nature of theprison environment, resulting in a resurgence or aggravation of certainpathologies(26) due to anxiety generated by imprisonment and poor condi-tions of hygiene. Likewise, the violence of relations between prisoners is a
(25) For prisoners, their last occupation prior to imprisonment.(26) Notably asthma, gastro-duodenal ulcers, skin disorders.
50
Ined 120 05Percentage
White-collarHigher-mid-level occup. Self-employed Blue-collar0
80
70
30
20
10
40
60
Never worked
Prisons Households + Residential care institutions
Figure 2.– Proportion of persons with at least one impairment by placeof residence and socio-occupational category (%)
Note: To calculate the proportions for ordinary households and residential care institutions,it was assumed that for each socio-occupational category the age structure of this population
is identical to that of the prison population.Source: HID-prisons survey 2001, HID surveys, 1998 and 1999.

16 A. DÉSESQUELLES
continual source of psychological trauma (de Beaurepaire, 1997). But theeffect of detention is also expressed more subtly through an alteration ofprisoners’ personal body image. The loss of self-esteem associated withimprisonment may be severe enough to result in bodily neglect. But thislow self-esteem and the need to build a more positive self-image some-times have more unexpected consequences: “for some, the very status ofinvalid, globally disparaged, provides a means to obtain a recognized sta-tus” (Parizot, 1998). Of course, the possibility that certain prisoners deli-berately exaggerate their health problems in the hope of making life easierfor themselves cannot be ruled out. But this tendency may also exist on amuch more unconscious level. The tough living conditions, lack of activityand withdrawal often observed in prison may result in greater bodilyawareness, increased sensitivity to pain, an exacerbation of the difficultiesexperienced or even a tendency towards somatization.
Clearly, analysing the consequences of detention is a complex task.What does the HID-prisons survey tell us about the damaging effects oflife in prison? In what way does time spent behind bars affect the develop-ment of disabilities? The HID survey does not provide a totally satisfac-tory answer to this question, since it only covers the current period ofincarceration and gives no data on previous periods of imprisonment, ifany. This reserve aside, note that most reported disabilities pre-date thecurrent period of imprisonment. This is the case for 77% of reported phy-sical disabilities and 61% of temporal and spatial orientation problems(27).
It is possible to reconstruct the situation of prisoners at the time oftheir imprisonment. Figure 3 clearly shows that the difference with respectto the rest of the population in terms of physical disabilities, alreadypresent at the time of imprisonment, increases thereafter. For a moredetailed insight, a multivariate analysis (logistic regression) was per-formed to study the specific effect of time spent in prison on the presenceof impairments or disabilities (Table 4). When time spent in prison undercurrent sentence is above five years, the probability of having an impair-ment or a disability is significantly higher. But does this effect correspondto a form of selection, with long-stay prisoners being in a poorer state ofhealth at entry into prison than the others, or to an effect of time spent inprison? To test this point, another regression was performed, this timeincluding only prisoners serving sentences of at least five years (Table 5).If the effect observed previously was entirely the result of a selectioneffect at entry into prison, there should be no significant correlationbetween time spent in prison and the presence or impairments or disabili-ties. Yet there is still a correlation, and it is even stronger than before. Thisresult suggests that there is indeed a selection effect, but that it operates inreverse to the one that might be expected: prisoners serving sentences of atleast five years tend to be in better health at the time of entry than those onshorter sentences.
(27) The history of behaviour problems is not known.

DISABILITY IN FRENCH PRISONS 17
Table 6 clearly illustrates these results. Whatever the disability indi-cator used, prevalence in a given age group increases sharply when timespent in prison is above five years. For example, at age 50 or above, theprevalence of physical disability rises from 37% among inmates who havebeen in prison for less than five years, to 66% among those who have beenin prison for longer.
This evidence of a negative effect of time spent behind bars on thepresence of impairments or disabilities necessarily raises the question ofhow these problems should be dealt with in the prison environment. Wehave noted that the difference between the prison population and the gene-ral population is less pronounced for impairments than for disabilities, bethey physical or mental. The difference observed for disabilities may bepartly attributable to less effective treatment of impairments which tend toworsen as a consequence and, in time, become incapacitating. Of course,this does not explain the difference observed for impairments. Applyingthe same reasoning, one could hypothesize that for lack of appropriatetreatment before or during imprisonment, the various causes of impair-
1.0
Ined 121 05Ratio
Age 30-49Age 18-290.0
5.0
3.0
4.0
2.0
Age 50 or over
At time of imprisonmentAt time of survey
Figure 3.– Ratio of prevalence of physical disability in prison to prevalencein the general population: comparison of situations at the time of survey
and at the time of imprisonmentNote : The data reconstituted at the time of imprisonment only take account
of disabilities whose history is known.Interpretation: At ages 18-29, at the time of survey, the proportion of persons
with at least one physical disability was 4.6 times higher in prison than in the general population.It was 3.6 times higher at the time of imprisonment.
Sources: HID-prisons survey 2001, HID surveys, 1998 and 1999.

18 A. DÉSESQUELLES
ments (illness, accident, etc.) more frequently give rise to impairmentsamong prisoners. It is impossible, however, to verify this point using datafrom the HID survey, since the potential causes of impairments are notknown unless they are actually responsible for one or more impairments.
TABLE 4.– FACTORS INFLUENCING THE PRESENCE OF A HANDICAP (ODDS RATIOS)
At least one impairment
At least one physical disability
At least one disability
SexMale (Ref.) 1.0 1.0 1.0 n.s.Female 1.3 n.s. 2.0* 1.6
AgeAge 18-29 (Ref.) 1.0 1.0 1.0 n.s.Age 30-49 1.4* 1.6** 0.9 n.s.Age 50 or over 2.6*** 4.5*** 1.5
SOCWhite-collar worker (Ref.) 1.0 1.0 1.0 n.s.Self-employed 0.8 n.s. 0.9 n.s. 1.1 n.s.Higher/mid-level occupation 0.6* 0.8 n.s. 0.8 n.s.Blue-collar worker 0.8 n.s. 1.3 n.s. 1.0 n.s.Has never worked 0.5*** 1.2 n.s. 0.8
Time spent in prisonLess than 2 years (Ref.) 1.0 1.0 1.0 n.s.2 to 5 years 1.1 n.s. 1.3 n.s. 1.2***5 years or more 2.3*** 2.2*** 2.7
n.s. : non-significant (threshold 5%); * p < 0.5; ** p < 0.01; *** p < 0.001.Source: HID-prisons survey 2001.
TABLE 5.– FACTORS INFLUENCING THE PRESENCE OF A HANDICAP AMONG PRISONERS SERVING A SENTENCE OF AT LEAST 5 YEARS (ODDS RATIOS)
At least one impairment
At least one physical disability
At least one disability
SexMale (Ref.) 1.0 1.0 1.0Female 0.4 n.s. 1.6 n.s. 1.2 n.s.
AgeAge 18-29 (Ref.) 1.0 1.0 1.0Age 30-49 1.2 n.s. 2.2* 1.1 n.s.Age 50 or over 4.1** 6.8*** 1.7 n.s.
SOCWhite-collar worker (Ref.) 1.0 1.0 1.0Self-employed 0.3** 1.8 n.s. 1.0 n.s.Higher/mid-level occupation 0.3* 1.4 n.s. 1.0 n.s.Blue-collar worker 0.5 n.s. 2.4* 1.5 n.s.Has never worked 0.1*** 2.1 n.s. 0.5 n.s.
Time spent in prisonLess than 2 years (Ref.) 1.0 1.0 1.02 to 5 years 1.3 n.s. 1.8 n.s. 2.2*5 years or more 3.2*** 3.0** 5.1***
n.s. : non-significant (threshold 5%); * p < 0.5; ** p < 0.01; *** p < 0.001.Source: HID-prisons survey 2001.

DISABILITY IN FRENCH PRISONS 19
IV. From disability to need of assistance
The HID survey questionnaire includes several questions to assessprisoners’ need of assistance. Depending on the question used, the resultsobtained are very different. For each physical disability included in thesurvey (washing, dressing, eating, using the toilet, transfers/movements,joint mobility/object grasping), two choices of answer (“cannot performwithout partial assistance” and “cannot perform without total assistance”)provide a means to directly identify a need of assistance related to thisdisability. A total of 600 persons, — i.e., 1.3% of prisoners — expressed aneed of assistance for at least one of the activities listed in the question-naire. This percentage increases with age, rising from below 0.5% at ages18-29, to 1% at ages 30-49 and 6% at age 50 or above.
Much higher figures are obtained when the answers to the followingquestion are analysed: “Do you receive all the assistance that you mightneed as a result of your state of health?” Though almost two-thirds of pri-soners answered yes to this question, 23% reported a need of human as-sistance and 12% a need of equipment. As the question was worded in theconditional, it might have been understood as a question about prisonhealth care in general terms, independently of the actual needs of the per-son concerned.
Lastly, a third battery of questions was administered in the VQSscreening questionnaire:
—“Due to health problems, do you need the assistance of anotherperson in your daily life?”
—“Due to health problems, do you regularly use, or do you need, aprosthesis, an assistive device or a technical aid (stick, crutches,artificial limb, wheelchair, hearing aid, etc.)?”
—“Due to health problems, do you need any special adaptations toyour cell?”
A total of 3% of prisoners report a need of human assistance due to ahealth problem, 4% regularly use or need a prosthesis, a technical aid or
TABLE 6.– PREVALENCE OF HANDICAP BY AGE AND TIME SPENT IN PRISONUNDER CURRENT SENTENCE (%)
Prisoners aged below 50 Prisoners aged 50 or more
Less than 5 years spent in prison
5 years or more spent in prison
Less than 5 years spent in prison
5 years or more spent in prison
At least one impairment 64 77 77 98At least one physical disability 18 29 37 66At least one disability 45 64 52 79Source: HID-prisons survey 2001.

20 A. DÉSESQUELLES
an assistive device. Lastly, 4% of prisoners reported that for health rea-sons, special adaptations to their cell were needed. Most often, these needsconcerned a special bed or an individual shower. The populations corre-sponding to these three types of need do not overlap. Hence, though lessthan 1% of the prison population combines all three types of need, 8%report at least one. Due to the small numbers concerned, comparison ofthe three sub-populations would be risky. Their characteristics neverthe-less appear to be very similar. The only noticeable difference is a slightlyhigher proportion of persons with an intellectual or mental impairmentamong those requiring human help, and slightly more persons with amotor or sensory impairment among those requiring a technical aid or celladaptations.
Table 7 lists the characteristics of persons reporting a need of assis-tance in their reply to one of the three questions and compares them withall prisoners and with those reporting a restriction of activity. Slightlymore than half of the people reporting a need of assistance are agedbetween 30-49, an age group that represents 44% of all prisoners. The pro-portion of inmates reporting a need of assistance who have been in prisonfor at least five years is slightly higher than among prisoners in general,though no difference in relation to the type of establishment is observed.
Practically all prisoners reporting a need of assistance reported atleast one impairment. 81% have at least one disability, 67% a restriction ofactivity and 27 % an officially recognized level of disability. Motorimpairments are particularly over-represented (63% vs. 25% among allprisoners), and the proportion of prisoners with a sensory impairment isalso much higher. In terms of physical disability, sensory problems comefirst (41% vs. 17% for all prisoners), followed by problems of joint mobi-lity and object grasping (27% vs. 6%). Only 36% of persons reporting aneed of assistance consider themselves to be in good or very good health,compared with 64% of prisoners in general. All in all, the profile of per-sons reporting a need of assistance is fairly similar to that of persons witha restriction of activity, though the two populations do not fully overlap.Disability and, even more so, the need of assistance, in whatever form, aremuch less frequent among persons with restriction of activity. By con-trast, the proportion of persons with visceral or metabolic impairments ishigher among those with restriction of activity than among those with aneed of assistance.

DISABILITY IN FRENCH PRISONS 21
TABLE 7.– MAIN CHARACTERISTICS OF PRISONERS REPORTINGA NEED OF ASSISTANCE (IN %)
Prisoners
All prisonersReporting a need of assistance
Witha restrictionof activity
AgeAge 18-29 30 34 44Age 30-49 55 48 44Age 50 or over 15 18 12
Time spent in prisonLess than 2 years 56 57 625 years or more 23 20 16
Type of establishmentRemand prison 71 68 71Detention centre 29 32 29
Type of impairmentNo impairment 1 1 32Intellectual or mental impairment 67 65 45Motor impairment 63 54 25Visceral or metabolic impairment 39 45 20Visual impairment 17 17 10Auditory impairment 27 19 11Speech impairment 11 9 5Dental problems 8 8 6
DisabilitiesBehaviour/orientation problems 60 54 39Difficulties washing and/or dressing and/or eating 10 5 2Difficulties in using the toilet 8 3 1Difficulties with transfers and/or movements 13 11 4Visual, auditory or speech difficulties 41 30 17Joint mobility and/or object grasping difficulties 27 17 6
Restriction of activity 67 100 29Officially recognized disability level 27 21 8Perceived state of health
Good or very good 36 33 64Fair 37 42 26Poor or very poor 27 25 10
Need of assistanceHuman assistance needed 38 8 3Technical aid needed 49 10 4Cell adaptations needed 45 8 4
Source: HID-prisons survey 2001, VQS-prisons survey 2001.

22 A. DÉSESQUELLES
V. Typology of the prison population
To establish general relationships between the different sets of indi-vidual data supplied by the HID survey, notably impairments and disabi-lities by their nature and origin, we performed a multiple correspondenceanalysis (MCA). Associated with a hierarchical classification, this analysisserves to establish a typology of the prison population. Alongside “stan-dard” socio-demographic variables — age sex, most recent occupation —and the time spent in prison, the active variables of the analysis are thevariables characteristic of the “objective” situation of persons with respectto disability (nature and origin of impairments, disability, restriction ofactivity). The other variables (perceived state of health, officially recog-nized level of disability, need of assistance assessed by replies to the threequestions of the VQS questionnaire) which focus on the consequences ofthis situation of disability, as well as the length of prison sentence and thetype of establishment (remand prison/penitentiary centre), closely corre-lated to the time already spent in prison, are included in the analysis forreference only.
The results are given in Figure 4 and Table 8. Four separate classeswere obtained. The first, which includes two in five prisoners, is charac-
Figure 4.– Scatter plot of the factor analysisSource: HID-prisons survey 2001, VQS-prisons survey 2001.

DISABILITY IN FRENCH PRISONS 23
TABLE 8.– MAIN CHARACTERISTICS OF THE CLASSES RESULTINGFROM THE HIERARCHICAL CLASSIFICATION
Class 1 (42%)
Class 2 (26%)
Class 3 (16%)
Class 4 (16%)
All prisoners
AgeAge 18-29 51% 61% 28% 15% 44%Age 30-49 42% 34% 59% 50% 44%Age 50 or over 7% 5% 13% 35% 12%
Time spent in prisonLess than 2 years 71% 67% 62% 31% 62%5 years or more 8% 13% 17% 42% 16%
Type of impairmentNo impairment 77% 0% 0% 0% 32%Intellectual or mental impairment 2% 98% 62% 55% 45%Motor impairment 7% 10% 91% 28% 25%Visceral or metabolic impairment 7% 14% 43% 43% 20%Visual impairment 2% 5% 11% 35% 10%Auditory impairment < 1% 2% 10% 53% 11%Speech impairment 0% 3% 5% 18% 5%Dental problems 4% 4% 8% 11% 6%
Cause of impairmentsDisease 16% 45% 61% 24%*Accident 5% 77% 19% 18%*Old age 1% 7% 19% 5%*Personal problems 36% 33% 30% 20%*Stress 35% 31% 32% 19%*Alcoholism, drug addiction 13% 8% 5% 5%*
DisabilitiesBehaviour/orientation problems 0% 91% 59 % 46% 39%Difficulties washing and/or dressing and/or eating 0% < 1% 8% 2% 2%Difficulties in using the toilet 0% < 1% 3% 2% 1%Difficulties with transfers and/or movements 0% 0% 20% 2% 4%Visual, auditory or speech difficulties 1% 7% 17% 77% 17%Joint mobility and/or object grasping difficulties 0% < 1% 33% 3% 6%
Restriction of activity 6% 21% 86% 51% 29%Officially recognized disability level 1% 4% 24% 14% 8%Perceived state of health
Good or very good 83% 66% 30% 45% 64%Fair 15% 26% 41% 40% 26%Poor or very poor 2% 8% 29% 15% 10%
Need of assistanceNo need of assistance 98% 93% 74% 86% 92%Human assistance needed 0% 2% 9% 6% 3%Technical aid needed 1% 1% 15% 6% 4%Cell adaptations needed 1% 3% 10% 6% 4%
* This corresponds to prevalences calculated with respect to all prisoners and not to those with an impair-ment only. This explains the difference with respect to Table 2.Source: HID-prisons survey 2001, VQS-prisons survey 2001.

24 A. DÉSESQUELLES
teristic of persons with no disability. All persons with no impairments areincluded in this class, and fewer than one quarter have one impairment.The prevalence of disabilities is practically zero and only 2% of persons inthis class reported a need of assistance. A total of 83% (compared with64% for all prisoners) consider themselves to be in good or even very goodhealth. It is a young group, with half of all members aged under 30.Inmates who have been in prison for less than two years (71% vs. 62%) arealso strongly over-represented in this class. The penal status (on remand/convicted) and the length of sentence are close to the average however.
The second class (one prisoner in four) is characteristic of personswith an intellectual or mental impairment (98% of persons in this class)and with an associated behaviour problem or problem of temporal or spa-tial orientation (91% of persons in the class). Predictably, this impairmentis generally attributed to a personal problem (36% of cases), to stress(35%) or to alcohol or drug consumption (13%). The state of health andneed of assistance of prisoners in this class are comparable with the aver-age. This is the youngest group (61% aged under 30 vs. 44% for all prison-ers). Prisoners serving a sentence of less than two years are slightly over-represented (31% vs. 24%), as are remand prison inmates (77% vs. 70%).
91% of the people in the third group (16% of prisoners) have a motorimpairment. Persons with transfer or movement problems are over-represented (20% vs. 4%) and 90% of persons with this type of disabilityare included in this class. Prisoners with joint mobility and object grasp-ing problems are also over-represented (33% vs. 6%), and likewise forwashing, dressing and eating (8% vs. 2%). The two most common causesof these disabilities are accidents (77% of cases) or illness (45%). 62% ofthe persons in this class (vs. 45% for all prisoners) also have an intellec-tual or mental impairment, 59% have behaviour and/or orientation pro-blems (vs . 39%) and 43% (vs . 20%) have a v iscera l or metabol icimpairment. It is in this group that the prevalence of restrictions of activityis highest (86% vs. 29%), as is the proportion of prisoners with an offi-cially recognized level of disability (24% vs. 8%) and of those with a needof assistance, of whatever kind (26% vs. 8%). 29% (vs. 10%) of the per-sons in this class consider that their state of health is poor to very poor.The 30-49 age group is over-represented (59% vs. 44%). The breakdownby time spent in prison, by penal status and, for convicts, by sentencelength, is no different from the average however.
The fourth class (also 16% of prisoners) is characteristic of personswith a sensory impairment. 53% (vs. 11%) have an auditory impairment,35% (vs. 10%) a visual impairment and 18% (vs. 5%) a speech impair-ment. Three-quarters of the persons in this class have problems seeing,hearing and/or speaking. Many have more than one impairment: 55% alsohave an intellectual or mental impairment, and 43% have a visceral ormetabolic impairment. The most frequently mentioned causes of these im-pairments are: illness (61% of cases), stress (32%), personal problems

DISABILITY IN FRENCH PRISONS 25
(30%) and old age (19%). The proportion of persons with a restriction ofactivity, an officially recognized level of disability or a need of assistance,though lower than the previous class, is also very high. The perceived stateof health is also slightly less poor. This is the oldest group (35% aged 50or over). Prisoners previously in senior and middle management occupa-tions are slightly over-represented (13% vs. 9%), while those who havebeen in prison for more than five years (42% vs. 16%), prisoners with asentence of five years or more (63% vs. 36%) and prisoners in penitentiarycentres (52% vs. 30%) are substantially over-represented. With the ageingof the prison population, the weight of this group, whose need of assis-tance is high, could grow further in the future.
Conclusion
The HID-prisons survey shows that situations of disability arestrongly over-represented in the prison population. The difference withrespect to the rest of the population is very probably attributable in part toa selection effect at entry into prison. However, within a single age group,the time spent behind bars significantly increases the probability of havinga disability.
Consequently, a non-negligible fraction of prisoners report a need ofassistance, and this rightfully raises the question of whether these needsare satisfied. Specially adapted cells for disabled prisoners do exist,though their number is very limited. The system of carers should also bedeveloped no doubt (Laplace et al., 2002). Lastly, more attention shouldperhaps be focused on preventing disability among all populations facingeconomic insecurity, and prison populations in particular. In this respect,it goes without saying that an improvement in prison living conditions iskey to reducing disability among prisoners.
REFERENCES
BEAUREPAIRE C. de, 1997, “Psychopathologie et détention”, Revue française des affaires sociales,No. 1, pp. 213-224.
CAMBOIS E., DÉSESQUELLES A., RAVAUD J.-F., 2003, “The gender disability gap”, Population andSocieties, No. 386.
COLDEFY M., FAURE P., PRIETO N., 2002, “La santé mentale et le suivi psychiatrique des détenusaccueillis par les services médico-psychologiques régionaux”, DREES-Études et résul-tats, No. 181.
COLIN M., JEAN J.-P., 1997, “Droit aux soins et amélioration de la condition des détenus : deuxobjectifs indissociables”, Revue française des affaires sociales, No. 1, pp. 17-32.
DARGENT-PARÉ C., BOURGEOIS D., 2000, “La santé bucco-dentaire”, in Leclerc A., Fassin D.,Grandjean H., Kaminski M., Lang T. (eds.), Les inégalités sociales de santé, éditionsLa Découverte/INSERM, pp. 267-282.
DÉSESQUELLES A. and the HID-prisons project group, 2002, “Le handicap est plus fréquent enprison qu’à l’extérieur”, Insee première, No. 854.

26 A. DÉSESQUELLES
DÉSESQUELLES A., 2003, “L’enquête HID-prisons : bilan d’une enquête particulière”, Courrierdes Statistiques, No. 107, pp. 43-54.
GUILLONNEAU M., KENSEY A., 1997, “La santé en milieu carcéral – Éléments d’analyse démo-graphique”, Revue française des affaires sociales, No. 1, pp. 41-60.
HASSOUN D., 1998, “Précarité et état de santé bucco-dentaire”, Questions d’économie de la san-té, No. 16.
KENSEY A., CASSAN F., TOULEMON L., 2000, “La prison : un risque plus fort pour les classespopulaires”, Cahiers de démographie pénitentiaire, No. 9.
KENSEY A., 2001, “Vieillir en prison”, Cahiers de démographie pénitentiaire, No. 10.LALANDE F., 1997, “La santé des détenus et l’état du système de soins avant la réforme”, Revue
française des affaires sociales, No. 1, pp. 61-72.LAPLACE L., DANIEL J., BELLONCLE M., ROBERT P.-Y., BOUCHARD I., PEROT A., FAC C., BERNARD B.,
2002, “Dépendance pour les actes de la vie quotidienne en milieu carcéral dans la régionpénitentiaire Ouest”, Revue d’épidémiologie et de santé publique, No. 50, pp. 453-461.
LA ROSA E., 1998, Santé, précarité, exclusion, Paris, PUF, 222 p.MORMICHE P., 1998, “L’enquête HID de l’Insee – Objectifs et schéma organisationnel”, Courrier
des statistiques, No. 87-88, pp. 7-18.MORMICHE P. and the HID-prisons project group, 2000, “Le handicap se conjugue au pluriel”,
Insee première, No. 742.MOUQUET M.-C. et al., 1999, “La santé à l’entrée en prison en 1997 : un cumul des facteurs de
risque”, DREES – Études et résultats, No. 4.OBRECHT O., 1998, “Précarité et prison”, in Lebas J., Chauvin P., Précarité et santé, Paris, Flam-
marion, pp. 189-201.PARIZOT I., 1998, “Trajectoires sociales et modes de relations aux structures sanitaires”, in
Lebas J., Chauvin P., Précarité et santé. Paris, Flammarion, pp. 33-43.PLICHART P., GOLSE A., 1997, “Psychiatrie en prison, une clinique aux limites”, Revue française
des affaires sociales, No. 1, pp. 161-178.RAVAUD J.-F., LETOURMY A., VILLE I., 2002, “Identifying the population with disability”,
Population-E, 57(3), pp. 529-552.ROCHÈRE B. de la, 2003, “La santé des sans-domicile usagers des services d’aide”, Insee première,
No. 893.WHO, 1980, International Classification of Impairments, Disabilities and Handicaps. A manual
of classification relating to the consequences of disease, Geneva, WHO publications.

DISABILITY IN FRENCH PRISONS 27
DÉSESQUELLES Aline.– Disability in French prisons: how does the situation differ from thatof the general population?In 2001, an extension of the “ HID” disability and dependency survey was conducted on
a sample of almost 1,300 prisoners in France. One prisoner in two has at least one disability. Thefrequency of mental disability is particularly high. For a similar age and sex structure, the preva-lence of physical disabilities is almost three times higher among prisoners than among the gene-ral population. This difference is the result of two effects that are difficult to dissociate: aselection effect at entry into prison and a detention effect. For example, among prisoners servinglong sentences, after controlling for age, the time already spent in prison is significantly corre-lated with the presence of disabilities.
Prisoners with disabilities are likely to need assistance, be it human help, technical aidsor cell adaptations. 8% of prisoners have such needs. Need of assistance is particularly frequentamong prisoners with motor impairments, but also among prisoners who are often older, who allsuffer from a sensory impairment and who also often have several types of impairment.
DÉSESQUELLES Aline.– Le handicap en milieu carcéral en France : quelles différencesavec la situation en population générale ?
En 2001, une extension de l’enquête Handicaps, incapacités, dépendance (dite HID) aété réalisée auprès d’un échantillon de près de 1 300 détenus en France. Un détenu sur deux aau moins une incapacité, et la fréquence des incapacités d’origine psychique apparaît parti-culièrement élevée. À structure par âge et par sexe similaire, la prévalence des incapacitésd’origine physique est près de trois fois plus élevée en milieu carcéral qu’en population géné-rale. Cet écart résulte de deux effets qu’il est difficile de dissocier : un effet de sélection àl’entrée, d’une part, et un effet de la détention, d’autre part. On observe ainsi que parmi lescondamnés à de longues peines, après contrôle de l’âge, l’ancienneté de la détention est signi-ficativement corrélée à la présence d’incapacités.
Les détenus en situation d’incapacité sont susceptibles d’avoir besoin d’une aide, qu’ils’agisse d’une aide humaine, d’équipements particuliers ou encore d’aménagements dans lacellule. 8 % des détenus sont dans ce cas. La demande d’aide apparaît particulièrement fré-quente chez les détenus ayant des déficiences motrices, mais aussi chez des détenus souventplus âgés, dont le point commun est la présence d’une déficience sensorielle mais qui cumu-lent souvent plusieurs types de déficiences.
Aline DÉSESQUELLES, Institut National d’Études Démographiques, 133 boulevard Davout,75980 Paris cedex 20, France, Tel: 33 (0)1 56 06 22 76, Fax: 33 (0)1 56 06 21 99, e-mail:[email protected]