diritto ed economia europea - benvenuto su ams tesi...
TRANSCRIPT

1
Alma Mater Studiorum – Università di Bologna
DOTTORATO DI RICERCA IN
DIRITTO ED ECONOMIA EUROPEA
Ciclo XXVI
Settore Concorsuale di afferenza: 13/A1
Settore Scientifico disciplinare: SECS-P/01
EDUCATIONAL MISMATCH IN ITALIAN AND EUROPEAN LABOUR MARKETS
(STARTING FROM THE UK)
Presentata da: Dott. LUCA CATTANI
Coordinatore Dottorato Relatore
Chiar.ma Prof.ssa Chiar.mo Prof.
LUCIA SERENA ROSSI GILBERTO ANTONELLI
Esame finale anno 2014

2

3
acknowledgements
I thank Gilberto Antonelli, my supervisor, for his help and guidance.
I thank Kate Purcell, my tutor during my stay at the Warwick IER as a research student,
who helped me and gave me a warm welcome in Coventry.
I gratefully thank Giovanni Guidetti, Dorel Manitiu and Giulio Pedrini for their support.
I thank Andrea Cammelli, Angelo Di Francia and Silvia Ghiselli from AlmaLaurea for their
hospitality and generosity.
I thank Peter Elias, Marco Ruffino, Pietro Scalisi and Francesca Gallo for their precious
help and suggestions.
To Diego, Malvina, Aroldo, Livia, Archimede, Giovanna, Martina, Luca, Cecilia, Filippo,
Angela and Grazia

4
5
SYNOPSIS
The present doctoral thesis is structured as a collection of three essays.
The first essay, “SOC(HE)-Italy: a classification for graduate occupations” presents the
conceptual basis, the construction, the validation and the application to the Italian labour
force of the occupational classification termed SOC(HE)-Italy. I have developed this
classification under the supervision of Kate Purcell during my period as a visiting research
student at the Warwick Institute for Emplyment Research. This classification links the
constituent tasks and duties of a particular job to the relevant knowledge and skills imparted
via Higher Education (HE). It is based onto the SOC(HE)2010, an occupational
classification first proposed by Kate Purcell in 2013, but differently constructed. Page 7.
In the second essay “Assessing the incidence and wage effects of overeducation among
Italian graduates using a new measure for educational requirements” I utilize this
classification to build a valid and reliable measure for job requirements. The lack of an
unbiased measure for this dimension constitutes one of the major constraints to achieve a
generally accepted measurement of overeducation. Estimations of overeducation incidence
and wage effects are run onto AlmaLaurea data from the survey on graduates career paths. I
have written this essay and obtained these estimates benefiting of the help and guidance of
Giovanni Guidetti and Giulio Pedrini. Page 83.
The third and last essay titled “Overeducation in the Italian labour market: clarifying the
concepts and addressing the measurement error problem” addresses a number of theoretical
issues concerning the concepts of educational mismatch and overeducation. Using Istat data
from RCFL survey I run estimates of the ORU model for the whole Italian labour force. In
my knowledge, this is the first time ever such model is estimated on such population. In
addition, I adopt the new measure of overeducation based onto the SOC(HE)-Italy
classification. Page 145.
These essays are based onto elaborations on Istat data from the labour force surveys (RCFL)
and the survey on Italian professions. Elaborations under my responsibility, usual
disclaimers apply. The first two essays are based on AlmaLaurea data from the graduates
career paths survey. Usual disclaimers apply.

6
7
SOC(HE)-Italy: a classification for graduate occupations
Luca Cattani*, Kate Purcell
˚, Peter Elias
§
*Department of Economics, University of Bologna
˚Institute for Employment Research (IER), University of Warwick
§Institute for Employment Research (IER), University of Warwick
Abstract. This essay presents an application to the Italian labour force of the British SOC(HE)
classification for graduate occupations. In order to achieve this goal, the classification is replicated, using
methodology that differs slightly to take account of differences in existing Italian data, to construct
SOC(HE)-Italy. This classification allocates each of the official 800 Italian job titles to four occupational
categories distinguishing between ‘graduate’ and ‘non-graduate’ groups on the basis of their relative
levels of knowledge and skills requirements. It is then validated using RCFL and AL data and used to
analyze changes in the Italian occupational structure that occurred soon before and after the financial
crisis that took place in 2008, and to compare the Italian structural trends and the British ones. This
analysis reveals that the decrease in the utilization of highly qualified labour in the Italian labour market
started before the beginning of the ongoing recession, which contradicts the findings of analyses reported
in pre-existing literature.
JEL classification: I2, J2
Key words: higher education, occupational classification, skills, graduate labour market.
Acknowledgments. This essay has been written relying on elaborations on AlmaLaurea data: we are grateful to
Andrea Cammelli, Angelo Di Francia and Silvia Ghiselli for their support and their useful comments and
suggestions. We also greatfully thank Pietro Scalisi and Francesca Gallo from Istat, the Isfol personnel and
Marco Ruffino for their precious support. We also have utilised data from the Istat survey on Italian professions
and from the Istat survey on Italian labour force (RCFL): elaborations on these data have been run under our
responsibility. Usual disclaimers apply.

8
9
Introduction
In this essay the utilization of highly qualified labour in advanced economies is analyzed
both in terms of incidence and in terms of returns to education. The former approach focuses
on changes in national occupational structures including investigation of the creation or
evolution of new and pre-existing jobs, while the latter emphasize the explanatory role
wages play when analyzing the fit between supply of and demand for qualified labour. In
Italy, studies on the topic (AlmaLaurea, 2012; Cnel, 2012) directly apply the national
occupational classification which is based on the conceptual basis embodied in the Isco88
structure. Following this international standard, Italian occupational groups and job-titles are
ranked according to assessment of the level of skill required to undertake them effectively,
grouped into eight aggregated skill levels that define eight occupational Major Groups.
Changes in the distribution of the employed labour force over these groups are monitored so
that, for example, the expansion over time of the first two or three groups is taken to
indicate increased demand for highly skilled labour. Although educational qualifications are
included in the criteria applied in classifying occupations, neither Isco and the Italian
classification refer solely to the knowledge and skills imparted in Higher Education (HE)
when establishing the skill level of the professions they rank. Reference is also made to the
required work experience and the nature of the tasks and duties typically associated with
that job. As a consequence, occupational classifications cannot be applied when trying to
distinguish between ‘graduate’ and ‘non-graduate’ jobs in order to assess changes in the
occupational structure or assess the extent to which graduates are or are not entering
appropriate employment for people with their qualifications.
In recognition of the need to monitor the impact of HE expansion and its impact on
occupational change and opportunities available to labour market entrants, a new
classification of occupations, named SOC(HE) has been developed for the UK by Elias and
Purcell (2004; 2013) to investigate the relationship between the knowledge and skills
acquired in HE and the jobs they were entering in their early careers. As part of my PhD
research, working with Elias and Purcell, I have developed a new measure, SOC(HE)-Italy,
based on the original SOC(HE) but differently constructed, to analyze changes that have
occurred in the Italian occupational structure between 2004 and 2010 and aiming at a
comparison with the trends recorded in the pre-existing literature before and after the
financial crisis that took place in 2008. Paragraph §1 introduces SOC(HE) and its
conceptual basis along with a brief review of some theoretical issues concerning
occupational classifications and their applications. In paragraph §2 we present an in-depth
10
description of the construction of SOC(HE)-Italy and the relative validation on Istat and
AlmaLaurea data. Paragraph §3 contains the analysis of the changes occurred in the Italian
occupational structure and a brief comparison with the British case.
1. Classifying occupations and measuring skills
It is hard to evaluate changes in the occupational structure generated by economic growth
and technological development without reference to the occupational classifications. These
last ones, in turn, are affected and somehow distorted by those same changes they intend to
capture, measure or describe. In fact, the advent of knowledge society quickened such
transformations with the appearance of new jobs or the alteration of the cognitive contents
and the tasks typically associated with some pre-existing professions. More specifically,
many jobs traditionally considered as manual labour have come to encompass a number of
immaterial tasks with higher levels of skill or knowledge requirements (Kochan et al.,
1999). On the other hand, massive updates resulting in radical transformations of these
classifications can actually hamper the possibility to build consistent time series and are
often opposed by operators, such as employment offices. Strategies to combine these two
opposing needs has brought in many cases (Gallo et al., 2007; Elias and Purcell, 2004;
2013) to integrate rather than substituting traditional instruments with new classificatory
tools, which were shaped to put in relationship jobs and their relative cognitive contents.
Referring to knowledge society and graduates’ labour market, the aim is to
“…put ‘the knowledge society’ under the microscope by looking at the jobs
that graduates do and the knowledge required to do them.” (Elias and Purcell,
2013)
Broadly speaking, many attempts were made to synthetize the new occupational and skill
structures and the need to make reliable comparisons between countries led to describe few
and highly aggregated major groups, anyhow identified. Reich’s (1991) “three jobs of the
future” are a good example of such aggregations: Americans, according to this view, would
have been employed only as “symbolic analysts”, in “in-person services” or as “routine
production workers”. The conceptual basis of these three categories is very close to embody
the distinction between different utilizations of knowledge on the job. Especially the first
and last category are referred exclusively to the nature of the job and the type of utilization
of knowledge the job requires. Symbolic analysts are those workers who produce or
manipulate knowledge, often exposed to international competition and asked to find

11
innovative solutions. Routine production workers are, at the other extreme, those employed
in routine and non-knowledge intensive tasks, corresponding to the old “blue collar”
professions, upgraded and enriched with immaterial tasks as in Kochan et al. (1999) such as
data entry, software re-coding, call centers, etc. Unfortunately, the second category of
workers, those employed in in-person services, has no relations to knowledge utilization and
consequently, cannot be subjected to the analysis we propose. Actually, Reich’s intention
was to rank jobs by sectors rather than by the use of knowledge and with reference to his
three main categories of occupation it is relatively straightforward to identify three sectors
ranked by innovativeness and global competition exposure. Following this perspective,
Reich could be considered as precursor of Moretti’s (2013) “three Americas”: the first one
(e.g. Silicon Valley) is highly dynamic and innovative and engaged as a forerunner in global
competition. At the same time, the concentration of human capital in urban areas will act as
a multiplier attracting in-person services, increasing their relative demand and thus raising
employment and wages in all sectors; the second (e.g. the old “Rust Belt”) is composed of
those traditional productions exposed to and beaten by international competitors such as
China and Brazil endowed with a relatively cheaper unskilled labour force; the last one is
lying in between the two and will end up, sooner or later, getting promoted to the first one or
relegated to the second one. All in all, Reich’s view appears more evocative of job
descriptions based on the relation between jobs and knowledge and it is, interestingly,
consistent with recent studies aimed at describing different types of ‘knowledge workers’.
Brown et al. (2011) classified these as developers, demonstrators and drones: the first and
last remarkably close to Reich’s symbolic analysts and routine production workers. In fact,
developers appear to be all but the most senior managers, researchers and professionals
while drones are basically overeducated skilled workers employed in routine but immaterial
tasks. However, all of the three knowledge workers share a common conceptual basis that
relies in the utilization or dissemination of knowledge itself. Demonstrators are, in fact,
defined following the same perspective as communicators or executors of pre-existing
knowledge. Nonetheless, this taxonomy appears more oriented towards hiring standards
than to the direct linking between knowledge imparted via higher education and knowledge
and skills required to carry out a job. This is a limit one must take into account when
analyzing graduate jobs because hiring standards may account for credential inflation or
signalling rather than for cognitive contents associated with the assigned tasks. Thus, if our
purpose is to develop a classification capable of assessing the direct relationship between
the knowledge acquired via Higher Education (HE) and the knowledge used on the job,
there is no way to avoid reference to the nature of the jobs we are classifying and the

12
cognitive contents (knowledge, skills and competences) they encapsulate. A job should then
be defined as a graduate job only if it generally requires study on an HE undergraduate or
higher-level course in order to be able to fulfill the tasks well. This is exactly the starting
point from which Elias and Purcell developed the conceptual basis of the UK Standard
Occupational Classification for Higher Education, known as SOC(HE), in 2004. SOC(HE)
constituted a consistent application of these criteria. It received considerable attention
among policy makers, analysts and careers advisers in the UK and its potential has also been
explored with reference to Brazil, Portugal and India (Comin et al., 2010; Raffery and Dale,
2008; Basant and Mukhopadhyay, 2009; UUK, 2010; HEFCE, 2011; Figueiredo et al.,
2011; Unni and Sarkar, 2011). Application of the original SOC(HE) to very different labour
markets with substantially lower HE participation such as Brazil and India revealed the
classification’s limitations for international comparison and inspired the authors to develop
a radically revised version, SOC(HE) 2010. The application of this revised classification to
the Italian labour force thus constitutes a testing SOC(HE)2010 as a useful tool for
comparative research between countries, as well as a potentially valuable way to investigate
change in Italian graduate labour market trends.
1.1 Occupational classifications
Official occupational classifications based on the International Standard Classification for
Occupation (Isco88 and its last update Isco08), such as the British SOC and the Italian CP,
do recognize the need to define a job regardless the employees’ characteristics and to link it
to some extent to a certain level of skills. According to the International Labour Office
(ILO) a job is defined as a set of tasks and duties actually performed or designed to be
performed by one person, characterized by a high level of similarity. Since its very first
attempts to suggest an international classification, ILO has in fact focused on the nature of
the work performed and has gradually shifted the attention on the skills needed to
competently perform it rather than on the economic sector of activity (e.g. the NACE
sectors) or on the social position employees occupy as these dimensions tend to differ
between countries and hamper classifications’ comparability. Skills were in turn defined as
the ability to carry out the tasks and duties of a particular job, articulated into two different
dimensions, namely skill level and skill specialization. (ILO, 1990; 2012). Skill
specialization refers to the concerned fields of knowledge and the economic sector. The
level of skills required by a particular job refers, on the other hand, to the complexity and
range of its constituent tasks and duties and the amount of formal and informal education

13
and work experience needed to competently perform them. The concept of skill level and its
operationalization in the classification Isco88 represents the biggest innovation in ILO
proposals and it is considered to be, along with political and historical facts1, the major
source of the increasing consensus and popularity of this international standard.
Table 1.1 Isco88/08 Major Groups and relative Skill Levels
Major Groups
Skill Level
Isco88
(source: Elias, 1997)
Isco08
(source: Gallo et al.,
2012)
1 Managers - 3 – 4
2 Professionals 4 4
3 Technicians and associate professionals 3 3
4 Clerical support workers 2 2
5 Service and sales workers 2 -
6 Skilled agricultural, forestry and fishery
workers 2 -
7 Craft and related trade workers 2 -
8 Plant and machine operators and assemblers 2 -
9 Elementary occupation 1 1
0 Armed forces - 1 – 2 – 4
Although skill levels in table 1.1 are referred to Isced categories2 as suggested by ILO, this
doesn’t imply that competences needed to carry out jobs encompassed in these Major
1 Elias (1997) and Gallo and Scalisi (2012) attribute Isco88 success also to the larger involvement of
national statistical offices, the adoption by the UK, Australia and EU, the collapse of Soviet Union
and the consequent need for Eastern European countries to substitute the obsolete socialist
classifications. 2 Categories displayed in table 1.1 are referred to Isced76 classification that ranks qualifications as
follow: Level 1, primary education; Level 2, secondary education; Level 3, Upper secondary
14
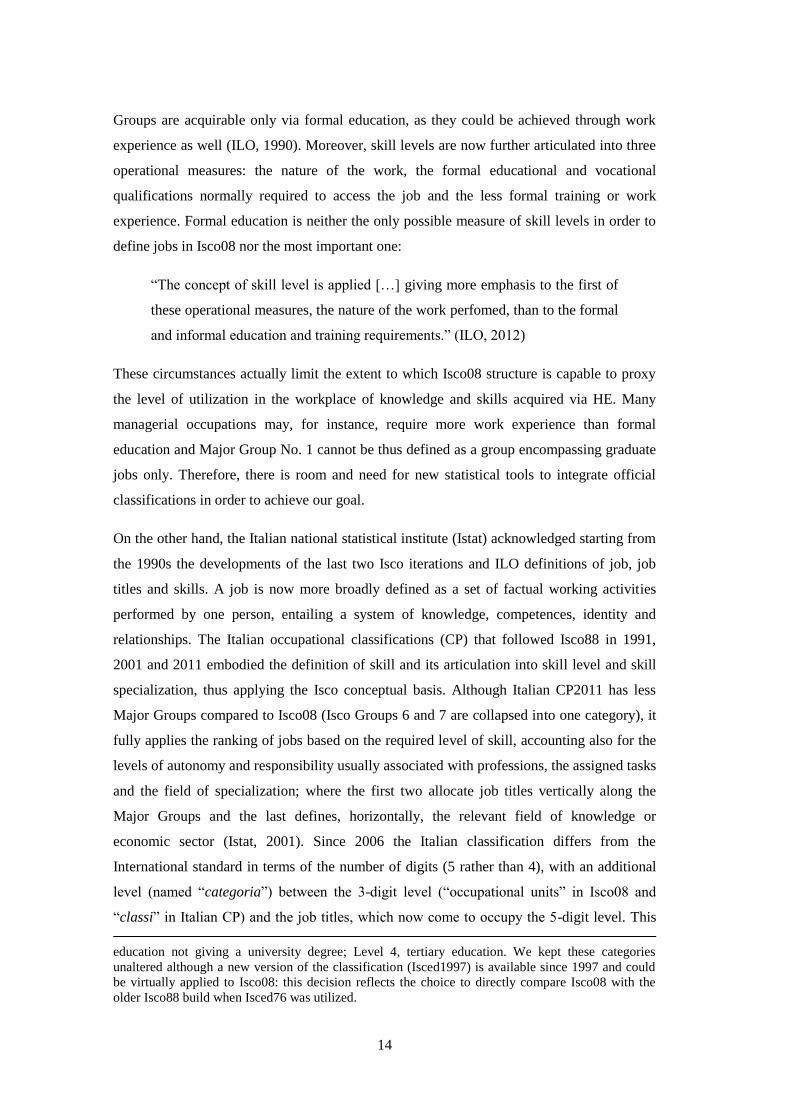
Groups are acquirable only via formal education, as they could be achieved through work
experience as well (ILO, 1990). Moreover, skill levels are now further articulated into three
operational measures: the nature of the work, the formal educational and vocational
qualifications normally required to access the job and the less formal training or work
experience. Formal education is neither the only possible measure of skill levels in order to
define jobs in Isco08 nor the most important one:
“The concept of skill level is applied […] giving more emphasis to the first of
these operational measures, the nature of the work perfomed, than to the formal
and informal education and training requirements.” (ILO, 2012)
These circumstances actually limit the extent to which Isco08 structure is capable to proxy
the level of utilization in the workplace of knowledge and skills acquired via HE. Many
managerial occupations may, for instance, require more work experience than formal
education and Major Group No. 1 cannot be thus defined as a group encompassing graduate
jobs only. Therefore, there is room and need for new statistical tools to integrate official
classifications in order to achieve our goal.
On the other hand, the Italian national statistical institute (Istat) acknowledged starting from
the 1990s the developments of the last two Isco iterations and ILO definitions of job, job
titles and skills. A job is now more broadly defined as a set of factual working activities
performed by one person, entailing a system of knowledge, competences, identity and
relationships. The Italian occupational classifications (CP) that followed Isco88 in 1991,
2001 and 2011 embodied the definition of skill and its articulation into skill level and skill
specialization, thus applying the Isco conceptual basis. Although Italian CP2011 has less
Major Groups compared to Isco08 (Isco Groups 6 and 7 are collapsed into one category), it
fully applies the ranking of jobs based on the required level of skill, accounting also for the
levels of autonomy and responsibility usually associated with professions, the assigned tasks
and the field of specialization; where the first two allocate job titles vertically along the
Major Groups and the last defines, horizontally, the relevant field of knowledge or
economic sector (Istat, 2001). Since 2006 the Italian classification differs from the
International standard in terms of the number of digits (5 rather than 4), with an additional
level (named “categoria”) between the 3-digit level (“occupational units” in Isco08 and
“classi” in Italian CP) and the job titles, which now come to occupy the 5-digit level. This
education not giving a university degree; Level 4, tertiary education. We kept these categories
unaltered although a new version of the classification (Isced1997) is available since 1997 and could
be virtually applied to Isco08: this decision reflects the choice to directly compare Isco08 with the
older Isco88 build when Isced76 was utilized.

15
iteration of CP2001 was termed NUP (Nomenclatura Unità Professionali) and constituted a
basis for the development of the new version of CP, the CP2011. In the same year a study
group with members from Istat and the Italian institute for vocational training (Isfol) run the
first survey on Italian professions aiming at developing a new tool for linking the knowledge
and skills required in a particular job and formal qualifications as articulated in the
European Qualification Framework (EQF)3. This attempt to link directly the knowledge
imparted via formal education and the knowledge used in the work place can be fully
ascribed as part of the international debate on the integration of traditional classificatory
tools to measure and describe changes in national occupational structures, with a specific
focus on graduate jobs (Gallo et al., 2007). The major outcome of this study group consisted
in a translation device that referred each of the 800 Italian job titles to a certain EQF level,
and this is of much interest with respect to our goal to provide a new statistical tool or
classification capable to measure the utilization of highly qualified labour in the labour
market.
Before proceeding to present and discuss SOC(HE) and its Italian application it is salutary
to consider the theoretical and statistical properties a classification should have in order to
guarantee the robustness of the classified data4.
a) Reliability. Information obtained from the same classification process but from different
data or in different periods should produce consistent results, within a normal tolerance
of statistical variation stemming from sampling procedures;
b) Validity. Variables measured in a given sample should therefore reflect the relative
values in the population from which they are drawn without systematic bias. If it is
known, for instance, from the 2011 census on Italian population that 18.7% of Italian
workers are graduating, the corresponding purpose in the sample should not differ from
this benchmark in a statistically significant way. These two first properties can be
considered as part of a same concept named technical derivation: the extent to which
methods adopted to obtain information from data are replicable;
c) Theoretical underpinnings. A classification should be as coherent as possible in relation
to the theoretical concepts it intends to represent.
3 The European Qualification Framework (EQF) consists in a transnational translation device and was
issued by the European Commission in 2008 to make different national qualifications more readable
across the continent and “promoting workers' and learners' mobility between countries and
facilitating their lifelong learning” (Recommendation 111/2008). It relates all European national
qualifications to 8 major levels, referring to knowledges, skills and competences acquired in their
relative education/training processes. We will discuss more in depth this device in subparagraph §2.2 4 Properties listed and summarized in this subparagraph refer to Elias (1997), Elias and McKnight
(2001) and Goldthorpe (1988).
16
d) Homogeneity/heterogeneity of the categories. There should be a minimum level of
homogeneity within the categories identified by the new classification and a reasonable
level of heterogeneity among them, otherwise it would be hard to extrapolate useful
information about patterned social or economic difference or trends..
When considering occupational classification, the consistency of coding procedures of job
titles is a major concern. Elias (1997) reported results from seven studies which operated
two different coding procedures on the same datasets and investigated the consistency of
occupational allocations among these. These recoding studies highlighted how occupational
coding can be described as an “inexact process” leading to significant differences according
to the different types of coding procedure adopted. Nonetheless, disagreement among coders
(or between coding procedures) often occurs at more disaggregated levels, resulting in
different codes falling in the same Major Group. As a consequence, levels of agreement
consistently increase with the level of aggregation, reporting on average less than 75%
workers identically allocated at the 3-digit level (Occupational Units) and more than 85% at
the 1-digit level (Major Groups). In the context of transnational comparability, this means
that comparisons made at more detailed levels (e.g. 3-digit) are subject to constraints in this
reliability and validity while comparing more aggregated levels (e.g. 1 and 2 digit) should
benefit of a reasonable trust.
1.2 SOC(HE)
As discussed in Subparagraph §1.1 above, in the course of their research on graduate career
paths, Elias and Purcell (2004) developed SOC(HE), an aggregate occupational
classification to measure the extent to which highly qualified labour is utilized in the UK
labour market. They based this classification on the British Standard Occupational
Classification (SOC2000) in order to meet three major needs: referring to the nature of the
work performed and its required skill/knowledge level (granted by Isco conceptual basis
embodied in SOC); referring data to the national dimension avoiding long and costly
additional data collection procedures (and thus relying on Labour Force Surveys data);
enabling the construction of time-series indicators to evaluate evolutions in the occupational
structure. Basically, building SOC(HE) consisted in allocating the 353 units groups of
SOC2000 in two broad categories, “graduate” and “non-graduate” jobs, linking explicitly
unit groups to formal qualification thus assessing that their relative tasks and duties required
or not knowledge and skills, acquirable via HE only, to be competently performed. In the

17
first version, termed SOC(HE)2000, the “graduate jobs” category was further disaggregated
into four subcategories on the basis of differences between age groups in terms of the share
of graduates employed in such unit groups: traditional graduate jobs, comprising the
established professions for which entrants are normally required to be qualified, such as
solicitors, doctors and professors; modern graduate jobs, in which graduates have been
employed since the educational expansion in the 1960s, such as managerial occupation, IT,
Knowledge Intensive Business Services (Kibs) and creative vocational areas; new graduate
jobs, which entry route has only recently changed and now requires candidates to have a
degree, such as marketing and sales managers or physiotherapists; niche graduate job,
representing the boundary between ‘graduate’ and ‘non-graduate’ professions and where the
majority of incumbents do not possess a HE title but with stable and increasing niches
normally only accessible to specialists trained via HE, like nurses, midwives, hotel
managers, etc. This taxonomy, properly validated, allowed to measure with time-series the
expansion in the utilization of graduate labour during the 1980s and 1990s. According to
SOC(HE)2000, more than 35% of the British labour force was employed in a graduate job
in the year 2000, 10% more than in 1975. This increase was due to the stable and consistent
growth in jobs belonging to ‘modern graduate’ and ‘new graduate’ groups, boosted by
technical and organizational change that accompanied the advent of the knowledge society.
Despite the above mentioned raised interest and the applications to other national contexts,
Elias and Purcell (2013) were concerned about the sustainability over time of such
conceptual bases, rooted in statistical thresholds subject to further changes, as graduates
continued to crowd the labour market ending up being employed even in jobs and sectors
which could hardly be defined as requiring HE preparation. All in all, the operational
definitions of the SOC(HE)2000 categories seemed to insufficiently translate the need to
focus on the nature of the job and the assigned tasks, capturing market realizations that
could account, like in Brown et al. (2011), for hiring standards and qualification inflation as
well. Simultaneously, the need to make this analytical method more transferable across
nations suggested to base it onto the relationship between “higher education, knowledge
development and its labour market application”, focusing on the type of use of knowledge
made on the job post.
Reference was made to three clusters of competence identified in a previous study (Purcell
et al., 2004) in which 220 British graduates were interviewed seven years after graduation to
assess the nature of their work with respect to tasks, responsibilities, interpersonal

18
relationships, knowledge and skills. These clusters were termed ‘knowledge’, ‘strategic
skills’ and ‘interactive skills’ and re-defined in the new classification as:
a. Specialist expertise deriving from HE knowledge. This is basically “detailed knowledge
and/or skills for which the normal foundation is an undergraduate degree course and
where these are continually being exercised, developed and/or refined in practical and/or
theoretical terms”;
b. Orchestration expertise. Based on “high-level competence based on knowledge and
skills that may have been developed either in HE or through experience (and most often,
both of these). It incorporates the ability to draw together knowledge and knowledge-
holders, to direct and co-ordinate activities, assess alternatives, evaluate risks and
influence or make high-level decisions on the basis of available evidence”;
c. Communication expertise. Consisting in knowledge and skills, normally involving well-
developed interactive skills, concerned with the exercise of high-level competence in the
communication and dissemination of knowledge, ideas and information, between
individuals, within groups, or for mass-production or consumption, delivered in person
or using digital media.” (Elias and Purcell, 2013)
Each job, at the the 4-digit unit group of SOC2010 was assigned a score on a 1-9 scale for
each of these three dimensions, according to the degree of utilization it required of these
abilities and considering a minimum score of 6 as indicative of a level of knowledge or
skills normally imparted via HE. The scoring methodology can be described as a qualitative
job analysis carried out separately by researchers, who then debated and resolved
differences where their scores differed on the basis of information contained in the official
classifications coding manuals. Unit groups not scored at six on any of the dimensions were
classified as non-graduate jobs and those where the score on one or more was six or above
were thus allocated to one of the following three occupational categories, according to the
highest score or, in the few cases where two were equally high, the one that defined their
capacity to do obtain the job. The categories were as follows:
Experts: workers in knowledge-intensive occupations, requiring the utilization and
production of specialist HE knowledge and skills. Hiring standards and the capacity to
competently perform tasks and duties associated with such jobs, are directly related to
possession of specialist knowledge and/or high level skills. Examples include solicitors,
civil and mechanical engineers and chemical and physical scientists.

19
Orchestrators (or Strategists): workers often employed in managerial activities and
required to orchestrate their knowledge and the knowledge of others to “evaluate
information, assess options, plan[s], make decisions and co-ordinate the contributions of
others to achieve objectives” (Elias and Purcell, 2013). Managers and directors are
Orchestrators, which includes also national and local government senior administrative
occupations, senior officers in the police force and in other public sector areas.
Communicators: workers employed in media, advertising and teaching whose major activity
consists in transmitting knowledge or information to others. These jobs entail substantial use
of interactive skills, were they “interpersonal skills, creative skills or high-level
technological knowledge, capacity to access and manipulate information and/or an
understanding of how to communicate information effectively to achieve objectives” (ibid).
The Communicator category includes journalists, actors, public relation professionals and
graphic designers.
2. SOC(HE)-Italy: construction and validation
The measure of the degree of utilization of highly qualified labour in the Italian labour
market we wanted to develop was subject to a number of caveats:
1. It should relate to both the nature of the work and the required knowledge and skills
needed to perform it, assessing the extent to which this knowledge and the skills
were normally acquirable via HE; it should not relate to personal characteristics of
the job post holders such as age, gender, or to the salary levels and occupation.
References to such dimensions can, in fact, divert our focus from the nature of the
jobs we want to analyze to a concern with the economics, social or political
dynamics of job allocation, where the qualifications candidates are required to
possess in order to be appointed, may reflect credential inflation or cultural capital
(Bourdieu and Passeron, 1968) rather than job-related variables;
2. Each category should have clear criteria and boundaries, to minimise coding
disagreement and achieve an acceptable level of reliability and comparability with
the applications of the same criteria to other national labour forces; it should be easy
to develop, without the need for additional data collection, based on national
microdata with the highest possible degree of reliability. This is crucial for a
measurement that allow us to build time-series indicators with reference to each
country.

20
The choice to build an application of SOC(HE)2010 to the Italian labour force is motivated
by its conformity to these criteria. Firstly, the SOC(HE)2010 classification is not vulnerable
to accusation that supply and demand fluctuations contribute to allocation of jobs to
graduate or non-graduate classification to the extent that SOC(HE)2000 was, whereby over-
supply of highly qualified labour changed the qualification profile of previously non-
graduate jobs. Secondly, the allocation of each of the 800 Italian job titles to one of the four
occupation categories of SOC(HE)2010 (Experts, Orchestrators, Communicators and Non
Graduate Jobs) make it consistent with the conceptual basis embodied in Isco08 and
consequently in the Italian Occupational Classification (CP) in which the ranking of
professions is established on the basis of their relative skill level and skill specialization.
Thirdly, the allocation to ‘graduate’ and ‘non-graduate’ categories makes explicit reference
to the formal education required to carry out the tasks and duties associated with the
concerned job title enabling us to directly assess which jobs require HE to be competently
performed. Finally, data from Italian labour force survey (RCFL) and from AlmaLaurea
database (a consortium of 64 Italian universities that surveys graduates career paths) are
consistent with the above mentioned needs as they are easily available, referred to the
national dimension and code professions utilizing CP2011 and its predecessors CP2001 and
NUP, the CP2001 iterated and modified version issued in 2006.
The procedure followed by Elias & Purcell to allocate each SOC2010 unit group to one of
the four categories consisted, as noted above, in a qualitative on-desk assessment based on
information contained in SOC2010 classification resulting in a score on a 1-9 point scale.
This procedure is not feasible when applying SOC(HE) to Italian professions as economic,
social and cultural differences greatly limit the extent to which job descriptions are
transferable across countries. Moreover, Italian occupational classifications contain less
information than the UK SOC as they make no reference at all to the formal or informal
education workers in a particular job should possess and this fact could limit the extent of
agreement when assessing whether the knowledge and skill utilized in the job place were to
be acquired through the HE system. We thus developed an allocation strategy which makes
direct reference to the skills and competences that the job-holders need to carry out their job.
This arguably constitutes a ‘purer’ variant of the original Elias and Purcell exercise,
uncontaminated by the relationship between knowledge, skills and credentials assumed by

21
the UK classifiers and researcher bias5. We utilized data from the Isfol-Istat survey on
Italian professions mentioned in subparagraph §1.1 (Gallo et al., 2007).
2.1 Isfol-Istat survey on Italian professions and variables re-aggregation
In 2006, a study group composed by members from both Isfol and Istat ran the first survey
of Italian professions aiming to assess which skills and to what extent were utilized in the
labour market/workplace. 16,000 workers were interviewed and asked to assign a score to
255 variables on a 1-100 point scale in terms of complexity of the knowledge, skill or
competence associated with the tasks of their particular job. These 255 variables were
borrowed from the O*Net6 taxonomy and covered 7 areas: Knowledge (33 questions), Skills
(35 questions), Attitudes (52 questions), Values (21 questions), Working styles (16
questions), Generalized working activities (41 questions) and Working conditions (57
questions). Scores were thus aggregated in the seven clusters and an average score was
computed for each of the 800 Italian job titles at a 5-digit level in all of these clusters.
We selected the 109 variables contained in the three areas that described knowledge, skills
and tasks/competences (Knowledge, Skills and Generalized working activities) and
proceeded to disaggregate them. Thus, we allocated each of these 109 variables to one of the
three clusters of competence of the SOC(HE)2010: Specialist expertise deriving from HE
knowledge (labelled EXP), Orchestration expertise (labelled STR) and Communication
expertise (COM). The results of this aggregation of Knowledge, Skills and Generalized
working activities are fully reported in Appendix 1.
5 Although of course it is susceptible to respondent bias, which might be expected to amplify the
extent to which skills are required. 6 O*Net (Occupational Information Network) is an American on-line occupational database designed
in the 1990s to organize, describe and spread data on employment, jobs, skills shortages, professional
profiles and individual characteristics facilitating the matching of demanded and supplied skills.
O*Net embodies the advantages of SOC classification and the implementation of the system took
large account of the indications emerged from the SCAN (Secretary’s Commission on Achieving
Necessary Skills) works, such as the distinction within the three types (basic, thinking and personal)
of soft skills: basic skills (reading, writing, arithmetic, comprehension and expression), thinking skills
(creative thinking, problem solving, etc..) and personal qualities (responsibility, sociability, etc...). It
is divided into six dimensions: Experience Requirements, Occupation Requirements, Occupation
Specific Information, Occupation Characteristics, Worker Characteristics and Worker Requirements
(see Peterson et al., 1999 and IRSO, 2000).
22
2.2 EQF Level
By this stage we had some 109 variables with their relative ‘complexity score’ for each of
the 800 job titles. For each profession, we computed a mean of all of these 109 variables.
Thus, we selected as ‘core variables’ only those variables exceeding a standard deviation
from this average value.
For instance, for Physical scientists (code 2.1.1.1.1 in the NUP) the threshold of a standard
deviation was set at 81.51 and the exceeding selected variables included physics,
mathematics, science and mechanics in the EXP cluster; creative thinking and updating and
review the relevant knowledge in the STR cluster; and, finally, reading comprehension,
speaking and writing in the COM cluster.
We thus computed the average score for the selected variables in each cluster for each job
title. Continuing our example run on Physical scientists (2.1.1.1.1) this meant that the three
clusters EXP, STR and COM measured respectively 91.29, 86.50 and 87.50.
In order to assess whether these complexity scores represented a skill level acquirable via
HE only, we wanted to translate our 1-100 point scale into the 8 levels of the European
Qualification Framework7, in which Level 6 and Level 7 indicate respectively a university
degree and a master degree. We borrowed from Isfol/Istat methodology, which postulate a
linear progression in skill levels from EQF Level 2 to EQF Level 7 thus running a simple
proportion between the two scales.
EQF levels computed accordingly for Physical scientists (2.1.1.1.1) were 7.30 for the EXP
cluster, 6.92 for the STR cluster and 7.00 for the COM cluster.
We established as allocation rule to select the highest of these three score (7.30) to represent
the job title (EQF Level 7 = Master Degree) and allocated the profession (Physical
scientists) in the occupational category corresponding to its relative cluster (Experts).
7 The 8 EQF levels are summarized in table A.2 in Appendix 2.

23
Table 2.1 EQF Levels and Occupational category for Physical scientists (2.1.1.1.1) according to SOC(HE)-Italy
NUP
Code Job Title
Experts
EQF
Orchestrators
EQF
Communicators
EQF
Highest EQF
Score
Major
Group
2.1.1.1.1 Physical
scientists 7.30 6.92 7.00
Experts (7.30 =
EQF Level 7) EXP
Appendix 3 contains EQF Levels and SOC(HE)-Italy Occupational Category for each 800
Italian job titles as displayed in the example in Table 2.1. Nonetheless, not all Italian job
titles have a corresponding score in all of the three clusters. In fact, for some professions
there could be no variables exceeding the standard deviation for a given cluster: Dental
technicians (3.2.1.3.2), for instance, do not have a score for the COM cluster.
2.3 Validation on RCFL data and AlmaLaurea survey data
Validating a measure consists in testing whether it is consistent with other measures of the
same phenomenon (construct validation) and whether its conceptual basis has been
appropriately applied (criterion validation). These tests reflect directly properties listed in
subparagraph §1.1.
Given that the application of SOC(HE)-Italy requires occupation information contained in
official classifications we relied onto two data sources in which the NUP (the iterated and
modified version of CP2001) was utilized: the Istat survey on Italian labour force (RCFL)
and the AlmaLaurea survey on graduates’ occupations (AL). RCFL survey is run by Istat
continuously on 250,000 families (more than 600,000 individuals) settled in 1,100 Italian
municipalities. RCFL collected occupational information from the resulting stratified
sample utilizing CP2001 and NUP in all quarters between 2004 and 2010. To our purposes,
individuals in the sample were relevant only if employed and with a valid occupational
code: this fact restricted the sample to 58,190 respondants: 34,156 males and 24,034
females. Although there are available data concerning more recent quarters (from 2011 to
2013) our choice is to test our measure on the period 2004-2010 in order to evaluate
structural change occurred soon before and after the financial crisis that took place in 2008.
Moreover, data collected in quarters from 2011 to 2013 utilized the new CP iteration
(CP2011) instead of the NUP, the classification on which Isfol and Istat run their survey on
professions in 2006. On the other hand, AlmaLaurea is a consortium of Italian universities
that analyses graduates’ career paths interviewing them at the time of graduation and then 1,

24
3 and 5 years later. In our application we must therefore refer to the last cohort whose
information is fully available, namely the cohort encompassing individuals who graduated
in 2007. The population is composed by those who earned either a master’s degree or a
five/six-year university degree, such as Law and Medicine respectively, and responded to all
of the survey waves up to 2012. This consists in 31,162 graduates from 46 Italian
universities. Restricting our sample to relevant respondents (employed individuals with a
valid occupation code) we investigated 18,269 graduates.
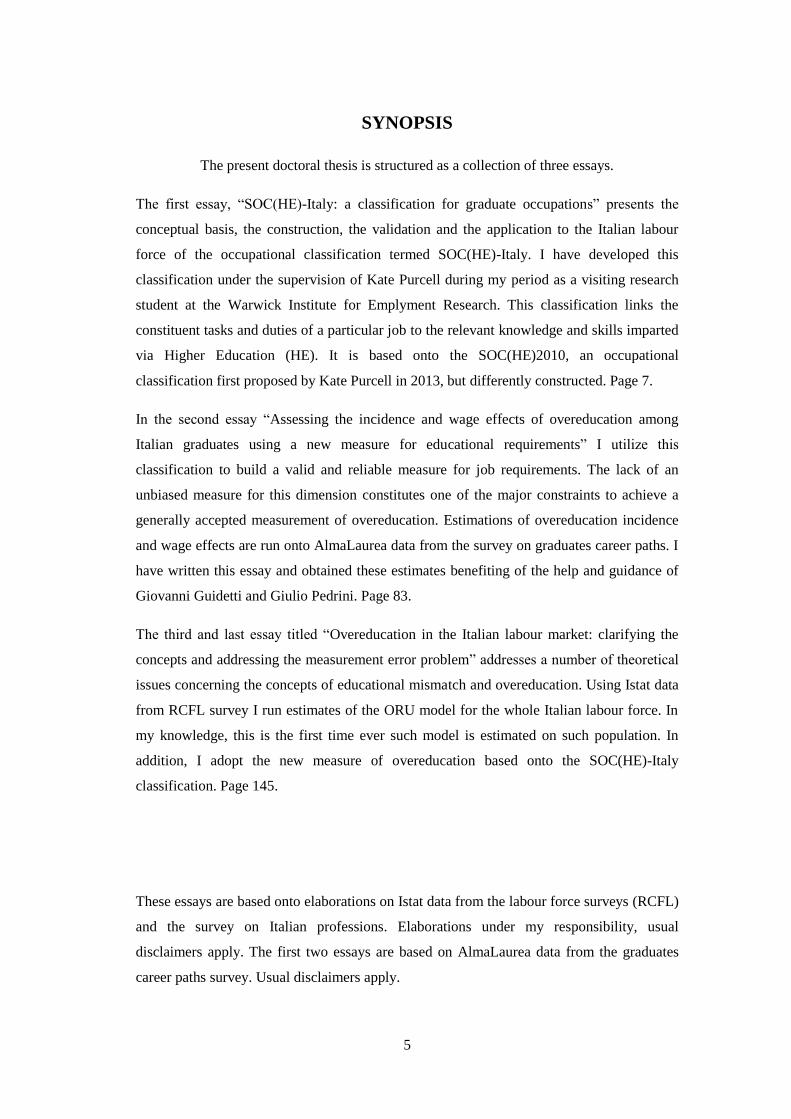
a. Construct validation
To test the construction of SOC(HE)-Italy we assessed the extent to which workers
employed in professions which we ranked as graduate jobs (Experts, Orchestrators and
Communicators) appeared to have achieved an earning premium compared to those in non-
graduate jobs. The rationale of this test is to compare two alternative definitions of graduate
job: a job for which workers must have knowledge and skills imparted via HE (the
conceptual basis of our measure) versus a job in which graduates are rewarded for their
higher human capital endowment.
Figure 2.1 Mean gross monthly pay for SOC(HE)-Italy groups
(Source: our elaborations on Istat RCFL data)
0
200
400
600
800
1000
1200
1400
1600
1800
EXP STR COM NONG
Mean gross monthly pay in 2010 in Euros (€)

25
On average, workers employed in one of the three graduate jobs categories earned 1,602€
per month compared to 1,135 € earned by those employed in the non-graduate group.
Communicators appeared to achieve the highest earnings (1,676 € mean gross pay per
month): apparently 47.7% more than non-graduate occupations, Experts achieved least with
an average of 1,491€: a premium of 31.4%. Finally, Orchestrators earned 44.4% more than
those employed in non-graduate occupations (1,639 € on average).
To test whether these differences in means were statistically significant we estimated two
specifications of a semi logarithmic wage equation model in which the natural logarithm of
the gross monthly pay (lnW) relates to being employed in one of the four groups (Experts,
Orchestrators, Communicators and Non-graduates). Specification (2) in Table 2.3 includes
additional controls (gender, age, job tenure, economic sector and territorial district) omitted
in specification (1)8. Both specifications include dummy variables for being employed in
Experts, Orchestrators and Communicators, omitting the dummy variable for Non-graduates
occupations which are thus adopted as benchmark.
Table 2.2 Earning premia in 2010 for Experts, Orchestrators and Communicators (source: our elaborations on
Istat RCFL data, controls omitted in table, see Appendix 4)
(1) (2)
lnW lnW
Experts 0.2884*** 0.2082***
(0.0056) (0.0044)
Orchestrators 0.3475*** 0.2858***
(0.0218) (0.0167)
Communicators 0.4010*** 0.2535***
(0.0072) (0.0058)
N 42720 42720
R2 0.108 0.479
adj. R2 0.1082 0.4786
Standard errors in parentheses; * p < 0.10, ** p < 0.05, *** p < 0.01; Omitted variable: Non-graduates jobs
Earnings premia are significant and range from 28.84% to 40.10% in specification (1) where
only dummy variables associated with the SOC(HE)-Italy groups are included in the
8 For complete model and variables descriptions see Appendix 4.

26
regression model and decrease to 20.82% - 28.58% when adding further controls in
specification (2)9. We can conclude that there is a relationship between pay and the high
levels of knowledge and skills encompassed in the SOC(HE)-Italy occupational groups for
graduate jobs. In other words, our definition is consistent with the alternative definition of
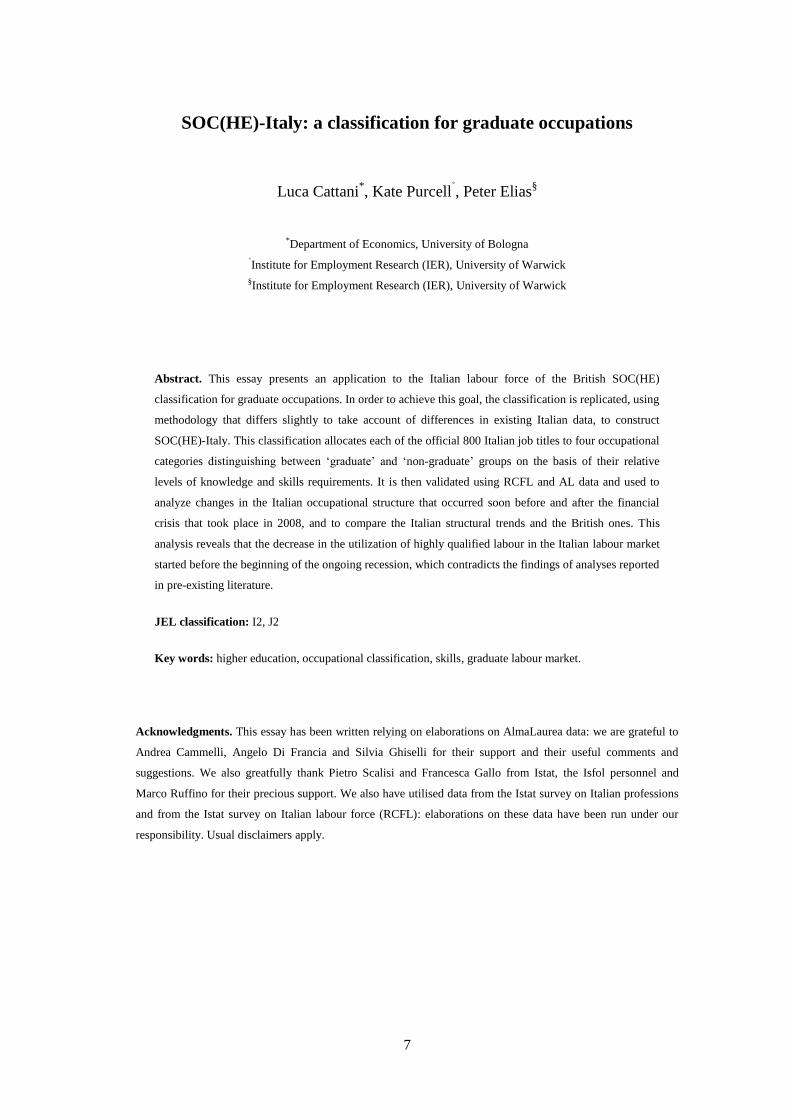
graduate job and the construct is valid. Furthermore, it is worth noting how Orchestrators
earn the highest premium after controls, reflecting the higher wages for Communicators in
specification (1) attributable to other individual (age, gender, work experience) or job
(economic sector and territorial district) characteristics. This fact is consistent with
empirical evidence from AlmaLaurea data on mean net monthly pay, in which
Communicators earn, on average, less than any other occupational group (and also
consistent with the analyses conducted by Elias and Purcell of recent UK graduates who
entered the labour market in 2009-10). In the workforce as a whole, the distribution of
Orchestrators is skewed towards the upper age ranges, whereas that of Communicators to
the lower end, whereas the distribution of Experts comes closer to that of the labour market
as a whole.
Figure 2.2 Mean net monthly pay for SOC(HE)-Italy groups
(Source: our elaborations on AL data)
9 Regressors associated with dummy variables representing employment in our four occupational
groups, given the semi logarithmic nature of the model, are to be interpreted as the percentage
variation of the gross monthly pay as consequence of being employed in such occupational groups.
The dummy variable associated with being employed in non-graduate jobs (NON-G) is omitted in
both specifications for collinearity reasons. Thus, parameters associated with Experts, Orchestrators
and Communicators come to represent the percentage difference of the relative gross monthly pay
and the mean gross monthly pay of workers employed in non-graduate jobs.
0
200
400
600
800
1000
1200
1400
1600
1800
2000
Experts Strategists Communicators
Mean net monthly pay in 2012 in Euros (€)
27
b. Criterion validation
AlmaLaurea (AL) data are also important when validating the criteria of SOC(HE)-Italy. In
fact, questionnaires utilized in AL survey include at least three questions explicitly linked to
the conceptual basis of the classification. These are question A16 (“Do you make use of the
skills acquired in your Master degree course in your current job?”), A17 (“Is the master
degree you hold required for your current job?”) and A17LS (“Are knowledge and skills
acquired during your Master degree course useful to competently perform your current
job?”).
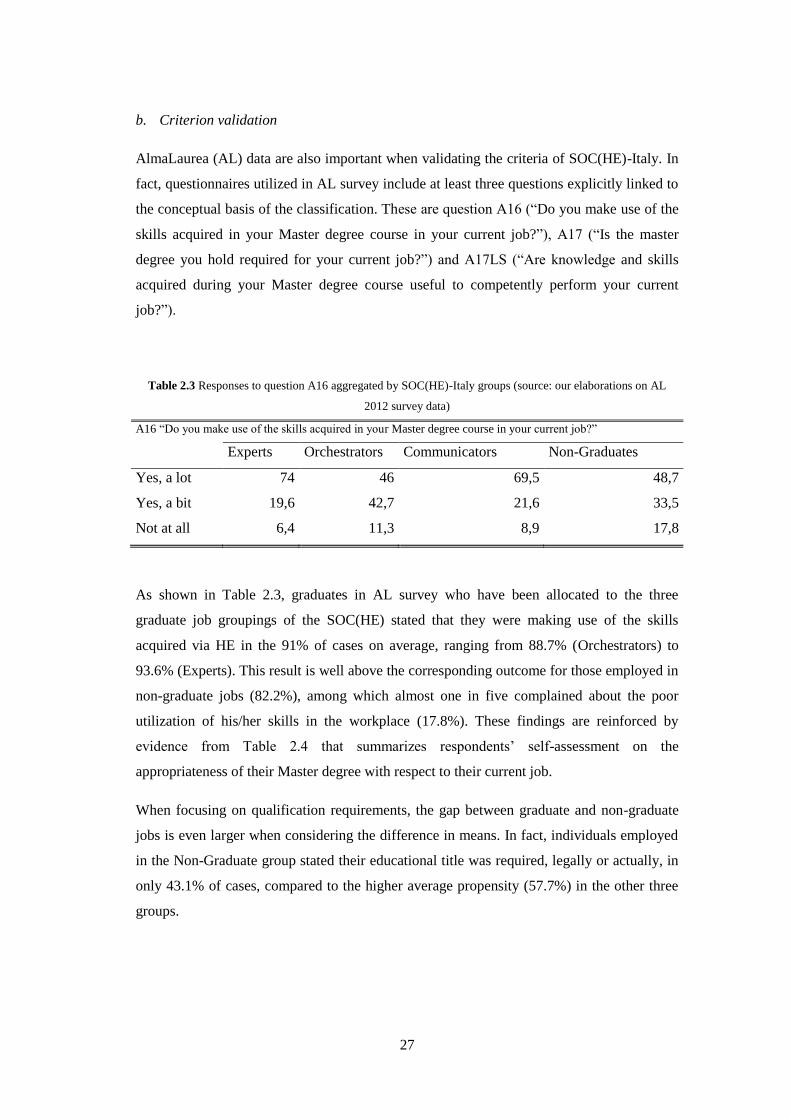
Table 2.3 Responses to question A16 aggregated by SOC(HE)-Italy groups (source: our elaborations on AL
2012 survey data)
A16 “Do you make use of the skills acquired in your Master degree course in your current job?”
Experts Orchestrators Communicators Non-Graduates
Yes, a lot 74 46 69,5 48,7
Yes, a bit 19,6 42,7 21,6 33,5
Not at all 6,4 11,3 8,9 17,8
As shown in Table 2.3, graduates in AL survey who have been allocated to the three
graduate job groupings of the SOC(HE) stated that they were making use of the skills
acquired via HE in the 91% of cases on average, ranging from 88.7% (Orchestrators) to
93.6% (Experts). This result is well above the corresponding outcome for those employed in
non-graduate jobs (82.2%), among which almost one in five complained about the poor
utilization of his/her skills in the workplace (17.8%). These findings are reinforced by
evidence from Table 2.4 that summarizes respondents’ self-assessment on the
appropriateness of their Master degree with respect to their current job.
When focusing on qualification requirements, the gap between graduate and non-graduate
jobs is even larger when considering the difference in means. In fact, individuals employed
in the Non-Graduate group stated their educational title was required, legally or actually, in
only 43.1% of cases, compared to the higher average propensity (57.7%) in the other three
groups.

28
Table 2.4 Responses to question A17 aggregated by SOC(HE)-Italy groups (source: our elaborations on AL
2012 survey data)
A17 “Is the master degree you hold required for your current job?”
Experts Orchestrators Communicators Non-Graduates
Yes, it is legally required to be hired 55,4 13,9 50,5 24,6
It isn't legally required but in fact it is 16,8 25,1 11,6 18,5
It is not required but still it is useful 22,8 52,7 30,2 42,9
It is neither required nor useful 4,9 8,2 7,6 13,9
Not surprisingly, there is a vast gradient in terms of responses between different graduate
groups as only 39% of Orchestrators tend to consider their qualification as needed for their
current job. This share is even lower than that recorded for Non-graduates and this could be
due to the fact that professions dealing with ‘orchestration expertise’ have only recently
started to employ graduates, being the relative hiring standards oriented more towards
working experience than to formal education, as above argued. On the other hand, this
group has the highest share of workers considering a Master’s degree as useful on the job,
re-equilibrating the final evidence of only 8.2% stating to be not requiring or using their
skills, compared to 13.9% of those in Non-graduate jobs.
Table 2.5 Responses to question A17LS aggregated by SOC(HE)-Italy groups (source: our elaborations on AL
2012 survey data)
A17LS “Are knowledge and skills acquired during your Master degree course useful to competently perform
your current job?”
Experts Orchestrators Communicators
Non-
Graduates
Having a Master degree is fundamental to
carrying out my job 31,3 16 17,4 17,8
Having a Master degree is useful in
carrying out my job 47,1 56,3 50,7 44,9
An undergraduate course would be
sufficient preparation to carrying out my
job
16 18,9 21,4 21,2
To perform my job secondary education
qualifications are sufficient 5,4 8,7 10,2 16,2

29
When reference is made to both knowledge and skills, all of the three ‘graduate jobs’ groups
report low proportions of workers stating they are underutilizing knowledge and skills
acquired during HE (equal to or below 10%) while those in ‘non-graduate’ occupations
report one out of six workers in such situation. All in all, graduates surveyed by
AlmaLaurea who were employed in SOC(HE)-Italy ‘graduate occupation’ groups, report a
higher propensity to utilize skills acquired in HE, to be hired in more demanding and better
paying jobs than those in the ‘non-graduate’ category and, finally, are less likely to be
under-employed 5 years after graduation. Together, these findings constitute a consistent
endorsement of the classification.

30
3. Labour market trends: the evolution of the Italian occupational structure
measured with SOC(HE)-Italy
Having established that SOC(HE)-Italy is a valid measure for the utilization in the labour
market of knowledge and skills mainly imparted via HE and that it may be relied upon to
distinguish and classify graduate and non-graduate jobs, it can be applied to the Italian
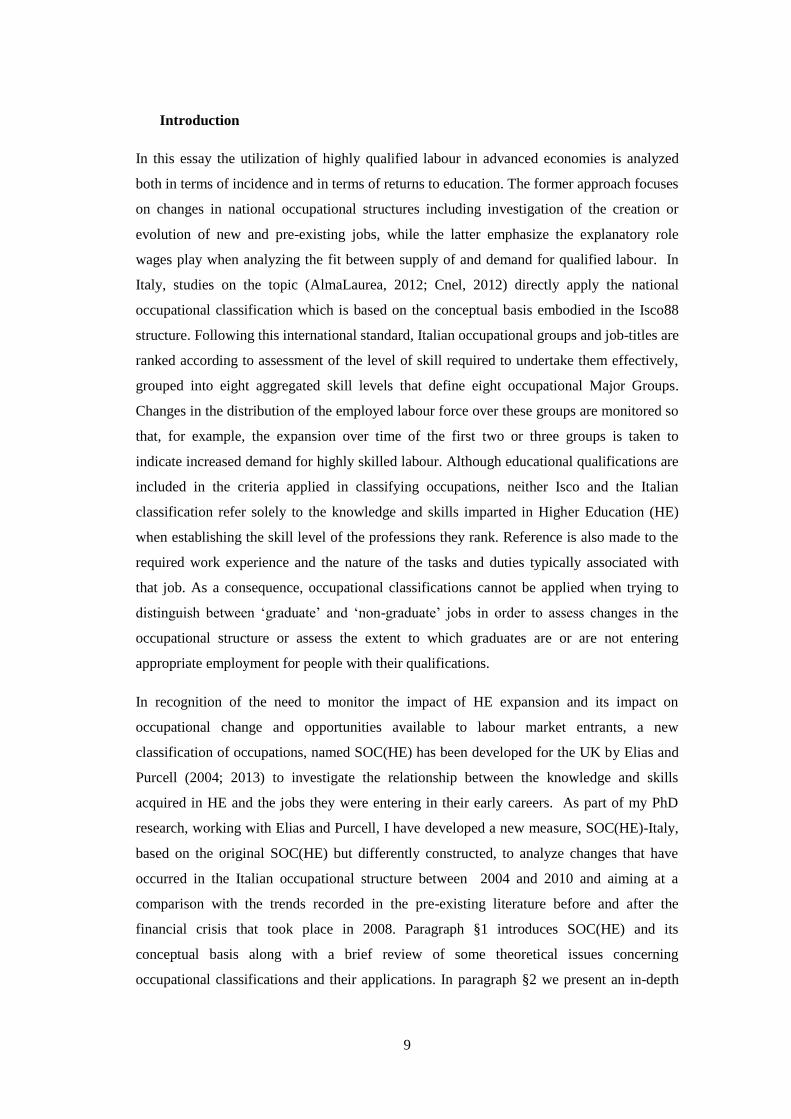
labour force to assess its structural trends. Before doing this, it is useful to describe recent
trends for both employment and unemployment. Fig. 3.1 shows, in thousands, the total
employment and the total unemployment between 2004 and 2010. It is noticeable how the
total unemployment reaches its minimum and starts increasing in 2007, one year before the
total employment reaches its peak. This fact can be explained by a significant increase in the
total active population with new entrants experiencing difficulties finding a first job, as
highlighted by Cnel (2012).
Figure 3.1 Total employment and total unemployment between 2004 and 2010, in thousands (Source: our
elaborations on I.Stat data)
21500
22000
22500
23000
23500
24000
Total employment
(thousands; seasonally adjusted)
0
500
1000
1500
2000
2500
T1
-20
04
T2
-20
04
T3
-20
04
T4
-20
04
T1
-20
05
T2
-20
05
T3
-20
05
T4
-20
05
T1
-20
06
T2
-20
06
T3
-20
06
T4
-20
06
T1
-20
07
T2
-20
07
T3
-20
07
T4
-20
07
T1
-20
08
T2
-20
08
T3
-20
08
T4
-20
08
T1
-20
09
T2
-20
09
T3
-20
09
T4
-20
09
T1
-20
10
T2
-20
10
T3
-20
10
T4
-20
10
Total unemployment
(thousands; seasonally adjusted)

31
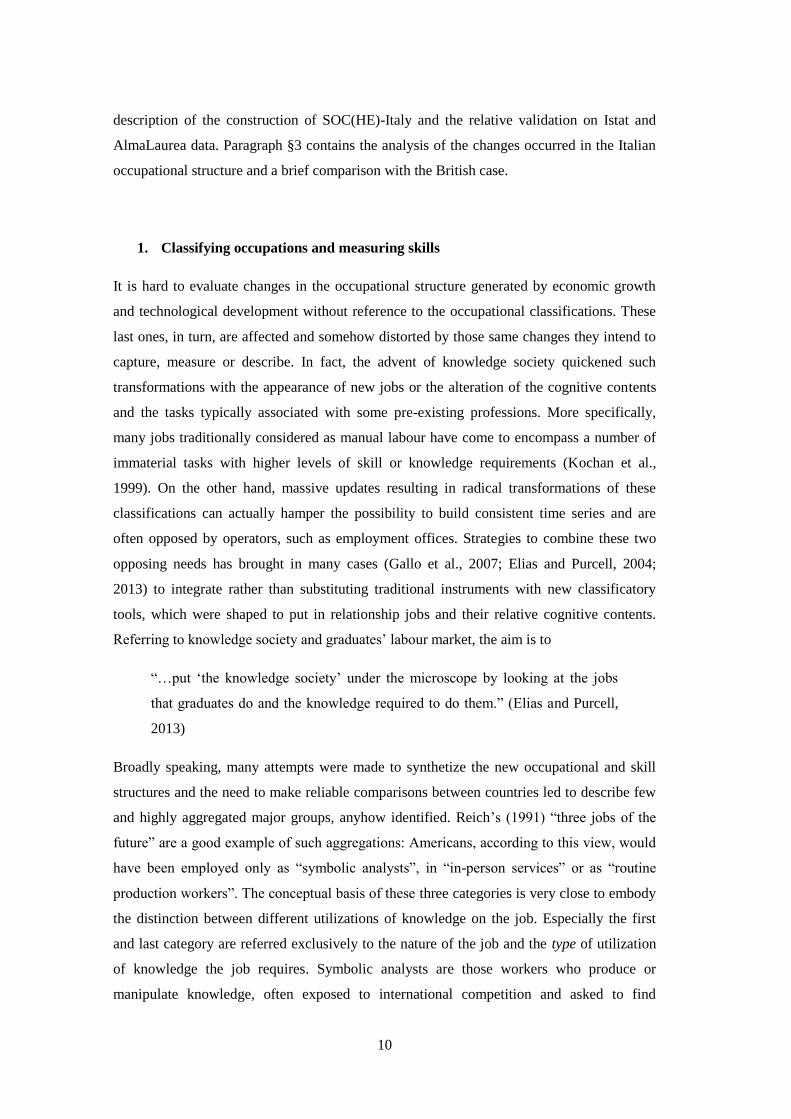
Fig. 3.2 shows employment and unemployment by gender. Female workers seem to have
better performed than men soon after the crisis by increasing rather than decreasing both
their participation in the labour market and the total number of employed employees.
Moreover, females unemployment increased at a lower rate compared to that of men since
2007, leading to a dramatic overtaking between the end of 2008 and the beginning of 2009.
This fact has been termed “the additional worker phenomen” by Cnel (2012), pointing out
how the recession has forced many previously inactive women to enter the labour market
because of the worsening budget constraints of their relative households10
.
Figure 3.2 Employment and unemployment by gender between 2004 and 2010, thousands (Source: our
elaborations on I.Stat data)
10
This is especially true in the south of Italy, where the participation of women in the labour market
has always been poor.
8000
9000
10000
11000
12000
13000
14000
15000
Employment by gender
(thousands; seasonally adjusted)
Male
Female
0
200
400
600
800
1000
1200
Unemployment by gender
(thousands; seasonally adjusted)
Males
Females

32
Table 3.1 shows percentages of the four occupational categories in the years from 2004 to
2010. Graduate jobs tend to have increased their relative share up until 2007 when a break
takes place: from this peak (32.72%) graduate jobs as defined by SOC(HE) decrease until
the end of the period where they come to represent a share of the labour force which is more
or less equal to its starting value (29%). This trend is consistent to a certain degree with
previous studies that employed different definitions of ‘graduate jobs’, such as the reports
issued by Cnel (2012) and AlmaLaurea (2012). But still there are two significant
differences. First: the SOC(HE)-Italy measurement for graduate occupations lies between
the two. This is reassuring if we assume that estimates by Cnel and AlmaLaurea were
respectively upward and downward biased, given that they ranged between 33.8% - 37.3%
and 17% - 19%. Nonetheless, Cnel and AlmaLaurea based their measures on NUP
classification as we did but in these cases the NUP was not deconstructed, with their
component criteria disaggregated as we have done above. NUP occupational groups were
taken per se as a proxy for the utilization of skills and labelled as ‘high’, ‘medium’ and
‘low’ skilled professions. As occupational groups in the NUP do not account for formal
education only (as argued in subparagraph §1.1) but also for work experience and other job
characteristics, we can conclude that Cnel and AlmaLaurea actually measured something
different from what we did. Second: when comparing the three time-series built onto
SOC(HE), Cnel and AlmaLaurea indicators it is worth noting that the first two reach their
peaks in 2007 while AL reaches its peak in 2008. In other words, our measure reinforces the
evidence highlighted by Cnel (2012) that the downturn in the Italian graduate labour market
preceded the financial crisis that took place in 2008. It is not clear, however, whether the
following recession has just exacerbated a decreasing trend or whether it has hampered the
possibilities of a full recovery that may have taken place ceteris paribus in more propitious
circumtances.

33
Figure 3.1 Evolution of Italian occupational structure by SOC(HE)-Italy groups (2004-2010) (source: our
elaborations on Istat RCFL data)
Table 3.1 Occupational structure by SOC(HE)-Italy, 2004-2010 (Source: our elaborations on Istat RCFL data)
% 2004 2005 2006 2007 2008 2009 2010
Experts 16,9 16,9 18,33 19,16 19,17 18,13 17,81
Orchestrators 4,24 4,22 4,44 4,32 4,15 3,74 3,48
Communicators 7,96 8,2 8,83 9,24 8,97 8,71 8,54
Non-graduates 70,9 70,68 68,4 67,28 67,71 69,42 70,17
Total 100 100 100 100 100 100 100
By disaggregating the graduate jobs into Experts, Orchestrators and Communicators it can
be shown, not surprisingly, that Experts are the biggest graduates group and possibly the
major group responsible for both the increase pre 2007 (from 16.9% to 19.16%) and the
decrease that took place afterwards (from 19.17% to 17.81%). Orchestrators remained
virtually unaltered up to 2008 (ranging between 4.22% and 4.44%) then decreased to their
minimum at the end of the period (3.48%), reaching for first their peak in 2006 and then
starting decreasing. Communicators reached their peak in 2007 (9.24%) and the first to start
descending the following year, anticipating the decreasing trend of the other two groups.
When comparing these three groups by age (Fig. 3.2), it is noticeable how Experts have a
higher proportion of workers belonging to the youngest age group (25-34) than the other
two graduate job groupings. This result is important as it shows how the occupational group
(Experts) that loss the biggest amount of job posts after the peak, is the youngest group of
all. This means that new graduates experienced difficulties entering the labour market as the
0
10
20
30
40
50
60
70
80
90
100
2004 2005 2006 2007 2008 2009 2010
%
Non-graduates
Communicators
Strategists
Experts

34
set of professions in which they were traditionally hired went through a period of stagnation
(2004-2010) while the share of workers holding a degree on the total labour force increased
from 14% to 17.3% in the period 2004-2011(source: Cnel, 2012).
Figure 3.2 SOC(HE) groups by age in 2010 (source: our elaborations on Istat RCFL data)
An additional source of concern with respect to young graduates entering the labour market
comes from the proportion of young workers employed in Non-graduate SOC(HE) group.
More than two out of three workers aged between 25 and 34 years old are employed in such
jobs and this propensity is even higher compared to that of the age group 45-54 in which the
share of those holding a degree is sensibly lower.
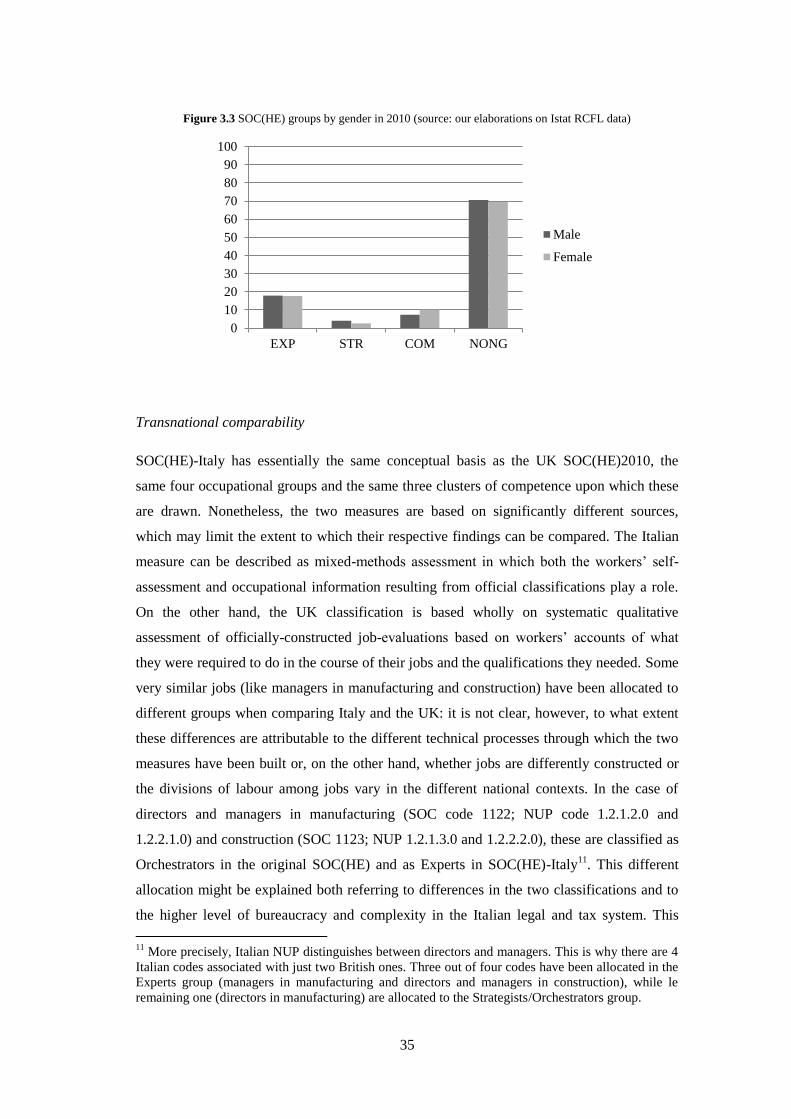
Figure 3.3 shows the proportion of employees in occupation by SOC(HE)-Italy and gender.
Communicators is the only occupational category with a higher proportion of female than
male employees. Significantly, this category recorded at the end of the period a higher
occupation rate (8.54%) compared to that in 2004 (7.96%), as Experts did (17.81% and
16.9%, respectively). However, in this last case the proportion of female employees was
almost equal to that of males, suggesting that male graduates’ employment rate has
decreased to a relatively greater extent than that of their female counterparts. In fact, female
graduates were less likley to be in Non-graduate jobs and more likely to be employed as
Communicators. This last observation could be attributable to the high proportions of
females traditionally employed in primary and secondary education (see Appendix 3 for the
allocation of these professions in Communicators group).
0
10
20
30
40
50
60
70
80
90
100
EXP STR COM NONG
25-34
45-54
35
Figure 3.3 SOC(HE) groups by gender in 2010 (source: our elaborations on Istat RCFL data)
Transnational comparability
SOC(HE)-Italy has essentially the same conceptual basis as the UK SOC(HE)2010, the
same four occupational groups and the same three clusters of competence upon which these
are drawn. Nonetheless, the two measures are based on significantly different sources,
which may limit the extent to which their respective findings can be compared. The Italian
measure can be described as mixed-methods assessment in which both the workers’ self-
assessment and occupational information resulting from official classifications play a role.
On the other hand, the UK classification is based wholly on systematic qualitative
assessment of officially-constructed job-evaluations based on workers’ accounts of what
they were required to do in the course of their jobs and the qualifications they needed. Some
very similar jobs (like managers in manufacturing and construction) have been allocated to
different groups when comparing Italy and the UK: it is not clear, however, to what extent
these differences are attributable to the different technical processes through which the two
measures have been built or, on the other hand, whether jobs are differently constructed or
the divisions of labour among jobs vary in the different national contexts. In the case of
directors and managers in manufacturing (SOC code 1122; NUP code 1.2.1.2.0 and
1.2.2.1.0) and construction (SOC 1123; NUP 1.2.1.3.0 and 1.2.2.2.0), these are classified as
Orchestrators in the original SOC(HE) and as Experts in SOC(HE)-Italy11
. This different
allocation might be explained both referring to differences in the two classifications and to
the higher level of bureaucracy and complexity in the Italian legal and tax system. This
11
More precisely, Italian NUP distinguishes between directors and managers. This is why there are 4
Italian codes associated with just two British ones. Three out of four codes have been allocated in the
Experts group (managers in manufacturing and directors and managers in construction), while le
remaining one (directors in manufacturing) are allocated to the Strategists/Orchestrators group.
0
10
20
30
40
50
60
70
80
90
100
EXP STR COM NONG
Male
Female
36
complexity would require individuals running big businesses to have better understanding
of and a higher confidence with these dimensions in spite of the ability to manipulate and
coordinate the activities and knowledge. Moreover, Italian managers might be hired senior
on the basis of their relative work experience rather than looking at formal educational titles.
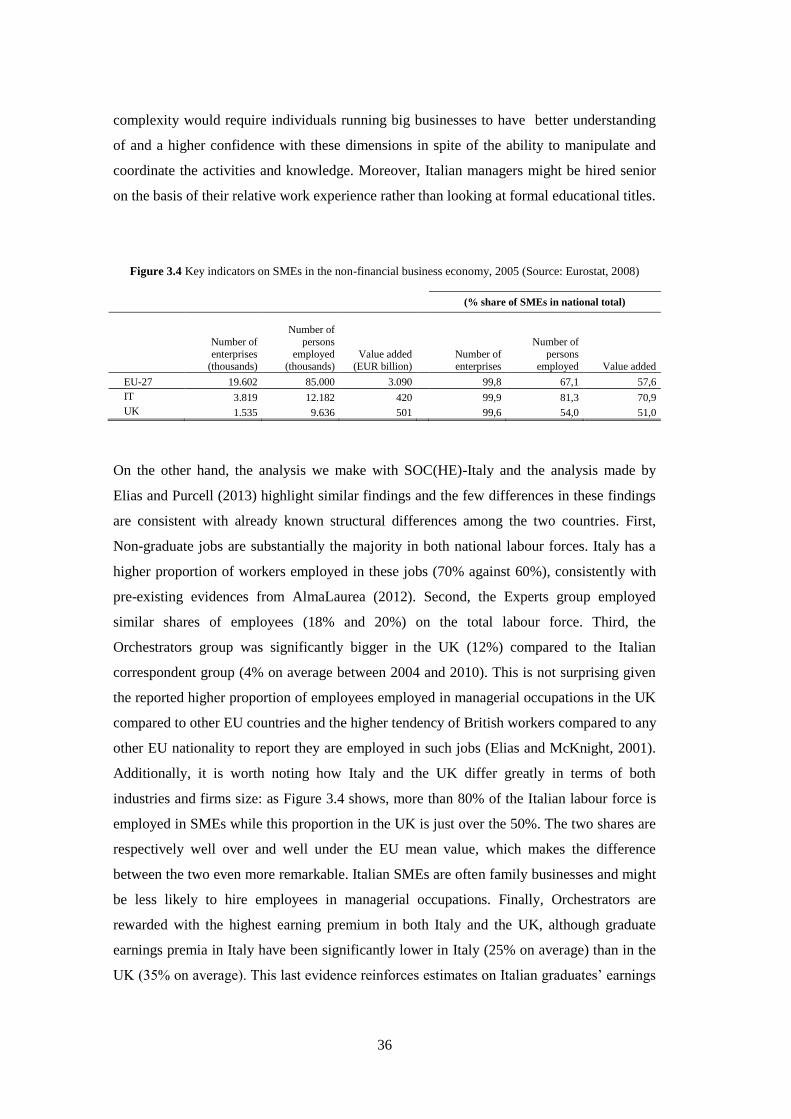
Figure 3.4 Key indicators on SMEs in the non-financial business economy, 2005 (Source: Eurostat, 2008)
(% share of SMEs in national total)
Number of
enterprises
(thousands)
Number of
persons
employed
(thousands)
Value added
(EUR billion)
Number of
enterprises
Number of
persons
employed Value added
EU-27 19.602 85.000 3.090 99,8 67,1 57,6
IT 3.819 12.182 420 99,9 81,3 70,9
UK 1.535 9.636 501 99,6 54,0 51,0
On the other hand, the analysis we make with SOC(HE)-Italy and the analysis made by
Elias and Purcell (2013) highlight similar findings and the few differences in these findings
are consistent with already known structural differences among the two countries. First,
Non-graduate jobs are substantially the majority in both national labour forces. Italy has a
higher proportion of workers employed in these jobs (70% against 60%), consistently with
pre-existing evidences from AlmaLaurea (2012). Second, the Experts group employed
similar shares of employees (18% and 20%) on the total labour force. Third, the
Orchestrators group was significantly bigger in the UK (12%) compared to the Italian
correspondent group (4% on average between 2004 and 2010). This is not surprising given
the reported higher proportion of employees employed in managerial occupations in the UK
compared to other EU countries and the higher tendency of British workers compared to any
other EU nationality to report they are employed in such jobs (Elias and McKnight, 2001).
Additionally, it is worth noting how Italy and the UK differ greatly in terms of both
industries and firms size: as Figure 3.4 shows, more than 80% of the Italian labour force is
employed in SMEs while this proportion in the UK is just over the 50%. The two shares are
respectively well over and well under the EU mean value, which makes the difference
between the two even more remarkable. Italian SMEs are often family businesses and might
be less likely to hire employees in managerial occupations. Finally, Orchestrators are
rewarded with the highest earning premium in both Italy and the UK, although graduate
earnings premia in Italy have been significantly lower in Italy (25% on average) than in the
UK (35% on average). This last evidence reinforces estimates on Italian graduates’ earnings

37
run onto AL data, in which recent graduates working abroad appeared to have enjoyed
higher premia than their Italian-based peers (AlmaLaurea, 2012).
Conclusion
Recent developments in occupational classifications have shifted the focus of the relative
conceptual basis from industries and economic sectors to skill levels. The rationale for this
has been to provide policy-makers with classifications with the potential to monitor and
measure the degree to which investment in national skills development and, in particular,
the extent to which knowledge and skills, were being required and utilised in ‘the
knowledge society’. However, the operational definition of skill and skill levels adopted by
the ILO do not refer to formal education only. This has limited the reliability and validity of
such classifications when trying to define and measure the utilization of highly qualified
labour in national economies and across different economies. Attempts were made to
develop new taxonomies either by integrating or substituting existing official classifications
and capture the ongoing changes in occupational structure concerning the utilization of
knowledge and skills imparted in HE, which was expanding, with increasing levels of
participation, in virtually all economies. Among these, Elias and Purcell’s SOC(HE) has
attracted the interest of both analysts and policy makers in the UK and abroad. We decided
to develop an application of this classification for the Italian labour force because its
conceptual basis is fully consistent with our purpose to better understand these structural
changes. Moreover, SOC(HE) has a number of compelling characteristics: it is easy to build
as it is based on official classifications and doesn’t require additional time-consuming data
entry; being based on official classifications it allows the construction of time-series
indicators with which it is possible to assess the trends of interest; having been already
applied in another European country it allowed to a certain extent comparisons between this
country, namely the UK, and Italy. In order to allocate each of the 800 Italian job titles into
‘graduate’ and ‘non-graduate’ groups, we attached three EQF levels to them, borrowing
from the methodology followed by Isfol/Istat in their 2006 survey on Italian professions.
These three EQF levels represented the formal education level required in each of the
SOC(HE) constituent clusters of experience to carry out a particular job. The highest of
these three was then taken to be most representative of the knowledge and skills that were
axiomatic to being able to accomplish the tasks and duties associated with that job, and

38
determined its allocation into one of the three graduate jobs groupings: Experts,
Orchestrators and Communicators.
After having validated SOC(HE)-Italy on RCFL and AL data, we mapped Italian labour
forces from 2004 to 2010 and assessed change over the period, notably two major trends:
the increase in the share of those employment in highly-skilled professions up to 2007 and
the decrease of this share subsequently. Highly skilled job as defined by SOC(HE)-Italy
employed, throughout all the years of the period, a share of the total labour force that
differed significantly from pre-existing studies on the topic. To be precise, the SOC(HE)-
Italy measure lies between the upper boundary represented by Cnel estimates and the lower
boundary marked by AL estimates. The observation of poor performance after the recession
that followed the financial crisis in 2008 is consistent with pre-existing work on Italian
labour force and graduates’ career paths. The novelty of this analysis consists in
highlighting how the share of workers employed in graduate jobs (i.e. the demand for
graduate labour) began to decline in the same year that the recession started, in 2008, while
the participation ration of one graduate group (Orchestrators) anticipated this decline in
2007. This is in contradiction with some previous analyses, according to which this decline
begun only in 2008 as direct consequence of the economic downturn. It is not clear,
however, to which extent the recession has accelerated changes that would have occurred
anyway or whether it has hampered the possibilities of recovery. There is no doubt that
austerity measures adopted by successive Italian government (such as the headcount freeze
started in 2009 for public administrations, schools and universities) have directly affected
graduates’ labour market entry options by restricting access to traditional sources of
employment for young Italian graduates.
Comparisons between the UK and Italy must be regarded as indicative rather than
statistically robust, given that the two utilized measures are based on somewhat different
source data. However, the analysis of the Italian labour force produced relatively similar
patterns of graduate labour market distribution and change to those observed in the UK
labour force over the same period. All in all, we conclude that these two measures allow us
to make consistent and more reliable qualitative comparisons between the two countries
than has been possible with by simply using existing occupational classifications and their
use, separately and for comparative purposes, advances our understanding of change in
demand for knowledge and skills, nationally and potentially, internationally.

39
References
Basant, R. and Mukhopadhyay, P. (2009) An arrested virtuous circle? Higher education and
hi-tech industries in Indi, AhmedabadIndian Institute of Management working paper n.
2009-05-01.
Bourdieau, P.; Passeron, J.,C. (1970) La Reproduction, Minuit, Paris.
Brown, P.; Lauder, H.; Ashton, D. (2011) The Global Auction, Oxford University Press,
Oxford.
Comin, A.; Barbosa, R. (2011) ‘From work to school: higher education and occupational
change in Brazil’. Working Paper for ESRC Pathfinder project ‘Assessing the impact of
higher education expansion on economic restructuring, occupational change and access to
opportunities in Brazil and India’.
Consorzio Interuniversitario Almalaurea (2012) Condizione occupazionale dei laureati XIV
indagine, Il Mulino, Bologna.
CNEL (2012) Rapporto sul mercato del lavoro 2011-2012, Roma.
Elias, P. (1997) Occupational classification (Isco88): concepts, methods, reliability, validity
and cross-national comparability, OECD labour market and social policy occasional papers
n. 20, OECD Publishing.
Elias, P.; McKnight, A. (2001) Skill measurement in official statistics: recent developments
in the UK and the rest of Europe, in Oxford Economic Papers n. 3/2001, pp. 508-540.
Elias, P. and K. Purcell (2004). SOC(HE): a classification of occupations for studying the
graduate labour market. Research Paper 6, University of Warwick, Institute for Employment
Research.
Elias, P. and Purcell, K. (2013) Classifying graduate occupation for the knowledge society,
HECSU working paper n. 5/2013.
Eurostat (2008) Enterprises by size class - overview of SMEs in the EU - Issue number
31/2008

40
Figueiredo, H.; Teixeira, P.; Rubery, J. (2011) Is Mass Higher Education Working? An
Update and a Reflection on the Sustainability of Higher Education Expansion in Portugal,
AlmaLaurea working papers n. 14, Bologna.
Gallo, F.; Scalisi, P.; Scarnera, A. (2007) L’indagine sulle professioni. Contenuti,
metodologia e organizzazione, in Metodi e norme n. 42, Istat, Rome.
Gallo, F.; Scalisi, P. (2012) Rappresentare il lavoro che cambia. Una lettura diacronica
dell’osservazione statistica delle professioni, in Sociologia del Lavoro n. 2/2012.
Goldthorpe, J. H. (1988) Making class and status operational: concept formation,
application and evaluation, ESRC-SCPR seminar working paper.
HEFCE (2011) Approaches to measuring employment circumstances of recent graduates,
Issues Paper n. 2, Bristol, Higher Education Funding Council for England.
ILO (1990) International Standard Classification for Occupations (Isco88), Geneva.
ILO (2012) International Standard Classification for Occupations (Isco08), Geneva.
Istat (1991) Classificazione delle Professioni, Metodi e norme, serie C, Rome.
Istat (2009) Indagine campionaria sulle professioni, Rome.
Kochan, T. A.; Barley, S. R; Mavor, A. S. (1999) The changing nature of work. Implications
for occupational analysis, National Research Council, National Academy Press, Washington
DC.
Moretti, E. (2013) The New Geography of Jobs, Mariner Books, New York.
Peterson, N. G.; Mumford, M. D.; Borman, W. C.; Jeanneret, P. R.; Fleishman, F. A. (1999)
An occupational information system for the 21st Century: the development of O*Net,
American Psychological Association, Washington DC.
Purcell, K.; Elias, P.; Wilton, N. (2004) Higher Education Skills and Employment: careers
and jobs in the graduate labour market, Research paper n. 3, University of Warwick,
Institute for Employment Research, Coventry.
Rafferty A.; Dale, A. (2008) Ethnic Differences in graduate over-education in the UK,
CSSR Working paper n. 5/2008, Cathie Marsh Centre for Census and Survey Research,
University of Manchester, Manchester.

41
Reich, R. (1991) The Work of Nations, Vintage Books, New York.
UUK (2010) Recession to Recovery: Changes in student choices and graduate employment,
Universities UK, London.

42
APPENDIX 1
Table A.1 The 109 O*Net variables of the Isfol-Istat survey regrouped in the SOC(HE)2010 clusters
of competence
Variable name
in Isfol/Istat
Survey
Label Description Cluster
B1a Amministrazione e gestione di
impresa
Conoscenza dei principi e dei metodi che regolano
l'impresa e la sua gestione relativi alla pianificazione
strategica, all'allocazione delle risorse umane, finanziarie
e materiali, alle tecniche di comando, ai metodi di
produzione e al coordinamento delle persone e delle
risorse
STR
B2a Lavoro d'ufficio
Conoscenza delle procedure amministrative e d'ufficio,
dei programmi di elaborazione di testi, delle tecniche di
gestione di archivi e di basi di dati oppure della
stenografia e delle regole di trascrizione o di altre
procedure e linguaggi previsti dal lavoro d'ufficio
EXP
B3a Economia e
contabilità
Conoscenza dei principi e delle pratiche di economia e
contabilità EXP
B4a Commercializzazione e
vendita
Conoscenza dei principi e dei metodi per presentare,
promuovere, vendere prodotti o servizi. Comprende la
definizione di strategie e delle tattiche di marketing, la
loro presentazione, le tecniche di vendita e di controllo
COM
B5a Servizi ai clienti e alle
persone
Conoscenza dei principi e delle procedure per fornire
servizi ai clienti e alle persone. Comprende la valutazione
dei bisogni del cliente, il raggiungimento degli standard
di qualità e la valutazione della soddisfazione
della clientela
STR
B6a Gestione del personale e delle
risorse umane
Conoscenza dei principi e delle procedure per il
reclutamento, la selezione, la formazione, la retribuzione
del personale per le relazioni e le negoziazioni sindacali e
per la gestione di sistemi informativi del personale
EXP
B7a Produzione e processo
Conoscenza delle materie prime, dei processi di
produzione, delle tecniche per il controllo di
qualità
EXP
B8a Produzione alimentare
Conoscenza delle tecniche e delle attrezzature necessarie
alla semina, alla coltivazione e alla raccolta di prodotti
alimentari (vegetali ed animali) destinati al consumo,
comprese quelle relative alla conservazione/stoccaggio
EXP
B9a Informatica ed elettronica
Conoscenza dei circuiti elettronici, dei processori, dei
chips delle attrezzature elettroniche, dell'hardware e dei
software dei computer, compresa la conoscenza dei
pacchetti applicativi e dei linguaggi di programmazione
EXP
B10a Ingegneria e tecnologia
Conoscenza delle applicazioni pratiche delle scienze
ingegneristiche e della tecnologia. Comprende
l'applicazione di principi, di tecniche, di procedure e l'uso
di strumenti per progettare e produrre diversi beni o
servizi
EXP
B11a Progettazione tecnica
Conoscenza delle tecniche di progettazione, degli
strumenti e dei principi utilizzati nella esecuzione di
progetti tecnici di precisione, di progetti di dettaglio, di
disegni e di modelli
EXP

43
B12a Edilizia e costruzioni
Conoscenza dei materiali, dei metodi e degli strumenti
usati nella costruzione e nella riparazione di case, edifici
o altre strutture come autostrade e strade
EXP
B13a Meccanica
Conoscenza delle macchine e delle attrezzature,
compresa la loro progettazione, il loro uso, la loro
riparazione e manutenzione
EXP
B14a Matematica Conoscenza dell'aritmetica, dell'algebra, della geometria,
del calcolo, della statistica e delle loro applicazioni EXP
B15a Fisica
Conoscenza dei principi e delle leggi della fisica, delle
loro interrelazioni e delle loro applicazioni per capire la
dinamica dei fluidi, dei materiali e dell'atmosfera e le
strutture e i processi meccanici, elettrici, atomici e
subatomici
EXP
B16a Chimica
Conoscenza della composizione, della struttura e delle
proprietà delle sostanze, dei processi e delle
trasformazioni chimiche sottostanti; ciò
comprende l'uso dei prodotti chimici, la conoscenza delle
loro interazioni, dei segnali di pericolo, delle tecniche di
produzione dei prodotti chimici e dei metodi di bonifica
EXP
B17a Biologia
Conoscenza degli organismi animali e vegetali, dei loro
tessuti, delle cellule, delle loro funzioni, interdipendenze
e delle loro interazioni con l'ambiente
EXP
B18a Psicologia
Conoscenza del comportamento e delle prestazioni
umane, delle differenze individuali nelle attitudini, nella
personalità e negli interessi, dei meccanismi di
apprendimento e di motivazione, dei metodi della ricerca
psicologica e della valutazione e del trattamento dei
disordini comportamentali ed affettivi
EXP
B19a Sociologia e antropologia
Conoscenza del comportamento e delle dinamiche di
gruppo, delle influenze e tendenze sociali, delle
migrazioni umane, dell'etnicità
EXP
B20a Geografia
Conoscenza dei principi e dei metodi per descrivere e
rappresentare la terra, il mare e le masse d'aria, comprese
le loro caratteristiche fisiche, le collocazioni, le
interrelazioni e la distribuzione di piante, animali e gli
insediamenti umani
EXP
B21a Medicina e odontoiatria
Conoscenza delle informazioni e delle tecniche
necessarie a diagnosticare e a curare ferite, malattie e
deformità del corpo umano, compresa la
conoscenza dei sintomi, delle cure alternative, delle
proprietà e delle interazioni dei farmaci e delle
cure preventive
EXP
B22a Terapia e consulenza
psicologica
Conoscenza dei principi, dei metodi e delle procedure per
la diagnosi, il trattamento e la riabilitazione delle
disfunzioni mentali e fisiche e per la consulenza e la
guida nelle carriere
EXP
B23a Istruzione e formazione
Conoscenza dei principi e dei metodi per la progettazione
formativa e curricolare, per l'insegnamento e
l'addestramento collettivo ed individuale, per la
misurazione degli effetti della formazione
EXP
B24a Lingua italiana
Conoscenza della struttura e dei contenuti della lingua
italiana oppure del significato e della pronuncia delle
parole, delle regole di composizione e della grammatica
EXP
B25a Lingua straniera
Conoscenza della struttura e dei contenuti di una lingua
straniera oppure del significato e della pronuncia delle
parole, delle regole di composizione e della grammatica
EXP
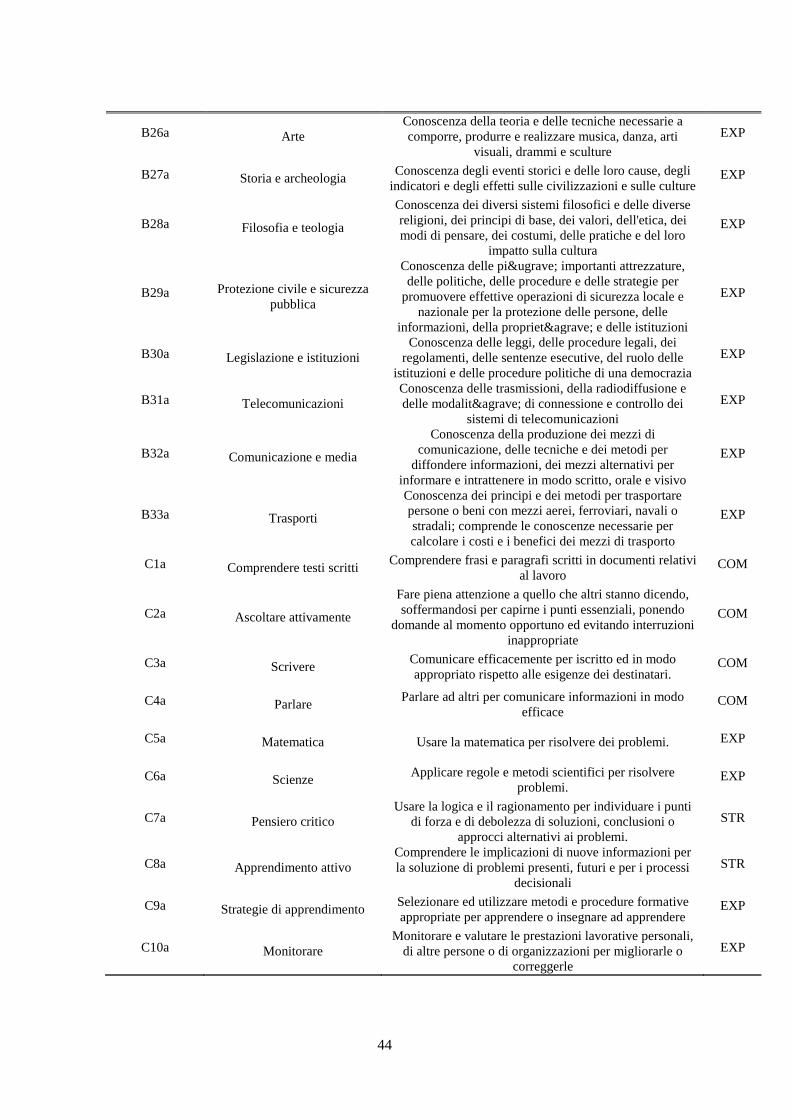
44
B26a Arte
Conoscenza della teoria e delle tecniche necessarie a
comporre, produrre e realizzare musica, danza, arti
visuali, drammi e sculture
EXP
B27a Storia e archeologia Conoscenza degli eventi storici e delle loro cause, degli
indicatori e degli effetti sulle civilizzazioni e sulle culture EXP
B28a Filosofia e teologia
Conoscenza dei diversi sistemi filosofici e delle diverse
religioni, dei principi di base, dei valori, dell'etica, dei
modi di pensare, dei costumi, delle pratiche e del loro
impatto sulla cultura
EXP
B29a Protezione civile e sicurezza
pubblica
Conoscenza delle più importanti attrezzature,
delle politiche, delle procedure e delle strategie per
promuovere effettive operazioni di sicurezza locale e
nazionale per la protezione delle persone, delle
informazioni, della proprietà e delle istituzioni
EXP
B30a Legislazione e istituzioni
Conoscenza delle leggi, delle procedure legali, dei
regolamenti, delle sentenze esecutive, del ruolo delle
istituzioni e delle procedure politiche di una democrazia
EXP
B31a Telecomunicazioni
Conoscenza delle trasmissioni, della radiodiffusione e
delle modalità di connessione e controllo dei
sistemi di telecomunicazioni
EXP
B32a Comunicazione e media
Conoscenza della produzione dei mezzi di
comunicazione, delle tecniche e dei metodi per
diffondere informazioni, dei mezzi alternativi per
informare e intrattenere in modo scritto, orale e visivo
EXP
B33a Trasporti
Conoscenza dei principi e dei metodi per trasportare
persone o beni con mezzi aerei, ferroviari, navali o
stradali; comprende le conoscenze necessarie per
calcolare i costi e i benefici dei mezzi di trasporto
EXP
C1a Comprendere testi scritti Comprendere frasi e paragrafi scritti in documenti relativi
al lavoro COM
C2a Ascoltare attivamente
Fare piena attenzione a quello che altri stanno dicendo,
soffermandosi per capirne i punti essenziali, ponendo
domande al momento opportuno ed evitando interruzioni
inappropriate
COM
C3a Scrivere Comunicare efficacemente per iscritto ed in modo
appropriato rispetto alle esigenze dei destinatari. COM
C4a Parlare Parlare ad altri per comunicare informazioni in modo
efficace COM
C5a Matematica Usare la matematica per risolvere dei problemi. EXP
C6a Scienze Applicare regole e metodi scientifici per risolvere
problemi. EXP
C7a Pensiero critico
Usare la logica e il ragionamento per individuare i punti
di forza e di debolezza di soluzioni, conclusioni o
approcci alternativi ai problemi.
STR
C8a Apprendimento attivo
Comprendere le implicazioni di nuove informazioni per
la soluzione di problemi presenti, futuri e per i processi
decisionali
STR
C9a Strategie di apprendimento Selezionare ed utilizzare metodi e procedure formative
appropriate per apprendere o insegnare ad apprendere EXP
C10a Monitorare
Monitorare e valutare le prestazioni lavorative personali,
di altre persone o di organizzazioni per migliorarle o
correggerle
EXP

45
C11a Percezione sociale Comprendere le reazioni degli altri e il perchè
reagiscano in determinati modi COM
C12a Coordinarsi con gli altri Coordinare le proprie azioni a quelle degli altri STR
C13a Persuadere Persuadere gli altri a cambiare opinioni o comportamenti COM
C14a Negoziare Discutere e trattare con gli altri per trovare un accordo e
cercare di ricomporre opinioni diverse COM
C15a Istruire Insegnare ad altri come fare determinate cose COM
C16a Orientamento al servizio Cercare in modo attivo soluzioni per soddisfare le
esigenze degli altri COM
C17a Risolvere problemi complessi
Identificare problemi complessi e raccogliere le
informazioni utili a valutare possibili opzioni e trovare
soluzioni
STR
C18a Analisi delle fasi operative
Analizzare le caratteristiche e i requisiti di strumenti,
servizi o prodotti necessari alla realizzazione di un
progetto
STR
C19a Progettazione tecnologica Produrre o adattare attrezzature e tecnologie per far
fronte ai bisogni degli utenti EXP
C20a Selezionare strumenti Individuare gli strumenti necessari per lo svolgimento di
un lavoro. NON-G
C21a Installare Installare attrezzature, macchine, cavi o programmi
applicando le specifiche tecniche NON-G
C22a Programmare Scrivere programmi per computer per vari scopi EXP
C23a Controllo di qualità Condurre test ed ispezioni su prodotti, servizi o processi
per valutarne la qualità o le prestazioni EXP
C24a Sorvegliare macchine
Controllare misure di livello, quadranti o altri indicatori
per assicurarsi del corretto funzionamento di una
macchina
NON-G
C25a Far funzionare e controllare Controllare le operazioni e l'attività di
attrezzature e sistemi NON-G
C26a Manutenzione
Effettuare manutenzioni ordinarie sulle attrezzature e
definire quando e che tipo di manutenzione è
necessaria
NON-G
C27a Risolvere problemi Determinare le cause di errori di funzionamento e
decidere cosa fare per risolverli NON-G
C28a Riparare Riparare macchinari o sistemi usando le attrezzature
opportune NON-G
C29a Analizzare sistemi
Determinare come dovrebbe funzionare un “sistema”
(ovvero macchine, fabbriche, organizzazioni, ambienti) e
come cambiamenti ambientali, operativi o di situazione
possano influire sui suoi risultati
EXP
C30a Valutare sistemi
Identificare misure o indicatori delle prestazioni di un
sistema (ovvero macchine, fabbriche, organizzazioni,
ambienti) e le azioni necessarie per migliorarle o
correggerle in relazione agli obiettivi del sistema stesso
EXP
C31a Valutare e decidere Valutare i costi e i benefici di possibili azioni per
scegliere la più opportuna STR
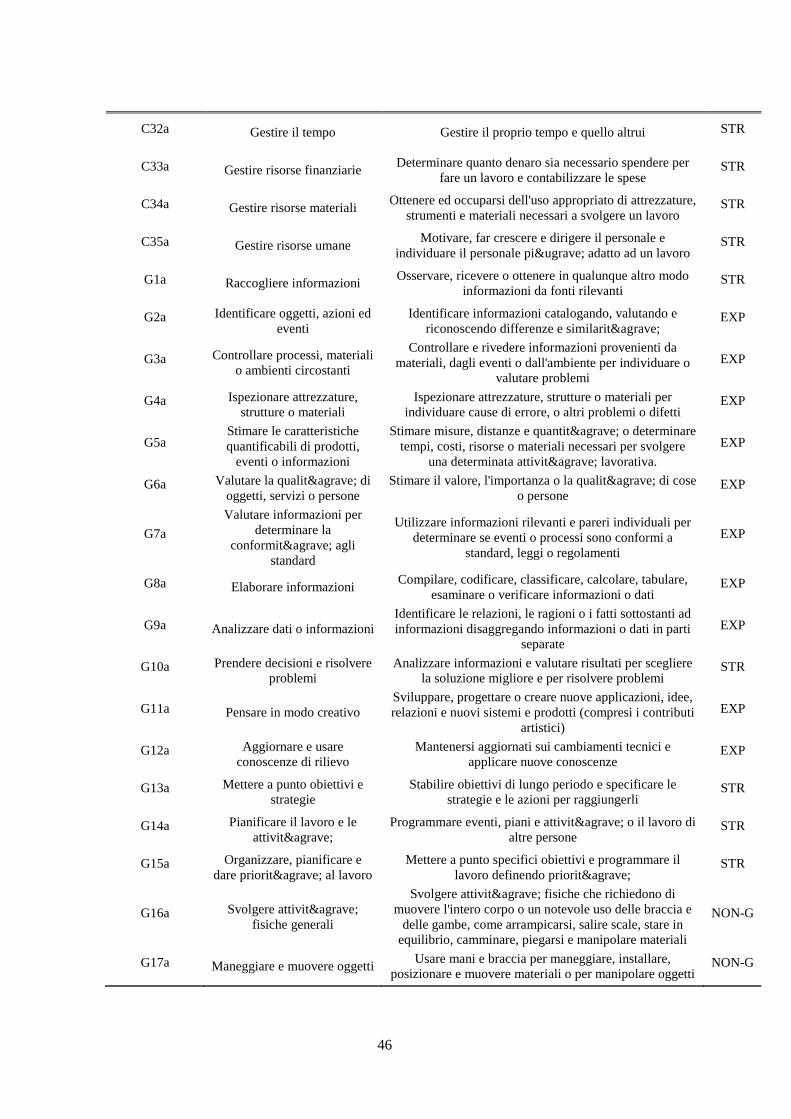
46
C32a Gestire il tempo Gestire il proprio tempo e quello altrui STR
C33a Gestire risorse finanziarie Determinare quanto denaro sia necessario spendere per
fare un lavoro e contabilizzare le spese STR
C34a Gestire risorse materiali Ottenere ed occuparsi dell'uso appropriato di attrezzature,
strumenti e materiali necessari a svolgere un lavoro STR
C35a Gestire risorse umane Motivare, far crescere e dirigere il personale e
individuare il personale più adatto ad un lavoro STR
G1a Raccogliere informazioni Osservare, ricevere o ottenere in qualunque altro modo
informazioni da fonti rilevanti STR
G2a Identificare oggetti, azioni ed
eventi
Identificare informazioni catalogando, valutando e
riconoscendo differenze e similarità EXP
G3a Controllare processi, materiali
o ambienti circostanti
Controllare e rivedere informazioni provenienti da
materiali, dagli eventi o dall'ambiente per individuare o
valutare problemi
EXP
G4a Ispezionare attrezzature,
strutture o materiali
Ispezionare attrezzature, strutture o materiali per
individuare cause di errore, o altri problemi o difetti EXP
G5a Stimare le caratteristiche
quantificabili di prodotti,
eventi o informazioni
Stimare misure, distanze e quantità o determinare
tempi, costi, risorse o materiali necessari per svolgere
una determinata attività lavorativa.
EXP
G6a Valutare la qualità di
oggetti, servizi o persone
Stimare il valore, l'importanza o la qualità di cose
o persone EXP
G7a
Valutare informazioni per
determinare la
conformità agli
standard
Utilizzare informazioni rilevanti e pareri individuali per
determinare se eventi o processi sono conformi a
standard, leggi o regolamenti
EXP
G8a Elaborare informazioni Compilare, codificare, classificare, calcolare, tabulare,
esaminare o verificare informazioni o dati EXP
G9a Analizzare dati o informazioni
Identificare le relazioni, le ragioni o i fatti sottostanti ad
informazioni disaggregando informazioni o dati in parti
separate
EXP
G10a Prendere decisioni e risolvere
problemi
Analizzare informazioni e valutare risultati per scegliere
la soluzione migliore e per risolvere problemi STR
G11a Pensare in modo creativo
Sviluppare, progettare o creare nuove applicazioni, idee,
relazioni e nuovi sistemi e prodotti (compresi i contributi
artistici)
EXP
G12a Aggiornare e usare
conoscenze di rilievo
Mantenersi aggiornati sui cambiamenti tecnici e
applicare nuove conoscenze EXP
G13a Mettere a punto obiettivi e
strategie
Stabilire obiettivi di lungo periodo e specificare le
strategie e le azioni per raggiungerli STR
G14a Pianificare il lavoro e le
attività
Programmare eventi, piani e attività o il lavoro di
altre persone STR
G15a Organizzare, pianificare e
dare priorità al lavoro
Mettere a punto specifici obiettivi e programmare il
lavoro definendo priorità STR
G16a Svolgere attività
fisiche generali
Svolgere attività fisiche che richiedono di
muovere l'intero corpo o un notevole uso delle braccia e
delle gambe, come arrampicarsi, salire scale, stare in
equilibrio, camminare, piegarsi e manipolare materiali
NON-G
G17a Maneggiare e muovere oggetti Usare mani e braccia per maneggiare, installare,
posizionare e muovere materiali o per manipolare oggetti NON-G

47
G18a Gestire macchine e processi
Usare sia i meccanismi di controllo che l'attività
fisica diretta per manovrare macchine o processi (esclusi
i computer e i veicoli)
NON-G
G19a Lavorare con i computer
Usare computer e sistemi informatici (software ed
hardware) per programmare, scrivere software, regolare
funzioni, inserire dati, o elaborare informazioni
EXP
G20a Manovrare veicoli, mezzi
meccanici o attrezzature
Far funzionare, manovrare, guidare o pilotare veicoli o
attrezzature meccaniche come carrelli elevatori, veicoli
da trasporto, aeromobili o battelli
NON-G
G21a Scrivere bozze, stendere note
e specifiche tecniche per
componenti o attrezzature
Produrre documentazione, istruzioni dettagliate, disegni o
specifiche per spiegare come sono costruiti, assemblati,
modificati, mantenuti o usati periferiche, componenti,
attrezzature o strutture
COM
G22a Riparare e fare manutenzione
di attrezzature meccaniche
Fare manutenzione, riparare, regolare e provare
macchine, periferiche, parti mobili e attrezzature
meccaniche (non elettroniche)
NON-G
G23a Riparare e fare manutenzione
di attrezzature elettroniche
Fare manutenzione, riparare, regolare, calibrare, mettere
a punto o provare macchine, periferiche e attrezzature
elettroniche (non meccaniche)
NON-G
G24a Documentare, registrare
informazioni
Inserire, trascrivere, registrare, immagazzinare o
conservare informazioni in forma scritta, elettronica o
magnetica
EXP
G25a Interpretare il significato delle
informazioni
Interpretare o spiegare il significato di informazioni ed il
loro possibile utilizzo COM
G26a Comunicare con superiori,
colleghi o subordinati
Fornire informazioni ai superiori, ai colleghi e ai
subalterni, per telefono, in forma scritta, via e-mail o
personalmente
COM
G27a Comunicare con persone
esterne all'organizzazione
Comunicare con persone esterne all'organizzazione,
rappresentare la stessa verso i clienti, il pubblico, le
amministrazioni ed altre entità esterne,
personalmente, in forma scritta, per telefono o via e-mail.
COM
G28a Stabilire e mantenere relazioni
interpersonali
Creare rapporti di lavoro costruttivi e cooperativi e
mantenerli nel tempo. COM
G29a Assistere e prendersi cura di
altri
Fornire assistenza personale, attenzione medica, supporto
emotivo o altre cure personali ad altri (colleghi, clienti,
pazienti)
COM
G30a Vendere merci o influenzare
altri
Convincere altre persone ad acquistare merci o beni o a
far loro cambiare idea o comportamenti COM
G31a Risolvere controversie e
negoziare con altre persone
Gestire lamentele, negoziare, calmare dispute e risolvere
conflitti COM
G32a Lavorare a contatto diretto
con il pubblico o esibirsi
Esibirsi per il pubblico o occuparsi direttamente del
pubblico. Comprende servire i clienti in pubblici esercizi
o negozi e ricevere clienti o ospiti
COM
G33a Coordinare il lavoro e le
attività di altri
Far in modo che i componenti di un gruppo lavorino
insieme per realizzare i compiti assegnati STR
G34a Far crescere e attivare gruppi
di lavoro
Incoraggiare e far crescere la fiducia reciproca, il rispetto
e la cooperazione fra i membri di un gruppo. STR
G35a Formare ed insegnare
Identificare i bisogni formativi di altre persone, mettere a
punto programmi o corsi formali di istruzione o
formazione e insegnare o istruire altre persone
COM
G36a Guidare, dirigere e motivare i
subalterni
Guidare e dirigere i subalterni definendo gli standard
nelle prestazioni e il controllo delle stesse STR
G37a Addestrare e far crescere altre
persone
Identificare i bisogni di crescita di altre persone e
addestrare, far da guida o aiutare altre persone a COM

48
migliorare le proprie conoscenze e capacità
G38a Fornire consulenze e
suggerimenti ad altre persone
Fornire linee guida e suggerimenti qualificati alla
dirigenza o ad altri gruppi su questioni tecniche o relative
a sistemi o processi
NON-G
G39a Svolgere attività
amministrative
Svolgere compiti amministrativi quotidiani, come gestire
archivi e sbrigare pratiche NON-G
G40a Reclutare il personale Reclutare, intervistare, selezionare, assumere e
promuovere impiegati in un'organizzazione STR
G41a Monitorare e controllare
risorse
Monitorare e controllare risorse e supervisionare le
attività di spesa STR
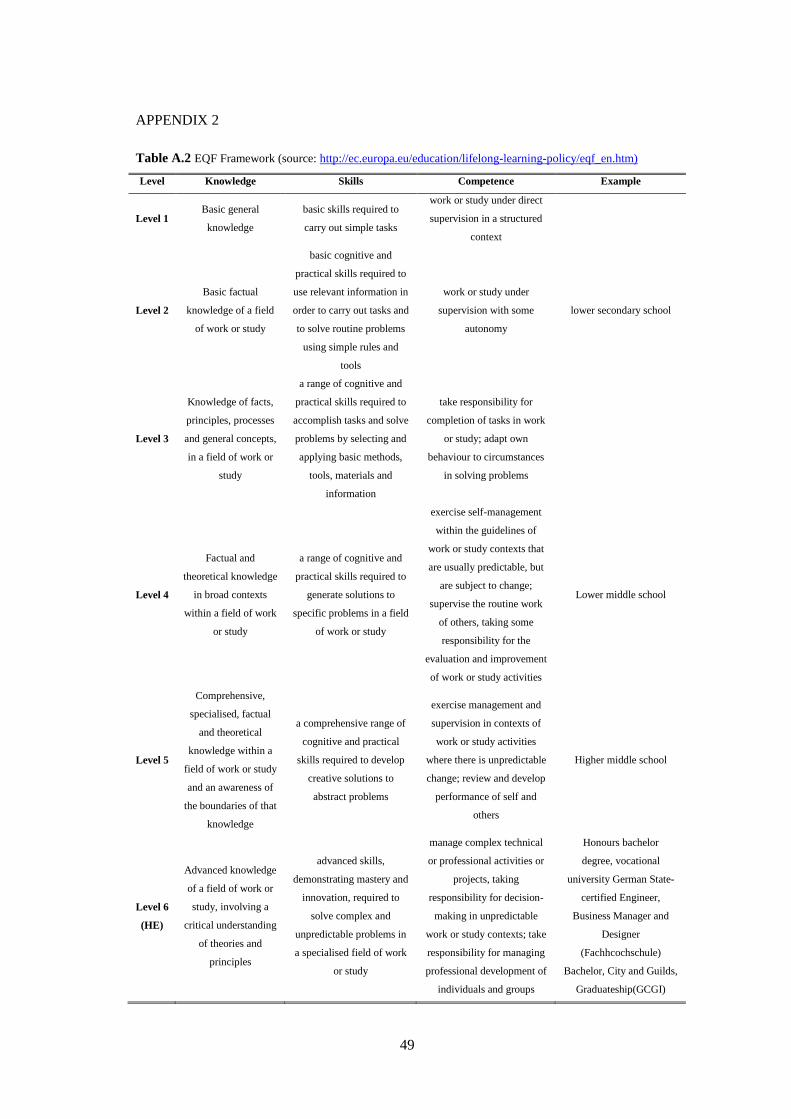
49
APPENDIX 2
Table A.2 EQF Framework (source: http://ec.europa.eu/education/lifelong-learning-policy/eqf_en.htm)
Level Knowledge Skills Competence Example
Level 1 Basic general
knowledge
basic skills required to
carry out simple tasks
work or study under direct
supervision in a structured
context
Level 2
Basic factual
knowledge of a field
of work or study
basic cognitive and
practical skills required to
use relevant information in
order to carry out tasks and
to solve routine problems
using simple rules and
tools
work or study under
supervision with some
autonomy
lower secondary school
Level 3
Knowledge of facts,
principles, processes
and general concepts,
in a field of work or
study
a range of cognitive and
practical skills required to
accomplish tasks and solve
problems by selecting and
applying basic methods,
tools, materials and
information
take responsibility for
completion of tasks in work
or study; adapt own
behaviour to circumstances
in solving problems
Level 4
Factual and
theoretical knowledge
in broad contexts
within a field of work
or study
a range of cognitive and
practical skills required to
generate solutions to
specific problems in a field
of work or study
exercise self-management
within the guidelines of
work or study contexts that
are usually predictable, but
are subject to change;
supervise the routine work
of others, taking some
responsibility for the
evaluation and improvement
of work or study activities
Lower middle school
Level 5
Comprehensive,
specialised, factual
and theoretical
knowledge within a
field of work or study
and an awareness of
the boundaries of that
knowledge
a comprehensive range of
cognitive and practical
skills required to develop
creative solutions to
abstract problems
exercise management and
supervision in contexts of
work or study activities
where there is unpredictable
change; review and develop
performance of self and
others
Higher middle school
Level 6
(HE)
Advanced knowledge
of a field of work or
study, involving a
critical understanding
of theories and
principles
advanced skills,
demonstrating mastery and
innovation, required to
solve complex and
unpredictable problems in
a specialised field of work
or study
manage complex technical
or professional activities or
projects, taking
responsibility for decision-
making in unpredictable
work or study contexts; take
responsibility for managing
professional development of
individuals and groups
Honours bachelor
degree, vocational
university German State-
certified Engineer,
Business Manager and
Designer
(Fachhcochschule)
Bachelor, City and Guilds,
Graduateship(GCGI)

50
Level 7
(HE)
Highly specialised
knowledge, some
of which is at the
forefront of
knowledge in a
field of work or
study, as the basis
for original
thinking and/or
research;
Critical awareness
of knowledge
issues in a field
and at the interface
between different
fields
specialised problem-
solving skills required in
research and/or innovation
in order to develop new
knowledge and procedures
and to integrate knowledge
from different fields
manage and transform work
or study contexts that are
complex, unpredictable and
require new strategic
approaches; take
responsibility for
contributing to professional
knowledge and practice
and/or for reviewing the
strategic performance of
teams
Masters, vocational
university
(Fachhcochschule)
Masters, City and Guilds
(MCGI)
Level 8
(HE)
Knowledge at the
most advanced
frontier of a field of
work or study and at
the interface between
fields
the most advanced and
specialised skills and
techniques, including
synthesis and evaluation,
required to solve critical
problems in research
and/or innovation and to
extend and redefine
existing knowledge or
professional practice
demonstrate substantial
authority, innovation,
autonomy, scholarly and
professional integrity and
sustained commitment to the
development of new ideas or
processes at the forefront of
work or study contexts
including research
Doctorate
Awards - Fellowship

51
APPENDIX 3
Table A.3 EQF Levels and SOC(HE)-Italy groups per job title
Code Job Title EXP
cluster
STR
Cluste
r
COM
Cliste
r
EQF
Leve
l
SOC(HE)-
Italy Group
1.1.1.1.0 Membri di organismi di governo e di assemblee nazionali con
podestà legislativa e regolamentare 6,96 6,63 6,47 7 EXP
1.1.1.2.0 Membri di organismi di governo e di assemblee regionali con
podestà legislativa e regolamentare 6,36 6,02 6,47 6 COM
1.1.1.3.0 Membri di organismi di governo e di assemblee provinciali con
podestà legislativa e regolamentare 6,04 5,92 6,28 6 COM
1.1.1.4.0 Membri di organismi di governo e di assemblee sub-provinciali
e comunali con podestà legislativa e regolamentare 5,8 5,87 5,95 6 COM
1.1.2.1.0 Ambasciatori, ministri plenipotenziari ed altri dirigenti della
carriera diplomatica - 6,88 7,11 7 COM
1.1.2.2.1 Commissari di governo, prefetti e vice prefetti 6,7 6,51 6,67 7 EXP
1.1.2.2.2 Capi e vice capi della Polizia di Stato, questori ed alti
responsabili della sicurezza pubblica 6,85 6,67 6,61 7 EXP
1.1.2.2.3 Segretari generali e responsabili del controllo e della gestione
nella amministrazione pubblica 6,28 6,35 6,4 6 COM
1.1.2.3.1 Dirigenti degli uffici scolastici territoriali 6,14 6,12 6,14 6 COM
1.1.2.3.2 Sovraintendenti al patrimonio culturale nazionale 6,08 6,26 6,24 6 STR
1.1.2.4.1
Direttori generali, dipartimentali ed equiparati delle
amministrazioni dello Stato, delle aziende autonome, degli enti
pubblici non economici e degli enti locali 6,72 6,92 6,92 7 STR
1.1.2.4.2 Direttori delle istituzioni scolastiche, delle università e degli
enti di ricerca 6,43 6,32 6,54 6 COM
1.1.2.4.3 Direttori generali ed equiparati delle istituzioni sanitarie 6,6 6,65 6,48 7 STR
1.1.2.5.1
Dirigenti ed equiparati delle amministrazioni dello stato, delle
aziende autonome, degli enti pubblici non economici e degli
enti locali 6,04 6,1 6,19 6 COM
1.1.2.5.2 Dirigenti ed equiparati delle istituzioni scolastiche, delle
università e degli enti di ricerca 7,09 7,1 7,03 7 STR
1.1.2.5.3 Dirigenti ed equiparati delle istituzioni sanitarie 6,48 6,44 6,44 6 EXP
1.1.3.1.0 Dirigenti della magistratura ordinaria 6,34 6,2 6,59 6 COM
1.1.3.2.0 Dirigenti della magistratura amministrativa e delle
giurisdizioni speciali 6,67 6,26 6,55 6 EXP
1.1.4.1.1 Dirigenti dei partiti politici 5,52 5,68 5,96 6 COM
1.1.4.1.2 Dirigenti di sindacati e altre organizzazionei a tutela di
interessi economici 6,16 6,27 6,54 6 COM
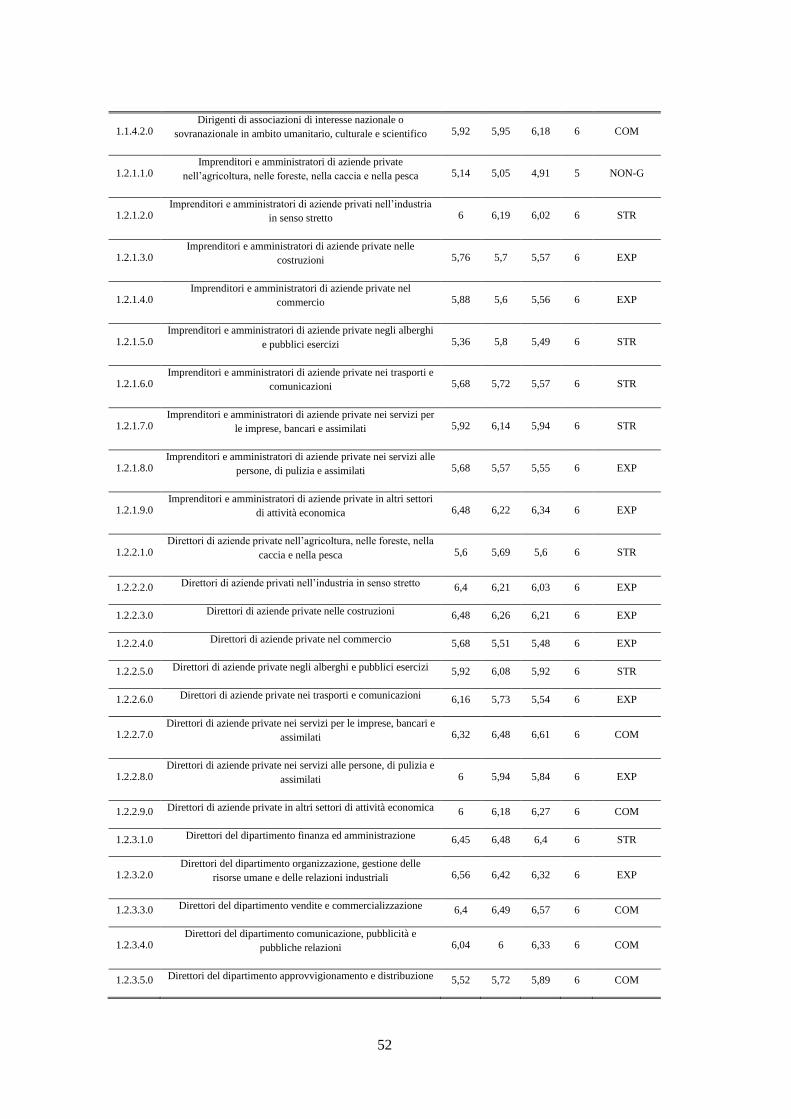
52
1.1.4.2.0 Dirigenti di associazioni di interesse nazionale o
sovranazionale in ambito umanitario, culturale e scientifico 5,92 5,95 6,18 6 COM
1.2.1.1.0 Imprenditori e amministratori di aziende private
nell’agricoltura, nelle foreste, nella caccia e nella pesca 5,14 5,05 4,91 5 NON-G
1.2.1.2.0 Imprenditori e amministratori di aziende privati nell’industria
in senso stretto 6 6,19 6,02 6 STR
1.2.1.3.0 Imprenditori e amministratori di aziende private nelle
costruzioni 5,76 5,7 5,57 6 EXP
1.2.1.4.0 Imprenditori e amministratori di aziende private nel
commercio 5,88 5,6 5,56 6 EXP
1.2.1.5.0 Imprenditori e amministratori di aziende private negli alberghi
e pubblici esercizi 5,36 5,8 5,49 6 STR
1.2.1.6.0 Imprenditori e amministratori di aziende private nei trasporti e
comunicazioni 5,68 5,72 5,57 6 STR
1.2.1.7.0 Imprenditori e amministratori di aziende private nei servizi per
le imprese, bancari e assimilati 5,92 6,14 5,94 6 STR
1.2.1.8.0 Imprenditori e amministratori di aziende private nei servizi alle
persone, di pulizia e assimilati 5,68 5,57 5,55 6 EXP
1.2.1.9.0 Imprenditori e amministratori di aziende private in altri settori
di attività economica 6,48 6,22 6,34 6 EXP
1.2.2.1.0 Direttori di aziende private nell’agricoltura, nelle foreste, nella
caccia e nella pesca 5,6 5,69 5,6 6 STR
1.2.2.2.0 Direttori di aziende privati nell’industria in senso stretto 6,4 6,21 6,03 6 EXP
1.2.2.3.0 Direttori di aziende private nelle costruzioni 6,48 6,26 6,21 6 EXP
1.2.2.4.0 Direttori di aziende private nel commercio 5,68 5,51 5,48 6 EXP
1.2.2.5.0 Direttori di aziende private negli alberghi e pubblici esercizi 5,92 6,08 5,92 6 STR
1.2.2.6.0 Direttori di aziende private nei trasporti e comunicazioni 6,16 5,73 5,54 6 EXP
1.2.2.7.0 Direttori di aziende private nei servizi per le imprese, bancari e
assimilati 6,32 6,48 6,61 6 COM
1.2.2.8.0 Direttori di aziende private nei servizi alle persone, di pulizia e
assimilati 6 5,94 5,84 6 EXP
1.2.2.9.0 Direttori di aziende private in altri settori di attività economica 6 6,18 6,27 6 COM
1.2.3.1.0 Direttori del dipartimento finanza ed amministrazione 6,45 6,48 6,4 6 STR
1.2.3.2.0 Direttori del dipartimento organizzazione, gestione delle
risorse umane e delle relazioni industriali 6,56 6,42 6,32 6 EXP
1.2.3.3.0 Direttori del dipartimento vendite e commercializzazione 6,4 6,49 6,57 6 COM
1.2.3.4.0 Direttori del dipartimento comunicazione, pubblicità e
pubbliche relazioni 6,04 6 6,33 6 COM
1.2.3.5.0 Direttori del dipartimento approvvigionamento e distribuzione 5,52 5,72 5,89 6 COM

53
1.2.3.6.0 Direttori del dipartimento servizi informatici 6,03 5,98 5,9 6 EXP
1.2.3.7.0 Direttori del dipartimento ricerca e sviluppo 6,29 6,33 6,35 6 COM
1.3.1.1.0 Imprenditori, gestori e responsabili di piccole imprese
nell'agricoltura, nelle foreste, nella caccia e nella pesca 4,93 4,78 4,72 5 NON-G
1.3.1.2.0 Imprenditori, gestori e responsabili di piccole imprese
nell'industria in senso stretto 5,68 5,85 5,68 6 STR
1.3.1.3.0 Imprenditori, gestori e responsabili di piccole imprese nelle
costruzioni 5,36 5,48 5,2 5 NON-G
1.3.1.4.0 Imprenditori, gestori e responsabili di piccole imprese nel
commercio - 5,25 5,24 5 NON-G
1.3.1.5.0 Imprenditori, gestori e responsabili di piccole imprese negli
alberghi e pubblici esercizi 5,12 5,3 5,32 5 NON-G
1.3.1.6.0 Imprenditori, gestori e responsabili di piccole imprese nei
trasporti e nelle comunicazioni 5,44 5,54 5,55 6 COM
1.3.1.7.0 Imprenditori, gestori e responsabili di piccole imprese nei
servizi per le imprese, bancari e assimilati 5,8 5,96 5,81 6 STR
1.3.1.8.0 Imprenditori, gestori e responsabili di piccole imprese nei
servizi alle persone, di pulizia e servizi assimilati 5,16 4,98 4,96 5 NON-G
1.3.1.9.0 Imprenditori, gestori e responsabili di piccole imprese in altri
settori di attività economica 6,08 5,84 5,76 6 EXP
2.1.1.1.1 Fisici 7,3 6,92 7 7 EXP
2.1.1.1.2 Astronomi ed astrofisici 7,26 7,08 7,12 7 EXP
2.1.1.2.1 Chimici ricercatori 6,26 5,88 6,1 6 EXP
2.1.1.2.2 Chimici informatori e divulgatori 6,08 5,56 5,95 6 EXP
2.1.1.3.1 Matematici 7,16 7,1 6,96 7 EXP
2.1.1.3.2 Statistici 6,34 6 6,21 6 EXP
2.1.1.4.1 Specialisti nella ricerca informatica di base 6,84 7,2 7,09 7 STR
2.1.1.4.2 Analisti e progettisti di software applicativi e di sistema 6,23 5,96 5,6 6 EXP
2.1.1.4.3 Analisti di sistema 6,59 6,24 6 6 EXP
2.1.1.4.4 Specialisti in sicurezza informatica 6,14 5,89 5,82 6 EXP
2.1.1.4.5 Specialisti in reti e comunicazioni informatiche 6,08 5,65 5,88 6 EXP
2.1.1.5.1 Geologi 5,68 5,24 5,54 5 EXP
2.1.1.5.2 Paleontologi 6,41 6,22 6,49 6 COM
2.1.1.5.3 Geofisici 7,05 - 7,28 7 COM
2.1.1.5.4 Meteorologi 6,64 6,24 6,14 6 EXP
2.1.1.5.5 Idrologi 6,52 6,48 6,32 6 EXP

54
2.2.1.1.1 Ingegneri meccanici 6,73 6,16 6,4 6 EXP
2.2.1.1.2 Ingegneri navali 7,12 6,64 6,72 7 EXP
2.2.1.1.3 Ingegneri aeronautici e spaziali 6,16 6,12 6,16 6 EXP
2.2.1.1.4 Ingegneri nucleari 7,72 - 7,68 7 EXP
2.2.1.2.1 Ingegneri metallurgici 6,64 6,16
6 EXP
2.2.1.2.2 Ingegneri minerari 6,76 6,54 6,98 7 COM
2.2.1.3.0 Ingegneri elettrotecnici e dell'automazione industriale 6,3 6,27 6,2 6 EXP
2.2.1.4.1 Ingegneri elettronici 6,32 6,28 6,04 6 EXP
2.2.1.4.2 Ingegneri progettisti di calcolatori e loro periferiche 6,9 6,8 6,8 7 EXP
2.2.1.4.3 Ingegneri in telecomunicazioni 6,47 - 6,4 6 EXP
2.2.1.5.1 Ingegneri chimici 6,55 6,45 6,4 6 EXP
2.2.1.5.2 Ingegneri petroliferi 6,78 6,74 6,72 7 EXP
2.2.1.6.1 Ingegneri edili 6,34 5,86 5,84 6 EXP
2.2.1.6.2 Ingegneri idraulici 6,1 5,84 5,6 6 EXP
2.2.1.9.1 Cartografi e fotogrammetristi 6,14 5,56 5,5 6 EXP
2.2.1.9.2 Ingegneri industriali e gestionali 6,2 6,4 6,16 6 STR
2.2.1.9.3 Ingegneri dei materiali 6,66 6,58 6,56 7 EXP
2.2.1.9.4 Ingegneri biomedici e bioingegneri 6,28 6,04 6,24 6 EXP
2.2.2.0.1 Architetti 6,56 6,13 6,19 6 EXP
2.2.2.0.2 Urbanisti e specialisti del recupero e della conservazione del
territorio 6,02 5,56 5,78 6 EXP
2.3.1.1.1 Biologi 6,22 6,12 5,98 6 EXP
2.3.1.1.2 Biochimici 6,04 5,63 5,81 6 EXP
2.3.1.1.3 Biofisici 7 6,96 7,06 7 COM
2.3.1.1.4 Biotecnologi alimentari 6,64 6,24 6,56 6 EXP
2.3.1.1.5 Botanici 6,29 6,32 6,3 6 STR
2.3.1.1.6 Zoologi 6,7 6,45 6,58 7 EXP
2.3.1.1.7 Ecologi 6,62 6,14 6,43 6 EXP
2.3.1.2.1 Farmacologi 7,02 6,92 6,8 7 EXP
2.3.1.2.2 Microbiologi 6,32 5,67 5,94 6 EXP
2.3.1.3.0 Agronomi ed assimilati 5,26 5,16 5,44 5 COM
2.3.1.4.0 Veterinari ed assimilati 5,58 5,43 5,54 6 EXP
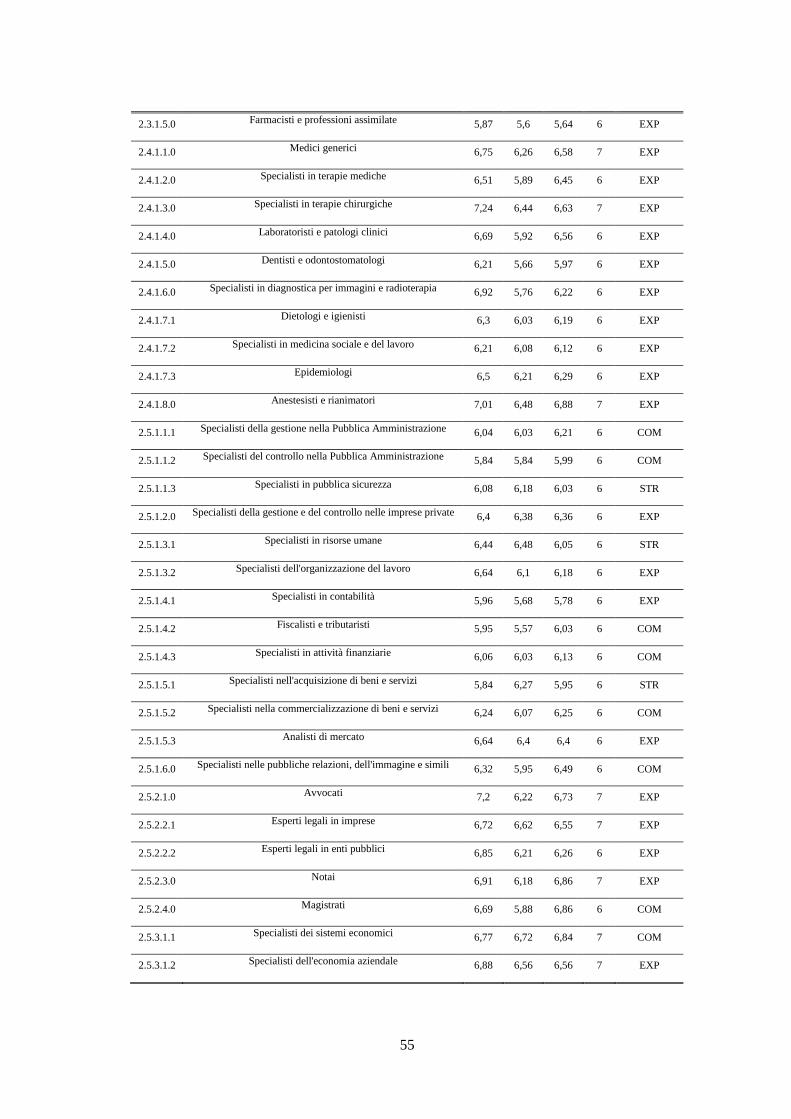
55
2.3.1.5.0 Farmacisti e professioni assimilate 5,87 5,6 5,64 6 EXP
2.4.1.1.0 Medici generici 6,75 6,26 6,58 7 EXP
2.4.1.2.0 Specialisti in terapie mediche 6,51 5,89 6,45 6 EXP
2.4.1.3.0 Specialisti in terapie chirurgiche 7,24 6,44 6,63 7 EXP
2.4.1.4.0 Laboratoristi e patologi clinici 6,69 5,92 6,56 6 EXP
2.4.1.5.0 Dentisti e odontostomatologi 6,21 5,66 5,97 6 EXP
2.4.1.6.0 Specialisti in diagnostica per immagini e radioterapia 6,92 5,76 6,22 6 EXP
2.4.1.7.1 Dietologi e igienisti 6,3 6,03 6,19 6 EXP
2.4.1.7.2 Specialisti in medicina sociale e del lavoro 6,21 6,08 6,12 6 EXP
2.4.1.7.3 Epidemiologi 6,5 6,21 6,29 6 EXP
2.4.1.8.0 Anestesisti e rianimatori 7,01 6,48 6,88 7 EXP
2.5.1.1.1 Specialisti della gestione nella Pubblica Amministrazione 6,04 6,03 6,21 6 COM
2.5.1.1.2 Specialisti del controllo nella Pubblica Amministrazione 5,84 5,84 5,99 6 COM
2.5.1.1.3 Specialisti in pubblica sicurezza 6,08 6,18 6,03 6 STR
2.5.1.2.0 Specialisti della gestione e del controllo nelle imprese private 6,4 6,38 6,36 6 EXP
2.5.1.3.1 Specialisti in risorse umane 6,44 6,48 6,05 6 STR
2.5.1.3.2 Specialisti dell'organizzazione del lavoro 6,64 6,1 6,18 6 EXP
2.5.1.4.1 Specialisti in contabilità 5,96 5,68 5,78 6 EXP
2.5.1.4.2 Fiscalisti e tributaristi 5,95 5,57 6,03 6 COM
2.5.1.4.3 Specialisti in attività finanziarie 6,06 6,03 6,13 6 COM
2.5.1.5.1 Specialisti nell'acquisizione di beni e servizi 5,84 6,27 5,95 6 STR
2.5.1.5.2 Specialisti nella commercializzazione di beni e servizi 6,24 6,07 6,25 6 COM
2.5.1.5.3 Analisti di mercato 6,64 6,4 6,4 6 EXP
2.5.1.6.0 Specialisti nelle pubbliche relazioni, dell'immagine e simili 6,32 5,95 6,49 6 COM
2.5.2.1.0 Avvocati 7,2 6,22 6,73 7 EXP
2.5.2.2.1 Esperti legali in imprese 6,72 6,62 6,55 7 EXP
2.5.2.2.2 Esperti legali in enti pubblici 6,85 6,21 6,26 6 EXP
2.5.2.3.0 Notai 6,91 6,18 6,86 7 EXP
2.5.2.4.0 Magistrati 6,69 5,88 6,86 6 COM
2.5.3.1.1 Specialisti dei sistemi economici 6,77 6,72 6,84 7 COM
2.5.3.1.2 Specialisti dell'economia aziendale 6,88 6,56 6,56 7 EXP

56
2.5.3.2.1 Sociologi 6,35 6,19 6,51 6 COM
2.5.3.2.2 Antropologi 6,96 6,72 6,76 7 EXP
2.5.3.2.3 Geografi 6,72 6,51 6,54 7 EXP
2.5.3.2.4 Archeologi 6,64 6,06 6,16 6 EXP
2.5.3.3.1 Psicologi clinici e psicoterapeuti 7,1 6,88 6,93 7 EXP
2.5.3.3.2 Psicologi clinici e psicoterapeuti 7,12 6,8 6,92 7 EXP
2.5.3.3.3 Psicologi del lavoro e delle organizzazioni 7,17 7,33 6,7 7 STR
2.5.3.4.1 Psicologi del lavoro e delle organizzazioni 6,32 5,92 6,17 6 EXP
2.5.3.4.2 Esperti d'arte 6,04 6,21 6,5 6 COM
2.5.3.4.3 Specialisti in scienza politica 6,88 7,07 7,04 7 STR
2.5.3.4.4 Filosofi 6,7 6,4 6,59 7 EXP
2.5.4.1.1 Scrittori e poeti 5,42 5,12 5,8 5 COM
2.5.4.1.2 Dialoghisti, soggettisti e parolieri 5,94 4,88 5,71 6 EXP
2.5.4.1.3 Redattori di testi per la pubblicità 6,22 5,88 6,17 6 EXP
2.5.4.1.4 Redattori di testi tecnici 4,71 4,67 5,16 5 NON-G
2.5.4.2.0 Giornalisti 6,21 5,75 6,16 6 EXP
2.5.4.3.0 Interpreti e traduttori di livello elevato 6,69 5,47 5,82 6 EXP
2.5.4.4.1 Linguisti e filologi 6,94 6,13 6,51 7 EXP
2.5.4.4.2 Revisori di testi 6,22 5,36 6,19 6 EXP
2.5.4.5.1 Archivisti 6,2 5,64 6,03 6 EXP
2.5.4.5.2 Bibliotecari 5,52 5,44 5,72 6 COM
2.5.4.5.3 Curatori e conservatori di musei 5,6 5,56 5,87 6 COM
2.5.5.1.1 Pittori, scultori e disegnatori 5,77 5,46 5,1 5 EXP
2.5.5.1.2 Bozzettisti e cartonisti 5,58 4,9 4,91 5 EXP
2.5.5.1.3 Restauratori di opere d'arte 5,6 5,6 6,08 6 COM
2.5.5.2.1 Registi 6,7 6,12 6,37 6 EXP
2.5.5.2.2 Attori 5,6 5,46 6,08 6 COM
2.5.5.2.3 Direttori artistici 5,3 5,35 5,49 5 NON-G
2.5.5.2.4 Sceneggiatori 5,75 4,97 5,86 6 COM
2.5.5.2.5 Scenografi 6,12 5,25 5,35 6 EXP
2.5.5.3.1 Coreografi 6,26 5,93 5,98 6 EXP

57
2.5.5.3.2 Ballerini 5,46 4,84 5,11 5 NON-G
2.5.5.4.1 Compositori 5,69 5,18 5,9 6 COM
2.5.5.4.2 Direttori d'orchestra e coro 5,98 6,18 6,16 6 STR
2.5.5.4.3 Strumentisti 6,48 5,36 5,76 6 EXP
2.5.5.5.0 Cantanti 4,65 4,57 5,49 5 NON-G
2.5.6.0.0 Specialisti in discipline religiose e teologiche 5,79 5,57 5,62 6 EXP
2.6.1.1.0 Docenti universitari in scienze statistiche, matematiche,
fisiche, chimiche e della terra 6,93 6,96 7,07 7 COM
2.6.1.2.1 Docenti universitari in scienze della vita 6,73 6,51 7 7 COM
2.6.1.2.2 Docenti universitari in scienze della salute 6,86 6,6 6,95 7 COM
2.6.1.3.1 Docenti universitari in scienze ingegneristiche 7,18 6,96 7,21 7 COM
2.6.1.3.2 Docenti universitari in scienze dell'informazione 7,2 7,24 7,32 7 COM
2.6.1.4.0 Docenti universitari in scienze dell'antichità, filologico-
letterarie e storico-artistiche 6,83 6,64 6,98 7 COM
2.6.1.5.0 Docenti universitari in scienze storiche, filosofiche,
pedagogiche e psicologiche 6,83 6,84 7 7 COM
2.6.1.6.0 Docenti universitari in scienze giuridiche e sociali 6,8 7,16 7,25 7 COM
2.6.2.0.0 Ricercatori e tecnici laureati nelle scienze matematiche e
dell'informazione 6,82 6,76 6,82 7 EXP
2.6.2.0.1 Ricercatori e tecnici laureati nelle scienze fisiche 6,51 6,48 6,56 7 COM
2.6.2.0.2 Ricercatori e tecnici laureati nelle scienze chimiche e
farmaceutiche 6,2 6,29 6,17 6 STR
2.6.2.0.3 Ricercatori e tecnici laureati nelle scienze della terra 6,67 6,52 6,67 7 EXP
2.6.2.0.4 Ricercatori e tecnici laureati nelle scienze biologiche 6,8 6,8 6,7 7 EXP
2.6.2.0.5 Ricercatori e tecnici laureati nelle scienze mediche e
veterinarie 7,07 6,93 7,06 7 EXP
2.6.2.0.6 Ricercatori e tecnici laureati nelle scienze agrarie e della
produzione animale 6,51 6,4 6,68 7 COM
2.6.2.0.7 Ricercatori e tecnici laureati nelle scienze ingegneristiche e
dell'architettura 6,67 6,68 6,86 7 COM
2.6.2.0.8
Ricercatori e tecnici laureati nelle scienze dell'antichità,
filologico-letterarie, storiche, filosofiche, pedagogiche,
psicologiche e giuridiche 6,71 6,86 6,99 7 COM
2.6.2.0.9 Ricercatori e tecnici laureati nelle scienze economiche,
politiche, sociali e statistiche 6,53 6,51 6,79 7 COM
2.6.3.1.1 Professori di discipline artistiche nelle accademie di belle arti e
nelle istituzioni scolastiche assimilate 6,37 6 6,34 6 EXP
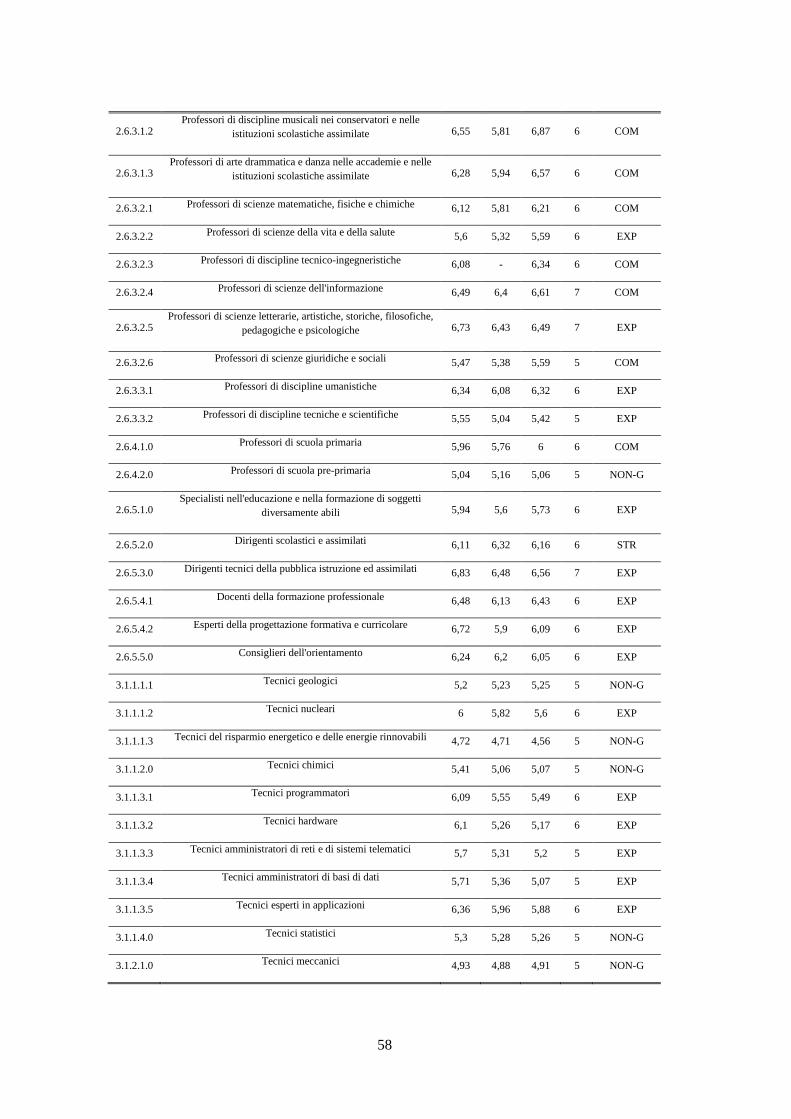
58
2.6.3.1.2 Professori di discipline musicali nei conservatori e nelle
istituzioni scolastiche assimilate 6,55 5,81 6,87 6 COM
2.6.3.1.3 Professori di arte drammatica e danza nelle accademie e nelle
istituzioni scolastiche assimilate 6,28 5,94 6,57 6 COM
2.6.3.2.1 Professori di scienze matematiche, fisiche e chimiche 6,12 5,81 6,21 6 COM
2.6.3.2.2 Professori di scienze della vita e della salute 5,6 5,32 5,59 6 EXP
2.6.3.2.3 Professori di discipline tecnico-ingegneristiche 6,08 - 6,34 6 COM
2.6.3.2.4 Professori di scienze dell'informazione 6,49 6,4 6,61 7 COM
2.6.3.2.5 Professori di scienze letterarie, artistiche, storiche, filosofiche,
pedagogiche e psicologiche 6,73 6,43 6,49 7 EXP
2.6.3.2.6 Professori di scienze giuridiche e sociali 5,47 5,38 5,59 5 COM
2.6.3.3.1 Professori di discipline umanistiche 6,34 6,08 6,32 6 EXP
2.6.3.3.2 Professori di discipline tecniche e scientifiche 5,55 5,04 5,42 5 EXP
2.6.4.1.0 Professori di scuola primaria 5,96 5,76 6 6 COM
2.6.4.2.0 Professori di scuola pre-primaria 5,04 5,16 5,06 5 NON-G
2.6.5.1.0 Specialisti nell'educazione e nella formazione di soggetti
diversamente abili 5,94 5,6 5,73 6 EXP
2.6.5.2.0 Dirigenti scolastici e assimilati 6,11 6,32 6,16 6 STR
2.6.5.3.0 Dirigenti tecnici della pubblica istruzione ed assimilati 6,83 6,48 6,56 7 EXP
2.6.5.4.1 Docenti della formazione professionale 6,48 6,13 6,43 6 EXP
2.6.5.4.2 Esperti della progettazione formativa e curricolare 6,72 5,9 6,09 6 EXP
2.6.5.5.0 Consiglieri dell'orientamento 6,24 6,2 6,05 6 EXP
3.1.1.1.1 Tecnici geologici 5,2 5,23 5,25 5 NON-G
3.1.1.1.2 Tecnici nucleari 6 5,82 5,6 6 EXP
3.1.1.1.3 Tecnici del risparmio energetico e delle energie rinnovabili 4,72 4,71 4,56 5 NON-G
3.1.1.2.0 Tecnici chimici 5,41 5,06 5,07 5 NON-G
3.1.1.3.1 Tecnici programmatori 6,09 5,55 5,49 6 EXP
3.1.1.3.2 Tecnici hardware 6,1 5,26 5,17 6 EXP
3.1.1.3.3 Tecnici amministratori di reti e di sistemi telematici 5,7 5,31 5,2 5 EXP
3.1.1.3.4 Tecnici amministratori di basi di dati 5,71 5,36 5,07 5 EXP
3.1.1.3.5 Tecnici esperti in applicazioni 6,36 5,96 5,88 6 EXP
3.1.1.4.0 Tecnici statistici 5,3 5,28 5,26 5 NON-G
3.1.2.1.0 Tecnici meccanici 4,93 4,88 4,91 5 NON-G

59
3.1.2.2.1 Tecnici della produzione ceramica 5,64 5,34 5,12 5 EXP
3.1.2.2.2 Tecnici minerari 5,07 4,76 5,22 5 NON-G
3.1.2.2.3 Tecnici metallurgici 5,57 5,56 5,52 6 EXP
3.1.2.3.0 Elettrotecnici 5,39 5,13 5,12 5 NON-G
3.1.2.4.0 Tecnici elettronici 6,05 5,65 5,68 6 EXP
3.1.2.5.1 Tecnici delle costruzioni civili 5,25 4,85 4,96 5 NON-G
3.1.2.5.2 Rilevatori e disegnatori di mappe e planimetrie per le
costruzioni civili 5,59 5,61 5,63 6 COM
3.1.2.6.1 Disegnatori tecnici 4,99 5,06 5,09 5 NON-G
3.1.2.6.2 Disegnatori tessili 5,2 5,02 4,76 5 NON-G
3.1.2.9.0 Tecnici della gestione del processo produttivo 5,84 5,66 5,6 6 EXP
3.1.3.1.1 Comandanti navali 5,72 5,15 5,2 5 EXP
3.1.3.1.2 Ufficiali e assistenti di bordo 5 4,75 4,83 5 NON-G
3.1.3.1.3 Piloti navali 4,99 5,1 4,84 5 NON-G
3.1.3.2.1 Piloti e ufficiali di aeromobili 6,58 6,24 6,4 6 EXP
3.1.3.2.2 Tecnici avionici 5,88 5,81 5,68 6 EXP
3.1.3.2.3 Tecnici aerospaziali 6,82 - 6,84 7 COM
3.1.3.3.1 Controllori di volo 5,79 5,66 6,11 6 COM
3.1.3.3.2 Tecnici del traffico aeroportuale 6,4 6,29 6,45 6 COM
3.1.4.1.0 Fotografi e assimilati 5,79 5,28 5,12 5 EXP
3.1.4.2.1 Operatori radio 3,6 3,63 4,15 4 NON-G
3.1.4.2.2 Tecnici delle trasmissioni radio-televisive 4,88 4,88 4,79 5 NON-G
3.1.4.3.1 Tecnici degli apparati audio-video e della ripresa video-
cinematografica 5,42 5,36 4,88 5 NON-G
3.1.4.3.2 Tecnici del suono 5,82 5,37 5,28 5 EXP
3.1.4.3.3 Tecnici del montaggio audio-video-cinematografico 5,29 5,09 5,12 5 NON-G
3.1.4.4.0 Tecnici di apparati medicali e per la diagnostica medica 4,56 4,51 4,45 5 NON-G
3.1.4.9.0 Altri operatori di apparati ottici ed elettronici 5,3 4,94 5,04 5 NON-G
3.1.5.1.2 Tecnici della sicurezza sul lavoro 5,79 5,62 5,71 6 EXP
3.1.5.2.0 Tecnici del controllo della qualità industriale 5,76 5,41 5,21 5 EXP
3.1.5.3.0 Tecnici del controllo ambientale 5,32 5,18 5,38 5 NON-G
3.1.5.4.1 Tecnici della raccolta e dello smaltimento dei rifiuti 5,08 4,97 4,96 5 NON-G
3.1.5.4.2 Tecnici del trattamento e della gestione delle acque reflue e 4,68 4,63 4,62 5 NON-G

60
potabili
3.2.1.1.1 Infermieri 5,95 5,73 5,79 6 EXP
3.2.1.1.2 Tecnici di diagnostica 5,56 4,82 5,31 5 EXP
3.2.1.2.1 Ortottisti e assistenti di oftalmologia 5,18 5,19 5,41 5 NON-G
3.2.1.2.2 Ottici e optometristi 5,44 4,77 5,04 5 NON-G
3.2.1.3.1 Igienisti dentali 5,74 5,52 5,55 6 EXP
3.2.1.3.2 Odontotecnici 5,52 5,2 - 5 EXP
3.2.1.4.1 Fisioterapisti e tecnici della riabilitazione 4,96 5,18 5,05 5 NON-G
3.2.1.4.2 Tecnici protesici 5,39 5,26 5,34 5 NON-G
3.2.1.5.0 Levatrici e ostetriche 5,9 5,86 5,78 6 EXP
3.2.1.6.1 Dietisti 5,63 5,63 5,59 6 EXP
3.2.1.6.2 Tecnici della nutrizione 5,12 5,31 5,36 5 NON-G
3.2.1.7.1 Tecnici della prevenzione sanitaria 5,6 5,56 5,53 6 EXP
3.2.1.7.2 Tecnici dell'assistenza sanitaria 5,92 5,64 5,79 6 EXP
3.2.1.9.0 Tecnici della medicina popolare ed altri tecnici paramedici 5,12 4,96 5,28 5 NON-G
3.2.2.1.1 Tecnici agronomi 5,42 4,96 5,2 5 NON-G
3.2.2.1.2 Tecnici forestali 5,6 5,63 5,6 6 STR
3.2.2.2.0 Zootecnici 5,63 5,32 5,44 5 EXP
3.2.2.3.1 Tecnici di laboratorio di analisi cliniche 4,72 4,5 4,4 5 NON-G
3.2.2.3.2 Tecnici di laboratorio biochimico 6,41 5,84 6,4 6 EXP
3.2.2.3.3 Tecnici dei prodotti alimentari 5,63 5,52 5,28 5 EXP
3.2.2.3.4 Tecnici di laboratorio veterinario 5,28 4,9 5,42 5 NON-G
3.3.1.1.1 Segretari amministrativi e tecnici degli affari generali 5,38 5,2 5,37 5 NON-G
3.3.1.1.2 Assistenti di archivio e di biblioteca 5,15 4,88 5,52 5 COM
3.3.1.2.1 Contabili 5,82 5,45 5,6 6 EXP
3.3.1.2.2 Economi e tesorieri 5,84 5,98 5,48 6 STR
3.3.1.2.3 Amministratore di stabili e condomini 5,57 5,15 5,33 5 EXP
3.3.1.3.0 Tecnici addetti all'organizzazione e al controllo gestionale
della produzione. 5,68 5,26 5,2 5 EXP
3.3.1.4.1 Tecnici dell'acquisizione delle informazioni 5,28 5,1 5,41 5 NON-G
3.3.1.4.2 Intervistatori e rilevatori professionali 4,06 4,35 4,72 4 NON-G
3.3.1.5.0 Corrispondenti in lingue estere e assimilati 5,76 5,23 5,63 6 EXP
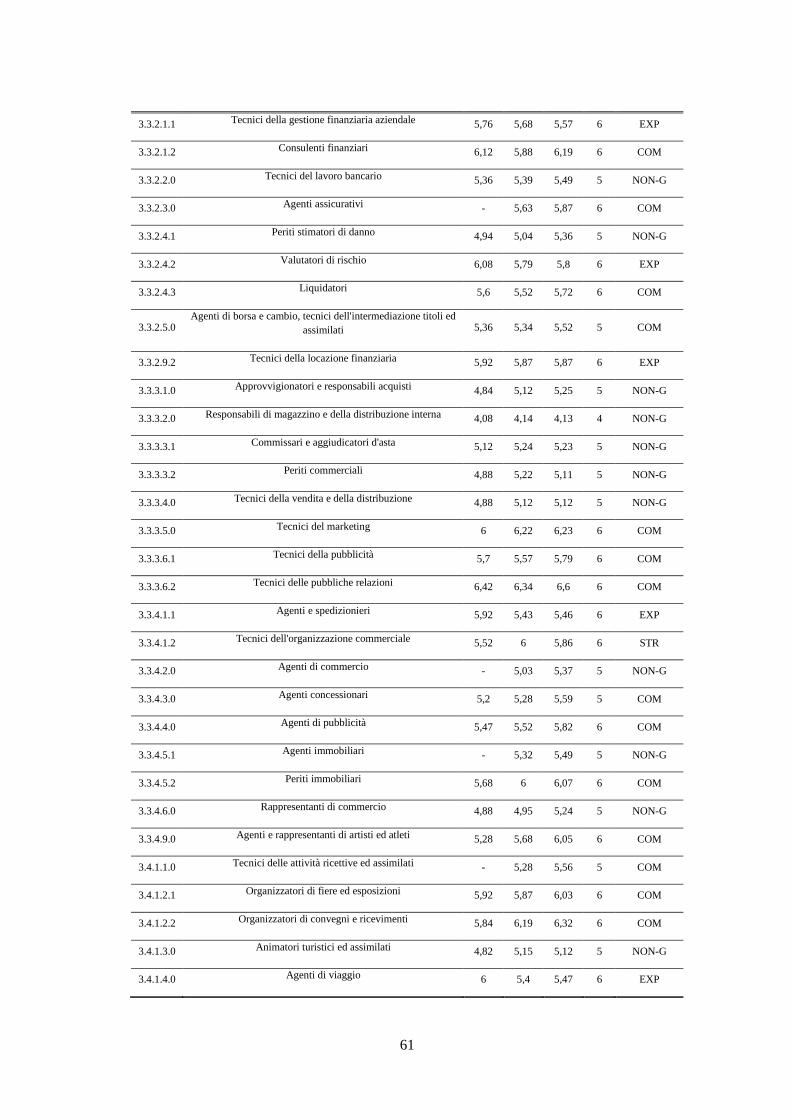
61
3.3.2.1.1 Tecnici della gestione finanziaria aziendale 5,76 5,68 5,57 6 EXP
3.3.2.1.2 Consulenti finanziari 6,12 5,88 6,19 6 COM
3.3.2.2.0 Tecnici del lavoro bancario 5,36 5,39 5,49 5 NON-G
3.3.2.3.0 Agenti assicurativi - 5,63 5,87 6 COM
3.3.2.4.1 Periti stimatori di danno 4,94 5,04 5,36 5 NON-G
3.3.2.4.2 Valutatori di rischio 6,08 5,79 5,8 6 EXP
3.3.2.4.3 Liquidatori 5,6 5,52 5,72 6 COM
3.3.2.5.0 Agenti di borsa e cambio, tecnici dell'intermediazione titoli ed
assimilati 5,36 5,34 5,52 5 COM
3.3.2.9.2 Tecnici della locazione finanziaria 5,92 5,87 5,87 6 EXP
3.3.3.1.0 Approvvigionatori e responsabili acquisti 4,84 5,12 5,25 5 NON-G
3.3.3.2.0 Responsabili di magazzino e della distribuzione interna 4,08 4,14 4,13 4 NON-G
3.3.3.3.1 Commissari e aggiudicatori d'asta 5,12 5,24 5,23 5 NON-G
3.3.3.3.2 Periti commerciali 4,88 5,22 5,11 5 NON-G
3.3.3.4.0 Tecnici della vendita e della distribuzione 4,88 5,12 5,12 5 NON-G
3.3.3.5.0 Tecnici del marketing 6 6,22 6,23 6 COM
3.3.3.6.1 Tecnici della pubblicità 5,7 5,57 5,79 6 COM
3.3.3.6.2 Tecnici delle pubbliche relazioni 6,42 6,34 6,6 6 COM
3.3.4.1.1 Agenti e spedizionieri 5,92 5,43 5,46 6 EXP
3.3.4.1.2 Tecnici dell'organizzazione commerciale 5,52 6 5,86 6 STR
3.3.4.2.0 Agenti di commercio - 5,03 5,37 5 NON-G
3.3.4.3.0 Agenti concessionari 5,2 5,28 5,59 5 COM
3.3.4.4.0 Agenti di pubblicità 5,47 5,52 5,82 6 COM
3.3.4.5.1 Agenti immobiliari - 5,32 5,49 5 NON-G
3.3.4.5.2 Periti immobiliari 5,68 6 6,07 6 COM
3.3.4.6.0 Rappresentanti di commercio 4,88 4,95 5,24 5 NON-G
3.3.4.9.0 Agenti e rappresentanti di artisti ed atleti 5,28 5,68 6,05 6 COM
3.4.1.1.0 Tecnici delle attività ricettive ed assimilati - 5,28 5,56 5 COM
3.4.1.2.1 Organizzatori di fiere ed esposizioni 5,92 5,87 6,03 6 COM
3.4.1.2.2 Organizzatori di convegni e ricevimenti 5,84 6,19 6,32 6 COM
3.4.1.3.0 Animatori turistici ed assimilati 4,82 5,15 5,12 5 NON-G
3.4.1.4.0 Agenti di viaggio 6 5,4 5,47 6 EXP

62
3.4.1.5.1 Guide ed accompagnatori sportivi 5,47 5,14 5,35 5 NON-G
3.4.1.5.2 Guide ed accompagnatori turistici 5,34 5,08 5,31 5 NON-G
3.4.2.1.0 Insegnanti elementari 5,56 5,39 5,51 5 EXP
3.4.2.2.0 Insegnanti per soggetti diversamente abili, di sostegno e altri
insegnanti di scuole speciali 5,39 5,5 5,43 5 STR
3.4.2.3.1 Insegnanti di asili nido 4,61 4,73 5,03 5 NON-G
3.4.2.3.2 Insegnanti di scuole materne 4,79 5,09 4,97 5 NON-G
3.4.2.4.1 Tutor, istitutori e insegnanti nella formazione professionale 5,36 5,15 5,31 5 NON-G
3.4.2.4.2 Insegnanti tecnico-pratici negli istituti di istruzione secondaria 5,77 5,36 5,77 6 COM
3.4.3.1.1 Istruttori di volo 5,84 5,89 6,05 6 COM
3.4.3.1.2 Istruttori di guida automobilistica 5,08 4,89 5,2 5 NON-G
3.4.3.1.3 Istruttori di nautica 5,31 5,02 5,54 5 COM
3.4.3.2.1 Istruttori di arti figurative 5,78 5,16 5,96 6 COM
3.4.3.2.2 Istruttori di danza 5,9 5,36 5,97 6 COM
3.4.3.2.3 Istruttori di canto 5,41 5,38 5,68 5 COM
3.4.3.2.4 Istruttori di strumenti musicali 6,06 5,44 5,87 6 EXP
3.4.3.2.5 Istruttori in campo linguistico 6,3 6,04 6,15 6 EXP
3.4.3.3.0 Istruttori di discipline sportive non agonistiche 5,12 4,94 5,15 5 NON-G
3.4.3.4.1 Organizzatori di eventi e di strutture sportive 5,12 5,11 5,23 5 NON-G
3.4.3.4.2 Osservatori sportivi 6,24 5,58 5,78 6 EXP
3.4.3.5.1 Allenatori e tecnici sportivi 4,92 5,05 5,32 5 NON-G
3.4.3.5.2 Arbitri e giudici di gara 4,61 5,02 4,82 5 NON-G
3.4.3.6.0 Atleti 4,44 4,45 4,69 5 NON-G
3.4.4.1.1 Annunciatori della radio e della televisione 5,3 4,94 5,51 5 COM
3.4.4.1.2 Presentatori di performance artistiche e ricreative 5,23 4,9 5,98 5 COM
3.4.4.2.1 Grafici pubblicitari 6,18 5,84 5,9 6 EXP
3.4.4.2.2 Disegnatori di moda 5,12 4,63 4,61 5 NON-G
3.4.4.2.3 Disegnatori e allestitori di scena 5,63 5,3 5,18 5 EXP
3.4.4.2.4 Disegnatori commerciali ed industriali 5,46 5,12 4,86 5 NON-G
3.4.4.2.5 Disegnatori artistici e illustratori 5,45 4,86 5,07 5 NON-G
3.4.4.3.1 Tecnici dei musei 5,15 5,04 5,26 5 NON-G
3.4.4.3.2 Tecnici delle biblioteche 5,06 4,82 5,06 5 NON-G

63
3.4.4.4.1 Stimatori di opere d'arte 6,21 6,1 6,04 6 EXP
3.4.4.4.2 Periti filatelici e numismatici 5,14 5,63 5,12 6 STR
3.4.4.4.3 Periti grafologi ed esperti in analisi e comparazione della
scrittura 5,71 6,07 6 6 STR
3.4.4.5.0 Tecnici dell'organizzazione della produzione radiotelevisiva,
cinematografica e teatrale 5,26 5,06 5,49 5 NON-G
3.4.4.6.1 Artisti di strada 4,87 4,74 5,25 5 NON-G
3.4.4.6.2 Artisti di varietà 4,88 4,99 5,43 5 NON-G
3.4.4.6.3 Acrobati e artisti circensi 5,52 4,93 5,68 5 COM
3.4.5.1.1 Assistenti sociali 5,84 6,02 6,06 6 COM
3.4.5.1.2 Operatori socio-assistenziali e animatori per l'infanzia e la
prima adolescenza 5,2 5,55 5,73 5 COM
3.4.5.2.0 Tecnici del reinserimento e dell'integrazione sociale degli
adulti 6,12 6,3 6,25 6 STR
3.4.5.3.0 Tecnici dei servizi di informazione e di orientamento scolastico
e professionale 5,2 5,3 5,4 5 NON-G
3.4.5.4.0 Tecnici dei servizi di collocamento 5,68 6 5,9 6 STR
3.4.5.5.0 Tecnici dei servizi di sicurezza privati e assimilati 4,96 5,2 5,12 5 NON-G
3.4.5.6.0 Tecnici della cura estetica 4,48 4,65 4,7 5 NON-G
3.4.6.1.0 Tecnici dei servizi giudiziari 5,14 4,55 5,09 5 NON-G
3.4.6.2.0 Ufficiali della Polizia di Stato 6 5,95 6,02 6 COM
3.4.6.3.1 Comandanti e ufficiali dei vigili urbani 5,84 5,84 5,84 6 STR
3.4.6.3.2 Comandanti e ufficiali dei vigili del fuoco 7,28 6,8 6,64 7 EXP
3.4.6.3.3 Comandanti e ufficiali del corpo forestale 5,97 5,89 5,96 6 EXP
3.4.6.4.0 Ufficiali di finanza 5,89 6,01 5,89 6 STR
3.4.6.5.0 Controllori fiscali 5,62 5,44 5,43 5 EXP
3.4.6.6.1 Tecnici dei servizi pubblici di concessioni licenze 4,92 5,03 5,25 5 NON-G
3.4.6.6.2 Tecnici dei servizi pubblici per il rilascio di certificazioni e
documentazioni personali 4,74 4,44 4,68 5 NON-G
4.1.1.1.0 Dattilografi, stenodattilografi 4,49 4,2 4,31 4 NON-G
4.1.1.2.0 Operatori su macchine di calcolo e di elaborazione dati 5,28 4,64 5,13 5 NON-G
4.1.1.3.0 Operatori su macchine per la riproduzione di documenti e
assimilati 4,4 4,64 4,48 5 NON-G
4.1.1.4.0 Personale di segreteria 4,76 4,6 4,94 5 NON-G
4.1.1.5.0 Personale addetto allo smistamento di materiali e documenti 4,1 4,08 4,47 4 NON-G

64
4.1.1.6.0 Addetti agli affari generali 4,72 4,21 4,55 4 NON-G
4.1.1.7.0 Addetti alla ricezione di materiali e documenti 4,94 4,48 4,26 5 NON-G
4.1.2.1.0 Aiuto contabili e assimilati 4,51 4,22 4,23 4 NON-G
4.1.2.2.0 Addetti alle rilevazioni di dati amministrativi 4,51 4,23 4,34 4 NON-G
4.1.2.3.0 Addetti a compiti di controllo e verifica 4,72 4,61 4,9 5 NON-G
4.1.2.4.0 Personale ausiliario nel campo della pianificazione e della
progettazione 4,88 4,97 5,03 5 NON-G
4.1.2.5.0 Addetti alla gestione del personale 4,8 4,56 4,93 5 NON-G
4.1.2.6.0 Addetti ai servizi finanziari 6,04 6 6,32 6 COM
4.1.3.1.0 Addetti alla gestione amministrativa dei magazzini 3,76 3,83 4,18 4 NON-G
4.1.3.2.0 Addetti alla gestione amministrativa degli approvvigionamenti - 5,28 5,25 5 NON-G
4.1.3.3.0 Addetti alla gestione amministrativa dei trasporti 4,77 4,77 4,72 5 NON-G
4.1.3.4.0 Addetti al controllo della documentazione di viaggio 3,8 4,18 4,3 4 NON-G
4.1.4.1.0 Addetti ad archivi e schedari 4,32 - 4,28 4 NON-G
4.1.4.2.0 Addetti a biblioteche ed assimilati 5,09 4,66 5,05 5 NON-G
4.1.4.3.0 Addetti a servizi statistici e di documentazione 5,34 5,28 5,28 5 NON-G
4.1.4.4.0 Addetti a servizi Studi e Ricerche 5,95 5,81 5,95 6 EXP
4.1.4.6.0 Addetti alla pubblicizzazione dei testi e della documentazione 5,26 5,17 5,6 5 COM
4.1.4.7.0 Addetti all'inoltro e allo smistamento di posta e
documentazione 2,96 3,16 3,85 3 NON-G
4.1.4.8.0 Addetti a telescriventi e ad altri mezzi di diffusione telematica
della documentazione 5,48 5,33 5,52 5 COM
4.2.1.1.1 Cassieri 5,56 5,87 6,21 6 COM
4.2.1.1.2 Bigliettai 3,3 3,89 3,64 4 NON-G
4.2.1.2.0 Addetti allo sportello bancario 4,68 4,86 4,84 5 NON-G
4.2.1.3.0 Addetti a sportelli assicurativi e assimilati 5,16 5,44 5,27 5 NON-G
4.2.1.4.0 Addetti allo sportello di altri intermediari finanziari 4,42 4,56 4,92 5 NON-G
4.2.1.5.0 Esattori di fatture e di crediti 5,34 5,06 5,27 5 NON-G
4.2.1.6.0 Addetti ad agenzie di pegno e assimilati 5,57 5,61 5,41 6 STR
4.2.1.7.1 Allibratori 4,4 4,73 4,52 5 NON-G
4.2.1.7.2 Croupiers 4,72 5,28 4,9 5 NON-G
4.2.1.7.3 Ricevitori 3,92 4,04 4,16 4 NON-G
4.2.2.1.0 Addetti all'accoglienza ed assimilati 4,08 4,46 4,42 4 NON-G

65
4.2.2.2.0 Addetti ad uffici stampa ed assimilati 5,57 4,8 5,4 5 EXP
4.2.2.3.1 Centralinisti 3,34 3,96 3,99 4 NON-G
4.2.2.3.2 Telefonisti e addetti ai Call Center 3,84 3,92 4,2 4 NON-G
4.2.2.4.1 Assistenti di volo 5,44 5,84 5,44 6 STR
4.2.2.4.2 Assistenti di viaggio e crociera 5,32 5,54 5,5 5 STR
4.2.2.4.3 Assistenti congressuali e fieristici 4,12 4,38 4,48 4 NON-G
5.1.1.1.0 Esercenti e gestori delle vendite all'ingrosso 4,48 4,77 4,92 5 NON-G
5.1.1.2.0 Addetti ad attività organizzative delle vendite all'ingrosso 3,83 4,4 4,34 4 NON-G
5.1.1.3.0 Addetti alle vendite all'ingrosso - 5,11 5,34 5 NON-G
5.1.2.1.0 Commessi e assimilati 3,52 4,18 4,22 4 NON-G
5.1.2.2.0 Esercenti delle vendite al minuto 4,4 4,71 4,89 5 NON-G
5.1.2.3.0 Esercenti di distributori di carburanti ed assimilati - 4,31 4,19 4 NON-G
5.1.2.4.0 Addetti ai distributori di carburanti ed assimilati 3,12 3,2 3,3 3 NON-G
5.1.2.5.1 Venditori a domicilio 4,8 4,97 5,13 5 NON-G
5.1.2.5.2 Venditori a distanza 4,72 4,77 5,01 5 NON-G
5.1.2.6.0 Cassieri di esercizi commerciali 3,31 3,41 3,79 4 NON-G
5.1.3.1.0 Indossatori, modelli e assimilati 4,24 4,49 5,25 5 NON-G
5.1.3.2.0 Dimostratori ed assimilati 3,92 4,45 5,06 4 NON-G
5.1.3.3.0 Vetrinisti ed assimilati 4,67 4,8 4,78 5 NON-G
5.1.3.4.0 Addetti all'informazione e all'assistenza dei clienti - 5,22 5,03 5 NON-G
5.2.1.1.0 Esercenti e gestori di servizi alberghieri ed assimilati 5,04 5,1 5,04 5 NON-G
5.2.1.2.0 Esercenti e gestori di servizi extralberghieri ed assimilati - 4,82 4,98 5 NON-G
5.2.1.3.0 Addetti all'accoglimento, portieri di albergo ed assimilati 4,44 4,46 4,77 5 NON-G
5.2.2.1.0 Cuochi in alberghi e ristoranti 3,84 3,84 3,79 4 NON-G
5.2.2.2.1 Cuochi di imprese per la ristorazione collettiva 4,38 4,35 4,34 4 NON-G
5.2.2.2.2 Cuochi di fast food 4,24 4,48 4,48 4 NON-G
5.2.2.2.3 Addetti e confezionatori nella ristorazione collettiva 3,01 2,75 3,15 3 NON-G
5.2.2.3.1 Camerieri di albergo 3,08 3,63 3,26 3 NON-G
5.2.2.3.2 Camerieri di ristorante 3,73 3,93 4 4 NON-G
5.2.2.3.3 Camerieri di mensa e fast food 3,44 3,89 3,85 4 NON-G
5.2.2.4.0 Baristi e assimilati 3,68 4,06 4,16 4 NON-G

66
5.2.2.5.0 Esercenti di servizi di ristorazione ed assimilati - 4,89 5,02 5 NON-G
5.3.1.1.0 Maestri d'arte nel campo dell'artigianato 5,17 4,96 5,46 5 NON-G
5.3.1.2.0 Maestri di attività per il tempo libero, la cura della persona e
assimilati 5,02 4,5 4,99 5 NON-G
5.3.1.3.1 Addestratori di animali 4,6 4,98 5,09 5 NON-G
5.3.1.3.2 Custodi e allevatori di animali domestici e da esposizione 3,36 3,69 3,69 4 NON-G
5.4.1.0.0 Professioni qualificate nei servizi sanitari 3,79 4,28 4,56 4 NON-G
5.5.1.1.1 Esercenti e gestori di cinema e teatri 4,96 5,14 5,44 5 NON-G
5.5.1.1.2 Esercenti e gestori di locali notturni - 5,17 5,48 5 NON-G
5.5.1.1.3 Esercenti e gestori di attività ricreative 5,01 4,86 5,02 5 NON-G
5.5.1.1.4 Esercenti e gestori di attività sportive - 5,07 5,1 5 NON-G
5.5.1.2.0 Guide ed accompagnatori urbani 4,8 4,37 4,67 5 NON-G
5.5.2.1.0 Tintori, lavandai e assimilati 3,8 3,82 3,71 4 NON-G
5.5.2.2.0 Esercenti di tintorie, lavanderie e assimilati 4,24 4,58 4,43 4 NON-G
5.5.3.1.1 Parrucchieri e barbieri 4,44 4,21 4,33 4 NON-G
5.5.3.1.2 Estetisti 5,2 4,79 4,87 5 NON-G
5.5.3.2.0 Personale di compagnia e personale qualificato di servizio alle
famiglie 4,16 5,05 5,17 5 NON-G
5.5.3.3.0 Addetti alla sorveglianza di bambini ed assimilati 3,66 4,03 4,2 4 NON-G
5.5.3.4.0 Addetti all'assistenza personale in istituzioni 4,16 4,75 5,09 5 NON-G
5.5.3.5.0 Addetti all'assistenza personale a domicilio 4,44 4,79 4,88 5 NON-G
5.5.3.6.0 Gestori di agenzie per il disbrigo di pratiche ed assimilati 5,12 4,9 4,85 5 NON-G
5.5.3.7.0 Addetti di agenzie per il disbrigo di pratiche ed assimilati 5,1 4,84 5,06 5 NON-G
5.5.3.8.0 Gestori di agenzie di pompe funebri - 4,53 4,45 4 NON-G
5.5.3.9.0 Addetti alle agenzie di pompe funebri 3,76 4,1 4,2 4 NON-G
5.5.4.1.0 Personale addetto alla custodia di edifici, impianti ed
attrezzature 3,32 3,55 3,43 3 NON-G
5.5.4.2.1 Vigili urbani 4,91 4,72 4,85 5 NON-G
5.5.4.2.2 Personale di guardiania territoriale 4,77 4,99 5,02 5 NON-G
5.5.4.3.1 Agenti della Polizia di Stato 5,48 5,42 5,27 5 NON-G
5.5.4.3.2 Agenti della Guardia di Finanza 5,2 5,12 5,22 5 NON-G
5.5.4.3.3 Agenti del corpo forestale 4,97 4,7 4,99 5 NON-G
5.5.4.4.1 Vigili del fuoco 6,24 6,08 5,93 6 EXP

67
5.5.4.4.2 Personale delle squadre antincendio 5,24 4,91 4,88 5 NON-G
5.5.4.5.0 Agenti di istituti di pena e rieducazione 4,46 4,67 4,72 5 NON-G
5.5.4.6.0 Guardie private di sicurezza 4,08 4,54 4,19 4 NON-G
5.5.4.7.0 Bagnini e assimilati 3,6 3,99 4,25 4 NON-G
5.5.4.8.0 Gestori di garage ed autorimesse 3,6 3,57 3,92 4 NON-G
6.1.1.1.0 Minatori 3,23 3,76 4 4 NON-G
6.1.1.2.0 Brillatori e artificieri in cave e miniere 4,29 3,92 3,92 4 NON-G
6.1.1.3.0 Tagliatori e levigatori di pietre, scalpellini e marmisti 3,53 3,51 3,63 4 NON-G
6.1.1.4.1 Coltivatori di cave 3,76 3,93 4,06 4 NON-G
6.1.1.4.2 Coltivatori di saline 4,84 4,56 4,56 5 NON-G
6.1.1.5.0 Assistenti e agenti di miniere e cave 5,31 5,04 4,93 5 NON-G
6.1.1.6.0 Armatori e binaristi di miniere e cave 4,77 4,84 4,8 5 NON-G
6.1.2.1.0 Muratori in pietra e mattoni 4,72 3,87 4 4 NON-G
6.1.2.2.1 Armatori e ferraioli 3,01 3,44 3,47 3 NON-G
6.1.2.2.2 Casseronisti/Cassonisti 4,32 3,92 3,92 4 NON-G
6.1.2.2.3 Muratori e formatori in calcestruzzo 4,8 4,03 4,43 4 NON-G
6.1.2.3.0 Carpentieri e falegnami edili 4,32 3,8 3,84 4 NON-G
6.1.2.4.0 Pontatori e ponteggiatori 5,26 5,08 5,25 5 NON-G
6.1.2.5.2 Armatori di ferrovie 3,78 3,88 3,95 4 NON-G
6.1.2.6.1 Asfaltisti 3,31 3,06 3,06 3 NON-G
6.1.2.6.2 Lastricatori e pavimentatori stradali 4,26 4,28 4,16 4 NON-G
6.1.2.9.0 Montatori di prefabbricati e di preformati 4,19 3,7 3,71 4 NON-G
6.1.3.1.0 Copritetti e impermeabilizzatori di solai 5,12 4,73 4,88 5 NON-G
6.1.3.2.1 Posatori di pavimenti 3,88 3,76 3,88 4 NON-G
6.1.3.2.2 Rifinitori di pavimenti 4,36 4,37 4,25 4 NON-G
6.1.3.2.3 Piastrellisti e rivestimentisti in pietra e materiali simili 3,74 3,75 3,9 4 NON-G
6.1.3.3.0 Intonacatori 3,84 3,5 3,63 4 NON-G
6.1.3.4.0 Installatori di impianti di isolamento e insonorizzazione 4,32 4,56 4,4 4 NON-G
6.1.3.5.0 Vetrai 3,86 3,81 3,84 4 NON-G
6.1.3.6.1 Idraulici nelle costruzioni civili 4,88 4,7 4,48 5 NON-G
6.1.3.6.2 Installatori di impianti termici nelle costruzioni civili 4,72 4,16 4,16 4 NON-G
6.1.3.7.0 Elettricisti ed installatori di impianti elettrici nelle costruzioni 4,96 4,4 4,36 5 NON-G

68
civili
6.1.3.8.0 Installatori di infissi e serramenti 3,84 4,05 4,42 4 NON-G
6.1.4.1.1 Pittori edili 3,76 4,01 3,93 4 NON-G
6.1.4.1.2 Decoratori edili e ornatisti 4,56 4,77 4,77 5 NON-G
6.1.4.1.3 Stuccatori 4,16 3,89 4,22 4 NON-G
6.1.4.2.0 Parchettisti e posatori di pavimenti e rivestimenti sintetici e in
legno 4,88 4,62 4,63 5 NON-G
6.1.4.3.0 Pulitori di facciate 4,36 4,11 4,21 4 NON-G
6.1.5.1.0 Operai addetti ai servizi di igiene e pulizia 4,2 3,84 3,61 4 NON-G
6.1.5.2.0 Operai addetti alla manutenzione degli impianti fognari 4 4,01 4,02 4 NON-G
6.2.1.1.1 Fonditori 4,26 3,82 4,08 4 NON-G
6.2.1.1.2 Formatori e animisti 3,79 3,66 3,62 4 NON-G
6.2.1.2.0 Saldatori e tagliatori a fiamma 2,99 3,33 3,57 3 NON-G
6.2.1.3.1 Lattonieri e calderai 3,68 4,03 4,21 4 NON-G
6.2.1.3.2 Tracciatori 4,88 4,48 4,49 5 NON-G
6.2.1.4.0 Carpentieri e montatori di carpenteria metallica 3,8 3,81 3,63 4 NON-G
6.2.1.5.0 Attrezzatori e montatori di cavi metallici per uso industriale e
di trasporto 4,78 4,37 4,72 5 NON-G
6.2.1.6.0 Sommozzatori e lavoratori subacquei 4,16 4,78 4,59 5 NON-G
6.2.1.7.0 Saldatori elettrici e a norme ASME 3,82 3,67 3,75 4 NON-G
6.2.1.8.1 Carrozzieri 4,64 4,38 4,35 4 NON-G
6.2.1.8.2 Stampatori e piegatori di lamiere 4,26 3,98 4,1 4 NON-G
6.2.2.1.1 Fabbri 4,08 4,2 4,12 4 NON-G
6.2.2.1.2 Fucinatori e forgiatori 4,17 3,97 4,32 4 NON-G
6.2.2.2.0 Costruttori di utensili, modellatori e tracciatori meccanici 4,37 4,58 4,68 5 NON-G
6.2.2.3.1 Attrezzisti di macchine utensili 5,1 4,54 4,64 5 NON-G
6.2.2.3.2 Aggiustatori meccanici 4,88 4,35 4,56 5 NON-G
6.2.2.4.1 Rettificatori 3,87 4,05 3,78 4 NON-G
6.2.2.4.2 Levigatori e affilatori di metalli 4,08 3,83 3,76 4 NON-G
6.2.3.1.1 Meccanici motoristi e riparatori di veicoli a motore 5,44 4,17 4,21 5 NON-G
6.2.3.1.2 Carburatoristi e pompisti 4,35 4 3,97 4 NON-G
6.2.3.1.3 Radiatoristi 4,64 4,15 4,04 4 NON-G

69
6.2.3.1.4 Gommisti 4,56 4,51 4,56 5 NON-G
6.2.3.1.5 Meccanici di biciclette e veicoli simili 4,8 4,09 4,38 5 NON-G
6.2.3.2.0 Meccanici, riparatori e manutentori di aerei 5,22 4,8 5,18 5 NON-G
6.2.3.3.1 Riparatori e manutentori di macchinari e impianti industriali 5,1 4,33 4,11 5 NON-G
6.2.3.3.2 Installatori e montatori di macchinari e impianti industriali 5,12 4,7 4,88 5 NON-G
6.2.3.4.0 Frigoristi 5 4,26 4,16 5 NON-G
6.2.3.5.1 Riparatori e manutentori di apparecchi e impianti
termoidraulici 4,05 4,36 4,13 4 NON-G
6.2.3.5.2 Installatori e montatori di apparecchi e impianti termoidraulici 4,45 4,43 4,32 4 NON-G
6.2.3.6.0 Meccanici collaudatori 5,32 4,65 5,2 5 NON-G
6.2.3.7.0 Verniciatori artigianali ed industriali 3,6 3,67 3,72 4 NON-G
6.2.4.1.1 Installatori e riparatori di impianti elettrici 5 4,9 4,84 5 NON-G
6.2.4.1.2 Riparatori di apparecchi elettrici e di elettrodomestici 4,12 3,73 3,78 4 NON-G
6.2.4.1.3 Elettromeccanici 4,16 3,8 3,84 4 NON-G
6.2.4.1.4 Installatori e riparatori di apparati di produzione e
conservazione dell'energia elettrica 5,04 4,5 4,66 5 NON-G
6.2.4.1.5 Elettrauto 4,72 4,19 4,2 4 NON-G
6.2.4.2.0 Manutentori e riparatori di apparati elettronici industriali 5,36 4,77 4,83 5 NON-G
6.2.4.3.0 Riparatori di apparecchi radio televisivi 4,84 4,43 4,56 5 NON-G
6.2.4.4.0 Installatori e riparatori di apparati telegrafici e telefonici 4,76 4,29 4,24 4 NON-G
6.2.4.5.0 Installatori, manutentori e riparatori di linee elettriche, cavisti 4,08 4,07 4,13 4 NON-G
6.2.5.1.1 Attrezzisti navali 3,84 3,87 3,76 4 NON-G
6.2.5.1.2 Meccanici e motoristi navali 5,08 3,82 3,84 4 NON-G
6.2.5.2.0 Carpentieri navali 3,52 3,63 3,79 4 NON-G
6.2.5.3.0 Frigoristi navali 3,82 3,89 3,74 4 NON-G
6.2.5.4.0 Elettomeccanici navali 4,64 4,19 4,44 4 NON-G
6.3.1.1.1 Attrezzisti e meccanici di precisione 4,83 4,62 4,6 5 NON-G
6.3.1.1.2 Strumentisti di precisione 5,04 4,94 4,92 5 NON-G
6.3.1.2.0 Meccanici e riparatori di protesi, di ortesi e di tutori ortopedici
e simili 5,12 5,27 5,2 5 NON-G
6.3.1.3.1 Accordatori di strumenti musicali 4,77 4,7 4,53 5 NON-G
6.3.1.3.2 Addetti alla costruzione e riparazione di strumenti musicali 4,67 4,72 4,4 5 NON-G
6.3.1.4.0 Addetti alla costruzione e riparazione di orologi 4,26 4,29 4,16 4 NON-G

70
6.3.1.5.1 Addetti alla produzione di lenti e occhiali 4,3 4,11 4,3 4 NON-G
6.3.1.5.2 Addetti alla produzione di apparecchi ottici 4,58 3,95 4,21 4 NON-G
6.3.1.6.1 Orafi e gioiellieri 4,62 4,18 4,03 4 NON-G
6.3.1.6.2 Addetti alla lavorazione di metalli preziosi 4,46 4,22 4,32 4 NON-G
6.3.1.6.3 Addetti alla lavorazione di pietre preziose e dure 4,81 5,03 4,6 5 NON-G
6.3.1.6.4 Addetti alla lavorazione di bigiotteria 4,56 4,31 4,62 4 NON-G
6.3.2.1.1 Vasai e terracottai 4,11 4,08 4,22 4 NON-G
6.3.2.1.2 Ceramisti 4,68 4,28 4,44 4 NON-G
6.3.2.2.1 Soffiatori e modellatori del vetro 3,92 3,64 3,49 4 NON-G
6.3.2.2.2 Tagliatori, molatori e levigatori del vetro 4,11 4,04 3,97 4 NON-G
6.3.2.3.0 Incisori ed acquafortisti su vetro 3,54 3,71 3,79 4 NON-G
6.3.2.4.0 Pittori e decoratori su vetro e ceramica 4,38 4,45 3,92 4 NON-G
6.3.3.1.1 Cartapestai 5,04 4,3 4,35 5 NON-G
6.3.3.1.2 Incisori e intarsiatori su legno 4,19 4,07 4,14 4 NON-G
6.3.3.2.1 Artigiani di prodotti tessili lavorati a mano 4,34 4,34 4,83 5 NON-G
6.3.3.2.2 Artigiani di prodotti in pelle e cuoio lavorati a mano 4,13 3,67 3,92 4 NON-G
6.3.4.1.0 Compositori tipografici 4,33 4,34 4,53 5 NON-G
6.3.4.2.0 Tipografi impressori 4,48 4,1 4,1 4 NON-G
6.3.4.3.0 Stampatori offset e alla rotativa 3,84 3,67 3,81 4 NON-G
6.3.4.4.0 Zincografi, stereotipisti ed elettrotipisti 3,68 3,66 3,72 4 NON-G
6.3.4.5.1 Acquafortisti e serigrafisti 4,76 4,4 4,38 5 NON-G
6.3.4.5.2 Litografi e incisori tipografici 4,37 4,27 4,28 4 NON-G
6.3.4.6.0 Rilegatori e rifinitori post stampa 3,73 3,61 3,65 4 NON-G
6.3.4.7.1 Fototecnici di tipografia 4,36 4,27 4,3 4 NON-G
6.3.4.7.2 Fototipografi e fotocompositori 4,31 4,11 4,01 4 NON-G
6.4.1.1.0 Agricoltori e operai agricoli specializzati di colture in pieno
campo 4,76 3,91 3,52 4 NON-G
6.4.1.2.0 Agricoltori e operai agricoli specializzati di coltivazioni
legnose agrarie 4,48 3,91 3,72 4 NON-G
6.4.1.3.1 Agricoltori e operai agricoli specializzati di vivai, di
coltivazioni di fiori e piante ornamentali 3,87 3,91 3,95 4 NON-G
6.4.1.3.2 Agricoltori e operai agricoli specializzati di coltivazioni ortive
in serra, di ortive protette o di orti stabili 4,05 3,92 3,76 4 NON-G

71
6.4.1.4.0 Agricoltori e operai agricoli specializzati di colture miste 3,79 3,63 3,64 4 NON-G
6.4.2.1.0 Allevatori e operai specializzati degli allevamenti di bovini ed
equini 4,16 4,03
4 NON-G
6.4.2.2.0 Allevatori e operai specializzati degli allevamenti di ovini e
caprini 3,68 3,44 3,52 4 NON-G
6.4.2.3.0 Allevatori e operai specializzati degli allevamenti di suini 4,34 4,12 4,16 4 NON-G
6.4.2.4.0 Allevatori e operai specializzati degli allevamenti avicoli 3,48 3,45 3,64 4 NON-G
6.4.2.5.0 Allevatore di bestiame misto 4 3,95 4,21 4 NON-G
6.4.2.9.1 Allevatori e operai specializzati degli allevamenti di insetti e di
molluschi 4,54 4,31 3,97 4 NON-G
6.4.2.9.2 Allevatori e operai specializzati degli allevamenti di altri
animali da carne e di animali da pelliccia 5 4,82 4,64 5 NON-G
6.4.3.0.0 Allevatori e agricoltori 4,72 4,01 3,6 4 NON-G
6.4.4.0.1 Tagliaboschi, abbattitori di alberi e disboscatori 3,68 3,83 3,74 4 NON-G
6.4.4.0.2 Sugherai e raccoglitori di resine 4,56 4,78 4,56 5 NON-G
6.4.4.0.3 Rimboschitori 4,16 4,13 4,26 4 NON-G
6.4.5.1.0 Acquacoltori 4,51 4,65 4,62 5 NON-G
6.4.5.2.0 Pescatori della pesca costiera e in acque interne 3,28 3,42 3,26 3 NON-G
6.4.5.3.0 Pescatori d'alto mare 4,22 3,92 3,96 4 NON-G
6.4.5.4.0 Cacciatori 3,87 3,77 3,73 4 NON-G
6.5.1.1.1 Macellai e abbattitori di animali 4,16 3,5 3,39 4 NON-G
6.5.1.1.2 Norcini 4,64 4,03 4,16 4 NON-G
6.5.1.1.3 Pesciaioli 4,44 4,19 4,22 4 NON-G
6.5.1.1.4 Addetti alla conservazione di carni e pesci 4,48 3,98 3,82 4 NON-G
6.5.1.2.1 Panettieri 3,96 3,85 3,71 4 NON-G
6.5.1.2.2 Pastai 4,35 4,12 4,35 4 NON-G
6.5.1.3.1 Pasticcieri e cioccolatai 4,72 4,58 4,56 5 NON-G
6.5.1.3.2 Gelatai 4,74 4,45 4,16 4 NON-G
6.5.1.3.3 Conservieri 5,09 4,63 4,92 5 NON-G
6.5.1.4.0 Degustatori e classificatori di prodotti alimentari e bevande 5,17 5,12 4,68 5 NON-G
6.5.1.5.0 Artigiani ed operai specializzati delle lavorazioni artigianali
casearie 4,37 4,19 4,19 4 NON-G
6.5.1.6.0 Operai specializzati della preparazione e della lavorazione
delle foglie di tabacco 3,94 3,89 3,84 4 NON-G
6.5.2.1.1 Stagionatori, ed operai specializzati del primo trattamento del 3,81 3,52 3,52 4 NON-G

72
legno
6.5.2.1.2 Curvatori, sagomatori ed operai specializzati della prima
lavorazione del legno 3,47 2,72 2,8 3 NON-G
6.5.2.2.1 Attrezzisti di falegnameria 3,48 3,56 3,28 3 NON-G
6.5.2.2.2 Falegnami 4,11 3,99 4,16 4 NON-G
6.5.2.2.3 Ebanisti 3,89 3,92 3,81 4 NON-G
6.5.2.3.1 Impagliatori e lavoranti in vimini e setole 3,25 3,31 3,42 3 NON-G
6.5.2.3.2 Cordai e intrecciatori di fibre 4,72 4,38 4,24 4 NON-G
6.5.2.3.3 Lavoranti in giunco e canna 4,43 3,85 3,92 4 NON-G
6.5.2.3.4 Lavoranti in sughero e spugna 3,8 3,42 3,5 4 NON-G
6.5.3.1.0 Preparatori di fibre 3,84 3,44 3,2 3 NON-G
6.5.3.2.1 Tessitori 4,4 4 3,87 4 NON-G
6.5.3.2.2 Maglieristi 3,5 3,65 3,73 4 NON-G
6.5.3.2.3 Tintori e addetti al trattamento chimico dei tessuti 4,98 4,47 4,45 5 NON-G
6.5.3.3.1 Modellisti di capi di abbigliamento 4,64 4,33 4,27 4 NON-G
6.5.3.3.2 Tagliatori e confezionatori di capi di abbigliamento 3,96 4 3,97 4 NON-G
6.5.3.3.3 Sarti 4,24 3,9 4,02 4 NON-G
6.5.3.3.4 Cappellai confezionatori di complementi di abbigliamento 3,98 3,88 4,08 4 NON-G
6.5.3.4.1 Modellisti di pellicceria e di capi in pelle 4,62 4,34 4,35 4 NON-G
6.5.3.4.2 Tagliatori e confezionatori di pellicceria e di capi in pelle 4,48 4,26 4,36 4 NON-G
6.5.3.4.3 Pellicciai e sarti in pelle 4,26 3,97 4 4 NON-G
6.5.3.5.1 Confezionatori e rifinitori di biancheria intima 4,02 4,23 4,36 4 NON-G
6.5.3.5.2 Confezionatori e rifinitori di biancheria per la casa 3,98 4 4,19 4 NON-G
6.5.3.5.3 Merlettai e ricamatrici a mano 4,27 3,79 4,07 4 NON-G
6.5.3.5.4 Bottonai 4,91 4,6 4,84 5 NON-G
6.5.3.6.1 Confezionatori di tende e drappeggi 3,76 3,55 3,79 4 NON-G
6.5.3.6.2 Modellisti di poltrone e divani 4,29 4,23 4,2 4 NON-G
6.5.3.6.3 Tagliatori di imbottiture e rivestimenti e confezionatori di
poltrone e divani 3,66 3,71 3,57 4 NON-G
6.5.3.6.4 Tappezzieri di poltrone, divani e simili 4,03 4,04 4,1 4 NON-G
6.5.3.6.5 Materassai 4,2 4,13 3,84 4 NON-G
6.5.4.1.0 Conciatori di pelli e di pellicce 3,72 3,48 3,76 4 NON-G

73
6.5.4.2.1 Modellisti di calzature 4,61 4,1 4,04 4 NON-G
6.5.4.2.2 Tagliatori e confezionatori di calzature 3,81 3,53 3,97 4 NON-G
6.5.4.2.3 Calzolai 3,52 3,51 3,5 4 NON-G
6.5.4.2.4 Sellai e cuoiai 3,92 3,85 3,98 4 NON-G
6.5.4.3.1 Modellisti di pelletteria 4,5 4,11 4 4 NON-G
6.5.4.3.2 Tagliatori e confezionatori di pelletteria 3,68 3,69 3,57 4 NON-G
6.5.4.3.3 Pellettieri 4,02 3,87 3,8 4 NON-G
6.6.1.0.0 Macchinisti ed attrezzisti di scena 3,4 3,72 3,93 4 NON-G
7.1.1.1.0 Conduttori di impianti di miniere e di cave 3,34 3,33 3,58 3 NON-G
7.1.1.2.0 Conduttori di impianti per il trattamento di minerali e di pietre 3,68 3,89 3,79 4 NON-G
7.1.1.3.1 Trivellatori di pozzi 4,84 4,7 4,7 5 NON-G
7.1.1.3.2 Conduttori di sonde e perforatrici da prospezione 4,13 4,07 4,18 4 NON-G
7.1.2.1.1 Conduttori di altoforno 4,56 4,42 4,7 5 NON-G
7.1.2.1.2 Conduttori di colata 4,2 4,47 4,32 4 NON-G
7.1.2.2.1 Conduttori di forni di seconda fusione 3,92 3,64 3,73 4 NON-G
7.1.2.2.2 Conduttori di laminatoi 4,34 4,33 4,41 4 NON-G
7.1.2.3.0 Conduttori di impianti per il trattamento termico dei metalli 3,63 3,7 3,76 4 NON-G
7.1.2.4.1 Conduttori di macchine per la trafila di metalli 3,71 3,49 3,86 4 NON-G
7.1.2.4.2 Conduttori di macchine per l'estrusione e la profilatura di
metalli 4,42 4,39 4,54 4 NON-G
7.1.2.5.1 Conduttori di impianti termici per la produzione di metalli non
ferrosi 4,03 3,7 3,76 4 NON-G
7.1.3.1.1 Conduttori di forni per la produzione del vetro 4,16 4,37 4,16 4 NON-G
7.1.3.1.2 Conduttori di impianti per la lavorazione del vetro 4,16 4,18 4,1 4 NON-G
7.1.3.2.1 Conduttori di impianti per la formatura di articoli in ceramica e
terracotta 3,84 3,71 3,76 4 NON-G
7.1.3.2.2 Conduttori di forni per la produzione di articoli in ceramica e
terracotta 4,27 3,85 3,95 4 NON-G
7.1.3.3.1 Conduttori di impianti per la formatura di laterizi 3,95 3,68 3,76 4 NON-G
7.1.3.3.2 Conduttori di forni per la produzione di laterizi 3,86 3,65 3,58 4 NON-G
7.1.3.9.0
Conduttori di impianti per dosare, miscelare ed impastare
materiali per la produzione del vetro, della ceramica e dei
laterizi 4,36 3,9 3,8 4 NON-G
7.1.4.1.0 Conduttori di impianti per la fabbricazione in serie di pannelli
in legno 3,5 3,44 3,48 4 NON-G

74
7.1.4.2.0 Conduttori di impianti per la preparazione della pasta di legno
e di altri materiali per cartiera 4,9 4,64 4,96 5 NON-G
7.1.4.3.0 Conduttori di impianti per la fabbricazione della carta 4,53 4,43 4,4 4 NON-G
7.1.5.1.0 Conduttori di frantumatrici, mulini e impastatrici 4,19 3,91 3,97 4 NON-G
7.1.5.2.0 Conduttori di forni e di impianti per il trattamento termico dei
minerali 4,8 4,43 4,44 5 NON-G
7.1.5.3.0 Conduttori di apparecchi di filtraggio e di separazione 4,84 4,98 4,99 5 NON-G
7.1.5.4.0 Conduttori di distillatori e di reattori chimici 5,16 5,09 5,33 5 NON-G
7.1.5.5.1 Conduttori di impianti per la raffinazione dei prodotti
petroliferi 4,8 4,91 5,11 5 NON-G
7.1.5.5.2 Conduttori di impianti per la stazzatura di prodotti petroliferi 4,24 4,13 4,19 4 NON-G
7.1.5.6.0 Strumentisti e quadristi di impianti chimici 4,02 3,78 3,92 4 NON-G
7.1.5.9.0 Conduttori di impianti per la produzione di prodotti chimici 4,64 3,84 4,01 4 NON-G
7.1.6.1.1 Quadristi di impianti per la produzione di energia elettrica 4,35 4,68 4,26 4 NON-G
7.1.6.1.2 Conduttori di impianti per la produzione di energia elettrica 4,48 4,42 4,48 4 NON-G
7.1.6.2.0 Conduttori di caldaie a vapore e di motori termici in impianti
industriali 3,84 3,89 3,92 4 NON-G
7.1.6.4.1 Conduttori di impianti per la depurazione, la potabilizzazione e
la distribuzione delle acque 4,16 3,63 3,6 4 NON-G
7.1.6.4.2 Conduttori di impianti di incenerimento dei rifiuti 3,8 4,11 3,86 4 NON-G
7.1.6.4.3 Conduttori di impianti di recupero e riciclaggio dei rifiuti 5,3 5,38 - 5 NON-G
7.1.7.1.0 Conduttori di catene di montaggio automatizzate 3,92 3,84 3,88 4 NON-G
7.1.7.2.0 Conduttori di robot industriali ed assimilati 3,74 3,95 4,05 4 NON-G
7.2.1.1.0 Conduttori di macchine utensili automatiche e
semiautomatiche industriali 3,71 3,49 3,6 4 NON-G
7.2.1.2.0 Conduttori di macchinari per la produzione di manufatti in
cemento ed affini 3,88 3,2 3,54 4 NON-G
7.2.1.3.0 Conduttori di macchinari per la produzione di abrasivi e
manufatti abrasivi minerali 4,11 3,87 3,77 4 NON-G
7.2.2.1.1 Conduttori di macchinari per la produzione di farmaci 4,22 3,82 3,77 4 NON-G
7.2.2.1.2 Conduttori di macchinari per la produzione di cosmetici 4,02 3,48 3,5 4 NON-G
7.2.2.1.3 Conduttori di macchinari per la produzione di detergenti 4,91 4,56 4,7 5 NON-G
7.2.2.2.0 Conduttori di macchinari per la fabbricazione di esplosivi e
munizioni 5,04 4,64 4,65 5 NON-G
7.2.2.3.0 Finitori di metalli e conduttori di impianti per finire, rivestire,
placcare metalli e oggetti in metallo 4,44 4,01 4 4 NON-G

75
7.2.2.9.0 Conduttori di macchinari per la fabbricazione di altri prodotti
derivati dalla chimica 3,96 3,43 3,55 4 NON-G
7.2.3.1.0 Conduttori di macchinari per la confezione e vulcanizzazione
dei pneumatici 4,48 3,75 3,94 4 NON-G
7.2.3.2.0 Conduttori di macchinari per la fabbricazione di altri articoli in
gomma 4 3,75 4,1 4 NON-G
7.2.3.3.0 Conduttori di macchinari per la fabbricazione di articoli in
plastica e affini 4,2 3,84 3,8 4 NON-G
7.2.4.0.0 Addetti a macchinari per la produzione in serie di mobili e di
articoli in legno 4,28 4,02 4,08 4 NON-G
7.2.5.1.0 Conduttori di macchinari per tipografia e stampa su carta e
cartone 4,67 4,28 4,24 4 NON-G
7.2.5.2.0 Conduttori di macchinari per la fabbricazione di prodotti in
carta e cartone 3,79 3,48 3,81 4 NON-G
7.2.5.3.0 Conduttori di macchinari per rilegatura di libri ed affini 4,14 3,97 3,96 4 NON-G
7.2.6.1.0 Addetti a macchinari per la filatura e la bobinatura 2,98 2,69 2,72 3 NON-G
7.2.6.2.0 Addetti a telai meccanici e a macchinari per la tessitura e la
maglieria 3,66 3,24 3,6 4 NON-G
7.2.6.3.0 Operai addetti a macchinari industriali per confezioni di
abbigliamento in stoffa e affini 3,6 3,37 3,42 4 NON-G
7.2.6.4.0 Addetti a macchinari per il trattamento e la tintura di filati e
tessuti 3,64 3,24 3,63 4 NON-G
7.2.6.5.0 Addetti a macchinari per la stampa dei tessuti 3,96 3,7 3,52 4 NON-G
7.2.6.9.1 Addetti a macchinari per la confezione in serie di
passamanerie, feltrerie e prodotti simili 3,76 3,47 3,65 4 NON-G
7.2.6.9.2 Addetti a macchinari industriali per la preparazione di pelli e
pellicce 4,61 4,42 4,35 4 NON-G
7.2.6.9.3 Addetti a macchinari per la produzione in serie di calzature 4,42 4,3 4,06 4 NON-G
7.2.6.9.4 Addetti a macchinari per la produzione in serie di articoli in
pelle 3,68 3,27 3,74 4 NON-G
7.2.7.1.0 Assemblatori in serie di parti di macchine 3,5 3,2 3,21 3 NON-G
7.2.7.2.0 Assemblatori e cablatori di apparecchiature elettriche 3,36 3,28 3,67 3 NON-G
7.2.7.3.0 Assemblatori e cablatori di apparecchiature elettroniche e di
telecomunicazioni 3,66 3,37 2,88 3 NON-G
7.2.7.4.0 Assemblatori in serie di articoli in metallo, in gomma e in
materie plastiche 3,38 3,73 3,49 4 NON-G
7.2.7.5.0 Assemblatori in serie di articoli in legno e in materiali affini 4,08 3,29 3,57 4 NON-G
7.2.7.6.0 Assemblatori in serie di articoli in cartone, in tessuto e materie
similari 3,76 3,98 4,11 4 NON-G

76
7.2.7.9.0 Assemblatori in serie di articoli industriali compositi 4,05 3,88 4,09 4 NON-G
7.2.8.0.0 Addetti a macchine confezionatrici e al confezionamento di
prodotti industriali 3,33 3,04 3,3 3 NON-G
7.3.1.1.1 Addetti agli impianti fissi in agricoltura 4,93 5,12 4,7 5 NON-G
7.3.1.1.2 Addetti agli impianti fissi nell'allevamento 3,4 3,54 3,56 4 NON-G
7.3.1.2.0 Addetti agli impianti per la trasformazione delle olive 4,32 4,1 4,04 4 NON-G
7.3.1.3.0 Addetti alla refrigerazione, trattamento igienico e prima
trasformazione del latte 4,28 4,1 4,4 4 NON-G
7.3.2.1.0 Conduttori di macchinari per la conservazione e la lavorazione
della carne e del pesce 4,36 3,86 4,22 4 NON-G
7.3.2.2.0 Conduttori di apparecchi per la lavorazione industriale di
prodotti lattiero-caseari 3,6 3,31 3,7 4 NON-G
7.3.2.3.1 Conduttori di macchinari industriali per la lavorazione dei
cereali 4,4 3,93 3,86 4 NON-G
7.3.2.3.2 Conduttori di macchinari industriali per la lavorazione delle
spezie 4,16 3,58 3,38 4 NON-G
7.3.2.3.3 Conduttori di macchinari industriali per la lavorazione di
prodotti a base di cereali 4,35 4,14 4,08 4 NON-G
7.3.2.4.1 Conduttori di macchinari per cernita e la calibratura di prodotti
ortofrutticoli 3,84 3,77 3,74 4 NON-G
7.3.2.4.2 Conduttori di macchinari per la conservazione di frutta e
verdura 3,6 3,59 3,58 4 NON-G
7.3.2.4.3 Conduttori di macchinari per la conservazione di legumi e riso 3,8 3,45 3,73 4 NON-G
7.3.2.4.4 Conduttori di macchinari per la produzione di oli di semi 4,24 4,18 4,32 4 NON-G
7.3.2.5.0 Conduttori di macchinari per la produzione e la raffinazione
dello zucchero 6,52 5,57 5,28 6 NON-G
7.3.2.6.1 Conduttori di macchinari per la preparazione e la produzione
del the, del caffè e del cacao 4,77 4,34 4,43 5 NON-G
7.3.2.6.2 Conduttori di macchinari per la preparazione e la produzione
della cioccolata 4,66 4,67 4,7 5 NON-G
7.3.2.7.0 Conduttori di macchinari per la lavorazione dei prodotti del
tabacco 4,38 4,39 4,29 4 NON-G
7.3.2.8.1 Addetti a macchinari industriali per la vinificazione 4 4,04 3,98 4 NON-G
7.3.2.8.2 Addetti a macchinari industriali per la produzione di birra 4,4 4,06 4,12 4 NON-G
7.3.2.8.3 Addetti a macchinari industriali per la produzione di liquori, di
distillati e di bevande alcoliche 3,95 4,08 4,02 4 NON-G
7.3.2.8.4 Addetti a macchinari industriali per la produzione di bevande
analcoliche e gassate 4,36 3,97 3,97 4 NON-G
7.3.2.9.0 Conduttori di macchinari per la produzione di pasticceria e 4,44 3,98 3,84 4 NON-G
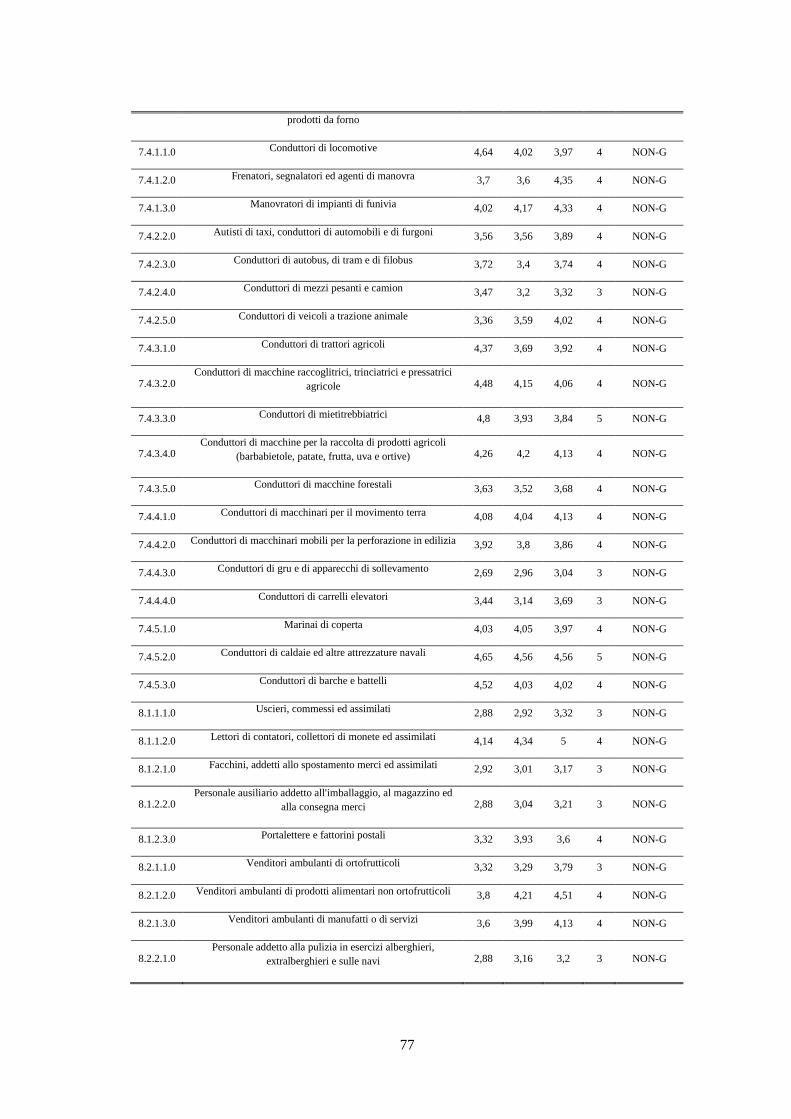
77
prodotti da forno
7.4.1.1.0 Conduttori di locomotive 4,64 4,02 3,97 4 NON-G
7.4.1.2.0 Frenatori, segnalatori ed agenti di manovra 3,7 3,6 4,35 4 NON-G
7.4.1.3.0 Manovratori di impianti di funivia 4,02 4,17 4,33 4 NON-G
7.4.2.2.0 Autisti di taxi, conduttori di automobili e di furgoni 3,56 3,56 3,89 4 NON-G
7.4.2.3.0 Conduttori di autobus, di tram e di filobus 3,72 3,4 3,74 4 NON-G
7.4.2.4.0 Conduttori di mezzi pesanti e camion 3,47 3,2 3,32 3 NON-G
7.4.2.5.0 Conduttori di veicoli a trazione animale 3,36 3,59 4,02 4 NON-G
7.4.3.1.0 Conduttori di trattori agricoli 4,37 3,69 3,92 4 NON-G
7.4.3.2.0 Conduttori di macchine raccoglitrici, trinciatrici e pressatrici
agricole 4,48 4,15 4,06 4 NON-G
7.4.3.3.0 Conduttori di mietitrebbiatrici 4,8 3,93 3,84 5 NON-G
7.4.3.4.0 Conduttori di macchine per la raccolta di prodotti agricoli
(barbabietole, patate, frutta, uva e ortive) 4,26 4,2 4,13 4 NON-G
7.4.3.5.0 Conduttori di macchine forestali 3,63 3,52 3,68 4 NON-G
7.4.4.1.0 Conduttori di macchinari per il movimento terra 4,08 4,04 4,13 4 NON-G
7.4.4.2.0 Conduttori di macchinari mobili per la perforazione in edilizia 3,92 3,8 3,86 4 NON-G
7.4.4.3.0 Conduttori di gru e di apparecchi di sollevamento 2,69 2,96 3,04 3 NON-G
7.4.4.4.0 Conduttori di carrelli elevatori 3,44 3,14 3,69 3 NON-G
7.4.5.1.0 Marinai di coperta 4,03 4,05 3,97 4 NON-G
7.4.5.2.0 Conduttori di caldaie ed altre attrezzature navali 4,65 4,56 4,56 5 NON-G
7.4.5.3.0 Conduttori di barche e battelli 4,52 4,03 4,02 4 NON-G
8.1.1.1.0 Uscieri, commessi ed assimilati 2,88 2,92 3,32 3 NON-G
8.1.1.2.0 Lettori di contatori, collettori di monete ed assimilati 4,14 4,34 5 4 NON-G
8.1.2.1.0 Facchini, addetti allo spostamento merci ed assimilati 2,92 3,01 3,17 3 NON-G
8.1.2.2.0 Personale ausiliario addetto all'imballaggio, al magazzino ed
alla consegna merci 2,88 3,04 3,21 3 NON-G
8.1.2.3.0 Portalettere e fattorini postali 3,32 3,93 3,6 4 NON-G
8.2.1.1.0 Venditori ambulanti di ortofrutticoli 3,32 3,29 3,79 3 NON-G
8.2.1.2.0 Venditori ambulanti di prodotti alimentari non ortofrutticoli 3,8 4,21 4,51 4 NON-G
8.2.1.3.0 Venditori ambulanti di manufatti o di servizi 3,6 3,99 4,13 4 NON-G
8.2.2.1.0 Personale addetto alla pulizia in esercizi alberghieri,
extralberghieri e sulle navi 2,88 3,16 3,2 3 NON-G

78
8.2.2.2.0 Personale non qualificato addetto alla ristorazione 2,36 2,32 2,76 2 NON-G
8.3.1.0.0 Bidelli ed assimilati 3,16 3,49 3,8 3 NON-G
8.3.2.0.0 Portantini ed assimilati 3,76 4,08 4,17 4 NON-G
8.4.1.0.0 Personale non qualificato nei servizi ricreativi e culturali - 4,59 4,62 5 NON-G
8.4.2.1.0 Collaboratori domestici ed assimilati 2,96 2,63 2,47 3 NON-G
8.4.2.2.0 Addetti non qualificati a servizi di pulizia in imprese ed enti
pubblici ed assimilati 2,64 2,84 3,16 3 NON-G
8.4.2.3.0 Spazzini e altri raccoglitori di rifiuti ed assimilati 2,96 2,52 2,64 3 NON-G
8.4.3.1.0 Garzoni di barbiere, di parrucchiere, manicure ed assimilati 3,68 3,76 3,93 4 NON-G
8.4.3.2.0 Lustrascarpe ed altri mestieri di strada - 3,51 3,81 4 NON-G
8.4.4.0.0 Personale non qualificato addetto alla custodia di edifici, di
impianti e di attrezzature 3,12 3,48 3,03 3 NON-G
8.5.1.0.0 Braccianti agricoli 4,8 2,66 3,15 5 NON-G
8.5.2.1.0 Personale forestale non qualificato 2,72 2,67 2,82 3 NON-G
8.5.2.2.0 Personale non qualificato addetto alla cura degli animali 2,96 3,35 2,86 3 NON-G
8.5.2.3.0 Personale non qualificato addetto alla pesca ed alla caccia 3,36 3,03 3,14 3 NON-G
8.6.1.0.0 Manovali ed altro personale non qualificato delle miniere e
delle cave 3,76 3,7 3,56 4 NON-G
8.6.2.1.0 Manovali e personale non qualificato dell'edilizia civile ed
assimilati 3,6 3,15 3,57 3 NON-G
8.6.2.2.0 Manovali e personale non qualificato della costruzione e
manutenzione di strade, dighe e altre opere pubbliche 3,07 2,67 3,16 3 NON-G
8.6.3.0.0 Personale non qualificato delle attività industriali ed assimilati 2,66 2,59 3 3 NON-G

79
APPENDIX 4
Estimates shown in subparagraph §2.3 are obtained as OLS estimates of the linear
regression model specificated as follows:
Where is a vector of controls, all of which are described in Table A.4
Table A.4 Variables description
Variable name Description
lnW Natural logarithm of gross monthly earnings (Dependent Variable)
SOC_EXP Dummy variable for being employed in Experts occupational group; D=1 if
employed, D=0 otherwise
SOC_STR Dummy variable for being employed in Orchestrators occupational group;
D=1 if employed, D=0 otherwise
SOC_COM Dummy variable for being employed in Communicators occupational
group; D=1 if employed, D=0 otherwise
AGE Age at the time of the interview
TENURE Job tenure defined as time spent in the current job, measured in years
PART_TIME Dummy variable for being part-time workersg: D=1 if employed in part-
time jobs, D=0 otherwise
GENDER Dummy variable for gender: D=1 if male, D=0 otherwise
DISTRETTO_NW Working area: D=1 if North-West district, D=0 otherwise
DISTRETTO_NE Working area: D=1 if North-East district, D=0 otherwise
DISTRETTO_C Working area: D=1 if Central district, D=0 otherwise
DISTRETTO_S Working area: D=1 if South district, D=0 otherwise
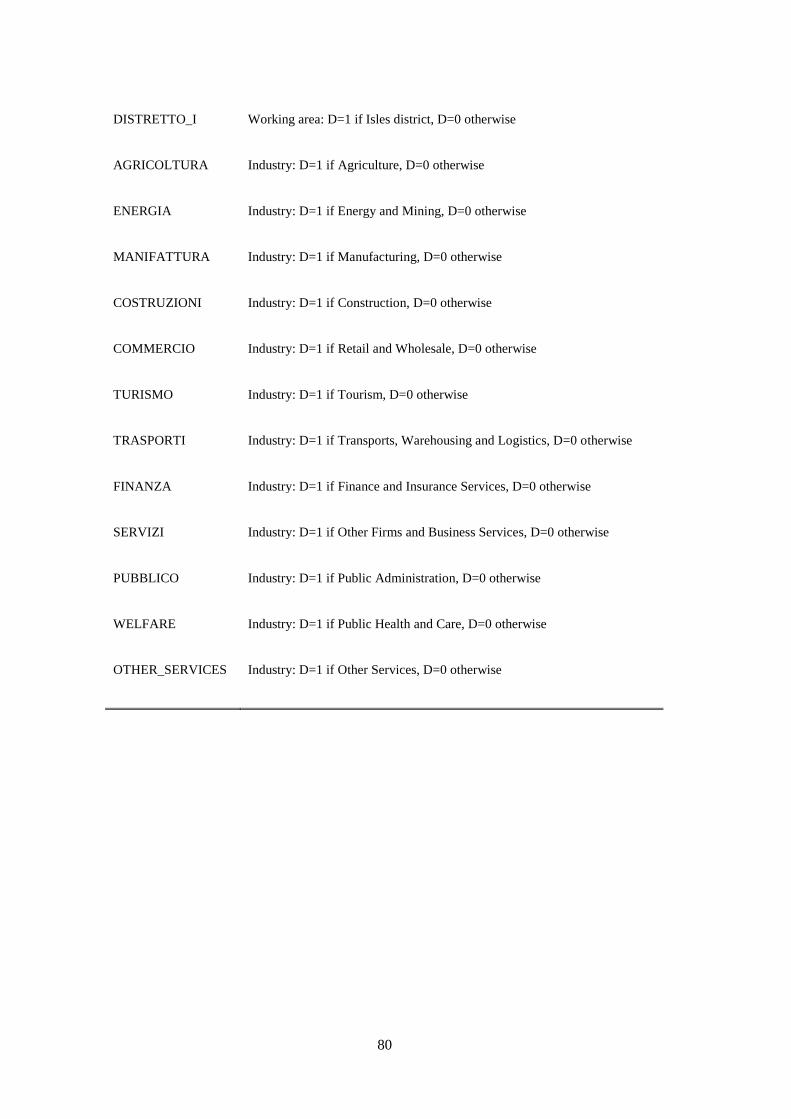
80
DISTRETTO_I Working area: D=1 if Isles district, D=0 otherwise
AGRICOLTURA Industry: D=1 if Agriculture, D=0 otherwise
ENERGIA Industry: D=1 if Energy and Mining, D=0 otherwise
MANIFATTURA Industry: D=1 if Manufacturing, D=0 otherwise
COSTRUZIONI Industry: D=1 if Construction, D=0 otherwise
COMMERCIO Industry: D=1 if Retail and Wholesale, D=0 otherwise
TURISMO Industry: D=1 if Tourism, D=0 otherwise
TRASPORTI Industry: D=1 if Transports, Warehousing and Logistics, D=0 otherwise
FINANZA Industry: D=1 if Finance and Insurance Services, D=0 otherwise
SERVIZI Industry: D=1 if Other Firms and Business Services, D=0 otherwise
PUBBLICO Industry: D=1 if Public Administration, D=0 otherwise
WELFARE Industry: D=1 if Public Health and Care, D=0 otherwise
OTHER_SERVICES Industry: D=1 if Other Services, D=0 otherwise

81
Table A.5 Linear regression model with OLS estimates of the impacts on earnings of SOC(HE)-Italy groups
(1) (2)
lnW lnW
SOC_EXP 0.2884*** 0.2082***
(0.0056) (0.0044)
SOC_STR 0.3475*** 0.2858***
(0.0218) (0.0167)
SOC_COM 0.4010*** 0.2535***
(0.0072) (0.0058)
AGE 0.0032***
(0.0002)
TENURE 0.0065***
(0.0002)
PART_TIME -0.4949***
(0.0047)
GENDER 0.1446***
(0.0037)
DISTRETTO_NW 0.0509***
(0.0048)
DISTRETTO_NE 0.0648***
(0.0050)
DISTRETTO_S -0.0705***
(0.0052)
DISTRETTO_I -0.0784***
(0.0063)
AGRICOLTURA -0.0789***
(0.0111)
ENERGIA 0.2688***
(0.0166)
MANIFATTURA 0.1579***
(0.0071)
COSTRUZIONI 0.1319***
(0.0087)
COMMERCIO 0.1554***
(0.0077)
TURISMO 0.0779***
(0.0093)
TRASPORTI 0.2281***
(0.0090)

82
FINANZA 0.3520***
(0.0106)
SERVIZI 0.1258***
(0.0083)
PUBBLICO 0.2616***
(0.0082)
WELFARE 0.2442***
(0.0072)
_cons 6.9510*** 6.5876***
(0.0024) (0.0099)
N 42720 42720
R2 0.108 0.479
adj. R2 0.1082 0.4786
Standard errors in parentheses; * p < 0.10, ** p < 0.05, *** p < 0.01

83
Assessing the incidence and wage effects of overeducation among
Italian graduates using a new measure for educational requirements
Luca Cattani*, Giovanni Guidetti
+, Giulio Pedrini
§
*Department of Economics, University of Bologna
+Department of Economics, University of Bologna
§Interuniversity Research Centre for Public Services (CRISP), University of Milan-Bicocca
Abstract. This essay investigates three dimensions of overeducation: incidence, impact on earnings and
possible determinants. The analysis focuses on Italian graduates and refers to the cohort that graduated in
2007 using data from the AlmaLaurea survey on graduates' career paths. A new measure of
overeducation is introduced and it is jointly examined along with other pre-existing measures based on
workers' self-assessment. The analysis is carried out by comparing the different results obtained adopting
the two different measures of overeducation. Results show that the newly introduced measure can deal
with the biases affecting workers' self- assessment measures.
JEL classification: I2, J31
Key words: overeducation, graduate labour market, wage differentials
Acknowledgments. This essay has been written relying on elaborations on AlmaLaurea data: we are grateful to
Andrea Cammelli, Angelo Di Francia and Silvia Ghiselli for their support and their useful comments and
suggestions. We have also utilised data from the Istat survey on Italian professions: elaborations on these data
have been run under our responsibility. Usual disclaimers apply.

84
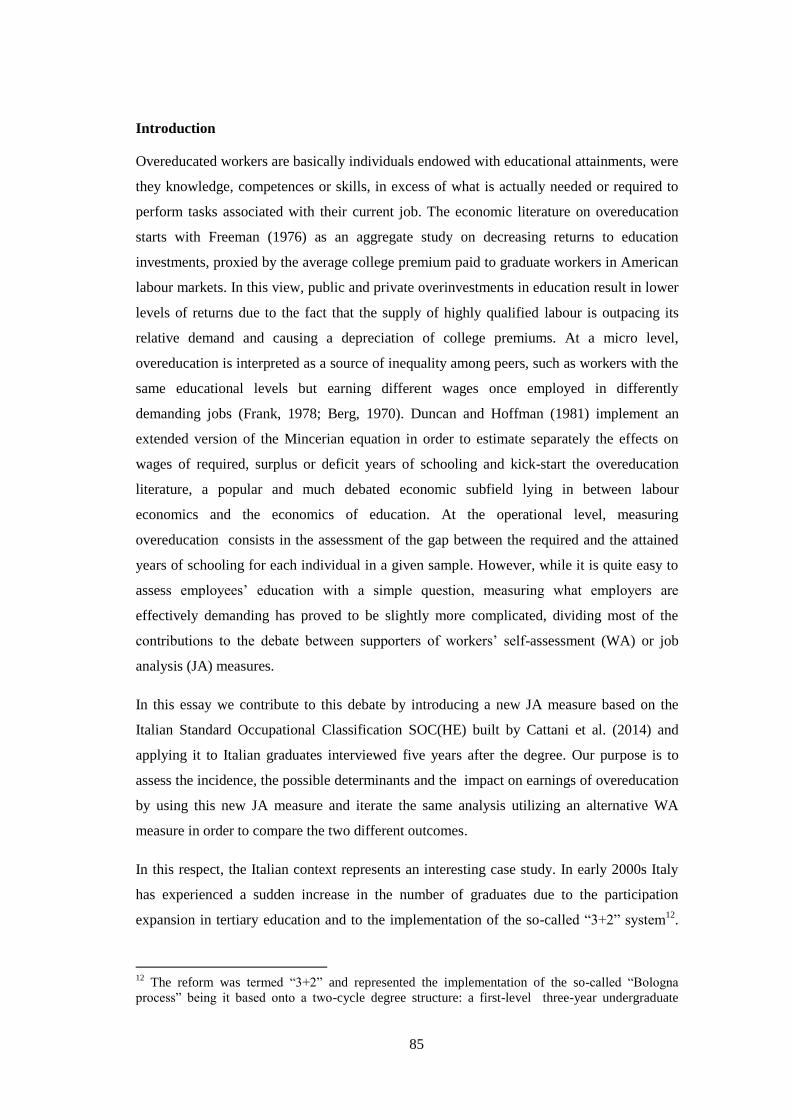
85
Introduction
Overeducated workers are basically individuals endowed with educational attainments, were
they knowledge, competences or skills, in excess of what is actually needed or required to
perform tasks associated with their current job. The economic literature on overeducation
starts with Freeman (1976) as an aggregate study on decreasing returns to education
investments, proxied by the average college premium paid to graduate workers in American
labour markets. In this view, public and private overinvestments in education result in lower
levels of returns due to the fact that the supply of highly qualified labour is outpacing its
relative demand and causing a depreciation of college premiums. At a micro level,
overeducation is interpreted as a source of inequality among peers, such as workers with the
same educational levels but earning different wages once employed in differently
demanding jobs (Frank, 1978; Berg, 1970). Duncan and Hoffman (1981) implement an
extended version of the Mincerian equation in order to estimate separately the effects on
wages of required, surplus or deficit years of schooling and kick-start the overeducation
literature, a popular and much debated economic subfield lying in between labour
economics and the economics of education. At the operational level, measuring
overeducation consists in the assessment of the gap between the required and the attained
years of schooling for each individual in a given sample. However, while it is quite easy to
assess employees’ education with a simple question, measuring what employers are
effectively demanding has proved to be slightly more complicated, dividing most of the
contributions to the debate between supporters of workers’ self-assessment (WA) or job
analysis (JA) measures.
In this essay we contribute to this debate by introducing a new JA measure based on the
Italian Standard Occupational Classification SOC(HE) built by Cattani et al. (2014) and
applying it to Italian graduates interviewed five years after the degree. Our purpose is to
assess the incidence, the possible determinants and the impact on earnings of overeducation
by using this new JA measure and iterate the same analysis utilizing an alternative WA
measure in order to compare the two different outcomes.
In this respect, the Italian context represents an interesting case study. In early 2000s Italy
has experienced a sudden increase in the number of graduates due to the participation
expansion in tertiary education and to the implementation of the so-called “3+2” system12
.
12
The reform was termed “3+2” and represented the implementation of the so-called “Bologna
process” being it based onto a two-cycle degree structure: a first-level three-year undergraduate

86
This expansion combined with the dramatic recession that hit the country in the 2008-2012
period, has raised growing concerns for a proper employability of the Italian graduates and
for the wage penalty associated with overeducation.
The structure of the essay is as follows. Paragraph 1 introduces some theoretical issues
together with the most relevant measurement issues, paragraph 2 presents the new
measurement of overeducation adopted in the essay, paragraphs 3 and 4 describe the
estimation methodology along with the dataset, paragraphs 5 and 6 present and discuss
estimates concerning determinants of overeducation and its impact on wages. Paragraph 7
concludes.
1 Theoretical framework(s) – Labour market theories
There are no generally accepted theories of overeducation, its determinants and its effects on
wages although a good number of applied studies has tried to relate it to the main labour
market theories. The most adopted model in such studies was first proposed by Duncan and
Hoffman in 1981 as an extension of the Mincerian equation, relating wage differentials to
attained years of schooling now decomposed in required, excess and deficit ones. Although
this peculiar model was developed starting from a typical human capital framework, it can
be placed in a theoretical middle ground between human capital theory and institutional
theories as it allows to test their different hypothesis. Before discussing measurement issues,
it could be salutary to remember such hypothesis.
a. Human capital theory
Becker (1964) suggests that wages are only determined by and equal to workers’ marginal
productivity in turn influenced by their human capital level, however accumulated. In fact,
there is no distinction between formal education and on-the-job training and firms will
adequately adapt production processes in order to fully utilize the supply of qualified labour.
This assumption has a perfect formalization in Mincer’s (1974) equation where the
logarithm of wages ( ) equals attained years of schooling plus working experience.
course plus a second-level two-years master’s degree. Few programs maintained their five/six-year
single-cycle structure.

87
Where is the number of attained years of school and is a vector of controls including
years of working experience and experience squared. By disaggregating attained schooling
into required ( ), surplus (
) and deficit ( ) years it is assumed that not all of them will
result in the same wage differentials, which is in contradiction with the postulated identity
between human capital, marginal productivity and wages.
Broadly speaking, if there is no correspondence between workers’ marginal productivity and
wages, productivity levels will be attached to job characteristics rather than to individual
ones, making overeducation inconsistent with the human capital perspective. Imposing in
the Duncan and Hoffman specification equal returns to all schooling years it can be tested
whether human capital theory fits data or not:
However, there is a number of objections to the postulated inconsistence of overeducation
with the human capital view that it is worth reporting. First, if overeducation is only a
transitory phenomenon, it can be still consistent with HC theory: in the short run firms can
face some problems in adapting their production processes to take full advantage of their
human capital. Frictions and constraints can lead to transitory disequilibria affecting the
supply side as well: as we discuss more in depth in subparagraph 1.1, the search theory and
the career mobility theory support the idea that skilled workers may accept unskilled jobs if
these last let them free to engage in job search (Gautier, 2002; Hornstein et al., 2006;
Dolado et al., 2009) or promise them higher promotion probabilities (Sicherman and Galor,
1990). Unfortunately, all of these theories are at odds with the observed persistency of
overeducation for many individuals (Sicherman, 1991). Secondly, workers could lack of
working experience and thus being properly matched once they acquire it. This is consistent
with Becker’s assertion on the substitutability between formal and informal human capital:

88
workers with less experience have less (informal) human capital as they haven’t had the
chance to accumulate it with on-the-job training. Thus, they are not actually overeducated
and are paid exactly their marginal productivity (Sicherman, 1991; Kiker et al, 1997).
However, little evidence supports the idea that formal education and informal training are
treated as substitutes by employers (Duncan and Hoffman, 1981; Groot, 1993) and,
moreover, overeducated workers still suffer significant wage penalties after having
controlled for training and experience (Ramirez, 1993; Dolton and Vignoles, 2000;
McGuinness, 2003; McGuinness, 2006). Finally, human capital measures can fail to capture
all individual abilities, namely workers’ skills heterogeneity. Thus, overeducation can be
interpreted, according to heterogeneous skills theory, as a lack of controls in Mincerian
equation resulting in, at best, omitted variable biases where the omitted variable is
unobservable ability (Chevalier, 2003).
b. Job competition model
Institutional theories suggest that wage levels are only related to job characteristics, while
hiring processes are carried out in a lack of information that forces firms to require formal
qualifications to minimize expected training costs (Thurow, 1975; 1979). In the human
capital perspective investments in education affect wages through marginal productivity
while labour oversupply always leads to lower wages because unemployed individuals
compete among themselves lowering their requests. In the job competition model workers
compete in the hiring process to obtain a particular job. Labour oversupply leads workers to
queue up on the basis of their expected trainability and not to lower their wages. In this
model, labour demand and labour supply are not independent one each other and the supply
of skilled labour depends on its relative demand. In fact, workers cannot affect their wages
and will invest in education to minimize training costs for the possible employers: this is
possibly the best framework to explain overinvestments in education and thus
overeducation. Frictions on both sides of the labour market can lead to mismatches while
individuals are engaged in increasing educational attainments in their attempt to avoid
unemployment. Similar assumptions are shared by the signalling theory (Spence, 1973),
where education still plays a major role in shaping jobs allocation among workers. Given
that only required education affects wage levels, it is relatively straightforward to test in the
Duncan and Hoffman extended equation whether excess and deficit years of schooling are
not significantly different from zero:
89
( )
c. Assignment theory
Placed in a theoretical middle ground between human capital and job competition models,
the assignment theory proposed by Sattinger (1993) states that both demand and supply
factors affect wage levels. On the one hand, qualifications and education levels drive
allocating processes like in the job competition model. On the other hand, workers will not
be randomly assigned to jobs as investments in education are driven by income
maximization. In fact, wages are determined by job characteristics and those workers who
are willing to obtain better (and better paid) jobs will increasingly accumulate skills,
knowledge and qualifications to win the competition. Individual characteristics will also
play a role in job allocation and thus in earnings distribution. Hence, wages are not entirely
determined by job requirements and a straightforward way to test assignment theory is to
impose the restriction proposed by McGuinnes (2006): .
Several works on the topic adopt a different model specification, first proposed by Verdugo
and Verdugo (1989), which employs dummy variables to capture the effects on earnings of
over and under education. This is the specification we use in this essay and there are three
notes we should unavoidably mention before continuing to other theoretical issues. First, as
we will argue more in depth in paragraph 3, coefficients associated with these dummy
variables do not estimate the impact on earnings of an additional year of education but the
fact itself that a worker is over or under educated. Second, dummy variables are especially
useful when analysing samples or populations composed by graduates only, where
individuals can be only matched or overeducated. This is exactly how our sample is defined
and our study should therefore be benchmarked against similar graduates’ labour markets
analyses, particularly popular in Europe and UK (Dolton and Vignoles, 2000; Allen and
Van der Velden, 2001; Green, McIntosh and Vignoles, 2002; Green and McIntosh, 2007;
Dolton and Silles, 2008; Green and Zhu, 2010 and many others). Third, if regressors cannot
be interpreted as returns to schooling years but just as differences among different
employment realizations, it is impossible to test which labour market theory fits best our
data. With respect to this last issue, there is to be said that tests presented in this section are
taken by McGuinness (2006) and Hartog (2000) and are not necessarily to be taken for
granted. In fact, once assessed that the three coefficients are different it is impossible to
reject in a neat way the human capital theory because of the three mentioned objections to

90
the inconsistence of overeducation with this theory. Furthermore, Thurow’s job competition
model is not necessarily unfit to explain results with returns to excess and deficit years
different from zero as in this model wages are not deterministically determined solely by
demand side factors and their relationship with educational attainments, which are supply
side factors by definition, is indirect. Notably, these restrictions intended to test the human
capital theory and the job competition model have always been rejected by data (Hartog,
2000; Leuven and Oosterbeek, 2011). Finally, the proposed test for the assignment theory
could be questioned and labelled as residual with respect to the former two.
1.1 Theoretical framework – Determinants
Estimating returns to education with separate information on required, exceeding and deficit
years of schooling is only useful when Freeman’s view is adopted: overeducation is due to
an oversupply of qualified labour at an aggregate level that calls in turn for policies intended
to stimulate its demand or limit its formation. However, no sufficient empirical evidences
have been brought in support to Freeman’s interpretation: were wages only determined by
market forces, we should then expect a relative depreciation of skilled professions against
non-skilled ones. However, recent analyses report substantial relative gains for graduate
workers (Machin, 1999; Dearden et al., 2002). It is not clear, moreover, to what extent
overeducation is related to macro dimensions, such as business cycles (Rubb, 2003), and
surveys of the UK business community on job vacancies and skills deficiencies report, even
at times of cyclical upswing, recruitment difficulties (see Campbell et al., 2001). It is hard to
assess these relationship without discussing and testing potential determinants of
overeducation. Furthermore, assuming that overeducation is a matter of private investments
that affects only a given proportion of workers because of their individual characteristics,
brings us to the same conclusions. In fact, no information concerning returns to required,
surplus or deficit years will be capable to affect individual investments in education and
training without a clear and reliable tool to predict who will be matched, overeducated and
undereducated. Strategies to achieve this goal include measuring the incidence of
overeducation for different categories of workers, estimating distribution function models to
assess different probabilities to be overschooled as driven by individual characteristics and
assessing differential wage-effects for such characteristics.

91
a. Differential overeducation
Women tend to show a higher probability to be overeducated in almost all studies on the
topic. Frank (1978) measures its incidence controlling by gender and theorizes that married
women can be heavily constrained in their quest for an appropriate job by the location of
their families in case this is based on their men’s career needs. Sloane et al. (1999) explain
similar findings otherwise, suggesting that part-time workers are more likely to be
overeducated and women with young children are more likely to accept part-time jobs. All
in all, gender is considered to be heavily affected by supply side rigidities such as time and
mobility constraints in skilled labour markets, including a lower propensity to commuting
for married women and families with children (McGoldrick and Robst, 1996; Green et al.,
2002; Buchel and Van Ham, 2003; Buchel and Battu, 2003). Ethnicity can play a similar
role in increasing such rigidities as immigrants can be limited in commuting or less
proficient in the host country language and thus experience difficulties in finding jobs that
are appropriate to their educational titles, once these have been recognized or achieved in
place (Green et al., 2007; Battu et al., 2004). Additional sources of differential
overeducation can be identified in workers’ social background and the contractual basis. In
fact, education can have a consumption value for richer families whose children may be
driven to attend more years of schooling than those suggested by their potential role of
human capital investments (Leuven and Oosterbeek, 2011). On the contrary, richer families
and graduates with graduated parents can benefit of a larger number of opportunities and
acquaintances when looking for a proper job. The contractual basis can affect individuals’
capability to learn on the job and gain field experience and, for subjective measures (WA)
heavily affect workers’ perception when asked to state whether they are matched or
overeducated.
b. Age and work experience
Skilled labour mismatches can be just a temporary phenomenon and tend to disappear as
young graduates’ careers evolve gaining field experience. At least two theories are based on
this assumption, the search theory and the career mobility theory. According to the former,
highly qualified workers can accept jobs for which they are overeducated but highly
productive or rewarded and allowed to engage in on-the-job search to obtain a better job,
resulting in progressively better matches (Gautier, 2002; Hornstein et al., 2006; Dolado et
al., 2009). According to the latter one, developed by Sicherman and Galor (1990), graduates

92
may accept jobs with lower educational requirements associated with lower wages but with
higher probabilities to be promoted. Many works support the idea that overeducation is only
transitory and due to a lack of experience (Dolton and Vignoles, 1997; Sloane et al., 1999;
Kiker et al., 2000) but applied studies show difficulties in testing such hypothesis.
Moreover, a huge amount of structural overeducated workers that never switch their
statuses, reported by the same authors that supported this view clearly tackles its
explanatory potential (Sicherman, 1991; Dolton and Vignoles, 1997; Sloane et al., 1999;
Dolton and Vignoles, 2000; Rubb, 2003). In conclusion, negative relationships between age
and the probability to be overeducated has been assessed for all countries and periods and
this fact is one of the few constants in this economic subfield. Nonetheless, we lack of a
clear explanation for this, while evidence supports the idea that skills and abilities, more
than age, can explain these differentials (Battu et al., 1999; Bauer, 2002). Some graduate
workers who are overeducated and don’t shift to better jobs can, in the end, be less skilled
or, alternatively, those who are able to get better jobs could have developed further skills on
the job thus explaining a new and secondary role played by age.
c. Skills
Chevalier (2003) builds up a measure to capture the structural overeducated share of
workers and tries to explain it. He distinguishes between apparent and genuine overeducated
applying the idea that workers with the same education level not necessarily share the same
level of skills. He thus defines overeducation as apparent where graduates employed in non-
graduate jobs don’t state to be dissatisfied with their jobs, proving to share a lower skill
level and being adequately matched for such jobs. Genuine overeducation, on the contrary,
occurs where overeducated workers perceive it, reporting a certain degree of dissatisfaction
thus signalling they have higher skill levels compared to those required by their particular
job post. Basically, in Chevalier’s view, the distinction between genuine and apparent
overeducation is marked by job satisfaction. A similar approach is used by Allen and Van
der Velden (2001) who conceptualize overskilling as the excess skill levels workers are
endowed with, not necessarily correlated to overeducation. They aren’t interested in the
overall job satisfaction and ask workers only about skills utilizations. They have the same
purpose as Chevalier: explaining structural overeducation with an heterogeneity in human
capital dimensions not referred to formal education such as innate ability. The
heterogeneous skills theory states that individuals with equal education titles don’t match

93
equally demanding jobs if they’re actually offering different skill levels: less skilled
graduates, for instance, are matched in non-graduate jobs and their overeducation is just
apparent (Chevalier, 2003) or formal (Green and Zhu, 2010) if, respectively, it doesn’t
imply effects on job satisfaction or wage penalties. Skills and abilities are considered by the
majority of contributions in this field as determinants of overeducation and possibly of wage
penalties, although assessing this last causal relationship has proved to be problematic as we
discuss in paragraph 3. All the attempts to measure or capture skills and ability levels we
have presented so far are proxies based on workers self-assessment (WA). Di Pietro and
Urwin (2009) applies this strategy to the Italian case, but there are pros and cons one should
take into account before relying on such information. On the one hand, in small surveys on
workers or graduates it is rather simple to ask them directly whether skills acquired via
higher education are being utilized on the job or not. On the other hand, when elaborating
already available data on the entire labour force this question may not be included in the
questionnaire. Moreover, regardless data availability WA is subjective and can bring
significant biases in the measurement if workers tend to over/under state systematically their
job requirements. In fact, there is a number of studies based on objective measures for skills
and ability. Green et al. (2002) test relationships between the possibility to be overeducated
and, respectively, math marks achieved during the high school and data from the
International Adult Literacy Survey (IALS). Similar evidence is also found with data from
the UK Skills Survey (Green and McIntosh, 2007). Hartog et al. (1996) report a negative
relation between quantitative literacy and underschooling and a weak but positive relation
between this last one and IQs (Hartog and Jonker, 1996). Ability has been also proxied by
high school final marks (Buchel and Pollmann-Schult, 2001) while a certain degree of
diversity in the probability to be overeducated can be explained by the type of skills
imparted via education, such as the disciplinary field (Dolton and Vignoles, 2000).
1.2 The different approaches to the measurement of overeducation
Individual characteristics, anyhow measured, represent the supply side of the human capital
matching in the labour markets. Measuring workers’ titles and skills is thus just half of the
work one should accomplish in order to assess overeducation incidence and wage effects.
Education and skill levels demanded by employers are, in fact, the benchmark to which we
have to refer individual endowments of human capital in order to understand who is
matched, who has deficit and who has excess schooling. We discuss in this paragraph the
three main methods adopted in the economic literature to proxy for job requirements.

94
a. Worker self-assessment (WA)
The first and most utilized strategy to measure job requirements is to directly ask workers
what is required or needed to obtain or carry out the job. Duncan and Hoffman (1981) along
with others (Hartog and Tsang, 1987; Sicherman, 1991) refer to the formal education
required to obtain the job, while Ramirez (1993) refers to the informal education needed to
perform the job. These are quite different things to analyse, being the former referred to
hiring standards and the latter to the cognitive content encompassed in the assigned tasks.
Nonetheless, WA is not available for most labour force surveys and it is subjective, given
that it only reflects the worker’s point of view. This fact can bring to biases as workers tend
to overstate their job requirements to inflate their job position during the interview or, in
newly hired workers, reflect qualification inflation in firms’ hiring strategies (Hartog, 2000).
In our view, a subjective measure of job requirements can be affected also by workers’ job
satisfaction including economic rewards for their educational titles. Individuals can perceive
their job as inadequate to their educational level, in fact, basing their evaluation on poor
college wage premiums even if the cognitive content of the assigned tasks is in line with
their studies.
b. Job-analysis (JA)
This measurement is obtained by looking at information provided in the occupational
classifications and thus building a correspondence table that assigns an educational level to
each job title. Many works adopt this strategy (Eckaus, 1964; Thurow and Lucas, 1972;
Hartog, 1980; Rumberger, 1987; Kiker and Santos, 1991; Oosterbeek and Webbink, 1996)
referring to the General Educational Development (GED) taxonomy or the Dictionary of
Occupation Titles (DOT). Unfortunately, this measurement hasn’t gain much popularity as
classifications are rarely updated because updates are costly (Mason, 1996; Hartog, 2000)
and there is no consensus when converting occupational scales into schooling years
(Halaby, 1994).
c. Realized matches.
One may also look at market realizations such as the mean educational attainment in a given
occupation or as hiring standards used by firms’ personnel departments (Verdugo and
Verdugo, 1989; Groot and Maassen van der Brink, 1997; Groenveld and Hartog, 2004).

95
Unfortunately, these matches are the result of demand and supply forces and don’t reflect
only job requirements (Leuven and Oosterbeek, 2011).
2 The new measurement of overeducation adopted in the essay
In this study we try to address the job requirements measurement error problem highlighted
in the above mentioned literature (Hartog, 2000; Leuven and Oosterbeek, 2011) by adopting
a mixed method of measurement. In fact, we infer employers’ job requirements from Italian
occupational classification (CP 2006) after having attached to each job title its European
Qualification Framework (EQF)13
corresponding level as identified by Cattani et al. (2014).
In his application to Italian labour force of the Warwick IER’s SOC(HE) classification, the
allocation of job titles to major groups (Experts, Orchestrators, Communicators and Non-
graduate-jobs) is based on data from the Istat survey on Italian professions (2009) in which
16,000 workers are asked to assign a score (1-100) to 109 variables referred to the O*Net14
taxonomy for knowledge, skills and competences. These variables are grouped into the three
categories of SOC(HE): experts, orchestrators and communicators. Following Istat-Isfol
methodology, Cattani et al. (2014) assigns a difficulty score to each group of variables for
each job title15
. This score is then translated into an equivalent 1-8 scale EQF score. The
13
The European Qualification Framework (EQF) is a common transnational translation device for all
European qualifications. Qualifications are here defined as educational titles issued at the completion
of an educational or training process. The aim of the EQF (issued by the European Commission in
2008) is to make different national qualifications more readable across the continent and “promoting
workers' and learners' mobility between countries and facilitating their lifelong learning”
(Recommendation 111/2008). It relates all European national qualifications to 8 major levels,
referring to knowledge, skills and competences acquired in their relative education/training process.
In our study, this is of crucial importance given the univocal translation from Italian qualifications
into EQF levels letting room for a univocal translation of EQF levels into schooling years. 14
O*Net (Occupational Information Network) is an American data collection and spreading system
focused on employment, jobs, skills shortages, professional profiles and individual characteristics. It
is based on the SOC classification and it has been structured to describe tasks and professional
profiles demanded and supplied enacting work processes. O*Net embodies the advantages of SOC
classification and its implementation took large account of the indications emerged from the SCAN
works, such as the distinction within the three types (basic, thinking and personal) of soft skills. It is
divided into six dimensions: Experience Requirements, Occupation Requirements, Occupation
Specific Information, Occupation Characteristics, Worker Characteristics and Worker Requirements.
This particular structure allows the in-depth description of different job profiles and it is fit, thanks to
transcode tools, to networking by exploiting linkages with other classification systems. 15
The difficulty index varies in each group of variables between 1 and 100 and is calculated as the
average score of variables selected case by case for each job title. The selection of variables in each
group however is not subjective and it is based on the standard deviation rule: for each job title
Cattani et al. (2014) selected those variables exceeding the mean of all variables in the grouping
(experts, strategists or communicators) incremented by the value of the standard deviation.
Knowledge, skills and competences selected in this way are the ones needed to carry out the most
characterizing tasks of the profession.

96
highest score of the three groups is then adopted as the job title’s EQF level. This is
particularly useful as the translation from occupational classifications into schooling years
still lacks an adequate level of consensus among economists and EQF provides us with a
correspondence table which is, at least, accepted by all European governments and their
statistical offices.
< Insert Table 1 here>
Following this methodology, economists are, for instance, assigned to Experts major group
while their EQF level is 7, equivalent to the Italian master degree (18 schooling years).
< Insert Table 2 here>
This job requirement measure shares with JA measures the advantage of avoiding biases
driven by WA. In fact, the employers’ point of view is represented by educational
requirements stated by workers without including the job satisfaction dimension and their
subjective job position assessment. Interviews in the Istat survey are carried out referring
explicitly only to skills, knowledge and competences utilization on the job place without
mentioning job positions. Moreover, workers are sampled and selected on the basis of the
position they hold in the firm and there is no room for them to overstate it. Finally, workers
interviewed in Istat survey are not the same ones we observe in our model. Our study on
overeducation is based on AlmaLaurea data on Italian graduates as described in paragraph 3
and their individual point of view is completely neglected when considering job
requirements.
The described methodology allows Istat-Isfol16
to attach to each job title an objective degree
of skills utilizations on which we build our measure that captures what is actually needed to
carry out a specific profession in terms of cognitive contents embodied in its constituent
tasks. SOC(HE)-Italy measure for overeducation comes to be a sort of JA measure
expressed in schooling years which are in turn determined by EQF framework and therefore
granted of a certain degree of consensus. However, JA measures are, as noted above,
affected also by imprecision as they are costly to revise and thus rarely updated. Our
measure can be, in other words, objective and precise to some extent but limited in time as
professions evolve changing their typical tasks and their relative cognitive contents. Basing
16
The Italian Institute for the Development of Vocational Training (Isfol) implemented the
methodology with which Istat assigned to each job title a corresponding EQF level, working on data
from the above mentioned survey. This is why in this work we refer to this methodology as Istat,
Isfol or Istat/Isfol methodology.

97
our measure on data from the Istat survey on Italian professions partially addresses this
problem as this survey is periodically held by Istat and thus data availability should not
represent a major problem with respect to Italy. We do recognize however that such data can
be unavailable for many European and western countries and in that case our SOC(HE)17
measure for overeducation could be limited when trying to extend its application to other
national contexts.
3 The estimation methodology
The basic specification of our model consists in a Duncan and Hoffmann extended wage
equation as modified by Verdugo and Verdugo (1989), while alternative specifications will
be obtained by adding controls for observable abilities and family or social background.
Where is the dummy variable for overeducation and is the vector of controls
including experience, experience squared, gender, working area, field of study and industry
and others, fully described in paragraph 3.3. The three specifications differ in additional
controls that are included step by step. In the first specification we include experience,
gender, working area, tenure, field of study. In the second specification we add (see Tables
11 and 12) abilities related variables. In the third and last specification, social and family
background proxies are included. The model is run onto AlmaLaurea data, referring to a
sample of Italian graduates so that individuals can only be overeducated or matched.
Overeducation here is a dummy variable defined by SOC(HE)-Italy, where D=1 if the
individual is overeducated (employed in job titles with EQF Level below or equal to 6), D=0
otherwise.
It is important to stress that when adopting this specification we compare overeducated
workers and individuals with the same level of education but employed in adequate jobs.
Thus, the sign of regressor is often negative, suggesting that overeducated workers earn
less than their adequately matched ex schoolmates. This is not exactly what Verdugo and
17
For a complete description of the original SOC(HE) classification see Elias and Purcell (2004;
2011) and Purcell et al. (2012).
98
Verdugo (1989) suggest. They erroneously interpret this negative sign as a negative return
to overschooling in opposition to higher and positive returns to required schooling and in
contradiction with previous empirical evidences of positive although lower returns to excess
schooling. This is actually a misinterpretation as the utilization of dummy variables relates
the selected individuals in comparison with their direct counterparts: in this case, matched
people. Returns to overschooling may well be positive even in case their regressor has a
negative sign: this just means, as noted above, that these returns are lower compared to
those earned by matched workers (Cohn and Kahn, 1995; Leuven and Oosterbeek, 2011).
Although highly criticized18
, this specification has gained some popularity due to its
capacity to describe differences among graduates’ entering the labour market. Allen and
Van der Velden (2001) find for the Netherlands that overeducated graduates earn some 5-
10% less than their matched former schoolmates while, in the UK, a large literature based
on this estimation strategy highlights wage penalties as large as 16% associated with
overeducation statuses (Dolton and Silles, 2008) with significant differences between males
and females who suffer respectively penalties equal to 10% and 27% (Green, McIntosh and
Vignoles, 2002). Similar evidence is found by a number of studies for the UK and Northen
Ireland (Sloane et al. 1999; Sloane, 2003; McGuinness, 2006; Green and McIntosh, 2007;
Green and Zhu, 2010 among the others). Although estimating returns to schooling seems not
to be affected by the utilized overeducation measurement, overeducation incidence varies a
lot: objective measures (JA) are significantly lower than subjective (WA) ones (Groot and
Maassen van der Brink, 2000; McGuinness, 2006; Cedefop, 2010). The total share of the
labour force that is affected by overeducation increased in the last two decades with little
differences between genders, from 21.7% to 33.2% for men and from 23.8% to 32.1% for
women (Green and Zhu, 2010). Significant differences can also be found when comparing
different European countries, reaching a minimum of 14-15% in the Netherlands (Allen and
van del Velden, 2001; Groot and Maassen van der Brink, 2000) and a maximum of 30-40%
in the UK (Green and Zhu, 2010; Dolton and Vignoles, 2000).
However, evidence for Italy is contradictory: Ferrante et al. (2010) find that wages are
affected by overskilling only and there is no relationship with overeducation. Di Pietro and
Urwin (2006) estimate a 5.5% wage penalty for those 25.5% of Italian graduates that state to
be overeducated.
18
Hartog asserted in the year 2000 its deletion would have benefited to researches in this field.

99
3.1 The analysis of the determinants of overeducation
As outlined in the previous paragraphs, the new measure of overeducation is dichotomous
and, therefore, its determinants can be estimated through a straightforward Probit model.
Applying standard treatment of the Probit model, we have that Overeducation =1 (YES)
when a latent variable Y is strictly positive, Y>0, and that Overeducation =0 (NO) when Y
is nil, Y=0.
The latent variable is linked through a linear function to a set of statistical variables so that:
Where is a normally and independently distributed error term (NID)
Consequently, we have:
P(Overeducation=1=YES)= P(Y>0)= ( ) (
) ( )
where F is the distribution function for , which in the case of the Probit model is a
standard normal distribution function.
3.2 The analysis of the effects of overeducation on wages
In order to investigate the effects of both measures of overeducation on the level of wages,
one cannot simply run a standard OLS to estimate a multivariate regression model in which
the level of wage depends on a dummy variable indicating overeducation and a set of
covariate as control variables. As the level of wage cannot be observed for, voluntarily or
involuntarily, unemployed graduates, a straightforward OLS estimate would contain a
sample selection bias, which would bias the estimation of the parameters. To overcome this
problem, one has to model, in a first step, the decision to work. Therefore, following
Heckman (1979), one has to estimate a system of two equations:

100
Of course, W can be observed only if the individual works. The decision to work is moulded
by a Probit model, which is the second equation of the system:
The wage can be observed if and only if and cannot be observed if . The
model is completed, assuming that the error terms ( ) are normally distributed with
variance and
, respectively, and covariance .
3.3 Dataset and variables.
The empirical analysis presented in this essay is based on data from the AlmaLaurea dataset
on Italian graduates. AlmaLaurea is a consortium of Italian Universities aimed at fostering
highly qualified labour demand and supply matching for graduates, universities and the
business world. AlmaLaurea collects every year extensive data on the graduates of each
cohort and on their early working career path. This complex information is gathered in two
stages. At the time of graduation students fill in a questionnaire providing their personal
data and information concerning their social and family background, educational path and
performances, intrinsic motivation and other subjective features. Then, graduates are
interviewed after one, three and five years after graduation on their career paths and/or their
post-graduate studies.
In our analysis we refer to the last cohort of graduates whose information is fully available
for both steps of the survey. This cohort includes individuals graduated in either a two-year
Master’s degree or a five/six-year university degree (such as Medicine and Law faculties)
during 2007, who completed their two-step survey in 2012. The relevant population is
composed by 184.669 graduates in 46 Italian universities, representing 61.5% of the Italian

101
graduates in that year19
. The subsample of graduates who answered the questionnaire after
five years from graduation is composed by 31,162 individuals. Since we are only interested
employed graduates, we exclude all those reporting to be either unemployed or inactive.
Accordingly, we end up with a final sample of 25,523 graduates reporting to be employed at
the time of the interview. Due to missing data our descriptive statistics on JA overeducation
are limited to 18,269 individuals.
Our main variables of interest are represented by the wage levels and by two dummies that
capture overeducation in both WA and JA terms. Wages are measured in terms of net
monthly earning. Our measures of overeducation are based onto two items of the
AlmaLaurea questionnaire. The JA measure is built on the occupational code, provided at a
5 digit level. Individuals are considered matched if their job is included in one of the three
‘graduate-jobs’ categories of the newly introduced SOC(HE)-Italy classification,
overeducated otherwise. The WA measure is based on a specific question for job
requirements as reported by respondents. However, 5-digit occupational codes are only
available in the 5-year after graduation interview. Consequently, our empirical analysis is
cross-sectional and referred to the 5-year after graduation survey, held in 2012.
Additional variables in the analysis include standard covariates of the human capital model:
personal characteristics, educational path and achievements (field of study, graduation mark,
and delay in completing the degree) and employment history (experience, tenure).
Individual heterogeneity is also captured by data on skills concerning software usage,
foreign languages and the attainment of a scholarship, which are used as proxies of intrinsic
abilities. In addition, we include variables related to current job’s characteristics, such as the
industrial sector, the working region, and the type of contract.
4 Descriptive statistics.
Table 3 shows descriptive statistics for the two measures of overeducation used in our
empirical analysis. 20.9% of graduates are currently employed in jobs that require an
undergraduate educational attainment (JA measure), while 26.1% of graduates report to be
overeducated in their current job (WA measure). However, the two definitions of
overeducation do not perfectly overlap. On the one side, 71.5% of JA overeducated
individuals also perceive themselves in such a status. On the other side, only 42.1% of
19
Source: our elaborations on ISTAT data.
102
individuals reporting to be overeducated are classified as overeducated in JA terms. All in
all, both percentages confirm that Italy has one of the highest incidence in Europe of
overeducated workers five years after graduation (Ferrante et al., 2010; Verhaest and Van
der Velden, 2010)20
.
< Insert Table 3 here >
The interaction of wage levels and overeducation with the other variables included in our
models reveals some interesting findings with respect to both types of overeducated
graduates.
Concerning individual characteristics (Table 4), we find that the gender variable acts in a
different way according to the measure of overeducation. Women show higher proportions
of JA overeducation (24.2%) than men (21.4%). Conversely, the share of men that perceive
themselves as overeducated (28.2%) is higher than the correspondent share of women
(24.9%), although the gender gap in terms of wage is substantial (504 €). Moreover, women
with children show higher proportions of WA overeducated (32.7%). Similarly, the share of
working students reporting to be WA overeducated 5 years after graduation (33.9%) is
higher than that of full time students, because the former tend not to change job once
graduated. Finally, a higher social and/or family background is associated with a lower
share of overeducated, as expected.
< Insert Table 4 here >
When reference is made to the field of study (Table 5), the best results in terms of JA
matching are achieved by sciences, medicine and pedagogy, all of them showing a rate of
overeducated lower than 10%. On the contrary, economics, statistics, sport sciences, geo-
biological disciplines, agriculture and architecture show the highest share of JA
overeducated (more than 30%). These results partly differ from those reported by the WA
measure, which is higher for engineering and political and social sciences, while it is lower
for agriculture and architecture.
< Insert Table 5 here >
The difference between the two measures of overeducation is clearly highlighted by
descriptive statistics referred to job characteristics (Table 6). In this respect, we analyse the
type of contract and the working area. In terms of geographical distribution, all Italian
20
Notably, the greatest part of the European countries has shares of overeducated workers ranging
from 10% to 15% (Verhaest and Van der Velden, 2010).

103
macro-regions show similar percentages of overeducated (slightly more than 20%). Foreign
countries are the only working area reporting a substantially lower share of overeducated
(17,6%). Italian regions differ with respect to workers’ distribution and wages: the majority
of respondents works in northern Italy, where wages are also substantially higher than in
other regions. The highest wages, however, are reported by graduates working abroad, who
earn on average 2229€. Looking at the contractual basis, summary statistics primarily show
the heterogeneity of the employment relationships and the relatively low diffusion of open-
ended contracts (covering only half of the sample), which is connected with the short
working experience reported by our sample (on average 2.8 years out of a five-year period).
Then, in terms of both JA and WA measures, descriptive statistics show that self-employed
workers are less overeducated than employees. Additionally, workers on fixed-term and
non-standard contracts are less overeducated than those with open-ended contracts. The
highest shares of overeducated graduates (more than 50%) are associated with apprentices
and temporary contracts.
< Insert Table 6 here >
5 The determinants of overeducation
a. The determinants of JA overeducation
In order to analyse thoroughly the determinants of JA, five different specifications of the
same model have been taken into account.
In the first specification (column 1 in Table 8) the relationship between the likelihood to be
overeducated and the characteristics of the job post have been investigated. Available
information on job posts includes the industry, the contractual basis and whether the work
activity is full time or part time. Each sector is identified by a dummy variable;
IND_OTH_SERV is omitted in the model and therefore selected as benchmark for all other
industries. An identical procedure has been applied to identify each contractual basis; in this
case the open-ended employment contract has been chosen as benchmark. The estimates
show that, with few exceptions, most of the sectors show a positive and statistically
significant coefficient. Consultancy (IND_OTHCONS) and the education sector
(IND_EDU_RES) are the only exceptions as they show negative and statistically significant
coefficients. This result can be interpreted as remarkable evidence that JA is spread in most
of the sectors of the economic system, at least for graduate workers, and is not a
104
phenomenon observable in few well defined sectors. As far as the contractual basis is
concerned, the evidence is more controversial. Self-employed and fixed term employment
contracts (SELF_EMPL and FIX_CON, respectively) affect negatively the probability to be
overeducated, whereas the opposite impact on overeducation is estimated for non-standard
and training contracts (PERM_CON and TRAIN_CON, respectively). In addition to
sectorial and contractual dummies, the model also includes a gender dummy, whose
coefficient is negative and statistically significant: males are more likely to be overeducated
than females. This counterintuitive evidence is in line with previous analyses (Franzini and
Raitano, 2009) that pointed out how Italy actually represents an exception to differential
overeducation theories. Finally, it should be observed that full time employment relationship
has a negative impact on the probability to be overeducated.
In the second specification (column 2 in Table 8) five dummy variables, each one
identifying a single macro geographical area, are added. All parameters related to the Italian
macro geographical areas present a positive sign but these are all statistically not significant.
Interestingly, only the parameter identifying the foreign macro geographical area
(AREA_ABR) arises with a statistically significant parameter. In this case the sign is
negative, which indicates that the likelihood to be over educated is lower for graduates
working abroad. Moreover, it is worth noting that in this second specification the estimated
parameters associated with sectors and contractual basis do not change significantly with
respect to the first specification.
In the third specification (column 3 in Table 8) two sets of variables related to the graduates'
characteristics are added. Unfortunately, due to missing data concerning these variables, the
number of observations in this model is reduced by over 60%, making any comparison
between this model and the previous ones problematic. The first set of variables includes
information concerning graduates’ work experience, postgraduate studies and age. As far as
this set of variables is concerned, postgraduate studies is the only significant dimension
showing a negative sign. This result suggests that the probability to be overeducated is
higher for graduates entering the labour market and decreases with working experience. The
second set of dummy variables includes the field of study and a dummy variable associated
with the attainment of a PhD. The parameters for most of the humanities and for law studies
and medicine show a positive and statistically significant sign, whereas techno-scientific
degrees such as engineering and chemical-pharmaceutical degrees have negative and
statistically significant coefficients. Not surprisingly, the parameter for the attainment of a
PhD. is positive and statistically significant.

105
In the fourth specification (column 4 in Table 8) we add few further individual variables
such as the graduation mark (DEG_MARK), the average mark in university studies
(AV_MARK) and marks in high school leaving certificates. All these variables can be
considered as proxies of individual ability. As expected, the estimates for these parameters
turn out to be positive and statistically significant for the variables concerning the university
studies, whereas the parameter for the achievement at the secondary school is negative, but
statistically non-significant.
Finally, the fifth specification (column 5 in Table 8) includes dummy variables for
graduates' social background. The coefficient of parents' education is negative and
statistically significant, whereas father's social position is not statistically different from nil.
< Insert Table 8 here >
b. The determinants of WA overeducation
The analysis on WA overeducation reiterates that with the JA measure, allowing
staightforward comparisons between the two.
The results of the first specification (column 1 in Table 9) almost coincide with those
obtained for JA. First, sectorial dummies show similar results with exception for the
parameter associated with the health sector, which in this estimate shows a negative and
statistically significant sign. As far as the contractual basis is concerned, only
parasubordinated contracts change their effect on the probability to be overeducated,
showing a negative and statistically significant parameter.
However, results change significantly in the second specification (column 2 in Table 9),
where a set of dummy variables identifying macro geographical areas have been included.
All areas, with the exception of AREA_ISL, show a statistically significant parameter. As
observed for JA, the parameter for the AREA_ABR is negative, whereas for all the other
macro geographical area the sign is strictly positive. Overeducation seems to be a
widespread phenomenon not confined to few specific areas.
Graduates' individual characteristics are added in the third specification (column 3 in Table
9). In this case, comparisons with the estimate run for JA highlight striking differences.
Postgraduate studies are the ones having a negative impact on the probability to be

106
overeducated, while both years of work experience (EXP) and tenure in the current job
(TENURE) show positive signs. Results are quite different compared to the JA measure
estimates even when controlling for the field of study. In this case, graduates from STEM
faculties are not the ones showing a lower propensity to be overeducated as law and
medicine show negative sign too. Finally, we find differences between WA and JA
measures when considering the effect of having completed a PhD course.
Ability proxies are included in the fourth specification (column 4 in Table 9). The variable
measuring the average mark in university exams is positive and statistically significant as in
the case for JA; the variable reporting the degree final evaluation is also positive but the
statistical significance is limited to 10%.
Finally, the fifth specification (column 5 in Table 9) shows the irrelevance of variables
catching the individual social background as all the variables are statistically non-
significant.
< Insert Table 9 here >

107
c. The bivariate Probit model
Following Greene (2013), one can say that a bivariate Probit consists of two Probit
equations with correlated disturbances (error). Following the notation used for the Probit
model, the general specification for this two equations model is given by:
P(Objective Overeducation=1=YES) = ( )
P(Subjective Overeducation=1=YES) = ( )
and the error specification is given by:
[ ] [ ]
[ ] [ ]
[ ]
Interestingly, even though the assumptions of the bivariate Probit (see Table 10) differ
substantially from those of a standard Probit model, the results of the estimate do not
change. Starting from the analysis of the determinants of JA, the bivariate Probit confirms
the pivotal role played by the variables identifying the job post (sector and contracts) as
drivers affecting significantly overeducation, contrary to individual characteristics, which
play a marginal role. Moreover, the bivariate Probit also confirms the results concerning the
WA overeducation. This result confirms the relevance of variables related to the graduates'
experience in the labour market and raises doubts about the role of ability proxies. In fact,
ability proxies are weakly correlated to both measures of overeducation even when
including three additional ability dimensions (SCOLARSHIP, ENG_S and ENG_W) along
with the natural logarithm of the net monthly wage (see Table 13). It is important to stress
that due to a fall in the number of observations in this last specification, making
comparisons between the two models is not so straightforward. However, in this model
wages are not correlated with the JA measure of overeducation as the parameter is not

108
statistically significant from zero, whereas a strong negative correlation (-0.411) shows up
with respect to the WA measure. The more gradute workers earn, the less they perceive to
be overeducated. This evidence reinforces the idea that subjective measurements of
overeducation account for factors other than the required and attained education, involving
the individual labour market experience. Moreover, the new overeducation measure based
onto the SOC(HE)-Italy classification is independent from wage differentials whereas the
subjective measure based on the workers’ point of view is not. This is an important point to
stress before proceeding to estimating the wage effects of overeducation as wage equations
including the WA measure for overeducation will face severe endogeneity problem while
wage equations including the SOC(HE) measure will not. This is a further consistent
endorsement of the new SOC(HE) measure.
< Insert Table 10 here >
6 The wage penalty
Table 11 and 12 report estimates of the two Heckit models, used to assess possible wage
penalties associated with overeducation as measured with WA and JA, respectively. Three
different specifications have been estimated for both measurements, following basically the
same steps adopted for the Probit estimates. The expected sign for the parameters of
overeducation is negative. Ceteris paribus, an overeducated worker is expected to earn a
lower wage compared with that of a matched peer as a consequence of market wage
differentials between graduate and non-graduate jobs. First, it is worth noting that the sign
and the level of significance remains unaltered for most of the variables when comparing the
corresponding columns between the two tables. Second, whatever the measure adopted,
overeducation has a negative and statistically significant impact on wages in all of the three
models. Overeducated graduate workers earn, ceteris paribus, lower wages than their
matched counterparts. This evidence is consistent with evidence highlighted in pre-existing
literature. In particular, our coefficients are close to those of Allen and Van der Velden
(2001) and Di Pietro and Urwin (2006), ranging between 5% and 10% for both JA and WA
measures. However, the penalty is lower than the one measured by Dolton and Vignoles
(2000), Dolton and Silles (2008) and Chevalier and Lindley (2007) for overeducated
graduates in the UK, and by Rubb (2003) for the US. This result is also in line with
international comparisons showing that Italian overeducated graduates suffer one of the

109
lowest pay-penalty in Europe (Ferrante et al., 2010; Barcena et al., 2011)21
. Actually, other
empirical studies referring to Italian data come out with even lower penalties. Cutillo and Di
Pietro (2006) report a 4.4% wage penalty for WA overeducation using the same estimation
method adopted in this study (while the penalty raise to 5.7% using instrumental variables).
Franzini and Reitano (2009) find that the wage penalty is not significant once controlled for
individual ability. This result can be explained by the poor tendency of wages in the Italian
graduate labour market in the last decade as suggested by Ferrante et al. (2010). This is
consistent with our evidence on wage premia earned by Italian graduates working abroad
(+45%). Other studies report slightly higher wage penalties for overeducated Italian
graduates, ranging between 10% and 15% (Carmen and Pastore, 2013).
< Insert Table 11 here >
However, it is important to emphasize that in all the three specifications the WA measure
for overeducation is associated with higher penalties compared to those reported for the JA
measure. This evidence can be interpreted referring to the results obtained in the analysis of
the determinants. As expected, individual characteristics play a more relevant role in the
analysis of WA overeducation than in that of JA overeducation. The way in which graduates
perceive their job position or their relative position in the labour market can affect their
perception to be overeducated. WA overeducation can be thus considered to be more than a
simple indicator of educational mismatch as it accounts also for graduates’ perception of
their relations to either the job or the labour market. As a result, WA overeducation is a
biased indicator of overeducation. Accordingly, it is not surprising that the wage penalty
associated with WA overeducation is significantly higher than that of JA overeducation.
< Insert Table 12 here >
Conclusion
This essay introduces a new measurement of overeducation in order to address the
measurement error problem highlighted by the relevant economic literature. As the
21
Ferrante et al. (2010) report the absence of a wage penalty for Italian (and Estonian) overeducated
graduate workers, whereas in the other surveyed countries such penalty ranges between 21% and
54%. Barcena-Martin et al. (2011) estimate that Italy is the only European country where the wage
penalty fails to be statistically significant.

110
measurement error is typically associated with biases generated by workers’ self-assessment
(WA) we develop a job analysis measure (JA) based on the SOC(HE)-Italy occupational
classification dealing with possible further sources of measurement error. We thus carry out
analyses with both measures on the possible determinants and the impact on wages of
overeducation. We try to assess the extent to which certain factors affect the probability to
be overeducated by estimating five different specifications of a single Probit model.
We can derive at least three conclusions from our analysis.
First, it is important to emphasize that job characteristics are significant determinants for
both JA and WA. Data availability allows us to take into account two different factors which
identify a job post: its techno-organisational content and its socio-institutional context, both
regulating the employment relation and the performance of its constituent tasks. The former
is proxied by two sets of dummy variables identifying the industry and the relevant field of
study. Actually, this set of variables describes the cognitive content of the constituent tasks
of a particular job. In this view, the relevant field of study represents job requirements of
labour demand rather than a distinctive trait of labour supply. The latter is represented by
the contractual basis. Graduates on either a self-employment or a fixed term contract are less
likely to be overeducated than graduates with open-ended contracts. This evidence could be
explained by two not mutually exclusive explanations. On the one hand, it may indicate that
workers prefer a job on an open-ended contract, even though it does not fully match their
skills and, possibly, their expectations. They accept job proposal on an open-ended
employment contract, because they value the expected tenure and security above the match
between their skills and the job contents. On the other hand, this lower probability can
derive from employers' hiring strategies. Firms could use the open-ended employment
relationship as an incentive for employees' long term attachment. If internal labour markets
operate and favour upward internal mobility, ports of entry can be opened at a low level
with the prospect to match individual skills and job contents after a lapse of internal career
or of on-the-job training.
Second, individual characteristics have a different impact on the two different measures of
overeducation. The impact of gender supports the view that women are less JA
overeducated than men, while the difference is not significant for WA. Thus, we do not find
only that graduated women are less likely to be overeducated than men, but also that women
may perceive to be overeducated although the cognitive content of their assigned job does
match with their educational attainment. This insight is supported by our evidence that
women win larger wage premia (17.6%) than men if they find a matched job22
. Graduates’
22
Rubb (2003) obtains similar results.

111
social and family background is a determinant of overeducation only when the JA measure
is adopted. Consequently, our JA measure captures the better career opportunities entailed
by a higher social background. On the contrary, effects on overeducation measured by WA
are ambiguous as this subjective measure is upwardly biased by higher expectations in terms
of wages and careers.
Finally, the characteristics of the graduates' experience in both the external and the internal
labour market, such as working experience and tenure, measured in years, are relevant only
as determinants of WA while they are not statistically significant for JA. This is not
surprising as WA does not embody only job characteristics but accounts also for the overall
individual experience in the labour market. Moreover, when running bivariate probit models
to assess the different impact of several determinants on the two different overeducation
measures we find that the WA measure is correlated with wage differentials whereas the
SOC(HE)-based measure is not. This means that wage equations that estimate the impact of
overeducation face severe endogeneity problem when including WA measures for required
level of schooling. On the contrary, the SOC(HE)-based measure is strictly exogenous.
Finally, since we have only one observation at five years after the degree without any
information on the number of jobs graduates had in that period we cannot derive any
suggestion with regard to the hypothesis that overeducation is just a temporary
phenomenon.
We have thus run Heckit estimates to assess the impact of overeducation on wages. We find
that, anyhow defined, overeducated workers suffer a wage penalty when compared to their
peers employed in a matched job. Nevertheless, differences between alternative definitions
of overeducation arise when referring to the magnitude of such penalty. The JA measure
reports a lower wage penalty (8.0%) than the WA measure does (9.9%). This evidence is
consistent with previous findings by Sloane et al. (1999) for the UK, by Cohn and Kahn for
the US and by Groot and van den Brink (2000) for the Netherlands. From this result we
draw two different conclusions. First, job satisfaction and individual expectations may affect
the perception to be overeducated. If so, the WA measure of overeducation accounts also for
factors other than educational mismatches. Individual motivation, job satisfaction and
wellbeing at work can be positively correlated with WA overeducation while omitting
variables related to such dimensions can result in upward biases (Pollmann-Schult and
Buchel, 2004; Vaisey, 2006; Green and Zhu, 2008). Accordingly, wage penalties associated
with WA overeducation incorporate the lower intrinsic motivation of graduated reporting to
be overeducated. For this reason the introduction of these variables in the specification can
represent a further step in the empirical research on this topic applied to the Italian context.

112
Second, skill heterogeneity can play a different role according to the chosen measure.
Unobserved individual characteristics can affect overeducation perception and thus WA
measures while this is not the case when using JA measures. All in all, we can claim that
WA measures of overeducation are spurious indicators of different, interrelated phenomena,
which makes the use of this measure highly problematic.
References
Allen, J.; Van derVelden, R. (2001) Educational Mismatches versus Skill Mismatches:
Effects on Wages, Oxford Economic Papers n. 3 pp. 434-452.
Barcena-Martin E.; Budria S., Moro-Egido A. I. (2011), Skill mismatches and wages among
European university graduates, MPRA Paper No. 33673.
Battu, H.; Belfield, C.; Sloane, P. (1999) Overeducation among graduates: A cohort view, in
Education Economics, vol. 7 issue 1, pp. 21–38.
Battu, H.; Sloane, P.; Building, E.; Street, D.; Park, S. (2004) Over-education and ethnic
minorities in Britain, in Manchester School, vol. 72 issue 4, pp. 535–559.
Bauer, T. (2002) Educational mismatch and wages: a panel analysis, in Economics of
Education Review, vol. 21 issue3, pp. 221–229.
Becker, G. S. (1964), Human Capital: A Theoretical and Empirical Analysis with Special
Reference to Education, University of Chicago Press, Chicago.
Berg, I. (1970) Education and Jobs: The Great Training Robbery, New York, Praeger.
Büchel, F. and van Ham, M. (2003) Overeducation, regional labour markets, and spatial
flexibility, in Journal of Urban Economics, vol. 53 issue 3, pp. 482–493.
Büchel, F.; Battu, H. (2003) The theory of differential overeducation: does it work? In
Scottish Journal of Political Economy, vol. 50 n. 1, pp. 1 – 16.
Büchel, F.; Pollmann-Schult, M. (2001) Overeducation and Skill Endowments The Role of
School Achievement and Vocational Training Quality, in International Journal of
Manpower, vol. 25 issue 2, pp. 150-166.

113
Campbell, M. ; Baldwin, S.; Johnson, S.; Chapman, R.; Upton A.; Upton, F. (2001) Skills in
England 2001. The Research Report. Nottingham, DfES Publications.
Carmen, A. Pastore F. (2013) Delayed graduation and overeducation: A test of the human
capital model versus the screening hypothesis, Discussion Paper series, Forschungsinstitut
zur Zukunft der Arbeit, No. 6413.
Caroleo F.E., Pastore F. (2011) Overeducation at a glance. Determinants and wage effects of
the educational mismatch, looking at the AlmaLaurea data.
Cattani, L.; Elias, P.; Purcell, K. (2014) SOC(HE)-Italy: a classification for graduate
occupations, mimeo.
Chevalier, A. (2003) Measuring Over-education, in Economica, Vol. 70, No. 3, pp. 509-531.
Chevalier A., Lindley J. (2007) Over-education and the skills of UK graduates, Centre for
the Economics of Education, Discussion Paper 79.
Cohn, E.; Khan, S. (1995) The wage effects of overschooling revisited, in Labour
Economics, vol. 2 issue 1, pp. 67–76.
Cutillo, A., Di Pietro, G. (2006), The effects of overeducation on wages in Italy: a bivariate
selectivity approach, International Journal of Manpower, 27, 2, pp. 143-168
Dearden, L.; McIntosh, S.; Myck, M.; Vignoles, A. (2002) The Returns to Academic and
Vocational Qualifications in Britain, in Bulletin of Economic Research, vol. 54 n. 3, pp.
249-274.
Di Pietro, G.; Urwin, P. (2009) Education and Skills mismatch in the Italian Graduate
Labour Market, University of Westminster, mimeo.
Dolado, J. J.; Jansen, M.; Jimeno, J. F. (2009) On the job-search in a matching model with
heterogeneous jobs and workers, in Economic Journal, vol. 119, pp. 200–228.
Dolton, P.; Silles, M. (2008) The effects of overeducation on earnings in the graduate labour
market, in Economics of Education Review, vol. 27 n. 2, pp. 125-139.
Dolton, P.; Vignoles, A. (2000) The incidence and effects of overeducation in the U.K.
graduate labour market, in Economics of Education Review, vol. 19, pp. 179–198.
114
Dolton, P.; Vignoles, A. (1997) Overeducation Duration: How Long Did Graduates in the
1980s Take to Get a Graduate Job? In University of Newcastle Upon Tyne Working Papers.
Duncan, G. and Hoffman, S. (1981) The Incidence and Wage Effects of Overeducation, in
Economics of Education Review 1 (1), pp 75-86.
Eckaus, R. (1964) Economic criteria for education and training, Review of Economics and
Statistics, 46, pp. 181-190.
Elias, P. and K. Purcell (2004). SOC(HE): a classification of occupations for studying the
graduate labour market. Research Paper 6, University of Warwick, Institute for Employment
Research.
Elias, P. and K. Purcell (2011) Higher education, intergenerational mobility and earnings:
the case of the UK. Working Paper for ESRC.
Frank, R. (1978). Why women earn less: the theory and estimation of differential
overqualification, in American Economic Review, vol. 68 issue 3, pp 360–373.
Ferrante F., McGuinness S.,. Sloane P. J (2010) Esiste «overeducation»? Un’analisi
comparata, in Consorzio InterUniversitario AlmaLaurea (Eds.) XII Rapporto sulla
condizione occupazionale dei laureati. Investimenti in capitale umano nel futuro di Italia ed
Europa, Il Mulino, Bologna.
Franzini, M., Raitano M. (2009), Pochi e poco utilizzati? L’overeducation dei laureati
italiani”, paper presented to the 50th Annual Conference of the Italian Economics
Association (Società Italiana degli Economisti), Rome, October.
Freeman, R. B. (1976) The Overeducated America, New York, Academic Press.
Gautier, P. (2002) Unemployment and search externalities in a model with heterogeneous
jobs and workers, in Economica, vol. 69, pp. 21–40.
Green, C.; Kler, P.; Leeves, G. (2007) Immigrant overeducation: Evidence from recent
arrivals to Australia, in Economics of Education Review, vol. 26 issue 4, pp. 420–432.
Green, F.; McIntosh, S. (2007) Is There a Genuine Under-utilization of Skills Amongst the
Overqualified?, Applied Economics, vol. 39 pp427- 439.
115
Green, F.; McIntosh, S.; Vignoles, A. (1999) Overeducation and skills – clarifying the
concepts. Mimeo.
Green, F.; McIntosh, S.; Vignoles, A. (2002) The Utilization of Education and Skills:
Evidence from Britain, in The Manchester School vol. 70 n. 6, pp. 792-811.
Green, F.; Zhu, Y. (2010) Overqualification, Job Dissatisfaction and Increasing Dispersion
in the Returns to Graduate Education, Oxford Economic Papers, vol. 62 pp 740- 763.
Greene W.H., (2012) Econometric Analysis, VII edition, Prentice Hall.
Groeneveld, S.; Hartog, J. (2004) Overeducation, wages and promotions within the firm,
Labour Economics, 11(6) pp. 701-714.
Groot, W. (1993) Overeducation and the returns to enterprise related schooling, in
Economics of Education Review, vol. 12, pp. 299–309.
Groot, W. and Maassen van den Brink, H. (1997) Allocation and the Returns to Over-
education in the UK, in Education Economics, vol. 5 issue 2, pp. 169–183.
Groot W., van den Brink H. M. (2000), Overeducation in the labour market: a meta-
analysis, Economics of Education Review 19, pp. 149–158.
Halaby, C. (1994) Overeducation and skill mismatch, in Sociology of Education, vol. 67, pp
47-59.
Hartog, J. (1980) Earnings and capability requirements, in Review of Economics and
Statistics, vol 62 issue 2, pp. 230 – 240.
Hartog, J. (2000) Overeducation and earnings: where are we, where should we go?
Economics of Education Review, 19(2) pp 131-147.
Hartog, J.; Houtkoop, W.; Oosterbeek, H. (1996) Returns to cognitive skills in the
Netherlands. Working paper, Universitet van Amsterdam.
Hartog, J.; Jonker, N. (1996) A job to match your education: does it matter? Paper presented
at the ROA 10th Anniversary Conference, Maastricht, in Heijke, H.; Borghans, L. (1998)
Towards a transparent labour market for educational decisions. Ashgate, Aldershot, pp. 99 –
118.

116
Hartog, J. and Tsang, M. (1987) Estimating, testing and applying a comparative advantage
earnings function for the us 1969-1973-1977. Research Memorandum 8709, Universiteit
van Amsterdam, Department of Economics.
Hornstein, A.; Krusell, P.; Violante, G. L. (2006) Frictional Wage Dispersion in Search
Models: A Quantitative Assessment, Federal Reserve Bank of Richmond Working Paper
2006-07.
Istat (2009) Indagine campionaria sulle professioni, Roma.
Kiker, B. F., Santos, M. C. (1991) Human capital and earnings in Portugal, in Economics of
Education Review, vol 10 issue 3, pp. 187 – 203.
Kiker, B. F.; Santos, M. C.; de Oliveira, M. (1997) The role of human capital and
technological change in overeducation, in Economics of Education Review, vol. 19 issue 2,
pp. 199 – 206.
Kiker, B. F.; Santos, M. C.; de Oliveira, M. (2000) Overeducation and undereducation:
evidence for Portugal, in Economics of Education Review, vol. 16 issue 2, pp. 111–125.
Leuven, E. and Oosterbeek, H. (2011) Overeducation and Mismatch in the Labour Market,
in Handbook of the Economics of Education, Volume 4, Elsevier, Amsterdam.
Machin, S.; Van Reener, J. (1998) Technology and Changes in Skill Structure: Evidence
from Seven OECD Countries, in Quarterly Journal of Economics, vol. 113, pp. 1215 -1244.
Mason, G. (1995) The New Graduate Supply-shock. Recruitment and Utilisation of
Graduates in British Industry, in Report Series Number 9, London, National Istitute of
Economic and Social Research.
McGoldrick, K. and Robst, J. (1996) Gender differences in overeducation: A test of the
theory of differential overqualification, in American Economic Review, vol. 86 pp. 280–284.
McGuinness, S. (2003) Graduate overeducation as a sheepskin effect: evidence from
Northen Ireland, in Applied Economics, vol. 35, pp. 1943-1945.
McGuinness, S. (2006) Overeducation in the Labour Market, in Journal of Economic
Surveys, Vol. 20, No. 3, pp 387-418.

117
Mincer, J. (1974) Schooling, Experience and Earnings, New York, Columbia University
Press.
Oosterbeek, H. and Webbink, D. (1996) Over scholing, overscholing en inkomen, in
Economisch-Statistische Berichten, vol. 81, pp. 240–241.
Pollmann-Schult, M. Buchel F. (2004). Career Prospects of Overeducated Workers in
Germany, European Sociological Review 20(4), pp. 321-331.
Purcell, L.; Elias, P. et al. (2012) Futuretrack Stage 4: transitions into employment, further
study and other outcomes, University of Warwick, Mimeo.
Ramirez, A. A. (1993) Mismatch in the Spanish labor market: overeducation?, in Journal of
Human Resources, vol. 28 issue 2, pp. 259–278.
Rubb, S. (2003a). Overeducation: a short or long run phenomenon for individuals? In
Economics of Education Review, vol. 22 issue 4, pp. 389–394.
Rumberger, R. (1987) The impact of surplus schooling on productivity and earnings, in
Journal of Human Resources, vol. 22 issue 1, pp. 24–50.
Sattinger, M. (1993) Assignment Models of the Distribution of Earnings, in Journal of
Economic Literature, Vol. 31, pp. 831-880.
Sicherman, N. (1991) "Overeducation" in the labor market, in Journal of Labor Economics,
vol. 9 issue 2, pp. 101.
Sicherman, N. and Galor, O. (1990) A theory of career mobility, in Journal of Political
Economy, vol. 98 issue 1, pp. 169–192.
Sloane, P. J.; Battu, H.; Seaman, P. T. (1999) Overeducation, Undereducation and the
British Labour Market, in Applied Economics, vol. 31, pp. 1437 – 1453.
Spence, M. (1973) Job market signaling, in Quarterly Journal of Economics, vol. 87, pp.
355–374.
Thurow, L. C. (1975). Generating inequality. Mechanisms of Distribution in the U.S.
Economy. New York, Basic Books.

118
Thurow, L. C. (1979) A job-competition model, in M. Piore (edited by) Unemployment and
Inflation. Institutionalist and Structuralist Views, New York, White Plains.
Thurow, L.C.; Lucas, R. F. B. (1972) The American distribution of income: a structural
problem. A study for the Joint Economic Committee, US Congress, Government Printing
Office, Washington DC.
Vaisey, S. (2006) Education and its discontents: Overqualification in America, 1972-2002.
Social Forces 85(2): 835-864.
Verdugo, R.; Verdugo, N. (1989) The impact of surplus schooling on earnings: some
additional findings, Journal of Human Resources, pp- 629-643.
Verhaest D.; van der Velden, R. (2010) Cross-country differences in graduate
overeducation and its persistence, ROA Research Memorandum n. 7-2010.
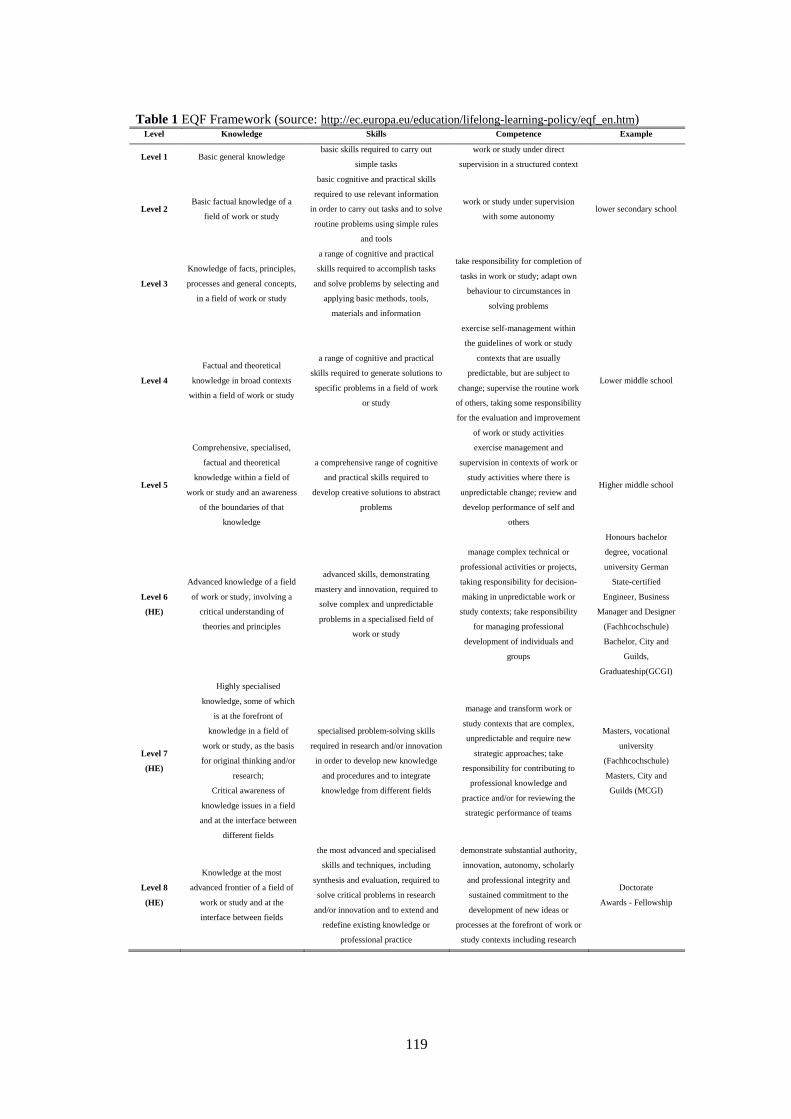
119
Table 1 EQF Framework (source: http://ec.europa.eu/education/lifelong-learning-policy/eqf_en.htm) Level Knowledge Skills Competence Example
Level 1 Basic general knowledge basic skills required to carry out
simple tasks
work or study under direct
supervision in a structured context
Level 2 Basic factual knowledge of a
field of work or study
basic cognitive and practical skills
required to use relevant information
in order to carry out tasks and to solve
routine problems using simple rules
and tools
work or study under supervision
with some autonomy lower secondary school
Level 3
Knowledge of facts, principles,
processes and general concepts,
in a field of work or study
a range of cognitive and practical
skills required to accomplish tasks
and solve problems by selecting and
applying basic methods, tools,
materials and information
take responsibility for completion of
tasks in work or study; adapt own
behaviour to circumstances in
solving problems
Level 4
Factual and theoretical
knowledge in broad contexts
within a field of work or study
a range of cognitive and practical
skills required to generate solutions to
specific problems in a field of work
or study
exercise self-management within
the guidelines of work or study
contexts that are usually
predictable, but are subject to
change; supervise the routine work
of others, taking some responsibility
for the evaluation and improvement
of work or study activities
Lower middle school
Level 5
Comprehensive, specialised,
factual and theoretical
knowledge within a field of
work or study and an awareness
of the boundaries of that
knowledge
a comprehensive range of cognitive
and practical skills required to
develop creative solutions to abstract
problems
exercise management and
supervision in contexts of work or
study activities where there is
unpredictable change; review and
develop performance of self and
others
Higher middle school
Level 6
(HE)
Advanced knowledge of a field
of work or study, involving a
critical understanding of
theories and principles
advanced skills, demonstrating
mastery and innovation, required to
solve complex and unpredictable
problems in a specialised field of
work or study
manage complex technical or
professional activities or projects,
taking responsibility for decision-
making in unpredictable work or
study contexts; take responsibility
for managing professional
development of individuals and
groups
Honours bachelor
degree, vocational
university German
State-certified
Engineer, Business
Manager and Designer
(Fachhcochschule)
Bachelor, City and
Guilds,
Graduateship(GCGI)
Level 7
(HE)
Highly specialised
knowledge, some of which
is at the forefront of
knowledge in a field of
work or study, as the basis
for original thinking and/or
research;
Critical awareness of
knowledge issues in a field
and at the interface between
different fields
specialised problem-solving skills
required in research and/or innovation
in order to develop new knowledge
and procedures and to integrate
knowledge from different fields
manage and transform work or
study contexts that are complex,
unpredictable and require new
strategic approaches; take
responsibility for contributing to
professional knowledge and
practice and/or for reviewing the
strategic performance of teams
Masters, vocational
university
(Fachhcochschule)
Masters, City and
Guilds (MCGI)
Level 8
(HE)
Knowledge at the most
advanced frontier of a field of
work or study and at the
interface between fields
the most advanced and specialised
skills and techniques, including
synthesis and evaluation, required to
solve critical problems in research
and/or innovation and to extend and
redefine existing knowledge or
professional practice
demonstrate substantial authority,
innovation, autonomy, scholarly
and professional integrity and
sustained commitment to the
development of new ideas or
processes at the forefront of work or
study contexts including research
Doctorate
Awards - Fellowship

120
Table 2 EQF levels for economists (2.5.3.1.1) according to SOC(HE)-Italy
CP
Code Job Title
Experts
EQF
Orchestrators
EQF
Communicators
EQF
Highest
EQF
Score
Major
Group
2.5.3.1.1 Specialists in economic systems 6.84 6.77 6.72 Experts
(6.84) EXP

121
Legend
Variable Description
JA_OVERED JA Overeducated
WA_OVERED WA Overeducated
EXP Years of experience after graduation
AGE Age at the time of the interview
SEX Male
EDU_PAR_PRIM Parental education: primary school
EDU_PAR_SEC Parental education: secondary school
EDU_PAR_HIGH Parental education: high school
EDU_PAR_DEG Parental education: degree (at least one)
OCC_FATH_ENT Father’s occupation: self-employed, entrepreneur, manager
OCC_FATH_OTH Father’s occupation: employee, unemployed, inactive
FATH_UPP Father’s social status: upper
MOTH Mother
TEN Tenured
POST_GRAD Years of post-graduate education
PHD Post graduate studies: Doctorate
lnW Natural logarithm of the net monthly wage
SCHOLARSHIP Having had scholarship during the studies
ENG_S English Language Proficiency: Speaking
ENG_W English Language Proficiency: Writing
FIELD_AGRIC Field of study: Agriculture
FIELD_ARCH Field of study: Architecture
FIELD_PHA Field of study: Pharmaceutical
FIELD_ECO Field of study: Economics and statistics
FIELD_SPO Field of study: Sport science
FIELD_GEO Field of study: Geo-biological
FIELD_LAW Field of study: Law
FIELD_ENG Field of study: Engineering
FIELD_EDU Field of study: Education
FIELD_HUM Field of study: Humanities
FIELD_LAN Field of study: Foreign languages
FIELD_MED Field of study: Medicine and dentistry
FIELD_POL Field of study: Political and social sciences
FIELD_PSYCH Field of study: Psychology
FIELD_SCIE Field of study: Sciences
AV_MARK Exams average mark
DEG_MARK Degree mark
HSCH_MARK High School mark
DEL_IND Delay index
AREA_NW Working area: North-west
AREA_NE Working area: North-east
AREA_CEN Working area: Centre
AREA_SOU Working area: South
AREA_ISL Working area: Islands
AREA_ABR Working area: abroad
LIV_NW Living area: North-west
LIV_NE Living area: North-east
LIV_CEN Living area: Centre
LIV_SOU Living area: South
LIV_ISL Living area: Islands
PERM_CON Open-ended contract
FIX_CON Fixed-term contract
SELF_EMPL Self-employed
TRAIN_ CON Training contract
TEMP_CON Temporary contract

122
NONSTD_CON Non-standard employment contract
NONSTD_SELF Non-standard self-employed
OTH_NONSTD Other non-standard contracts
NO_CON Without contract
FULL_TIME Full-time
IND_AGRIC Industry: Agriculture, forestry and fishing
IND_PRINT Industry: Printing and reproduction of recorded media
IND_ENERGY Industry: Energy/mining
IND_CHEM Industry: Manufacture of chemical products
IND_MET Industry: Manufacture of metal products and machineries
IND_ELECT Industry: Manufacture of electronic and electric products
IND_OTHMAN Industry: Other manufacturing
IND_CONSTR Industry: Construction
IND_TRADE Industry: Wholesale and retail trade
IND_TRANSP Industry: Transporting and storage
IND_COMM Industry: Information and communication
IND_FIN Industry: Financial and insurance activities
IND_OTHCONS Industry: Other consulting and professional activities
IND_INFOR Industry: Information service activities
IND_BUS_SERV Industry: Other business support service activities
IND_PUB Industry: Public administration and defence
IND_EDU_RES Industry: Education/ R&D
IND_HEAL Industry: Human health and social work activities
IND_CULT Industry: Arts, entertainment and recreation
IND_OTH_SERV Industry: Other services activities
REG_STUD Regularity in studies
STUD_WORK Working experience during studies
COMP_SKIL Computer skills (ability in using excel spreadsheets)
CONS_JOB Coherent job during studies
TRAINEESHIP Training, apprenticeship

123
Table 3 – Descriptive statistics on overeducation
Overeducated workers %
JA overeducated 20.9%
WA overeducated 26.1%
WA overeducated conditioned on being JA overeducated 72.4%
JA overeducated conditioned on being WA overeducated 42.1%
Table 4 - Overeducation by individual characteristics and social and family background
% Monthly net
earning
JA
overeducated
(%)
WA
overeducated
(%)
Female 60.9% 1233 24.2% 24.9%
Male 39.1% 1737 21.4% 28.2%
Parental education:
primary school 5.4% 1396 24.0% 30.5%
Parental education:
secondary school 18.3% 1360 26.4% 31.4%
Parental education: high
school 37.4% 1382 24.6% 28.2%
Parental education:
degree (at least one) 26.3% 1451 19.3% 22.4%
Father’s occupation:
self-employed,
entrepreneur, manager
55.2% 1482 21.6% 25.5%
Father’s occupation:
employee, unemployed,
inactive
44.8% 1359 25.1% 28.9%
Mother 12.3% 1264 22.2% 32.7%
Tenured 44.7% 1501 24.9% 33.9%
Table 5 - Overeducation by educational attainment and field of study
% Monthly net
earning
JA
overeducated
(%)
WA
overeducated
(%)
Agriculture 2.7% 1202 31.4% 18.5%
Architecture 5.0% 1222 30.7% 18.7%
Pharmaceutical 4.6% 1405 10.9% 6.1%
Economics and statistics 12.3% 1572 34.4% 40.4%
Sport science 1.0% 1101 43.4% 36.9%
Geo-biological 5.2% 1260 36.8% 19.0%
Law 7.0% 1240 12.5% 12.3%
Engineering 13.0% 1722 18.4% 33.1%
Education 7.9% 1175 4.3% 12.5%
Humanities 5.8% 1134 15.1% 20.8%
Foreign languages 2.7% 1184 14.4% 19.6%
Medicine and dentistry 13.2% 1459 7.8% 11.5%
Political and social sciences 10.5% 1273 24.4% 32.2%
Psychology 6.0% 1087 10.3% 19.6%
Sciences 3.1% 1259 8.4% 17.3%

124
Table 6 – Overeducation by job characteristics
% Monthly net
earning
JA
overeducated
(%)
WA
overeducated
(%)
Working area: North-
west 22.9% 1464 21.4% 40.4%
Working area: North-
east 30.2% 1380 25.6% 44.7%
Working area: Centre 24.9% 1324 23.6% 40.5%
Working area: South 11.1% 1207 21.6% 40.7%
Working area: Islands 5.6% 1264 23.5% 40.5%
Working area: abroad 5.2% 2229 17.6% 38.1%
Open-ended contract 50.2% 1547 29.1% 51.9%
Fixed-term contract 15.3% 1345 19.3% 31.3%
Self-employed 19.4% 1298 8.2% 20.0%
Training contract 2.7% 1236 51.4% 66.4%
Temporary contract 0.8% 1126 52.4% 66.5%
Non-standard
employment contract 8.1% 1334 26.5% 42.3%
Non-standard self-
employed 1.7% 1094 12.0% 30.1%
Other non-standard
contracts 0.2% 1102 21.0% 33.1%
Without contract 1.3% 706 21.4% 48.8%
Full-time 84.4% 1505 23.5% 41.9%
Part-time 15.6% 832 21.2% 40.4%
Table 7 - Overeducation by industry (NACE code)
% Monthly net
earning
JA
overeducated
(%)
WA
overeducated
(%)
Agriculture, forestry and
fishing
0.9% 1232 66.9% 53.4%
Printing and reproduction of
recorded media
0.8% 1088 22.6% 74.6%
Energy/mining 2.7% 1759 35.0% 43.4%
Manufacture of chemical
products
2.4% 1623 34.8% 44.3%
Manufacture of metal
products and machineries
5.1% 1709 31.6% 56.9%
Manufacture of electronic and
electric products
1.2% 1761 16.9% 41.6%
Other manufacturing 2.9% 1555 45.5% 63.9%
Construction 3.6% 1402 25.1% 33.0%
Wholesale and retail trade 7.5% 1315 38.1% 53.2%
Transporting and storage 1.3% 1425 45.5% 71.4%
Information and
communication
2.5% 1335 21.0% 71.0%
Financial and insurance
activities
6.2% 1571 57.8% 67.6%
Other consulting and
professional activities
7.4% 1277 5.4% 13.8%
Information service activities 3.6% 1589 14.0% 65.4%
Other business support service
activities
2.5% 1284 44.0% 66.2%
Public administration and 5.7% 1592 28.0% 54.4%

125
defence
Education/ R&D 16.4% 1199 9.5% 19.1%
Human health and social work
activities
12.7% 1579 12.4% 27.8%
Arts, entertainment and
recreation
2.2% 1023 34.1% 71.7%
Other services activities 4.6% 1039 18.8% 54.0%
No answer 1.0% - - -

126
Table 8- Probit model with JA measure for overeducation as dependent variable. Marginal effects
(1) (2) (3) (4) (5) SOC_Overed SOC_Overed SOC_Overed SOC_Overed SOC_Overed
IND_AGRIC 1.825*** 1.807*** 1.535*** 1.495*** 1.496***
(0.1151) (0.1154) (0.1985) (0.2014) (0.2019)
IND_PRINT 0.221* 0.224* -0.00977 0.00150 0.00419
(0.1245) (0.1251) (0.2325) (0.2331) (0.2332)
IND_ENERGY 0.751*** 0.757*** 0.916*** 0.911*** 0.921***
(0.0831) (0.0834) (0.1647) (0.1666) (0.1668)
IND_CHEM 0.653*** 0.644*** 0.866*** 0.871*** 0.871***
(0.0859) (0.0862) (0.1725) (0.1752) (0.1753)
IND_MET 0.624*** 0.623*** 0.992*** 1.012*** 1.014***
(0.0730) (0.0735) (0.1427) (0.1451) (0.1454)
IND_ELECT 0.261** 0.275** 0.638*** 0.646*** 0.667***
(0.1110) (0.1114) (0.2419) (0.2431) (0.2435)
IND_OTHMAN 0.916*** 0.912*** 0.878*** 0.854*** 0.858***
(0.0790) (0.0794) (0.1468) (0.1489) (0.1493)
IND_CONSTR 0.489*** 0.472*** 0.923*** 0.976*** 0.971***
(0.0873) (0.0875) (0.1698) (0.1722) (0.1725)
IND_TRADE 0.762*** 0.743*** 1.169*** 1.167*** 1.168***
(0.0652) (0.0654) (0.1230) (0.1248) (0.1250)
IND_TRANSP 0.950*** 0.947*** 0.976*** 1.003*** 0.999***
(0.1066) (0.1071) (0.1885) (0.1906) (0.1910)
IND_COMM 0.265*** 0.276*** 0.170 0.157 0.165
(0.0866) (0.0870) (0.1552) (0.1573) (0.1574)
IND_FIN 1.325*** 1.317*** 1.261*** 1.260*** 1.267***
(0.0714) (0.0717) (0.1341) (0.1357) (0.1360)
IND_OTHCONS -0.210*** -0.233*** -0.126 -0.0943 -0.0949
(0.0779) (0.0781) (0.1465) (0.1482) (0.1483)

127
IND_INFOR 0.0819 0.0836 0.360** 0.329* 0.331**
(0.0823) (0.0826) (0.1646) (0.1685) (0.1687)
IND_BUS_SERV 0.884*** 0.868*** 0.905*** 0.881*** 0.885***
(0.0822) (0.0825) (0.1458) (0.1486) (0.1489)
IND_PUB 0.556*** 0.523*** 0.198 0.247* 0.247*
(0.0722) (0.0726) (0.1285) (0.1312) (0.1314)
IND_EDU_RES -0.487*** -0.521*** -0.384*** -0.374*** -0.378***
(0.0716) (0.0719) (0.1337) (0.1357) (0.1359)
IND_HEAL 0.0221 -0.00703 0.184 0.199 0.207
(0.0657) (0.0660) (0.1334) (0.1350) (0.1352)
IND_CULT 0.671*** 0.665*** 0.526*** 0.542*** 0.534***
(0.0942) (0.0945) (0.1555) (0.1570) (0.1572)
IND_OTH_SER
V
0.233*** 0.222*** 0.213 0.235 0.226
(0.0854) (0.0857) (0.1456) (0.1476) (0.1479)
SELF_EMPL -0.586*** -0.604*** -0.649*** -0.633*** -0.618***
(0.0404) (0.0406) (0.0719) (0.0729) (0.0732)
NONSTD_CON 0.447*** 0.447*** 0.483* 0.472* 0.466*
(0.1102) (0.1105) (0.2567) (0.2566) (0.2563)
OTH_NONSTD -0.482*** -0.484*** -0.355*** -0.347** -0.326**
(0.0803) (0.0804) (0.1377) (0.1393) (0.1399)
FIX_CON -0.515*** -0.508*** -0.548** -0.535** -0.526**
(0.1141) (0.1144) (0.2626) (0.2628) (0.2625)
FULL_TIME -0.0951*** -0.0763** -0.202*** -0.213*** -0.212***
(0.0352) (0.0355) (0.0622) (0.0635) (0.0636)
SEX -0.220*** -0.212*** -0.162*** -0.155*** -0.152***
(0.0251) (0.0253) (0.0453) (0.0466) (0.0468)
AREA_NW -0.109*** -0.0634 -0.0535 -0.0437
(0.0347) (0.0600) (0.0612) (0.0615)

128
AREA_SOU 0.0432 0.0463 0.0340 0.0265
(0.0403) (0.0682) (0.0694) (0.0695)
AREA_ABR -0.368*** -0.532*** -0.516*** -0.498***
(0.0616) (0.1262) (0.1330) (0.1335)
POST_GRAD -0.172*** -0.174*** -0.172***
(0.0316) (0.0322) (0.0321)
AGE -0.0260 -0.0184 -0.0258
(0.0288) (0.0308) (0.0309)
AGE SQUARED 0.000381 0.000282 0.000352
(0.0003) (0.0004) (0.0004)
EXP 0.356* 0.327 0.324
(0.2030) (0.2066) (0.2068)
EXP SQUARED -0.0432 -0.0385 -0.0383
(0.0272) (0.0276) (0.0277)
TEN -0.0362 -0.0423 -0.0470
(0.0501) (0.0509) (0.0510)
FIELD_AGRIC 0.607*** 0.242* 0.241*
(0.1729) (0.1292) (0.1295)
FIELD_ARCH 0.216 -0.234 -0.235
(0.1873) (0.1526) (0.1526)
FIELD_PHA -0.956*** -1.272*** -1.263***
(0.1783) (0.1405) (0.1406)
FIELD_ECO 0.202 -0.214*** -0.214***
(0.1355) (0.0733) (0.0734)
FIELD_LAW 0.434*** -0.00923 -0.0110
(0.1647) (0.1184) (0.1185)
FIELD_ENG -0.367*** -0.759*** -0.762***
(0.1424) (0.0959) (0.0961)

129
FIELD_HUM 0.523*** 0.0659 0.0743
(0.1503) (0.0813) (0.0813)
FIELD_MED 0.440*** 0.0179 0.0129
(0.1659) (0.0982) (0.0983)
FIELD_PSYCH 0.117 -0.328*** -0.332***
(0.1540) (0.0814) (0.0815)
PHD 0.539*** 0.550*** 0.535***
(0.1547) (0.1575) (0.1578)
AV_MARK 0.113** 0.108**
(0.0493) (0.0493)
DEG_MARK 0.0148*** 0.0145***
(0.0044) (0.0044)
OCC_FATH_EN
T
-0.0696
(0.0437)
EDU_PAR_DEG -0.125**
(0.0556)
_cons -0.952*** -0.933*** -1.205* -2.413** -2.149**
(0.0669) (0.0707) (0.7030) (0.9539) (0.9580)
Pseudo R2
0.1654 0.1691 0.2083 0.2108 0.2123
N 18045 18034 6219 6065 6065
Standard error in parenthesis
* Significant at 10%
**Significant at 5%
*** Significant at 1%

130
Table 9 - Probit model with WA measure for overeducation as dependent variable. Marginal effects
(1) (2) (3) (4) (5) SOC_Overed SOC_Overed SOC_Overed SOC_Overed SOC_Overed
IND_AGRIC 0.671*** 0.656*** 0.988*** 1.027*** 1.022***
(0.0922) (0.0925) (0.1746) (0.1789) (0.1790)
IND_PRINT 1.113*** 1.121*** 0.850*** 0.842*** 0.847***
(0.1006) (0.1007) (0.1848) (0.1853) (0.1854)
IND_ENERGY 0.158*** 0.167*** 0.470*** 0.455*** 0.454***
(0.0604) (0.0606) (0.1234) (0.1244) (0.1245)
IND_CHEM 0.191*** 0.191*** 0.765*** 0.769*** 0.769***
(0.0628) (0.0629) (0.1380) (0.1401) (0.1401)
IND_MET 0.486*** 0.481*** 0.840*** 0.850*** 0.849***
(0.0504) (0.0507) (0.1017) (0.1033) (0.1033)
IND_ELECT 0.130 0.133* 0.364** 0.322* 0.322*
(0.0800) (0.0803) (0.1836) (0.1856) (0.1857)
IND_OTHMAN 0.676*** 0.663*** 0.934*** 0.910*** 0.906***
(0.0592) (0.0593) (0.1125) (0.1143) (0.1143)
IND_CONSTR 0.105* 0.0997* 0.353*** 0.355*** 0.351***
(0.0553) (0.0555) (0.1091) (0.1108) (0.1109)
IND_TRADE 0.458*** 0.439*** 1.118*** 1.114*** 1.109***
(0.0451) (0.0452) (0.0927) (0.0940) (0.0941)
IND_TRANSP 0.909*** 0.904*** 1.026*** 1.044*** 1.046***
(0.0805) (0.0808) (0.1459) (0.1485) (0.1486)
IND_COMM 0.967*** 0.988*** 0.933*** 0.928*** 0.928***
(0.0630) (0.0631) (0.1169) (0.1181) (0.1181)
IND_FIN 0.758*** 0.746*** 0.832*** 0.812*** 0.812***
(0.0486) (0.0487) (0.0942) (0.0952) (0.0952)
IND_OTHCONS -0.390*** -0.414*** -0.161 -0.176* -0.180*
(0.0509) (0.0510) (0.0995) (0.1010) (0.1010)
IND_INFOR 0.757*** 0.760*** 1.185*** 1.196*** 1.196***
(0.0557) (0.0558) (0.1183) (0.1219) (0.1219)

131
IND_BUS_SERV 0.776*** 0.763*** 0.955*** 0.929*** 0.927***
(0.0625) (0.0626) (0.1129) (0.1151) (0.1151)
IND_PUB 0.450*** 0.421*** 0.257*** 0.245*** 0.246***
(0.0488) (0.0492) (0.0853) (0.0870) (0.0870)
IND_EDU_RES -0.469*** -0.493*** -0.238*** -0.242*** -0.241***
(0.0432) (0.0433) (0.0836) (0.0850) (0.0850)
IND_HEAL -0.0991** -0.126*** 0.161* 0.160* 0.160*
(0.0416) (0.0418) (0.0885) (0.0898) (0.0898)
IND_CULT 1.046*** 1.041*** 0.772*** 0.782*** 0.782***
(0.0667) (0.0668) (0.1107) (0.1123) (0.1123)
IND_OTH_SERV 0.480*** 0.463*** 0.355*** 0.350*** 0.349***
(0.0517) (0.0518) (0.0908) (0.0921) (0.0921)
SELF_EMPL -0.676*** -0.690*** -0.546*** -0.548*** -0.549***
(0.0280) (0.0282) (0.0515) (0.0524) (0.0525)
NONSTD_CON 0.294*** 0.297*** 0.0266 0.0145 0.0110
(0.0937) (0.0939) (0.2142) (0.2147) (0.2148)
OTH_NONSTD -0.450*** -0.448*** -0.238** -0.241** -0.241**
(0.0519) (0.0520) (0.0971) (0.0985) (0.0986)
FIX_CON -0.545*** -0.540*** -0.0849 -0.0682 -0.0668
(0.0959) (0.0961) (0.2176) (0.2181) (0.2182)
FULL_TIME -0.140*** -0.124*** -0.217*** -0.232*** -0.233***
(0.0257) (0.0259) (0.0468) (0.0477) (0.0478)
SEX -0.0148 -0.00741 0.0483 0.0562 0.0588*
(0.0186) (0.0187) (0.0343) (0.0353) (0.0354)
AREA_NW -0.0751*** -0.0943** -0.0818* -0.0856*
(0.0255) (0.0440) (0.0449) (0.0451)
AREA_SOU 0.131*** 0.212*** 0.217*** 0.217***
(0.0296) (0.0498) (0.0506) (0.0506)
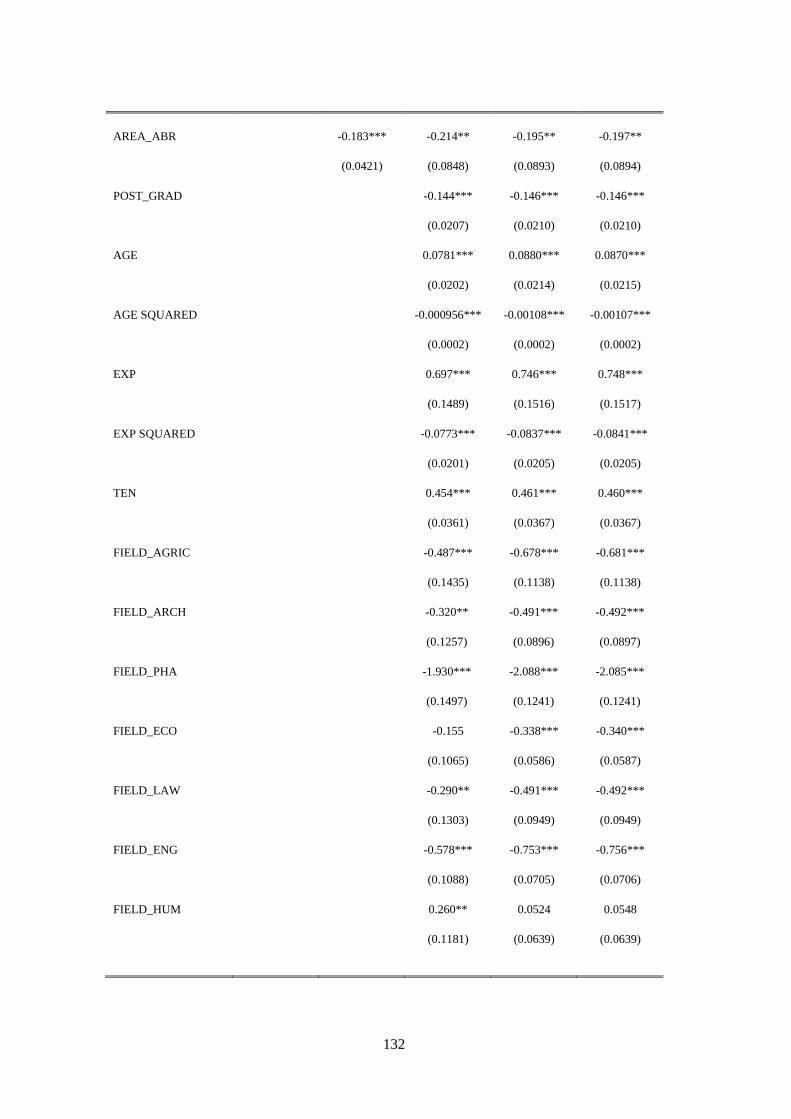
132
AREA_ABR -0.183*** -0.214** -0.195** -0.197**
(0.0421) (0.0848) (0.0893) (0.0894)
POST_GRAD -0.144*** -0.146*** -0.146***
(0.0207) (0.0210) (0.0210)
AGE 0.0781*** 0.0880*** 0.0870***
(0.0202) (0.0214) (0.0215)
AGE SQUARED -0.000956*** -0.00108*** -0.00107***
(0.0002) (0.0002) (0.0002)
EXP 0.697*** 0.746*** 0.748***
(0.1489) (0.1516) (0.1517)
EXP SQUARED -0.0773*** -0.0837*** -0.0841***
(0.0201) (0.0205) (0.0205)
TEN 0.454*** 0.461*** 0.460***
(0.0361) (0.0367) (0.0367)
FIELD_AGRIC -0.487*** -0.678*** -0.681***
(0.1435) (0.1138) (0.1138)
FIELD_ARCH -0.320** -0.491*** -0.492***
(0.1257) (0.0896) (0.0897)
FIELD_PHA -1.930*** -2.088*** -2.085***
(0.1497) (0.1241) (0.1241)
FIELD_ECO -0.155 -0.338*** -0.340***
(0.1065) (0.0586) (0.0587)
FIELD_LAW -0.290** -0.491*** -0.492***
(0.1303) (0.0949) (0.0949)
FIELD_ENG -0.578*** -0.753*** -0.756***
(0.1088) (0.0705) (0.0706)
FIELD_HUM 0.260** 0.0524 0.0548
(0.1181) (0.0639) (0.0639)

133
FIELD_MED -0.140 -0.313*** -0.313***
(0.1225) (0.0681) (0.0681)
FIELD_PSYCH -0.0571 -0.259*** -0.264***
(0.1153) (0.0582) (0.0583)
PHD 0.251** 0.281*** 0.286***
(0.1044) (0.1069) (0.1069)
AV_MARK 0.101*** 0.101***
(0.0367) (0.0367)
DEG_MARK 0.00571* 0.00560*
(0.0032) (0.0032)
OCC_FATH_ENT 0.0340
(0.0324)
EDU_PAR_DEG -0.0529
(0.0413)
_cons -0.152*** -0.177*** -3.026*** -3.791*** -3.762***
(0.0443) (0.0472) (0.5022) (0.6753) (0.6776)
Pseudo R2
0.1433 0.1467 0.2187 0.2215 0.22217
N 25155 25131 9139 8912 8912
Standard error in parenthesis
* Significant at 10%
**Significant at 5%
*** Significant at 1%

134
Table 10 - Bivariate probit model with WA measure for overeducation as dependent variable
OVERED SOC_Overed
POST_GRAD -0.143*** -0.172*** (0.0251) (0.0322) AGE 0.0981*** -0.0264 (0.0266) (0.0307) AGE_SQUARED -0.00108*** 0.000382 (0.0003) (0.0004) EXP 0.737*** 0.370* (0.1862) (0.2066) EXP SQUARED -0.0847*** -0.0431 (0.0251) (0.0276) TEN 0.501*** -0.0469 (0.0459) (0.0511) FIELD_AGRIC -0.573*** 0.669*** (0.1682) (0.1761) FIELD_ARCH -0.169 0.197
(0.1790) (0.1927)
FIELD_PHA -2.103*** -0.856***
(0.1799) (0.1857)
FIELD_ECO -0.269** 0.222 (0.1299) (0.1378) FIELD_LAW -0.409*** 0.435***
(0.1554) (0.1671) FIELD_ENG -0.652*** -0.317**
(0.1335) (0.1454) FIELD_HUM 0.135 0.493***
(0.1436) (0.1531) FIELD_MED -0.189 0.415**
(0.1558) (0.1697) FIELD_PSYCH -0.294** 0.0814
(0.1432) (0.1562)
SEX 0.0448 -0.151*** (0.0434) (0.0467)
PHD 0.443*** 0.543*** (0.1353) (0.1584) IND_AGRIC 1.112*** 1.482*** (0.2040) (0.2028) IND_PRINT 0.784*** 0.0427 (0.1961) (0.2264) IND_ENERGY 0.433*** 0.893*** (0.1451) (0.1656) IND_CHEM 0.801*** 0.865*** (0.1603) (0.1733) IND_MET 0.837*** 0.993*** (0.1244) (0.1437) IND_ELECT 0.252 0.603** (0.2141) (0.2461) IND_OTHMAN 0.848*** 0.837*** (0.1341) (0.1479) IND_CONSTR 0.399*** 0.925*** (0.1517) (0.1726) IND_TRADE 1.105*** 1.150***
(0.1112) (0.1240)
IND_TRANSP 0.939*** 0.975***
(0.1876) (0.1891)
IND_COMM 0.886*** 0.173

135
(0.1352) (0.1548)
IND_FIN 0.678*** 1.244*** (0.1166) (0.1343) IND_OTHCONS -0.225* -0.136
(0.1152) (0.1478)
IND_INFOR 1.222*** 0.327** (0.1409) (0.1663) IND_BUS_SERV 0.895*** 0.871*** (0.1362) (0.1475) IND_PUB 0.0439 0.212 (0.1074) (0.1305) IND_EDU_RES -0.293*** -0.410*** (0.1060) (0.1343) IND_HEAL 0.0483 0.182 (0.1115) (0.1352) IND_CULT 0.627*** 0.525*** (0.1435) (0.1553) IND_OTH_SERV 0.292** 0.202 (0.1229) (0.1476) SELF_EMPL -0.566*** -0.633*** (0.0634) (0.0733) NONSTD_CON -0.0469 0.443* (0.2529) (0.2528) OTH_NONSTD -0.438*** -0.331** (0.1258) (0.1413) FIX_CON -0.0161 -0.496* (0.2574) (0.2590) FULL_TIME -0.210*** -0.212***
(0.0599) (0.0639) AV_MARK 0.146*** 0.107**
(0.0450) (0.0492) DEG_MARK 0.00892** 0.0151***
(0.0038) (0.0044) OCC_FATH_ENT 0.0498 -0.0782*
(0.0395) (0.0437) EDU_PAR_DEG -0.0603 -0.119**
(0.0498) (0.0554) _cons -4.643*** -2.736***
(0.8418) (0.9595) athrho 0.371***
(0.0278) N 6065 6065
Wald χ2 2420.69
Log-likelihood -5710.56
Standard error in parenthesis
* Significant at 10%
**Significant at 5%
*** Significant at 1%

136
Table 11 - Heckman selection model with natural logarithm of net monthly wage as dependent
variable; overeducation measured as JA
(1) (2) (3)
lnW lnW lnW
SOC_Overed -0.0827*** -0.0819*** -0.0801***
(0.0130) (0.0131) (0.0131)
EXP 0.00177 -0.0174 -0.0167
(0.0685) (0.0692) (0.0690)
EXP SQUARED 0.00481 0.00746 0.00739
(0.0091) (0.0092) (0.0092)
TEN 0.0617*** 0.0597*** 0.0596***
(0.0132) (0.0133) (0.0133)
SEX 0.169*** 0.164*** 0.164***
(0.0138) (0.0139) (0.0140)
AREA_NW 0.0536*** 0.0521*** 0.0503***
(0.0159) (0.0160) (0.0160)
AREA_SOU -0.121*** -0.121*** -0.120***
(0.0239) (0.0242) (0.0242)
AREA_ABR 0.440*** 0.428*** 0.424***
(0.0339) (0.0341) (0.0341)
SELF_EMPL 0.778*** 0.779*** 0.775***
(0.1064) (0.1066) (0.1061)
PERM_CONTR 0.889*** 0.888*** 0.889***
(0.1042) (0.1042) (0.1037)
TRAIN_CONTR 0.775*** 0.776*** 0.775***
(0.1071) (0.1071) (0.1066)
NONSTD_CONT 0.632*** 0.633*** 0.636***
(0.1318) (0.1314) (0.1312)
NONSTD_SELF 0.644*** 0.644*** 0.644***
(0.1083) (0.1086) (0.1081)
OTH_NONSTD 0.525*** 0.537*** 0.532***
(0.1215) (0.1211) (0.1206)
FIX_CON 0.194** 0.192** 0.189**
(0.0827) (0.0820) (0.0823)
IND_PRINT 0.0979 0.0979 0.0974
(0.0646) (0.0658) (0.0658)
IND_ENERGY -0.205*** -0.203** -0.202**
(0.0793) (0.0794) (0.0790)
IND_CHEM 0.142*** 0.169*** 0.165***
(0.0382) (0.0322) (0.0325)
IND_MET 0.176*** 0.174*** 0.172***
(0.0275) (0.0279) (0.0280)
IND_ELECT 0.128*** 0.124*** 0.124***
(0.0248) (0.0252) (0.0251)
IND_OTHMAN 0.0977** 0.0956* 0.0905*
(0.0497) (0.0496) (0.0492)
IND_FIN 0.122*** 0.121*** 0.119***
(0.0256) (0.0255) (0.0255)
IND_INFOR 0.0839* 0.0846* 0.0834*
(0.0452) (0.0452) (0.0453)
FIELD_AGRIC -0.0951* -0.0930* -0.0954*
(0.0528) (0.0534) (0.0533)
FILD_ECO -0.0273 -0.0352 -0.0355
(0.0577) (0.0597) (0.0593)
FIELD_SPO 0.116*** 0.121*** 0.120***
(0.0387) (0.0398) (0.0397)
FIELD_ENG 0.146*** 0.145*** 0.141***
(0.0328) (0.0331) (0.0331)
FIELD_HUM -0.158** -0.159** -0.158**
(0.0658) (0.0663) (0.0661)
FIELD_MED 0.00364 0.00469 0.00730
(0.0482) (0.0487) (0.0485)

137
FIELD _POL 0.00691 0.0144 0.0132
(0.0471) (0.0483) (0.0483)
FIELD _PSYCH 0.129*** 0.126*** 0.123***
(0.0330) (0.0332) (0.0332)
HSCH_MARK -0.000474 -0.000646 -0.000631
(0.0005) (0.0005) (0.0005)
REG_STUD -0.00321 -0.00279 -0.00227
(0.0067) (0.0070) (0.0069)
STUD_WORK 0.0316** 0.0320** 0.0324**
(0.0144) (0.0144) (0.0146)
COMP_SKIL 0.0106* 0.0106*
(0.0062) (0.0062)
OCC_FATH_ENT 0.0228*
(0.0121)
_cons 6.062*** 6.072*** 6.063***
(0.1706) (0.1735) (0.1733)
Occ_Heckit
EDU_PAR_DEG -0.180*** -0.176*** -0.181***
(0.0397) (0.0399) (0.0400)
POST_GRAD 0.0587*** 0.0593*** 0.0597***
(0.0226) (0.0226) (0.0226)
LIV_NW 0.260*** 0.263*** 0.264***
(0.0537) (0.0539) (0.0539)
LIV_NE 0.222*** 0.222*** 0.222***
(0.0491) (0.0494) (0.0493)
LIV_SOU -0.245*** -0.262*** -0.262***
(0.0551) (0.0556) (0.0555)
LIV_ISL -0.107 -0.127* -0.127*
(0.0689) (0.0696) (0.0696)
LIV_ABR -0.764*** -0.746*** -0.742***
(0.2398) (0.2398) (0.2398)
DEL_IND -0.167** -0.162** -0.162**
(0.0676) (0.0683) (0.0683)
CONS_JOB -0.113*** -0.107*** -0.107***
(0.0233) (0.0235) (0.0235)
MOTH -0.228*** -0.237*** -0.237***
(0.0513) (0.0518) (0.0517)
STUD_WORK 0.424*** 0.422*** 0.421***
(0.0458) (0.0463) (0.0463)
TRAINEESHIP -0.253*** -0.247*** -0.246***
(0.0484) (0.0487) (0.0488)
PHD -1.390*** -1.382*** -1.382***
(0.0943) (0.0945) (0.0945)
_cons 1.460*** 1.377*** 1.376***
(0.3832) (0.3881) (0.3879)
Field of study Yes Yes Yes
athrho
_cons -0.196*** -0.195*** -0.204***
(0.0558) (0.0548) (0.0562)
lnsigma
_cons -0.994*** -0.997*** -0.997***
(0.0188) (0.0188) (0.0190)
N 7408 7285 7285
Wald χ2 1474.99 1644.56 2291.39
Robust standard error in parenthesis
* Significant at 10%
**Significant at 5%
*** Significant at 1%

138
Table 12 - Heckman selection model with natural logarithm of net monthly wage as dependent
variable; overeducation measured as WA
(1) (2) (3)
lnW lnW lnW
OVERED -0.101*** -0.0989*** -0.0993***
(0.0097) (0.0098) (0.0098)
EXP -0.00962 -0.0272 -0.0258
(0.0544) (0.0551) (0.0551)
EXP SQUARED 0.00608 0.00844 0.00829
(0.0073) (0.0074) (0.0074)
TEN 0.0553*** 0.0537*** 0.0546***
(0.0104) (0.0105) (0.0105)
SEX 0.160*** 0.158*** 0.159***
(0.0108) (0.0109) (0.0109)
AREA_NW 0.0462*** 0.0448*** 0.0435***
(0.0102) (0.0103) (0.0103)
AREA_SOU -0.0933*** -0.0942*** -0.0916***
(0.0178) (0.0182) (0.0182)
AREA_ABR 0.452*** 0.443*** 0.439***
(0.0263) (0.0264) (0.0264)
SELF_EMPL 0.698*** 0.716*** 0.711***
(0.0870) (0.0884) (0.0881)
PERM_CONTR 0.848*** 0.866*** 0.867***
(0.0853) (0.0866) (0.0863)
TRAIN_CONTR 0.722*** 0.738*** 0.738***
(0.0871) (0.0885) (0.0881)
NONSTD_CONT 0.578*** 0.595*** 0.599***
(0.1033) (0.1042) (0.1039)
NONSTD_SELF 0.576*** 0.594*** 0.594***
(0.0881) (0.0895) (0.0892)
OTH_NONSTD 0.426*** 0.451*** 0.448***
(0.0970) (0.0980) (0.0976)

139
FIX_CON 0.196*** 0.197*** 0.193***
(0.0597) (0.0594) (0.0593)
IND_PRINT -0.142* -0.140* -0.139*
(0.0734) (0.0734) (0.0732)
IND_ENERGY 0.115*** 0.138*** 0.136***
(0.0306) (0.0264) (0.0265)
IND_CHEM 0.171*** 0.171*** 0.171***
(0.0224) (0.0227) (0.0226)
IND_MET 0.0908*** 0.0882*** 0.0881***
(0.0194) (0.0197) (0.0196)
IND_ELECT 0.0760* 0.0766* 0.0710*
(0.0423) (0.0423) (0.0420)
IND_OTHMAN 0.117*** 0.116*** 0.114***
(0.0204) (0.0204) (0.0202)
IND_FIN 0.0823*** 0.0807*** 0.0810***
(0.0144) (0.0145) (0.0145)
IND_INFOR 0.0963*** 0.0867*** 0.0869***
(0.0270) (0.0266) (0.0265)
FIELD_AGRIC -0.105*** -0.102*** -0.101***
(0.0373) (0.0372) (0.0370)
FILD_ECO 0.131*** 0.131*** 0.130***
(0.0140) (0.0141) (0.0141)
FIELD_SPO -0.136*** -0.143*** -0.141***
(0.0398) (0.0402) (0.0401)
FIELD_ENG 0.130*** 0.129*** 0.128***
(0.0172) (0.0174) (0.0174)
FIELD_HUM -0.112*** -0.110*** -0.110***
(0.0190) (0.0193) (0.0193)
FIELD_MED 0.228*** 0.231*** 0.232***
(0.0175) (0.0181) (0.0181)
FIELD _POL 0.0697*** 0.0731*** 0.0733***
(0.0130) (0.0129) (0.0129)

140
FIELD _PSYCH -0.233*** -0.238*** -0.237***
(0.0192) (0.0194) (0.0194)
HSCH_MARK -0.000774* -0.000924** -0.000881**
(0.0004) (0.0004) (0.0004)
REG_STUD -0.00974* -0.0110** -0.0107**
(0.0051) (0.0053) (0.0053)
STUD_WORK 0.0359*** 0.0388*** 0.0399***
(0.0112) (0.0112) (0.0112)
COMP_SKIL 0.00828* 0.00836*
(0.0049) (0.0049)
OCC_FATH_ENT 0.0195**
(0.0097)
_cons 6.293*** 6.283*** 6.262***
(0.1334) (0.1355) (0.1353)
Occ_Heckit
EDU_PAR_DEG -0.178*** -0.176*** -0.178***
(0.0364) (0.0366) (0.0366)
POST_GRAD 0.0365* 0.0366* 0.0367*
(0.0212) (0.0214) (0.0214)
LIV_NW 0.245*** 0.247*** 0.247***
(0.0493) (0.0496) (0.0496)
LIV_NE 0.201*** 0.205*** 0.204***
(0.0449) (0.0452) (0.0451)
LIV_SOU -0.262*** -0.279*** -0.280***
(0.0503) (0.0508) (0.0508)
LIV_ISL -0.201*** -0.213*** -0.213***
(0.0626) (0.0633) (0.0633)
LIV_ABR -0.905*** -0.886*** -0.885***
(0.2375) (0.2374) (0.2372)
DEL_IND -0.128*** -0.125*** -0.124***
(0.0468) (0.0474) (0.0474)
CONS_JOB -0.133*** -0.126*** -0.126***

141
(0.0211) (0.0212) (0.0212)
MOTH -0.229*** -0.238*** -0.238***
(0.0483) (0.0487) (0.0486)
STUD_WORK 0.423*** 0.423*** 0.422***
(0.0419) (0.0423) (0.0423)
TRAINEESHIP -0.338*** -0.335*** -0.334***
(0.0433) (0.0437) (0.0437)
PHD -1.180*** -1.168*** -1.168***
(0.0845) (0.0848) (0.0848)
_cons 1.680*** 1.602*** 1.605***
(0.3529) (0.3573) (0.3571)
Field of study Yes Yes Yes
athrho
_cons -0.186*** -0.179*** -0.183***
(0.0459) (0.0444) (0.0444)
lnsigma
_cons -1.015*** -1.017*** -1.018***
(0.0154) (0.0153) (0.0154)
N 9594 9395 9395
Wald χ2 2158.02 2420.68 3423.37
Robust standard error in parenthesis
* Significant at 10%
**Significant at 5%
*** Significant at 1%

142
Table 13 - Bivariate probit model with WA measure for overeducation (OVERED) as dependent
variable and Wage (lnW) as an explanatory variable
(1) (2)
OVERED SOC_Overed
lnW -0.411*** -0.141
(0.1126) (0.1279)
AV_MARK 0.224** 0.0132
(0.0954) (0.1022)
SCHOLARSHIP -0.207** 0.0221
(0.0912) (0.0992)
ENG_S 0.156** -0.0224
(0.0756) (0.0835)
ENG_W -0.195** -0.0770
(0.0790) (0.0856)
POST_GRAD -0.248*** -0.291***
(0.0614) (0.0837)
FIELD_AGRIC -0.649** 0.801**
(0.2816) (0.3119)
FIELD_ARCH -0.675** -0.0757
(0.3286) (0.3806)
FIELD_PHA -2.030*** -0.771**
(0.3079) (0.3300)
FIELD_LAW -0.930*** 0.352
(0.2993) (0.3327)
FIELD_ENG -0.756*** -0.177
(0.2252) (0.2579)
FIELD_EDU 0.467 -2.300*
(1.0077) (1.1775)
FIELD_HUM 0.134 0.575*
(0.2752) (0.3074)
FIELD_LAN 0.100 0.709**
(0.2885) (0.3228)
FIELD_MED -0.923** -0.00103
(0.4147) (0.5249)
FIELD_POL 0.201 0.557**
(0.2406) (0.2655)
FIELD_PSYCH -0.507** 0.284
(0.2520) (0.2885)
SEX 0.181* -0.0485
(0.0971) (0.1058)
PHD 0.909*** 1.174***
(0.2850) (0.3498)
SELF_EMPL -0.564*** -0.789***
(0.1241) (0.1490)

143
TRAIN_ CON 0.295 0.675***
(0.2150) (0.2042)
IND_AGRIC 1.170*** 1.193***
(0.4032) (0.4272)
IND_ENERGY 0.582** 0.807***
(0.2260) (0.2823)
IND_CHEM 0.586** 0.826***
(0.2589) (0.3000)
IND_MET 0.819*** 1.178***
(0.2028) (0.2501)
IND_ELECT -0.0944 0.851**
(0.3635) (0.4065)
IND_OTHMAN 0.893*** 1.023***
(0.2264) (0.2619)
IND_CONSTR 0.580** 1.174***
(0.2571) (0.3113)
IND_TRADE 1.126*** 1.289***
(0.1933) (0.2268)
IND_TRANSP 0.275 0.684*
(0.3001) (0.3528)
IND_COMM 0.676*** 0.377
(0.2252) (0.2734)
IND_FIN 0.616*** 1.457***
(0.2024) (0.2472)
IND_OTHCONS -0.0313 0.274
(0.2199) (0.2733)
IND_INFOR 1.293*** 0.759***
(0.2336) (0.2859)
IND_BUS_SERV 1.025*** 1.095***
(0.2260) (0.2574)
IND_PUB 0.283 1.041***
(0.2389) (0.2794)
IND_EDU_RES -0.582*** -0.349
(0.2176) (0.2878)
IND_CULT 0.860*** 1.153***
(0.2819) (0.2991)
IND_OTH_SERV 0.569** 0.396
(0.2276) (0.2831)
athrho 0.332***
(0.0555)
N 1549 1549

144

145
Overeducation in the Italian labour market: clarifying the concepts
and addressing the measurement error problem
Luca Cattani
Department of Economics, University of Bologna
Abstract. The present essay introduces a new measurement of overeducation based onto the SOC(HE)-
Italy classification in an attempt to address the measurement error problem recently highlighted by the
relevant economic literature. Applying the new measure, which has been presented and validated in the
first essay of the present thesis, I run an analysis of possible determinants of overeducation in which Italy
is confirmed to represent an exception to the generally accepted theory of differential qualification. Thus,
I attempt the first application ever of the ORU model the whole Italian labour force using Istat RCFL
data. Furthermore, basic concepts such as overqualification and overskilling are discussed and the
relevant economic literature on overeducation is reviewed to clarify the conceptual basis of such
definitions.
JEL classification: I2, J31
Key words: overeducation, overqualification, wage differentials
Acknowledgments. This essay has been written relying on elaborations on data from the Istat survey on Italian
professions and from the Istat survey on the Italian labour force (RCFL): elaborations on these data have been
run under my responsibility. Usual disclaimers apply.

146

147
Introduction
Educational mismatch constituted a major source of concern for both policy makers and
analysts since the education expansion of the 1960s. On the one hand, first evidences on
falling returns to education (Berg, 1970; Freeman, 1976) were interpreted as both an
oversupply of skilled labour or an overinvestment in education. On the other hand, Skill-
Biased Technical Change (SBTC) and skill obsolescence threatened to increase wage
inequalities (as in fact they did) as the accelerating rate of technological progress tended to
favour skilled workers over the unskilled (Acemoglou, 1992). As graduates continued to
enter the labour markets in ever higher numbers during the 1980s, the idea that the
increasing supply of highly qualified labour was overtaking the increase of its relative
demand gained popularity and attracted much attention thanks to a simple equation model
introduced by the seminal work by Duncan and Hoffman (1981). Since then, the analysis of
the returns to education focused on this particular type of educational mismatch generating a
wide set of definitions, taxonomies, measures and estimation methods. While the definition
of this particular phenomenon experienced a beneficial stabilization thanks to continuous
and active reviews of the relevant literature on the topic (Hartog, 2000; Green et al., 2002;
McGuinness, 2006; Cedefop, 2010; Leuven and Oosterbeek, 2012), a number of theoretical
and operational issues concerning the measurement of overeducation and the estimation of
its wage effects are still to be addressed. This essay explores the most relevant measurement
issues trying to address them by applying the SOC(HE)-Italy classification to whole Italian
labour force. This last circumstance represents novelty on its own. In fact, little research has
focused on overeducation in Italy so far and when it has done so it has often focused solely
on graduates. First studies on overeducation in Italy were carried out as late as the mid-
2000s and the majority of them aimed at comparing the earnings of graduates employed in
appropriate jobs and those of graduates hired in less demanding ones. Based on data
collected by Istat and AlmaLaurea for the relative surveys on graduates’ career paths, these
studies adopt a much criticized estimation method that focuses on wage penalties associated
with having excess education and thus neglecting to assess the returns to required and deficit
schooling. The present essay tries to address the measurement error problem, leaving
estimation issues to further research in such field. Nonetheless and as far as measurement is
concerned, estimates on wage effects of overeducation as defined with the SOC(HE)-Italy
are here presented to provide a baseline for further improvements in estimation methods and
identification issues. Paragraph §1 introduces and discusses different definitions and
measurements of overeducation, paragraph §2 examines some theoretical issues and their
relations to labour market theories. Different estimation methodologies are presented in

148
paragraph §3, along with references to the Italian case. The new measurement of
overeducation based onto the SOC(HE)-Italy classification is also introduced in pragarph §3
and estimates on wage effects and possible determinants based on this measurement are
reported in paragraphs §4 and §5.
1. Measurement issues
When trying to define overeducation, the first issue one has to cope with consists in
choosing the relevant dimension of educational mismatch we want to analyse. In fact,
overeducation is usually assessed by interviewing employees directly and this assessment
rarely refers to objective qualitative analysis of the constituent tasks and duties associated
with a particular job. As argued later on in this paragraph, workers’ self-assessment
measures (WA) is capable to introduce biases in the estimation due to the fact that workers
may tend to systematically overstate or understate their job positions or their bundle of
human capital according to the different formulations of the questions. However, there could
be a potential and additional source of measurement error in case the question has been
ambiguously formulated: confusing vertical mismatch with its horizontal counterpart.
Questions such as ‘Is your educational title required for a job like yours?’ may refer to both
employers’ hiring standards (requirements to get the job) or the knowledge and skills
needed to carry out the assigned duties (requirements to do the job). Additionally, workers
could tend to refer to their specific field of studies and state to be overeducated, thus
neglecting the linking between the tasks and duties associated with their job and the broader
level of general knowledge and skills acquired in the education system. Leuven and
Oosterbeek (2012) brilliantly reviewed the most frequent questions onto which scholars and
analysts have built their overeducation measures, pointing out how different studies on the
overeducation have sometimes measured different concepts: recruitment standards based on
formal educational titles, recruitment standard based on informal or vocational training,
minimum competences requirements and best competences requirements. As differences in
operational definitions could prove to be far less than trivial and lead to biases, it could be
salutary to remind the theoretical concepts from which they stemmed in order ensure a
minimum level of reliability and validity of such measures.

149
1.1 Definitions
Horizontal mismatch refers to employment realizations in which the educational title held
by the employee matches the level of knowledge and skills required to competently perform
his/her particular job but do not match the relevant field of knowledge. Vertical mismatch,
on the other hand, is when the educational title matches the relevant field of knowledge but
it is inappropriate with respect to the level of such knowledge. As far as overeducation is
concerned, vertical mismatch is the only relevant dimension to take into account and a
measure intended to capture both its incidence and its wage effect should be consistent with
this choice in order to be valid and reliable. As argued later on in this essay, WA measure
are not always consistent with this need.
When comparing the different levels of educational attainments and job requirements,
overeducation and undereducation are usually measured in years of schooling. Thus, the
estimates of their wage effects are to be interpreted as returns to a single year of excess or
deficit schooling respectively. Verdugo and Verdugo (1989) proposed a different estimation
method I will discuss in paragraph §3 in which overeducation and undereducation were
defined and measured in terms of qualifications with dummy variables accounting for being
matched, overequalified or underqualified. Many studies (examples are Sloane et al., 1999;
Allen and van der Velden, 2001; Sloane, 2003; Di Pietro and Urwin, 2006; Green and
McIntosh, 2007; Brynin and Longhi, 2009; Green and Zhu, 2010) were based, especially in
the European context, on such measures alternatively and confusingly labelled as either
overeducation and overqualification. Furthermore, these studies were often focused on
graduates only, thus neglecting educational mismatches occurring at any other level in the
labour force. In most cases this different focus was intentional and explicit. However, it is
important to stress how assessing returns to additional years of schooling in the whole
labour force and assessing wage penalties for graduates employed in non-graduate jobs are
two extremely different things. An additional source of ambiguity is represented by the
concept of overskilling. In its first two formulations (Allen and van der Velden, 2001;
Chevalier, 2003), this concept was referred to personal and often unobservable
characteristics, such as ability. Overeducated workers may differ from matched workers in
that they are less skilled and, consequently, not all overeducated workers are necessarily
overskilled as well. As pointed out by Leuven and Oosterbeek (2012), this concept was
suitable to account for unobservable heterogeneity among workers thus addressing a major
identification problem affecting Duncan and Hoffman’s model. Unfortunately, in recent
studies the term ‘overskilling’ has come to cover a much less striking fact: that overeducated

150
graduates do not use all the skills they acquired during their Higher Education (HE) courses.
Studies like that of Di Pietro and Urwin (2003) present ‘overeducation’ and ‘overskilling’ as
separate concepts while actually they aren’t. Education and skills mismatch measures were
in fact obtain respectively from questions like “With respect to your current job, do you feel
that having a university degree is excessive, adequate or insufficient?” and “Please indicate
the extent to which you make use of the knowledge and skills acquired at university in your
current job”. Not surprisingly, their measure for overskilling is not significantly different
from nil when controlling for overeducation. In fact, these operationalizations account, at
best, for having too much education to get and to do a particular job. In my view, stressing
in this way a theoretical difference between concepts like ‘overeducation’, ‘overskilling’ or
‘overqualification’ is neither possible nor useful. The concept of overeducation is a much
broader one and, in fact, it encompasses all of the possible dimensions: knowledge,
qualification and skills acquired via formal education and training. The term
‘overqualification’ could be only useful whether conventionally adopted to label a sub-field
of the overeducation literature aiming at assessing wage penalties for overeducated
graduates. ‘Overskilling’, on the contrary, should be purified by eradicating any possible
reference to skills acquired via HE (also present in Green and McIntosh, 2007) and only
devoted to correct for unobserved heterogeneity between individuals.
1.2 Measurements
Measures of overeducation can be only obtained by comparing the educational attainments
of a job post holder and the educational requirements of that particular job. In the ideal
measure for overeducation these educational attainments account for both knowledge and
skills acquirable via either formal education and vocational training. Additionally, they must
not relate to working experience, unobserved ability or recruitment standards as these are
different dimensions to be separately estimated and interpreted. In fact, recruitment standard
and the to get overeducation may account for credentialism/qualification inflation/grade
drift.
a. Realized matches
In the article with which Verdugo and Verdugo (1989) introduced their much criticized
alternative estimation method for returns to schooling, the required education level was
151
inferred from the existing market realizations: the mean educational attainment of workers
employed in a particular profession. Even without in-depth discussions on the construction
of this measurement, it is reasonable to consider it as inadequate as realized matches
account for both demand and supply factors by definition.
b. Workers’ self-assessment (WA)
As noted above, asking directly to workers to assess job requirements associated with their
job posts could lead to crucial misunderstandings and biases. First, the way in which the
question is formulated in the interview could lead to measure much different things:
recruitment standards based on formal educational titles, recruitment standard based on
informal or vocational training, minimum competences requirements and best competences
requirements. Second, workers could misunderstand the question and report they are
overeducated because the field of study of their educational path is different from the
relevant field of knowledge of their job activities, thus neglecting the relevant dimension of
skill levels. Third, as noted by a number of consistent literature reviews (Hartog, 2000;
Green et al., 2002; McGuinnes, 2006; Leuven and Oosterbeek, 2012) workers’ self-
assessment often leads to measurement error if respondents tend to overstate their job
positions. Moreover, WA is not available for most labour force surveys.
c. Job analysis (JA)
The direct linking between knowledge and skills imparted via education and knowledge and
skills encapsulated in tasks and skills of a particular job can be objectively assessed by
experts or referring to official occupational classification and job dictionaries. These last
classifications, in fact, embody the conceptual basis of Isco88 and rank jobs according to
their particular level of skills. According to Hartog (2000) this is virtually the best measure
for job requirements but its utilisation is limited by the fact that up-to-date dictionaries and
classifications are available only for specific years while letting a team of expert ranks job
requirements would be much more expansive than relying on already available dataset built
with WA. Furthermore, in the specific case one would rely on official occupational
classification, there is an additional issue to be taken into account: classifications based onto
Isco88 do rank jobs according to their skill level but this skill level do not accounts for
education and training only. This is in fact determined by three dimensions: the nature of the

152
work, the required formal education and the needed informal training or working
experience. Formal education and training are neither the only possible measures for the
level of skill of a particular job nor the most important two:
“The concept of skill level is applied […] living more emphasis to the first of
these operational measures, the nature of the work perfomed, than to the formal
and informal education and training requirements.” (ILO, 2012)
This is why further assessment made by experts is needed and this is why overeducation is
measured in this essay utilising the SOC(HE)-Italy classification for occupations. This
classification, in fact, was constructed to directly link knowledge and skills requirements to
a specific educational qualification. Before introducing such classification and proceed to
estimate the wage effects, a brief overview on the relevant findings and their theoretical
interpretations is required.
2. Theoretical issues
Overeducation has been interpreted in several ways, not all of which consistent with the
others. Before the introduction of Duncan and Hoffman’s model, the gradient of
interpretation and theoretical underpinnings was even larger. On the one hand, concerns on
the falling returns to education suggested the presence of an overinvestment in such sector.
According to this view, governments had to cut subsidies or at least limit the access to the
tertiary education, which sounded a little bit too draconian. On the other hand, credentialism
was pointed out as the principal factor to blame along with the necessity to sustain the
increase in number of more demanding jobs. However, the introduction of the mentioned
model didn’t put out the debate. A shift occurred in the level of analysis, from the aggregate
measures to the micro ones. Freeman’s study on the mean college premum was overcome
by Duncan and Hoffman’s model, termed ORU as it provided estimates for the effects on
wages of Over, Required and Under education at the individual level. This model can be
better understood if derived from Mincer’s wage equation where wages are determined by
the total amount of schooling years a workers has completed.

153
Where is the number of schooling years and represents other explanatory variables
such as work experience. The ORU model basically decomposes attained schooling into
required ( ), surplus (
) and deficit ( ) years.
Although no theory on such effects has gained general agreement, still there is a number of
facts with potential theoretical implications reckoned by a vast majority of studies. These
facts were highlighted by a huge review by Hartog (2000) and some of them held the meta-
analysis carried out by Leuven and Oostebeek (2012)23
.
a. When running estimates with the ORU model and estimates with Mincer’s equation on
the same data, regressors associated with required schooling in the first one are higher
than those associated with attained schooling in the second one;
b. Returns to excess years of education are positive and statistically significant from nil;
c. Returns to excess years of education are lower than those to required ones. The gradient
of the proportions varies between one half and one third but the meta-analysis run by
Leuven and Oosterbeek, consisting in averaging the existing estimates, shows that
returns to overeducation are half of their counterparts;
d. Returns to undereducation are significantly different from zero and have negative sign.
As far as the absolute value is concerned, (negative) returns to undereducation are lower
than returns to required education. When comparing (negative) returns to
undereducation and returns to overeducation, the former ones are smaller than (Hartog,
2000) or equal to (Leuven and Oostebeek, 2012) the latter ones;
e. Regardless differences in the measurement methods exposed in subparagraph §1.2,
estimates of returns to required, excess and deficit years are broadly similar. This
circumstance alternatively raised doubts on the reliability of such measurements
(Hartog, 2000) and on the unbiasedness of such estimates (Battu et al., 2000;
McGuinness, 2006). The only work in my knowledge that has contradicted this
evidence has been written by Groot and Van den Brink (2000);
23
This last study do not claims results from estimates obtained in such model as representing causal
effects because of the above mentioned identification problems.

154
f. By imposing restrictions on the ORU model it is possible to test basic assumptions of
the human capital theory ( ) and of the job competition model (
). None of these has ever held such tests.
Although these last evidence, no consensus has been reached on the potential contradiction
between the existence of overeducation and the assumptions of the human capital theory. In
fact, overeducation could be a temporary phenomenon as young graduates accept non-
gradutes jobs that allow them to engage in on-the-job search (Gautier, 2002; Hornstein et
al., 2006; Dolado et al., 2009) or because they know they have higher probability to be
promoted (Sicherman and Galor, 1990). However, for many individuals overeducation is
persistent (Sicherman, 1990; Rubb, 2003). Another point of disagreement is represented by
the relation between working experience and overeducation. In Becker’s view formal and
informal human capital are substitutes: workers with less experience have less (informal)
human capital as they haven’t had the chance to accumulate it with on-the-job training.
Therefore, they are not overeducated as they lack human capital and they are paid less
because of their lower marginal productivity (Sicherman, 1991; Kiker et al, 1997).
Nonetheless, overeducation persistency contradicts this argument as well and evidences has
been brought against the idea that education and experience are treated as substitutes by
employers: returns to education and returns to experience are different (Duncan and
Hoffman, 1981; Groot, 1993). In addition, wage penalties associated with overeducation are
significant even when controlling for work experience (Ramirez, 1993; Dolton and
Vignoles, 2000; McGuinness, 2003; McGuinness, 2006). Finally, estimates of returns to
excess schooling years have been interpreted as a statistical artefact consisting in biases
determined by a lack of controls for unobserved heterogeneity between individuals.
McGuinness (2006) observes how
“[i]t is obvious from the results that the more poorly specified the model the
more upwardly biased the overeducation penalty will be. The results
demonstrates the importance of including job characteristics and some form of
ability heterogeneity control”
Unfortunately, unobservable ability is hard to measure by definition. Attempts to rely on
proxy measures for this dimension are about to be introduced in the next subparagraph but
what is important to stress here is that omitting such an important variable results in biases
which are potentially able to overtake the impact on wages of overeducation. This is
basically what I noted above when discussing overskilling and what prevented Leuven and
Oosterbeek (2012) to claim that estimates on returns to overeducation represent causal

155
relation. Strategies to overcome the omitted variable bias problem included the adoption of
instrumental variables (Dolton and Vignoles, 2000; Korpi and Tahlin, 2009) and fixed effect
estimates (Bauer, 2002; Korpi and Tahlin, 2009). Disappointingly, the identification of good
instruments proved to be virtually impossible while the postulated time-invariance of
unobserved characteristics in fixed effect models is unlikely to hold. This essay does not
introduce any of the mentioned strategies to overcome the omitted variable bias and it is
intended to address only the measurement error problem. However, estimates presented in
paragraph §4 benefit of a good degree of novelty as the ORU model has never been applied
to the wholw Italian labour force: all the existing studies have applied the Verdugo
specification (Di Pietro and Urwin, 2006; Cutillo and Di Pietro, 2006; Franzini and Raitano,
2009; Caroleo and Pastore, 2010; Ferrante et al., 2010; Aina and Pastore, 2012). These
studies relied onto WA measures for overeducation, which are not included in Istat survey
on the Italian labour force (RCFL) and the most of them focused their analysis on graduates
with data from either the specific AlmaLaurea or Istat surveys, where individuals can only
be overeducated. Two of these works (Franzini and Raitano, 2009; Aina and Pastore)
utilized Isfol-Plus data were non graduated workers are also included. In this dataset
however there are no measures for undereducation while overeducation is measured with a
dummy variable as in Verdugo.
2.1 Determinants
Estimations on returns to overeducation are only useful when it is possible to predict who is
more likely to be overeducated. As far as individual and social choices in investments in
education are concerned, it is crucial to understand what factor are capable to increase the
probability to be overeducated. At the individual level, the choice to engage in an additional
year of education could be heavily affected by the probability that this additional year will
pay less in terms of wage premium. At the social level, governments must know which type
of individuals are more likely to be overeducated and whether this higher probability does
not have only economic determinants. Suppose women with children are more likely to be
overeducated because the lack of nurseries and kindergarten forces them to accept only part-
time jobs, which are typically associated with overeducation: policy implication would
include more investments in children care. Unfortunately, there are no generally accepted
theories on overeducation determinants. However, there is a number of factors and
individual characteristics that are usually regarded as potential source of an higher
probability to be overeducated.

156
a. Differential overeducation
Women actually show higher propensity to be overeducated and the linking between having
children, being part-time worker and being overeducated was explicitly tested by Sloane et
al. (1999). Many works associated gender with other source of supply side rigidities such as
the lower propensity to commuting (McGoldrick and Robst, 1996; Green et al., 2002;
Buchel and Van Ham, 2003; Buchel and Battu, 2003). Another category of workers heavily
affected by overeducation is represented by immigrants, which may share with women a
lower propensity to commuting and could experience difficulties in speaking the host
country language (Green et al., 2007; Battu et al., 2004);
b. Age and work experience
As argued above, age and working experience are one of the dimensions on which the
theoretical debate has focused most intensively. The career mobility theory and the search
theory have proved to be in contradiction with evidences on the persistence of
overeducation for many individuals. Nonetheless, that the age and the work experience
decrease the probability to be overeducated has been assessed for all countries;
c. Ability
The idea that unobserved abilities can affect the probability to be overeducated is widely
acknowledged and reinforces the identification problems of the ORU model. This does not
mean that ability measures have always succeeded in explaining overeducation. Hartog and
Jonker (1996) found a positive but poorly significant relationship between IQ and
educational mismatches and relations were found between overeducation and quantitative
literacy (Green and McIntosh, 2007) and between this last one and undereducation (Hartog
et al., 1996). Finally, some evidences were found in support of a relation between
performances during school and overeducation (Green et al., 1999; Buchel and Pollmann-
Schult, 2001).
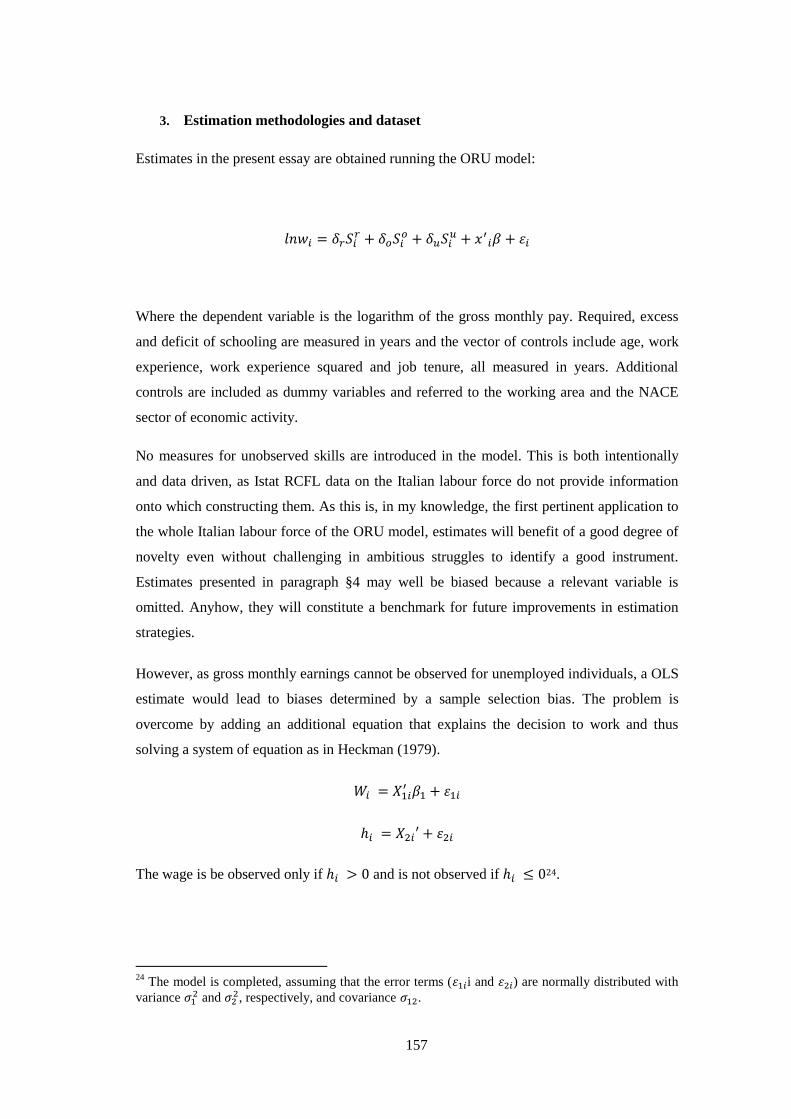
157
3. Estimation methodologies and dataset
Estimates in the present essay are obtained running the ORU model:
Where the dependent variable is the logarithm of the gross monthly pay. Required, excess
and deficit of schooling are measured in years and the vector of controls include age, work
experience, work experience squared and job tenure, all measured in years. Additional
controls are included as dummy variables and referred to the working area and the NACE
sector of economic activity.
No measures for unobserved skills are introduced in the model. This is both intentionally
and data driven, as Istat RCFL data on the Italian labour force do not provide information
onto which constructing them. As this is, in my knowledge, the first pertinent application to
the whole Italian labour force of the ORU model, estimates will benefit of a good degree of
novelty even without challenging in ambitious struggles to identify a good instrument.
Estimates presented in paragraph §4 may well be biased because a relevant variable is
omitted. Anyhow, they will constitute a benchmark for future improvements in estimation
strategies.
However, as gross monthly earnings cannot be observed for unemployed individuals, a OLS
estimate would lead to biases determined by a sample selection bias. The problem is
overcome by adding an additional equation that explains the decision to work and thus
solving a system of equation as in Heckman (1979).
The wage is be observed only if and is not observed if 24.
24
The model is completed, assuming that the error terms ( i and ) are normally distributed with
variance and
, respectively, and covariance .

158
The dataset
Istat surveys continuously over 250,000 families (more than 600,000 individuals) settled in
1,100 Italian municipalities. The survey is termed RCFL (Rilevazione Continua sulle Forze
di Lavoro) and aims at collecting and organizing relevant wage and occupational
information. Given that the overeducation measure adopted in the essay refers to the Italian
official occupational classification, it is worth noting that all the workers in the sample have
been allocated to a 3-digit level. The choice to analyze data referred to the year 2010 is
explained by adoption of a new classification in the following year. Restricting observations
to employed individuals with a valid occupational code resulted in selecting 58,190
individuals only: 34,156 males and 24,034 females.
3.1 The new measurement based onto the SOC(HE)-Italy classification
The adopted overeducation measure is based onto the SOC(HE)-Italy classification which
basically allocates each of the 800 Italian job titles to ‘graduate’ and ‘non graduate’ job
categories. In order to do so, it assigns a complexity score on a 1-100 point scale to 109
variables representing knowledges, skills and competences. The computation of this score is
based on data from the survey on Italian professions held by Istat and Isfol (the Italian
institute for vocational training) in 2006 on more than 16,000 workers. With this study, Isfol
assigned to each Italian profession an equivalent EQF level25
.
In order to select for each profession only those variables capable to represent tasks and
duties typically associated with that particular job, the average complexity score is
computed for each job title. Then, for a given job title I have selected only those variable
exceeding the mean of a standard deviation.
I constructed this classification under the supervision of Kate Purcell and Peter Elias (2013)
who developed the first version of SOC(HE) starting from the British national classification.
In this classification, jobs were referred to three clusters of competence identified in a
previous work (Purcell et al., 2004): knowledge expertise, knowledge orchestration and
knowledge communication. I have aggregated the selected variables referring to these three
clusters: the mean of the relevant variables for each cluster is adopted as the complexity
score of that cluster for that particular job. Then, borrowing from the Istat/Isfol
methodology that postulates a linear progression between EQF levl 2 and EQF level 7 I
25
The European Qualification Framework (EQF) is a transantional translation device for
qualifications. It is articulated in 8 levels to which all the European qualifications are referred.

159
translate such scores in equivalent EQF levels by running a simple proportion between the
two scales. The highest EQF score of the three clusters of competence comes to represent
the equivalent EQF level of the concerned job title.
As EQF ranks both graduate and non-graduate titles, the overeducation measure based on
SOC(HE)-Italy accounts for educational mismatches occurring at any level and does not
focus on graduates only. Moreover, both skills and knowledge are taken into account.
Finally, qualifications can be translated into schooling years to be compared to the attained
schooling years stated by workers. This is an important point as the conversion of job titles
into schooling years systematically lacked of an acceptable degree of consensus. Basing our
measure on EQF provides, at least, a translation device into schooling which is share, if not
by scholars, by all the European governments.
As this measure contains direct workers’ self-assessment of neither their job position nor job
requirements, it should contain no measurement error.
The validity and reliability of the utilization of the SOC(HE)-Italy classification have been
tested onto RCFL data in the first essay of this thesis.
4. The wage effect of overeducation on the Italian labour force
As most of the works devoted to analyze overeducation in Italy have focused onto graduates
only, there is little choice when trying to benchmark a measurement of overeducation in the
whole labour force. The only comparable measures, in that they have been computed on the
entire labour force, are basically two and not much dispersed: Franzini and Raitano (2009)
and Aina and Pastore (2012). Unfortunately, these estimates were obtained with a different
specification of the model, first proposed by Verdugo and Verdugo (1989). In this
specification, overeducation is operationalized as a dummy variable the effect on wages of
which is to be interpreted as the percentage differential between overeducated and matched
workers. By doing so, estimates have negative sign, implying that overeducated are
suffering a wage penalty compared to their counterparts. Consequently, these estimates
cannot be compared with the present ones. Still, there is always room for comparison with
overeducation facts listed in paragraph §2. Table 1 shows estimates of the ORU model.
< Insert Table 1 here >

160
First, all ORU estimates are significant. Returns to excess years of schooling are significant,
positive and lower than those to required one. Interestingly, returns to OS are lower than
expected: about one fourth of returns to RS instead of half of them.
Second, returns to undereducation are significant and have negative sign. Their value is in
line with pre-existing literature, about one half of returns to required schooling.
Controls for experience and experience squared are both significant but they show opposite
signs. This is also in line with the literature, postulating a positive but decreasing relation
between experience and productivity. Notably, returns to experience and returns to
overschooling are jointly significant thus confirming that they cannot be considered as
substitutes (Ramirez, 1993; Dolton and Vignoles, 2000; McGuinness, 2003; McGuinness,
2006) as Sicherman and Galor (1990) theorized.
Controls for gender, age and job tenure are significant and show the expected signs,
implying that males are paid more than females and that job tenure is rewarded. Notably,
age and working experience are jointly significant.
5. Determinants
In order to run the probit model, overeducation must be operationalized as a dummy
variable. Estimates of the effects on the probability to be overeducated are thus comparable
to those obtained in the works by Franzini and Raitano (2009) and Aina and Pastore (2012).
The effects of age, tenure and working experience are significant and show the expected
signs.
< Insert Table 2 >
The only relevant issue is the somewhat counterintuitive effect on the probability to be
overeducated of gender. In fact, males in the RCFL sample are more likely to be
overeducated. This evidence contradicts the vast majority of the studies that have worldwide
attempted to test the differential overeducation theory (Frank, 1978; Sloane et al., 1999;
McGoldrick and Robst, 1996; Green et al., 2002; Buchel and Van Ham, 2003; Buchel and
Battu, 2003). Interestingly, Franzini and Raitano (2009) found similar evidences while Aina
and Pastore (2012) found no relations between gender and overeducation. Italy could come
to represent an exception to this much consolidated evidence.
161
6. Conclusion
The overeducation literature has crossed three decades and yet has not come to a reasonable
degree of agreement concerning definitions, measurements and estimations methods. I have
discussed in this essay the major sources of disagreement regarding definitions and
measurements. Terms like overqualification and overskilling has been used alternatively and
sometimes confusingly enriching or overlapping the concept of overeducation. As far as the
valid and reliable measurement of this phenomen is concerned, these two terms should be
re-shaped to avoid dangerous misunderstandings. Overqualification, often associated with
studies that focus on graduates labour market, could be devoted to label such subfield of the
overeducation literature implying the use of dummy variables. Overskilling should be more
clearly defined avoiding confusing relations to skills imparted via formal education or
training. In its first formulation by Chevalier (2003), this concept concerned unobservable
abilities only and virtually shed lights onto the way out from one of the biggest unsolved
issues of the overeducation literature: the omitted variable bias. However, in most cases the
later adoptions have somehow distorted its original conceptual basis by referring to skills
and competences acquirable via formal education.
Additional sources of disagreement stemmed from several attempts to establish a standard in
operational measures of job requirements. I argued in this essay as measures based on
worker’s self-assessment (WA) contain biases and therefore cannot be considered as neither
valid nor reliable. I presented a new measure of overeducation, based onto the SOC(HE)-
Italy classification I presented and validated in the first essay of the present thesis. This
measure contains no biases, is easy to construct as it based on already available data
periodically collected by Istat in its survey on Italian professions. This circumstance also
limit the extent to which doubts usually raised against job analysis (JA) measures are to be
considered as founded, being it easy to update. Adopting this new measurement, the analysis
of the determinats of overeducation confirmed a counterintuitive pre-existing evidence on
the role played by gender: Italian women are less likely to be overeducated than Italian
males.
Finally, estimates of returns to required, excess and deficit schooling have been run with the
ORU model. Although I reckon that these estimates could be affected by omitted variable
bias (as all estimates in the relevant literature are), they always represent estimates obtained
applying a measurement of overeducation which is not affected by measurement error.
Moreover, as these is, to my knowledge, the first application to the whole Italian labour

162
force of the ORU model, these estimates benefit of a certain degree of novelty and provide a
benchmarking precedent for further possible developments in the identification and
estimation field capable to remove the omitted variable bias.
References
Aina, C.; Pastore F. (2013) Delayed graduation and overeducation: A test of the human
capital model versus the screening hypothesis, Discussion Paper series, Forschungsinstitut
zur Zukunft der Arbeit, No. 6413.
Allen, J.; Van derVelden, R. (2001) Educational Mismatches versus Skill Mismatches:
Effects on Wages, Oxford Economic Papers n. 3 pp. 434-452.
Battu, H.; Sloane, P.; Building, E.; Street, D.; Park, S. (2004) Over-education and ethnic
minorities in Britain, in Manchester School, vol. 72 issue 4, pp. 535–559.
Bauer, T. (2002) Educational mismatch and wages: a panel analysis, in Economics of
Education Review, vol. 21 issue3, pp. 221–229.
Berg, I. (1970) Education and Jobs: The Great Training Robbery, New York, Praeger.
Büchel, F. and van Ham, M. (2003) Overeducation, regional labor markets, and spatial
flexibility, in Journal of Urban Economics, vol. 53 issue 3, pp. 482–493.
Büchel, F.; Battu, H. (2003) The theory of differential overeducation: does it work? In
Scottish Journal of Political Economy, vol. 50 n. 1, pp. 1 – 16.
Büchel, F.; Pollmann-Schult, M. (2001) Overeducation and Skill Endowments The Role of
School Achievement and Vocational Training Quality, in International Journal of
Manpower, vol. 25 issue 2, pp. 150-166.
Caroleo F.E., Pastore F. (2011) Overeducation at a glance. Determinants and wage effects of
the educational mismatch, looking at the AlmaLaurea data.
Chevalier, A. (2003) Measuring Over-education, in Economica, Vol. 70, No. 3, pp. 509-531.
Cutillo, A., Di Pietro, G. (2006), The effects of overeducation on wages in Italy: a bivariate
selectivity approach, International Journal of Manpower, 27, 2, pp. 143-168

163
Di Pietro, G.; Urwin, P. (2003) Education and Skills mismatch in the Italian Graduate
Labour Market, University of Westminster, mimeo.
Dolado, J. J.; Jansen, M.; Jimeno, J. F. (2009) On the job-search in a matching model with
heterogeneous jobs and workers, in Economic Journal, vol. 119, pp. 200–228.
Dolton, P.; Vignoles, A. (2000) The incidence and effects of overeducation in the U.K.
graduate labor market, in Economics of Education Review, vol. 19, pp. 179–198.
Duncan, G. and Hoffman, S. (1981) The Incidence and Wage Effects of Overeducation, in
Economics of Education Review 1 (1), pp 75-86.
Elias, P. and K. Purcell (2004). SOC(HE): a classification of occupations for studying the
graduate labour market. Research Paper 6, University of Warwick, Institute for Employment
Research.
Elias, P. and K. Purcell (2011) Higher education, intergenerational mobility and earnings:
the case of the UK. Working Paper for ESRC.
Frank, R. (1978). Why women earn less: the theory and estimation of differential
overqualification, in American Economic Review, vol. 68 issue 3, pp 360–373.
Ferrante F., McGuinness S.,. Sloane P. J (2010) Esiste «overeducation»? Un’analisi
comparata, in Consorzio InterUniversitario AlmaLaurea (Eds.) XII Rapporto sulla
condizione occupazionale dei laureati. Investimenti in capitale umano nel futuro di Italia ed
Europa, Il Mulino, Bologna.
Franzini, M., Raitano M. (2009), Pochi e poco utilizzati? L’overeducation dei laureati
italiani”, paper presented to the 50th Annual Conference of the Italian Economics
Association (Società Italiana degli Economisti), Rome, October.
Freeman, R. B. (1976) The Overeducated America, New York, Academic Press.
Gautier, P. (2002) Unemployment and search externalities in a model with heterogeneous
jobs and workers, in Economica, vol. 69, pp. 21–40.
Green, C.; Kler, P.; Leeves, G. (2007) Immigrant overeducation: Evidence from recent
arrivals to Australia, in Economics of Education Review, vol. 26 issue 4, pp. 420–432.

164
Green, F.; McIntosh, S. (2007) Is There a Genuine Under-utilization of Skills Amongst the
Overqualified?, Applied Economics, vol. 39 pp427- 439.
Green, F.; McIntosh, S.; Vignoles, A. (1999) Overeducation and skills – clarifying the
concepts. Mimeo.
Green, F.; McIntosh, S.; Vignoles, A. (2002) The Utilization of Education and Skills:
Evidence from Britain, in The Manchester School vol. 70 n. 6, pp. 792-811.
Green, F.; Zhu, Y. (2010) Overqualification, Job Dissatisfaction and Increasing Dispersion
in the Returns to Graduate Education, Oxford Economic Papers, vol. 62 pp 740- 763.
Greene W.H., (2012) Econometric Analysis, VII edition, Prentice Hall.
Groeneveld, S.; Hartog, J. (2004) Overeducation, wages and promotions within the firm,
Labour Economics, 11(6) pp. 701-714.
Groot, W. (1993) Overeducation and the returns to enterprise related schooling, in
Economics of Education Review, vol. 12, pp. 299–309.
Groot, W. and Maassen van den Brink, H. (1997) Allocation and the Returns to Over-
education in the UK, in Education Economics, vol. 5 issue 2, pp. 169–183.
Groot W., van den Brink H. M. (2000), Overeducation in the labor market: a meta-analysis,
Economics of Education Review 19, pp. 149–158.
Elias, P. and Purcell, K. (2013) Classifying graduate occupation for the knowledge society,
HECSU working paper n. 5/2013.
Hartog, J. (2000) Overeducation and earnings: where are we, where should we go?
Economics of Education Review, 19(2) pp 131-147.
Hartog, J.; Houtkoop, W.; Oosterbeek, H. (1996) Returns to cognitive skills in the
Netherlands. Working paper, Universitet van Amsterdam.
Hartog, J.; Jonker, N. (1996) A job to match your education: does it matter? Paper presented
at the ROA 10th Anniversary Conference, Maastricht, in Heijke, H.; Borghans, L. (1998)
Towards a transparent labour market for educational decisions. Ashgate, Aldershot, pp. 99 –
118.

165
Hornstein, A.; Krusell, P.; Violante, G. L. (2006) Frictional Wage Dispersion in Search
Models: A Quantitative Assessment, Federal Reserve Bank of Richmond Working Paper
2006-07.
Istat (2009) Indagine campionaria sulle professioni, Roma.
Kiker, B. F.; Santos, M. C.; de Oliveira, M. (1997) The role of human capital and
technological change in overeducation, in Economics of Education Review, vol. 19 issue 2,
pp. 199 – 206.
Leuven, E. and Oosterbeek, H. (2012) Overeducation and Mismatch in the Labor Market, in
Handbook of the Economics of Education, Volume 4, Elsevier, Amsterdam.
McGoldrick, K. and Robst, J. (1996) Gender differences in overeducation: A test of the
theory of differential overqualification, in American Economic Review, vol. 86 pp. 280–284.
McGuinness, S. (2003) Graduate overeducation as a sheepskin effect: evidence from
Northen Ireland, in Applied Economics, vol. 35, pp. 1943-1945.
McGuinness, S. (2006) Overeducation in the Labour Market, in Journal of Economic
Surveys, Vol. 20, No. 3, pp 387-418.
Pollmann-Schult, M. Buchel F. (2004). Career Prospects of Overeducated Workers in
Germany, European Sociological Review 20(4), pp. 321-331.
Purcell, K.; Elias, P.; Wilton, N. (2004) Higher Education Skills and Employment: careers
and jobs in the graduate labour market, Research paper n. 3, University of Warwick,
Institute for Employment Research, Coventry.
Ramirez, A. A. (1993) Mismatch in the Spanish labor market: overeducation?, in Journal of
Human Resources, vol. 28 issue 2, pp. 259–278.
Rubb, S. (2003). Overeducation: a short or long run phenomenon for individuals? In
Economics of Education Review, vol. 22 issue 4, pp. 389–394.
Sicherman, N. (1991) "Overeducation" in the labor market, in Journal of Labor Economics,
vol. 9 issue 2, pp. 101.
Sicherman, N. and Galor, O. (1990) A theory of career mobility, in Journal of Political
Economy, vol. 98 issue 1, pp. 169–192.

166
Sloane, P. J.; Battu, H.; Seaman, P. T. (1999) Overeducation, Undereducation and the
British Labour Market, in Applied Economics, vol. 31, pp. 1437 – 1453.
Verdungo, R.; Verdungo, N. (1989) The impact of surplus schooling on earnings: some
additional findings, Journal of Human Resources, pp- 629-643.

167
Table 1 ORU model estimated with Heckman selection methodology
(1)
lnW
RS 0.0430***
(0.0008)
OS 0.0098***
(0.0009)
US -0.0239***
(0.0014)
AGE 0.0107***
(0.0004)
EXP 0.0131***
(0.0008)
EXP2 -0.0003***
(0.0000)
TENURE 0.0056***
(0.0003)
GENDER 0.0634***
(0.0054)
PART_TIME -0.4359***
(0.0068)
DISTRETTO_NW 0.0297***
(0.0069)
DISTRETTO_NE 0.0163**
(0.0072)
DISTRETTO_S 0.1319***
(0.0090)
DISTRETTO_I 0.1244***
(0.0107)
AGRICOLTURA -0.0491***
(0.0156)
ENERGIA 0.1689***
(0.0194)
MANIFATTURA 0.1144***
(0.0087)
COSTRUZIONI 0.1036***
(0.0104)
COMMERCIO 0.0957***
(0.0095)

168
TURISMO 0.0723***
(0.0122)
TRASPORTI 0.1465***
(0.0110)
FINANZA 0.2273***
(0.0133)
SERVIZI 0.0638***
(0.0108)
PUBBLICO 0.1292***
(0.0112)
WELFARE 0.1240***
(0.0094)
_cons 6.3342***
(0.0181)
EMPLOYED
GENDER 0.3657***
(0.0089)
AGE -0.0224***
(0.0002)
DISTRETTO_NW 0.0853***
(0.0133)
DISTRETTO_NE 0.1462***
(0.0139)
DISTRETTO_S -0.5476***
(0.0149)
DISTRETTO_I -0.5008***
(0.0181)
_cons 0.2791***
(0.0156)
athrho
_cons -1.4047***
(0.0215)
lnsigma
_cons -0.7624***
(0.0120)
N 112373
R2
adj. R2

169
Table 2 Determinants of overeducation (Source: elaborations on RCFL data)
(1)
OVER
GENDER 0.0508***
(0.0195)
AGE 0.0330***
(0.0016)
lnW 0.0070
(0.0218)
TENURE -0.0106***
(0.0012)
EXP -0.0614***
(0.0034)
EXP2 0.0002***
(0.0001)
DISTRETTO_NW -0.1015***
(0.0243)
DISTRETTO_NE -0.0643***
(0.0249)
DISTRETTO_S -0.1317***
(0.0293)
DISTRETTO_I -0.1831***
(0.0359)
AGRICOLTURA -0.6127***
(0.0613)
ENERGIA -0.4930***
(0.0890)
MANIFATTURA -0.5642***
(0.0359)
COSTRUZIONI -0.5992***
(0.0449)
COMMERCIO -0.5243***
(0.0392)
TURISMO -0.2476***
(0.0472)
TRASPORTI -0.4361***
(0.0460)
FINANZA -0.6645***
(0.0562)

170
SERVIZI -0.4864***
(0.0416)
PUBBLICO -0.8002***
(0.0454)
WELFARE -0.0897**
(0.0368)
_cons 0.0972
(0.1485)
N 25661
R2
adj. R2