directors’ report · in accordance with the corporations act 2001 (cth), the directors of origin...
TRANSCRIPT

DIRECTORS’ REPORT For the year ended 30 June 2018
(including the Operating Financial Review and the Remuneration Report)
1 of 92 Origin Energy Limited ABN 30 000 051 696

TABLE OF CONTENTS 1. PRINCIPAL ACTIVITIES
2. REVIEW OF OPERATIONS & FUTURE DEVELOPMENTS
3. SIGNIFICANT CHANGES IN THE STATE OF AFFAIRS
4. EVENTS SUBSEQUENT TO BALANCE DATE
5. DIVIDENDS
6. DIRECTORS
7. INFORMATION ON DIRECTORS AND COMPANY SECRETARIES
8. DIRECTORS’ MEETINGS
9. DIRECTORS’ INTERESTS IN SHARES, OPTIONS AND RIGHTS
10. ENVIRONMENTAL REGULATION AND PERFORMANCE
11. INDEMNITIES AND INSURANCE FOR DIRECTORS AND OFFICERS
12. AUDITOR INDEPENDENCE
13. NON-AUDIT SERVICES
14. PROCEEDINGS ON BEHALF OF THE COMPANY
15. ROUNDING OF AMOUNTS
16. REMUNERATION
2 of 92 Origin Energy Limited ABN 30 000 051 696

16 August 2018
Directors’ Report for the year ended 30 June 2018 In accordance with the Corporations Act 2001 (Cth), the Directors of Origin Energy Limited (Company) report on the Company and the consolidated entity Origin Energy Group (Origin), being the Company and its controlled entities for the year ended 30 June 2018. The Operating and Financial Review and Remuneration Report form part of this Directors’ Report.
1. Principal activities During the year, the principal activity of Origin was the operation of energy businesses including: exploration and production of natural gas; electricity generation; wholesale and retail sale of electricity and gas; and sale of liquefied natural gas. On 31 January 2018, Origin completed the sale of Lattice Energy, the name given to the upstream conventional oil and gas business. There were no other significant changes in the nature of these activities during the year. 2. Review of operations & future developments A review of the operations and results of operations of Origin during the year, the financial position of Origin and the business strategies and prospects for future financial years, is set out in the Operating and Financial Review, which forms part of this Directors’ Report. 3. Significant changes in the state of affairs The following significant changes in the state of affairs of the Company occurred during the year: Australia Pacific LNG In July 2017, Australia Pacific LNG completed the 90-day operational phase of the two-train project finance lenders’ test, producing more than 10% above nameplate capacity. The remaining US$3.4 billion of shareholder guarantees relating to Australia Pacific LNG’s US$8.5 billion project finance facility were released in August 2017. Capital management Origin completed the $1,585 million sale of Lattice Energy on 31 January 2018. After adjusting for settlement of the acquisition by Lattice Energy of Benaris’ interest in the Otway basin, close out of oil forward sale agreements, transaction costs, adjustments and taxes, the balance of approximately $1 billion was used to pay down debt. The sale of Acumen, Origin’s retail metering business, was completed on 19 June 2018 with proceeds of $267 million also used to pay down debt. In June 2018 Origin redeemed its €500 million Capital Securities due 2071 at their first call date (16 June 2018), in accordance with the terms of the securities. Origin also completed the extension of approximately $4 billion of syndicated loan facilities with new 4, 5 and 7 year maturities at reduced funding margins. Adjusted net debt reduced by $1.6 billion to $6.5 billion driven by operating cash flows, proceeds from asset sales and net cash flows from Australia Pacific LNG, all of which were more than sufficient to fund capital expenditure and interest payments.
3 of 92 Origin Energy Limited ABN 30 000 051 696

The events described above and those disclosed in the Financial Statements represent the significant changes in the state of affairs of Origin for the year ended 30 June 2018.
4. Events subsequent to balance date No matters or circumstances have arisen since 30 June 2018, which have significantly affected, or may significantly affect the Company’s operations, the results of those operations or the Company’s state of affairs in future financial years.
5. Dividends No Dividends were paid during the year by the Company and the Directors have determined that no final dividend will be payable for the year ended 30 June 2018.
6. Directors The Directors of the Company at any time during or since the end of the financial year are: Gordon Cairns (Chairman) Frank Calabria (Managing Director & Chief Executive Officer) John Akehurst Maxine Brenner Teresa Engelhard Bruce Morgan Scott Perkins Steven Sargent
7. Information on Directors and Company Secretaries Information relating to current Directors’ qualifications, experience and special responsibilities is set out below. The qualifications and experience of the Company Secretaries are also set out below. Gordon Cairns Independent Non-executive Chairman Gordon Cairns joined the Board in June 2007 and became Chairman in October 2013. He is Chairman of the Nomination Committee and a member of the Risk, Remuneration and People, Audit and Health, Safety and Environment committees. He has extensive Australian and international experience as a senior executive, as Chief Executive Officer of Lion Nathan Ltd, and has held senior management positions in marketing, operations and finance with PepsiCo, Cadbury Ltd and Nestlé. Gordon is Chairman of Woolworths Group Limited (since September 2015), a Director of Macquarie Group Limited (since November 2014), Macquarie Bank Limited (since November 2014) and Non-executive Director of World Education Australia (since November 2007). He was previously Chairman of the Origin Foundation, David Jones Limited (March 2014 - August 2014), Rebel Group (2010 - 2012), Director of The Centre for Independent Studies (May 2006 - August 2011), Director of Quick Service Restaurant Group (October 2011 – May 2017) and Director of Westpac Banking Corporation (July 2004 - December 2013). He was also a senior advisor to McKinsey & Company. Gordon holds a Master of Arts (Honours) from the University of Edinburgh. John Akehurst Independent Non-executive Director John Akehurst joined the Board in April 2009. He is Chairman of the Health, Safety and Environment Committee and a member of the Nomination and Risk committees. His executive career was in the upstream oil and gas and LNG industries, initially with Royal Dutch Shell and then as Chief Executive Officer of Woodside Petroleum Limited.
4 of 92 Origin Energy Limited ABN 30 000 051 696

He is Chairman of the National Centre for Asbestos Related Diseases and of the Fortitude Foundation, a Director of Human Nature Adventure Therapy Ltd (since February 2018), a former Chairman of Transform Exploration Pty Ltd (February 2012 – December 2017), Alinta Limited (January 2007 - September 2007) and Coogee Resources Ltd (2008 - 2009) and a former Board member of the Reserve Bank of Australia (September 2007 – September 2017), Director of CSL Limited (April 2004 - October 2016), Oil Search Limited (1998-2003), Securency Ltd (2008 - 2012), Murdoch Film Studios Pty Ltd and the University of Western Australia Business School. John holds a Masters in Engineering Science from Oxford University and is a Fellow of the Institution of Mechanical Engineers. Maxine Brenner Independent Non-executive Director Maxine Brenner joined the Board in November 2013. She is Chairman of the Risk Committee and a member of the Audit and Nomination committees. Maxine is a Non-executive Director of Orica Ltd (since April 2013) and Qantas Airways Ltd (since August 2013). She is also an Independent Director and Chairman of the Audit and Risk Committee for Growthpoint Properties Australia and a member of the University of NSW Council. Maxine was formerly a Managing Director of Investment Banking at Investec Bank (Australia) Ltd. Prior to Investec, Maxine was a Lecturer in Law at the University of NSW and a lawyer at Freehills, specialising in corporate law. Her former directorships include Treasury Corporation of NSW, Bulmer Australia Ltd, Neverfail Springwater Ltd (1999 - 2003) and Federal Airports Corporation, where she was Deputy Chair. In addition, Maxine has served as a Council Member of the State Library of NSW and as a member of the Takeovers Panel. Maxine holds a Bachelor of Arts and a Bachelor of Laws. Frank Calabria Managing Director & Chief Executive Officer Frank Calabria was appointed Managing Director & Chief Executive Officer in October 2016. Frank is a member of the Health, Safety and Environment Committee and a Director of the Origin Foundation. Frank first joined Origin as Chief Financial Officer in November 2001 and was appointed Chief Executive Officer, Energy Markets in March 2009. In that latter role, Frank was responsible for the integrated business within Australia including retailing and trading of natural gas, electricity and LPG, power generation and solar and energy services. Frank is a Director of the Australian Energy Council and the Australian Petroleum Production & Exploration Association. He is a former Chairman of the Australian Energy Council and former Director of the Australian Energy Market Operator. Frank has a Bachelor of Economics from Macquarie University and a Master of Business Administration (Executive) from the Australian Graduate School of Management. Frank is also a Fellow of the Chartered Accountants Australia and New Zealand and a Fellow of the Financial Services Institute of Australasia. Teresa Engelhard Independent Non-executive Director Teresa Engelhard joined the Board in May 2017. She is a member of the Audit and Remuneration and People committees. Teresa has more than 20 years’ experience in the information, communication, technology and energy sectors as a senior executive and venture capitalist. Teresa is a Non-executive Director of Wisetech Global (since March 2018), Planet Innovation Ltd (since April 2016), StartupAUS (since March 2016), and Redkite (since February 2017). Teresa started her career at McKinsey & Company in California where she served energy and retail clients. More recently, she focused on energy sector innovation as
5 of 92 Origin Energy Limited ABN 30 000 051 696

a Managing Partner at Jolimont Capital. Her former directorships include Daintree Networks and RedBubble Limited (July 2011 - October 2017). Teresa holds a Bachelor of Science (Hons) degree from the California Institute of Technology (Caltech), an MBA from Stanford University and is a graduate of the Australian Institute of Company Directors. Bruce Morgan Independent Non-executive Director Bruce Morgan joined the Board in November 2012. He is Chairman of the Audit Committee and a member of the Health, Safety and Environment, Nomination and Risk committees. He is Chairman of Sydney Water Corporation (since October 2013), a Director of Caltex Australia Ltd (since June 2013), a Director of Redkite, the University of NSW Foundation and the European Australian Business Council. Bruce has a Bachelor of Commerce (Accounting and Finance) from the University of NSW. Bruce served as Chairman of the Board of PricewaterhouseCoopers (PwC) Australia between 2005 and 2012. In 2009, he was elected as a member of the PwC International Board, serving a four year term. He was previously Managing Partner of PwC’s Sydney and Brisbane offices. An audit partner of the firm for over 25 years, he was focused on the financial services and energy and mining sectors leading some of the firm’s most significant clients in Australia and internationally. He is a Fellow of the Chartered Accountants Australia and New Zealand and of the Australian Institute of Company Directors. Scott Perkins Independent Non-executive Director Scott Perkins joined the Board in September 2015. He is Chairman of the Remuneration and People Committee and a member of the Audit, Risk and Nomination committees. Scott is a Non-executive Director of Woolworths Limited (since September 2014) and Brambles Limited (since May 2015). He is Chairman of Sweet Louise (since 2005), a Director of the Museum of Contemporary Art in Sydney (since 2011) and the New Zealand Initiative (since 2012). Scott was previously a Non-executive Director of Meridian Energy (1999 - 2002). Scott has extensive Australian and international experience as a leading corporate adviser. He was formerly Head of Corporate Finance for Deutsche Bank Australia and New Zealand and a member of the Executive Committee with overall responsibility for the Bank’s activities in this region. Prior to that he was Chief Executive Officer of Deutsche Bank New Zealand and Deputy CEO of Bankers Trust New Zealand. He has a longstanding commitment to breast cancer causes, the visual arts and public policy development. Scott holds a Bachelor of Commerce and a Bachelor of Laws (Hons) from Auckland University. Steven Sargent Independent Non-executive Director Steven Sargent joined the Board in May 2015. He is Chairman of the Origin Foundation and a member of the Health, Safety and Environment and Remuneration and People committees. Steven is Chairman of OFX Group Ltd (since November 2016). He is Deputy Chairman of Nanosonics Ltd (since July 2016) and Non-executive Director of the Great Barrier Reef Foundation (since March 2015). Over recent years Steven has been a Non-executive Director of Veda Group Ltd (2015 - 2016) and Bond University Ltd (2010 - 2016). Steven was also a member of the Australian Treasurer’s Financial Sector Advisory Council, President of the American Chamber of Commerce and a Director on the Board of the Business Council of Australia and he was a member of the Australian B20 Leadership Group and Coordinating Chair of the B20 Human Capital Taskforce in 2014.
6 of 92 Origin Energy Limited ABN 30 000 051 696

Steven’s executive career included 22 years at General Electric, where he led businesses across the USA, Europe and Asia Pacific. Steven was President and CEO of GE Mining, GE’s global mining technology and services business. Prior to this he was President and CEO of GE Australia, NZ & PNG where he had local responsibility for GE's Energy, Oil and Gas, Aviation, Healthcare and Financial Services businesses. Steven holds a Bachelor of Business from Charles Sturt University in New South Wales and is a Fellow with the Australian Institute of Company Directors and a Fellow with the Australian Academy of Technological Sciences and Engineering. Andrew Clarke Group General Counsel and Company Secretary Andrew Clarke joined Origin in May 2009 and is responsible for the company secretarial and legal functions. He was a partner of a national law firm for 15 years and was Managing Director of a global investment bank for more than two years prior to joining Origin. Andrew has a Bachelor of Laws (Hons) and a Bachelor of Economics from the University of Sydney, and is a member of the Australian Institute of Company Directors. Helen Hardy Company Secretary Helen Hardy joined Origin in March 2010. She was previously General Manager, Company Secretariat of a large ASX listed company, and has advised on governance, financial reporting and corporate law at a Big 4 accounting firm and a national law firm. Helen is a Chartered Accountant and Chartered Secretary and a Graduate Member of the Australian Institute of Company Directors. She holds a Bachelor of Laws and a Bachelor of Commerce from the University of Melbourne, and is admitted to legal practice in New South Wales and Victoria.
8. Directors’ meetings The number of Directors’ meetings, including Board committee meetings, and the number of meetings attended by each Director during the financial year are shown in the table below:
Directors
Board Meetings Committee Meetings
Scheduled Additional Audit
Health, Safety and
Environment (HSE)
Nomination Remuneration
& People
Risk
H A H A H A H A H A H A H A
G Cairns 10 10 3 3 4 4 5 5 1 1 6 6 4 4
F Calabria 10 10 3 3 - - 5 5 - - - - - -
J Akehurst 10 10 3 3 - - 5 5 1 1 - - 4 4
M Brenner 10 10 3 3 4 4 - - 1 1 - - 4 4
B Morgan 10 10 3 2 4 4 5 5 1 1 - - 4 4
T Engelhard 10 10 3 3 3 3 - - - - 6 6 - -
S Perkins 10 10 3 3 4 4 - - 1 1 6 6 4 4
S Sargent 10 10 3 3 - - 5 5 - - 6 6 - -
H Number of scheduled meetings held during the time that the Director held office or was a member of the
committee during the year. A Number of meetings attended. The Board held 10 scheduled meetings, including a two-day strategic review meeting and three additional meetings to deal with urgent matters. There were also seven Board or Committee workshops to consider matters of particular relevance. In addition, the Board conducted visits of Company operations at various sites and met with operational management during the year. 7 of 92 Origin Energy Limited ABN 30 000 051 696

9. Directors’ interests in shares, Options and Rights The relevant interests of each Director as at 30 June 2018 in the shares and Options or Rights over such instruments issued by the companies within the consolidated entity and other related bodies corporate at the date of this report are as follows:
Director Ordinary shares held directly and
indirectly
Options over ordinary shares
Deferred Share Rights (DSR)
over ordinary Shares
Performance Share Rights
(PSR) over ordinary
shares
G Cairns 163,660 - - -
F Calabria 191,905 1,430,2101 216,2142 271,8952
J Akehurst 71,200 - - -
M Brenner 22,117 - - -
T Engelhard - - - -
B Morgan 47,143 - - -
S Sargent 31,429 - - -
S Perkins 30,000 - - -
Exercise price for Options and Rights:
(1) 227,065: $15.65; 570,150: $6.78; 231,707: $5.67; 401,288: $7.37. (2) Nil.
No Director other than the Chief Executive Officer & Managing Director participates in the Company’s Equity Incentive Plan. Options and Rights granted by Origin Non-executive Directors do not receive Options or Rights as part of their remuneration. The following Options and Rights were granted to the Managing Director & Chief Executive Officer and the 5 most highly remunerated officers (other than Directors) of the Company during the year ended 30 June 2018:
Options DSRs PSRs
J Briskin 86,910 23,340 27,477 A Clarke 77,683 25,347 24,560 G Jarvis 93,219 25,993 29,471 M Schubert 83,769 18,945 26,484 L Tremaine 81,441 335,875 24,415
Each of these awards was made in accordance with the Company’s Equity Incentive Plan as part of the relevant executive’s remuneration. Further details on Options and Rights granted during the financial year, and unissued shares under Options and Rights, are included in Section 5 of the Remuneration Report. No Options or Rights were granted since the end of the financial year.
8 of 92 Origin Energy Limited ABN 30 000 051 696

Origin Shares issued on the exercise of Options and Rights Options No Options granted under the Equity Incentive Plan were exercised during or since the year ended 30 June 2018, so no ordinary shares in Origin were issued as a result. Rights 3,822,999 ordinary shares of Origin were issued during the year ended 30 June 2018 on the vesting and exercise of DSRs granted under the Equity Incentive Plan. No amount is payable on the vesting of those DSRs and, accordingly, no amounts remain unpaid in respect of any of those shares. Since 30 June 2018, 228,709 ordinary shares were issued on the vesting of DSRs granted under the Equity Incentive Plan. No amount is payable on the vesting of those DSRs and, accordingly, no amounts remain unpaid in respect of any of those shares.
10. Environmental regulation and performance The Company’s operations are subject to environmental regulation under Commonwealth, State, and Territory legislation. For the year ended 30 June 2018, the Company’s Australian operations recorded some environmental incidents arising from Origin’s activities including those where Origin was the operator of a joint venture. These incidents resulted in environmental impacts mostly with a moderate and temporary nature. Regulators were notified of reportable environmental incidents. For FY18, the Company recorded no formal notices or penalties from a regulator arising from Origin’s activities as compared to the 12 notices received in FY17. However, for APLNG where Origin is the operator, one infringement at Spring Gully was received for $12,615. Appropriate remedial actions have been taken or are being undertaken in response to the notice and reportable environmental incident.
11. Indemnities and insurance for Directors and Officers Under its Constitution, the Company may indemnify current and past Directors and Officers for losses or liabilities incurred by them as a Director or Officer of the Company or its related bodies corporate to the extent allowed under law. The Constitution also permits the Company to purchase and maintain a Directors’ and Officers’ insurance policy. No indemnity has been granted to an auditor of the Company in their capacity as auditor of the Company. The Company has entered into agreements with current Directors and certain former Directors whereby it will indemnify those Directors from all losses or liabilities in accordance with the terms of, and subject to the limits set by, the Constitution. The agreements stipulate that the Company will meet the full amount of any such liability, including costs and expenses to the extent allowed under law. The Company is not aware of any liability having arisen, and no claim has been made against the Company during or since the year ended 30 June 2018 under these agreements. During the year, the Company has paid insurance premiums in respect of Directors’ and Officers’ liability, and legal expense insurance contracts for the year ended 30 June 2018. The insurance contracts insure against certain liability (subject to exclusions) of persons who are or have been Directors or Officers of the Company and its controlled entities. A condition of the contracts is that the nature of the liability indemnified and the premium payable not be disclosed.
12. Auditor independence There is no former partner or director of KPMG, the Company’s auditors, who is or was at any time during the year ended 30 June 2018 an officer of the Origin Energy Group. The auditor’s independence declaration for the financial year (made under section 307C of the Corporations Act (Cth)) is attached to and forms part of this Report.
9 of 92 Origin Energy Limited ABN 30 000 051 696

13. Non-audit services The amounts paid or payable to KPMG for non-audit services provided during the year was $1,558,000 (shown to nearest thousand dollar). Amounts paid to KPMG are included in F7 to the full financial statements. Based on written advice received from the Audit Committee Chairman pursuant to a resolution passed by the Audit Committee, the Board has formed the view that the provision of those non-audit services by KPMG is compatible with, and did not compromise, the general standards of independence for auditors imposed by the Corporations Act 2001 (Cth). The Board’s reasons for concluding that the non-audit services provided by KPMG did not compromise its independence are: all non-audit services provided were subjected to the Company’s corporate governance
procedures and were either below the pre-approved limits imposed by the Audit Committee or separately approved by the Audit Committee;
all non-audit services provided did not, and do not, undermine the general principles relating to auditor independence as they did not involve reviewing or auditing the auditor’s own work, acting in a management or decision making capacity for the Company, acting as an advocate for the Company or jointly sharing risks and rewards; and
there were no known conflict of interest situations nor any other circumstance arising out of a relationship between Origin (including its Directors and officers) and KPMG which may impact on auditor independence.
14. Proceedings on behalf of the Company The Company is not aware of any proceedings being brought on behalf of the Company, nor any applications having been made in respect of the Company under section 237 of the Corporations Act 2001 (Cth).
15. Rounding of amounts The Company is of a kind referred to in ASIC Corporations (Rounding in Financial/Directors’ Reports) Instrument 2016/191 dated 24 March 2016 and in accordance with that class order, amounts in the financial report and Directors’ Report have been rounded off to the nearest million dollars unless otherwise stated.
16. Remuneration The Remuneration Report forms part of this Directors’ Report.
10 of 92 Origin Energy Limited ABN 30 000 051 696

Operating and Financial Review 30 June 2018
11 of 92 Origin Energy Limited ABN 30 000 051 696

Table of Contents 1. About Origin
2. Strategy and prospects
3. Financial update
3.1 Financial summary
3.2 Reconciliation from Statutory to Underlying Profit
3.3 Cash flows
3.4 Capital management
4. Review of segment operations
4.1 Energy Markets
4.2 Integrated Gas
5. Climate change disclosures
6. Risks related to Origin’s future financial prospects
7. Important information
Appendix 1 - Consolidated financial supplementary data
Appendix 2 - Energy Markets supplementary data
Appendix 3 - Integrated Gas supplementary data
Appendix 4 - Glossary and interpretation
12 of 92 Origin Energy Limited ABN 30 000 051 696
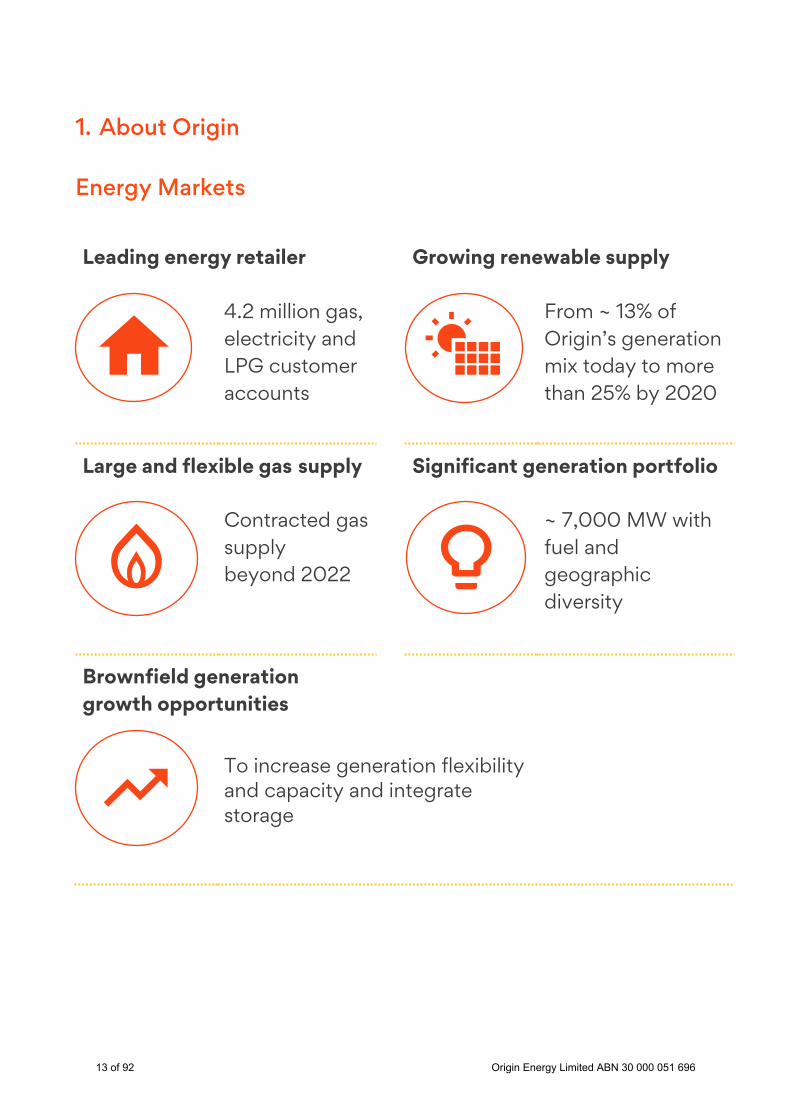
1. About Origin
Energy Markets
Leading energy retailer Growing renewable supply
4.2 million gas, electricity and LPG customer accounts
From ~ 13% of Origin’s generation mix today to more than 25% by 2020
Large and flexible gas supply Significant generation portfolio
Contracted gas supply beyond 2022
~ 7,000 MW with fuel and geographic diversity
Brownfield generation growth opportunities
To increase generation flexibility and capacity and integrate storage
13 of 92 Origin Energy Limited ABN 30 000 051 696

Discontinued Operations
On 31 January 2018, Origin completed the sale of Lattice Energy which is treated as a discontinued operation (along with Jingemia and the Darling Downs Pipeline in the comparative period). Financial information in this report focuses on continuing operations. Refer to note E4 of Origin’s Financial Statements for further detail.
1 At 30 June 2018. For further information refer to Origin’s Annual Reserves Report for the year ended 30 June 2018, announced on the same date as this report. Some of APLNG’s reserves and resources are subject to reversionary rights and an ongoing royalty interest in favour of Tri-Star. Refer to section 6 for further information.
Integrated Gas
Upstream operator and 37.5% shareholder in APLNG
Australia’s largest CSG reserves base
Largest LNG facility on the east coast of Australia
Supplier to domestic and export markets
2P reserves of 12,453 PJ1
(APLNG 100%)
9 mtpa nameplate capacity
Supplier of ~ 30% of domestic east coast gas demand in 2018
~ 8.6 mtpa LNG export contracts to 2035
Other exploration and development interests
Surat Basin (Ironbark)
Beetaloo Basin
Browse Basin
14 of 92 Origin Energy Limited ABN 30 000 051 696

Operations
Origin also has one LPG seaboard terminal in Cam Ranh, Vietnam.
15 of 92 Origin Energy Limited ABN 30 000 051 696

Financial highlights
Statutory Profit
$218M Up $2.4b vs FY2017
Underlying Profit – continuing operations
$838M Up $438m or 110% vs FY2017
Underlying EBITDA – continuing operations
$2,947M Up $774m or 36% vs FY2017
Net Cashflow from Operating and Investing
Activities
$2,645M Up $1,267m or 92% vs FY2017
Underlying ROCE – continuing operations
8.4% Up 3% vs FY2017 and in line
with H1 FY2018
Operational highlights
Generation output
at Eraring
15.9 TWH Up 2 TWh or 14% vs FY2017
APLNG production
(100%)
676 PJ Up 67 PJ or 11% vs FY2017
Net proceeds from
asset sales
$1.5B
Energy Markets natural gas sales
281 PJ Up 32 PJ or 13% vs FY2017
Cash flow from APLNG
$363M Up $533m vs FY2017
Capex - continuing operations
$328M
$1.6B Adjusted Net Debt
down to $6.5b
16 of 92 Origin Energy Limited ABN 30 000 051 696

FY2019 guidance
Energy Markets
Underlying EBITDA
$1.5B-$1.6B
APLNG Operating
Breakeven
US$22-26/BOE
Corporate costs
$60-$65M
$1.74b – $1.84b before
adjusting for a change in treatment of certain electricity
hedge premiums and NSW revenue forgone
APLNG Distribution
breakeven
US$39-44/BOE
Capex (excluding APLNG)
$385-$445M
Growth Opportunities
Energy Markets
• Growing renewables >1,000 MW by FY2020
• Brownfield generation
- Increased flexibility and capacity
- Pumped hydro and batteries
• Retail adjacencies and new products
• Growing rooftop solar
Integrated Gas
• Entering stage 2 in the Beetaloo
- Targeting liquids rich plays
• Entered FEED for Ironbark Stage 1
- Targeting first gas in FY2021/22
- Assessing alternative strategic options
17 of 92 Origin Energy Limited ABN 30 000 051 696
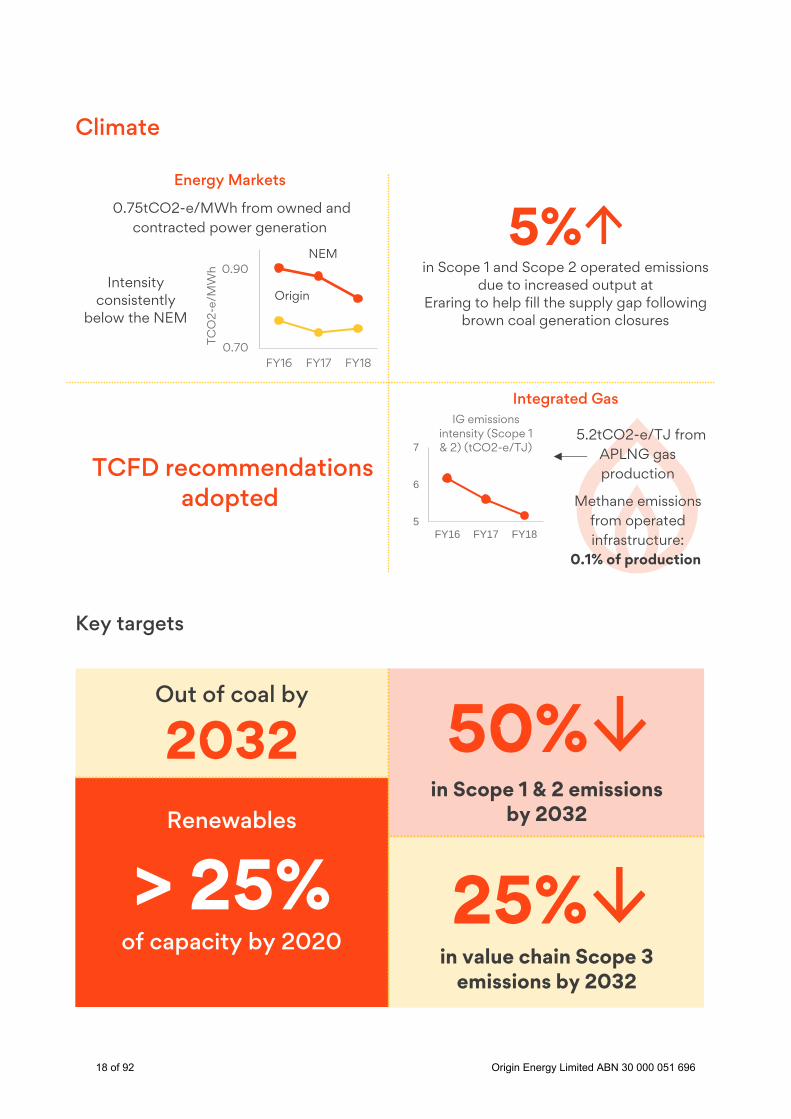
Climate
Key targets
Energy Markets
0.75tCO2-e/MWh from owned and contracted power generation
Intensity consistently
below the NEM
TCFD recommendations
adopted
5% in Scope 1 and Scope 2 operated emissions
due to increased output at Eraring to help fill the supply gap following
brown coal generation closures
Integrated Gas
5.2tCO2-e/TJ from APLNG gas production
Methane emissions from operated infrastructure:
0.1% of production
Out of coal by
2032 50%
in Scope 1 & 2 emissions by 2032
Renewables
> 25%
of capacity by 2020
25%
in value chain Scope 3 emissions by 2032
5
6
7
FY16 FY17 FY18
IG emissions intensity (Scope 1 & 2) (tCO2-e/TJ)
0.70
0.90
FY16 FY17 FY18
TCO
2-e/
MW
h
Origin
NEM
18 of 92 Origin Energy Limited ABN 30 000 051 696

Customers, communities and people Customers
More affordable
Increased electricity supply to put downward pressure on prices
Tariffs flat or reducing (3% electricity price increase
absorbed in NSW)
Smarter and easier
Giving customers
control
• Usage Buster • Home HQ • Savernator
Highest ever Interaction NPS up 5.6 points from FY2017 to
21.7
More sustainable
# 1 Provider for Business Solar
1,200 MW of new renewable supply committed since March 2016
Sunwiz, June 2018
Communities
People
99.9% of Eraring water is recycled
$236M spent directly with regional suppliers
$23M awarded by Origin Foundation since establishment in
2010
‘Best Company Indigenous
Procurement Initiative’
2018 Queensland Resources Council
Employee engagement
3% to 61%
Women in senior roles 3% to 32%
4.23.2
2.2
FY16 FY17 FY18
Origin’s lowest Total Recordable Injury Frequency Rate (TRIFR)
result
19 of 92 Origin Energy Limited ABN 30 000 051 696
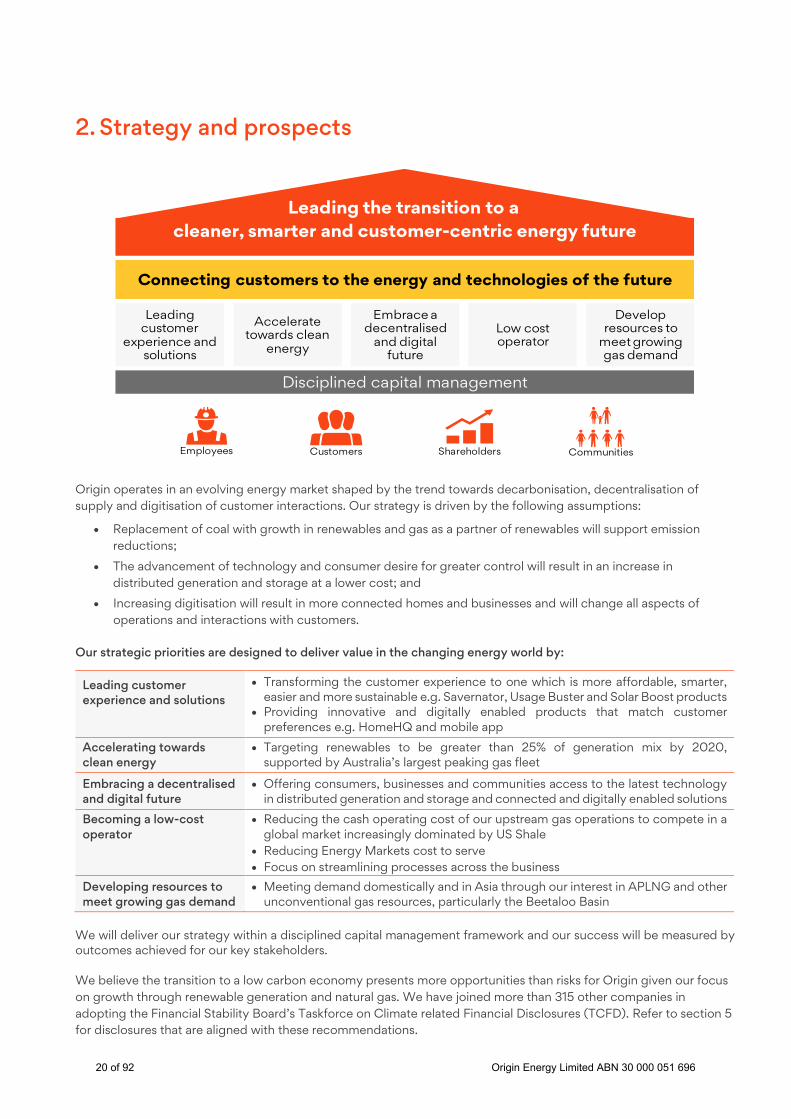
2. Strategy and prospects
Origin operates in an evolving energy market shaped by the trend towards decarbonisation, decentralisation of supply and digitisation of customer interactions. Our strategy is driven by the following assumptions:
• Replacement of coal with growth in renewables and gas as a partner of renewables will support emission reductions;
• The advancement of technology and consumer desire for greater control will result in an increase in distributed generation and storage at a lower cost; and
• Increasing digitisation will result in more connected homes and businesses and will change all aspects of operations and interactions with customers.
Our strategic priorities are designed to deliver value in the changing energy world by:
Leading customer experience and solutions
• Transforming the customer experience to one which is more affordable, smarter, easier and more sustainable e.g. Savernator, Usage Buster and Solar Boost products
• Providing innovative and digitally enabled products that match customer preferences e.g. HomeHQ and mobile app
Accelerating towards clean energy
• Targeting renewables to be greater than 25% of generation mix by 2020, supported by Australia’s largest peaking gas fleet
Embracing a decentralised and digital future
• Offering consumers, businesses and communities access to the latest technology in distributed generation and storage and connected and digitally enabled solutions
Becoming a low-cost operator
• Reducing the cash operating cost of our upstream gas operations to compete in a global market increasingly dominated by US Shale
• Reducing Energy Markets cost to serve • Focus on streamlining processes across the business
Developing resources to meet growing gas demand
• Meeting demand domestically and in Asia through our interest in APLNG and other unconventional gas resources, particularly the Beetaloo Basin
We will deliver our strategy within a disciplined capital management framework and our success will be measured by outcomes achieved for our key stakeholders. We believe the transition to a low carbon economy presents more opportunities than risks for Origin given our focus on growth through renewable generation and natural gas. We have joined more than 315 other companies in adopting the Financial Stability Board’s Taskforce on Climate related Financial Disclosures (TCFD). Refer to section 5 for disclosures that are aligned with these recommendations.
Disciplined capital management
cleaner, smarter and customer-centric energy future
Connecting customers to the energy and technologies of the future
Leading the transition to a
Leading customer
experience and solutions
Embrace adecentralised
and digital future
Low cost operator
Develop resources to
meet growing gas demand
Accelerate towards clean
energy
Employees CommunitiesCustomers Shareholders
20 of 92 Origin Energy Limited ABN 30 000 051 696

Prospects
Energy Markets
Over the past 18 months, the Australian energy market has been characterised by high wholesale electricity and gas prices which have flowed through to customers, increased levels of competition particularly in retail electricity and a changing and uncertain regulatory environment.
We have acted to put downwards pressure on prices by increasing the supply of gas and electricity, including committing to contracting approximately 1,200 MW of new renewables since March 2016, 133 MW of which was online at 30 June 2018 and launching improved offers and low rate concession products for customers. We have advocated for energy policy that addresses the issues of affordability, emissions reduction and reliability, and to that end, we have actively supported the National Energy Guarantee which we believe can address these objectives.
We expect:
• a further reduction in average wholesale electricity prices as more renewable supply enters the market, which should flow through to lower bills and provide relief for customers;
• gas prices linked to international LNG prices; and
• the retail market to remain competitive.
Our Actions:
• optimising our flexible generation portfolio based on customer demand and market price signals;
• driving a leading customer experience and efficient cost structure through our digital first approach where we seek to simplify the experience of buying energy for our customers and create new sources of value; and
• maximising the supply of gas to customers as well as supporting energy security through gas-fired generation from our competitive wholesale gas portfolio.
We have a number of opportunities to invest in generation flexibility that are dependent on market signals and regulatory certainty which can be quickly implemented at the appropriate time.
We have been actively working with governments to address concerns about energy affordability and reliability. We support the objectives of the National Energy Guarantee as a practical way to reduce carbon emissions, maintain system reliability and improve affordability. We will consult with the government on the ACCC’s report into the electricity market and support the intention to prioritise recommendations that will directly reduce bills for customers without distorting the market or limiting investment and innovation.
Integrated Gas
We are on track to deliver a cost out program at APLNG that includes more than $500 million per annum reduction in sustain capex and opex from the baseline provided in November 2017. This is expected to deliver an operating breakeven of < US$24/boe2 and distribution breakeven of <US$40/boe2 on a run rate basis from June 2019, with a full year impact in FY2020.
We have implemented a flatter, smaller, asset-led structure built around core processes, resulting in a reduction of 500 roles in FY2018, with a strong regional presence maintained.
As part of the cost out program, we are targeting the following unit costs on a run rate basis from June 2019:
• Operating costs of A$1.00/GJ from upstream operated areas; and
• Well costs of A$1.2 million/well3.
Over the year, well costs were an average of A$1.9 million per well3, significantly lower than previous FY2018 guidance of A$2.4 million per well. We expect well costs to continue decreasing driven by lower overheads, optimised gathering construction, simplified surface facilities design, drilling improvements and re-priced rig and construction contracts.
2 AUD=0.75 USD 3 Single vertical unfracked Surat well
21 of 92 Origin Energy Limited ABN 30 000 051 696

The international outlook for LNG demand is robust with Chinese demand driving recent spot LNG price strength.
We have entered the FEED phase for a Stage 1 development at Ironbark, targeting first gas in FY2021/FY2022. We are also assessing alternative strategic options for the asset.
In the Beetaloo Basin, following the lifting of the moratorium on fracture stimulation, announced by the Northern Territory Government in April 2018, we plan to drill and fracture stimulate a further five wells to complete existing farm-in commitments over the next two to three years. Exploration and appraisal activities planned for the 2019 dry season include one vertical and two fracture stimulated horizontal wells.
FY2019 Guidance
Guidance is provided on the basis that market conditions and the regulatory environment do not materially change. Overall, Origin expects Underlying Profit to be higher and further debt reduction in FY2019.
Energy Markets
Energy Markets FY2019 Underlying EBITDA is expected to be lower at $1.5–$1.6 billion driven by:
• lower Electricity gross profit reflecting a 3% price increase forgone ($80 million impact) after absorbing increased green and network costs in NSW and increased discounting associated with ongoing retail competition;
• moderate growth in Natural Gas gross profit; and
• change in treatment of certain electricity hedge premiums previously reported outside of underlying earnings ($160 million pre-tax) to within underlying earnings. Following the implementation of a new Financial Instruments accounting standard from 1 July 2018, we have undertaken a review of all fair value accounting and determined that, from FY2019, the expense of these upfront cash premiums will be included within Underlying Profit. There is no change to Statutory Profit or cash flow as a result of this treatment change.
Year Ended 30 June 2018 2019 Guidance
($m) ($m)
Underlying EBITDA – pre NSW revenue forgone and treatment change 1,811 1,740 - 1,840 NSW 3% electricity price increase absorbed - (80)
Change in treatment of electricity hedge premiums (160) (160) Underlying EBITDA – new basis 1,651 1,500 - 1,600
Integrated Gas
APLNG FY2019 production is expected to be 660-690 PJ.
We expect to drill 250-300 operated wells. Increased drilling is expected in non-operated areas, in particular Arcadia and Roma East as these fields commence production.
Planned downstream maintenance outages are posted on the AEMO Natural Gas Services Bulletin Board. The latest notification, dated 14 August 2018 outlines scheduled maintenance outages in August and September 2018.
Despite expected reductions in cost per well (-US$1/boe) and savings on opex and purchases (-US$2/boe), overall costs are expected to be higher than FY2018 due to:
• phasing/scope of non-operated activity (US$2/boe);
• operated E&A (US$2/boe); and
• higher operated infrastructure spend associated with the Eurombah Creek – Reedy Creek Interconnect pipeline, and the Talinga-Orana Gas Gathering Station, along with other infrastructure designed to increase flexibility (US$3/boe).
Exploration and Appraisal spend is expected to increase in FY2019 as work progresses to test new conventional and unconventional prospects.
22 of 92 Origin Energy Limited ABN 30 000 051 696

FY2019 breakeven guidance
100% APLNG (A$m) FY2019 guidance @ 0.75 AUD/USD
Capital expenditure – Sustain 1,450 Capital expenditure – E&A 200 Operating expenses – pre-capitalisation(a) 1,570 Less: Spot LNG & domestic revenue (1,350)
Operating breakeven 1,870
Operating breakeven (US$/boe)(b) 22 – 26 Project finance interest 460 Project finance principal 860
Distribution breakeven 3,190
Distribution breakeven (US$/boe)(b) 39 - 44 (a) Operating expenses estimate includes royalties payable reflected at the breakeven oil price. Royalties payable increases as oil price increases. (b) Range represents variability around work program scope, operating costs, project refinancing and non oil-linked revenue.
100% APLNG (PJ) FY2019 guidance Domestic & Spot LNG 232 Contract LNG 427 Contract LNG (mmboe) 56.4
APLNG is targeting operating breakeven of US$22-26/boe and distribution breakeven of US$39-44/boe in FY2019.
For every US$10/boe above distribution breakeven, Origin’s share of APLNG distributable cash flow is expected to be approximately US$200m.
FY2019 oil and LNG hedging
FY2019 oil hedging consists of 15.4 mmbbl hedged through a combination of put and call options, collars and three-way producer hedges.
Origin manages its exposure to APLNG’s uncontracted LNG and gas sales predominately through executing forward fixed price hedge contracts. These hedge contracts have an estimated FY2019 hedge mark-to-market cost of $75-$85 million at current market prices.
Refer to section 3.4 for details. Corporate
Corporate costs are expected to be $60-$65 million.
Capital expenditure (excluding APLNG) is expected to be $385-$445 million:
• Mandatory ($80-$100 million): Beetaloo, Ironbark and Power of Choice
• Sustaining ($200-$220 million): Generation, LPG and Solar businesses
• Productivity/growth ($105-$125 million): Generation flexibility, digital systems and investments in new customer-focussed technologies and solutions.
23 of 92 Origin Energy Limited ABN 30 000 051 696

3. Financial update
3.1 Financial summary
Year Ended 30 June 2018 2017 Change Change ($m) ($m) ($m) (%)
Statutory Profit/(Loss) 218 (2,226) 2,444 n/a Underlying earnings (Continuing operations):
Energy Markets 1,811 1,492 319 21 Integrated Gas 1,251 747 504 67 Corporate (115) (66) (49) 74
Underlying EBITDA 2,947 2,173 774 36 Underlying Profit 838 400 438 110 Underlying earnings per share 47.7¢ 22.8¢ 24.9¢ 109 Underlying ROCE 8.4% 5.5% 3 Adjusted Net Debt/Underlying EBITDA(a) 3.4x 5.4x (37) Other (Total operations):
Underlying profit 1,022 550 472 86 Net cash flow from operating and investing activities (NCOIA) 2,645 1,378 1,267 92
Adjusted Net Debt 6,496 8,111 (1,615) (20) Gearing 35% 42% (7) (a) FY2017 Adjusted Net Debt/Underlying EBITDA is calculated on a total operations basis.
For the year ended 30 June 2018, the statutory profit was $218 million compared to a loss of $2,226 million in FY2017, which largely reflected post-tax impairment charges. Underlying Profit from continuing operations more than doubled during the period to $838 million reflecting improved performance in both our Energy Markets and Integrated Gas businesses - refer to sections 4.1 and 4.2 respectively for details.
Corporate costs increased by $49 million due to an increase in non-cash provisions relating to legacy sites remediation ($70 million), partially offset by FX gains relating to interest received on MRCPS and cost reductions.
Refer to Appendix 1 for a detailed breakdown of Underlying Profit.
Underlying ROCE from continuing operations improved by 3% to 8.4% reflecting increased earnings in both the Energy Markets and Integrated Gas businesses and lower average capital employed from the impact of impairments in H1 FY2018 and prior periods. Refer to Appendix 1 for a detailed breakdown of ROCE.
Net cash from operating and investing activities (NCOIA) increased by 92% to $2,645 million driven by improved earnings in Energy Markets, increased cash flows from APLNG and the successful completion of the Lattice Energy and Acumen sales. Refer to section 3.3 and Appendix 1 for details.
Adjusted Net Debt reduced by $1.6 billion to $6.5 billion at 30 June 2018 and Adjusted Net Debt/Underlying EBITDA was 3.4x, within the interim capital structure target of 3.0 – 3.5x. Gearing reduced 7% from 42% at 30 June 2017 to 35% at 30 June 2018. Refer to section 3.4 for details.
The Board has determined not to pay a dividend in respect of earnings for the second half of 2018.
24 of 92 Origin Energy Limited ABN 30 000 051 696

3.2 Reconciliation from Statutory to Underlying Profit
Year Ended 30 June 2018 2017 Change ($m) ($m) ($m)
Statutory Profit/(Loss) 218 (2,226) 2,444 Items Excluded from Underlying Profit (post-tax)
Fair value and foreign exchange movements (410) 96 (506) LNG items pre-revenue recognition - (36) 36 Disposals, impairments and business restructuring (394) (2,836) 2,442 Total Items Excluded from Underlying Profit (post-tax) (804) (2,776) 1,972 Underlying Profit (Total operations) 1,022 550 472
Fair value and foreign exchange movements reflect fair value losses associated with commodity hedging, interest rate swaps and other financial instruments (see Appendix 1 for further information on the nature of financial instruments).
Fair value and foreign exchange movements also includes the expense associated with certain up-front electricity hedge premiums ($112 million post-tax). Following the implementation of a new Financial Instruments accounting standard from 1 July 2018, we have undertaken a review of all fair value accounting and determined that, from FY2019, the expense of these upfront premiums will be included within Underlying Profit.
Disposals, impairments and business restructuring for the period of $394 million includes a gain on the sale of Acumen of $239 million, impairment charges recognised in H1 FY2018 of $533 million (post-tax), transaction costs associated with the disposal of Lattice Energy of $31 million (post-tax) and a Lattice Energy related Foreign Currency Translation Reserve release of $27 million.
3.3 Cash flows Sources of cash
Year Ended 30 June 2018 2017 Change ($m) ($m) ($m)
Underlying EBITDA - continuing operations 2,947 2,173 774 Non-cash APLNG Underlying EBITDA (equity accounted) (1,405) (859) (546) Other non-cash items in Underlying EBITDA 136 116 20 Change in working capital (245) (178) (67) Electricity hedge premiums (excluded from Underlying Profit) (160) (133) (27) Tax/Other (120) (115) (5) Cash flows from operating activities - continuing operations 1,153 1,005 148 Net cash from/(to) APLNG 363 (170) 533 Net disposals/other 1,486 888 598 Discontinued operations (NCOIA) 46 106 (60) Net sources of cash 3,048 1,829 1,219
Other non-cash items in Underlying EBITDA includes a provision increase for legacy site remediation of $70 million and amortisation of oil hedge premiums paid in the prior year of $64 million.
FY2018 Working capital increased by $245 million, primarily due to:
• $137 million increase in Energy Markets driven primarily by higher coal and LREC inventory;
• $54 million increase in Integrated Gas driven by timing of cost recoveries from APLNG as upstream operator; and
• $53 million increase in Corporate primarily relating to timing of property fit-out incentive receivable and prior period transaction costs paid during the year.
25 of 92 Origin Energy Limited ABN 30 000 051 696

Net cash distributions to Origin from APLNG were $363 million. This comprised the following:
• ($74) million contributed in the first half of FY2018
• $76 million received via reserve account loan
• $227 million received via MRCPS interest
• $134 million received via MRCPS buy back
Uses of cash
Year Ended 30 June 2018 2017 Change ($m) ($m) ($m)
Net sources of cash 3,048 1,829 1,219 Capital expenditure (328) (323) (5) Electricity futures collateral (170) 6 (176) Operator cash call movements (81) 12 (93) Interest and dividends paid (476) (542) 65 Close out of oil forward sale agreements(a) (265) - (265) Close out of FX hedges (56) - (56) Repayment of borrowings (1,675) (974) (699) Net uses of cash (3,050) (1,821) (1,228)
Net increase in cash and cash equivalents (2) 7 (9) (a) Relates to the close out of agreements to forward sell oil where the proceeds were received in a prior period. The assets forecast to deliver oil were sold as part of the sale of Lattice Energy.
FY2018 continuing capital expenditure of $328 million comprises:
• Mandatory spend ($55 million), primarily expenditure related to the implementation of Power of Choice electricity market reforms;
• Sustaining spend ($193 million), including $63 million related to Eraring power station maintenance and unit 1 overhaul, $33 million related to Darling Downs power station major outage and $26 million LPG spend; and
• Productivity / growth ($80 million), including Quarantine power station re-power and Future Energy investments.
Electricity futures collateral reflects movement in funds held on deposit to cover electricity futures positions. Operator cash call movements represents the movement in funds held and other balances relating to Origin’s role as upstream operator of APLNG.
3.4 Capital management Since 30 June 2017, Adjusted Net Debt has reduced from $8.1 billion to $6.5 billion driven by improved operating cash flow, cash returns from APLNG and the proceeds from asset sales.
During FY2018 Origin progressed a number of capital management initiatives including:
• The sale of Lattice Energy for $1,585 billion with an economic effective date of 1 July 2017 and net proceeds of ~ $1 billion used to repay debt;
• The sale of the Acumen metering business for $267 million with proceeds utilised to repay debt;
• The cancellation of $3.4 billion of surplus undrawn debt facilities following completion of the APLNG lenders’ test and asset disposals, resulting in ongoing commitment fee savings of ~ $20 million per annum; and
• The refinancing of $4 billion in syndicated debt with new four, five and seven year maturities and the redemption of the €500 million 2071 hybrid, which together with the proceeds from asset sales will result in savings of ~ $80 million per annum.
In addition, APLNG and its shareholders are actively pursuing opportunities to refinance APLNG project finance debt with the prime objective of reducing interest costs.
26 of 92 Origin Energy Limited ABN 30 000 051 696

Adjusted net debt down $1.6 billion
Origin’s target capital structure is to achieve an Adjusted Net Debt/Underlying EBITDA ratio of 2.5-3.0x which equates to a gearing range of ~ 25%-30%. Adjusted Net Debt/Underlying EBITDA as at 30 June 2018 was 3.4x, within the interim capital structure target of 3.0 – 3.5x, and gearing was 35% down from 42% at 30 June 2017.
See section 3.3 for details of cash movements.
FX/Other changes in Adjusted Net Debt relate primarily to foreign exchange and fair value adjustments associated with USD denominated debt held by Origin, electricity futures collateral, operator cash call movements and close out of FX hedges.
Origin holds investment grade credit ratings of BBB- (positive outlook) from S&P and Baa3 (positive outlook) from Moody’s.
Debt portfolio and management
For the 12 month period Origin’s average interest rate was 6.5%. As at 30 June 2018 Origin’s committed and undrawn debt facilities and cash totalled $3.6 billion.
After the capital management initiatives noted earlier in section 3.4, Origin’s average portfolio term to maturity increased from 2.8 years to 3.4 years, excluding the hybrid.
8,111
(1,153)
(363) 328
(1,485)
(46) 474
265
364
6,496
30 June 2017 Operatingcash flow -cont. ops
Net cashfrom
APLNG
Capex -cont. ops
Net saleproceeds
Discont. ops Interestpayments
Oil forwardsale close
out
FX/Other 30 June 2018
Movements in Adjusted Net Debt ($m)
-
500
1,000
1,500
2,000
FY19 FY20 FY21 FY22 FY23 FY24 FY25 FY26+
Debt maturity profile - post refinance ($m)
Loans & Bank Guarantees - Undrawn Loans & Bank Guarantees - DrawnCapital Markets Debt Hybrid
27 of 92 Origin Energy Limited ABN 30 000 051 696

APLNG funding
During the construction phase of APLNG, the shareholders, including Origin, contributed capital into APLNG via ordinary equity and the investment in preference shares (termed MRCPS) issued by APLNG. APLNG distributes funds to shareholders first via fixed dividends of 6.37% per annum on the MRCPS, recognised as interest income by Origin and second either via buy-back of MRCPS or dividends on ordinary equity. During FY2018, Origin received $227 million in MRCPS interest income and $134 million via a buy-back of MRCPS. The balance of MRCPS held by Origin at 30 June 2018 was US$2,673 million.
APLNG signed a US$8.5 billion project finance facility in 2012 to fund the construction of the LNG project and the facility was fully drawn in 2017. During the period APLNG made principal repayments of US$713 million (A$915 million) on this facility. The outstanding project finance loan balance as at 30 June 2018 was US$7,346 million (A$9,949 million, APLNG 100%).
Oil and LNG hedging
Origin entered into oil hedging instruments to manage its share of APLNG FY2019 and FY2020 oil price risk.
In FY2019, 15.4 mmbbl of oil have been hedged through a combination of put and call options, collars and three-way producer hedges for a premium of $34 million. The FY2019 oil hedge position provides full participation to oil price movements above US$75/bbl. The table below shows the hedging gain/(loss) at various FY2019 average oil prices.
FY2019 expected hedge gain/(loss) at various oil prices (A$m @ 0.75 AUD/USD)
US$60/bbl US$65/bbl US$70/bbl US$75/bbl and above
Hedge gain/(loss) 1 (36) (78) (111)
Premium (34) (34) (34) (34)
Total hedge cost (33) (70) (112) (145)
40
45
50
55
60
65
70
75
80
85
90
40 45 50 55 60 65 70 75 80 85 90
Eff
ectiv
e oi
l pric
e (U
S$/b
bl)
FY2020 average market oil price (US$/bbl)
FY2020 oil hedging payoff
FY20 effective price
FY20 effective price after hedging
All effective oil prices are in JCC crude oil equivalents. Effective price is inclusive of contract pricing lags, hedging gains (losses) and premium costs.
40
45
50
55
60
65
70
75
80
85
90
40 45 50 55 60 65 70 75 80 85 90
Eff
ectiv
e oi
l pric
e (U
S$/b
bl)
FY2019 average market oil price (US$/bbl)
FY2019 oil hedging payoff
FY19 effective price
FY19 effective price after hedging
28 of 92 Origin Energy Limited ABN 30 000 051 696
In FY2020, 11.6 mmbbl of oil have been hedged at a floor price of US$48/bbl and 4.2 mmbbl have been hedged via sold call options at a strike price of US$85/bbl, for a total premium cost of $26 million.
Gas volumes produced by APLNG in excess of the contracted volumes are sold to the domestic gas market and the spot LNG market. To manage the price risk associated with these volumes, Origin entered into a number of forward fixed price hedge contracts that settle over the period to the end of FY2020. Since entering into those contracts, the JKM spot price has increased resulting in higher cash flow from APLNG and a loss on those fixed price hedge contracts. Our FY2019 LNG hedge position currently consists of physical and financial LNG contracts at an estimated hedge mark-to-market cost of $75-$85 million at current market prices. In FY2020 we hold a smaller hedge position against the expected APLNG uncontracted sales exposure.
Origin also has an established position in LNG via a contract with ENN Energy Trading Company Limited to supply 0.28mtpa for a period of five years commencing in FY2019, and a contract to purchase 0.25mtpa from Cameron LNG for a period of 20 years on a Henry Hub linked basis commencing in FY2020, subject to the commencement of that project.
Final dividend
The Board has determined not to pay a dividend in respect of earnings for the second half of FY2018.
Subject to Board approval and no material adverse change in business conditions, our medium term outlook supports recommencement of dividends in FY2019.
29 of 92 Origin Energy Limited ABN 30 000 051 696

4. Review of segment operations
4.1 Energy Markets
Overview
Energy Markets comprises Australia’s largest energy retail business by customer accounts. The generation portfolio includes Australia’s largest fleet of gas-fired peaking power stations supported by a substantial contracted fuel position, a growing supply of renewable energy and Australia’s largest power station, the Eraring black coal-fired power station.
Energy Markets reports on an integrated portfolio basis. Electricity and Natural Gas gross profit and retail costs to serve are reported separately, as are the EBITDA of the Solar and Energy Services, Future Energy and LPG divisions.
Operations
Energy Markets delivered a 14% increase in electricity generation during FY2018, reflecting the 1 in 20 year outage at Eraring in the prior year and increased our generation in response to higher wholesale prices. Increased generation included contracting 240 MW of gas fired capacity at Pelican Point from 1 July 2017, utilising Origin’s gas supply portfolio.
Eraring generated 15.9 TWh, at the top end of guidance provided of 15.5-16 TWh. Since completing its major outage in FY2017 Eraring has achieved an average availability factor of 85%, well above the NEM average.
Renewable supply continues to grow with a further 77 MW coming online during FY2018.
Retail markets experienced increased competition during FY2018 impacting customer numbers, operating costs and revenue rates as more customers moved onto higher headline discounts. We are continuing to defend market share and manage for value and are focused on transforming the customer experience and transitioning to a more efficient cost structure through a digital first approach.
Underlying EBITDA -
continuing operations
1,811M Up 21% vs FY2017
Electricity Generation
Up by
14% vs FY2017 to 25.4 TWh (owned and contracted)
13% Increase in gas sales
vs FY2017 to 281 PJ (internal and external sales)
Fuel Supply • Gas • Coal
Transportation • Flexible
contracted gas arrangements
Generation • 1 black coal generator • Australia’s largest
gas-fired fleet • Growing renewables
Networks • Regulated
(cost pass through)
Customers • Retail (consumer
and SME)
• Business (commercial and industrial)
Energy Markets operations
30 of 92 Origin Energy Limited ABN 30 000 051 696

Financial summary
Segment summary
Year Ended 30 June 2018 2017 Change Change ($m) ($m) ($m) (%)
Earnings:
Total Segment Revenue 14,344 13,558 786 6
Electricity gross profit 1,705 1,426 279 20
Natural Gas gross profit 649 528 121 23
Electricity & Natural Gas cost to serve (624) (541) (83) 15
LPG EBITDA 91 88 3 3
Solar & Energy Services EBITDA 10 5 5 100
Future Energy costs (19) (14) (6) 41
Underlying EBITDA 1,811 1,492 319 21
Depreciation and amortisation (359) (325) (34) 10
Underlying EBIT 1,453 1,167 286 25
Cash flow:
Underlying EBITDA 1,811 1,492 319 21
Change in working capital (137) (165) 28 (17)
Electricity hedge premiums (160) (133) (27) 21
Other (26) (60) 33 (56)
Cash flow from operating activities 1,487 1,134 353 31
Capital expenditure (302) (278) (24) 9
Net disposals 267 436 (169) (39)
Net cash flow from operating and investing activities 1,453 1,292 161 12
Underlying EBITDA
Energy Markets’ Underlying EBITDA increased $319 million to $1,811 million reflecting growth in both Electricity and Natural Gas gross profit, underpinned by strong wholesale portfolio performance, partially offset by increased retail costs to serve in a competitive market environment.
See Appendix 2 for a detailed breakdown of Energy Markets financial performance.
1,492
1,811 (68)
(131)478
61
60 (35) (48) 2
FY2017 ElectricityVolume
Competition /Activity
ElectricityWholesale Margin
Natural Gas Volume
Natural GasWholesale Margin
Cost toacquire
Cost tomaintain
Other FY2018
Movements in Energy Markets Underlying EBITDA ($m)
Gas +$121 million Electricity +$279 million
31 of 92 Origin Energy Limited ABN 30 000 051 696

Electricity gross profit increased $279 million driven by:
• Improved wholesale performance ($478 million) with a 3 TWh increase in owned and contracted generation offsetting higher green costs from the roll off of legacy LREC inventory and increases in the SRES regulatory rate; partly offset by
• lower sales volumes ($68 million) reflecting a combination of customer losses, milder weather and continued energy efficiency and solar PV penetration; and
• Increased competition and customer activity ($131 million) including more customers moving onto discounted market offers.
Higher wholesale electricity prices and an increase in generation volumes, allowing for a reduction in contracted and spot electricity purchases saw unit margin increase from $35.90/MWh to $45.50/MWh.
Natural gas gross profit increased $121 million reflecting improved sales volumes ($61 million) and margins ($60 million). A strong and flexible supply portfolio facilitated additional sales to business customers (26.5 PJ) and our own electricity generation portfolio (5.2 PJ). Unit margin increased across business and retail customer segments as a result of a competitive gas portfolio and rising market price environment. Average margin increased $0.2/GJ to $3.0/GJ notwithstanding higher gas procurement costs and the impact of a higher proportion of business customer volumes at lower unit margin.
Electricity and natural gas cost to serve increased by $83 million to $624 million due to increased competitive activity, reflecting higher energy prices and new entrants:
• Increased cost to acquire and retain ($35 million) reflecting:
Costs associated with increased activity/competition and brand ($34 million) including a 23% increase in call volumes and a 23% increase in win/retain activity
• Increased cost to maintain ($48 million) due to:
Higher bad and doubtful debts expense ($13 million) reflecting rising energy prices and more customers on payment plans;
Ongoing spend on data analytics to support customer strategy ($10 million) and increased digital interactions ($2 million); and
Other costs associated with an increase in activity/competition ($8 million).
-
5
10
15
20
25
30
35
40
FY17 FY18
Sources of Electricity (TWh)
Renewables Coal (Eraring)Gas OtherContracts Spot
-
50
100
150
200
250
300
FY17 FY18 FY17 FY18
Sources Uses
Sources and Uses of gas (PJ)
0
500
1,000
1,500
2,000
2,500
FY17 FY18
Customer Wins/Retains ('000s)
Wins Retains
32 of 92 Origin Energy Limited ABN 30 000 051 696

There was a 17,000 decrease in electricity and natural gas customer accounts during the period due to increased competition and new entrants.
We competed actively for customers through various sales channels, improving service, introducing new products and campaigns, which contributed to net customer gains of 30,000 in H2 FY2018. We lifted customer experience metrics by achieving the top Strategic Net Promoter Score of Tier 1 retailers and Interaction Net Promoter Score increasing by six-points to 21.7.
Origin’s digital-first approach is driving more and more customer interactions through online channels, resulting in:
• An 18% increase in eBilling accounts to 2.1 million;
• A 28% increase in online sales to 345,000;
• A 13% increase in direct debit accounts to 1.1 million; and
• A 54% increase in MyAccount and Mobile App unique visits.
Future Energy
During the year we progressed a series of initiatives to connect customers to the energy and technologies of the future, including:
• Collaborative energy programs: We are a co-founder of Free Electrons, a global clean energy accelerator program that selects start-ups each year to undergo rigorous assessments, culminating in market trials with large utilities such as Origin. The 2018 program commenced in May with 15 start-ups and 10 utility partners involved. We are also the principal sponsor of Energy Lab based at the University of Technology, Sydney, a home for clean energy innovation and Australian energy technology start-ups.
• Energy management trials: We have rolled out Usage Buster to approximately 40,000 smart meter customers to break down their home energy usage and are working with commercial and industrial customers on demand-side management aimed at shifting load to achieve potential electricity cost savings.
• Connected home: We launched HomeHQ, a smart home solution allowing customers to monitor and control aspects of their home, as part of a bundled energy solution.
• Integrated renewable energy: Trial of a peer to peer energy trading solution.
(47)
30
(60)
(50)
(40)
(30)
(20)
(10)
0
10
20
30
40
H1 FY18 H2 FY18
Net customer movement (000s)
33 of 92 Origin Energy Limited ABN 30 000 051 696

4.2 Integrated Gas
Overview
Integrated Gas comprises Origin’s 37.5% shareholding in APLNG (an equity accounted incorporated joint venture), two potential unconventional exploration and development assets (Beetaloo and Ironbark) and a potential conventional development resource in the offshore Browse Basin. APLNG operates Australia’s largest CSG to LNG export project (by nameplate capacity) and has Australia’s largest 2P CSG reserves4. Origin is the operator of the upstream CSG exploration and appraisal, development and production activities. ConocoPhillips is the operator of the two train LNG facility at Gladstone in Queensland.
As APLNG is an incorporated joint venture, Integrated Gas reports its share of APLNG EBITDA, as well as costs (net of recoveries) incurred as upstream operator and corporate service provider and other costs incurred in managing this investment and Origin’s exposure to LNG pricing risk. The share of APLNG ITDA is recorded as one line item between EBITDA and EBIT.
Operations
APLNG operations
APLNG continues to deliver increased production and revenue with more than 250 LNG cargoes loaded and shipped to 30 June 2018, including 125 cargoes in FY2018. APLNG has a proven ability to produce at > 10% above the downstream plant’s 9 mtpa nameplate capacity. APLNG successfully completed the project finance lenders’ tests in FY2018, releasing the remaining US$3.4 billion of shareholder guarantees in August 2017.
Planned maintenance was successfully completed during the second half of FY2018 on both LNG trains with excess gas volumes during this period directed to the domestic market and to the other LNG counterparties. Production from operated fields averaged 1,410 TJ/d over the year compared to 1,225 TJ/d for the same period last year.
APLNG announced an agreement to supply an additional 41 PJ of gas to Origin for the domestic market over 14 months commencing November 2017, playing a significant role in supplying gas to the Australian east coast market.
4 As per EnergyQuest EnergyQuarterly, June 2018. Some of APLNG’s CSG reserves and resources are subject to reversionary rights and an ongoing interest in favour of Tri-Star. Refer to section 6 for further information.
Underlying EBITDA
1,251M Up $504m or 67% vs FY2017
APLNG Production (100%)
676PJ Up 67 PJ or 11% vs FY2017
42% Increase in APLNG
commodity revenue
vs FY2017
Exploration & Appraisal
Development & Processing • Drilling and
gathering
• Gas and water processing
Transportation • To Curtis Island
(Gladstone)
• To domestic markets
Customers • Domestic
• International (LNG)
34 of 92 Origin Energy Limited ABN 30 000 051 696

APLNG acquired various CSG interests from Tri-Star in 2002 that are subject to reversionary rights and an ongoing royalty in favour of Tri-Star. Refer to section 6 for disclosure relating to Tri-Star litigation associated with these CSG interests and for a description of other risks and mitigants with respect to APLNG’s gas reserves, resources and deliverability. Other operations Beetaloo (Northern Territory)
Origin has a 70% interest in exploration permits over 18,500 km2 in the Beetaloo Basin. This is a compelling exploration opportunity with four stacked, unconventional hydrocarbon plays identified and a booked contingent resource of 6.6TCF (100%) relating to the Velkerri B shale dry gas play. Origin is entering Stage 2 appraisal targeting the Kyalla and Velkerri shale liquids rich gas plays. The Scientific Inquiry into Hydraulic Fracturing in the Northern Territory released its Final Report in April 2018, allowing the Northern Territory government to lift the moratorium on fracking. Origin continues to work with the government on implementation of the 135 recommendations from the inquiry and engage with stakeholder groups, including those directly connected to the project area.
Ironbark (Surat Basin, Queensland)
The Ironbark development has entered FEED for Stage 1 development with a revised multi-stage field development plan, initially targeting the high permeability sweet spot (Undulla Nose extension) in the North West sector of the tenement. Successful testing of low permeability drilling techniques at APLNG, which could be applied to Ironbark, provide the potential for development of additional resource. Origin is considering various options to bring the Ironbark gas to market and the FEED process is expected to inform an optimum path for development of the resource in the future.
Financial Summary
Segment Summary Year Ended 30 June 2018 2017 Change Change Continuing Operations ($m) ($m) ($m) (%)
Earnings:
Share of APLNG EBITDA 1,405 859 546 64
Origin only commodity hedging (111) (98) (13) 13
Other Origin only costs (43) (14) (29) 207
Underlying EBITDA 1,251 747 504 67
Origin Depreciation and amortisation (22) (19) (3) 16
Share of APLNG ITDA (1,194) (925) (269) 29
Underlying EBIT 34 (197) 231 n/a
Interest income 227 199 28 14
Underlying Profit 261 2 259 13,971
Cash flow:
Underlying EBITDA 1,251 747 504 67
Non-cash APLNG Underlying EBITDA (equity accounted) (1,405) (859) (546) 64
Other Non-cash items in Underlying EBITDA(a) 66 116 (50) (43)
Change in working capital (54) (8) (46) 575
Other (20) (77) 57 (74)
Cash flow from operating activities (164) (81) (83) 102
Capital expenditure (21) (31) 10 (32)
Net disposals - 403 (403) n/a
Net cash from/(to) APLNG(b) 287 (297) 584 n/a
Net cash flow from operating and investing activities 101 (7) 108 (1,635) (a) Includes $64 million related to amortisation of oil hedge premiums paid for in the prior year (FY2017: $117 million). (b) Excludes $76 million loan proceeds (FY2017: $127 million) included in financing cash flows.
35 of 92 Origin Energy Limited ABN 30 000 051 696

Share of APLNG (+$546 million)
Origin only costs (-$42 million)
Underlying EBITDA
Integrated Gas Underlying EBITDA increased by $504 million to $1,251 million primarily reflecting increased production and higher commodity prices.
APLNG opex/other includes $41 million relating to the exploration write-off of ATP663 (Gilbert Gully) and increased purchases and volume related costs ($63 million), partially offset by net capitalised earnings from prior year ($32 million).
Commodity hedging reflects slightly lower oil hedging costs of $95 million, inclusive of premiums ($102 million in FY2017) offset by increased costs associated with LNG hedging of $16 million ($4 million gain in FY2017).
Origin Other includes lower cost recoveries relating to Origin’s upstream operatorship of APLNG.
Origin’s share of APLNG production increased by 25 PJ or 11% to 254 PJ reflecting a full 12 month contribution from Train 2.
The average realised domestic gas price increased 48% to $4.50/GJ reflecting a reduction in sales of low priced gas under legacy contracts and higher market prices.
73 64 80 77
156 189 148 178
FY17 FY18 FY17 FY18
Production (PJe) Sales (PJe)
APLNG Production and Sales (Origin share) (PJ)
Domestic Directed to LNG
3.04
4.50
FY17 FY18
APLNG Domestic Price(A$/GJ)
6.48
7.90
FY2017 FY2018
APLNG LNG Price(US$/MMBTU)
747
1,251
(63)(29)
289
214
106 (13)
FY2017 LNG Volume LNG Price Domestic Revenue
APLNG opex/other
Commodityhedging
Origin Other FY2018
Movements in Integrated Gas Underlying EBITDA - continuing operations ($m)
36 of 92 Origin Energy Limited ABN 30 000 051 696

Cash flow APLNG generated Free Cash Flow of $2.6 billion (APLNG 100%) at an effective oil price of US$56/bbl in FY2018. After servicing project finance interest and principal, net cash flow available for distribution was $1.3 billion (Origin’s 37.5% share: $482million). Refer to Appendix 3 for additional detail. Increased production and higher commodity prices combined with a reduction in capital expenditure resulted in net cash from APLNG to Origin of $363 million, compared to a $170 million contribution from Origin to APLNG in FY2017. This is slightly lower than the share of distributable cash flow generated as cash was retained by APLNG for scheduled project finance repayments.
Year Ended 30 June 2018 100% APLNG (A$m) @ 0.78 AUD/USD Capital expenditure – Sustain 1,105 Capital expenditure – E&A 65 Operating expenses – pre-capitalisation 1,673 Less: Spot LNG & domestic revenue (1,345)
Operating breakeven 1,498
Operating breakeven (US$/boe) 21
Project finance interest 418 Project finance principal 915
Distribution breakeven 2,831
Distribution breakeven (US$/boe) 39
Sales Volumes Domestic and Spot LNG (PJ) 248 Contract LNG volumes (PJ) 432
Contract LNG volumes (mmboe) 57.0
APLNG FY2018 distribution breakeven of US$39/boe is US$6/boe lower than FY2018 guidance of US$45/boe driven by:
• Operated well cost savings of US$2/boe with cost per well reducing to $1.9 million from $2.4 million;
• Changes to scope and timing of non-operated activity (US$2/boe); and
• Higher spot LNG and domestic revenue from higher volumes sold at favourable realised prices (US$2/boe).
Operating expenses were in line with expectations and reflect gas purchases to support the lenders test and redundancy costs.
-
1,000
2,000
3,000
4,000
5,000
6,000
FY17 FY18
APLNG uses of cash (A$m)
$2.6 billion Free Cash Flow
$1.3 billion distributable
cash flow
37 of 92 Origin Energy Limited ABN 30 000 051 696

5. Climate change disclosures
Origin unequivocally supports the Paris Climate Accord and other measures to reduce carbon emissions. We support Australia’s 2030 target and the objectives of the proposed National Energy Guarantee, and have advocated for more ambitious targets for the electricity sector over time, including a transition to net zero emissions by 2050 or earlier.
The disclosures below reflect the adoption of the recommendations made by the Financial Stability Board’s Taskforce on Climate-related Financial Disclosures (TCFD).
Governance
Board • Considers, reviews and monitors climate-related risks and opportunities as part of investment considerations, regular financial and operational performance reviews.
• Risk and HSE committees meet at least quarterly.
• Monitors and oversees progress on targets aimed at addressing climate related issues and considers climate related risks and opportunities at least annually as part of the Company’s strategic planning process.
HSE risk controls • Outlines the requirements for managing climate related risks and impacts including carbon emissions.
• Further detail on the risk management framework can be found in section 6 of this Operating and Financial Review.
Executive leadership team
• Strategic planning: monitor climate change risks via risk, assurance and compliance meetings.
• Track, report and escalate risks to the appropriate level of management within Origin based on the assessed level of risk and the agreed escalation protocols.
• The Executive General Manager, Integrated Gas and the Executive General Manger, Future Energy and Business Development are responsible for identifying, quantifying and managing climate related risks and reporting these to the Board and the Risk and HSE Committees.
Strategy
As a leading Australian integrated energy company, climate related risks and opportunities are a core feature of our strategy. We have a five pillar approach to drive decarbonisation of our business.
1) Exit coal-fired power generation by 2032;
2) Significantly grow renewables in our portfolio;
3) Utilise our strong gas position as a lower emissions generation firming fuel;
4) Empower customers with cleaner, smarter energy solutions; and
5) Demonstrate leadership in climate change advocacy.
Origin is positioned to prosper in a low carbon economy and our long term planning is based on ensuring resilience and generating value under a number of carbon reduction scenarios.
Our wholesale generation portfolio is not only resilient but well placed to prosper in a low carbon world:
• Eraring is our only coal-fired power station
• Short generation – provides flexibility to add low cost renewables to our portfolio without stranding assets
• Increasing renewables exposure – targeting renewables reaching 25% of generation mix by 2020
• Gas peaking fleet – sufficient capacity to support our increased uptake of renewables
• Strong gas supply – gas is the only fossil fuel to grow under IEA’s 450 scenario
38 of 92 Origin Energy Limited ABN 30 000 051 696
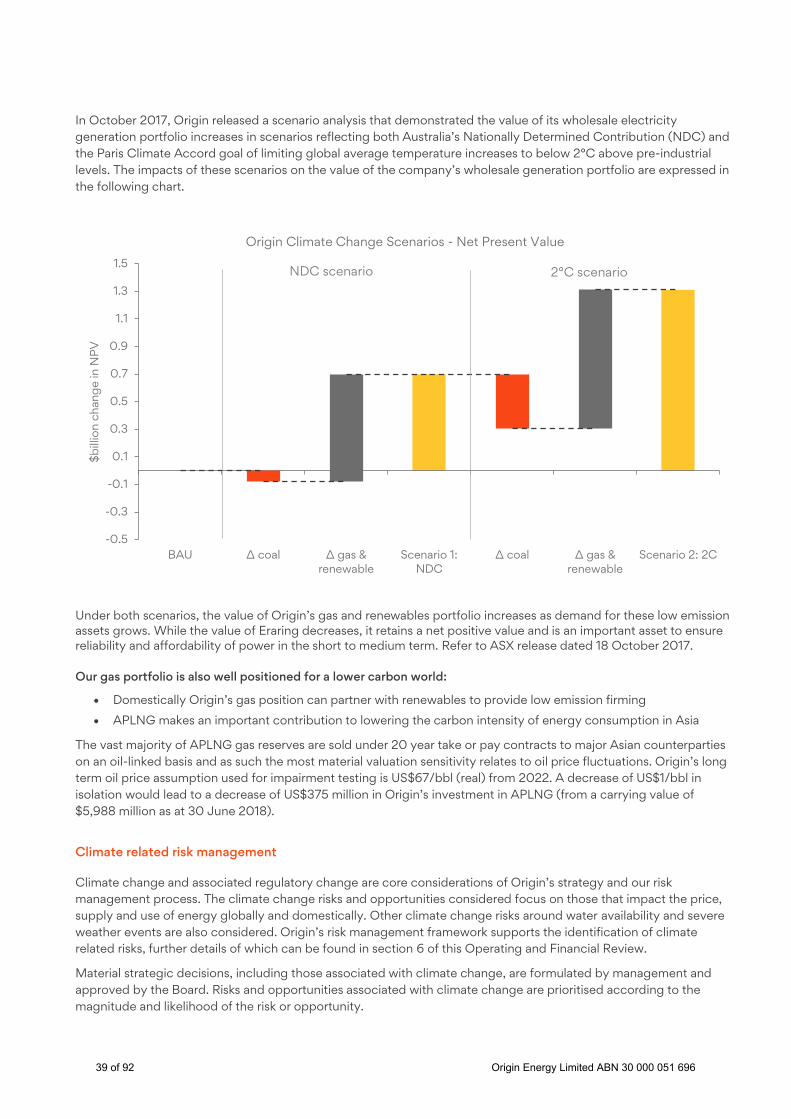
In October 2017, Origin released a scenario analysis that demonstrated the value of its wholesale electricity generation portfolio increases in scenarios reflecting both Australia’s Nationally Determined Contribution (NDC) and the Paris Climate Accord goal of limiting global average temperature increases to below 2°C above pre-industrial levels. The impacts of these scenarios on the value of the company’s wholesale generation portfolio are expressed in the following chart.
Under both scenarios, the value of Origin’s gas and renewables portfolio increases as demand for these low emission assets grows. While the value of Eraring decreases, it retains a net positive value and is an important asset to ensure reliability and affordability of power in the short to medium term. Refer to ASX release dated 18 October 2017.
Our gas portfolio is also well positioned for a lower carbon world:
• Domestically Origin’s gas position can partner with renewables to provide low emission firming
• APLNG makes an important contribution to lowering the carbon intensity of energy consumption in Asia
The vast majority of APLNG gas reserves are sold under 20 year take or pay contracts to major Asian counterparties on an oil-linked basis and as such the most material valuation sensitivity relates to oil price fluctuations. Origin’s long term oil price assumption used for impairment testing is US$67/bbl (real) from 2022. A decrease of US$1/bbl in isolation would lead to a decrease of US$375 million in Origin’s investment in APLNG (from a carrying value of $5,988 million as at 30 June 2018).
Climate related risk management
Climate change and associated regulatory change are core considerations of Origin’s strategy and our risk management process. The climate change risks and opportunities considered focus on those that impact the price, supply and use of energy globally and domestically. Other climate change risks around water availability and severe weather events are also considered. Origin’s risk management framework supports the identification of climate related risks, further details of which can be found in section 6 of this Operating and Financial Review.
Material strategic decisions, including those associated with climate change, are formulated by management and approved by the Board. Risks and opportunities associated with climate change are prioritised according to the magnitude and likelihood of the risk or opportunity.
-0.5
-0.3
-0.1
0.1
0.3
0.5
0.7
0.9
1.1
1.3
1.5
BAU ∆ coal ∆ gas & renewable
Scenario 1:NDC
∆ coal ∆ gas & renewable
Scenario 2: 2C
$bill
ion
chan
ge
in N
PV
Origin Climate Change Scenarios - Net Present Value
2°C scenario NDC scenario
39 of 92 Origin Energy Limited ABN 30 000 051 696

Management considers a range of climate related risks as part of its risk identification process. These risks are reported to the Risk Committee in terms of their magnitude and likelihood of occurrence.
Origin’s Supplier Code of Conduct was developed throughout FY2018 and will be implemented over the next year. It requires that suppliers ensure their practices consider the impact on the social and environmental sustainability of the communities in which they operate. This requirement will be operationalised through sourcing processes and supported through Origin’s HSE management system.
Metrics & targets
During FY2018, operated Scope 1 & 2 carbon emissions increased to 20,079 ktCO2-e due to a full year’s contribution from APLNG Train Two and increased output from the Eraring black coal-fired power station. Eraring power station is a major contributor to reliability and security of electricity supply following the closure of the Hazelwood brown coal-fired power station in Victoria.
Further metrics on climate change are detailed in section 1 of this report.
In December 2017, Origin announced a commitment to a company wide, independently verified target of a 50% reduction in Scope 1 & 2 emissions5 and a 25% reduction in value chain Scope 3 emissions6 by 2032, both from 2017 baseline levels. We remain committed to and confident in achieving these targets through the continued investment in renewable supply and our commitment to exit coal-fired generation by 2032.
We are targeting renewables to comprise more than 25% of our generation mix by 2020 – up from 13% today. The chart below shows the contracted renewable projects from 2018 to 2020.
*Partially online at 30 June 2018.
5 Excluding APLNG Train two, Origin will review the inclusion of Train two emissions in our target baseline during FY2019. 6 Excluding LNG exports.
-
500.0
1,000.0
1,500.0
2,000.0
FY18contractedrenewables
Clare solar*(QLD)
Bungala solar*(SA)
Daydreamsolar (QLD)
DarlingDowns solar
(QLD)
Stockyard Hillwind (VIC)
MW
Origin's Growth in Renewable Capacity to 2020(committed as at 30th June 2018)
40 of 92 Origin Energy Limited ABN 30 000 051 696
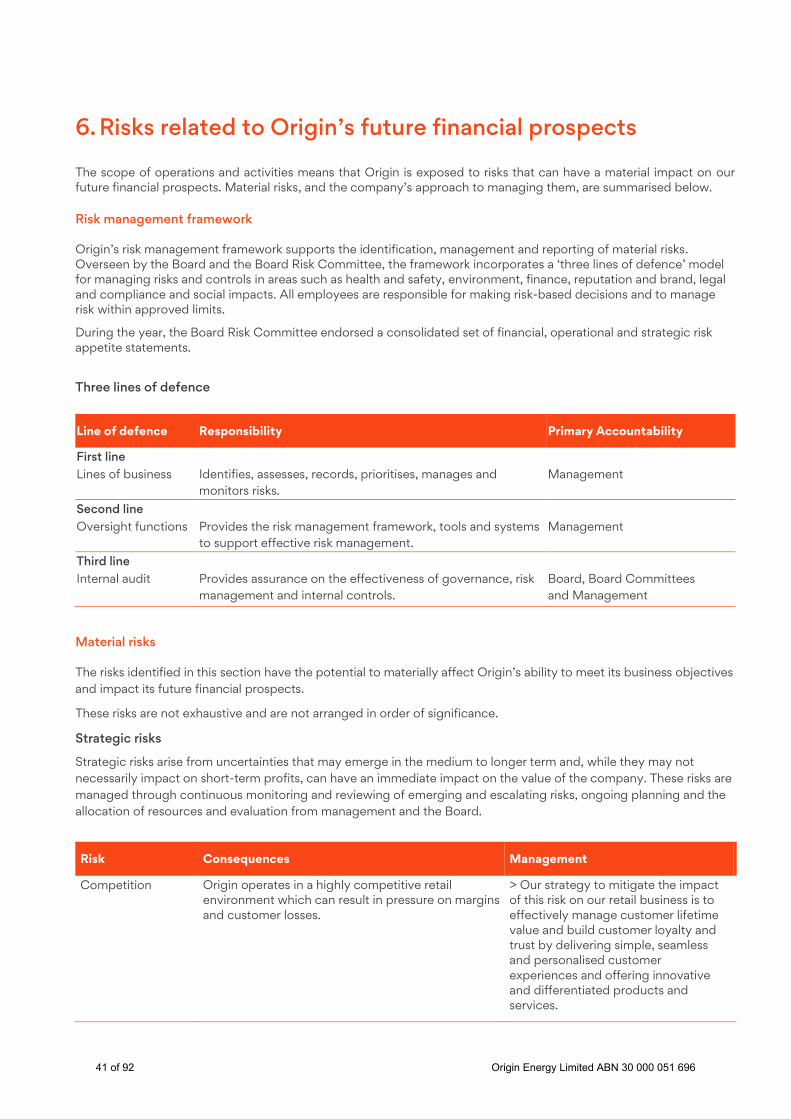
6. Risks related to Origin’s future financial prospects
The scope of operations and activities means that Origin is exposed to risks that can have a material impact on our future financial prospects. Material risks, and the company’s approach to managing them, are summarised below.
Risk management framework
Origin’s risk management framework supports the identification, management and reporting of material risks. Overseen by the Board and the Board Risk Committee, the framework incorporates a ‘three lines of defence’ model for managing risks and controls in areas such as health and safety, environment, finance, reputation and brand, legal and compliance and social impacts. All employees are responsible for making risk-based decisions and to manage risk within approved limits.
During the year, the Board Risk Committee endorsed a consolidated set of financial, operational and strategic risk appetite statements.
Three lines of defence
Line of defence Responsibility Primary Accountability
First line Lines of business Identifies, assesses, records, prioritises, manages and
monitors risks. Management
Second line Oversight functions Provides the risk management framework, tools and systems
to support effective risk management. Management
Third line Internal audit Provides assurance on the effectiveness of governance, risk
management and internal controls. Board, Board Committees and Management
Material risks
The risks identified in this section have the potential to materially affect Origin’s ability to meet its business objectives and impact its future financial prospects.
These risks are not exhaustive and are not arranged in order of significance.
Strategic risks
Strategic risks arise from uncertainties that may emerge in the medium to longer term and, while they may not necessarily impact on short-term profits, can have an immediate impact on the value of the company. These risks are managed through continuous monitoring and reviewing of emerging and escalating risks, ongoing planning and the allocation of resources and evaluation from management and the Board.
Risk Consequences Management
Competition
Origin operates in a highly competitive retail environment which can result in pressure on margins and customer losses.
> Our strategy to mitigate the impact of this risk on our retail business is to effectively manage customer lifetime value and build customer loyalty and trust by delivering simple, seamless and personalised customer experiences and offering innovative and differentiated products and services.
41 of 92 Origin Energy Limited ABN 30 000 051 696

Competition also impacts Origin’s wholesale business, with generators competing for capacity and fuel and the potential for gas markets to be impacted by new domestic gas resources, LNG imports and the volume of gas exports.
> We endeavour to mitigate the impact of this risk on our wholesale business by sourcing competitively priced fuel to operate our generation fleet and optimising flexibility in our fuel, transportation and generation portfolio.
Technological developments / disruption
Distributed generation is empowering consumers to own, generate and store electricity, consuming less energy from the grid. Technology is allowing consumers to understand and manage their power usage through smart appliances, having the potential to disrupt the existing utility relationship with consumers. Advances in technology have the potential to create new business models and introduce new competitors.
> Origin actively monitors and participates in technological developments through local and global start-up accelerator programs, trialling new energy technology and exploring investments in new products or business models. > In parallel, Origin is growing its distributed generation and home energy services businesses and endeavouring to mitigate the impact of this risk on its core energy businesses by offering superior service and innovative products and reducing cost to serve.
Changes in demand for energy
Changes in energy demand driven by price, consumer behaviour, mandatory energy efficiency schemes, government policy, weather and other factors can reduce Origin’s revenues and adversely affect Origin’s future financial performance.
> Origin is partially mitigating the impact of this risk by applying advanced data and analytics capability to smart meter data to better predict customer demand and enable Origin to develop data based customer propositions.
Regulatory policy
Origin has broad exposure to regulatory policy change and other government interventions including energy markets, climate change policy, gas development and royalties and tax policy. Changes to policy and other government interventions will impact financial outcomes and, in some cases, change the commercial viability of existing or proposed projects or operations. Specific areas subject to review and development include retail price regulation, the National Energy Guarantee, domestic gas market interventions and the Petroleum Resources Rent Tax.
> Origin contributes to the policy process at all levels of government by actively participating in public policy debate, proactively engaging with policy makers and participating in public forums, industry associations, think tanks and research. > Origin advocates directly with key ministers and shadow ministers to achieve sound policy outcomes aligned with our commercial objectives. > Origin actively promotes the customer and economic benefits publicly that flow from our activities in deregulated energy markets.
Climate change
Climate change impacts many parts of Origin’s business. Key risks and opportunities include ongoing decarbonisation of energy markets, decreased demand for fossil fuels in some markets, reduced lifespan of carbon-intensive assets, changes to energy market dynamics caused by the intermittency of renewables and community demand for lower-carbon sources of energy.
> Our strategy for transitioning to a carbon constrained future is focused on growth in renewables, gas and cleaner, smarter customer solutions. Origin has prepared for a range of decarbonisation scenarios. > Origin has committed to significantly growing supply of renewable generation, including 1,200 MW of committed large scale solar and wind energy since March 2016.
42 of 92 Origin Energy Limited ABN 30 000 051 696

> Origin uses the flexibility in its gas supply and peaking generation capacity to manage the intermittency of renewables. > Committed to halving emissions by 2032 in a science-based target.
Financial risks
Financial risks are the risks that directly impact the financial performance and resilience of Origin.
Risk Consequences Management
Commodity
Origin has a long term exposure to international oil, LNG and gas prices through the sale of gas and LPG, and its investment in APLNG. Pricing can be volatile and downward price movements can impact cash flow, financial performance, reserves and asset carrying values. Prices and volumes for electricity that Origin sources to on-sell to customers are volatile and are influenced by many factors that are difficult to predict. Long term fluctuations in coal and gas prices also impact the margins of Origin's generation portfolio.
> Commodity exposure limits are set by the Board to manage the overall financial exposure that Origin is prepared to take. > Origin's commodity risk management process monitors and reports performance against defined limits. > Commodity price risk is managed through a combination of physical positions and derivatives contracts.
Foreign exchange and interest rates
Origin has exposures through principal debt and interest payments in foreign currency long term borrowings, through the sale and purchase of gas and LPG, and through its investments in APLNG and the company’s foreign operations. Interest rate movements and foreign exchange fluctuations could lead to a decrease in Australian dollar revenues or increased payments in Australian dollar terms.
> Risk limits are set by the Board to manage the overall exposure. > Origin's treasury risk management process monitors and reports performance against defined limits. > Foreign exchange and interest rate risks are managed through a combination of physical positions and derivatives.
Liquidity and access to capital markets
Origin’s business, prospects, and financial flexibility could be adversely affected by a failure to appropriately manage its liquidity position, or if markets are not available at the time of any financing or refinancing requirement.
> Origin actively manages its liquidity position through cash flow forecasting and maintenance of minimum levels of liquidity as determined under Board approval limits.
Credit and counterparty
Some counterparties may fail to fulfil their obligations (in whole or part) under major contracts.
> Counterparty risk assessments are regularly undertaken and where appropriate, credit support is obtained to manage counterparty risk.
43 of 92 Origin Energy Limited ABN 30 000 051 696

Operational risks
Operational risks arise from inadequate or failed internal processes, people or systems or from external events.
Risk Consequences Management
Safe and reliable operations
Malfunctioning plant, major infrastructure failure, incorrect application of procedures, unsafe practices, a physical security breach, or a cyber-attack may lead to the loss of lives, asset damage, environmental damage and other impacts to third parties. A production outage or constraint, network or IT systems outage, would affect Origin's ability to deliver electricity and gas to its customers. A serious incident or a prolonged outage may also damage Origin’s financial prospects and reputation.
> Core operations are subject to comprehensive operational, safety and maintenance procedures and directives. > Origin personnel are adequately trained and licensed to perform their operational activities. > Origin maintains an extensive insurance program to mitigate consequences by transferring financial risk exposure to third parties where commercially appropriate.
Environmental
An environmental incident or Origin’s failure to consider and adequately mitigate the environmental, social and socio-economic impacts on communities and the environment has the potential to cause environmental impact, community action, regulatory intervention, legal action, reduced access to resources and markets, impacts to Origin’s reputation and increased operating costs.
> Origin engages with communities to understand, mitigate and report on environmental and social risks associated with its projects and operations. > At a minimum, the management of environmental and social risks meets regulatory requirements. Where practical, their management extends to the improvement of environmental values and the creation of socio-economic benefits. > A dedicated Board Committee oversees health, safety and environment risk. The Committee receives quarterly reporting of the highest rated environmental risks and mitigants, and reviews significant incidents and near misses.
Cyber security
A cyber security incident could lead to a breach of privacy, loss of and/or corruption of commercially sensitive data, and/or a disruption of critical business processes. This may adversely impact customers and the company’s business activities.
> A dedicated cyber risk team, reporting directly to the executive responsible for Risk, is responsible for implementing a Board-approved cyber strategy. > Our cyber strategy improves preparedness for four scenarios: external intrusion leading to data theft or disruption; ransomware attacks; insiders stealing or disclosing data; and deliberate system manipulation. > External cyber security specialists are regularly employed to assess our cyber security profile, including penetration testing. > Employees undertake compulsory cyber awareness training, including how to identify phishing emails and keep data safe, and are subject to a regular program of random testing.
44 of 92 Origin Energy Limited ABN 30 000 051 696

APLNG gas reserves, resources and deliverability
There is uncertainty about the productivity, and therefore economic viability, of resources and developed and undeveloped reserves. As a result, there is a risk that actual production may vary from that estimated, and in the longer term, that there will be insufficient reserves to supply the full duration and volumes to meet contractual requirements. As at 30 June 2018, APLNG’s total resources are estimated to be greater than its contractual supply commitments on a volume basis. However, under certain scenarios of production and deliverability of gas over time, there is a risk that the rate of gas delivery required to meet APLNG’s committed gas supply agreements may not be able to be met for the later years in the life of existing contracts.
> APLNG employs established industry procedures to identify and consider areas for exploration to mature contingent and prospective resources. > APLNG monitors reservoir performance and adjusts development plans accordingly and/or acquires reserves from alternate sources. > APLNG is progressing an exploration campaign to test high materiality plays that, if successful, could mitigate the deliverability risk. > APLNG is also progressing commercial arrangements for long term gas supply, and has the ability to substitute gas or LNG to meet contractual requirements if required
Conduct Unethical business practice or failure to comply with Origin’s Values may affect Origin’s risk profile by impacting its business operations, financial prospects or reputation, particularly with customers and community stakeholders.
> Origin’s Purpose, Values and Code of Conduct guide conduct and decision making across Origin. > A refresh of Company Values was deployed during the period throughout the company. > All Origin’s people are trained every two years in Origin’s Code of Conduct, and we conduct training for Insider Trading, privacy, anti-bribery and corruption and anti-competition and consumer law > Conduct risk is identified as a material risk within Origin’s risk management framework and is regularly reported to the appropriate Board Committee. Controls specific to the different parts of Origin’s business are the accountability of Business Units and are subject to Internal Audit.
Joint venture
Third party joint venture operators may have economic or other business interests that are inconsistent with Origin’s own and may take actions contrary to the company’s objectives, interests or standards. This may lead to potential financial, reputational and environmental damage in the event of a serious incident.
> Origin enforces a number of standards across its various joint venture interests. > Enterprise-wide joint venture governance and management standards are being revised to provide a more consistent approach to managing Origin’s joint ventures. > Origin actively monitors and participates in its joint ventures through participation in their respective boards and governance committees.
APLNG reversion See below
APLNG reversion
In 2002, APLNG acquired various CSG interests from Tri-Star that are subject to reversionary rights and an ongoing royalty in favour of Tri-Star. If triggered, the reversionary rights require APLNG to transfer back to Tri-Star a 45% interest in those CSG interests for no additional consideration. The reversion trigger will occur when the revenue from the sale of petroleum from those CSG interests, plus any other revenue derived from or in connection with
45 of 92 Origin Energy Limited ABN 30 000 051 696

those CSG interests, exceeds the aggregate of all expenditure relating to those CSG interests plus interest on that expenditure, royalty payments and the original acquisition price.
The affected CSG interests represent approximately 21% of APLNG’s 3P CSG reserves (as at 30 June 2018).
Tri-Star served proceedings on APLNG in 2015 claiming that reversion occurred as early as 1 November 2008 following ConocoPhillips’ investment in APLNG, on the assertion that the equity subscription monies paid by ConocoPhillips was revenue for purposes of the trigger. Tri-Star has also claimed in the alternative that reversion occurred in 2011 or 2012 following Sinopec’s investment in APLNG. These claims are referred to in this document as Tri-Star’s ‘past reversion’ claims.
Tri-Star has made other claims in these proceedings against APLNG. These relate to other aspects of the reversion trigger (including as to the calculation of interest) and the calculation of the royalty payable by APLNG to Tri-Star. The outcome of these other claims may impact on when reversion may occur in the future but will not result, if determined in favour of Tri-Star, in reversion having already occurred.
APLNG denies these claims and filed its defence and counter-claim in April 2016. Tri-Star responded with its reply and answer to APLNG’s defence and counter-claim in March 2018.
If Tri-Star’s past reversion claims are successful, then Tri-Star may be entitled to an order that reversion occurred as early as 1 November 2008. If the court determines that reversion has occurred, then APLNG may no longer have access to the reserves and resources that are subject to Tri-Star’s reversionary interests and may need to source alternative supplies of gas (including from third parties) to meet its contracted commitments. There are also likely to be a number of further complex issues that would need to be resolved as a consequence of any such finding in favour of Tri-Star. These matters will need to be determined by the court (either in the current or in separate proceedings) or by agreement between the parties, and they include:
• ownership and/or rights to access certain infrastructure;
• the terms under which some of the affected CSG interests will be operated where currently there are no joint operating agreements in place;
• the amount of Tri-Star’s contribution to the costs incurred by APLNG in exploring and developing the affected CSG interests between the date of reversion and the date of judgment, which APLNG has stated in its defence and counter-claim are in the order of $3.1 billion (as at 31 December 2015); and
• the consequences of APLNG having dealt with Tri-Star’s reversionary interests, between the date of reversion and the date of judgment, including the gas produced from them. Tri-Star has, in its reply and answer:
o estimated the value of such gas to be $2.06 billion (as at 31 December 2017) and approximately $1.08 billion per annum thereafter; and
o alleged that it should be entitled to set-off the value of such gas from any amount owing to APLNG arising from its counter-claim for contribution to the costs incurred by APLNG in exploring and developing the affected CSG interests between the date of reversion and the date of judgment.
Tri-Star has also commenced proceedings against APLNG which allege that APLNG breached three CSG joint venture agreements by failing to offer Tri-Star (and the other minority participants in those agreements) an opportunity to participate in the “markets” alleged to be constituted by certain of its LNG and domestic gas sales agreements, including the Sinopec and Kansai LNG sale agreements entered into by APLNG in 2011 and 2012. Tri-Star has alleged that it should have been offered participation in those sales agreements for its share of production from those three CSG joint ventures referable to both its small participating interests and its reversionary interests in those joint ventures.
Tri-Star is seeking damages and/or an order that APLNG offer Tri-Star (and the other minority participants in those CSG joint venture agreements) the opportunity to participate in those sales agreements for their proportionate share of production from those three CSG joint ventures. APLNG will defend the claims.
If APLNG is not successful in defending all or some of the claims being made in the proceedings by Tri-Star, APLNG’s financial performance may be materially adversely impacted and the amount and timing of cash flows from APLNG to its shareholders, including Origin, may be significantly affected.
If APLNG is successful in defending Tri-Star’s past reversion claims, the potential for reversion to otherwise occur in the future in accordance with the reversion trigger will remain.
46 of 92 Origin Energy Limited ABN 30 000 051 696

7. Important information
Forward looking statements
This Operating and Financial Review (OFR) contains forward looking statements, including statements of current intention, statements of opinion and predictions as to possible future events and future financial prospects. Such statements are not statements of fact and there can be no certainty of outcome in relation to the matters to which the statements relate. Forward looking statements involve known and unknown risks, uncertainties, assumptions and other important factors that could cause the actual outcomes to be materially different from the events or results expressed or implied by such statements, and the outcomes are not all within the control of Origin. Statements about past performance are not necessarily indicative of future performance.
Neither the Company nor any of its subsidiaries, affiliates and associated companies (or any of their respective officers, employees or agents) (the ‘Relevant Persons’) makes any representation, assurance or guarantee as to the accuracy or likelihood of fulfilment of any forward looking statement or any outcomes expressed or implied in any forward looking statement. The forward looking statements in this OFR reflect views held only at the date of this report and except as required by applicable law or the ASX Listing Rules, the Relevant Persons disclaim any obligation or undertaking to publicly update any forward looking statements, or discussion of future financial prospects, whether as a result of new information or future events.
Non-IFRS financial measures
This OFR and Directors’ Report refer to Origin’s financial results, including Origin’s Statutory Profit and Underlying Profit. Origin’s Statutory Profit contains a number of items that when excluded provide a different perspective on the financial and operational performance of the business. Income Statement amounts, presented on an underlying basis such as Underlying Profit, are non-IFRS financial measures, and exclude the impact of these items consistent with the manner in which senior management reviews the financial and operating performance of the business. Each underlying measure disclosed has been adjusted to remove the impact of these items on a consistent basis. A reconciliation and description of the items that contribute to the difference between Statutory Profit and Underlying Profit is provided in section 3.2 of this OFR.
Certain other non-IFRS financial measures are also included in this OFR. These non-IFRS financial measures are used internally by management to assess the performance of Origin’s business and make decisions on allocation of resources. Further information regarding the non-IFRS financial measures is included in the Glossary in Appendix 4 of this OFR. Non-IFRS measures have not been subject to audit or review. Certain comparative amounts from the prior corresponding period have been re-presented to conform to the current period’s presentation.
47 of 92 Origin Energy Limited ABN 30 000 051 696

Appendix 1 - Consolidated financial supplementary data
Underlying profit
Year Ended 30 June 2018 2017 Change Change ($m) ($m) ($m) (%)
Continuing operations: Energy Markets underlying EBITDA 1,811 1,492 319 21 Integrated Gas underlying EBITDA 1,251 747 504 67 Corporate underlying EBITDA (115) (66) (49) 74
Underlying EBITDA 2,947 2,173 774 36 Underlying depreciation and amortisation (381) (344) (37) 11 Underlying share of ITDA (1,194) (925) (269) 29 Underlying EBIT 1,372 904 468 52 Underlying interest income - MRCPS 227 199 28 14 Underlying net financing costs - other (497) (483) (15) 3 Underlying profit before income tax and non-controlling interests 1,102 620 482 78 Underlying income tax expense (261) (217) (44) 20 Non-controlling interests’ share of underlying profit (3) (3) - - Underlying profit 838 400 438 110 Underlying earnings per share 47.7¢ 22.8¢ 24.9¢ 109 Discontinued operations: Underlying profit 184 150 34 23 Total operations: Underlying profit 1,022 550 472 86
Discontinued operations
On 31 January 2018, Origin completed the $1,585 million sale of Lattice Energy to Beach Energy. Lattice Energy earnings have been classified as a discontinued operation in the current and prior period, along with the Darling Downs Pipeline and Jingemia asset in Western Australia in the prior period.
Year Ended 30 June 2018 2017 Change Change ($m) ($m) ($m) (%)
Underlying EBITDA 270 357 (87) (24) Underlying depreciation and amortisation - (133) 133 (100) Underlying EBIT 270 224 46 21 Underlying financing costs (8) (12) 4 (33) Underlying income tax expense (78) (62) (16) 26 Underlying profit 184 150 34 23 Items excluded from underlying profit (246) (324) 78 (24)
48 of 92 Origin Energy Limited ABN 30 000 051 696

Cash flow
Year Ended 30 June 2018 2017 Change Change ($m) ($m) ($m) (%)
Movements (continuing operations) Underlying EBITDA 2,947 2,173 774 36 Non-cash items in Underlying EBITDA(a) (1,269) (743) (526) 71
Movement in debtors (240) (380) 140 (37) Movement in creditors 144 11 133 1,181 Movement in inventory (76) 14 (89) (648) Movement in green certificates and prepayments (73) 177 (250) (142)
Change in working capital (245) (178) (67) 38 Electricity hedge premiums (excluded from Underlying Profit) (160) (133) (27) 21 Oil Puts premium paid - (64) 64 (100) Other (82) (104) 22 (21) Tax (refund received) / paid (38) 53 (91) (172)
Cash flows from operating activities (continuing operations) 1,153 1,005 148 15
Discontinued operations 140 284 (145) (51)
Total cash flows from operating activities 1,293 1,289 4 0 Capital expenditure (328) (323) (5) 2 Net cash from/(to) APLNG(b) 287 (170) 457 (269) APLNG – reserve accounts - (127) 127 (100) Net disposals 1,485 887 598 67 Interest income excl MRCPS 2 1 1 100
Cash flows from investing activities (continuing operations) 1,445 267 1,177 440
Discontinued operations – cash flow from investing activities (94) (178) 85 (47)
Total cash flows from investing activities 1,352 89 1,263 1,419
Net cash flows from operating and investing activities (NCOIA) 2,645 1,378 1,267 92 Net proceeds/(repayment) of debt (1,675) (974) (700) 72 Electricity Futures Collateral (170) 6 (176) n/a Operator cash call movements (81) 12 (93) n/a Oil forward sale agreements (265) - (265) n/a Close out of FX hedges (56) - (56) n/a APLNG – loan proceeds(c) 76 127 (51) (40) Interest paid (474) (540) 66 (12) Dividends paid (2) (2) - n/a
Total cash flows used in financing activities (2,647) (1,371) (1,276) 93 (a) Non-cash items in Underlying EBITDA includes the contribution from equity accounted APLNG operations ($1,405 million; FY2017 $859 million) partly offset by a provision increase for legacy site remediation ($70 million), amortisation of oil hedge premiums paid for in the prior year ($64 million; FY2017: $117 million) and exploration expense ($2 million; FY2017 nil). (b) APLNG net cash flow includes the receipt of $227 million interest on MRCPS and the receipt of $134m from APLNG buy-back of MRCPS less a $74 million contribution to APLNG in H1 FY2018. (c) APLNG - loan proceeds ($76 million) represents cash generated by APLNG as part of its normal business operations deposited to a project finance debt service reserve accounts. Upon issuance of a bank guarantee to APLNG by Origin the cash was distributed to Origin by way of a loan.
49 of 92 Origin Energy Limited ABN 30 000 051 696

ROCE calculation
As at 30 Jun 18 30 Jun 17 ($m) ($m) Net Assets - continuing operations 11,828 10,088
including:
Investment in APLNG 5,988 5,463 MRCPS issued by APLNG 3,620 3,609
Non-cash fair value uplift (28) (30) Adjusted net assets – continuing operations 11,800 10,058 Origin Adjusted Net Debt 6,496 8,111 Net derivative liabilities 830 565 Origin's share of APLNG net debt (project finance less cash) 3,272 3,642 Capital employed - held for sale - 1,330
Capital employed 22,398 23,707 Origin's underlying EBIT - continuing operations 1,372 903 Origin's equity share of APLNG interest and tax 503 324 Dilution depreciation adjustment 2 47
Adjusted EBIT - continuing operations 1,877 1,275
Adjusted EBIT - discontinued operations 271 224
Adjusted EBIT 2,148 1,499
Average capital employed - continuing operations 22,387 23,174
Average capital employed - discontinued operations 665 1,741
Average capital employed 23,052 24,914 Underlying ROCE - continuing operations 8.4% 5.5% Underlying ROCE 9.3% 6.0%
Key financials impacted by change in treatment of certain electricity hedge premiums
Year Ended 30 June 2018
As reported 2018
Adjusted 2017
As reported 2017
Adjusted
($m) ($m) ($m) ($m)
Origin - continuing operations:
Underlying EBITDA 2,947 2,787 2,173 2,032
Underlying EBIT 1,372 1,212 903 762
Underlying Profit 838 726 400 301 Underlying ROCE 8.4% 7.7% 5.5% 4.9%
Adjusted Net Debt/Underlying EBITDA(a) 3.4x 3.7x 5.4x 6.0x
Energy Markets segment:
Wholesale energy costs (3,237) (3,397) (2,629) (2,770)
Underlying EBITDA 1,811 1,651 1,492 1,351
Underlying EBIT 1,453 1,293 1,167 1,026 (a) FY2017 Adjusted Net Debt/Underlying EBITDA is calculated on a total operations basis.
50 of 92 Origin Energy Limited ABN 30 000 051 696
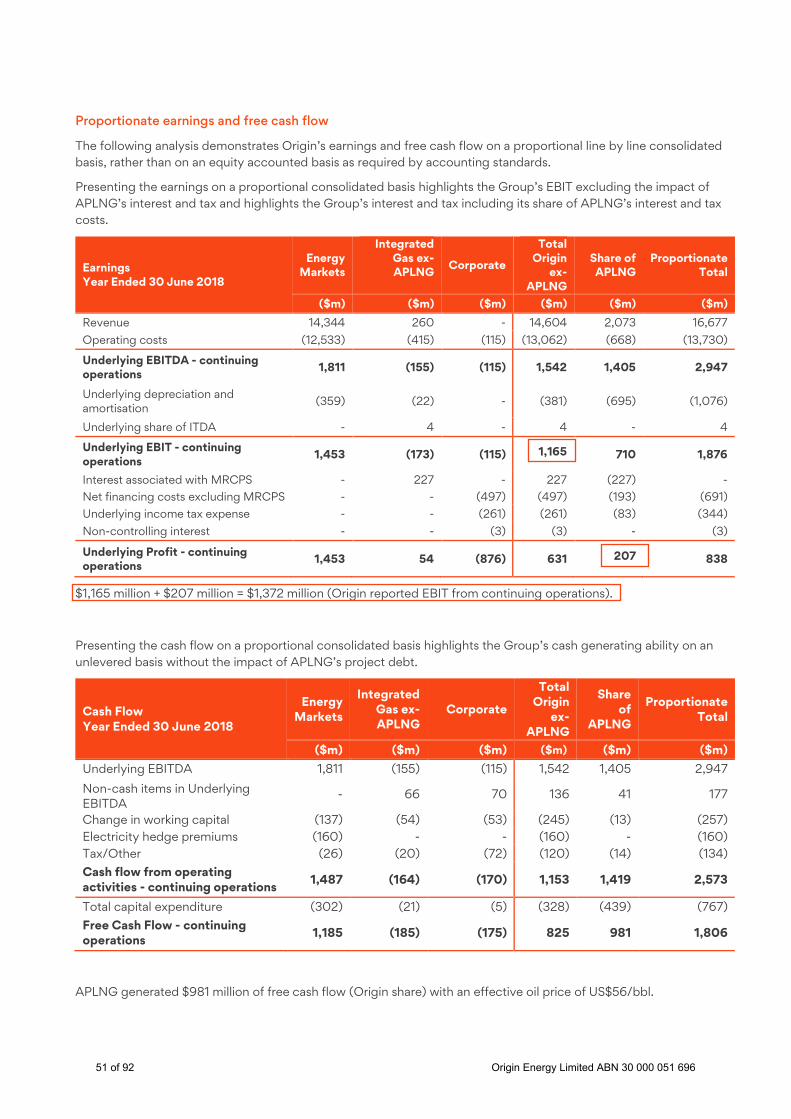
Proportionate earnings and free cash flow
The following analysis demonstrates Origin’s earnings and free cash flow on a proportional line by line consolidated basis, rather than on an equity accounted basis as required by accounting standards.
Presenting the earnings on a proportional consolidated basis highlights the Group’s EBIT excluding the impact of APLNG’s interest and tax and highlights the Group’s interest and tax including its share of APLNG’s interest and tax costs.
Earnings Year Ended 30 June 2018
Energy Markets
Integrated Gas ex-APLNG Corporate
Total Origin
ex- APLNG
Share of APLNG
Proportionate Total
($m) ($m) ($m) ($m) ($m) ($m)
Revenue 14,344 260 - 14,604 2,073 16,677 Operating costs (12,533) (415) (115) (13,062) (668) (13,730)
Underlying EBITDA - continuing operations 1,811 (155) (115) 1,542 1,405 2,947
Underlying depreciation and amortisation
(359) (22) - (381) (695) (1,076)
Underlying share of ITDA - 4 - 4 - 4
Underlying EBIT - continuing operations 1,453 (173) (115) 1,165 710 1,876
Interest associated with MRCPS - 227 - 227 (227) - Net financing costs excluding MRCPS - - (497) (497) (193) (691) Underlying income tax expense - - (261) (261) (83) (344) Non-controlling interest - - (3) (3) - (3)
Underlying Profit - continuing operations 1,453 54 (876) 631 207 838
$1,165 million + $207 million = $1,372 million (Origin reported EBIT from continuing operations).
Presenting the cash flow on a proportional consolidated basis highlights the Group’s cash generating ability on an unlevered basis without the impact of APLNG’s project debt.
Cash Flow Year Ended 30 June 2018
Energy Markets
Integrated Gas ex-APLNG
Corporate
Total Origin
ex- APLNG
Share of
APLNG
Proportionate Total
($m) ($m) ($m) ($m) ($m) ($m) Underlying EBITDA 1,811 (155) (115) 1,542 1,405 2,947
Non-cash items in Underlying EBITDA
- 66 70 136 41 177
Change in working capital (137) (54) (53) (245) (13) (257) Electricity hedge premiums (160) - - (160) - (160) Tax/Other (26) (20) (72) (120) (14) (134) Cash flow from operating activities - continuing operations 1,487 (164) (170) 1,153 1,419 2,573
Total capital expenditure (302) (21) (5) (328) (439) (767) Free Cash Flow - continuing operations 1,185 (185) (175) 825 981 1,806
APLNG generated $981 million of free cash flow (Origin share) with an effective oil price of US$56/bbl.
51 of 92 Origin Energy Limited ABN 30 000 051 696

Reconciliation of Adjusted Net Debt
Origin has US dollar and Euro foreign currency denominated debt. This foreign currency debt is hedged into either AUD or USD using cross currency interest rate swap (CCIRS) derivatives. Accounting standards require the foreign currency debt and the linked CCIRS derivatives to be disclosed in different lines on the Statement of Financial Position (Balance Sheet). Foreign currency debt is translated at the current market spot rate and classified as interest-bearing liabilities, whilst the associated CCIRS derivatives are measured at current market rates (fair value) and are classified as either derivative assets or derivative liabilities on the Statement of Financial Position. It is the combination of the interest-bearing liabilities and the CCIRS derivative assets or liabilities that reflect the Company’s Adjusted Net Debt position or the quantum of funds the Company is required to repay upon maturity of the debt.
As at 30 June 2018, Origin’s interest-bearing liabilities on the Statement of Financial Position were $7,439 million. The impact of the associated CCIRS recorded within net derivative assets on the Statement of Financial Position reduces Adjusted Net Debt by $793 million. Adjusted Net Debt of $6,496 million decreased $1,615 million compared to the prior period.
Issue Issue Hedged Hedged AUD $m AUD $m AUD $m
Currency Notional Currency Notional 30 Jun 2018
30 Jun 2018
30 Jun 2018
Interest-bearing
liabilities
Debt and CCIRS fair
value adjustments
Adjusted net debt
AUD debt AUD 149 AUD 149 149 - 149
USD Debt left in USD USD 703 USD 703 952 - 952 USD debt swapped to AUD USD 800 AUD 853 1,081 (228) 853
EUR debt swapped to AUD EUR 2,700 AUD 3,691 4,340 (649) 3,691
EUR debt swapped to USD EUR 500 USD 646 788 88 876
NZD debt swapped to AUD NZD 141 AUD 125 129 (4) 125
Total 7,439 (793) 6,646
Cash and cash equivalents (150)
Adjusted Net Debt 6,496
52 of 92 Origin Energy Limited ABN 30 000 051 696

Financial instruments and fair value adjustments
Balance Sheet Impact Income Statement Impact
Derivative asset/(liability)
Inc/(dec) in
derivatives
Inc/(dec) in
other net assets
Total inc/(dec)
in net assets
Gain/(loss) included in Underlying
Profit
Gain/(loss) excluded from
Underlying Profit ($m) 30 Jun
2018 30 Jun
2017 Oil and gas
Forward oil sale
- (290) 290 (314) (24) 11 (35) Oil and gas hedges (68) 35 (103) (108) (210) (84) (126) Other commodity hedges 14 1 13 1 14 14 0
(54) (254) 201 (421) (220) (59) (161)
Electricity Electricity swaps and options 13 306 (294) 86 (208) 24 (232) Power purchase agreements (405) (325) (80) 104 24 104 (80) Environmental derivatives (123) (25) (98) 0 (98) 0 (98)
(515) (44) (472) 190 (282) 128 (410)
FX and interest rate Foreign exchange contracts (249) (301) 52 (65) (13) (3) (10) Foreign currency debt hedges 805 294 511 (510) 1 0 1 Interest rate swaps (6) (8) 2 0 2 0 2
550 (15) 565 (575) (10) (3) (7)
(19) (313) 294 (806) (512) 66 (578) Fair value changes in other financial assets/liabilities (46) Increase/(decrease) in fair value of financial instruments (Note A1(b)) (624)
Reconciliation of net derivative liability to financial statements
Derivative financial assets (Note C5) 1,639 1,296 Derivative financial liabilities (Note C5) (1,658) (1,609) Net derivative liability (19) (313)
Oil and gas derivatives Origin is exposed to fluctuations in the oil price through its gas portfolio, as well as indirectly through its investment in APLNG, and utilises a variety of oil and gas derivatives to manage this price risk. Origin's gas hedging consists primarily of swaps that fix the price to be paid under oil-linked gas purchase contracts. The value of these derivatives increases when market oil prices exceed the agreed swap price. Much of the hedging is carried out through put options executed by Origin that establish a minimum price Origin will receive on oil-linked LNG sales. The value of these options declines in periods of rising oil and gas prices as payouts are less likely to be received.
Electricity derivatives Origin generates approximately half of the total electricity volume it sells. As such it is exposed to fluctuations in wholesale electricity prices in respect of the electricity that must be purchased to meet retail and business customer demand. To manage this risk Origin utilises a variety of derivatives including swaps, options, power purchase arrangements and forward purchase contracts. The value of these derivatives declines when forward electricity prices are forecast to decrease as the electricity purchase costs to be paid by Origin exceed expected market prices.
Currency and interest rate derivatives Origin utilises a variety of funding derivatives to manage the exposure to foreign exchange and interest rate risk on its debt portfolio. A significant portion of the debt portfolio is Euro denominated and cross currency interest rate swap derivatives have been used to hedge that debt to AUD or USD. Although Origin has an Australian functional currency, a portion of the foreign debt is swapped to USD as a natural offset to the investment in APLNG which is USD functional and will deliver USD distributions. The value of these currency derivatives increases in periods where the Euro strengthens against the Australian dollar. Also included in this portfolio, are foreign exchange contracts executed in prior periods to monetise the value that had accrued in certain cross currency interest rate swap derivatives. In aggregate, the value of the foreign exchange contracts, which will cash settle over the period to 2023, are not subject to foreign exchange fluctuations.
53 of 92 Origin Energy Limited ABN 30 000 051 696

Appendix 2 - Energy Markets supplementary data
Energy Markets Revenue reconciliation The table below reconciles the difference between segment revenue and customer revenue disclosed in the Electricity, Natural gas, LPG and Solar & Energy Services tables.
Year Ended 30 June 2018 2017 Change Change ($m) ($m) ($m) (%)
Energy Markets Segment Revenue 14,344 13,558 786 6 Less pool and other revenue:
Internal Generation (1,907) (2,073) 166 (8) Renewable PPAs (190) (144) (46) 32 Other PPAs (80) (200) 120 (60)
Pool revenue (2,177) (2,418) 241 (10) Other(a) (111) (127) 16 (13)
Total Customer Revenue 12,056 11,014 1,042 9 (a)Other revenue includes ancillary services, transmission use of system and other items which are partially offset in cost of energy
Electricity Volume summary
Year Ended 30 June 2018 2017 Change Change
Volumes sold (TWh) Retail Business Total Retail Business Total TWh %
NSW 8.4 9.2 17.6 9.0 9.1 18.1 (0.5) (3)
Queensland 4.9 4.0 8.9 5.2 5.4 10.6 (1.7) (16)
Victoria 3.2 4.8 8.0 3.4 4.8 8.2 (0.2) (2)
South Australia 1.2 1.8 3.0 1.1 1.7 2.8 0.2 7
Total volumes sold 17.7 19.8 37.5 18.6 21.1 39.7 (2.2) (5)
Financial summary
Year Ended 30 June 2018 $/MWh 2017 $/MWh Change % Change
($/MWh)
Revenue ($m) 8,573 228.7 8,085 203.8 6 24.9 Retail (consumer & SME) 5,262 297.9 5,065 272.4 4 25.5 Business(a) 3,311 167.0 3,020 143.3 10 23.7
Cost of goods sold ($m) (6,868) (183.2) (6,660) (167.9) (3) (15.3)
Network costs (3,417) (91.1) (3,828) (96.5) 11 5.4
Wholesale energy costs (3,237) (86.3) (2,629) (66.3) (23) (20.0)
Generation operating costs (215) (5.7) (202) (5.1) (6) (0.6)
Energy procurement costs (3,452) (92.1) (2,831) (71.4) (22) (20.7)
Gross profit ($m) 1,705 45.5 1,426 35.9 20 9.4
Gross margin % 19.9% 17.6% 13
$ Gross profit per customer 637 521 22
(a) Includes externally contracted generation
54 of 92 Origin Energy Limited ABN 30 000 051 696

Electricity supply
Year ended 30 June 2018
Nameplate Capacity
(MW) Type(a)
Equivalent Reliability
Factor(b)
Capacity Factor
Electricity Output
(GWh)(c)
Pool Revenue
($m)
Pool Revenue
($/MWh)
Eraring 2,880 Black Coal 92.6% 62.8% 15,854 1,331 83
Darling Downs 644 CCGT 99.3% 37.3% 2,107 154 74
Osborne(d) 180 CCGT 100.0% 81.1% 1,279 132 103
Uranquinty 664 OCGT 100.0% 9.7% 565 62 110
Mortlake 566 OCGT 99.5% 25.8% 1,280 157 124
Mount Stuart 423 OCGT 99.7% 0.3% 10 1 123
Quarantine 224 OCGT 98.6% 9.6% 189 31 165
Ladbroke Grove 80 OCGT 99.5% 24.0% 168 24 145
Roma 80 OCGT 99.0% 4.3% 30 3 107
Shoalhaven 240 Pump/Hydro 97.0% 4.7% 99 12 121
Internal Generation 5,981 96.0% 41.2% 21,581 1,907 88
Pelican Point 240 CCGT 1,512
Renewable PPA’s 953 Solar / Wind n/a 27.9% 2,333 190 81 Owned and Other Generation
7,174 38.1% 25,426 2,097 88
(a) OCGT = Open cycle gas turbine; CCGT = Combined cycle gas turbine. (b) Availability for Eraring = Equivalent Availability Factor (which takes into account de-ratings). (c) Electricity output is measured at the node. (d) Origin has a 50 per cent interest in the 180 MW plant and contracts 100 per cent of the output.
Natural Gas Volume summary
Year Ended 30 June 2018 2017 Change Change
Volumes sold (PJ) Retail Business Total Retail Business Total PJ %
NSW 9.5 22.3 31.8 9.4 23.4 32.8 (1.0) (3)
Queensland 3.1 83.7 86.8 2.9 69.1 72.0 14.8 21
Victoria 24.9 53.0 77.9 25.6 40.9 66.5 11.4 17
South Australia 5.5 12.4 17.9 5.1 11.5 16.6 1.3 8
External volumes sold 43.1 171.4 214.4 43.1 144.9 187.9 26.5 14
Internal sales (generation) 66.6 61.5 5.2 8
Total volumes sold 281.0 249.4 31.6 13
55 of 92 Origin Energy Limited ABN 30 000 051 696

Financial summary
Year Ended 30 June 2018 $/GJ 2017 $/GJ Change %
Change
($/GJ)
Revenue ($m) 2,644 12.3 2,154 11.5 23 0.8
Retail (consumer & SME) 1,097 25.5 1,030 23.9 6 1.6
Business 1,547 9.0 1,124 7.8 38 1.2
Cost of goods sold ($m) (1,995) (9.3) (1,627) (8.7) (23) (0.6)
Network costs (764) (3.6) (709) (3.8) (8) 0.2
Energy procurement costs (1,231) (5.7) (918) (4.9) (34) (0.8)
Gross profit ($m) 649 3.0 528 2.8 23 0.2
Gross margin % 24.5% 24.5% 0
$ Gross profit per customer 578 478 21
Electricity and Natural Gas operating costs
Year Ended 30 June 2018 2017(a) Change Change %
Cost to maintain ($ per average customer(b)) (124) (109) (15) 14
Cost to acquire/retain ($ per average customer(b)) (46) (36) (10) 27
Elec & Natural Gas Cost to Serve ($ per average customer(b)) (171) (146) (25) 17
Maintenance Costs ($m) (455) (406) (48) 12
Acquisition & Retention Costs(c) ($m) (170) (135) (35) 26
Elec & Natural Gas cost to serve ($m) (624) (541) (83) 15 (a) FY2017 has been re-stated to reflect changes in the allocation of certain items. (b) Represents Cost to Serve per average customer account, excluding serviced hot water accounts. (c) Customer wins (FY2018: 631,000; FY2017: 552,000) and retains (FY2018: 1,894,000; FY2017: 1,509,000).
LPG
Year Ended 30 June 2018 2017 Change Change %
Volumes (kt) 450 448 2 01
Revenue ($m) 654 628 26 4
Cost of Goods Sold ($m) (434) (418) (16) 4
Gross Profit ($m) 220 211 9 4
Operating Costs ($m) (129) (122) (7) 6
Underlying EBITDA ($m) 91 88 3 3
As at 30 June 2018, Origin had 370,000 LPG customer accounts, down from 382,000 customer accounts at 30 June 2017.
56 of 92 Origin Energy Limited ABN 30 000 051 696

Solar and Energy Services
Year Ended 30 June 2018 2017 Change Change % ($m) ($m) ($m) (%)
Revenue 185 148 37 25
Cost of Goods Sold (99) (74) (25) 34
Gross Profit 85 74 11 15
Operating Costs(a) (76) (69) (7) 10
Underlying EBITDA 10 5 5 90
Future Energy
Year Ended 30 June 2018 2017 Change Change ($m) ($m) ($m) (%)
Operating Costs (19) (14) (6) 36
Investments 9 2 7 350
Electricity and Natural Gas retail and business customer accounts
As at 30 June 2018 30 June 2017 Customer
Electricity Natural
Total Electricity Natural
Total Change Accounts ('000) Gas Gas NSW(a) 1,200 284 1,483 1,213 262 1,475 8
Queensland 696 176 872 752 168 920 (48)
Victoria 545 472 1,018 553 478 1,031 (14)
South Australia(b) 225 213 438 198 203 401 37
Total 2,666 1,145 3,811 2,716 1,112 3,828 (17) (a) Australian Capital Territory (ACT) customers are included in New South Wales. (b) Northern Territory and Western Australia customers are included in South Australia.
57 of 92 Origin Energy Limited ABN 30 000 051 696

Appendix 3 - Integrated Gas supplementary data
APLNG production and sales volumes
Year Ended 30 June 2018 2017 Volumes (PJ) 100% APLNG Origin share 100% APLNG Origin share Production volumes:
Operated 515 193 447 168 Non-operated 162 61 163 61.125 Total production 676 254 610 229 Purchases 45 17 23 9 Liquefaction/inventory (41) (15) (25) (9)
Sales volumes 680 255 608 228 Natural Gas sales volumes 205 77 214 80 LNG sales volumes 475 178 394 148
Realised price (A$/GJ)
Natural Gas 4.50 3.04
LNG 9.60 8.16
APLNG underlying financial performance
Year Ended 30 June 2018 2017 ($m) 100% APLNG Origin share 100% APLNG Origin share Operating revenue(a) 5,528 2,073 3,754 1,408 Operating expenses (1,782) (668) (1,465) (549)
Underlying EBITDA 3,746 1,405 2,289 859 Depreciation and amortisation (1,853) (695) (1,614) (605) MRCPS financing expense (605) (227) (626) (235) Net financing expense (515) (193) (326) (122) Income tax (expense) / benefit (222) (83) 87 32
Underlying ITDA (3,195) (1,198) (2,479) (930)
Underlying profit(b) 551 207 (190) (71)
(a) Includes commodity revenue as reported in the Quarterly Production Report, plus other revenue of $46 million (Origin share: $16 million) in FY2018 and $8 million (Origin share: $3 million) in FY2017. FY2017 operating revenue is net of $130 million (Origin share: $49 million) of revenue capitalised prior to the recognition of earnings from Train 2 in November 2016. (b) Origin’s share of APLNG Underlying Profit differs to note E1.2 of Origin’s financial statements (FY2018: $211 million; FY2017: $66 million loss) due to an elimination of APLNG depreciation related to capitalised MRCPS interest. Refer to note E1.2 of Origin’s financial statements for details.
58 of 92 Origin Energy Limited ABN 30 000 051 696
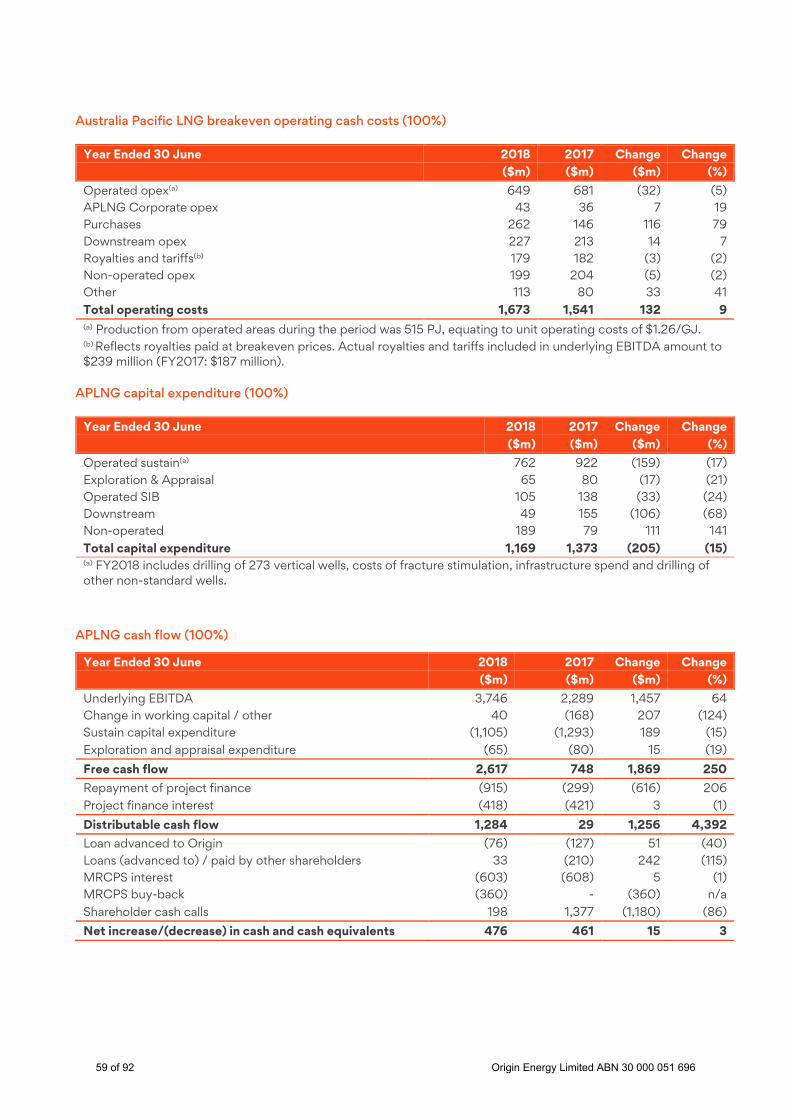
Australia Pacific LNG breakeven operating cash costs (100%)
Year Ended 30 June 2018 2017 Change Change ($m) ($m) ($m) (%) Operated opex(a) 649 681 (32) (5) APLNG Corporate opex 43 36 7 19 Purchases 262 146 116 79 Downstream opex 227 213 14 7 Royalties and tariffs(b) 179 182 (3) (2) Non-operated opex 199 204 (5) (2) Other 113 80 33 41 Total operating costs 1,673 1,541 132 9 (a) Production from operated areas during the period was 515 PJ, equating to unit operating costs of $1.26/GJ. (b) Reflects royalties paid at breakeven prices. Actual royalties and tariffs included in underlying EBITDA amount to $239 million (FY2017: $187 million).
APLNG capital expenditure (100%)
Year Ended 30 June 2018 2017 Change Change ($m) ($m) ($m) (%) Operated sustain(a) 762 922 (159) (17) Exploration & Appraisal 65 80 (17) (21) Operated SIB 105 138 (33) (24) Downstream 49 155 (106) (68) Non-operated 189 79 111 141 Total capital expenditure 1,169 1,373 (205) (15) (a) FY2018 includes drilling of 273 vertical wells, costs of fracture stimulation, infrastructure spend and drilling of other non-standard wells.
APLNG cash flow (100%)
Year Ended 30 June 2018 2017 Change Change ($m) ($m) ($m) (%) Underlying EBITDA 3,746 2,289 1,457 64 Change in working capital / other 40 (168) 207 (124) Sustain capital expenditure (1,105) (1,293) 189 (15) Exploration and appraisal expenditure (65) (80) 15 (19)
Free cash flow 2,617 748 1,869 250 Repayment of project finance (915) (299) (616) 206 Project finance interest (418) (421) 3 (1)
Distributable cash flow 1,284 29 1,256 4,392 Loan advanced to Origin (76) (127) 51 (40) Loans (advanced to) / paid by other shareholders 33 (210) 242 (115) MRCPS interest (603) (608) 5 (1) MRCPS buy-back (360) - (360) n/a Shareholder cash calls 198 1,377 (1,180) (86)
Net increase/(decrease) in cash and cash equivalents 476 461 15 3
59 of 92 Origin Energy Limited ABN 30 000 051 696

Appendix 4 - Glossary and interpretation
Financial measures Statutory Financial Measures
Statutory Financial Measures are measures included in the Financial Statements for the Origin Consolidated Group, which are measured and disclosed in accordance with applicable Australian Accounting Standards. Statutory Financial Measures also include measures that have been directly calculated from, or disaggregated directly from financial information included in the Financial Statements for the Origin Consolidated Group.
Term Meaning
Statutory Profit/Loss Net profit/loss after tax and non-controlling interests as disclosed in the Income Statement of the Origin Consolidated Financial Statements.
Statutory earnings per share
Statutory profit divided by weighted average number of shares.
Cash flows from operating activities
Statutory cash flows from operating activities as disclosed in the Statement of Cash Flows in the Origin Consolidated Financial Statements.
Cash flows from investing activities
Statutory cash flows from investing activities as disclosed in the Statement of Cash Flows in the Origin Consolidated Financial Statements.
Cash flows used in financing activities
Statutory cash flows used in financing activities as disclosed in the Statement of Cash Flows in the Origin Consolidated Financial Statements.
External revenue Revenue after elimination of intersegment sales on consolidation as disclosed in the Income Statement of the Origin Consolidated Financial Statements.
Net Debt Total current and non-current interest-bearing liabilities only, less cash and cash equivalents.
Non-controlling interest Economic interest in a controlled entity of the consolidated entity that is not held by the Parent entity or a controlled entity of the consolidated entity.
Non-IFRS Financial Measures
This document includes certain Non-IFRS Financial Measures. Non-IFRS Financial Measures are defined as financial measures that are presented other than in accordance with all relevant Accounting Standards. Non-IFRS Financial Measures are used internally by management to assess the performance of Origin’s business, and to make decisions on allocation of resources. The Non-IFRS Financial Measures have been derived from Statutory Financial Measures included in the Origin Consolidated Financial Statements, and are provided in this report, along with the Statutory Financial Measures to enable further insight and a different perspective into the financial performance, including profit and loss and cash flow outcomes, of the Origin business.
The principal non-IFRS profit and loss measure of Underlying Profit has been reconciled to Statutory Profit in section 3.2. The key Non-IFRS Financial Measures included in this report are defined below.
60 of 92 Origin Energy Limited ABN 30 000 051 696

Term Meaning
Adjusted Net Debt Net Debt adjusted to remove fair value adjustments on hedged borrowings.
Adjusted Net Debt/Underlying EBITDA
Adjusted Net Debt/Underlying EBITDA is calculated as Adjusted Net Debt / (Origin Underlying EBITDA – Share of APLNG EBITDA + net cash flow from APLNG) over the last 12 months.
Average interest rate Interest expense for the current period divided by Origin’s average drawn debt during the current period.
Current period Year ended 30 June 2018.
Free Cash Flow Net cash from operating activities less capital expenditure.
Gearing Adjusted Net Debt / Adjusted Net Debt + Total equity
Gross Profit Revenue less cost of goods sold.
Items excluded from Underlying Profit
Items that do not align with the manner in which the Chief Executive Officer reviews the financial and operating performance of the business which are excluded from Underlying Profit. Items excluded from Underlying Profit are categorised as:
Fair value and foreign exchange movements – reflecting the impact of mark to market movements on financial assets and liabilities from period to period.
LNG related items pre-revenue recognition – primarily comprising net financing costs incurred (but unable to be capitalised) in funding Origin’s investment in APLNG which relate to the period prior to revenue recognition for each of the two LNG Trains.
Disposals, impairments and business restructuring – reflecting the impact of actions and decisions to dispose, acquire, revalue or restructure the company’s assets and business operations.
MRCPS Mandatorily redeemable cumulative preference shares.
MRCPS elimination adjustment
The interest on MRCPS was capitalised by APLNG prior to commencement of revenue recognition. As the project is now operational, previously capitalised interest is being unwound through depreciation. The proportion of the unwind attributable to Origin’s share is eliminated as Origin had previously eliminated the impact of the capitalised interest through the equity investment balance.
Non-cash fair value uplift Reflects the impact of the accounting uplift in the asset base of APLNG which was recorded on the creation of APLNG and subsequent share issues to Sinopec. This balance will be depreciated in APLNG’s income statement on an ongoing basis and, therefore, a dilution adjustment is made to remove this depreciation.
Prior period Year ended 30 June 2017.
Share of ITDA Origin’s share of equity accounted investees interest, tax, depreciation and amortisation.
Total Segment Revenue Total revenue for the Energy Markets, Integrated Gas, Corporate and discontinued operations segments, including inter-segment sales, as disclosed in note A1 of the Origin Consolidated Financial Statements.
61 of 92 Origin Energy Limited ABN 30 000 051 696

Term Meaning
Underlying earnings per share
Underlying profit/loss divided by weighted average number of shares.
Underlying EBITDA Underlying earnings before underlying interest, underlying tax, underlying depreciation and amortisation (EBITDA) as disclosed in note A1 of the Origin Consolidated Financial Statements.
Underlying share of ITDA Share of ITDA (interest, tax, depreciation and amortisation) of equity accounted investees adjusted for items excluded from underlying profit.
Underlying Profit Underlying net profit after tax and non-controlling interests as disclosed in note A1 of the Origin Consolidated Financial Statements.
Underlying ROCE Underlying ROCE is calculated as Adjusted EBIT / Average Capital Employed.
• Average Capital Employed = Shareholders Equity + Origin Debt + Origin’s Share of APLNG project finance - Non-cash fair value uplift + net derivative liabilities. The average is a simple average of opening and closing in any year.
• Adjusted EBIT = Origin Underlying EBIT and Origin’s share of APLNG Underlying EBIT + Dilution Adjustment = Statutory Origin EBIT adjusted to remove the following items: a) Items excluded from underlying earnings; b) Origin’s share of APLNG underlying interest and tax; and c) the depreciation of the Non-cash fair value uplift adjustment.
• In contrast, for remuneration purposes Origin’s statutory EBIT is adjusted to remove Origin’s share of APLNG statutory interest and tax (which is included in Origin’s reported EBIT) and certain items excluded from underlying earnings. Gains and losses on disposals and impairments will only be excluded subject to Board discretion. The Remuneration Report provides specific details.
Non-Financial Terms
Term Meaning
1P reserves Proved Reserves are those reserves which analysis of geological and engineering data can be estimated with reasonable certainty to be commercially recoverable. There should be at least a 90 per cent probability that the quantities actually recovered will equal or exceed the estimate.
2P reserves The sum of Proved plus Probable Reserves. Probable Reserves are those additional reserves which analysis of geological and engineering data indicate are less likely to be recovered than Proved Reserves but more certain than Possible Reserves. There should be at least a 50 per cent possibility that the quantities actually recovered will equal or exceed the best estimate of Proved plus Probable Reserves (2P).
3P reserves Proved plus Probable plus Possible Reserves. Possible Reserves are those additional Reserves which analysis of geological and engineering data suggest are less likely to be recoverable than Probable Reserves. The total quantities ultimately recovered from the project have at least a 10 per cent probability of
62 of 92 Origin Energy Limited ABN 30 000 051 696

Term Meaning
exceeding the sum of Proved plus Probable plus Possible (3P), which is equivalent to the high estimate scenario.
2C resources The best estimate quantity of petroleum estimated to be potentially recoverable from known accumulations by application of development oil and gas projects, but which are not currently considered to be commercially recoverable due to one or more contingencies. The total quantities ultimately recovered from the project have at least a 50 per cent probability to equal or exceed the best estimate for 2C contingent resources.
Boe Barrel of oil equivalent
Capacity factor A generation plant’s output over a period compared with the expected maximum output from the plant in the period based on 100 per cent availability at the manufacturer’s operating specifications.
Discounting For Energy Markets, discounting refers to offers made to customers at a reduced price to the published tariffs. While a customer bill comprises a fixed and a variable portion, Origin’s discounts only apply to the variable portion. In some cases, these discounts are conditional, such as requiring direct debit payment or on-time payments.
Equivalent reliability factor Equivalent reliability factor is the availability of the plant after scheduled outages.
FEED Front End Engineering Design
GJ Gigajoule = 109 joules
GJe Gigajoules equivalent = 10-6 PJe
HSE Health, Safety and Environment
Joule Primary measure of energy in the metric system.
kT kilo tonnes = 1,000 tonnes
kW Kilowatt = 103 watts
kWh Kilowatt hour = standard unit of electrical energy representing consumption of one kilowatt over one hour.
Mtpa Million tonnes per annum
MW Megawatt = 106 watts
MWh Megawatt hour = 103 kilowatt hours
NEM National Electricity Market
NPS Net Promoter Score (NPS) is a measure of customers’ propensity to recommend Origin to friends and family
PJ Petajoule = 1015 joules
63 of 92 Origin Energy Limited ABN 30 000 051 696

Term Meaning
PJe Petajoules equivalent = an energy measurement Origin uses to represent the equivalent energy in different products so the amount of energy contained in these products can be compared. The factors used by Origin to convert to PJe are: 1 million barrels crude oil = 5.8 PJe; 1 million barrels condensate = 5.4 PJe; 1 million tonnes LPG = 49.3 PJe; 1 TWh of electricity = 3.6 PJe.
Scope 1 emissions Direct emissions driven by Origin’s owned and operated business operations, in particular electricity generation and gas development.
Scope 2 emissions Emissions from the electricity that Origin purchases to undertake activities.
Scope 3 emissions Indirect emissions through Origin’s value chain that are not owned or controlled by Origin.
TRIFR Total Recordable Incident Frequency Rate.
TW Terawatt = 1012 watts
TWh Terawatt hour = 109 kilowatt hours
Watt A measure of power when a one ampere of current flows under one volt of pressure.
Interpretation
All comparable results reflect a comparison between the current period and the prior period ended 30 June 2017, unless specifically stated otherwise.
A reference to APLNG or Australia Pacific LNG is a reference to Australia Pacific LNG Pacific LNG Pty Limited in which Origin holds a 37.5 per cent shareholding. Origin’s shareholding in APLNG is equity accounted.
A reference to $ is a reference to Australian dollars unless specifically marked otherwise.
All references to debt are a reference to interest bearing debt only.
Individual items and totals are rounded to the nearest appropriate number or decimal. Some totals may not add down the page due to rounding of individual components.
When calculating a percentage change, a positive or negative percentage change denotes the mathematical movement in the underlying metric, rather than a positive or a detrimental impact.
Percentage changes on measures for which the numbers change from negative to positive, or vice versa, are labelled as not applicable.
64 of 92 Origin Energy Limited ABN 30 000 051 696

REMUNERATION REPORT FOR THE YEAR ENDED 30 JUNE 2018
Letter from the Chairman of the Remuneration and People Committee
On behalf of the Remuneration and People Committee (RPC) and the Board, I am pleased to present the Remuneration Report for the year ended 30 June 2018. During the year a number of changes foreshadowed last year were implemented to provide a simpler remuneration framework geared to enhance executive share ownership and to better align the interests of the executives with our shareholders. The work of simplification and refinement is a continuing one in which the RPC regularly reviews both the operation and outcomes of the framework to assure its fitness for purpose in a constantly changing business context. Significant progress has been made in FY2018 on our twin priorities of reducing debt and improving returns. The sale of Lattice Energy was successfully completed, contributing a net $1 billion towards debt reduction, and underlying profit increased substantially. Over the period the APLNG project lenders’ test was completed, production and revenue increased, and we began implementing a simpler lower cost operating model. Despite intense competition, our Energy Markets performance improved, with contributions to this growth by both our electricity and gas businesses. Our renewable energy supply increased, and we trialled new technologies and introduced new products to improve our customer experience. We continue to position the company for a cleaner and smarter energy future. The company’s share price rose by over 46 per cent in FY2018, and over two years has risen over 74 per cent, reflecting the strength of our recent progress against our priorities. Annual short term incentive (STI) outcomes for FY2018 have climbed above their targets (as detailed in tables 3 and 4), reflecting this progress and improvement. At the same time, FY2018 represented the sixth successive year of zero vesting and forfeiture of all long-term incentive (LTI) awards. This reflects that while recent performance has been strong the long term performance (as shown in the 3-year Total Shareholder Return (TSR)) is still unsatisfactory. Our remuneration framework ensures that reward and performance are linked to both short and long term outcomes. Our remuneration report this year has become shorter and more focused reflecting the changes and simplifications being made to the remuneration framework. Scott Perkins Chairman, Remuneration and People Committee
Contents
The Remuneration Report for the 12 months ended 30 June 2018 (FY2018, the Period) forms part of the Directors’ Report. Except as otherwise noted it has been prepared in accordance with the Corporations Act 2001 (Cth) (the Act) and in compliance with AASB 124 Related Party Disclosures, and audited as required by section 308(3C) of the Act. The report is divided into the following sections: 1. People covered by the report 2. Remuneration outcomes for FY2018 3. Executive remuneration policy and structure 4. Remuneration governance 5. Statutory disclosures 6. Loans and other transactions with Key Management Personnel (KMP)
65 of 92 Origin Energy Limited ABN 30 000 051 696

REMUNERATION REPORT FOR THE YEAR ENDED 30 JUNE 2018
1. People covered by the Remuneration Report
The Remuneration Report discloses the remuneration arrangements and outcomes for people listed in table 1, who are those individuals who have been determined as KMP as defined by AASB 124 Related Party Disclosures.
Table 1: KMP
Name Position and board committees Term as KMP in FY2018
Non-executive Directors (NEDs) J Akehurst Independent Director
Health, Safety and Environment (Chair); Risk; Nomination Full year
M Brenner Independent Director Risk (Chair); Audit; Nomination
Full year
G Cairns Independent Chairman Nomination (Chair); Audit; Risk; Remuneration and People; Health, Safety and Environment
Full year
T Engelhard Independent Director Remuneration and People; Audit (since September 2017)
Full year
B Morgan Independent Director Audit (Chair); Risk; Health, Safety & Environment; Nomination
Full year
S Perkins Independent Director Remuneration and People (Chair); Audit; Risk; Nomination
Full year
S Sargent Independent Director Origin Foundation (Chair); Remuneration and People; Health, Safety and Environment
Full year
Executive Director F Calabria Chief Executive Officer (CEO)
Full year
Other KMP J Briskin Executive General Manager, Retail
Full year
G Jarvis Executive General Manager, Energy Supply and Operations
Full year
G Mallett Acting Chief Financial Officer KMP role until 9 July 2017
To 9 July 2017
M Schubert Executive General Manager, Integrated Gas
Full year
L Tremaine Chief Financial Officer Appointed KMP 10 July 2017
From 10 July 2017
The term Executive KMP is a reference to the Executive Director plus Other KMP. Although focused on the remuneration arrangements and outcomes for the KMP listed in table 1, the report also provides a perspective across the broader Executive Leadership Team (ELT). The term ‘senior executives’ in this report is a collective reference to Other KMP plus non-KMP members of the ELT.
66 of 92 Origin Energy Limited ABN 30 000 051 696

REMUNERATION REPORT FOR THE YEAR ENDED 30 JUNE 2018
2. Remuneration outcomes for FY2018
This section summarises remuneration outcomes for FY2018 and provides commentary on their alignment with company outcomes. 2.1 Five-year company performance and remuneration outcomes
Table 2 summarises key financial and non-financial performance for the company from FY2014 to FY2018, grouped and compared with short-term and long-term remuneration outcomes. Table 2: Five-year performance history
2014 2015 2016 2017 2018
Earnings and cash flow Revenue $m 14,518 14,147 12,174 14,107 14,883Revenue $m (continuing activities 1) 12,363 11,893 11,456 13,646 14,604Statutory profit $m2 530 (658) (628) (2,226) 218Statutory EPS cents2,3 42.1 (52.1) (39.8) (126.9) 12.4Underlying profit $m 713 682 365 550 1022Underlying profit $m (continuing activities 1) 604 603 286 400 838Underlying EPS cents3 56.7 54.0 23.2 31.3 58.2Underlying EPS cents3 (continuing activities 1) 48.0 47.7 18.1 22.8 47.7Net cash from/(used in) operating and investing activities (NCOIA)
(1,087) (2,081) 1,215 1,378 2,645
STI award outcomes (table 5) Executive KMP outcome (% of $ target) 111.1 81.0 43.8 91.7 129.1
Returns Share price3 (closing at 30 June, $) 12.79 10.47 5.75 6.86 10.03Dividends (cents) 50.0 50.0 10.0 0.0 0.0Annual TSR (%) 20.6 (15.0) (42.0) 19.3 46.23-year TSR4 (CAGR % pa) 0.9 2.8 (18.5) (14.2) (2.6)Underlying ROCE5 (% pa) na na na 6.0 9.3
LTI outcomes LTI vesting % in the year 0 0 0 0 0LTI forfeit % in the year 100 100 100 100 100
1 Excludes Contact Energy (2014-2016) and Lattice Energy (2016-2018). 2 2016 statutory profit and statutory EPS have been restated to reflect adjustments as noted in 2017 financial statements. 3 EPS and share price have been re-stated for the bonus element of the rights issue completed in October 2015. 4 Using a three-month (60 trading days) volume weighted average price (VWAP) to 30 June, reflecting the LTI methodology
for calculating TSRs for Origin and the comparator group companies. 5 Reporting for ROCE commenced FY2017.
Table 2 shows that overall awarded STI outcomes have varied from 43.8% to 129.1% of target over the last five years. The specific performance metrics supporting the Executive KMP results for FY2018 STI are provided in section 2.2 below. There has been no vesting of LTI for any executive since 2011 (when vesting occurred for grants allocated in 2008). The forfeiture of this awarded remuneration reflects share price underperformance in recent years and underlines the strong linkage between company performance and remuneration outcomes. More recently performance has improved. The share price has increased by over 74% over the last two years, and over 46% over the last year.
67 of 92 Origin Energy Limited ABN 30 000 051 696

REMUNERATION REPORT FOR THE YEAR ENDED 30 JUNE 2018
2.2 STI awards and scorecard details for FY2018
The STI program operates on an annual financial year cycle, using a scorecard made up of key performance indicators (KPIs). Before the commencement of the performance year, targets are set for each KPI at three levels — threshold, target and stretch. Achievement at the target level is scored at 100%, with threshold achievements at one-third (33%) of target, and outperformance achieving the stretch level is scored at 167%.1
Unless the threshold level is achieved, the award for the KPI is zero. The stretch performance level is set on the basis of significantly exceeding budget and operational targets. Between target and threshold, and between threshold and stretch, outcomes are calculated on a proportionate basis.
For FY2018 the scorecard was weighted 60% to financial KPIs and 20% each to Customer and People KPIs. Table 3 shows the CEO’s scorecard, targets and outcomes for FY2018. Table 3: CEO scorecard for FY2018
[Targets in light bars; actual outcomes in dark bars]
CEO Scorecard
KPIs
Wei
ght
%
Sco
re
% ta
rget
Res
ult
%
Threshold Target Stretch 33% 100% 167%
Financial (60%)
Underlying EPS (c) 41.6 46.3 50.9
15 167 25.1 58.2
Net cash from operating and investing activities (NCOIA) excluding Lattice net proceeds ($m)
608 675 743 10 167 16.7 $1,575
Lattice net proceeds ($m) 934 983 1,032
5 167 8.3 1,070
Energy Markets EBITDA ($m) 1,679 1,745 1,810
15 167 25.0 1,811
FY18 APLNG operating breakeven ($m)
2,381 2,268 2,155 15 167 25.0
1,493 60 167.0 100.1
Customer (20%) Strategic NPS (T1 refers to #1 Tier 1)
T1 or >-16 T1 & -10 T1 & -6 10 67 6.7
-13 Customer value – retail gross margin ($m)
880 940 990 7.5 167 12.5
1,082 Customer value – customer net movement
-50k -35k -20k 2.5 167 4.2
-15k 20 105.0 23.4
People (20%) People, culture and HSE Measures2
100.9
20 100.9 20.2
Business scorecard result (% target) 100 143.7 143.7 %Fixed Remuneration3 123.0
1 In earlier years this was expressed as threshold and target representing 20% and 60% of maximum respectively. 2 Measures include engagement and culture metrics, total recordable injury frequency rate, significant incidents, process safety and environmental reportable incidents. 3 The difference between target (100%) and stretch (167%) KPIs is 67 points, and the CEO’s opportunity difference is 20 points (110%FR at target, 130%FR at maximum). Therefore, for a 143.7% scorecard outcome, the calculation as %FR equals 110 + {20 x (143.7-100) / 67)} = 123.0%FR. Table 5 shows this represents 111.8% of the dollar target opportunity. These conversions will not be necessary from FY2019 forward as the CEO’s opportunity levels will be aligned with the rest of the organisation as detailed in Table 9.
68 of 92 Origin Energy Limited ABN 30 000 051 696

REMUNERATION REPORT FOR THE YEAR ENDED 30 JUNE 2018
Scorecards for Other KMP follow the same structure, where financial KPIs represent at least 60% of the overall weighting, customer KPIs represent between 15% and 25%, and business unit KPIs are incorporated in addition to the Group targets. Table 4 summarises the outcomes for Other KMP for FY2018. Table 4: Other KMP scorecard summaries for FY2018
Other KMP Scorecards
Threshold Target Stretch
33% 100% 167%
J Briskin (EGM, Retail) 147.1
G Jarvis (EGM, Energy Supply & Operations) 145.1
M Schubert (EGM, Integrated Gas) 138.3
L Tremaine (Chief Financial Officer) 142.1
The scorecard outcomes range from 138.3% to 147.1% of target. These dollar results are summarised in table 5 which shows the STI outcomes for all Executive KMP. 2.3 LTI allocations for FY2018
LTI allocations for FY2018 have been set at the standard (target) level. In the absence of reasons to exercise its discretion to deviate from usual practice (which it has done from time to time when circumstances warranted), the Board has determined that 2018 allocations will be at the standard role-based level. Vesting outcomes depend on future performance against the performance hurdles.
The allocation of equity for the CEO is subject to shareholder approval.
As foreshadowed in the 2017 Remuneration Report, the 2018 and future allocations are wholly based on face value methodology. Previously the allocation was based on a mixture of fair and face value. Opportunity levels have been adjusted to reflect this change without materially altering the allocation value to the executive, as set out in table 11. 2.4 Variable pay outcomes
Table 5 summarises variable pay awards (STI and LTI) made to Executive KMP for FY2018 and FY2017, including the proportions between cash and conditional deferred elements.
The level of STI deferred has increased from 35.6 per cent to the 50 per cent level, reflecting one of the changes made for FY2018 to have all Executive KMP subject to deferral of half their STI award. Overall the proportion of deferred remuneration increased from 68.5 to 76.4 per cent.
2.5 Actual pay received
In line with general market practice a (non-AIFRS) presentation of actual pay received is provided in table 6 in addition to the statutory requirements (table 18). This gives shareholders another perspective of actual remuneration outcomes, albeit one that includes remuneration derived from prior years.
In addition to Fixed Remuneration (FR) and the cash component of STI, actual pay received includes equity that has vested from equity grants made in prior periods, whether from Deferred STI or from LTI vesting.
The value of Deferred STI that vests, even though it is not subject to further performance conditions, depends on the company’s share price at the time of vesting. This ensures that the original award value is exposed to increases or decreases in share price over the deferral period.
With respect to LTI awards table 6 shows no value crystallised in FY2018 (or FY2017) from prior year LTI allocations, and those amounts previously reported as statutory remuneration were forfeited during the year. These remuneration outcomes reflect that the company’s performance in recent years has not reached sustained levels at which executives derive any value from the LTI component of their remuneration package.
These results underline the strong alignment that exists between executive remuneration and both short-term and sustained long-term company performance.
69 of 92 Origin Energy Limited ABN 30 000 051 696

REMUNERATION REPORT FOR THE YEAR ENDED 30 JUNE 2018
Table 5: Variable pay (STI and LTI) awarded for the period.
STI LTI Deferral
Name FR
base ($)1 Tar
get
(%
FR
)
Target STI ($) S
core
card
(%
)
ST
I Aw
ard
(
%F
R)
ST
I Aw
ard
(
%T
arg
et)
STI Award
($)
Maximum
STI(%FR)
STIaward
(% of maximum)2
Target LTI (%
FR)
LTI Award(%FR)
LTI Award ($)3 %
of
ST
I d
efer
red
% o
f va
riab
le
def
erre
d
Executive Director
F Calabria 2018 1,700,000 110 1,870,000 143.7 123.0 111.8 2,091,000 130 94.6 180 180 3,060,000 50 79.7 2017 1,700,000 110 1,870,000 128.2 118.5 107.7 2,014,500 130 91.2 180 165 2,805,000 50 79.1
Other Executive KMP
J Briskin 2018 675,000 66 445,500 147.1 97.1 147.1 655,331 110 88.3 90 90 607,500 50 74.1 2017 384,750 66 253,935 115.8 76.5 115.8 294,142 110 69.5 90 90 346,275 33.3 69.4
G Jarvis 2018 724,000 66 477,840 145.1 95.8 145.1 693,346 110 87.1 90 90 651,600 50 74.2 2017 412,680 66 272,369 120.3 79.4 120.3 327,580 110 72.2 90 90 371,412 33.3 68.7
M Schubert 2018 724,000 66 477,840 138.3 91.3 138.3 660,853 110 83.0 90 90 651,600 50 74.8 2017 108,650 56 60,844 115.0 64.4 115.0 69,949 92.5 69.6 90 90 97,785 33.3 72.2
L Tremaine 2018 980,769 100 980,769 142.1 142.1 142.1 1,393,673 167 85.1 120 120 1,176,923 50 72.9 2017 — — — — — — — — — — — — — —
Former Executive KMP
G King 2018 — — — — — — — — — — — — — — 2017 760,000 90 684,000 0.0 0 0.0 0 150 0.0 180 0 0 — —
G Mallett 2018 11,346 45 5,106 0 0 0 0 75 0 60 0 0 0 0 2017 590,000 45 265,500 134.5 60.5 134.5 357,098 75 80.7 60 60 354,000 33.3 66.5
D Baldwin 2018 — — — — — — — — — — — — — — 2017 951,740 78 742,357 100.0 78.0 100.0 742,357 130 60.0 120 0 0 — —
Total 2018 4,815,115 4,257,055 129.1 5,494,203 88.7 128 128 6,147,623 50.0 76.4 2017 4,907,820 4,149,005 91.7 3,805,626 63.3 137 81 3,974,472 35.6 68.5
1 The FR base is the reference to Fixed Remuneration (FR) applicable for STI and LTI calculations, pro-rata for part year KMP periods. The FR base excludes acting and temporary allowances that may be included in FR more generally.
2 Where the STI award is less than 100 per cent of the maximum, the difference is forfeited. Awards are calculated with reference to the target. The ratio between maximum and target STI is 1.67 times, except for the CEO where the ratio is 1.18. Awards expressed relative to target are consistent between executives, but when expressed as a percentage of maximum the CEO appears proportionally higher relative to other executives because of his different ratio. This inconsistency will be eliminated from FY2019 (see table 9).
3 The LTI award allocation is conditional pay subject to performance hurdles over periods of 3-5 years. The awards may vest (partially or fully) or they may lapse without value in a future period. LTI for 2017 has been re-stated to align with the full face-value allocation commenced in 2018. The number of instruments held has not changed. The allocation value was originally expressed
in a mixture of accounting fair value and face value and is now expressed wholly in terms of face value (see table 11 ‘Allocation Amount’).
70 of 92 Origin Energy Limited ABN 30 000 051 696

REMUNERATION REPORT FOR THE YEAR ENDED 30 JUNE 2018
Table 6: Actual pay received in the period ($) – non-AIFRS
Variable pay (STI + LTI) received
Name Fixed Remuneration1 STI cash2 Deferred
STI vested3 LTI vested4 Total remuneration
received5 Equity forfeited6 Executive DirectorF Calabria 2018 1,700,000 1,045,500 213,380 0 2,958,880 (157,741)
2017 1,498,461 1,007,250 158,714 0 2,664,425 (1,755,705)
Other Executive KMPJ Briskin 2018 675,000 327,666 101,870 0 1,104,536 (41,757)
2017 339,225 196,095 0 0 535,320 0
G Jarvis 2018 724,000 346,673 156,882 0 1,227,555 (104,317) 2017 373,209 218,387 0 0 591,596 0
M Schubert 2018 724,000 330,427 213,771 0 1,268,198 0 2017 100,479 46,633 0 0 147,112 0
L Tremaine 2018 980,769 696,837 0 0 1,677,606 0 2017 — — — — — —
Former Executive KMPG King 2018 — — — — — —
2017 680,319 0 174,793 0 855,112 (6,245,275)
G Mallett 2018 71,346 0 0 0 71,346 02017 849,078 238,065 48,968 0 1,136,111 (411,555)
D Baldwin 2018 — — — — — — 2017 942,484 742,357 162,567 0 1,847,408 (2,000,352)
Total 2018 4,875,115 2,747,103 685,903 0 8,308,121 (303,815)2017 4,783,255 2,448,787 545,042 0 7,777,084 (10,412,887)
1 F Calabria was in two different roles during FY2017. Pro-rata for KMP periods for L Tremaine and G Mallett (FY2018) and for G King and D Baldwin (FY2017). G Mallet’s FR includes allowances paid for acting in the role of CFO.
2 For FY2018, STI cash represents half of the STI award (for FY2017, except for the CEO, it was two-thirds of the award, and for D Baldwin it was the whole award). The STI cash is allocated to the earning year even though it is physically paid after the end of that year.
3 Deferred STI vested in FY2018 was from grants awarded in 2013, 2014 and 2015; vests in FY2017 arose from grants in 2014 and 2015. The vested value is calculated as the number of vested securities multiplied by the closing price of Origin ordinary shares on the day of vesting.
4 LTI vested represents the value of LTI awards from prior years that vested wholly or partially during the year. No LTI awards vested in FY2018 or FY2017. 5 Total remuneration received is the sum of FR plus STI cash, plus the value of Deferred STI and LTI that vested during the Period. 6 The value of equity forfeited relates to previously awarded equity that was forfeited during the year (i.e. the relevant grants realised no benefit). The forfeited value represents
original value that was attributed to remuneration in the year of the grant. Only one LTI tranche (October 2013 Options) was tested during FY2018 (resulting in 100% forfeit).
71 of 92 Origin Energy Limited ABN 30 000 051 696
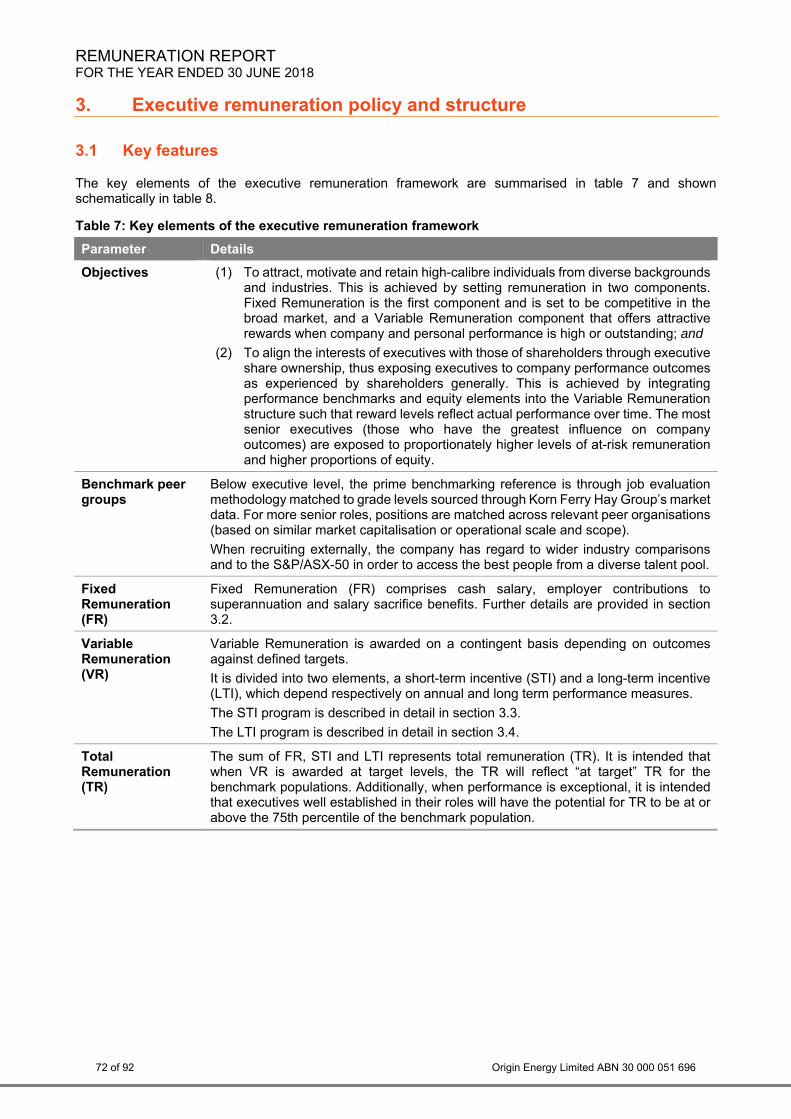
REMUNERATION REPORT FOR THE YEAR ENDED 30 JUNE 2018
3. Executive remuneration policy and structure
3.1 Key features
The key elements of the executive remuneration framework are summarised in table 7 and shown schematically in table 8.
Table 7: Key elements of the executive remuneration framework
Parameter Details
Objectives (1) To attract, motivate and retain high-calibre individuals from diverse backgrounds and industries. This is achieved by setting remuneration in two components. Fixed Remuneration is the first component and is set to be competitive in the broad market, and a Variable Remuneration component that offers attractive rewards when company and personal performance is high or outstanding; and
(2) To align the interests of executives with those of shareholders through executive share ownership, thus exposing executives to company performance outcomes as experienced by shareholders generally. This is achieved by integrating performance benchmarks and equity elements into the Variable Remuneration structure such that reward levels reflect actual performance over time. The most senior executives (those who have the greatest influence on company outcomes) are exposed to proportionately higher levels of at-risk remuneration and higher proportions of equity.
Benchmark peer groups
Below executive level, the prime benchmarking reference is through job evaluation methodology matched to grade levels sourced through Korn Ferry Hay Group’s market data. For more senior roles, positions are matched across relevant peer organisations (based on similar market capitalisation or operational scale and scope).
When recruiting externally, the company has regard to wider industry comparisons and to the S&P/ASX-50 in order to access the best people from a diverse talent pool.
Fixed Remuneration (FR)
Fixed Remuneration (FR) comprises cash salary, employer contributions to superannuation and salary sacrifice benefits. Further details are provided in section 3.2.
Variable Remuneration (VR)
Variable Remuneration is awarded on a contingent basis depending on outcomes against defined targets.
It is divided into two elements, a short-term incentive (STI) and a long-term incentive (LTI), which depend respectively on annual and long term performance measures.
The STI program is described in detail in section 3.3.
The LTI program is described in detail in section 3.4.
Total Remuneration (TR)
The sum of FR, STI and LTI represents total remuneration (TR). It is intended that when VR is awarded at target levels, the TR will reflect “at target” TR for the benchmark populations. Additionally, when performance is exceptional, it is intended that executives well established in their roles will have the potential for TR to be at or above the 75th percentile of the benchmark population.
72 of 92 Origin Energy Limited ABN 30 000 051 696

REMUNERATION REPORT FOR THE YEAR ENDED 30 JUNE 2018
Table 8 FY2018 remuneration framework and timelines (ELT)
Grant Year 1 Year 2 Year 3 Year 4
Fixed remuneration ASX-50 and other relevant benchmarks
STI earning year 60% Financials (including EPS, NCOIA, EBITDA, opex) 20% Customer (strategic NPS etc) 20% People (people, culture and HSE)
cash award (50% of STI)
equity award (50% of STI)
STI deferral (2 years) Ongoing minimum shareholding requirement LTI
Pre-grant service contribution
Performance share rights Half with 3-year ROCE hurdle Half with 3-year relative TSR hurdle
1-year post-vest holding lock
equity grant vest conditional vest 3.2 Fixed Remuneration
FR (cash salary, employer contributions to superannuation and salary sacrifice benefits) takes into account the size and complexity of the role, and the know-how, skills and experience required to be successful in it. To be market competitive, roles are benchmarked annually with reference to comparable roles in the peer groups and achieving median for FR over time.
FY2018 FR for Executive KMP is shown in Tables 5 and 6. Following a benchmark review, FR for the CEO will increase from $1,700,000 to $1,800,000 effective for FY2019, and an average increase of 3.7% will apply to other ELT roles. This review also took into account that the incumbents are becoming more established in the roles that were created in the executive team restructure of December 2016. The CEO’s base remuneration is below the benchmark median of peer organisations and is intended to move closer to median over time subject to performance and prevailing benchmarks. 3.3 STI plan details
STI awards are calculated on the basis of achievement of various KPIs defined annually by the Board. These KPIs reference both annual financial results and other measures that reflect organisational health and predict superior long term performance. STI awards are delivered half in cash and half deferred into equity for two years which is contingent on ongoing employment with satisfactory service over that period. Any trading in the resulting shares is further subject to the Executive Minimum Shareholding Requirement (MSR) requirements described in section 3.6.
A detailed description of the STI plan operation is provided in table 9, with table 10 setting out the arrangements for the deferred element of STI awards.
73 of 92 Origin Energy Limited ABN 30 000 051 696

REMUNERATION REPORT FOR THE YEAR ENDED 30 JUNE 2018
Table 9: STI plan details
Parameter Details
Name Short Term Incentive Plan (STIP)
Objective To align superior outcomes for shareholders with remuneration outcomes for executives and employees; to reward performance; to be competitive in the broad market and to offer attractive levels of reward for out-performance. STIP is a key element in the overall remuneration objective to attract, motivate and retain high-calibre individuals.
Type Annual awards based on annual objectives, delivered half in cash and half in deferred equity (see table 10).
Opportunity Amount
The STI opportunity level varies according to the executive’s role, generally increasing with role size and accountability and the capacity to influence business outcomes. For FY2018 the levels were:
% of Fixed Rem Role Min Target Max CEO 0 110* 130* CFO 0 100 167 Oth Exec KMP 0 66 110 Next level executives 0 45-60 75-100
*see below for FY2019 changes for CEO
The opportunity levels are set with reference to the benchmarks in table 7 such that target outcomes align with median market outcomes, and when performance is at its highest there is opportunity to reach the 75th percentile of that market.
Deferral The CEO and senior executives have one-half of their STI award deferred on the terms and conditions set out in table 10 below.
Approval The KPIs and the outcomes for Executive KMP are approved by the Board on advice from the RPC. The CEO makes recommendations to the RPC in respect of his direct reports.
Payment and superannuation
The portion of an STI award that is not deferred (see table 10) is paid in cash (less applicable tax and required superannuation contribution) approximately three months after the end of the financial year in which it was earned.
Service and behavioural conditions
The award of STI is subject to ongoing employment with satisfactory performance throughout the performance period and, in addition, through to the end of any applicable deferral periods (see Deferral below).
Adherence to Origin’s values and behavioural standards is a requirement for achieving satisfactory performance. Failure to do so will result in disqualification from incentive awards and may jeopardise continued employment. A more formalised measurement of behaviours is being introduced for FY2019 and this will be incorporated more specifically into remuneration assessment. The Board retains discretion to vary formulaic outcomes to ensure all relevant matters are taken into account when determining appropriate levels of remuneration, within the maximum prescribed levels.
Cessation and Good Leavers
No STI award is made where the Service Conditions have not been met in full, except in limited “good leaver” circumstances.
“Good leaver” circumstances are those where cessation of employment arises in consequence of death, disability, redundancy, genuine retirement or other exceptional circumstances as approved by the Board.
STI awards are settled wholly in cash (no deferral) where payment is in circumstances of a good leaver cessation.
Previously awarded but unvested deferred awards vest at cessation of employment in good leaver circumstances, unless the Board determines otherwise.
74 of 92 Origin Energy Limited ABN 30 000 051 696
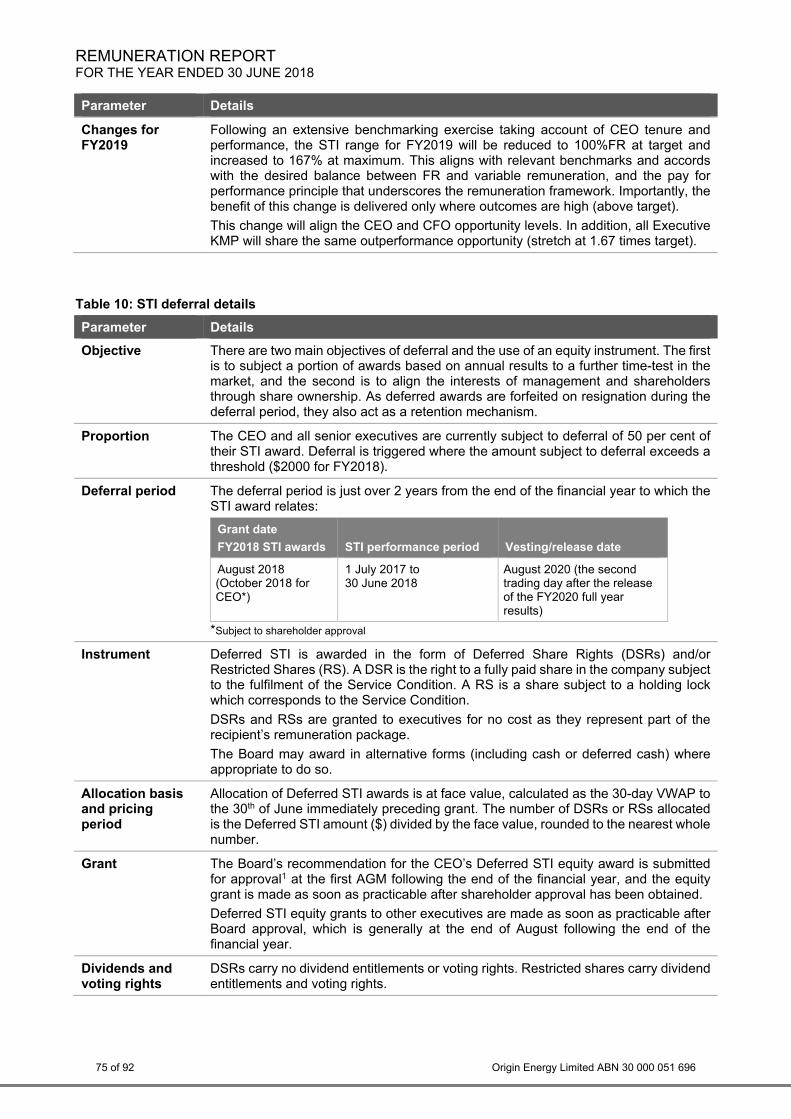
REMUNERATION REPORT FOR THE YEAR ENDED 30 JUNE 2018
Parameter Details
Changes for FY2019
Following an extensive benchmarking exercise taking account of CEO tenure and performance, the STI range for FY2019 will be reduced to 100%FR at target and increased to 167% at maximum. This aligns with relevant benchmarks and accords with the desired balance between FR and variable remuneration, and the pay for performance principle that underscores the remuneration framework. Importantly, the benefit of this change is delivered only where outcomes are high (above target).
This change will align the CEO and CFO opportunity levels. In addition, all Executive KMP will share the same outperformance opportunity (stretch at 1.67 times target).
Table 10: STI deferral details
Parameter Details
Objective There are two main objectives of deferral and the use of an equity instrument. The first is to subject a portion of awards based on annual results to a further time-test in the market, and the second is to align the interests of management and shareholders through share ownership. As deferred awards are forfeited on resignation during the deferral period, they also act as a retention mechanism.
Proportion The CEO and all senior executives are currently subject to deferral of 50 per cent of their STI award. Deferral is triggered where the amount subject to deferral exceeds a threshold ($2000 for FY2018).
Deferral period The deferral period is just over 2 years from the end of the financial year to which the STI award relates:
Grant date
FY2018 STI awards STI performance period Vesting/release date
August 2018 (October 2018 for CEO*)
1 July 2017 to 30 June 2018
August 2020 (the second trading day after the release of the FY2020 full year results)
*Subject to shareholder approval
Instrument Deferred STI is awarded in the form of Deferred Share Rights (DSRs) and/or Restricted Shares (RS). A DSR is the right to a fully paid share in the company subject to the fulfilment of the Service Condition. A RS is a share subject to a holding lock which corresponds to the Service Condition.
DSRs and RSs are granted to executives for no cost as they represent part of the recipient’s remuneration package.
The Board may award in alternative forms (including cash or deferred cash) where appropriate to do so.
Allocation basis and pricing period
Allocation of Deferred STI awards is at face value, calculated as the 30-day VWAP to the 30th of June immediately preceding grant. The number of DSRs or RSs allocated is the Deferred STI amount ($) divided by the face value, rounded to the nearest whole number.
Grant The Board’s recommendation for the CEO’s Deferred STI equity award is submitted for approval1 at the first AGM following the end of the financial year, and the equity grant is made as soon as practicable after shareholder approval has been obtained.
Deferred STI equity grants to other executives are made as soon as practicable after Board approval, which is generally at the end of August following the end of the financial year.
Dividends and voting rights
DSRs carry no dividend entitlements or voting rights. Restricted shares carry dividend entitlements and voting rights.
75 of 92 Origin Energy Limited ABN 30 000 051 696

REMUNERATION REPORT FOR THE YEAR ENDED 30 JUNE 2018
Parameter Details
Vesting, release and exercise
DSRs vest and Restricted Shares are released on meeting the Service Conditions (or as described in the Cessation and Good Leaver provisions above). Exercise of DSRs is automatic on vesting and there is no exercise price. Share disposals are subject to the minimum shareholding requirement (section 3.6).
Changes for FY2019
The preferred allocation vehicle for deferred STI equity granted after 1 July 2018 will be in the form of Restricted Shares. The intention will be to purchase the shares on market (unless circumstances arise where the Board determines otherwise), which ties the share award to current rather than future share price.
1 Where the CEO’s Deferred STI equity allocation is purchased on market, which from 2018 is the Board’s preferred approach, shareholder approval is not required. However, in the interests of good governance and to preserve flexibility to issue shares where it may be appropriate to do so, the Board’s practice is to seek shareholder approval.
3.4 LTI plan details
LTI awards are provided in the form of equity allocations which are made annually according to role size and influence on long-term performance. The equity may vest in the future subject to the executive meeting service and performance obligations, and the company meeting or exceeding three-year performance hurdles. There is a further one-year holding lock such that the overall deferral period is four years. Any trading in vested equity is further subject to the Executive Minimum Shareholding Requirement (MSR) requirements described in section 3.6. A detailed description of the LTI plan operation is provided in table 11.
Table 11: LTI plan details
Parameter Details
Name Long Term Incentive Plan (LTIP)
Objective The objective is to align the interests of executives with those of shareholders. If shareholders do well, executives are rewarded. Conversely, where shareholders do not do well, neither does the executive. In combination with the holding lock (see below) and the Minimum Shareholding Requirement (section 3.6), the plan achieves alignment through increased executive share ownership. Unvested equity is forfeited if the executive resigns before the end of the performance period, therefore the LTI also serves as a retention tool.
Type LTI is conditional equity that may or may not vest (crystallise) in the future. Vesting is subject to the company meeting or exceeding long-term performance conditions (set out below), and, in addition, conditional on the executive meeting service and performance obligations.
Allocation basis and pricing period
The basis of LTI awards and allocation is on the face value of an Origin share calculated as the 30-day VWAP to and including the last trading day of the financial year immediately preceding the year the award is granted.
Grant The Board’s recommendation for the CEO’s LTI equity award is submitted for approval at the first AGM following the end of the financial year, and the equity grant is made as soon as practicable after shareholder approval has been obtained.
LTI equity grants to other executives are made as soon as practicable after Board approval, which is generally at the end of August following the end of the financial year.
76 of 92 Origin Energy Limited ABN 30 000 051 696

REMUNERATION REPORT FOR THE YEAR ENDED 30 JUNE 2018
Parameter Details
Allocation amount
The value of the allocation is role-based reflecting role accountability and influence on long-term company performance.
As foreshadowed in the 2017 Remuneration Report, Options were discontinued effective from FY2018 awards and the basis of allocation has been changed from partly Face Value (for PSRs) and partly Fair Value (for Options) to entirely Face Value. The Board, having taken external advice to ensure that the change was made on a remuneration-neutral basis, has applied an overall gross-up factor of 50% to the previous standard or target allocation level.1
Role % of Fixed Rem allocated
on a Face Value basis CEO 180CFO 120Other Executive KMP 90Next level executives 60-75
Awards are considered soon after the end of each financial year, and take into account demonstrated performance and long-term commitment as assessed at that time (this is the “pre-grant service contribution” referred to in table 8). The Board may determine that the allocation should be varied up or down (including to zero).
The benchmarks used to determine the allocation levels are described in the Total Remuneration section of table 7.
Allocation approval
Annual LTI allocations for Executive KMP are approved by the Board on advice from the RPC. The CEO makes recommendations to the RPC in respect of his direct reports.
Instruments Performance Share Rights (PSRs) are the standard vehicle for all LTI awards made after 18 October 2017. A PSR is a right to a fully paid ordinary share in the company, subject to the fulfilment of performance and service conditions. The PSRs are granted at no cost because they are awarded as remuneration.
Dividends and voting rights
PSRs carry no dividend entitlements or voting rights.
Performance and deferral period
The deferral period is approximately 4 years, made up of a 3-year performance period (three financial years) followed by a holding lock of approximately 13½ months:
Grant date FY2018 LTI awards
Base date (Start of performance period)
Test date (End of performance period)
Vested Shares Holding Lock
August 2018 (October 2018 for CEO*)
1 July 2018 30 June 2021
The second trading day after the release of the FY2022 full year results in August 2022
*Subject to shareholder approval
The pre-grant service contribution (see table 8 and Allocation Amount above) is additional to and not counted in the performance or deferral period.
Service and behavioural conditions
In addition to the performance conditions below, unvested LTI awards will ordinarily be forfeited if the holder does not remain in ongoing employment with satisfactory service through to the end of the performance period. Satisfactory service includes adherence to Origin’s values and behavioural standards.
77 of 92 Origin Energy Limited ABN 30 000 051 696

REMUNERATION REPORT FOR THE YEAR ENDED 30 JUNE 2018
Parameter Details
Performance Condition 1
One half of the LTI award has a relative Total Shareholder Return (TSR) hurdle. Relative TSR has been chosen because it directly reflects returns to shareholders and aligns executive reward to that return.
Vesting occurs only where Origin’s TSR over the performance period places it above the 50th percentile of the S&P/ASX-50 companies as defined at the start of the performance period.
Half of the PSRs in this tranche vest if the 50th percentile is exceeded, and all of the PSRs in this tranche vest if Origin’s TSR achieves or exceeds the 75th percentile, with straight-line vesting between.
The S&P/ASX-50 has been chosen as the comparator group because, in the absence of a sufficient number of operationally similar and direct competitors, it represents the most meaningful group with which Origin competes for shareholder investment and executive talent.
For awards to be granted in 2018 (referable to FY2018 service) consideration was given to the inclusion of a share price growth condition, however following consultation it was decided not to do so as the absolute measure conflicted with the operation of the relative return measure.
Performance Condition 2
One half of the LTI award has a Return on Capital Employed (ROCE) condition. The choice of ROCE reflects the importance of prudent capital allocation and the need to generate sufficient returns over that capital employed over time.
ROCE is referenced to EBIT divided by average capital employed. Adjustments to statutory EBIT are considered in restricted circumstances. Circumstances that would result in impairment related adjustments include for example where such impairments cannot reasonably be said to be the responsibility of current management. Determination of the appropriate cost of capital during the performance period follows established capital asset pricing model norms. Adjustments to these targets may be warranted, at the Board’s discretion, to appropriately reflect the impact of corporate actions such as M&A or major projects which, while in shareholders’ long term interests, may adversely impact near-term ROCE.
For awards granted in 2017, the ROCE performance condition was in two parts. First, the simple average of actual ROCE outcomes over the performance period must meet or exceed the simple average of the annual targets set in advance by the Board. In addition, for any vesting to occur, the actual ROCE must also meet or exceed Origin’s overall weighted average cost of capital (WACC) in either of the last two years of the performance period. If both of these targets are achieved, half of the relevant PSRs vest. If the WACC hurdle is exceeded by two percentage points or more, then all of the relevant PSRs vest, with straight line proportionate vesting in between.
For awards to be granted in 2018, the ROCE approach has been refined to better recognise the differing capital characteristics between the Integrated Gas and Energy Markets businesses. Accordingly, average actual ROCE outcomes will need to exceed average annual ROCE targets which are reflective of delivering WACC for each business, and will be tested separately, and vest separately, for the two businesses (half of the ROCE tranche will be allocated to each). Meeting or exceeding the ROCE targets will result in half of the relevant PSRs vesting, while exceeding the targets by two percentage points or more will result in all of the relevant PSRs vesting, with straight line proportionate vesting in between.
Cash awards In exceptional circumstances (for example an LTI recipient residing in an international jurisdiction, or where it is inappropriate to provide shares) the Board may determine to cash settle an award.
78 of 92 Origin Energy Limited ABN 30 000 051 696

REMUNERATION REPORT FOR THE YEAR ENDED 30 JUNE 2018
Parameter Details
Cessation and good leavers
Generally, unvested LTI awards held at cessation of employment will be forfeited on the date of cessation.
“Good leaver” circumstances are those where cessation of employment arises in consequence of death, disability, redundancy, genuine retirement or other exceptional circumstances as approved by the Board.
In good leaver circumstances, unvested LTI awards may be held ‘on foot’ subject to their original Performance Conditions and other terms and conditions being met (except for the waived Service Condition), or dealt with in an appropriate manner determined by the Board.
Minimum and maximum value
The minimum value of the PSRs is zero. This will be the case where awards are not made, or where service conditions are not met, or where performance conditions are not met and there is no vesting. The maximum present-day value is the present-day face value based on full vesting. The actual future value will of course depend on the future share price and the level of vesting.
Pricing period The pricing period for allocation is the 30-day VWAP up to and including the last trading day of the financial year immediately preceding grant.
Vesting and exercise
PSRs vest according to the level at which each of the Performance Conditions have been met. Exercise of PSRs is automatic on vesting and there is no exercise price. Shares allocated after vesting are subject to a holding lock, and, more generally, disposals are also subject to the minimum shareholding requirement (section 3.6).
Legacy Options In addition to PSRs, legacy awards that remain unvested or unexercised as at the date of this Report include seven series of Options granted between 22 October 2014 and 18 October 2017. An Option is the right to a fully paid ordinary share on payment of an exercise price.
All of the legacy Options have a Relative TSR performance condition, against a peer group of either S&P/ASX-100 (2014 and 2015 series), or (for 2016 and 2017 series) on the basis of a market capitalisation reference (the ten companies immediately larger and smaller than Origin) plus AGL, Oil Search, Santos and Woodside (if they were not already in that group).
The legacy Options have performance periods varying between four and five years, with exercise prices as tabulated in table 20.
1 The gross-up required for changing from fair value to face value allocation was determined to be approximately 100% based on consideration of external advice. As this change applied to one-half of the original LTI structure (the Options tranche) the overall gross-up was set at 50%. The CEO’s LTI remuneration from appointment was expressed as an opportunity range with a target 110%FR and a maximum cap of 130%FR, on the basis of mixed allocations (face value and fair value). In moving to a standard allocation expressed wholly on the basis of face value, the mid-point of the old range (120%FR) has been grossed-up by 50% (i.e. to 180%FR).
79 of 92 Origin Energy Limited ABN 30 000 051 696

REMUNERATION REPORT FOR THE YEAR ENDED 30 JUNE 2018
3.5 Remuneration range, mix and deferral
The possible range of remuneration outcomes and their mix is summarised in tables 12-15, using the following definitions: Minimum FR plus zero STI awarded, and zero LTI awarded (or zero LTI vested outcome) Target FR plus Target STI awarded, plus LTI allocated at full face value with 50% vesting Maximum FR plus Maximum STI awarded, and LTI allocated at full face value with 100% vesting
For the CEO, the range is shown below for both FY2018 and for FY2019. The FY2019 data incorporates a change to Fixed Remuneration (refer section 3.2) from 1 July 2018, and to STI opportunity levels (refer table 9). The CEO’s Total Remuneration will increase by 2.4% at target outcomes with a potential increase of up to 15.4% for the achievement of outstanding (stretch) results.
Table 12 FY2018 FY2019 CEO Minimum Target Maximum Minimum Target MaximumFR 1,700,000 1,700,000 1,700,000 1,800,000 1,800,000 1,800,000STI 0 1,870,000 2,210,000 0 1,800,000 3,006,000LTI 0 1,530,000 3,060,000 0 1,620,000 3,240,000Total 1,700,000 5,100,000 6,970,000 1,800,000 5,220,000 8,046,000
The make-up of the package at these different delivery levels is summarised in table 13:
Table 13
Dashed lines indicate conditional variable pay that is subject to forfeiture
80 of 92 Origin Energy Limited ABN 30 000 051 696
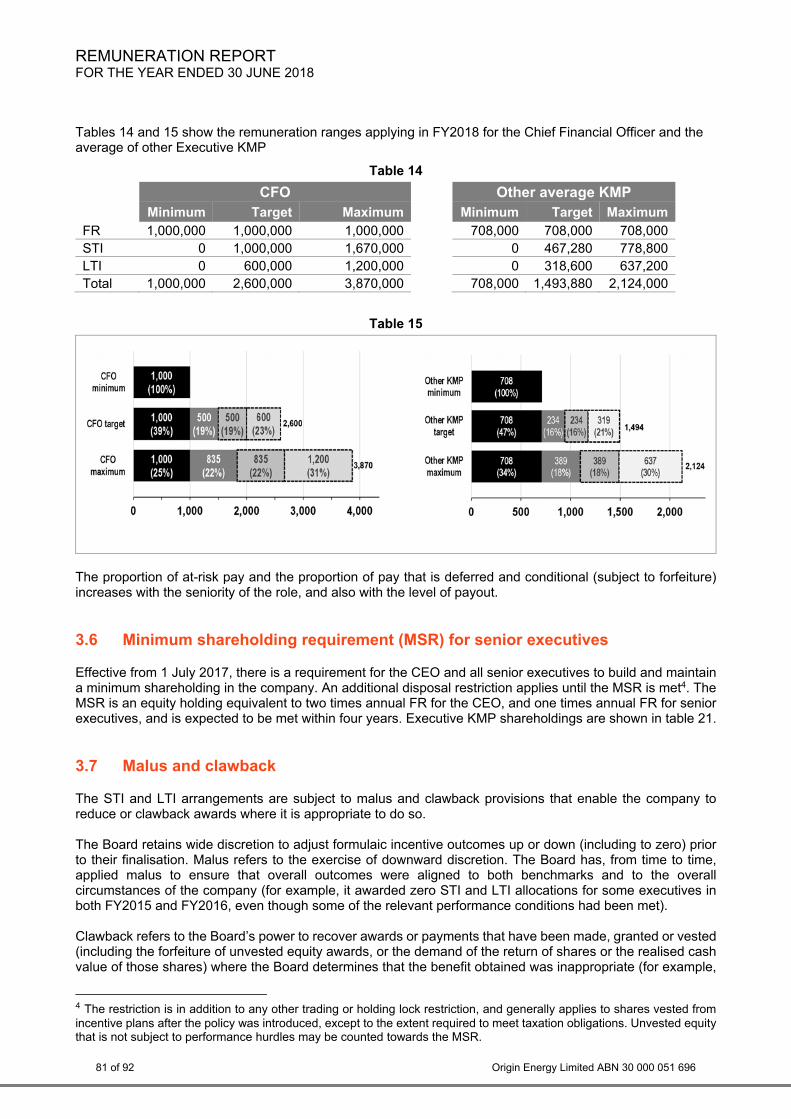
REMUNERATION REPORT FOR THE YEAR ENDED 30 JUNE 2018
Tables 14 and 15 show the remuneration ranges applying in FY2018 for the Chief Financial Officer and the average of other Executive KMP
Table 14 CFO Other average KMP Minimum Target Maximum Minimum Target MaximumFR 1,000,000 1,000,000 1,000,000 708,000 708,000 708,000STI 0 1,000,000 1,670,000 0 467,280 778,800LTI 0 600,000 1,200,000 0 318,600 637,200Total 1,000,000 2,600,000 3,870,000 708,000 1,493,880 2,124,000
Table 15
The proportion of at-risk pay and the proportion of pay that is deferred and conditional (subject to forfeiture) increases with the seniority of the role, and also with the level of payout. 3.6 Minimum shareholding requirement (MSR) for senior executives
Effective from 1 July 2017, there is a requirement for the CEO and all senior executives to build and maintain a minimum shareholding in the company. An additional disposal restriction applies until the MSR is met4. The MSR is an equity holding equivalent to two times annual FR for the CEO, and one times annual FR for senior executives, and is expected to be met within four years. Executive KMP shareholdings are shown in table 21. 3.7 Malus and clawback
The STI and LTI arrangements are subject to malus and clawback provisions that enable the company to reduce or clawback awards where it is appropriate to do so. The Board retains wide discretion to adjust formulaic incentive outcomes up or down (including to zero) prior to their finalisation. Malus refers to the exercise of downward discretion. The Board has, from time to time, applied malus to ensure that overall outcomes were aligned to both benchmarks and to the overall circumstances of the company (for example, it awarded zero STI and LTI allocations for some executives in both FY2015 and FY2016, even though some of the relevant performance conditions had been met). Clawback refers to the Board’s power to recover awards or payments that have been made, granted or vested (including the forfeiture of unvested equity awards, or the demand of the return of shares or the realised cash value of those shares) where the Board determines that the benefit obtained was inappropriate (for example,
4 The restriction is in addition to any other trading or holding lock restriction, and generally applies to shares vested from incentive plans after the policy was introduced, except to the extent required to meet taxation obligations. Unvested equity that is not subject to performance hurdles may be counted towards the MSR.
81 of 92 Origin Energy Limited ABN 30 000 051 696

REMUNERATION REPORT FOR THE YEAR ENDED 30 JUNE 2018
as a result of fraud, dishonesty or breach of employment obligations by the recipient or any employee of the Group). The Board has not encountered circumstances in this or prior periods that have required the application of the clawback provisions. 3.8 No hedging
The company’s policy requires that employees cannot trade instruments or other financial products that limit the economic risk of any securities held under any equity-based incentive scheme. Non-compliance may result in summary dismissal.
3.9 Change of control
If a change of control5 occurs prior to the vesting of share rights that are not subject to performance hurdles the Board has discretion to bring forward vesting dates where it considers it appropriate to do so. If a change of control occurs prior to the vesting of LTI that is subject to performance hurdles, provided the executive has held the relevant instruments for at least 12 months as at the change of control, the Board has discretion to bring forward testing against the performance conditions as at the date of the change of control, and vesting may occur to the extent that the relevant performance conditions have been met. 3.10 Capital reorganisation
On a capital reorganisation, the number of unvested share rights and Options held by participants may be adjusted in a manner determined by the Board to minimise or eliminate any material advantage or disadvantage to the participant. If new awards are granted, they will, unless the Board determines otherwise, be subject to the same terms and conditions as the original awards. 3.11 Other equity/share plans
The company operates a universal employee share plan in which all full-time and part-time employees can be awarded up to $1,000 worth of company shares on an annual basis. As foreshadowed in last year’s report, the arrangements are being amended to encourage greater share ownership across the company. For FY2018 eligibility for the award was expanded by removing the conditional safety hurdle and reducing the service requirement from twelve to six months. The company is planning to introduce a salary sacrifice and matching mechanism to begin in FY2019. For the FY2018 award, shares will be purchased on-market during late August for allocation to employees on a restricted basis (the shares cannot be traded until the earlier of cessation of employment or three years). Directors are not eligible for the general employee share plan. To help preserve shareholder value, retention plans may be used selectively to retain key people. The RPC regularly assesses the risk of the Group losing key people in areas of intense market activity, for example critical employees who manage core activities or have skills that are being actively solicited in the market. Where appropriate the RPC may consider putting in place deferred payment arrangements to reduce the risk of critical loss. Key people may be offered DSRs or deferred cash payments subject to the condition of remaining in ongoing employment with the company through to a nominated date and achieving personal performance targets over that period. Where DSRs are used for this purpose they represent the same equity vehicle described in table 10 for deferred STI, but their purpose is for retention and the vesting period will vary according to the specific circumstances. No deferred cash or retention DSRs were provided to KMP during the current or the prior period. 5 Change of control is defined as a person/entity acquiring more than 50 per cent of the relevant interest in the company pursuant to a takeover bid that has become unconditional, or when a person/entity otherwise acquires more than 50 per cent of a relevant interest in the issued capital of the company
82 of 92 Origin Energy Limited ABN 30 000 051 696

REMUNERATION REPORT FOR THE YEAR ENDED 30 JUNE 2018
From time to time it may be necessary to offer deferred equity to replace similar or equivalent equity that an executive forfeits when leaving another employer to take up employment with the company. ‘Sign-on’ equity of this sort, where required, is targeted to the particular circumstances and will have vesting periods matching those circumstances. Table 20 identifies that such sign-on equity was granted to L Tremaine in FY2018. 3.12 Remuneration and contractual details for Executive KMP
Table 16 sets out the main employment terms and conditions for Executive KMP as at 30 June 2018.
Table 16: Executive service agreements and remuneration terms
CEO Other KMP
Basis of contract Ongoing (no fixed term) Ongoing (no fixed term)
Notice period 12 months by either party, or shorter notice by agreement No notice for misconduct or breach of contract
Up to six months by either party or shorter notice by agreement No notice for misconduct or breach of contract
Termination benefits for cause
Statutory entitlements only Statutory entitlements only
Termination benefits for resignation
Notice as above or payment in lieu of notice that is not worked; current-year STI forfeited; all unvested equity lapses; statutory entitlements
Notice as above or payment in lieu of notice that is not worked; current-year STI forfeited; all unvested equity lapses; statutory entitlements
Termination benefits for other than resignation or cause
Notice worked (or payment in lieu of any portion not worked); pro-rata STI for the period worked (no deferral applicable); all unvested equity lapses unless held ‘on foot’ in accordance with Equity Incentive Plan Rules (in cases of death, disability, genuine retirement or extraordinary circumstance); and statutory entitlements
Notice worked (or payment in lieu of any portion not worked); pro-rata STI for the period worked (no deferral applicable); all unvested equity lapses unless held ‘on foot’ in accordance with Equity Incentive Plan Rules (in cases of death, disability, bona fide redundancy, genuine retirement or extraordinary circumstance); and statutory entitlements. Payment in accordance with the company’s general redundancy policy of three weeks FR per year of service with a minimum of 18 weeks and a maximum of 78 weeks.
Remuneration As set out in table 12. Remuneration is regularly reviewed to align with policy and benchmarks.
As set out in table 12. Remuneration is regularly reviewed to align with policy and benchmarks.
83 of 92 Origin Energy Limited ABN 30 000 051 696

REMUNERATION REPORT FOR THE YEAR ENDED 30 JUNE 2018
4. Remuneration governance
4.1 Role of the Board and its Remuneration and People Committee
The full Board has oversight of Origin’s remuneration arrangements. It is accountable for the remuneration of executives and of NEDs, and the policies and processes governing both. The Remuneration and People Committee (RPC) operates under a Charter published on the company’s website at originenergy.com.au. The RPC, through its chairman, provides advice and makes recommendations to the full Board on remuneration for NEDs and for ELT members, and also for all equity arrangements and grants regardless of level. The RPC has delegated authority to approve remuneration arrangements for Origin people outside these groups. As identified in table 1, the RPC has four members (including its chairman) who are all independent NEDs. The RPC’s Charter requires a minimum of three NEDs. In addition, there is a standing invitation to all Board members to attend the RPC’s meetings. The RPC met formally six times during the Period. 4.2 External advisors
The RPC has established protocols for engaging and dealing with external advisors, including those defined as remuneration consultants for the purposes of the Act. The protocols are to ensure independence and the avoidance of conflicts of interest. The protocols require that remuneration advisors are directly engaged by the RPC and act on instruction from its Chairman. Reports must be delivered directly to the RPC Chairman. The advisor is prohibited from communication with company management except as authorised by the Chairman, and limited to the provision or validation of factual and policy data. The advisor must furnish a statement confirming the absence of any undue influence from management. During the Period the RPC engaged external advisors to conduct practice reviews and benchmarking exercises, and it also received general market trend information from a variety of commercial and industry sources. It did not seek or receive any remuneration recommendations within the definition of the Act. 4.3 Remuneration policy and structure for NEDs
NED remuneration is designed to ensure independence by setting fees that are fixed and not dependent on company results. There are no bonus or incentive-based payments. This ensures that NEDs are able to independently and objectively assess both executive and company performance. On 18 October 2017 shareholders approved setting the aggregate cap for overall NED remuneration at $3,200,000 per annum, prior to that it had last been approved in 2013 (at $2,700,000). The increase was approved to provide the Board with sufficient flexibility to appoint additional directors, and it also recognised that there had been a decrease in the number of executive directors and an increase in the number of NEDs. Board and committee fees take into account market rates for similar positions at relevant Australian organisations (those of comparable size and complexity) that fairly reflect the time commitments and responsibilities involved. Per diem fees may also be paid on occasions where approved special work is undertaken outside of the expected commitments. No per diem fees were paid during the Period. The Origin Chairman receives a single fee that is inclusive of committee activities, while other NEDs receive a NED Base Fee and separate fees for their role on specific committees, other than the Nomination Committee, which is considered within the NED Base Fee. All fees include superannuation contributions. As reflected in Table 17, which sets out the structure and level of NED fees, there is no change to the fees to apply during FY2019. Fees were last increased in FY2013 (fees for the Risk Committee were introduced in FY2016).
84 of 92 Origin Energy Limited ABN 30 000 051 696

REMUNERATION REPORT FOR THE YEAR ENDED 30 JUNE 2018
Table 17: NED and committee fees ($)
FY 2018 2019
Board – Chairman (inclusive of committee fees) 677,000 677,000 NED Base Fee (exclusive of committee fees) 196,000 196,000
Audit — Chairman 57,000 57,000 Audit — Member 29,000 29,000
Remuneration and People — Chairman 47,000 47,000 Remuneration and People — Member 21,000 21,000
Health, Safety and Environment — Chairman 42,000 42,000 Health, Safety and Environment — Member 21,000 21,000
Risk — Chairman 42,000 42,000 Risk — Member 21,000 21,000
Nomination — Chairman nil nil Nomination — Member nil nil
Origin Foundation - Chairman nil nil
4.4 Minimum shareholding requirement (MSR) for NEDs
To align the interests of the Board and shareholders, NEDs are required to build and then maintain a minimum shareholding in the company. The MSR requirement for the Chairman was raised effective from 1 July 2017 from one times the NED Base Fee to two times the NED Base Fee, and for all other NEDs it is one times the NED Base Fee. The MSR must be reached within three years of appointment, or, where the requirement has been increased, within two years of the increase. At the date of this Remuneration Report, all NEDs either met the minimum requirement or were on track to meet it within the required time. Details on NED shareholdings are included in table 21. A Non-executive Director Share Plan (NEDSP) was suspended in 2013 (existing participants could no longer make acquisitions) and closed to new entrants. The NEDSP provided for NEDs to sacrifice annual fees toward the acquisition of shares, which were then acquired on market by the Trustee of the plan. There is one remaining participant in the NEDSP. A revised Director Share Acquisition Plan is under consideration for introduction during FY2019.
85 of 92 Origin Energy Limited ABN 30 000 051 696

REMUNERATION REPORT FOR THE YEAR ENDED 30 JUNE 2018
5. Statutory disclosures
Table 18: Executive KMP statutory remuneration (A-IFRS) ($, except where otherwise indicated)
Short-term benefits
Post-employment benefits Accounting value of long-term benefits Totals
Base salary Cash STI1
Non-monetary benefits2
Superannuation
Deferred STI3 LTI4
Accrued leave change
Termination benefits5
Total remuneration
At Risk (%)
Share based (%)
Executive Director F Calabria 2018 1,646,466 1,045,500 32,826 24,384 697,375 612,235 42,500 — 4,101,285 57 32
2017 1,471,005 1,007,250 32,312 27,456 433,397 458,546 265,312 — 3,695,278 51 24
Other Executive KMP J Briskin 2018 654,936 327,666 10,645 20,064 187,782 109,763 68,488 — 1,379,343 45 22
2017 328,035 196,095 4,375 11,190 61,343 35,477 13,903 — 650,418 45 15
G Jarvis 2018 684,258 346,673 27,225 27,468 220,422 161,139 18,100 — 1,485,285 49 26 2017 357,798 218,387 15,236 15,411 81,009 73,845 37,868 — 799,554 47 19
M Schubert 2018 703,936 330,427 9,848 20,064 223,244 121,000 9,042 — 1,417,561 48 24 2017 97,200 46,633 1,672 3,279 30,180 10,123 1,881 — 190,968 46 21
L Tremaine5 2018 961,091 696,837 10,764 19,678 220,978 1,784,358 12,253 — 3,705,959 73 54 2017 — — — — — — — — — — —
Former Executive KMP
G King6 2018 — — — — — — — — — — — 2017 673,026 0 21,000 7,293 20,796 272,492 15,738 2,173,077 3,183,422 9 9
G Mallett5 2018 70,486 0 963 482 956 4,693 142 — 77,722 7 7 2017 824,046 238,065 26,282 25,032 112,805 131,850 15,000 — 1,373,080 35 18
D Baldwin6 2018 — — — — — — — — — — — 2017 926,237 742,357 27,649 16,247 142,087 507,254 23,945 746,019 3,131,795 44 21
Total 2018 4,721,173 2,747,103 92,272 112,140 1,550,756 2,793,188 150,525 0 12,167,157 58 36 2017 4,677,347 2,448,787 128,526 105,908 881,617 1,489,587 373,647 2,919,096 13,024,515 37 18
1 For FY2018 STI cash represents one half of the STI award. For FY2017 it represents two-thirds of the STI awarded, except for the CEO which was one half. For Former Executive KMP the STI award may not be subject to deferral. The STI cash is physically paid after the end of the financial year to which it relates, but is allocated to the earning year. The balance of the STI award is STI deferred.
2 Non-monetary benefits include insurance premiums and fringe benefits such as car parking and expenses associated with travel.
86 of 92 Origin Energy Limited ABN 30 000 051 696
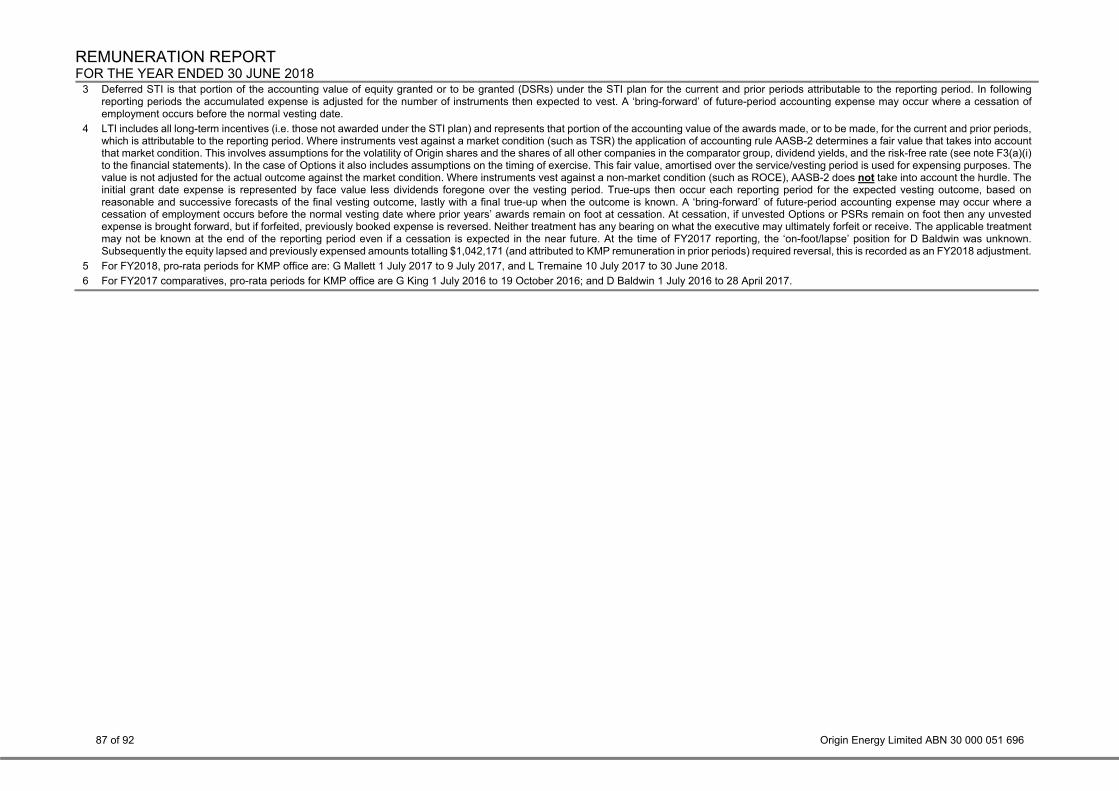
REMUNERATION REPORT FOR THE YEAR ENDED 30 JUNE 2018
3 Deferred STI is that portion of the accounting value of equity granted or to be granted (DSRs) under the STI plan for the current and prior periods attributable to the reporting period. In following reporting periods the accumulated expense is adjusted for the number of instruments then expected to vest. A ‘bring-forward’ of future-period accounting expense may occur where a cessation of employment occurs before the normal vesting date.
4 LTI includes all long-term incentives (i.e. those not awarded under the STI plan) and represents that portion of the accounting value of the awards made, or to be made, for the current and prior periods, which is attributable to the reporting period. Where instruments vest against a market condition (such as TSR) the application of accounting rule AASB-2 determines a fair value that takes into account that market condition. This involves assumptions for the volatility of Origin shares and the shares of all other companies in the comparator group, dividend yields, and the risk-free rate (see note F3(a)(i) to the financial statements). In the case of Options it also includes assumptions on the timing of exercise. This fair value, amortised over the service/vesting period is used for expensing purposes. The value is not adjusted for the actual outcome against the market condition. Where instruments vest against a non-market condition (such as ROCE), AASB-2 does not take into account the hurdle. The initial grant date expense is represented by face value less dividends foregone over the vesting period. True-ups then occur each reporting period for the expected vesting outcome, based on reasonable and successive forecasts of the final vesting outcome, lastly with a final true-up when the outcome is known. A ‘bring-forward’ of future-period accounting expense may occur where a cessation of employment occurs before the normal vesting date where prior years’ awards remain on foot at cessation. At cessation, if unvested Options or PSRs remain on foot then any unvested expense is brought forward, but if forfeited, previously booked expense is reversed. Neither treatment has any bearing on what the executive may ultimately forfeit or receive. The applicable treatment may not be known at the end of the reporting period even if a cessation is expected in the near future. At the time of FY2017 reporting, the ‘on-foot/lapse’ position for D Baldwin was unknown. Subsequently the equity lapsed and previously expensed amounts totalling $1,042,171 (and attributed to KMP remuneration in prior periods) required reversal, this is recorded as an FY2018 adjustment.
5 For FY2018, pro-rata periods for KMP office are: G Mallett 1 July 2017 to 9 July 2017, and L Tremaine 10 July 2017 to 30 June 2018.
6 For FY2017 comparatives, pro-rata periods for KMP office are G King 1 July 2016 to 19 October 2016; and D Baldwin 1 July 2016 to 28 April 2017.
87 of 92 Origin Energy Limited ABN 30 000 051 696
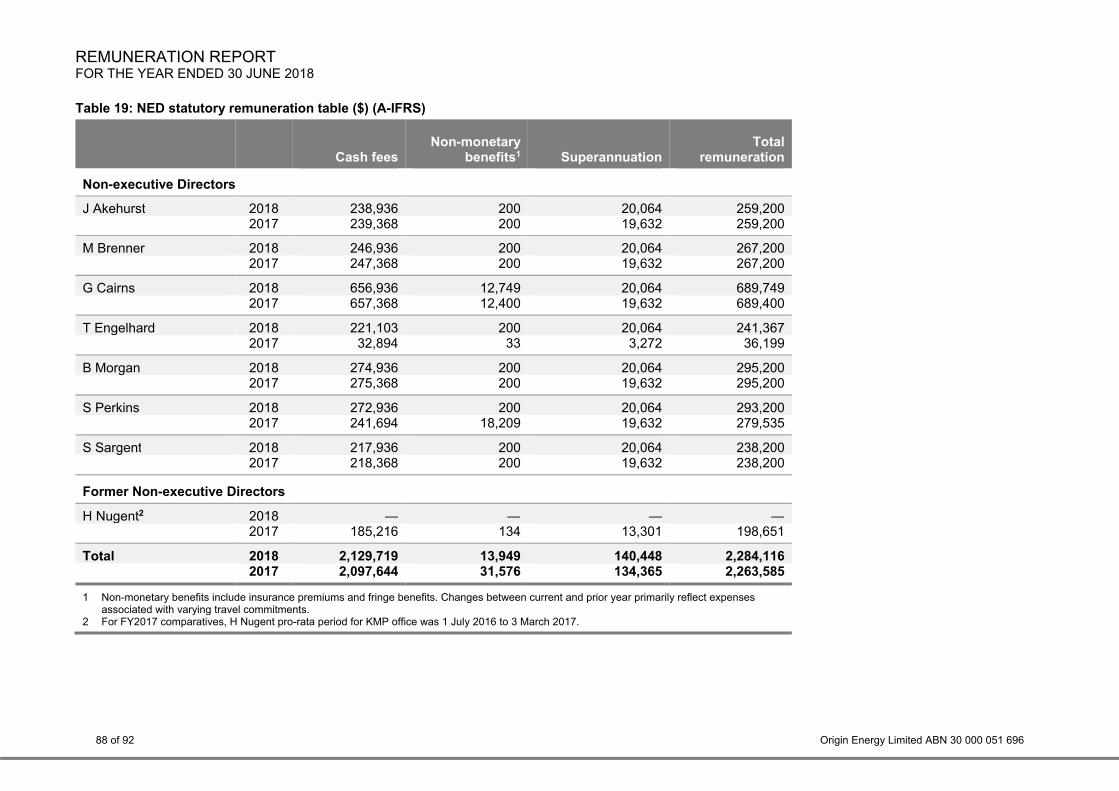
REMUNERATION REPORT FOR THE YEAR ENDED 30 JUNE 2018
Table 19: NED statutory remuneration table ($) (A-IFRS)
Cash feesNon-monetary
benefits1 SuperannuationTotal
remuneration
Non-executive Directors
J Akehurst 2018 238,936 200 20,064 259,2002017 239,368 200 19,632 259,200
M Brenner 2018 246,936 200 20,064 267,2002017 247,368 200 19,632 267,200
G Cairns 2018 656,936 12,749 20,064 689,7492017 657,368 12,400 19,632 689,400
T Engelhard 2018 221,103 200 20,064 241,3672017 32,894 33 3,272 36,199
B Morgan 2018 274,936 200 20,064 295,2002017 275,368 200 19,632 295,200
S Perkins 2018 272,936 200 20,064 293,2002017 241,694 18,209 19,632 279,535
S Sargent 2018 217,936 200 20,064 238,2002017 218,368 200 19,632 238,200
Former Non-executive Directors
H Nugent2 2018 — — — —2017 185,216 134 13,301 198,651
Total 2018 2,129,719 13,949 140,448 2,284,116 2017 2,097,644 31,576 134,365 2,263,585
1 Non-monetary benefits include insurance premiums and fringe benefits. Changes between current and prior year primarily reflect expenses associated with varying travel commitments.
2 For FY2017 comparatives, H Nugent pro-rata period for KMP office was 1 July 2016 to 3 March 2017.
88 of 92 Origin Energy Limited ABN 30 000 051 696

REMUNERATION REPORT FOR THE YEAR ENDED 30 JUNE 2018
Table 20: Details of, and movements in, rights to equity
Rights to equity in the company are granted to Executive KMP only, no NEDs hold rights to equity. This table covers holdings and movements for rights held (directly, indirectly or beneficially including related parties) over the Period (or KMP portion of the Period), including grants, transactions and forfeits, by value and by number. Details of the terms and vesting and exercise conditions attaching to the rights are set out in tables 21 and 22. All of the awards to L Tremaine represent compensation for equity forfeited from his previous employer as a consequence of accepting employment with the company, reflecting the timing and vesting patterns of the forfeited instruments.
GRANTED VESTED FORFEITED
Type Held at start 1 Grant date
Number granted
Fair value 2,3 ($) Value ($)
Exercise price ($)
Vest date 3
Expiry date 4
No. vested
No. exercised
Value at exercise
5 ($) No.
forfeited6 Value 7
($)
Vested exercisable
at end
Held at end 1
Executive Director F Calabria Options 1,096,046 18 Oct 2017 401,288 2.30 922,962 7.37 22 Aug 2022 23 Aug 2027 0 0 0 67,124 157,741 0 1,430,210
PSRs 145,029 18 Oct 2017 126,866 6.98 885,525 — 23 Aug 2021 Vest date 0 0 0 0 0 0 271,895 DSRs 107,921 18 Oct 2017 136,668 7.18 981,731 — 2019 to 2021 Vest date 28,375 28,375 213,380 0 0 0 216,214
Other Executive KMP J Briskin Options 17,769 30 Aug 2017 86,910 2.50 217,275 7.37 22 Aug 2022 23 Aug 2027 0 0 0 17,769 41,757 0 86,910
PSRs 60,733 30 Aug 2017 27,477 7.21 198,109 — 23 Aug 2021 Vest date 0 0 0 0 0 0 88,210 DSRs 25,163 30 Aug 2017 23,340 7.65 178,551 — 26 Aug 2019 Vest date 13,615 13,615 101,870 0 0 0 34,888
G Jarvis Options 229,982 30 Aug 2017 93,219 2.50 233,047 7.37 22 Aug 2022 23 Aug 2027 0 0 0 44,390 104,317 0 278,811 PSRs 54,319 30 Aug 2017 29,471 7.21 212,486 — 23 Aug 2021 Vest date 0 0 0 0 0 0 83,790 DSRs 42,679 30 Aug 2017 25,993 7.65 198,846 — 26 Aug 2019 Vest date 20,862 20,862 156,882 0 0 0 47,810
G Mallett Options 232,270 — 0 — 0 — — — 0 0 0 0 0 0 232,270 PSRs 54,435 — 0 — 0 — — — 0 0 0 0 0 0 54,435 DSRs 39,510 — 0 — 0 — — — 0 0 0 0 0 0 39,510
M Schubert Options 153,641 30 Aug 2017 83,769 2.50 209,423 7.37 22 Aug 2022 23 Aug 2027 0 0 0 0 0 0 237,410 PSRs 45,652 30 Aug 2017 26,484 7.21 190,950 — 23 Aug 2021 Vest date 0 0 0 0 0 0 72,136 DSRs 52,578 30 Aug 2017 18,945 7.65 144,929 — 26 Aug 2019 Vest date 23,639 23,639 213,771 0 0 0 47,884
L Tremaine Options 0 30 Aug 2017 81,441 2.52 205,231 7.37 23 Aug 2021 28 Aug 2026 0 0 0 0 0 0 81,441 PSRs 0 30 Aug 2017 24,415 7.43 181,403 — 24 Aug 2020 Vest date 0 0 0 0 0 0 24,415 DSRs 0 30 Aug 2017 335,875 7.55 2,536,272 — 2018 to 2020 Vest date 0 0 0 0 0 0 335,875
1 The number of instruments that are held at the start/end of the Period, or, where the holder is KMP for part-year only, on the relevant start/end dates of holding KMP office. 2 Accounting expense value per instrument at grant date (Black-Scholes Monte Carl for Relative TSR performance conditions; discounted cash flow for DSRs) or as estimated at first reporting
period after grant (ROCE non-market hurdle). 3 Where the DSRs were granted in three tranches with different vesting dates, the range of vesting dates is shown and the fair value is the weighted average of the three tranches per instrument. 4 The expiry date is the same as the vesting date where the terms of the grant apply automatic exercise on vesting. Where there is no automatic exercise on vesting, the expiry date is the last
possible expiry. Rights and options may expire earlier, for example if the rights or options fail to vest on testing, they will lapse on the vesting date. 5 The value of rights exercised is calculated as the closing market price of the company’s shares on the Australian Securities Exchange (ASX) on the date of exercise, after deducting any
exercise price. The exercise price for PSRs and DSRs is nil. DSRs vesting in the Period were granted on 14 Oct 2013 (vested 16 Oct 2017), 22 Oct 2014 (vested 23 Oct 2017), 22 Oct 2015 (vested 23 Oct 2017) and 7 Dec 2015 (vested 15 Jan 2018).
6 Forfeited Options were granted in October 2013. 7 The value of equity forfeited represents prior year Origin equity allocations that were forfeited during the year (i.e. the relevant grants realised no benefit and lapsed without value). The forfeited
value represents the grant date value that was disclosed and attributed to remuneration at the time of the grant.
89 of 92 Origin Energy Limited ABN 30 000 051 696

REMUNERATION REPORT FOR THE YEAR ENDED 30 JUNE 2018
Table 21: Details of, and movements in, ordinary shares of the company
Holdings and movements for ordinary shares held by KMP (directly, indirectly or beneficially including related parties) over the Period.
Held at start1 Acquired 2
Received on exercise of
Options/PSRs3
Received on exercise of
DSRs 3 Disposed 4Held atend 1,5
Position relative to shareholding requirement 6
Non-executive Directors7
J Akehurst 71,200 0 — — 0 71,200 MetM Brenner 22,117 0 — — 0 22,117 MetG Cairns 163,660 0 — — 0 163,660 MetT Engelhard 0 0 — — 0 0 On trackB Morgan 47,143 0 — — 0 47,143 MetS Perkins 30,000 0 — — 0 30,000 MetS Sargent 31,429 0 — — 0 31,429 Met
Executive Director
F Calabria 163,530 0 — 28,375 0 191,905 Met
Other Executive KMP
J Briskin 15,302 134 — 13,615 0 29,051 On trackG Jarvis 14,319 134 — 20,862 0 35,315 MetG Mallett 43,282 0 — 0 0 43,282 n/aM Schubert 28,138 134 — 23,639 8,000 43,911 MetL Tremaine 0 0 — 0 0 0 On track
1 The number of instruments that are held at the start/end of the Period, or, where the holder is KMP for part-year only, on the relevant start/end dates of holding KMP office. 2 Purchases and transfers in. For Other Executive KMP this includes allotments of fully-paid ordinary shares granted under the general Employee Share Plan (ESP). Executive Directors
do not participate in the ESP. 3 After vesting and after payment of the exercise price (the exercise price for PSRs and for DSRs is nil). 4 Sales and transfers out. 5 Other than options and rights disclosed elsewhere in this Report, no other equity instruments including shares in the company were granted to KMP during the period. 6 Minimum shareholding requirements are set out in sections 3.6 and 4.4. For informative purposes the test applied here uses the 30-day VWAP to 30 June 2018 ($9.80). 7 NEDs are not issued shares under any incentive or equity plans. Acquisitions include purchases of shares on-market, or pursuant to the company’s dividend reinvestment plan or the
August 2016 Entitlement Offer.
90 of 92 Origin Energy Limited ABN 30 000 051 696
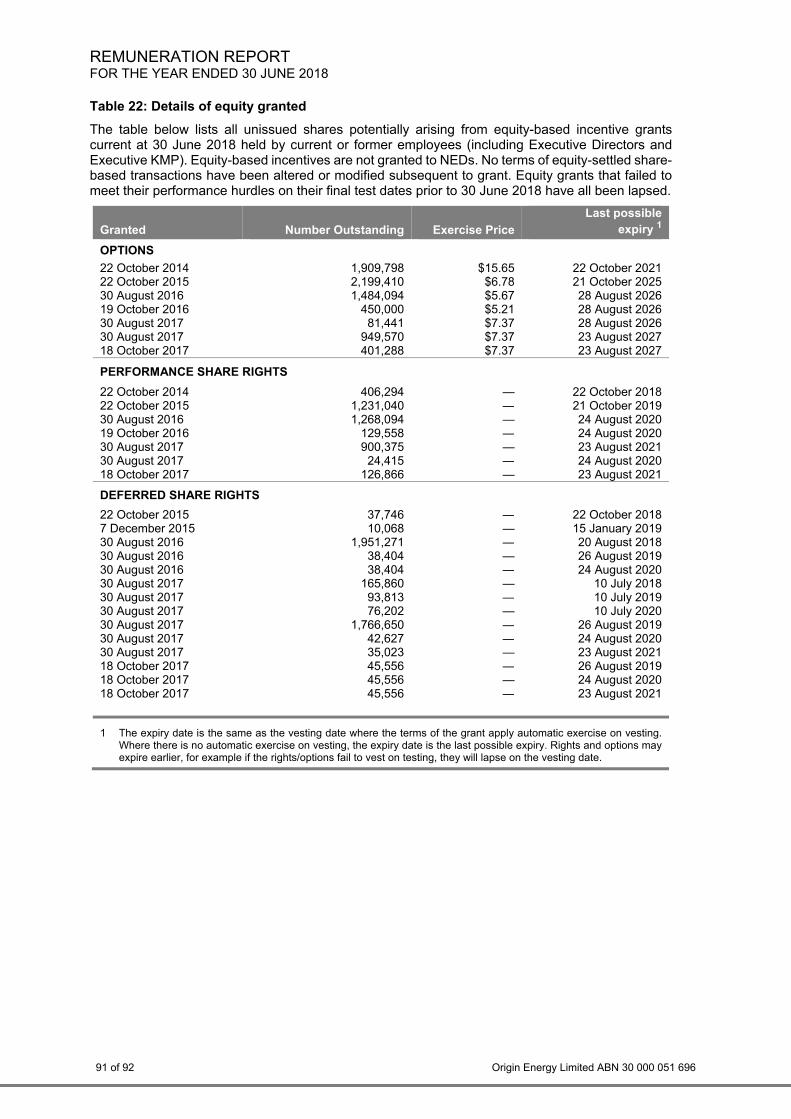
REMUNERATION REPORT FOR THE YEAR ENDED 30 JUNE 2018
Table 22: Details of equity granted
The table below lists all unissued shares potentially arising from equity-based incentive grants current at 30 June 2018 held by current or former employees (including Executive Directors and Executive KMP). Equity-based incentives are not granted to NEDs. No terms of equity-settled share-based transactions have been altered or modified subsequent to grant. Equity grants that failed to meet their performance hurdles on their final test dates prior to 30 June 2018 have all been lapsed.
Granted Number Outstanding Exercise Price
Last possible expiry 1
OPTIONS
22 October 2014 1,909,798 $15.65 22 October 202122 October 2015 2,199,410 $6.78 21 October 2025 30 August 2016 1,484,094 $5.67 28 August 202619 October 2016 450,000 $5.21 28 August 2026 30 August 2017 81,441 $7.37 28 August 202630 August 2017 949,570 $7.37 23 August 2027 18 October 2017 401,288 $7.37 23 August 2027
PERFORMANCE SHARE RIGHTS
22 October 2014 406,294 — 22 October 2018 22 October 2015 1,231,040 — 21 October 201930 August 2016 1,268,094 — 24 August 2020 19 October 2016 129,558 — 24 August 202030 August 2017 900,375 — 23 August 2021 30 August 2017 24,415 — 24 August 202018 October 2017 126,866 — 23 August 2021
DEFERRED SHARE RIGHTS
22 October 2015 37,746 — 22 October 20187 December 2015 10,068 — 15 January 2019 30 August 2016 1,951,271 — 20 August 201830 August 2016 38,404 — 26 August 2019 30 August 2016 38,404 — 24 August 202030 August 2017 165,860 — 10 July 2018 30 August 2017 93,813 — 10 July 201930 August 2017 76,202 — 10 July 2020 30 August 2017 1,766,650 — 26 August 201930 August 2017 42,627 — 24 August 202030 August 2017 35,023 — 23 August 2021 18 October 2017 45,556 — 26 August 201918 October 2017 45,556 — 24 August 2020 18 October 2017 45,556 — 23 August 2021
1 The expiry date is the same as the vesting date where the terms of the grant apply automatic exercise on vesting. Where there is no automatic exercise on vesting, the expiry date is the last possible expiry. Rights and options may expire earlier, for example if the rights/options fail to vest on testing, they will lapse on the vesting date.
91 of 92 Origin Energy Limited ABN 30 000 051 696

REMUNERATION REPORT FOR THE YEAR ENDED 30 JUNE 2018
6. Loans and other transactions with KMP
There were no loans with KMP during the year. 6.1 Other transactions with the consolidated entity or its controlled entities
Transactions entered into during the year with KMP which are within normal employee, customer or supplier relationships on terms and conditions no more favourable than dealings in the same circumstances on an arm’s length basis include:
• the receipt of dividends from Origin Energy Limited; • participation in the Employee Share Plan, Equity Incentive Plan and NED Share Plan; • terms and conditions of employment or directorship appointment; • reimbursement of expenses incurred in the normal course of employment; • purchases of goods and services; and • receipt of interest on Retail Notes
Certain directors of Origin Energy Limited are also directors of other companies which supply Origin Energy Limited with goods and services or acquire goods or services from Origin Energy Limited. Those transactions are approved by management within delegated limits of authority and the directors do not participate in the decisions to enter into such transactions. If the decision to enter into those transactions should require approval of the Board, the director concerned will not vote upon that decision nor take part in its consideration. Signed in accordance with a resolution of Directors
Gordon Cairns, Chairman Sydney, 16 August 2018
92 of 92 Origin Energy Limited ABN 30 000 051 696
