directorate general for internal policies · 2.3.5. concluding remarks 35 analysis of drivers and...
TRANSCRIPT


DIRECTORATE GENERAL FOR INTERNAL POLICIES POLICY DEPARTMENT A: ECONOMIC AND SCIENTIFIC POLICY
European Energy Industry Investments
STUDY
Abstract
This study was prepared at the request of the European Parliament's Committee on Industry, Research and Energy (ITRE). The paper provides an overall assessment of European investments in the electricity sector. It concludes by providing policy recommendations to facilitate the investments in the electricity sector which are needed to enable a transition to a low carbon energy supply, while realising a fully integrated and interconnected electricity system, enhancing competitiveness and ensuring security of electricity supply.
IP/A/ITRE/2013-046 February 2017
PE 595.356 EN

Policy Department A: Economic and Scientific Policy
This document was requested by the European Parliament's Committee on Industry, Research and Energy (ITRE). AUTHOR(S) Luc VAN NUFFEL, Trinomics Koen RADEMAEKERS, Trinomics Jessica YEARWOOD, Trinomics Verena GRAICHEN, Öko-Institut Iberian case study: María José LÓPEZ; Alicia GONZALEZ; Juan Luis MARTIN, Aether German case study: Sylvie LUDIG, Öko-Institut BEMIP case study: Foivos MARIAS, Trinomics RESPONSIBLE ADMINISTRATOR Dagmara STOERRING / Balázs MELLÁR EDITORIAL ASSISTANT Janetta Cujkova LINGUISTIC VERSIONS Original: EN ABOUT THE EDITOR Policy departments provide in-house and external expertise to support EP committees and other parliamentary bodies in shaping legislation and exercising democratic scrutiny over EU internal policies. To contact Policy Department A or to subscribe to its newsletter please write to: Policy Department A: Economic and Scientific Policy European Parliament B-1047 Brussels E-mail: [email protected]
Manuscript completed in January 2017 © European Union, 2017 This document is available on the Internet at: http://www.europarl.europa.eu/studies DISCLAIMER The opinions expressed in this document are the sole responsibility of the author and do not necessarily represent the official position of the European Parliament. Reproduction and translation for non-commercial purposes are authorised, provided the source is acknowledged and the publisher is given prior notice and sent a copy.
European Energy Industry Investments
PE 595.356 3
CONTENTS
LIST OF ABBREVIATIONS 8
LIST OF BOXES 12
LIST OF FIGURES 12
LIST OF TABLES 14
EXECUTIVE SUMMARY 16
INTRODUCTION 19
1.1. Context and main objectives of the study 19
1.2. Reading guide 20
INVESTMENT NEEDS IN THE ELECTRICITY SECTOR TO REACH THE ENERGY AND CLIMATE POLICY OBJECTIVES AND TARGETS 21
2.1. Objectives of European energy policy 21
2.2. Energy and climate targets 22
2.2.1. 2020 targets 23 2.2.2. 2030 targets 25 2.2.3. 2050 targets 26
2.3. Analysis of the impact of the energy and climate targets on electricity investment needs 27
2.3.1. Investment needs in power generation 28 2.3.2. Investment needs in transmission and distribution grids 31 2.3.3. Investment needs in storage 33 2.3.4. Investment needs on the demand side, including demand response 34 2.3.5. Concluding remarks 35
ANALYSIS OF DRIVERS AND BARRIERS FOR ELECTRICITY INVESTMENTS 37
3.1. Economic and energy market aspects 39
3.1.1. Electricity demand growth is no longer a significant driver 39 3.1.2. Decreasing income for conventional power plants is a major barrier
for new investments 40 3.1.3. Decreasing price volatility and regulated prices are hindering
investments in flexibility on the supply and demand side 42 3.1.4. Electricity market concentration and size 43 3.1.5. Availability and cost of primary fuel and suitable sites for electricity
production 44 3.1.6. Reserve generation capacity margin versus peak load 44
3.2. Policy framework 45
3.2.1. Policy measures to support investments in RES and RD&I 45 3.2.2. Carbon pricing and ETS 45

Policy Department A: Economic and Scientific Policy
4 PE 595.356
3.2.3. Smart metering target 46 3.2.4. National capacity remuneration mechanisms 46 3.2.5. Energy efficiency targets and measures 46 3.2.6. Interconnection target & PCI 47 3.2.7. Divergent and unstable national policies 47
3.3. Institutional aspects 48
3.3.1. Permitting procedure for new infrastructure 48 3.3.2. Complexity of cross-border investments 48
3.4. Financial market and instruments 48
3.4.1. Cost of capital and access to public and private funding 48 3.4.2. Risk perception and hedging 49
3.5. Other aspects 49
3.5.1. Lack of public acceptance of new energy infrastructure 49 3.5.2. Tariffs for connection and access to the transmission and distribution grid 50
OVERVIEW OF THE EU INVESTMENT FRAMEWORK 51
4.1. EU Policies 51
4.1.1. Trans-European Energy Networks Regulation and Projects of Common Interest (PCI) 52
4.1.2. Notification of energy infrastructure investment projects 55 4.1.3. Promotion of the use of RES 55 4.1.4. EU Emissions Trading System (ETS) 56
4.2. EU Funding Mechanisms 56
4.2.1. European Fund for Strategic Investments (EFSI) 56 4.2.2. European Structural and Investment Funds (ESIF), including in
particular the European Regional Development Fund (ERDF) and the Cohesion Fund (CF) 57
4.2.3. Connecting Europe Facility (CEF) 58 4.2.4. Research and development - Horizon 2020 60 4.2.5. New Entrants Emission Allowances Reserve (NER300) 62 4.2.6. European Energy Programme for Recovery (EEPR) 63
4.3. Overview of main EU funding mechanisms 63
ASSESSMENT OF CURRENT INVESTMENT TRENDS AND PLANS 67
5.1. Investment Trends 67
5.2. Evaluation of investment plans 855
5.2.1. ENTSO-E’s Ten-Year Network Development Plan (TYNDP) 866 5.2.2. Projects of Common Interest (PCI) 88
5.3. Evaluation of selected national investment/development plans 92
5.3.1. Germany 92

European Energy Industry Investments
PE 595.356 5
5.3.2. Iberian Peninsula 93 5.3.3. The Baltic States 94
5.4. Concluding remarks 95
POLICY OPTIONS TO FOSTER INVESTMENTS IN THE ELECTRICITY SECTOR 96
6.1. Identification and assessment of possible policy options 96
6.2. Assessment of the effectiveness of the proposed policy options and of their contribution to the policy objectives 102
RECOMMENDATIONS 105
7.1. Investors’ certainty should be enhanced by more consistent, stable and balanced policies based on long term strategy and objectives 105
7.2. Targeted and coordinated support schemes to foster investments in RES 105
7.3. Research, development & innovation (RDI) should focus on promising technologies as well as on new services, market models and data management 105
7.4. Coordinated and harmonised policies to stimulate investments necessary for security of supply 106
7.5. Policy initiatives are needed to facilitate investments in storage 106
7.6. Investments to increase interconnection capacity should be boosted 106
7.7. Adequate regulation and supporting initiatives to incentivise grid investments 107
7.8. Facilitate access to co-financing instruments and partners, including European funds 107
7.9. Authorities should allow carbon and electricity markets and grid operators to offer appropriate price signals to investors 108
7.10. Adequate legal and regulatory framework to facilitate investments in energy efficiency and demand response 109
7.11. Streamline and simplify permitting procedures and enhance public acceptance of energy infrastructure 109
REFERENCES 110
ANNEX 1: INTERVIEWS 114
ANNEX 2: ADDITIONAL INFORMATION ON SCENARIOS AND INVESTMENT NEEDS 115
ANNEX 3: CASE STUDY: GERMANY 124
Investment trends, market characteristics and main operators in Germany 124
Installed power generation capacity 124 Electricity consumption and peak load 126 Interconnections and transmission lines evolution (2007-2015) 127 Market Structure 129
Supporting national framework for electricity investments 130

Policy Department A: Economic and Scientific Policy
6 PE 595.356
Implementation of national investment and development plans: The Network Development plan and the Federal Requirements Plan Act 132
Implementation of Projects of Common Interest (PCIs) 134
Key lessons learnt and conclusions 136
ANNEX 4: CASE STUDY: IBERIAN PENINSULA 138
Market characteristics, trends and main operators in the Iberian Peninsula 138
The Iberian Electricity Market structure and main operators 138 Installed generation capacity 139 Electricity consumption and peak load 140 Interconnections and transmission lines evolution 141 Electricity tariff deficit in Spain and Portugal 142
Investments in generation and transmission 144
Drivers and barriers for RES investments 145 Drivers and barriers for conventional generation 148 Drivers and barriers for investment in grids 149
Implementation of national investment and development plans 149
Spain 150 Portugal 151 Projects of Common interest 152 Key barriers for the implementation of national development plans and PCI´s 155 Structuring/financing arrangements of the PCIs and other projects 155 Prospects for achieving the energy and climate 2020 targets 156
Key lessons learnt and conclusions 157
ANNEX 5: CASE STUDY: INVESTMENTS IN THE TRANSMISSION GRID IN THE BALTIC STATES 159
Investment trends, market characteristics and main operators in the Baltic States 159
Installed power generation capacity 159 Electricity consumption 160 Interconnections and transmission lines evolution (2006-2015) 161 Market Structure 163
Implementation of BEMIP 164
BEMIP’s key objectives and drivers 164 Level of implementation of BEMIP’s related PCIs 165 National support for the implementation 170 EU support for the implementation 172 Key barriers for the implementation 172 Impact of BEMIP on EU energy and environment policy targets 172
Key lessons learnt / Conclusions 173

European Energy Industry Investments
PE 595.356 7
ANNEX 6: NET CHANGES IN INSTALLED POWER GENERATION CAPACITY PER MS BETWEEN 2005-2009 AND 2010-2014 (MW) 174

Policy Department A: Economic and Scientific Policy
8 PE 595.356
LIST OF ABBREVIATIONS
ACER Agency for the Cooperation of Energy Regulators
BAU Business as usual
BEMIP Baltic Energy Market Interconnection Plan
CBA Cost-benefit analysis
CCS Carbon capture and storage
CCGTs Combined-Cycle Gas Turbines
CEF Connecting Europe Facility
CEE Central and Eastern Europe
CF Cohesion Fund
CHP Combined heat and power
CIP Competitiveness and Innovation Programme
CPI Current policy initiatives
CRM Capacity remuneration mechanisms
CSE Central and Southern Europe
CWE Central Western Europe
DC Direct current
DR Demand response
DST Diversified supply technologies
DG CLIMA Directorate-General for Climate Action
DG ENER Directorate-General for Energy
DR Demand response
DSO Distribution System Operators

European Energy Industry Investments
PE 595.356 9
EBRD European Bank for Reconstruction and Development
EE Energy efficiency
EEA European Environmental Agency
EC European Commission
ECF European Climate Foundation
EEAG Environmental and Energy State Aid Guidelines
EED Energy Efficiency Directive (2012/27/EU)
EEE-F European Energy Efficiency Fund
EEPR European Energy Programme for Recovery
EFSI European Fund for Strategic Investments
EIAH European Investment Advisory Hub
EIB European Investment Bank
EIPP European Investment Project Portal
ENTSO-E European Network of Transmission System Operators for Electricity
EP European Parliament
EPBD Energy Performance of Buildings Directive (2010/31/EU)
ERDF European Regional Development Fund
ESIF European Structural and Investment Funds
ETP Energy Technology Perspective
ETS Emission trading system
EU European Union
EUA European emission allowance
EUR Euro
EV Electric vehicle

Policy Department A: Economic and Scientific Policy
10 PE 595.356
EWEA European Wind Energy Association
FEC Final energy consumption
FI Financial instrument
FiT Feed in tariff
FP7 Framework Programme 7
GHG Greenhouse gas
GW Giga-Watt
HVDC High-voltage, direct current
IEA International Energy Agency
IEE Intelligent Energy Europe
ITC Inter-TSO Compensation
LCOE Levelised cost of electricity
MS Member State
MSR Market Stability Reserve
MWh Mega-Watt hour
NDP National network development plan
NPS New policies scenario
NRA National Regulatory Authority
OECD Organisation for Economic Cooperation and Development
PF4EE Private Financing for Energy Efficiency
PCI Projects of common interest
PDA Project Development Assistance
PPA Power Purchase Agreement
PV Photo-voltaic

European Energy Industry Investments
PE 595.356 11
R&D Research and Development
RAB Regulatory asset based
RD&I Research, Development and Innovation
RED Renewable Energy Directive (2009/28/EC)
RES Renewable energy sources
RES-E Electricity from renewable energy sources
SET-Plan Strategic Energy Technology Plan
SEW Socio-economic welfare
TEN-E Trans-European energy networks
TSO Transmission System Operator
TYNDP Ten-Year Development Plan
UK United Kingdom
UNFCCC United Nations Framework Convention on Climate Change
TWh Tera-Watt hour
US United States
USD United States Dollars
WACC Weighted average cost of capital
WEF World Economic Forum

Policy Department A: Economic and Scientific Policy
12 PE 595.356
LIST OF BOXES
Box 1: Ongoing reviews of major European legislation 19
Box 2: Selected studies 28
Box 3: The PV Storage Case in Germany 34
Box 4: Projects of Common Interest 54
Box 5: e-Highway2050 88
Box 6: Governance structure for interconnection lines 166
LIST OF FIGURES
Figure 1: Energy policy objectives, applied to electricity 22
Figure 2: Reference Scenario: Investment in new capacity and plant refurbishment per technology up to 2050 (in GW) 29
Figure 3: Net Power Capacity Investment in GWe per decade for EU27 29
Figure 4: EU investments for power generation in 2015 (billion USD’15) compared to cumulative investment needs in 2014-2035 in the 450 Scenario (in billion USD’12) 30
Figure 5: Investments in new electricity interconnectors (in billion EUR’08) 32
Figure 6: Transmission investment volumes in Europe – Past vs future 33
Figure 7: Electricity storage capacity for daily electricity storage in 2011 and 2050 for ETP 2014 scenarios and corresponding investment needs in 2010-2050 34
Figure 8: Investment expenditures (5-year period, in billion EUR’13) on the demand side, excluding transport 35
Figure 9: Average year-ahead future price of electricity in CWE in 2007-2015 40
Figure 10: Germany clean spark spreads and clean dark spreads 41
Figure 11: Returns on invested capital in EU and US utilities in 2006-2013 42
Figure 12: Price volatility of gas and electricity by month: Day-ahead contracts (UK) 43
Figure 13: Market share of the largest generator in the electricity market in 2014 (%) and total installed capacity (GW) in 2014 43
Figure 14: ETS carbon price trend 2007–2015 (EUR/tonne CO2) 45
Figure 15: Capacity mechanisms in Europe in 2015 46
Figure 16: Actions financed by the Connecting Europe Facility – Energy. Grant agreements up to May 2016 59
Figure 17: Total funds received, other than CEF (M Euro) 60
Figure 18: Worldwide evolution of RES investments in 2004-2015 (in billion USD, left) and clean energy investments in Europe in 2015 (in billion EUR, right) 68
Figure 19: RES investments in Europe in 2015 (in billion USD) 69

European Energy Industry Investments
PE 595.356 13
Figure 20: Total electricity related support (in million EUR) vs net changes in installed power generation capacity (in GW). 69
Figure 21: LCOE ranges in USD/MWh (at discount rate of 3 %, 7 % and 10 %) 70
Figure 22: Electricity utility asset impairments and investment in 2014-2015 in the EU (billion USD’15) 72
Figure 23: RES-electricity support per unit of overall (RES + conventional) gross electricity produced (EUR/MWh in 2012) 73
Figure 24: Use of RES-E auctions in the EU28 74
Figure 25: Government budget for energy R&D in EU28 (2007-2014, in M EUR and EUR/inhabitant) 75
Figure 26: Corporate and government R&D renewable energy investment by region, 2014, and growth on 2013 (in billion USD) 76
Figure 27: Average R&D intensity for the top 1000 companies ranked by R&D in the EU per industry branch (in %) 77
Figure 28: Electricity prices for households and medium scale industry in the EU28 (in EUR/kWh) 83
Figure 29: Map of explicit DR development in Europe 84
Figure 30: Investment plans in transmission infrastructure 86
Figure 31: Investment cost breakdown per ENTSO-E member country (in billion euro) 87
Figure 32: Type of electricity and smart grid PCIs 89
Figure 33: Number of electricity PCIs per MS 90
Figure 34: Number of electricity PCIs according to their status and commissioning dates (as of 2016) 91
Figure 35: Number of electricity PCI according to the assessment of their status (as of 2016, compared to 2015) 91
Figure 36: Installed capacity (GW) 124
Figure 37: Investments in renewable energy technologies (in billion Euro) 126
Figure 38: Electricity generation and demand (in TWh) 127
Figure 39: Investments into the German power grid by TSOs (in million Euro) 128
Figure 40: Investments into the German distribution grids by DSOs (in million Euro) 129
Figure 41: Share of renewables in gross electricity consumption 131
Figure 42: Area of the case study 138
Figure 43: Spanish and Portuguese electrical capacity by end 2015 140
Figure 44: Reserve margin in Spain and Portugal 140
Figure 45: Electricity international flows (net balance) in Spain and Portugal 142
Figure 46: Evolution of revenues and costs of the Spanish power system (EUR/MWh) 143
Figure 47: Evolution of the electricity tariff deficit in Portugal, 2007-2014 144
Figure 48: Renewables – Investment & special premium system, 2000-2014 146
Figure 49: Spanish coal aid, 2001-2013 149

Policy Department A: Economic and Scientific Policy
14 PE 595.356
Figure 50: Installed capacity per technology in 2014 (MW) 160
Figure 51: Monthly energy consumption in GWh (2010-2015) 160
Figure 52: Transmission lines in 2013 (left) and 2015 (right) 161
Figure 53: Electricity balance and trading flows in 2014 (left) and expected in 2025 (right) 163
Figure 54: Signatories of BEMIP (in grey) 164
Figure 55: Implementation status (left) and progress (right) of PCIs 170
LIST OF TABLES
Table 1: Summary of key EU targets in the short, medium and long term 22
Table 2: Actual interconnection levels in 2014 and 2016 and expected levels in 2020 (assuming Projects of Common Interest (PCIs) are implemented) 24
Table 3: Investment needs according to the 2030 Framework Impact Assessment 25
Table 4: Investment needs according to the 2050 Energy Roadmap Impact Assessment 26
Table 5: Cumulative investment needs in transmission (including interconnectors) and distribution 31
Table 6: Average annual investment levels in billion EUR 36
Table 7: Overview of drivers and barriers for investments in the energy sector 38
Table 8: Evolution of EU28 electricity demand (final consumption) in TWh and growth rates for 2010-2014 39
Table 9: Electricity priority corridors and related investment needs up to 2020 53
Table 10: Budget and activities for the Horizon 2020 Work Programmes on the challenge “Secure, Clean and Efficient Energy” 61
Table 11: Number of projects and funds awarded under each category 62
Table 12: Overview of main EU funding mechanisms for electricity infrastructure 65
Table 13: Assessment of policy options 103
Table 14: Overview of studies quantifying electricity investment needs 115
Table 15: Market structure 130
Table 16: List of PCIs defined in the German NDP 2025 134
Table 17: Market structure 139
Table 18: Electricity infrastructure investments in Spain 144
Table 19: Planned transmission grid investment in Portugal and Spain for years 2015-2020 150
Table 20: PCIs involving Spain and/or Portugal 153
Table 21: Expected achievement of the targets, considering the current situation and the planned developments 156

European Energy Industry Investments
PE 595.356 15
Table 22: Installed electricity generation capacity (MW) 159
Table 23: Maximum load in MW (2009-2015) 161
Table 24: Transmission capacities (MW) 162
Table 25: Interconnection levels 162
Table 26: Market structure 163
Table 27: Electricity grid and interconnection infrastructure projects in the three Baltic countries that are part of the BEMIP strategy 167
Table 28: Progress of the Baltic countries towards 2020 climate and energy targets 173

Policy Department A: Economic and Scientific Policy
16 PE 595.356
EXECUTIVE SUMMARY This study aims to identify and propose appropriate policy recommendations to facilitate the investments in the electricity sector which are needed to enable a transition to a low carbon energy supply by 2050, while achieving a fully integrated and interconnected electricity system and market, enhancing competitiveness and ensuring security of supply.
Huge investments are needed for the energy transition to succeed. These investments are crucial to ensure access to secure, affordable and climate-friendly energy. It is estimated that annual investments of EUR 95 to 145 billion would be needed in the power sector in 2021-2050. These investment needs consist of:
• Electricity generation: EUR 54 to 80 billion per year, compared to current levels of EUR 50 to 60 billion.
• Electricity transmission and distribution grids: EUR 40 to 62 billion per year, compared to EUR 35 billion currently.
• Investments in storage and demand response are still rather low but should significantly increase in the near future.
The required investments are being hindered by a variety of factors including inappropriate regulation, lack of public acceptance of new infrastructure, complex permitting procedures and unfavourable market and economic factors. Investments in interconnection capacity are particularly affected by conflicting national interests and the administrative and regulatory complexity of multi-national projects.
Investments in power generation are currently mainly driven by financial support schemes. Thanks to this policy instrument, investments in power generation from renewable energy sources (RES) in the EU grew rapidly from 2004 to 2011; they fell back in 2012-2013 and remained at their 2013 level in 2014-2015. Financial support to RES is still high in most EU Member States (MS), but decreasing as a result of declining investment costs and changes in support schemes, including a wider use of tendering procedures. Grid investments, which are necessary to facilitate the development of renewable energy and to replace and modernise ageing infrastructure, are mainly driven by regulation.
New investments in conventional generation are very limited, and several gas-fired and nuclear power plants are being decommissioned, which poses a threat to the security of supply in some MSs. For this reason, several national authorities are implementing, or considering the implementation of, capacity remuneration mechanisms.
Investments in energy storage, demand response and smart technologies will become increasingly important and will play a key role in enabling cost-efficient deployment of RES. Digitalisation will in particular have a major impact on investments in grids and on the demand side.
“New” financing instruments and business models are being implemented and new institutional partners attracted to finance energy investments. End-users are also becoming more actively involved in energy investments, either as investors in assets for self-production, as co-financers of generation assets or as investors in energy efficiency and demand response.
The EU added value in financing energy investments is difficult to quantify, but the EU can and does play an important role, especially for electricity interconnection projects. At EU level, several policies and instruments are in place to stimulate and co-finance investments in energy infrastructure, particularly low carbon power production technologies and transmission infrastructure of pan-European interest. Eligible electricity investments (e.g. Projects of Common Interest) can benefit from grants, guarantees, loans or equity capital provided by the Connecting Europe Facility (CEF), the European Fund for

European Energy Industry Investments
PE 595.356 17
Strategic Investments (EFSI), the European Investment Bank, or Horizon 2020 (which focuses on investments in innovation, research and development). The EU budget available to co-finance electricity investments is limited compared to the overall investment levels, and its added value and additionality are difficult to quantify. However, the included case studies on the Baltic and Iberian regions clearly show that EU co-funding of electricity interconnectors is a key element for their effective implementation.
On the basis of the current investment levels and development plans/trends, it is expected that most MSs will meet their 2020 climate and energy targets. However, current policies and investment levels will obviously not be sufficient to reach the 2030 or 2050 targets. Policy changes and/or new policy measures will be necessary to trigger higher investment levels.
In this study, 12 potential policy options and market arrangements that could contribute to reaching the 2030/2050 targets have been identified and assessed. They are grouped in four categories:
− Policy measures to incentivise investments in the liberalised subsectors via properly functioning electricity and carbon markets:
i. Liquid and EU wide integrated electricity wholesale and ancillary services markets.
ii. Market-based, predictable and harmonised national policies and support schemes.
iii. Internalisation of GHG emission costs via stronger carbon price signals.
iv. Abolishing price regulation in electricity retail and wholesale markets.
v. EU wide capacity market with suppliers’ obligation to ensure RES development and security of supply.
− Policy options to incentivise low carbon investments in a market where carbon and electricity price signals are not sufficient to trigger the required investments:
vi. An EU wide legal initiative to phase out outdated conventional power plants.
vii. Abolishing ETS and replacing it with an EU wide carbon tax.
viii. Tendering at (supra)national level for conventional and/or RES generation capacity.
− Policy options to facilitate investments, both in the regulated (grids) and non-regulated subsectors:
ix. Determining clear EU wide rules to encourage investments in flexibility (storage and demand response).
x. Enabling a more rapid permitting procedure for investments in grids and power generation units.
− Policy options to improve the financial framework for electricity investments in the regulated and not regulated sub-sectors:
xi. Facilitating the availability of, and access to, appropriate public and private financing instruments and partners.
xii. Providing more targeted and coordinated public support at EU level for research & development.

Policy Department A: Economic and Scientific Policy
18 PE 595.356
These policy options were assessed based on their effectiveness to incentivise low carbon investments, their implementation feasibility and proportionality, as well as their contribution to the policy objectives of economic efficiency and competitiveness, sustainability and security of supply. On the basis of this evaluation, the study concludes that the first group of policy options, which aim to incentivise investments in the liberalised subsectors via properly functioning electricity and carbon markets, have in general the highest positive scores. The other policy options are also effective, to varying extents, in incentivising investments and contribute to some or all policy goals, but their implementation feasibility and/or proportionality scores were lower.
Recommendations to foster investments in the power sector, based on this assessment of potential policy options and the overall analysis, conclude that the EU should focus on the following issues:
− Investors’ certainty should be enhanced by more consistent, stable and balanced policies based on long term strategy and objectives.
− Targeted and coordinated support schemes are necessary to foster investments in renewable energy.
− Research, development & innovation (RDI) should focus on promising technologies as well as on new services, market models and data management.
− Coordinated and harmonised policies should be in place to stimulate investments necessary for security of supply.
− Policy initiatives are needed to facilitate investments in energy storage.
− Investments to increase electricity interconnection capacity should be boosted.
− Adequate regulation and supporting initiatives are required to incentivize grid investments.
− Access to co-financing instruments and partners, including European funds, should be facilitated.
− Authorities should allow carbon and electricity markets and grid operators to offer appropriate price signals to investors.
− An adequate legal and regulatory framework is important to facilitate investments in energy efficiency and demand response (DR).
− Further streamlining and simplification of permitting procedures, as well as enhancing public acceptance of energy infrastructure.

European Energy Industry Investments
PE 595.356 19
INTRODUCTION
1.1. Context and main objectives of the study This study aims to identify and propose appropriate policy recommendations to facilitate the investments in the electricity sector which are needed to enable a transition to a low carbon energy supply by 2050, while realising a fully integrated and interconnected electricity system (internal market), enhancing competitiveness and ensuring security of electricity supply. The study is also intended to provide an analysis of the key barriers and drivers for investments in the electricity sector, review how to attract adequate (public and private) funding and review how regulation and market arrangements could be adapted to improve the investment framework.
In order to achieve these objectives, we have carried out the following tasks through a literature review and a number of key interviews (see annex 1):
• Analysed the estimated investment needs in the electricity sector under different technology scenarios required to reach the EU energy and climate targets;
• Identified the drivers and barriers for investments;
• Provided an overview of EU schemes and policies to foster investments in energy infrastructure;
• Identified market-based arrangements that can encourage investments; and
• Proposed policy options and recommendations on how to improve the investment framework in the short, medium and long-term.
This study aims to provide information that will be useful to the Members of the European Parliament in their review of legislative proposals in areas such as electricity market design, interconnection targets, energy efficiency and renewable energy.
Box 1: Ongoing reviews of major European legislation
The European Commission (EC) has published on 30 November 2016 a package of new legislative proposals that should contribute to putting energy efficiency first, achieving global leadership in renewable energies and providing a fair deal for consumers.
The proposed legislation should allow consumers to become more active and central players on the energy markets, by ensuring them a better choice of supply, access to reliable energy price comparison tools and the possibility to produce and sell their own electricity. Increased transparency and better regulation should give them more opportunities to become active players in the energy system and respond to price signals. The package also contains a number of measures aimed at protecting the most vulnerable consumers.
The Commission's “Clean Energy for All Europeans” proposals cover energy efficiency, renewable energy, the design of the electricity market, security of electricity supply and governance rules for the Energy Union. In addition, the Commission proposes a new way forward for eco-design as well as a strategy for connected and automated mobility.
The package also includes actions to accelerate clean energy innovation and to renovate Europe's buildings. It provides measures to encourage public and private investment, promote EU industrial competitiveness and mitigate the societal impact of the clean energy transition.

Policy Department A: Economic and Scientific Policy
20 PE 595.356
Besides this comprehensive review of major energy related legislation, the European Commission is called to review the use and functioning of the European Fund for Strategic Investments (EFSI), the European Investment Advisory Hub (EIAH), and the European Investment Project Portal (EIPP) (according to Regulation 2015/1017) by July 2018. The Commission is also due to set up an Innovation Fund, based on the NER 300 programme (as proposed by COM(2014) 15).
This study aims to support the European Parliament in its role of ensuring that these political initiatives continue to be effective and efficient.
1.2. Reading guide The primary focus of this study is on investments in the supply side of the electricity sector, by actors such as grid operators and energy companies. Investments in interconnectors, transmission systems, distribution grids and conventional (nuclear & fossil) and RES based power generation are of particular interest. Investments in storage and investments in the demand side by end-users or third parties are also covered, though in a more qualitative way.
Following this introduction, the second chapter provides an overview of the European energy and climate goals and targets and compares the current and expected investment levels with the investment needs required to achieve these targets.
The third chapter identifies the main drivers and barriers for investments in the electricity sector. These drivers and barriers, as well as the economic and financial context (risks, investment cost recovery, financing instruments, etc.) are somewhat dependent on the type of investments and investors. The typology developed in this chapter to describe the drivers and barriers is used in the subsequent analysis.
Chapter four focuses on funding mechanisms and public support for energy investments. It assesses the contribution of the different funds and compares the level of investments realised with support provided by the EU.
Chapter five analyses the investment trends and assesses the progress and effectiveness of investment plans, in particular the European Network of Transmission System Operators for Electricity’s (ENTSO-E) Ten Year Network Development Plans (TYNDP) and the Projects of Common Interest, as well as findings from specific case studies covering Germany, the Iberian Peninsula and the Baltic States.
The study concludes with an assessment of a number of possible policy options to foster the required investments in the electricity sector that have been identified or proposed (with their pros and cons) and a set of recommendations for policy makers.

European Energy Industry Investments
PE 595.356 21
INVESTMENT NEEDS IN THE ELECTRICITY SECTOR TO REACH THE ENERGY AND CLIMATE POLICY OBJECTIVES AND TARGETS
KEY FINDINGS
The European Union has defined ambitious energy and climate objectives and targets which have a huge impact on the electricity sector. Estimates of future annual investment needs in electricity generation required to reach the energy and climate targets range from EUR 54 to 80 billion in 2021-2050, compared to EUR 39 to 64 billion in the Reference scenarios and an actual investment level of EUR 58 billion in 2015.
Most of these investment needs concern RES (75 % to 80 % depending on the scenario).
The estimates of investment needs in transmission and distribution grids (extension, refurbishment and replacement of ageing infrastructure) are in the Reference scenarios (EUR 35.4-38 billion in 2021-2050) slightly higher than the current level (EUR 35 billion in 2015), and further increase (EUR 40-62 billion/year) if the EU climate and energy goals are to be met.
Investments in storage and demand response are currently rather low but they are expected to substantially rise in the future.
In this chapter, we assess the investment required in the electricity sector in order to achieve the EU climate and energy goals and targets. We begin by providing an overview of the relevant energy and climate policy objectives and targets, and then identify and assess their impact on the electricity sector in terms of investment needs in the different subsectors, in particular interconnection, transmission and distribution grids, generation and storage.
2.1. Objectives of European energy policy The European Union has several policies in place that support the transition to a low carbon energy system. For several years, the EU has aimed to resolve the “energy trilemma” by implementing policies to make energy supply more sustainable, secure, competitive and affordable.1 This trilemma is illustrated in the figure below.
1 Friends of Europe (2015), Europe’s Energy Union and the road to Paris and beyond

Policy Department A: Economic and Scientific Policy
22 PE 595.356
Figure 1: Energy policy objectives, applied to electricity
Source: Adapted from WEF (2015) & Trinomics (2015)
The electricity sector is organised according to the “Third energy package”2: value-added activities that allow for effective competition are liberalised (generation, trade and supply) while the grids, which represent a natural monopoly, are unbundled from the competitive activities and are subject to regulation. The main objectives of the liberalisation package are the creation of an internal energy market and the realisation of efficiency gains by more effective (both domestic and cross-border) competition amongst market players.
2.2. Energy and climate targets The key energy and climate targets that affect the electricity sector are presented in the following table.
Table 1: Summary of key EU targets in the short, medium and long term
EU Level Target 2020 2030 2050
Greenhouse gas emissions3 20 % 40 % 80-95 %
(Indicative) Reduction compared to 1990
levels
Renewable Energy4 20 % 27 % 55 %
(Indicative) % of total energy consumption
2 The third energy package is the latest round of energy market legislation, enacted to improve the functioning of
the internal energy market and resolve structural problems. It comprises the following legislation: Common Rules for the Internal Market in Electricity Directive (2009/72/EC); Common Rules for the Internal Market in Natural Gas Directive (2009/73/EC); Regulation Establishing an Agency for the Cooperation of Energy Regulators (713/2009/EC); Regulation on Conditions for Access to the Network for Cross-Border Exchanges in Electricity (714/2009/EC); and Regulation on Conditions for Access to the Natural Gas Transmission Networks (715/2009/EC).
3 The national 2020 targets for the non ETS sectors (i.e. housing, agriculture, waste, small industrial installations and transport, excluding aviation) differ according to GDP per capita, e.g. from a 20 % cut for the richest countries to a maximum 20 % increase for the least wealthy for 2020. The target for the ETS sectors (large industrial and energy installations and aviation) is not split up per MS.
4 The 2020 RES targets were determined per MS based on their starting point and their technical and economic potential. The 2020 target also includes a 10 % RES share in the transport sector, which can be among other things, achieved with an increased use of electrical vehicles.
European Energy Industry Investments
PE 595.356 23
EU Level Target 2020 2030 2050
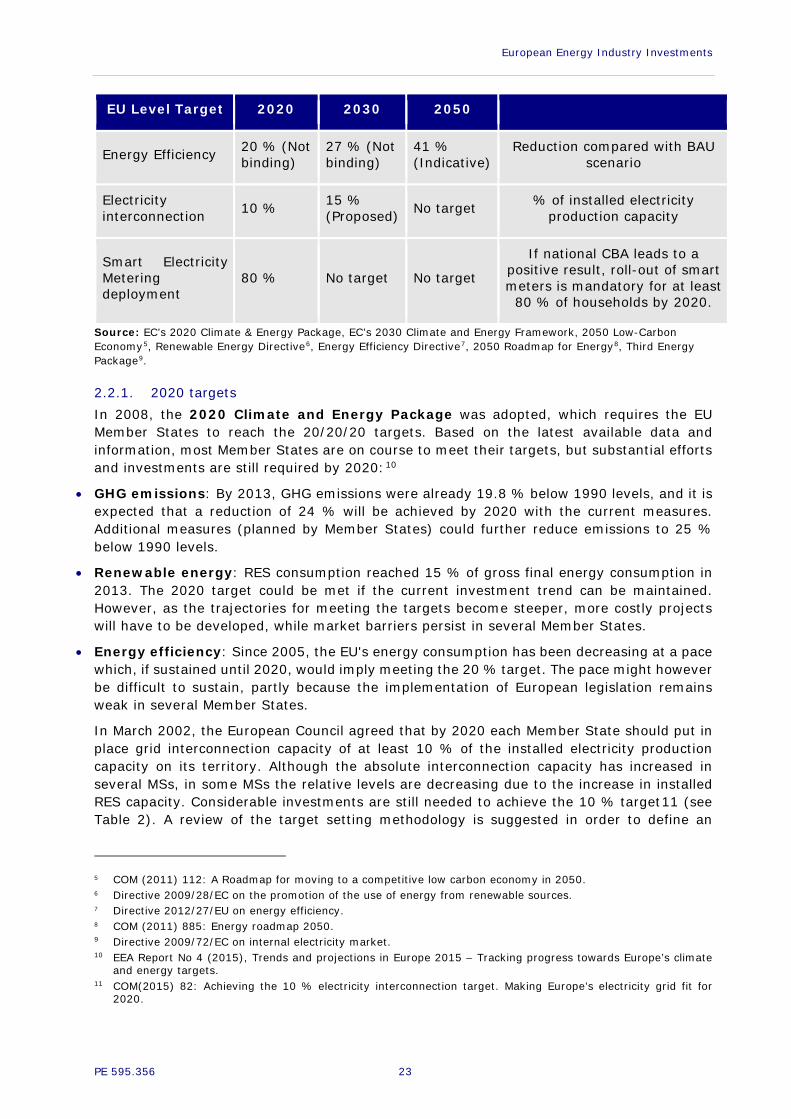
Energy Efficiency 20 % (Not binding)
27 % (Not binding)
41 % (Indicative)
Reduction compared with BAU scenario
Electricity interconnection 10 % 15 %
(Proposed) No target % of installed electricity production capacity
Smart Electricity Metering deployment
80 % No target No target
If national CBA leads to a positive result, roll-out of smart meters is mandatory for at least
80 % of households by 2020.
Source: EC’s 2020 Climate & Energy Package, EC’s 2030 Climate and Energy Framework, 2050 Low-Carbon Economy5, Renewable Energy Directive6, Energy Efficiency Directive7, 2050 Roadmap for Energy8, Third Energy Package9.
2.2.1. 2020 targets In 2008, the 2020 Climate and Energy Package was adopted, which requires the EU Member States to reach the 20/20/20 targets. Based on the latest available data and information, most Member States are on course to meet their targets, but substantial efforts and investments are still required by 2020:10
• GHG emissions: By 2013, GHG emissions were already 19.8 % below 1990 levels, and it is expected that a reduction of 24 % will be achieved by 2020 with the current measures. Additional measures (planned by Member States) could further reduce emissions to 25 % below 1990 levels.
• Renewable energy: RES consumption reached 15 % of gross final energy consumption in 2013. The 2020 target could be met if the current investment trend can be maintained. However, as the trajectories for meeting the targets become steeper, more costly projects will have to be developed, while market barriers persist in several Member States.
• Energy efficiency: Since 2005, the EU's energy consumption has been decreasing at a pace which, if sustained until 2020, would imply meeting the 20 % target. The pace might however be difficult to sustain, partly because the implementation of European legislation remains weak in several Member States.
In March 2002, the European Council agreed that by 2020 each Member State should put in place grid interconnection capacity of at least 10 % of the installed electricity production capacity on its territory. Although the absolute interconnection capacity has increased in several MSs, in some MSs the relative levels are decreasing due to the increase in installed RES capacity. Considerable investments are still needed to achieve the 10 % target11 (see Table 2). A review of the target setting methodology is suggested in order to define an
5 COM (2011) 112: A Roadmap for moving to a competitive low carbon economy in 2050. 6 Directive 2009/28/EC on the promotion of the use of energy from renewable sources. 7 Directive 2012/27/EU on energy efficiency. 8 COM (2011) 885: Energy roadmap 2050. 9 Directive 2009/72/EC on internal electricity market. 10 EEA Report No 4 (2015), Trends and projections in Europe 2015 – Tracking progress towards Europe’s climate
and energy targets. 11 COM(2015) 82: Achieving the 10 % electricity interconnection target. Making Europe’s electricity grid fit for
2020.

Policy Department A: Economic and Scientific Policy
24 PE 595.356
indicator and target that better reflect the evolution and contribution of interconnection capacity to the integration of markets.12
Table 2: Actual interconnection levels in 2014 and 2016 and expected levels in 2020 (assuming Projects of Common Interest (PCIs) are implemented)
Country 2014 2016 2020 AT n.a. n.a. >15 % BE 17 % 13 % >15 % BG 11 % 7 % ≥10 & <15 % CY 0 % 0 % <5 % CZ 17 % 19 % >15 % DE 10 % 7 % ≥10 & <15 % DK 44 % 47 % >15 % EE 44 % 34 % n.a. ES 3 % 5 % ≥5 & <10 % FI 30 % 21 % >15 % FR 10 % 8 % ≥10 & <15 % GB 6 % 6 % ≥10 & <15 % GR 11 % 10 % ≥10 & <15 % HR 69 % 66 % >15 % HU 29 % 37 % >15 % IE 9 % 6 % >15 % IT 7 % 7 % ≥10 & <15 % LT 33 % 78 % n.a. LU 245 % 163 % >15 % LV 47 % 45 % n.a. NL 17 % 18 % >15 % PL 2 % 4 % >15 % PT 7 % 8 % ≥10 & <15 % RO 7 % 8 % >15 % SE 26 % 25 % >15 % SI 65 % 85 % >15 % SK 61 % 59 % >15 % Baltic Region n.a. 12 % >15 %
Source: Adapted from COM(2015) 82 and information received from DG ENER
According to Directive 2009/72/EC on the internal electricity market Member States are required to ensure the implementation of smart metering: a 80 % market penetration rate should be reached by 2020 if the result of the cost-benefit analysis (CBA) is positive.
In 2014, the progress report on smart metering13 stated that MSs had committed to the deployment of 200 million smart meters for electricity and 45 million for gas by 2020 which would represent a total investment of EUR 45 billion. 72 % of European consumers are expected to have a smart electricity meter by 2020. The roll-out will cost between EUR 200 and 250 per customer and provide during their lifetime a global benefit of EUR 309 per metering point, including, on average, 3 % energy savings.
12 This issue has been extensively addressed in our study (2016): Energy Union: Key Decisions for the Realisation
of a Fully Integrated Energy Market, pp 52-54. 13 COM(2014)356: Benchmarking smart metering deployment in the EU-27 with a focus on electricity.

European Energy Industry Investments
PE 595.356 25
2.2.2. 2030 targets The 2030 Climate and Energy Framework14 was agreed in 2014. It builds on the 2020 package and sets three key targets for 2030. According to the EC’s impact assessment for the 2030 climate and energy policy framework, the total investment needs (including investments in end-use sectors, generation and grids) in the reference scenario amount to EUR 816 billion (annual average for 2011-2030) and the decarbonisation scenarios require additional investments ranging from 4.7 % (for a 40 % GHG reduction target and 26.5 % RES) to 7.71 % (for a 40 % GHG reduction target and 30 % RES) compared to the reference.15 The incremental investment needs to reach the 2030 targets are hence relatively low; the average electricity cost in 2030 would be basically identical in the considered scenarios, i.e. 176 EUR/MWh in the reference scenario and 179 EUR/MWh and 178 EUR/MWh respectively in the two other scenarios versus 131 EUR/MWh in 2010. The investment needs for grids and generation & boilers only represent between 9 and 12 % of the total investments, while transport is responsible for the major share (about 80 %).
Table 3: Investment needs according to the 2030 Framework Impact Assessment
Scenario 2030 target
Annual investment expenditure (avg. 2011-2030/2031-2050)
Grid Generation & boilers
Total investmen
t16
Reference GHG: -32.4 % vs 1990 RES: 24.4 % in FEC EE: -21 % vs 2030 projected
EUR 37/41 billion
EUR 50/59 billion
EUR 816/949 billion
GHG40
GHG: 40 % vs 1990 RES: No pre-set target (26.5 %) EE: No pre-set target (-25.1 % vs 2030 projected)
EUR 41/56 billion
EUR 53/85 billion
EUR 854/1188 billion
GHG40/ EE/RES30
GHG: -40 % vs 1990 RES: 30 % in FEC EE: No pre-set target (-30 % vs 2030 projected)
EUR 40/47 billion
EUR 55/72 billion
EUR 879/1333 billion
Source: SWD (2014)16: Executive summary of the impact assessment for the policy framework for climate and energy in the period from 2020 to 2030
In addition, the 2030 framework proposes a reform of the Emissions Trading System (ETS) and the use of Member State plans, under a common framework, for competitive, secure and sustainable energy.
In 2014 the European Commission proposed increasing the interconnection target to 15 % by 2030.17 An increase in the level of interconnection of the electricity system would enhance the competitiveness of the electricity sector and contribute to the markets’ integration as well as to security of supply, as more reserve capacity could be shared amongst
14 COM (2014) 15: A policy framework for climate and energy in the period from 2020 to 2030. 15 SWD (2014)16: Executive summary of the impact assessment fort the policy framework for climate and energy
in the period from 2020 to 2030. 16 Including investment expenditures in industry, residential & tertiary, transport, grid, and generation & boilers. 17 COM (2014) 330 final: European Energy Security Strategy.

Policy Department A: Economic and Scientific Policy
26 PE 595.356
member states. This proposal has not yet been endorsed; an expert group has been set up to provide advice on how to “conceptualise the 15% target into regional, country and/or border level targets".18
2.2.3. 2050 targets The EC has published two roadmaps for 2050 that are relevant for electricity investments.
The Roadmap for moving to a competitive low carbon economy in 205019 aims to reduce total EU GHG emissions in 2050 by 80 % - 95 % of the 1990 levels. This would require cutting emissions by 40 % in 2030 (already endorsed in 2014) and by 60 % in 2040. To achieve these ambitious targets, the power sector would have to almost totally eliminate its GHG emissions by 2050.
The Energy Roadmap 205020 explores different pathways (see more details in section 2.3) to achieve the 2050 target mentioned above, without jeopardising competitiveness or security of supply. The roadmap confirms that the low-carbon goal is economically feasible, but highlights the need to mobilise investors and to offer a unified and effective approach to energy sector incentives, in particular a higher carbon price, support for early movers, greater and more tailored financing via public institutions (EIB, EBRD) and the mobilisation of the commercial banking sector and new institutional investors.
Table 4: Investment needs according to the 2050 Energy Roadmap Impact Assessment
Scenario Target
Cumulative investment for power generation 2011-205021
Grid investment costs
2011-2030 2011-2050
Current Policy Initiatives (CPI)
GHG: -40 % vs 2005 RES: 29 % in final energy consumption (FEC) EE: -11.6 % (2050 vs 2005)
EUR 2 000 billion EUR 584 billion
EUR 1 357 billion
High EE GHG: -80 % vs 1990 RES: 57.3 % in FEC EE: -40.6 %(2050 vs 2005)
EUR 2 150 billion EUR 657 billion
EUR 1 518 billion
Diversified supply technologies (DST)
GHG: -80 % vs 1990 RES: 54.6 % in FEC EE: -33.3 % (2050 vs 2005)
EUR 2 400 billion EUR 753 billion
EUR 1 712 billion
High RES GHG: -80 % vs 1990 RES: 75.2 % in FEC EE: -37.9 % (2050 vs 2005)
EUR 3 200 billion EUR 872 billion
EUR 2 195 billion
Delayed CCS GHG: -80 % vs 1990 RES: 55.7 % in FEC EE: -32.2 % (2050 vs 2005)
EUR 2 550 billion EUR 756 billion
EUR 1 717 billion
18 2016/C 94/02: Commission Decision of 9 March 2016 setting-up a Commission expert group on electricity
interconnection targets. 19 COM (2011) 112: A Roadmap for moving to a competitive low carbon economy in 2050. 20 COM (2011) 885: Energy roadmap 2050. 21 Approximate values.

European Energy Industry Investments
PE 595.356 27
Scenario Target
Cumulative investment for power generation 2011-205021
Grid investment costs
2011-2030 2011-2050
Low nuclear GHG: -80 % vs 1990 RES: 57.5 % in FEC EE: -37.7 % (2050 vs 2005)
EUR 2 500 billion EUR 764 billion
EUR 1 793 billion
Source: SEC (2011) 1565/2, Impact Assessment for the Energy Roadmap 2050
The decarbonisation scenarios require about 30 % more investments than the CPI scenario, because increasingly more sophisticated infrastructure (mainly RES capacity, electricity lines, smart grids and storage) is needed. The High RES scenario requires additional RES assets, DC lines (mainly to transport wind electricity generated in the North Sea to the centre of Europe) and more storage. As the social and economic impact of the 2 “extreme” scenarios (high RES and high EE) would be very high, their implementation seems less likely than the other more balanced scenarios. Considering the technology and market developments, investments in nuclear and CCS are expected to be limited, at least in the next two decades. The three technology scenarios (DST, delayed CCS and low nuclear) can hence be considered as a reasonable basis to estimate future investment needs. However, in order to have a comprehensive overview, we will also include the results of the “more ambitious” scenarios in our analysis.
2.3. Analysis of the impact of the energy and climate targets on electricity investment needs
Reaching the targets mentioned above will require substantial investments and an economic and institutional framework capable of facilitating this transition.22 The electricity sector will have to play a major role: its potential to further decarbonise the energy supply is high and it can also contribute to reducing the dependence on fossil fuels in end-uses that are currently mainly fossil fuel based, particularly transport and heating.
Several studies23 have assessed the investment needs for the European electricity sector. The results of these studies vary according to the scenarios and assumptions regarding economic and market developments and specific investment costs that they make. An overview of the results of a number of recent studies can be found in annex 2.
In this section, we provide an analysis of the investment needs based on studies from the European Commission, ECF and IEA/OECD. These studies have been selected for this analysis as they provide an independent and objective analysis of pathways to achieve a low-carbon energy supply, in line with the energy security, environmental and economic goals. Although these studies have different time horizons and are based on different assumptions and levels of ambition, they complement each other and allow us to make a comprehensive assessment of the investment levels required by 2050 per subsector and per generation technology.
22 DG ECFIN (2015): Energy Economic Developments: Investment perspectives in electricity markets; Friends of
Europe (2015), Europe’s energy Union and the road to Paris and beyond 23 EC (2011) – Energy Roadmap 2050; EC (2016), EU Reference Scenario 2016; ECF (2010) - Roadmap 2050: A
Practical Guide to a Prosperous, Low-carbon Europe; ECF (2012) – Power Perspectives 2030; Eurelectric – Power Choices (2009) and Power Choices Reloaded (2013); EWI (2011) - Roadmap 2050 – a closer look; TU Vienna / EEG (2014) - 2030 RES targets for Europe; OECD/IEA (2014) – World Energy Investment Outlook; ENTSO-E TYNDP 2012 and 2014; IEA (2016). World Energy Investment 2016; VGB (2015) - Investment Requirements in the EU Electricity Sector up to 2050; Green Peace (2015) – Energy [R]evolution

Policy Department A: Economic and Scientific Policy
28 PE 595.356
Box 2: Selected studies
Although the EC Energy Roadmap 2050 is slightly outdated, its results are still relevant. It considers the EU policies for 2020 and explores different pathways to achieve the 2050 target of reducing the GHG by 80 % compared to 1990 levels, while also focusing on competitiveness and security of supply. It compares a current policy initiatives scenario (CPI – As of April 2011) to five decarbonisation scenarios: high energy efficiency, diversified supply technologies (DST), high RES, delayed CCS and low nuclear.
The EU Reference Scenario 2016 focuses on current trend projections, assuming that both the GHG and RES 2020 targets will be met.24 While this scenario provides a consistent approach in projecting long term trends across the EU, it is not a forecast. By 2050 it projects 31 % RES in gross final energy consumption and a decrease of 48 % in GHG emissions compared to 1990 levels. This analysis clearly illustrates that current policies and trends are not sufficient to reach the 2050 target.
The OECD/IEA’s World Energy Investment Outlook (2014) estimates the investment needs in 2014-2035 for two scenarios: The New Policies Scenario (NPS) in which the energy demand and supply projections reflect energy policies and measures adopted as of early 2014; and the 450 Scenario which considers an emissions-reduction path consistent with the goal to limit global increase in temperature to 2°C by limiting concentration of greenhouse gases in the atmosphere to around 450 parts per million of CO2.
The ECF (2010) - Roadmap 2050: A Practical Guide to a Prosperous, Low-carbon Europe assesses a baseline, three decarbonisation pathways and an ambitious 100 % RES scenario. Its follow-up study ECF (2012) – Power Perspectives 2030 focuses on the medium term and assesses an “On Track” case and several alternative scenarios.
In the next section, we compare the different investment needs to achieve a low carbon energy system, with the current investment levels on the one hand, and the expected investment trends according to the Reference Scenario 2016 on the other hand. This analysis allows us to estimate the additional investment needs for different levels of ambition and technology development pathways.
2.3.1. Investment needs in power generation According to the EU Reference Scenario 2016 projections, most of the new power capacity investments (in GW) would be in onshore wind energy, followed by solar energy and gas fueled power plants. The scenario predicts a considerable investment drop in the 2020 and 2030 decades, after the massive expansion of RES in 2010-2020. On the other hand, refurbishments (representing over one third of overall cumulative investments in 2011-2050) would strongly increase in the 2030 and 2040 decades, mainly concerning solar energy installations and onshore wind turbines.
It should be underlined that the Reference Scenario 2016 does not enable reaching the 2030 and 2050 targets. Total GHG emissions are projected to be 35 % below 1990 levels by 2030 and only 48 % by 2050. The share of renewables in the energy mix will continue to grow, from 21 % in 2020 to 24 % in 2030 (hence below the 27 % target) and 31 % in 2050. The main reason for including the outcome of this scenario in this study is as a basis for comparison.
24 This reference scenario is based on a set of assumptions, including on population growth, macroeconomic and
oil price developments, technology improvements, and current policies. It does not include the 2030 climate and energy targets.

European Energy Industry Investments
PE 595.356 29
Figure 2: Reference Scenario: Investment in new capacity and plant refurbishment per technology up to 2050 (in GW)
Source: EC (2016), EU Reference Scenario
The EU Reference Scenario 2016 also projects that divestments (decommissioning) in nuclear and fossil fuel based power production capacity would be higher than investments in new and refurbished capacity. This leads to a net decrease in nuclear capacity up to 2050 (except for the 2020 decade, where there is a slight increase) and in fossil fuel based capacity from 2011 to 2035.
The EC Energy Roadmap 2050 concludes that, depending on the scenario, between 300 and 600 GWe (and up to 950 MW in 2041-2050 in the high RES scenario) of net additional power capacity would be needed per decade up to 2050, with most of these investments in RES. According to the reference and CPI scenarios (which are in line with the EU Reference Scenario 2016), the current investment level is about 300 GWe (2011-2020). To reach the decarbonisation targets, the future capacity needs would in 2031-2050 be substantially higher than the current level and the investment trend estimated in the EU Reference Scenario 2016.
Figure 3: Net Power Capacity Investment in GWe per decade for EU27
Source: Prepared by Trinomics based on EC Energy Roadmap 2050 (2011)
The overall investment needs in 2011-2050 show a large level of variation, depending on the scenario: EUR 2 000 billion in the CPI scenario versus EUR 2 150 in the high EE and EUR 3

Policy Department A: Economic and Scientific Policy
30 PE 595.356
200 in the high RES scenario. The other scenarios lead to comparable investment figures of EUR 2 450 to EUR 2 550 billion. The average annual investment needs in 2011-2050 range from EUR 53.8 (high EE scenario) to EUR 80 (high RES) billion versus EUR 40 billion in the current policies scenario. The investment needs to meet the climate targets would be substantially higher than the actual levels in 2011-2015, which, according to the EU Reference Scenario 2016, are EUR 60 billion per year. This is in line with the 64 billion USD invested in 2015, as reported by OECD/IEA (2016).
In the OECD/IEA study, the cumulative investments in 2014-2035 for power generation are estimated at 1 572 billion USD in the NPS versus 1 916 billion USD in the 450 scenario. Annual investments needed to reach the 2050 GHG target (450 scenario) would be 87.1 billion USD on average, which is higher than the actual investment level (almost 66 billion USD) in 2000-2013.25 The large majority of the investment needs concern RES: 75 % in the NPS and 79 % in the 450 scenario. Nuclear investments account for 13 % in the 450 scenario while fossil investments are limited to 4 % each for coal and gas. Although the figures in this study are not fully comparable with the Energy Roadmap’s results due to their different scenarios and time horizon, the pattern is similar, as the Roadmap also foresees much lower investment needs in 2021-2030 than in 2031-2050.
Figure 4: EU investments for power generation in 2015 (billion USD’15) compared to cumulative investment needs in 2014-2035 in the 450 Scenario (in billion USD’12)
Source: Prepared by Trinomics based on OECD/IEA (2014), World Energy Investment Outlook and OECD/IEA (2016), World Energy Investment
The electricity mix and the RES shares diverge depending on the scenario. The EC (2014) decarbonisation scenarios estimate 34 % to 47 % of RES in the electricity mix (RES-E) by 2030, while ECF’s “On Track” Scenario estimates 50 %. In most scenarios, the RES-E share in 2030 would be higher than the indicative target of 34 % to 35 % RES-E, which is derived from the overall 27 % RES target.26 In 2031-2050 the RES-E share would further increase to 49 % to 83 %: the Energy Roadmap 2050’s decarbonisation scenarios lead to RES-E share of 59 % to 83 % (versus 48.8 % in CPI) in 2050, while according to the latest EU Reference Scenario 2016, the current policies and trends would lead to 56 % RES-E by 2050. The most likely and feasible decarbonisation scenarios (DST, Delayed CCS and Low nuclear) lead to 59.1 % to 64.8 % RES-E in 2050. While RES-E shares are close in the EU REF 2016 and 25 Though the annual investment level in the period 2007-2013 increased substantially to around 100 billion USD. 26 SWD (2014) 15, impact assessment fort the policy framework for climate and energy in the period from 2020 to
2030 (p. 70).

European Energy Industry Investments
PE 595.356 31
several decarbonisation scenarios, the GHG reduction achieved by 2050 in the EU REF 2016 is only 48 % compared to 1990 levels, which appears insufficient to reach the agreed target of -80 %. The Energy 2050 Roadmap decarbonisation scenarios are conceived to reach this target.
2.3.2. Investment needs in transmission and distribution grids IEA/OECD estimates in its World Energy Investment Outlook (2014) that between 2014 and 2035 around 650 billion USD would be needed in the 450 scenario to refurbish and extend the European Union electricity grids. The EC Energy Roadmap 2050 also includes separate investment figures for both the transmission and distribution parts of the grid. Over 75 % of the future grid investments relate to distribution infrastructure. Table 5 shows the investment needs that have been estimated in both studies for each scenario.
Table 5: Cumulative investment needs in transmission (including interconnectors) and distribution
Source (Unit) Scenarios Investment 2000-2013
2011-2020
2021-2030
2031-2040
2041-2050
OECD/IEA 2014 (billion USD’12)
NPS Transmission 56 61 65 60* NA Distribution 364 246 230 230* NA
450** Transmission 56 70 70 70* NA Distribution 364 226 226 226* NA
EC 2011 (billion EUR’05)
CPI Transmission NA 47.1 49.6 64.8 66.6 Distribution NA 245 239.3 317.6 325.9
High EE Transmission NA 49 63.1 80.3 80.1 Distribution NA 256.3 289.1 408.4 291.8
DST Transmission NA 52.8 70.2 88 86.8 Distribution NA 284.2 345.9 454.3 329.8
High RES Transmission NA 52.8 95.5 137.8 134.4 Distribution NA 283.5 440 619.8 431.5
Delayed CCS Transmission NA 52.7 71 88.6 87.6 Distribution NA 283.4 349.4 445.1 339.6
Low nuclear Transmission NA 52.9 73.8 95.2 94.8 Distribution NA 286.4 350.8 472.5 366.5
ECF 2012 (billion EUR) On track Transmission NA 46 68 NA NA
Note: *Assuming same annual average for 2036-2040 as for 2031-2035; **Assuming uniform distribution of the investment over time.
Source: Prepared by Trinomics based on EC (2011) and OECD/IEA (2014)
The average annual transmission investment needs in the decarbonisation scenarios between 2021-2050 are 52 % to 66 % higher than current (2011-2020) levels, except in the high RES scenario where the level is substantially higher, being some 132 % higher than current investment levels. The OECD/IEA 450 scenario expects a much more limited increase in transmission investment needs.
The investment needs for distribution are much higher than for transmission, representing 81 % to 83 % of the grid investments in the Energy 2050 Roadmap and 76 % to 79 % in the OECD/IEA (2014) scenarios. The biggest share of the costs is related to the upgrade and

Policy Department A: Economic and Scientific Policy
32 PE 595.356
extension of the distribution networks and the development of smart grids. However, the scenarios have large investment ranges, depending on the RES share and technology choices. The most likely and feasible scenarios (DST, Delayed CCS and Low nuclear) lead to largely similar investment levels in 2021-2050, which are some 40 % to 50 % above the current 2011-2020 levels.
Investments in interconnectors currently represent a relatively small share (about EUR 0.9 to 1.5 billion annually), but would substantially rise in a high RES scenario to an average of EUR 3.6 billion annually (see figure 5).
Figure 5: Investments in new electricity interconnectors (in billion EUR’08)
Source: Prepared by Trinomics based on EC (2011)
The European Network of Transmission System Operators for Electricity (ENTSO-E) produces a Ten-Year Network Development Plan (TYNDP) which includes an estimate of the investment budget per MS for national and supranational projects of pan-European significance. The overall investment budget in the TYNDP 2012 was EUR 104 billion (including EUR 23 billion for subsea cables). In the TYNDP 2014 the budget was raised to EUR 150 billion by 2030. The TYNDP 2016 estimates EUR 150 billion of investments – in line with TYNDP 2014, of which EUR 80 billion is allocated to projects already endorsed in national plans and/or intergovernmental agreements by 2030.
Figure 6 shows the additional capital expenditure in transmission infrastructure (including interconnectors) required to deliver the EU energy and climate policy ambitions. It also shows that the TYNDP projects are only a subset of the transmission investment needs.27
27 ENTSO-E (2014), Fostering Electricity transmission investments to achieve Europe´s energy goals: Towards a
future-looking regulation.

European Energy Industry Investments
PE 595.356 33
Figure 6: Transmission investment volumes in Europe – Past vs future
Source: ENTSO-E (2014), Fostering Electricity transmission investments to achieve Europe´s energy goals: Towards a future-looking regulation
2.3.3. Investment needs in storage Energy storage will have a key role in the transition to a low-carbon electricity system by providing flexibility via a balancing reserve to provide energy to the electricity system as a back-up to intermittent RES. Currently, there is limited storage capacity in the EU electricity system (only around 5 % of the installed electricity production capacity) almost exclusively from pumped hydro-storage. The development of other forms of storage, such as batteries, flywheels, hydrogen, chemical storage, is still rather limited. The need for investments in energy storage is mainly related to the increase in intermittent wind and solar energy and to the increase in demand peaks28, among others due to the development of electric vehicles and heat pumps.
The IEA’s 2014 Technology Roadmap for Energy Storage29 provides an estimate of the storage capacity expected by 2050 in a reference scenario (2 Degrees Scenario, 2DS) compared to a breakthrough scenario where costs are drastically reduced, and an electric vehicle deployment scenario (EV) where vehicle charging strategies for offsetting peak demand are widely employed. The IEA expects that between 43 and 90 GW of installed storage capacity will be required for the EU by 2050. The installed pumped hydro storage capacity was 51 GW in 2010 with almost 6 additional GW expected between 2011-201530 so the current storage capacity would be sufficient in the scenario EV (battery capacity for EV is not included in the figures), as this scenario assumes that 25 % of the electricity consumption of EVs would be controllable load, available for demand response. In the two other scenarios, additional storage capacity in the electricity system would be necessary. The study also assesses the corresponding cumulative investment needs for storage capacity and related infrastructure (e.g. charging stations) in 2011-2050 in the EU, which range between USD 80 billion to USD 130 billion, depending on the scenario.
28 DG ENER (2013), Working paper: The future role and challenges of energy storage. 29 IEA (2014), Technology Roadmap – Energy Storage. 30 DG ENER (2013), Working paper: The future role and challenges of energy storage.

Policy Department A: Economic and Scientific Policy
34 PE 595.356
Figure 7: Electricity storage capacity for daily electricity storage in 2011 and 2050 for ETP 2014 scenarios and corresponding investment needs in 2010-2050
Source: IEA (2014), Technology Roadmap – Energy Storage
The EWI (2011) study also provides specific investment estimates for storage for the 2010-2050 period. They are slightly lower than the IEA’s estimates: EUR 39 billion for the optimal grid extension scenario and EUR 86 billion for the moderate transmission grid scenario.31
Box 3: The PV Storage Case in Germany32
Up until 2015, around 35,000 households and commercial enterprises in Germany have invested in a PV-battery system. Experts predict a massive deployment of energy storage systems in the coming years. According to research from Germany Trade & Invest (the German foreign trade and inward investment agency), the German market for PV-battery systems could see annual installations of around 50,000 systems by 2020. This growth is likely to be encouraged by substantial charges and taxes applying to electricity bought from the grid and exemption/reduction rules for auto-consumption.
2.3.4. Investment needs on the demand side, including demand response Huge investments are also needed on the demand side33 to succeed in the transition to low carbon energy use. These investments are required in order to facilitate demand response and more efficient use of energy. In a similar way to storage, demand response contributes to balancing the electricity system by “voluntary changes by end-consumers to their usual electricity use pattern” in response to, for example, changes in the electricity price or incentive payments.34 The changes can be load shifting (shifting the load to a different point in time) or load reduction/increase, and are triggered by specific contracts with suppliers or aggregators.
Figure 8 gives an overview of the current and expected electricity related investment expenditures on the demand side. More than 70 % of these investments relate to the residential sector. Specific figures about the expected (or needed) investments in demand response are not available.
31 EWI (2011), Roadmap 2050 – a closer look. 32 GTA Factsheet: The energy storage in Germany. Recovered from:
https://www.gtai.de/GTAI/Content/EN/Invest/_SharedDocs/Downloads/GTAI/Fact-sheets/Energy-environmental/fact-sheet-energy-storage-market-germany-en.pdf.
33 Demand side investments are usually related to energy efficiency improvements and demand side management or demand response.
34 SWD (2013) 442: Incorporating demand side flexibility, in particular demand response, in electricity markets.

European Energy Industry Investments
PE 595.356 35
Figure 8: Investment expenditures (5-year period, in billion EUR’13) on the demand side, excluding transport
Source: EU (2016), EU Reference Scenario 2016
While there are several studies assessing DR potentials35, there is limited information regarding the investment levels required to enable this potential. ECF (2012) considered a specific High Demand Response scenario, assuming a shift in energy of maximum 10 % within the same day. This would decrease the need for grid capacity by 10 % and backup generation capacity by 35 %, leading to savings of EUR 7 billion and EUR 25 billion respectively.36
2.3.5. Concluding remarks Future investment needs in electricity generation required to reach the energy and climate targets would range from EUR 54 to 80 billion annually in 2021-2050, compared to EUR 39-64 billion per year in both reference scenarios , and actual investment levels of EUR 50 to 60 billion per year in 2011-2020. The large majority of the investment needs concern RES: 75 % to 80 % depending on the scenario.
Given the current and expected technology and market developments, investments in nuclear and CCS are expected to remain at a low level in the next two decades. The three technology based decarbonisation scenarios (DST, delayed CCS and low nuclear) can therefore be considered as the most likely and feasible scenarios.37 These scenarios lead to very similar results, while the two “extreme” scenarios (high RES and high EE) result in quite divergent outcomes: the high energy efficiency scenario would lead to the lowest investment needs both in generation and grids (but its implementation would represent a major challenge for
35 Phil Baker (RAP) (2015), Resource adequacy, regionalisation and demand response; Smart Energy Demand
Coalition (SEDC) (2014), Mapping Demand Response in Europe Today; ACER (2014), Demand side flexibility: The potential benefits and state of play in the European Union; Schneider Electric (2014), The Benefits of Demand Response for Utilities; University of Cambridge – Energy Policy Research Group (2013), Distributed generation, storage, demand response and energy efficiency as alternatives to grid capacity enhancement; Capgemini (2008), Demand Response: a decisive breakthrough for Europe.
36 ECF (2012), Power Perspective 2030. 37 The impact assessment of the EC energy roadmap 2050 also looked at some evaluation criteria. For the
effectiveness criterion, it was noted that although all policy scenarios were designed to reach 85 % CO2 emissions reduction by 2050, some scenarios are highly dependent on the success of new technologies (like CCS and offshore wind). It is also important to note that in all scenarios, ETS prices are considered to rise drastically (and are much higher than in the Reference scenario). In terms of efficiency, the analysis demonstrated that ‘the costs of decarbonisation of the energy system are not substantially higher compared to the Reference scenario’. Finally, all policy scenarios are assumed to be coherent with other EU long term objectives.

Policy Department A: Economic and Scientific Policy
36 PE 595.356
the end-users), while the high RES scenario would imply the highest investment budget for both grids and generation, and would lead to the highest overall system cost.
Decommissioning of ageing thermal power plants is predicted to be substantial in 2016-2035. While the current investment level in this technology is extremely low, new thermal plants would be needed as of 2030. Taking into account the CO2-emission constraints and the need for highly flexible capacity, it is expected that most MS and investors will opt for gas based power generation technologies rather than for new coal fired power plants.
The future investment needs in grids (extension, refurbishment and replacement of ageing infrastructure) are substantial, even in the reference scenarios (EUR 35.4-38 billion/year), and these costs rise dramatically if the scenarios are adjusted to achieve the EU climate and energy goals (EUR 40-62 billion/year). The additional investment needs related to achieving the energy and climate policy goals are extremely high in the high RES scenario, where the investment needs raise sharply as of 2030 to more than EUR 70 billion annually.
The average annual electricity related investment levels, including on the demand side, are summarised in the next table.
Table 6: Average annual investment levels in billion EUR
Types of investment
Current level Needs 2021-2050 Estimates 2011-
2020 2015* Reference** Decarbonisation
Power generation 50-60 58 39-64 54-80
- RES 43.9 50.4 48 62
- Conventional 12.3 7.2 16 16.5
Grids 26-34 35 35.4-38 40-62
- Transmission 4.6-5.3 4.5 6 7.5-12.3
- Distribution 24.3-28.6 27 29.4 33-49.7
- Interconnectors 0.9 -1.5 NA 0.5 0.5 - 3.6
Storage < 1 NA NA 1.3-2.9
Demand side38 About 100 NA 170-220 NA Note: *Values for 2015 are from IEA (2016), World Energy Investment 2016 using the conversion rate of 0.90 EUR/USD. Value for grids refers to electricity networks and include grid-scale battery storage. **Based on the EC’s CPI (2011), the OECD’s NPS (2014) and the EU Reference 2016 scenarios
Source: Prepared by Trinomics based on several studies (Energy Roadmap 2050, ECF 2012, IEA/OECD 2014, IEA 2016, EWI 2011, EU Reference Scenario 2016)
The impact of the energy transition on the affordability of energy for households and professional end-users is a major concern for policy makers. We notice, however, that the cost impact of higher investment levels in the future will be partly offset by avoided primary energy import costs. The overall electricity system cost would in 2030 be about 30 % higher than in 2010 while the share of energy related costs (excluding transport) in household expenditures would rise from 7.5 % in 2010 to about 9.3 % in 2030. Energy efficiency investments can help to reduce the operational energy expenditures and thereby contribute to affordability, but may require targeted assistance to facilitate investments for vulnerable consumers.39
38 These figures include investments in demand side in residential, industrial and tertiary sectors (excluding
transport). 39 SWD (2014) 15, impact assessment fort the policy framework for climate and energy in the period from 2020 to
2030 (pages 93-97).

European Energy Industry Investments
PE 595.356 37
ANALYSIS OF DRIVERS AND BARRIERS FOR ELECTRICITY INVESTMENTS
KEY FINDINGS
Support schemes represent currently the major driver for investments in power generation capacity, while investments in grid assets are mainly driven by regulation that guarantees investors a reasonable return on equity.
Important barriers affecting investments in the energy industry are a lack of regulatory certainty due to inadequate policies, in particular frequently changing and poorly harmonised national legislation, a lack of public acceptance of new infrastructure, an inappropriate regulatory framework (including complex permit granting procedures) and economic factors: low electricity demand growth, lack of proper electricity and carbon markets price signals, low profitability of not subsidised power generation, long lead times and high upfront capital requirements for most infrastructure projects.
Investments in interconnection capacity are particularly hindered by conflicting national interests and the administrative and regulatory complexity of multi-national projects.
The aim of this chapter is to identify the main drivers and barriers for investments in electricity infrastructure, and to qualitatively assess their impact. This analysis should allow an examination of how drivers can be reinforced, and how barriers can be eliminated, by policy measures to facilitate the investments needed to reach energy and climate targets.
At the present time investments in RES are mainly driven by the enabling legal and regulatory framework and the presence of specific support schemes. Investments in conventional production will in the coming decades still be needed, at least as back-up for intermittent RES production, but they are being hindered by a negative perception of future economic and market conditions. At the same time, an inadequate regulatory framework is often considered as the main barrier for investments in grid assets.40 Some of the key barriers to grid investment are insufficient rate of return, the long duration of the regulatory scrutiny period, the political instability and the lack of incentives/support for specific projects. 41
As policy measures and/or external factors can have positive and negative impacts on investments we have opted for an integrated approach for their assessment. For each factor, we have assessed the positive and negative impacts per type of investment in order to identify barriers and drivers. For example, national RES support schemes are a driver for investments in RES generation and grids, but they represent a barrier for investments in conventional generation.
Our analysis and overview table are based on a variety of data sources, with a focus on publications of the European Commission42 and OECD/IEA43.
The next table provides an overview and the following sections assess the current and expected impact of the main barriers and drivers on the different types of investments.
40 DG ENER (2015), Study on comparative review of investment conditions for electricity and gas Transmission
System Operators (TSOs) in the EU. 41 DG ENER (2015), Study on comparative review of investment conditions for electricity and gas Transmission
System Operators (TSOs) in the EU. 42 DG ECFIN (2015), Energy Economic Developments - Investment perspectives in electricity markets. 43 OECD/IEA (2012), Securing power during the transition.

Policy Department A: Economic and Scientific Policy
38 PE 595.356
Table 7: Overview of drivers and barriers for investments in the energy sector
Drivers & barriers
Tran
smis
sion
Inte
rcon
nect
ors
Dis
trib
utio
n
RES
gen
erat
ion
Con
vent
iona
l ge
nera
tion
Sto
rage
ca
paci
ty
Dem
and
Res
pons
e
Economic and energy market aspects
Limited electricity demand growth - -
Remuneration level for electricity (commodity and capacity) - - - - -
Price volatility and regulation - - +/- +/-
Electricity market concentration and size + +/- +/-
Availability and cost of primary fuel for electricity production and suitable sites +/- +/-
Generation capacity reserve margin +/- - - -
Policy framework
RES & RD&I support + + + ++ - + +
Carbon pricing and ETS44 +
Smart metering target + + +
National CRMs + + +
EE targets and measures + + + +
Interconnection target & PCI + ++
Inadequacy of national policies - - - - - - -
Institutional aspects
Permitting procedure for new infrastructure - - - - - - - - -
Feasibility to realise cross-border investments - -
Financial market and instruments
Cost of capital and access to funding -
Risk perception and hedging - - - - -
Other aspects
Public acceptance of infrastructure - - - - - - - -
Grid tariffs + + +/- +/- +/-
Note: Driver with limited impact (+) or high impact (++). Barrier with limited impact (-) or high impact (--). Impacts depend on the national and project specific context (+/-).
Source: Prepared by Trinomics.
44 ETS is currently a very weak driver of low carbon investments, but in all scenarios between 2030 and 2050 the
EUA price should become a major trigger for investments.

European Energy Industry Investments
PE 595.356 39
3.1. Economic and energy market aspects
3.1.1. Electricity demand growth is no longer a significant driver Electricity demand growth has historically been a driver for investments in the electricity sector. However, current investments in generation capacity are mainly policy driven (RES support) and the residual demand growth has become too weak to act as a driver for investments by utilities in generation assets. Similarly, electricity demand growth is no longer a driver for investments in grid assets, which are mainly triggered by RES projects and markets’ integration.
Between 1990 and 2013, electricity consumption increased by 28.1 %.45 In 2009 electricity consumption, influenced by the financial and economic crisis, decreased by 5.2 % but recovered immediately in 2010 almost back to its 2008 level. In 2015 electricity demand in the EU rose by 1.1 %, recovering from a fall of 2.3 % in 2014. The growth rates of individual MS are, however, quite varied (see Table 8).
Table 8: Evolution of EU28 electricity demand (final consumption) in TWh and growth rates for 2010-2014
Source: Prepared by Trinomics based on Eurostat (nrg_105a, code B_101500)
Total EU electricity consumption is expected to slightly increase in the medium and long term, partly because of an increase in the use of electricity for heating (heat pumps), cooling and
45 Eurostat.
1990 2000 2010 2011 2012 2013 2014 Growth rate 2010-2014EU28 2 165 2 529 2 842 2 784 2 793 2 771 2 707 -5%BE 58 78 83 80 81 83 81 -3%BG 35 24 27 28 28 28 28 2%CZ 48 49 57 57 57 57 56 -2%DK 28 32 32 32 31 31 31 -5%DE 455 483 532 526 526 523 513 -4%EE 7 5 7 7 7 7 7 0%IE 12 20 25 25 24 25 25 -2%GR 28 43 53 52 52 49 50 -7%ES 126 188 245 243 239 231 227 -8%FR 302 384 444 415 432 439 413 -7%HR 13 12 16 16 15 15 15 -6%IT 215 273 299 302 297 287 281 -6%CY 2 3 5 5 4 4 4 -19%LV 8 4 6 6 7 7 7 6%LT 12 6 8 9 9 9 9 11%LU 4 6 7 7 6 6 6 -6%HU 32 29 34 35 35 35 36 4%MT 1 2 2 2 2 2 2 10%NL 74 96 107 108 106 104 103 -4%AT 43 52 60 60 61 61 60 0%PL 96 99 119 122 123 124 126 6%PT 24 38 50 48 46 45 45 -9%RO 54 34 41 43 42 40 42 1%SI 9 11 12 13 12 12 12 4%SK 25 22 24 25 24 25 24 0%FI 59 76 83 80 81 80 79 -5%SE 120 129 131 125 127 125 122 -7%UK 274 330 329 318 318 317 304 -8%

Policy Department A: Economic and Scientific Policy
40 PE 595.356
transport (electric vehicles). ENTSO-E estimates a 7.5 % increase in electricity consumption between 2016 and 2025.46
3.1.2. Decreasing income for conventional power plants is a major barrier for new investments
a. Decreasing electricity wholesale prices
The price paid for electricity has historically been a driver for investments in electricity generation. The massive development of wind and solar based production installations with low variable costs has, however, led to structurally lower wholesale electricity prices (see Figure 9), which no longer trigger new investments. The IEA47 states that the role of wholesale price signals as a driver for investment in (conventional) generation is declining. According to the IEA, at least a 20 % increase in wholesale electricity prices is needed to encourage utilities to invest in power plants.48
Figure 9: Average year-ahead future price of electricity in CWE in 2007-2015
Source: CREG, 2015.
The lower prices are partly due to a higher number of hours with zero or negative prices and a significant decrease in the frequency and magnitude of high-price periods.49
While most RES installations have guaranteed revenues via support schemes, conventional installations depend on energy market prices to recover their costs. In some cases, they also get some revenues from capacity remuneration schemes (CRM – see section 3.2.4) or from contracts with the Transmission System Operator (TSO) for ancillary services. These revenues can be vital to the operational retention of existing capacity, but are currently too low to trigger investments in new capacity.
b. Low gross margins for fossil fuel fired power plants
Considering the low gross margins for coal and gas based power production, many of these assets are at present not profitable and investments in new assets will not occur in the current economic and regulatory framework. This situation is illustrated in Figure 10 which presents
46 Based on Scenario B (Best Estimate Scenario) in the SOAF 2015. ENTSO-E (2015), Scenario Outlook & Adequacy
Forecast. 47 IEA (2016), World Energy Investment 2016. 48 OECD/IEA (2014), World Energy Investment Outlook. 49 ACER/CEER (2016), Annual report on the results of monitoring the internal electricity markets in 2015.

European Energy Industry Investments
PE 595.356 41
the actual gross margins (clean spark spread50 and clean dark spread51) for fossil fuel fired power plants in Germany. These figures are in general representative for Europe.
Figure 10: Germany clean spark spreads and clean dark spreads
Source: ICIS52.
c. Lower load factors for conventional power plants
The profitability of conventional power plants is also negatively affected by decreasing load factors, in particular for gas fired power plants. Most renewable energy based installations have lower variable costs than conventional plants, and hence have priority in the merit order. This impact can be illustrated with the figures for Portugal and Spain, where the average load factor for Combined-Cycle Gas Turbines (CCGTs) was only 6 % in Q1 2016 (7 % in Q1 2015).53 This load factor for CCGTs means less than 100 hours (full load equivalent) operation per year, even though they generally need 4000 hours per year to recover their fixed costs.
d. Lower overall return on generation investments
In most EU markets the overall returns on conventional thermal plants are not high enough to justify capital expenditures to replace them.54 Figure 11 shows that the overall return on capital invested in utilities in the EU fell 4.8 % from 2006 to 2013 as a result of weak demand, overcapacity, reduced load factors and declining wholesale prices.55 Average returns on RES investments in Europe also declined by 4 % between 2001 and 2013.56
50 Current clean spark spread is the gross operating margin for a gas fired power plant with an efficiency of 52
%. 51 Clean dark spread is the gross operating margin for a coal fired power plant with an efficiency of 35 %. 52 http://www.icis.com/resources/news/2016/01/28/9964560/uk-and-german-sparks-vs-darks-german-ccgts-in-
money-for-february/. 53 EDP (2016), Provisional Volumes Statement. 54 WEF (2015), The Future of Electricity: attracting investment to build tomorrow’s electricity sector. 55 Bain and company (2015), Business and investment opportunities in a changing electricity sector. 56 WEF (2015), The Future of Electricity: attracting investment to build tomorrow’s electricity sector.
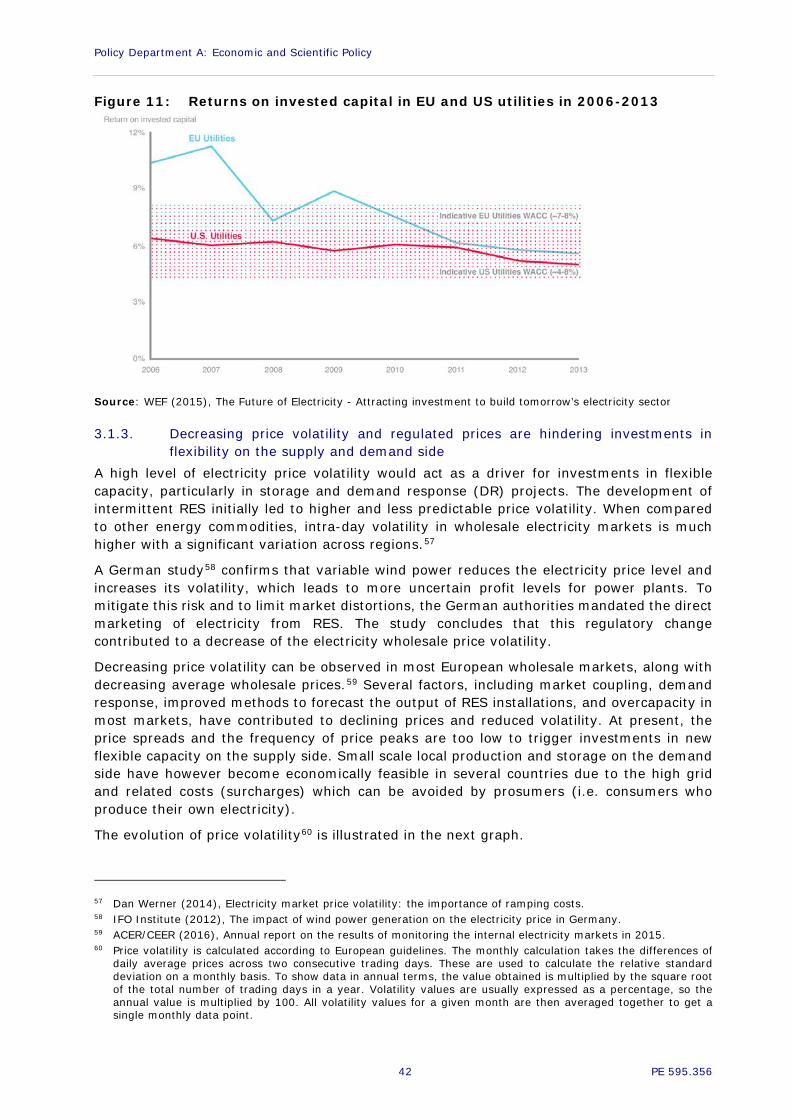
Policy Department A: Economic and Scientific Policy
42 PE 595.356
Figure 11: Returns on invested capital in EU and US utilities in 2006-2013
Source: WEF (2015), The Future of Electricity - Attracting investment to build tomorrow’s electricity sector
3.1.3. Decreasing price volatility and regulated prices are hindering investments in flexibility on the supply and demand side
A high level of electricity price volatility would act as a driver for investments in flexible capacity, particularly in storage and demand response (DR) projects. The development of intermittent RES initially led to higher and less predictable price volatility. When compared to other energy commodities, intra-day volatility in wholesale electricity markets is much higher with a significant variation across regions.57
A German study58 confirms that variable wind power reduces the electricity price level and increases its volatility, which leads to more uncertain profit levels for power plants. To mitigate this risk and to limit market distortions, the German authorities mandated the direct marketing of electricity from RES. The study concludes that this regulatory change contributed to a decrease of the electricity wholesale price volatility.
Decreasing price volatility can be observed in most European wholesale markets, along with decreasing average wholesale prices.59 Several factors, including market coupling, demand response, improved methods to forecast the output of RES installations, and overcapacity in most markets, have contributed to declining prices and reduced volatility. At present, the price spreads and the frequency of price peaks are too low to trigger investments in new flexible capacity on the supply side. Small scale local production and storage on the demand side have however become economically feasible in several countries due to the high grid and related costs (surcharges) which can be avoided by prosumers (i.e. consumers who produce their own electricity).
The evolution of price volatility60 is illustrated in the next graph.
57 Dan Werner (2014), Electricity market price volatility: the importance of ramping costs. 58 IFO Institute (2012), The impact of wind power generation on the electricity price in Germany. 59 ACER/CEER (2016), Annual report on the results of monitoring the internal electricity markets in 2015. 60 Price volatility is calculated according to European guidelines. The monthly calculation takes the differences of
daily average prices across two consecutive trading days. These are used to calculate the relative standard deviation on a monthly basis. To show data in annual terms, the value obtained is multiplied by the square root of the total number of trading days in a year. Volatility values are usually expressed as a percentage, so the annual value is multiplied by 100. All volatility values for a given month are then averaged together to get a single monthly data point.

European Energy Industry Investments
PE 595.356 43
Figure 12: Price volatility of gas and electricity by month: Day-ahead contracts (UK)
Source: https://www.ofgem.gov.uk/chart/price-volatility-gas-and-electricity-month-day-ahead-contracts-gb
Regulation of wholesale or retail electricity prices is also a barrier for investments, in particular in demand response and storage.
3.1.4. Electricity market concentration and size High market concentration levels act as a barrier for investments, while a low market concentration or low competition intensity61 will have a positive impact. The size of the market also affects the willingness to invest. Figure 13 provides an overview of the size of the electricity markets and the market share of the largest generator in 2014 (% of total generation).
Figure 13: Market share of the largest generator in the electricity market in 2014 (%) and total installed capacity (GW) in 2014
Note: Data on market share not available for Bulgaria, the Netherlands, Austria and United Kingdom. Incomplete data for installed capacity for Hungary and Sweden
Source: Eurostat (ten00119 and nrg_113a)
61 Captured by the Herfindahl-Hirschman Index (HHI) or the Concentration Ratio (CR). The HHI is a measure of
the market share of individual firms in relation to the overall market size and an indicator of the level of competition among them. The CR is a measure of the total output produced in an industry by a given number of firms; the most common CR is CR3, which reflects the total market share of the three largest firms.

Policy Department A: Economic and Scientific Policy
44 PE 595.356
A high market concentration can efficiently be mitigated by market coupling. Markets’ integration also leads to a higher size of the relevant market and to lower price volatility, and is hence a positive factor in attracting investments in power generation capacity.
3.1.5. Availability and cost of primary fuel and suitable sites for electricity production Investment decisions in generation capacity are influenced by the expected net revenues, which can vary widely between MSs depending on the availability of suitable sites and primary energy for power generation (e.g. gas in the Netherlands, lignite in Germany, coal in Poland, hydro-energy in Scandinavia, etc.). In general, the availability at reasonable cost of primary energy for electricity production can be considered as a driver for investments in generation capacity, while the lack of suitable sites for production installations (e.g. onshore wind parks, conventional power plants) can in some cases represent a barrier for investments.
3.1.6. Reserve generation capacity margin versus peak load A high capacity reserve margin62 implies that there is no need for new production capacity, while a small or negative margin will act as a driver for investments in electricity generation assets and might also trigger investments in interconnection capacity.
At present, in most EU MSs the reserve capacity margin is high and, hence, is not triggering investments. In 2014, it was estimated that there was an overall overcapacity of at least 10 % which expected to maintain electricity prices at the same level for most of the rest of the decade.63
The current decommissioning of conventional power plants for political or economic reasons is, however, leading to lower reserve margins, and adequacy tensions may appear in the future. ENTSO-E’s Winter Outlook 2015-2016 showed a decrease in capacity from programmable units compared to the winter of 2014-2015 (-22.4 GW).64 While ENTSO-E concluded that most EU countries would have sufficient generation for the winter 2015-2016, several were expected to rely on imports, load reduction measures or the use of strategic reserves to cover their peak demand. TSOs estimate that the decreasing availability of non-RES units to balance the increase in RES in their networks is not sustainable in the medium to long term.65
Regional analysis by ENTSO-E66 shows that the number of countries relying on imports to maintain adequate capacity margins is expected to increase between 2016 and 2025, which illustrates the need for investments in generation and/or interconnection capacity. Although an insufficient reserve margin indicates the need for investments, it is only a minor driver in triggering investments.
62 The reserve margin indicator for a specific market is defined as the ratio between the total net available
generation capacity and the maximum level of electricity demand. In principle, the de-rated capacity should be used to take into account the specific capacity factor of each technology. The de-rated capacity reflects the proportion of an electricity source, which is likely to be technically available to generate at times of peak demand.
63 SWD (2014) 313: Investment Projects in Energy Infrastructure. 64 RES based capacity increased less (+18.6 GW), causing the total Net Generation Capacity to slightly decrease
(-3.8 GW). The effective decrease of the net available capacity is much higher as the capacity factor of conventional plants is 3 to 4 times higher than of RES.
65 ENTSO-E (2015), Winter Outlook 2015/2016 & Summer Review. 66 ENTSO-E (2015), Scenario Outlook & Adequacy Forecast.

European Energy Industry Investments
PE 595.356 45
3.2. Policy framework
3.2.1. Policy measures to support investments in RES and RD&I Support schemes are undoubtedly the most important driver for investments in RES. They limit the risk exposure of investors, and improve the profitability of projects. The German Renewable Energy Act (EEG) has e.g. led to high investments in RES technologies; also in the Iberian Peninsula national support measures have been a major driver for RES investments (see annexes 3 and 4).
Support for Research, Development and Innovation (RD&I) is a driver for investments in promising technologies, but inappropriate or unfocused support programs can negatively affect investments, e.g. if specific technologies are not eligible for support they are likely to develop at a slower pace. In this context, OECD suggests that current support policies would not be sufficiently focused to help immature green technologies achieve competitiveness against incumbent technologies.67
3.2.2. Carbon pricing and ETS Carbon pricing should in principle act as a driver for investments in low carbon technologies, but its impact on investment decisions is currently rather low. Several EU MSs (SE, FI, DK, IE, GB, SP, EE, LV, CZ and FR) have introduced carbon taxes on the consumption of fossil fuels in the building and transport sectors, to help stimulate low carbon energy use and investments on the demand side, but other policy instruments, e.g. building standards and fiscal/financial measures, are effective complementary initiatives to trigger investments.68
At the EU level, carbon pricing has been introduced via the ETS scheme. This instrument has however failed to deliver the right price signals to affect operational and investment decisions: today’s price levels for GHG emission allowances are too low to act as a driver to reduce the use of coal/lignite/oil and to switch to low carbon technologies.
Figure 14: ETS carbon price trend 2007–2015 (EUR/tonne CO2)
Source: WEF (2015), The Future of Electricity - Attracting investment to build tomorrow’s electricity sector
67 OECD (2015), Mobilising private investment in clean-energy infrastructure - what’s happening? 68 IEA (2011), Energy efficiency policy and carbon pricing.

Policy Department A: Economic and Scientific Policy
46 PE 595.356
3.2.3. Smart metering target The specific provision in the Third Energy Package on Smart Metering (see chapter 2) is an effective driver for investments in metering infrastructure and facilitates investments in demand response, energy efficiency and storage.
3.2.4. National capacity remuneration mechanisms Some MSs have introduced, or are considering, capacity remuneration mechanisms (CRM), in order to ensure that sufficient generating capacity is available at any moment to cover (peak) demand. The first objective of CRM is to keep existing conventional generating capacity available to the market and/or the system operator, but, depending on the design of the CRM scheme, it can also act as a driver for investments in new generation and storage capacity, and if end-users are eligible to participate in the CRM scheme, it can also incentivise investments in demand response. As illustrated on the map below most EU MS have opted for strategic reserves or capacity payments, that are only remunerating specific existing capacity and hence not triggering investments; only a few MS have implemented CRMs, in particular capacity auctions or requirements, that are driving investments in new capacity.
Figure 15: Capacity mechanisms in Europe in 2015
Source: ACER/CEER (2016), Annual Report on the Results of Monitoring the Internal Electricity Markets in 2015.
3.2.5. Energy efficiency targets and measures The 2012 Energy Efficiency Directive establishes a set of binding measures which are intended to help drive energy investments. Under this Directive, EU countries are required to implement measures to use energy more efficiently at all stages of the energy chain from its production to its final use. These measures can be considered as drivers for investments on the supply (especially CHP as investors are obliged to assess the feasibility of CHP for any large power generation project) and demand side (energy efficiency and demand response). For example, in the Iberian Peninsula, energy efficiency is now a key component of national

European Energy Industry Investments
PE 595.356 47
energy development/investment plans, and significant resources are currently allocated to this purpose (see annex 4). In Germany, support for investments in CHP and distribution networks for heat and cold is guaranteed through the CHP Act (KWK-G, see Annex 3).
3.2.6. Interconnection target & PCI The interconnection target (10 % and – proposed – 15 % of installed generation capacity by respectively 2020 and 2030) stimulates national authorities and TSOs to invest in interconnection capacity. As the interconnection target is not binding, it cannot be considered as a strong driver for investments. The Projects of Common Interest (PCI) approach (explained in section 4.1.1) is however an effective driver, as it improves the investment framework for interconnectors. The case study on the Baltic States (see annex 5) shows that the implementation of PCI has increased the interconnection level of the Baltic region with other EU-countries from around 4 % in 2010 to almost 23 % in 2015. In the Iberian Peninsula, where the interconnection level is still very low, PCI are included in national development plans, in order to foster investments in interconnection capacity (see case study in annex 4). Also in Germany, most PCI are defined as national priority before becoming PCI, but if projects without national priority are recognised as PCI, they get the same priority status.
3.2.7. Divergent and unstable national policies Divergences and frequent changes in national energy and fiscal policies (e.g. energy mix, transmission charges on generation, taxes or subsidies on primary fuels or assets for power generation) cause competition and market distortions and create an insecure environment for investors who require long-term stability.69 This was noted in the case study for the Iberian Peninsula (see annex 4), where the unstable policy framework in the region severely affected investments in the electricity sector.
A lack of harmonisation between policies also reduces the feasibility and attractiveness of cross-border grid investments.70 Uncoordinated support schemes for renewable energy or not harmonised CRMs across the EU can effectively drive specific types of investments in the concerned countries, but may represent a barrier for investments in neighbouring countries.
The (perceived) risk of changes in legislation and regulation is considered a major barrier for investments by market players and grid operators. Changes (sometimes with retroactive effect) affect the profitability and level of confidence of investors, who then require a risk premium or do not invest.71 Rating methodologies show that creditors consider regulatory risk as a major element in the financial rating of utilities. A regulatory regime which is perceived as uncertain will lead to a lower rating, which increases the cost of debt, and negatively affects the investment climate.72
69 CEPS (2016), Fostering investment in cross border energy infrastructure in Europe. Report of the High-Level
Group on Energy Infrastructure in Europe, and Friends of Europe (2015), Europe’s energy Union and the road to Paris and beyond.
70 CEPS (2016), Fostering investment in cross border energy infrastructure in Europe. Report of the High-Level Group on Energy Infrastructure in Europe; and Trinomics (2016), Energy Union: Key Decisions for the Realisation of a Fully Integrated Energy.
71 CEPS (2016), Fostering investment in cross border energy infrastructure in Europe. Report of the High-Level Group on Energy Infrastructure in Europe.
72 ENTSO-E (2014), Fostering Electricity transmission investments to achieve Europe´s energy goals: Towards a future-looking regulation.

Policy Department A: Economic and Scientific Policy
48 PE 595.356
3.3. Institutional aspects
3.3.1. Permitting procedure for new infrastructure The complexity and time needed to get a permit for energy investments is considered as a major barrier, both for generation assets and grid infrastructure. Permitting procedures can cause long delays and large administrative costs (including stranded costs), especially for cross-border projects.73 The time lag between an investment decision, based on market price signals or grid capacity needs, and its realisation is at present an obstacle. To this end, specific legal provisions apply for Projects of Common Interest (PCIs) which benefit from accelerated permit granting (see section 4.1.1).
3.3.2. Complexity of cross-border investments The administrative and regulatory complexity of cross-border investments is undoubtedly a major barrier. The high level of complexity is caused by different (not harmonised) national regulations and permitting procedures and by the fact that several investors, operators and authorities are involved. Discrepancy of costs and benefits between MSs in cross border projects, and the absence of a homogeneous implementation of cost-benefit allocation and analysis (CBA) also seems to be a barrier for cross-border investments. Stakeholders confirm that it is challenging to develop a common position with regard to the split of investments, costs and benefits in cross-border projects. The fact that each regulator may set a tariff scheme for the part of the line/cable in its territory also makes it difficult for investors to develop a business plan.74
3.4. Financial market and instruments
3.4.1. Cost of capital and access to public and private funding Most energy infrastructure projects are capital intensive with high upfront investment costs and the need for long-term funding. Conditions and costs for financing therefore affect investment decisions.
The global financial crisis has damaged investor confidence,75 limited the financing potential for electricity generation investments, and has also led to excess generating capacities and low margins.76 Often, utilities cannot finance projects due to the impact on their credit rating.77 New actors such as pension funds and other institutional investors are needed to co-finance energy investments.
The currently low cost of capital should be a driver for investments, but the low profitability and unfavourable balance sheet of most utilities is acting as a barrier.
For grid investments, equity financing ought to play a large role as a financing instrument together with corporate bonds and bank loans to optimally value the gearing potential. Pay-out optimisation could also be considered as an option to shape good financing conditions for
73 DG ENER (2015), Study on comparative review of investment conditions for electricity and gas Transmission
System Operators (TSOs) in the EU. 74 CEPS (2016), Fostering investment in cross border energy infrastructure in Europe. Report of the High-Level Group
on Energy Infrastructure in Europe. 75 Friends of Europe (2015), Europe’s energy Union and the road to Paris and beyond. 76 OECD/IEA (2012), Securing power during the transition. 77 OECD/IEA (2012), Securing power during the transition.

European Energy Industry Investments
PE 595.356 49
grid operators. However, reducing pay-out to finance investments could send a negative signal to the debt or equity market, suggesting that the grid operator is undercapitalised.78
Due to public support, which in general covers the full incremental cost, including the weighted average cost of capital (WACC), financing for RES is currently not a major issue.79
3.4.2. Risk perception and hedging Investments in demand response (DR) and most RES and other low-carbon technologies are relatively new, and are perceived as having a higher risk than investments in conventional technology.80 Risks will, in general, represent a barrier for investments and can be mitigated by regulation or hedging instruments, e.g. long term contracts, futures, options, etc.
Risks can be caused by uncertainties regarding future cost and revenue levels given the fast pace in technology development and the volatile prices of energy. Uncertainties can also emerge due to changes in remuneration of the capital invested over the lifetime of a grid asset.81 Additional uncertainties, linked to energy politics, conflicts of interest at borders and regulatory patterns can also hinder investments. Specific risks and uncertainties leading to cash flow volatility and variability are related to the fact that peak electricity prices depend on weather conditions and to the risks from fossil and carbon prices.82
Peak generating units have high market risks as they only operate for a small number of hours (peak demand), and are therefore especially sensitive to the price levels during these peak demand hours during which they provide energy or ancillary services. 83
The main risk for energy storage investments is economic. Several issues affect the value assessment of energy storage. 84 The compensation scheme is a key issue as storage can be both valued in the regulated part of the electricity market (ancillary services provided to TSOs/DSOs) and in the commercial market segment. Risk perception is also currently a barrier for investments in storage; although it can be mitigated by appropriate business models85 (e.g. by offering flexibility to both grid operators and market parties) and regulation.
3.5. Other aspects
3.5.1. Lack of public acceptance of new energy infrastructure Lack of public acceptance is a barrier for investments in overhead transmission and distribution lines (due to their significant impact on landscapes86) and some types of power generation installations. Insufficient public acceptance due to environmental concerns (e.g. if infrastructure is built in a natural area or close to populated areas87) can hinder or block
78 DG ENER (2015), Study on comparative review of investment conditions for electricity and gas Transmission
System Operators (TSOs) in the EU. 79 OECD/IEA (2012), Securing power during the transition. 80 Friends of Europe (2015), Europe’s Energy Union and the road to Paris and beyond. 81 CEPS (2016), Fostering investment in cross border energy infrastructure in Europe. Report of the High-Level
Group on Energy Infrastructure in Europe. 82 OECD/IEA (2012), Securing power during the transition. 83 OECD/IEA (2012), Securing power during the transition. 84 DG ENER (2013), Working paper: The future role and challenges of energy storage. 85 Different business models are identified, such as generation support, grid support and consumer support (behind-
the-meter). Details can be found in EY (2015), Renewable energy country attractiveness index; or Pöyry and Swanbarton (2014), Storage business models in the GB market; or Scott P. Burger MIT (2016), Business models for Distributed Energy Resources.
86 OECD/IEA (2012), Securing power during the transition. 87 Also known as the NIMBY concept (Not in my backyard).

Policy Department A: Economic and Scientific Policy
50 PE 595.356
the development of investment projects. Public acceptance of interconnectors may be an issue if the benefits are not significant for one of the concerned countries.88
3.5.2. Tariffs for connection and access to the transmission and distribution grid The level and structure of grid tariffs can represent a barrier or driver for investments, depending on the grid tariff and investment type. The following examples illustrate this impact:
• If grid tariffs are based on the Regulated Asset Base (RAB) and allow TSOs and DSOs to recover their investment costs, including a reasonable remuneration level for their equity capital providers, they will represent a driver for grid investments. The impact will however be different, depending on the regulation; some regulators offer the same return for all types of investments, while others offer a premium for certain types.89
• Capacity based grid charges on injection (currently applied in UK and Sweden) are a barrier for investments in generation and storage assets, notably for assets with a low load factor, such as peak plants and most RES installations.
• Storage investment decisions are highly affected by the grid charging rules; in some MSs storage facilities are exempt from grid charges while in others they are considered as both generators (for the power they supply) and end-users (when they take power from the grid), thus paying a double grid fee (supply and demand).
High grid charges improve the competitiveness of self-production versus grid supply, incentivising investments on the demand side (self-production, energy efficiency, DR). The type of grid tariff regulation (cost-plus, incentive based, revenue capped, RAB based90) and parameters used (remuneration of equity and debt gearing) will affect grid investment; the impact will differ depending on the national regulatory approach.91
88 CEPS (2016), Fostering investment in cross border energy infrastructure in Europe. Report of the High-Level
Group on Energy Infrastructure in Europe. 89 EY (2013), Mapping power and utilities regulation in Europe. 90 In a RAB (Regulated Asset Base model) regulatory scheme, the authorised revenue for a grid operator =
authorised operational expenses + regulated return on accounting value of fixed assets (RAB) + depreciation. 91 EY (2013), Mapping power and utilities regulation in Europe.

European Energy Industry Investments
PE 595.356 51
OVERVIEW OF THE EU INVESTMENT FRAMEWORK
KEY FINDINGS
At EU level, there are several policies and instruments in place to support investments in energy infrastructure, particularly low carbon power production technologies and transmission infrastructure of pan-European interest.
Besides the 2020 and 2030 Climate and Energy Framework, the EU has set-up the Trans-European Energy Networks Regulation (TEN-E) and the framework for Projects of Common Interest (PCI). Several funds are also providing, among others, grants, loans, guarantees, equity and other risk-bearing mechanisms. The main fund providers for electricity investments are the Connecting Europe Facility (CEF),the European Fund for Strategic Investments (EFSI), the European Investment Bank (EIB), along with several others focused on innovation and low carbon technologies (such as Horizon 2020).
The overall EU budget available to co-finance electricity investments is rather small, and its added value and additionality are difficult to quantify. However, our case studies on the Baltic and Iberian regions clearly show that EU co-funding of electricity interconnectors is a key element for their effective realisation.
4.1. EU Policies The main regulations and directives that have a direct or indirect impact on energy investments are presented below. Investments are at present strongly affected by the 2020 Climate and Energy Package, while future investment plans will be developed in the context of the new 2030 Climate and Energy Framework, which has been set in line with the objectives of the 2050 Energy Roadmap. This Framework also emphasises the need for EU MSs to develop their own policy frameworks to facilitate the implementation of interconnectors, storage and smart grids.
In addition, three key legislative Energy Packages were adopted between 1996 and 2009 in order to realise an EU wide internal electricity (and gas) market. The Third Energy Package, adopted in 2009, established the Agency for the Cooperation of Energy Regulators (ACER) 92 and focused on unbundling93 and third party access94.
Regulation 714/200995, part of the Third Energy Package, indirectly supports cross-border investments via the Inter-TSO compensation (ITC) mechanism (art. 13).96 Regulation EC 838/2010 further specifies this ITC mechanism.
Directive 2009/72 and Regulation 714/2009 mandate ENTSO-E to produce a non-binding EU wide ten-year network development plan (TYNDP) every two years. There is no EU level legal provision that obliges national authorities and/or grid operators to establish development or investment plans at national level.
92 Regulation 713/2009 establishing an Agency for the Cooperation of Energy Regulators. 93 Unbundling means that energy supply and generation activities are effectively separated from distribution and
transmission activities. 94 Third party access implies that any market party (generator, supplier, end-user, etc.) that asks for a connection
and/or access to the grid should have this right based on objective, transparent and non-discriminatory conditions and tariffs.
95 Regulation 714/2009 on conditions for access to the network for cross-border exchanges in electricity. 96 ITC is a multiparty agreement between ENTSO-E member countries to compensate TSOs for costs associated
with losses resulting with hosting transits flows on networks and for the costs of hosting those flows.

Policy Department A: Economic and Scientific Policy
52 PE 595.356
4.1.1. Trans-European Energy Networks Regulation and Projects of Common Interest (PCI)
The Trans-European Energy Networks (TEN-E) regulation97 identifies priority corridors and provides guidelines for the selection of Projects of Common Interest (PCIs) as described below.
a. Priority Corridors and Thematic Areas
The TEN-E regulation identifies four priority electricity corridors which require “urgent infrastructure development in order to connect EU countries currently isolated from European energy markets, strengthen existing cross-border interconnections, and help integrate renewable energy.” The same regulation provides the following priority thematic areas for energy grid infrastructure which are relevant to all MSs:
• Smart grids deployment to efficiently integrate end users in the electricity system, in particular via distributed generation and demand response.
• Electricity highways, in view of supporting a system that is capable of accommodating increasing RES, connecting RES hubs with storage capacities and demand centers, and coping with an increasingly variable and decentralised electricity supply and flexible electricity demand.
• Cross-border carbon dioxide network in view of the deployment of carbon dioxide capture and storage.
The table below shows the estimated investment needs, the expected investment gaps98 and approximate co-financing that is needed to enable the realisation of the electricity priority corridors.
97 Regulation 347/2013 on guidelines for trans-European energy infrastructure. 98 The ‘investment gap’ refers to the difference between what will be funded in a ‘business as usual’ scenario and
the overall investment required. (E3G, 2014).

European Energy Industry Investments
PE 595.356 53
Table 9: Electricity priority corridors and related investment needs up to 2020
Corridor Description MSs
Inve
stm
ent
nee
d
(bil
lion
EU
R)
Inve
stm
ent
gap
(b
illio
n E
UR
)
Co
-fin
anci
ng
rat
io
nee
d (
%)
Like
ly n
eed
fo
r p
ub
lic
fun
din
g
(bil
lion
EU
R)
Northern Seas offshore grid (NSOG)
Integrated offshore electricity grid development and interconnectors in the North Sea, Irish Sea, English Channel, Baltic Sea and neighbouring waters to transport electricity from offshore RES to centres of consumption and storage and to increase cross-border electricity exchange.
BE, DK, FR, DE, IE, LU, NL, SE, UK
30 8 10 % 0.80
North-South electricity interconnections in Western Europe (NSI West Electricity)
Interconnections with the Mediterranean area including the Iberian Peninsula, notably to integrate electricity from RES and reinforce internal grid infrastructures to foster market integration in the region.
AT, BE, FR, DE, IE, IT, LU, NL, MT, PT, ES, UK
30 5 10 % 0.50
North-South electricity interconnections in Central Eastern and South Eastern Europe (NSI East Electricity)
Interconnections and internal lines in North-South and East-West directions to complete the internal market and integrate RES generation.
AT, BG, HR, CZ, CY, DE, GR, HU, IT, PL, RO, SK, SI
40 12 20 % 2.40
Baltic Energy Market Interconnection Plan in electricity (BEMIP Electricity)
Interconnections in the Baltic region and reinforcements of internal grid infrastructure, to reduce their isolation, foster market integration and facilitate integration of RES.
DK, EE, FI, DE, LV, LT, PL, SE
5 3 50 %
1.50
Source: Prepared by Trinomics based on Regulation 347/2013 on guidelines for trans-European energy infrastructure and EC’s "Connecting Europe - The Energy Infrastructure for Tomorrow".

Policy Department A: Economic and Scientific Policy
54 PE 595.356
b. Projects of Common Interest
The TEN-E regulation provides guidelines for the selection of Projects of Common Interest (PCI) to speed-up the development of a pan-EU electricity (and gas) infrastructure. The list of PCI is updated every two years and the latest update was finalised in November 2015.99
Box 4: Projects of Common Interest
To be classified as a PCI, a project must:
• Be necessary for at least one priority corridor or area.
• Have significant impact on the energy markets of at least two EU countries.100
• Have potential benefits that outweigh its costs.
A PCI should also enhance security of supply by allowing countries to source energy from more sources, contribute to the energy and climate goals (e.g. by integrating RES into the grid) and increase competition by offering alternatives to consumers.101
PCI can benefit from:
• financial support from the Connecting Europe Facility (CEF)102,
• accelerated licensing by having a single national authority acting as a one-stop-shop for permitting procedures in each concerned country, including a binding time limit of 3.5 years for granting a permit,
• improved regulatory conditions and cost-allocation,
• lower administrative costs thanks to more streamlined environmental assessment procedures,
• increased transparency, public participation, visibility and attractiveness for investors.
The agreed PCI should help MSs to meet their 10 % interconnection target by 2020.
Accelerated licencing procedures are a crucial point that strongly contributes to the success of PCIs as an EU tool according to the case study on the Baltic countries presented in annex 5.
c. Critical PCI to ensure security of supply
Annex 2 of the EU Energy Security Strategy103 identifies 6 electricity projects and 27 gas projects (most of which have a PCI status) as critical for the EU’s energy supply security, since their implementation will enhance diversification of supply and solidarity in the most
99 C(2015) 8052 regarding the European Union list of projects of common interest. 100 By directly crossing the border of two or more MSs, be located on the territory of one MS and have significant
cross-border impact or cross the border of at least one MS and a EEA country. 101 CEPS (2016), Fostering investment in cross border energy infrastructure in Europe. Report of the High-Level
Group on Energy Infrastructure in Europe. 102 PCIs that have significant external benefits and prove not to be economically viable under the existing regulatory
framework and market conditions may profit from grants for studies, and also, under certain conditions, from grants for works and innovative financial instruments under CEF. Source: SWD (2014) 313: Investment Projects in Energy Infrastructure.
103 COM (2014) 330: European Energy Security Strategy.

European Energy Industry Investments
PE 595.356 55
vulnerable parts of Europe. These are mainly large scale projects, inherently complex and prone to delays.104
These projects will have a special focus within the CEF. The EC also aims to increase support “by bringing together the project promoters to discuss technical possibilities to speed up project implementation and NRAs to agree on cross-border cost allocation and financing as well as the relevant Ministries to ensure strong political support”.105
Strong political support as well as the advantages provided to a project by the status of PCI were found to be important drivers for interconnection investments in the Baltic States (see case study in annex 5). Thanks to this coordinated approach, the formerly poorly interconnected Baltic region (interconnection level of only 4 % in 2010) is now very well interconnected (almost 23 % in 2015) with other EU countries.
4.1.2. Notification of energy infrastructure investment projects Regulation 256/2014106 requires MSs to inform the EC of investment projects in energy infrastructure for which construction work is scheduled to start within five years and projects which are to be decommissioned within three years.107 The Commission is required to produce a report every two years which gives an assessment of the evolution and perspectives of the energy system in order to identify potential gaps between demand and supply, and to identify investment barriers and promote best practices to address them.
The 2014 report noted that the MS notifications “were often incomplete and the data input provided was limited” and that “Generation projects with renewables, particularly solar and wind energy are substantially underreported in the notifications due to a minimum project size threshold in the Regulation below which a project does not have to be notified.”108 The low quality of the reporting on investment/divestment plans is also partly due to the unstable economic and regulatory framework; operators often change their plans to take into account the latest market and policy developments. A review of this regulation is necessary to enhance its effectiveness. It was foreseen that the Commission would review its implementation by 31 December 2016, but results of this review are not available at the time of finalising this study.
4.1.3. Promotion of the use of RES Directive 2009/28/EC109 provides the overall EU framework for stimulating RES investments. It sets the 2020 RES targets and the obligation for MSs to establish National Renewable Energy Action Plans. It also highlights the need for MSs to develop adequate transmission and distribution grid infrastructure, intelligent networks, storage facilities and a flexible electricity system in order to allow the secure operation of the electricity system and accommodate increasing RES. This legal framework has proven to be very effective in stimulating the deployment of RES. Its cost efficiency and impact on system and supply security are however criticised due to the existence of diverging national schemes and the lack of adequate accompanying measures to avoid competition and market distortions.
104 SWD (2014) 314: Implementation of TEN-E, EEPR and PCI Projects. 105 SWD (2014) 314: Implementation of TEN-E, EEPR and PCI Projects. 106 Regulation 256/2014 concerning the notification to the Commission of investment projects in energy
infrastructure within the EU. 107 This includes projects in oil (refining, transport and storage); gas (transmission, LNG terminals and storage);
electricity (generation and transmission); biofuels (production); and carbon capture and storage (transport and storage).
108 SWD (2014) 313: Investment Projects in Energy Infrastructure. 109 Directive 2009/28/EC on the promotion of the use of energy from renewable sources.
Policy Department A: Economic and Scientific Policy
56 PE 595.356
4.1.4. EU Emissions Trading System (ETS) Directive 2003/87/EC110 established the EU ETS, a market based emission allowances scheme which regulates about 45 % of the EU’s GHG emissions based on a global cap and trade principle. The system, active in 31 countries (EU28, Iceland, Lichtenstein and Norway), works by limiting the overall emissions from large industrial and power and heat generation installations and aviation, and by reducing this global cap each year. Within this limit, companies can buy and sell emission allowances as needed.
The ETS entered its third phase in 2013. Since that year, the overall cap on emissions from ETS installations has been reduced by 1.74 % annually, and power generators no longer get free allowances, except in some Eastern European Member States (Art.10). Currently, revenues from ETS allowances are used to fund the NER300 (see section 4.2.5). The proposal for the revised EU ETS Directive aims for low income countries to retain their eligibility for support from the (proposed) Modernisation Fund to renovate their energy systems111.
The latest report on the functioning of the European carbon market112 acknowledges that the economic/financial crisis has led to a surplus of more than two billion allowances, and consequently a (too) low EUA113 price, which is too low to trigger investments in low carbon technologies. In order to address this oversupply and increase the carbon price level, a backloading of allowances and the implementation of a market stability reserve have been put in place. These measures will probably be insufficient to raise the carbon price to a level that incentivises investments in low carbon technology. The implementation of a carbon price floor at EU level could be considered as a more effective measure to address this problem.
4.2. EU Funding Mechanisms This section focuses on current EU mechanisms available to co-fund energy infrastructure projects.114
4.2.1. European Fund for Strategic Investments (EFSI)115 EFSI is a joint EC and EIB initiative aimed at closing the investment financing gap by mobilising private financing for strategic investments. The EFSI fund uses a EUR 16 billion guarantee from the EU budget and a EUR 5 billion allocation from the EIB’s own capital. It should unlock EUR 315 billion in public and private investments over a three-year period (2015-2018) via its two components:
• Infrastructure and Innovation Window, deployed through the EIB, and
• SME Window, implemented through the European Investment Fund (EIF).
To be eligible to benefit from the EU guarantee, set by Regulation 2015/1017, investment projects must be technically and economically viable, be consistent with EU policies, provide additionality, and maximise where possible the mobilisation of private sector capital.
110 Directive 2003/87/EC establishing a scheme for greenhouse gas emission allowance trading. 111 The Modernisation Fund would support ten lower income Member States in meeting their high investment needs
relating to energy efficiency and the modernisation of their energy system. Between 2021 and 2030, 2 % of the allowances, would be set aside to finance the fund. The eligible countries are: BG, HR, CZ, EE, HU, LV, LT, PL, RO and SK. Source: COM (2015) 0337.
112 COM (2015) 576: Report on the functioning of the European carbon market. 113 EU Allowance Unit of one tonne of CO2. 114 The chapter does not include previous funding opportunities such as TEN-E or EEPR. Additional information on
these programmes is available in SWD (2014) 314: Implementation of TEN-E, EEPR and PCI Projects. 115 Regulation 2015/1017 on the European Fund for Strategic Investments, the European Investment Advisory Hub
and the European Investment Project Portal.

European Energy Industry Investments
PE 595.356 57
After one year of implementation, as of mid-October 2016116, the EFSI project list included 25 signed and 24 approved energy projects, plus two pre-approved projects. According to the EIB’s website117, EFSI has approved financing for 24.8 billion EUR, related to a total investment of EUR 138.3 billion (44 % of its EUR 315 billion goal). 21 % of the EFSI investment financing was dedicated to the energy sector. Given the success so far, the Commission is committed to doubling the EFSI in terms of duration and financial capacity and to focus on financing more cross-border and sustainable projects.118
4.2.2. European Structural and Investment Funds (ESIF), including in particular the European Regional Development Fund (ERDF) and the Cohesion Fund (CF)
The European Structural and Investment Funds (ESIF) have a budget of 454 billion Euros for the 2014-2020 period for investments under the five structural and investment funds119, which also aim to leverage funding from other investors. From the five ESIF120, the European Regional Development Fund and the Cohesion Fund are key for energy projects.
Investments in energy infrastructure are at present not a priority of the ESIF; they represent about 0.5 % of the total allocation of the ERDF, CF and ESF allocations both in the period of 2007 to 2013 and 2014 to 2020.121
The ERDF is allowed to support investments in infrastructure for smart energy distribution, storage and transmission systems for both electricity and gas, especially in less developed regions.122 In more developed regions, 20 % of ERDF funds must be channelled towards the low-carbon economy, while in transition and less developed regions, this figure is 15 % and 12 % respectively.
Under the CF, funding is allocated in the 2014-2020 period to support projects in 15 low income MS in infrastructure and trans-European transport and networks, as well as the environment, energy efficiency, and renewable energy.
Financial instruments (FI) of ERDF were not successful in attracting private finance during the 2007-2013 cycle and most were not successful in providing revolving financial support.123 Their management costs were also considered to be high. Several FI in a number of Member States did not utilise all of the capital available to them from the operational programme budgets, with 43 % on average left undisbursed. Improvements have been made for the 2014-2020 ESIF programme: Mandatory ex-ante assessments have been introduced in order to prevent excessive endowments, which can consequently help increase a revolving effect, and ceilings on management costs have been lowered. However, certain issues remain, most notably the challenge of leveraging private investments.
116 http://www.eib.org/efsi/efsi-projects/index.htm?c=&se=3. 117 http://www.eib.org/efsi/efsi_dashboard_en.jpg accessed 14/10/2016. 118 EC Press release (14 September 2016), State of the Union 2016: Strengthening European Investments for jobs
and growth. 119 Regulation (EU) No 1303/2013. 120 The five coordinated funds under ESIF are: European Regional Development Fund (ERDF); European Social Fund
(ESF); Cohesion Fund (CF); European Agricultural Fund for Rural Development (EAFRD); and European Maritime & Fisheries Fund (EMFF).
121 European Court of Auditors (2015), Improving the security of energy supply by developing the internal market: more efforts needed.
122 SWD (2014) 313: Investment Projects in Energy Infrastructure. 123 Court of Auditors (2016) Implementing the EU budget through financial instruments – lessons to be learnt from
the 2007-2013 programme period.
Policy Department A: Economic and Scientific Policy
58 PE 595.356
4.2.3. Connecting Europe Facility (CEF) CEF is a funding mechanism aiming to support the development of cross-border infrastructure introduced by the EC’s growth package for integrated European infrastructure124. Its total budget for 2014-2020 was initially EUR 33.2 billion but this total was later reduced to EUR 30.4 billion due to the implementation of EFSI. EUR 5.35 billion of the CEF is allocated to energy projects (EUR 4.7 billion to be allocated through grants managed by the INEA125), EUR 24 billion to transport and EUR 1 billion to telecommunications.126 In the energy sector the agreed priorities include:
• Promoting the integration of the internal energy market and the interoperability of energy networks across borders;
• Enhancing security of energy supply; and
• Contributing to the integration of RES into the transmission network and to the development of smart energy networks and carbon dioxide networks.127
CEF aims to act as a catalyst and leverage funding from private and public investors by “giving infrastructure projects credibility and lowering their risk profiles”.128 In particular, CEF provides financial support to PCI projects with positive externalities “that transcend the mere project and can therefore not be financed completely by the market”.129
CEF can make a difference by targeting the most critical projects and working together with other efforts such as the regulators financing part of the infrastructure via network tariffs and the use of ESIF funds.130 PCIs that are critical from a security of supply point of view have a special focus and can benefit from a higher support.131 The CEF regulation132 stipulates indeed that the amount of Union financial assistance shall not exceed 50 % of the eligible cost of studies and/or works, but can rise to 75 % for investments which “provide a high degree of regional or Union-wide security of supply, strengthen the solidarity of the Union or comprise highly innovative solution”.
In 2015 and 2016, 64 grant agreements contributing to 61 PCIs were signed for a total amount of EUR 733 million (see details in Figure 16).133 The EP assessed CEF in early 2016.134 Further, a mid-term evaluation by the Commission is scheduled for 2017.135
According to the EP study, it is too early to conclude whether CEF is actually attracting and facilitating private funding (insurance companies and pension funds). However, stakeholder perception seems to be that CEF is insufficient, and this is exacerbated by budget cuts to support EFSI. CEF only covers 2.7 % of the trans-European energy infrastructure investment
124 COM (2011) 0676: A growth package for integrated European infrastructures. 125 Innovation and Networks Executive Agency. 126 EP (2016), Assessment of Connecting Europe Facility; E3G (2014), Energy Security and the Connecting Europe
Facility: Maximising public value for public money and SWD (2014) 313: Investment Projects in Energy Infrastructure.
127 E3G (2014), Energy Security and the Connecting Europe Facility: Maximising public value for public money. 128 SWD (2014) 314: Implementation of TEN-E, EEPR and PCI Projects. 129 SWD (2014) 313: Investment Projects in Energy Infrastructure. 130 SWD (2014) 314: Implementation of TEN-E, EEPR and PCI Projects. 131 SWD (2014) 314: Implementation of TEN-E, EEPR and PCI Projects. 132 Regulation (EU) 1316/2013 establishing the Connecting Europe Facility. 133 INEA (2016), Connecting Europe Facility -Energy. Supported actions - update May 2016. The electricity actions
can be found here: https://ec.europa.eu/inea/en/connecting-europe-facility/cef-energy/projects-by-sector/electricity.
134 EP (2016), Assessment of Connecting Europe Facility (http://www.europarl.europa.eu/RegData/etudes/IDAN/2016/572677/IPOL_IDA(2016)572677_EN.pdf).
135 Regulation 1316/2013 establishing the Connecting Europe Facility.

European Energy Industry Investments
PE 595.356 59
needs up to 2020 (estimated at EUR 200 billion), which led to the rejection of high-quality applications.136 Stakeholder feedback proposed additional efforts on promoting public-private partnerships to complement CEF funding. The EP study also suggests investment needs might have been underestimated.137
Figure 16: Actions financed by the Connecting Europe Facility – Energy. Grant agreements up to May 2016
Source: Adapted from INEA (2016), Connecting Europe Facility -Energy. Supported actions - update May 2016.
The annual CEF budget available to grant financial support to electricity and gas PCIs amounts to EUR 0.75 trillion, while the investment needs just for electricity transmission and interconnection lines range from EUR 8 to 15.9 trillion per annum (see chapter 2). It thus appears that the current CEF budget would not be sufficient to co-finance all eligible projects. In this context, the Commission is assessing whether additional financing resources, e.g. from congestion income at the borders, could be transferred to the CEF budget.138
However, although CEF support is in principle available to all PCI, ACER reported that access to CEF funding does not seem to be a priority for project promoters and that the likelihood of many PCI requesting CEF support for projects in 2016/2017 is low. As a point of reference, only around 30 % of the electricity PCI applied for CEF support in the past.139
Other funding for PCI
75 % of the PCI do not receive financial support from funding programmes other than CEF.140 22 PCIs reported having received EUR 419 million support in total.141
136 EP (2016), Assessment of Connecting Europe Facility
(http://www.europarl.europa.eu/RegData/etudes/IDAN/2016/572677/IPOL_IDA(2016)572677_EN.pdf). 137 EP (2016), Assessment of Connecting Europe Facility
(http://www.europarl.europa.eu/RegData/etudes/IDAN/2016/572677/IPOL_IDA(2016)572677_EN.pdf). 138 Information obtained from bilateral communications with DG ENER. 139 ACER (2016), Consolidated report on the progress of electricity and gas projects of common interest for the year
2015. 140 ACER (2016), Consolidated report on the progress of electricity and gas projects of common interest for the year
2015. 141 ACER (2016), Consolidated report on the progress of electricity and gas projects of common interest for the year
2015.

Policy Department A: Economic and Scientific Policy
60 PE 595.356
Figure 17: Total funds received, other than CEF (M Euro)
Source: Prepared by Trinomics based on ACER (2016), Consolidated report on the progress of electricity and gas projects of common interest for the year 2015. Note that the total from adding the different components is not aligned with the total reported by ACER of EUR 419 million. It seems that the EUR 5.2 million difference corresponds to national funds and EFSI, though no breakdown is provided.
4.2.4. Research and development - Horizon 2020 The European Commission published its Communication on the Strategic Energy Technology Plan (SET-Plan) in September 2015; it defines four strategic priorities: renewable technologies, empowering consumers with a smarter energy system, energy efficiency and other low carbon technologies (CCS and nuclear) and 10 actions to achieve these priorities through a more result-oriented approach, a new SET-Plan management (governance) and smart financing.
Horizon 2020 is the successor to Framework Programme 7 (FP7); it also continues parts of the Intelligent Energy Europe (IEE) programme, the Project Development Assistance Programme (PDA) and other energy-relevant parts of the Competitiveness and Innovation Programme (CIP). It is divided into seven sections: excellent science, industrial leadership, tackling societal challenges, spreading excellence and widening participation, science with and for society, cross-cutting activities, the fast track to innovation pilot, the European Institute of Innovation and Technology, and Euratom142.
Regarding energy investments, the most relevant section is “tackling societal challenges,” which includes seven key challenges, in particular the third challenge "Secure, Clean and Efficient Energy". A budget of EUR 5.9 billion has been allocated to this challenge for the period 2014-2020.143 The first work programme (2014-2015) in this challenge area had three focus areas, while the second work programme (2016-2017) had two but with a much greater focus on renewable energy technologies. Further details are presented in the table below.
142 https://ec.europa.eu/programmes/horizon2020/h2020-sections. 143 http://ec.europa.eu/research/horizon2020/pdf/press/fact_sheet_on_horizon2020_budget.pdf.

European Energy Industry Investments
PE 595.356 61
Table 10: Budget and activities for the Horizon 2020 Work Programmes on the challenge “Secure, Clean and Efficient Energy”
Name of Call WP 2014-2015 WP 2016-2017
Energy Efficiency
- Buildings and consumers - Heating and cooling - Industry and products - Finance for sustainable energy
- Buildings - Engaging consumers towards sustainable
energy - Heating and cooling - Industry, services, and products - Innovative financing for energy efficiency
investments
Competitive Low-Carbon Energy
- RES based electricity and heating/cooling
- Modernising the European electricity grid
- Enhanced energy storage technologies
- Develop European energy research area
- Social, environmental, and economic aspects of the energy system
- Cross-cutting issues
- Integrated EU energy system - Next generation & innovative RES
technologies (incl. demonstration) - RES market uptake - Fostering international cooperation in RES - Enabling decarbonisation of the use of
fossil fuels during the transition - Social, economic, and human aspects of
the energy system - Development of a European research area
in the field of energy - Cross-cutting issues
Smart Cities and Communities
- Enhancing the roll-out of Smart Cities and Communities solutions by stimulating the market demand
NA
Total budget EUR 1 310.9 million EUR 1 373.3 million
Source: Horizon 2020 WP 2014 – 2015 (10. Secure, clean and efficient energy, Revised) and WP 2016 – 2017 (10. Secure, clean and efficient energy)
Horizon 2020 will be evaluated based on different indicators. One key performance indicator specifically refers to energy: it monitors the share of the funds under the Societal Challenge “Secure, Clean and Efficient Energy” that is allocated to research activities related to RES, end user energy efficiency, smart grids and energy storage. The target is to allocate 85 % of the energy funds (equivalent to just above EUR 5 billion) to these four priorities by 2020.144
Moreover, the EC has jointly put in place with the EIB group a fund called “InnovFin – EU Finance for Innovators”. InnovFin consists of integrated and complementary financing tools and advisory services offered by the EIB Group, covering the entire value chain of research and innovation. All H2020 sectors are eligible under InnovFin. By 2020, InnovFin is expected to make over EUR 24bn of debt and equity financing available to innovative companies to support EUR 48bn of final R&I investments.145 Within the framework of InnovFin “InnovFin Energy Demo Projects” enables the EIB to finance innovative first-of-a-kind demonstration projects in the fields of renewable energy, sustainable hydrogen and fuel cells.
144 EC (2015), Horizon 2020 Indicators – Assessing the results and impact of Horizon. 145 http://www.eib.org/products/blending/innovfin/.

Policy Department A: Economic and Scientific Policy
62 PE 595.356
4.2.5. New Entrants Emission Allowances Reserve (NER300) Another European initiative to catalyse innovation and implementation of low-carbon technologies is the New Entrants Reserve (NER300) programme.146 The NER300 programme is a Community wide funding programme for commercial projects to demonstrate innovative technologies for CCS and RES. It was funded through the sale of 300 million emission allowances (about EUR 2.1 billion) under the EU’s Emission Trading Scheme (ETS). It was implemented with the support of the European Investment Bank (EIB) and awarded EUR 2.1 billion to 38 innovative renewable energy and one CCS project in 20 Member States.147 The renewable technology areas with the largest number of awarded projects were bioenergy and wind as shown in Table 11.
Table 11: Number of projects and funds awarded under each category
Category 1st call (2011) 2nd call (2013) Total
funding (M EUR) Submitted Awarded Submitted Awarded
Advanced bioenergy 24 7 10 6 905.8
Concentrated solar power 9 3 3 2 233.4
Photovoltaic 4 0 3 1 8
Geothermal 3 1 4 2 70.9
Wind 15 6 3 2 340.5
Ocean 8 2 5 3 142
Distributed renewable management (smart grids)
3 1 3 2 104.2
CCS 13 0 1 1 300
Total 79 20 32 19 2 104.9 Source: Adapted from SWD (2015) 135
The NER300 funding of EUR 2.1 billion has mobilised another EUR 700 million from public sources and leveraged EUR 2.7 billion from private sources. An additional EUR 3.1 billion is expected in additional benefits (net present value) over the first five years of operation. This initiative is hence considered as efficient, also given that it has not distorted the carbon market.
The establishment of an Innovation Fund (or NER400), as the continuation to NER300, has been proposed in the review process of the ETS.148 If a similar program is launched a further administrative simplification should be considered. Additional streamlining of knowledge sharing requirements could also facilitate project implementation. Suggestions are to simplify
146 Established under article 10a(8) of Directive 2009/29/EC which states that ‘up to 300 million allowances in the
new entrants’ reserve shall be available until 31 December 2015’ to help encourage the construction and operation of CCS as well as innovative renewable energy technologies in the EU. The funding programme was implemented through the NER300 Decision (2010/670/EU) in 2010.
147 SWD (2015) 135: Impact Assessment accompanying the proposal for a Directive amending Directive 2003/87/EC to enhance cost-effective emission reductions and low-carbon investments.
148 SWD (2015) 135: Impact Assessment accompanying the proposal for a Directive amending Directive 2003/87/EC to enhance cost-effective emission reductions and low-carbon investments.

European Energy Industry Investments
PE 595.356 63
the knowledge sharing exercise and to implement it more efficiently via conferences and social media instead of reports to the EC to encourage exchange of information between projects and with the wider public.149
4.2.6. European Energy Programme for Recovery (EEPR) The EEPR was set up in 2009 with a budget of EUR 3.98 billion. By the end of 2015 it had supported 44 gas and electricity infrastructure projects (12 of which were electricity), 9 offshore wind projects, and 6 carbon capture and storage projects. 34 projects were completed and EUR 1.86 billion had been paid to beneficiaries by June 2015 (of which EUR 1.1 went to interconnector projects).150
The European Energy Efficiency Fund (EEE-F) offers several financial instruments for energy efficiency investments made by local, regional, and national authorities and was also launched under the EEPR.
4.3. Overview of main EU funding mechanisms An overview of the main EU funding mechanisms for electricity infrastructure is presented in Table 12. Additional instruments such as the Private Financing for Energy Efficiency instrument (PF4EE, funded by LIFE151) and the European Energy Efficiency Fund (EEE-F, co-financed by EEPR152) are not included given the difference in scope and challenges when comparing energy efficiency and infrastructure investments.
We can conclude that several instruments are available at EU level to grant financial funding (equity capital, senior and junior debts or grants) or guarantees to energy infrastructure investments. These programmes facilitate access to funding, enhance the leverage potential and/or reduce the risk exposure leading to lower capital costs. Instruments such as NER300 and Horizon 2020 successfully focus on research, development and innovation, while the Connecting Europe Facility is especially targeted towards projects of common interest and contributes directly to the investments needed in transmission grids.
The European added value and additionality of these funds are difficult to quantify. However, the case studies on the Baltic and Iberian regions (see annexes 4 and 5) clearly show that EU financial support to electricity transmission projects of supra-national interest is a key element for their effective realisation.
The effectiveness of these instruments could be further enhanced by avoiding overlaps between EU programs and promoting stronger interactions between investment projects.153 The access of new entrants and small players to these European instruments should also be facilitated.
The overview presented in Table 12 shows that approximately EUR 1.5 billion are available annually in grants, and EUR 12.5 billion in financial instruments (loans, guarantees, equity, etc.) for energy related projects. Note that this scope is much broader than that covered by the investment needs described in chapter 2.3. According to our findings, the investments in
149 SWD (2015) 135: Impact Assessment accompanying the proposal for a Directive amending Directive 2003/87/EC
to enhance cost-effective emission reductions and low-carbon investments. 150 COM (2015) 484: On the implementation of the European Energy Programme for Recovery and the European
Energy Efficiency Fund. 151 Programme for the Environment and Climate Action – Decision 2014/203/EU. 152 The EEE-F has a budget of €265 million, including funds from the EU & EIB (Among others). It provides different
financial instruments (senior and junior loans, guarantees, or equity participation) supported by grants for technical assistance and awareness raising.
153 The effectiveness of e.g. interconnection investments is affected by the realisation of other cross-border or domestic grid projects.

Policy Department A: Economic and Scientific Policy
64 PE 595.356
electricity generation required to reach the energy and climate targets range from EUR 54 to 80 billion annually in 2021-2050; while investment needs in grids are estimated at EUR 40-62 billion/year. This would imply that the current EU funds available for all energy projects amount to 10 % to 15 % of the annual investment needs for electricity only. An increase of the available budget (of, among others, CEF) might hence be appropriate to facilitate and accelerate the transition to a low carbon energy supply. On the basis of our case studies154 and interviews, it appears that the EU funding instruments effectively offer added value, in particular when the market alone does not deliver the required investments; in that case, public budget can leverage private funding and contribute to realising interconnections and other infrastructure of supra-national interest.
154 In the Baltic region, EU financial support to PCI is considered an important element for the implementation of
the projects. For most of the Baltic PCI EU funding support is above 40 % of the investment costs (see case study in annex 5).

European Energy Industry Investments
PE 595.356 65
Table 12: Overview of main EU funding mechanisms for electricity infrastructure
Funding programme Funding period
Available EU budget
Approximate Annual Budget for Energy
Budget spent Financial Instruments (FI) and/or grants
Eligible projects
European Fund for Strategic Investment (EFSI)
2015-2018
EUR 16 billion EU guarantee and EUR 5 billion EIB capital
EUR 5 billion (FI, based on 2015/16)
EUR 5.21 billion approved financing, corresponding to 22% of total (spending on energy up to 10/2016)
FI (long term debt, subordinated debt, equity). Leverage effect 1:15
Infrastructure, research and innovation, education, renewable energy and energy efficiency
European Structural and Investment Funds (ESIF)
2014-2020 EUR 454 billion - - Grants & FI (loans,
guarantees, equity)
Innovation, ICT, SME competitiveness, low carbon economy
- European Regional Development Fund (ERDF)
2014 - 2020 EUR 196 billion No split available No details available Grants & FI
Innovation, ICT, SME competitiveness, low carbon economy
- Cohesion Fund (CF) 2014 - 2020
EUR 63.4 billion (of which EUR 10 billion to CEF - transport)
No split available No details available Grants & FI Sustainable economic development, including energy
- Connecting Europe Facility (CEF) - co-financed by Cohesion Fund
2014-2020
EUR 30.4 billion, of which for energy: EUR 5.35 billion
EUR 750 million (grants for gas/electricity PCIs)
EUR 303.2 million (up to 05/2016 on electricity PCIs)
Grants (~ 90 % of budget, plus 1 % for TA) & FI155 (~ 9 %)
Transport (TEN-T), telecommunications (DSIs), energy (gas and electricity networks, PCIs)
Horizon 2020 2014 - 2020 EUR 80 billion - - Grants Research, innovation and
development
- Secure, Clean and Efficient Energy
2014 - 2020 EUR 5.9 billion156 EUR 700 million
(grants)
2014: EUR 640 million 2015: EUR 671 million Grants
Energy efficiency, low carbon energy, smart cities & communities, SMEs
155 Use of innovative financial instruments, developed together with entrusted financial institutions such as the European Investment Bank (debt), the Marguerite Fund (equity
for energy, climate and infrastructure), the Loan Guarantee for TEN Transport (LGTT), the Risk-Sharing Finance Facility (RSFF) and the Project Bond Initiative. 156 Out of this figure, more than €200 million is earmarked to support European Institute of Innovation and Technology activities, subject to a mid-term review (scheduled
completion in Q4 of 2016).

Policy Department A: Economic and Scientific Policy
66 PE 595.356
Funding programme Funding period
Available EU budget
Approximate Annual Budget for Energy
Budget spent Financial Instruments (FI) and/or grants
Eligible projects
2016: EUR 673 million157
- Project Development Assistance (PDA)/ELENA158
Ongoing EUR 80 million (2014-2017)159
EUR 20 million (grants & TA) Grants & technical
assistance
TA for buildings, RES, CHP, urban transport, local energy infrastructure. Typically, EUR 6 – 50 million per project (EIB-ELENA also >50 million)
- InnovFin – EU Finance for Innovators
2014-2020 EUR 24 billion No split available FIs: Loans/ guarantee
All H2020 sectors (i.e. Transport, energy, telecoms, manufacturing, life science, research infrastructure)
NER300 2012, 2013 EUR 2.1 billion No longer
available
EUR 2.1 billion (RES & CCS) Grants
Low-carbon energy demonstration projects (CCS, RES)
European Energy Programme for Recovery (EEPR)
2009-2015 EUR 3.98 billion No longer
available
EUR 1.09 billion (on electricity & gas interconnectors); EUR 0.43 billion (CCS); EUR 0.24 billion (offshore wind, up to 06/2015)
Grants & FI (EUR 146 million)
Gas & electricity infrastructure, Offshore wind, CCS
European Investment Bank Ongoing
EUR 7.5 billion/year in energy (based on 2014160)
EUR 7.5 billion (FI)
Since 2011, EUR 45.95 billion signed for EU energy related loans161
FI (subsidised / guaranteed loans)
Investments that contribute to EU policy objectives. Focus on larger (> EUR 20 million) projects
157 Budgets available from the Horizon 2020 Work Programmes for 2014-2015 and 2016-2017. 158 European Local ENergy Assistance (ELENA) facility (part of Horizon 2020 budget) & Mobilising Local Energy Investments (MLEI-PDA) (integrated in Horizon 2020 from 2014). 159 The H2020 work programme 2016-18 has an indicative budget for ELENA of EUR 20 million (2016) and EUR 30 million (2017).
http://ec.europa.eu/research/participants/data/ref/h2020/wp/2016_2017/main/h2020-wp1617-energy_en.pdf ELENA disposed of €15m each year in 2014 and 2015. http://ec.europa.eu/research/participants/data/ref/h2020/wp/2014_2015/main/h2020-wp1415-energy_en.pdf.
160 EIB (2015), Investing in infrastructure for a growing economy. 161 EIB website: http://www.eib.org/projects/loan/list/index.htm?from=2011®ion=1§or=1000&to=&country.
European Energy Industry Investments
PE 595.356 67
ASSESSMENT OF CURRENT INVESTMENT TRENDS AND PLANS
KEY FINDINGS
Investments in RES based power generation increased strongly from 2004 to 2011, but fell back in 2012-2013 and remained in 2014-2015 at their 2013 level. Financial support to RES is still high, but decreasing due to declining investment costs and changes in support schemes. Investment in new conventional power generation is very limited, and several gas and nuclear power plants are being decommissioned, which might jeopardise the security of supply in some MS.
Energy storage and demand response are steadily developing and may become a game changer. The digitalisation of processes and technologies is also a relevant trend with a major impact on current and future investments. At the same time “new” financing instruments and models are emerging. Reaching the ambitious energy and climate targets will represent a major challenge to maintaining the energy cost at an affordable level for end-users.
Most MS are on track to reach the 2020 energy and climate targets, but the current investment levels and policies will not allow to reach the 2030/2050 targets. Additional policy measures and higher investment levels will be required to succeed in the transition to a low carbon electricity supply by 2050.
5.1. Investment Trends Massive investments in RES in most EU MSs
Worldwide investments in renewable energy rose six-fold between 2004 and 2015, from USD 46.6 to 285.8 billion; Europe represented 58 % of the worldwide RES investments in 2004 but its share declined to only 17 % in 2015.162
Figure 18 illustrates the evolution of RES investments in 2004-2015 in Europe in comparison to other world regions.163 While Europe was the major RES investor in 2004-2012, China took the lead in 2013.
162 Frankfurt School-UNEP Centre/BNEF (2016), Global trends in renewable energy investment 2016. 163 Frankfurt School-UNEP Centre/BNEF (2016), Global trends in renewable energy investment 2016.

Policy Department A: Economic and Scientific Policy
68 PE 595.356
Figure 18: Worldwide evolution of RES investments in 2004-2015 (in billion USD, left) and clean energy investments in Europe in 2015 (in billion EUR, right)
Source: Frankfurt School-UNEP Centre/BNEF (2016), Global trends in renewable energy investment 2016; EWEA (2016), Wind in power – 2015 European statistics
In the EU28, investments in RES based power generation capacity increased steadily until 2011, but decreased in 2012-2013 and then stabilised at a lower level. The average annual growth rate in 2004-2014 was 14 % for wind energy and 55 % for photovoltaic energy.164
Over the past decade, four-fifths of investment in new European power generation went to renewables, with 60 % to wind and solar PV alone.165 Between 2008 and 2012, EU RES capacity increased by 50 % thanks to the policy support and financial incentives for these technologies.166 This increase in capacity was mainly subsidy driven and was achieved in spite of the negative market and macro-economic conditions.
EU Member States did not exhibit the same investment trends. Between 2005 and 2014, most Member States increased their overall electricity generation capacity, but in some MSs there was little change in capacity and in some other MSs there was a decrease. The increase in RES based capacity was higher than in conventional generation capacity in all MSs except Latvia and Lithuania. In Germany, where the RES capacity increased significantly in 2010-2014, additional conventional capacity was built as a consequence of the phasing-out of nuclear power plants. The net changes in installed capacity per technology are presented in Annex 6.
The breakdown of the 2015 RES investments in Europe per technology and per financing source is presented in Figure 19.
164 Calculations based on Eurostat figures (nrg_113a). 165 Friends of Europe (2015), Europe’s Energy Union and the road to Paris and beyond. 166 Friends of Europe (2015), Europe’s Energy Union and the road to Paris and beyond.
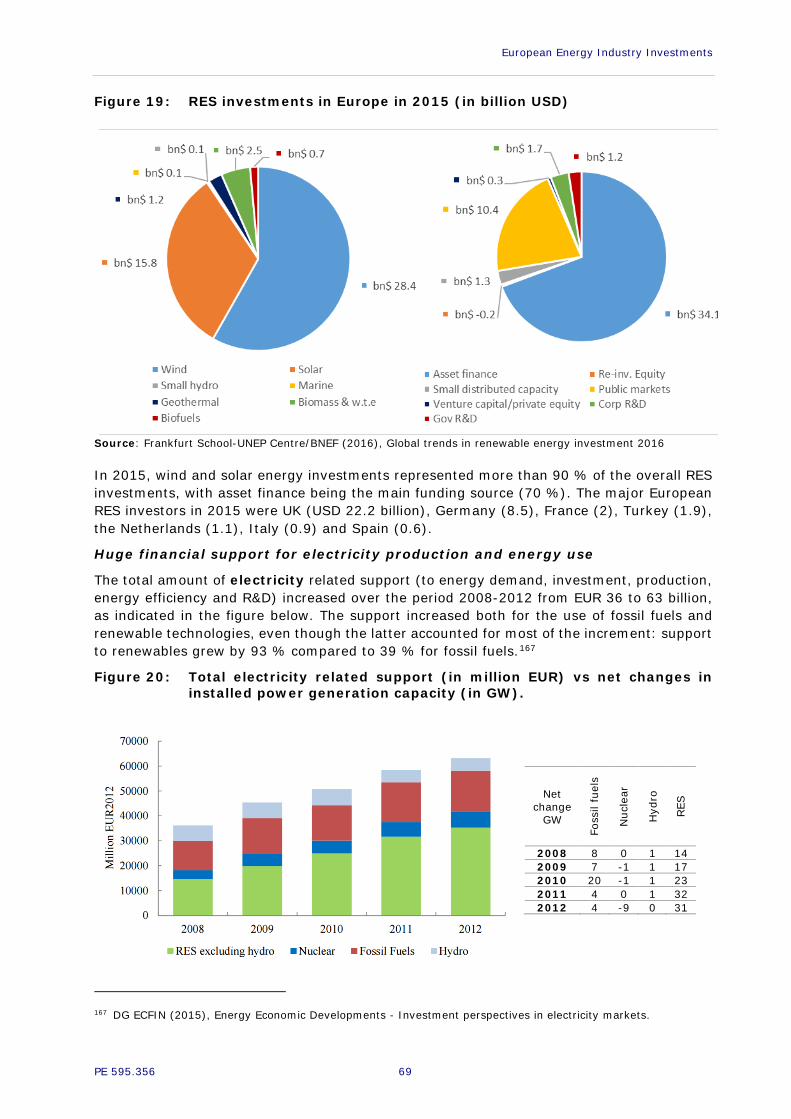
European Energy Industry Investments
PE 595.356 69
Figure 19: RES investments in Europe in 2015 (in billion USD)
Source: Frankfurt School-UNEP Centre/BNEF (2016), Global trends in renewable energy investment 2016
In 2015, wind and solar energy investments represented more than 90 % of the overall RES investments, with asset finance being the main funding source (70 %). The major European RES investors in 2015 were UK (USD 22.2 billion), Germany (8.5), France (2), Turkey (1.9), the Netherlands (1.1), Italy (0.9) and Spain (0.6).
Huge financial support for electricity production and energy use
The total amount of electricity related support (to energy demand, investment, production, energy efficiency and R&D) increased over the period 2008-2012 from EUR 36 to 63 billion, as indicated in the figure below. The support increased both for the use of fossil fuels and renewable technologies, even though the latter accounted for most of the increment: support to renewables grew by 93 % compared to 39 % for fossil fuels.167
Figure 20: Total electricity related support (in million EUR) vs net changes in installed power generation capacity (in GW).
Net change
GW
Foss
il fu
els
Nuc
lear
Hyd
ro
RES
2008 8 0 1 14 2009 7 -1 1 17 2010 20 -1 1 23 2011 4 0 1 32 2012 4 -9 0 31
167 DG ECFIN (2015), Energy Economic Developments - Investment perspectives in electricity markets.

Policy Department A: Economic and Scientific Policy
70 PE 595.356
Source: DG ECFIN (2015), Energy Economic Developments - Investment perspectives in electricity markets and Eurostat (nrg_113a)
A large share of the support is provided to renewable energy projects (EUR 40.3 billion in 2012168): solar energy (EUR 14.7 billion), wind energy (EUR 11.2 billion), biomass (EUR 8.3 billion), hydropower (EUR 5 billion) and other technologies (EUR 1.1 billion). Among conventional power generation technologies, coal received the largest subsidy (EUR 10.1 billion), followed by nuclear (EUR 7 billion) and natural gas (EUR 5.2 billion). These figures do not include the market value of the free allocation of CO2 emission allowances nor the tax exemption or reduction for specific energy consumption, which can also be considered as subsidies; including them in the comparison would reduce the gap between the support for renewables and conventional power generation technologies.
The (indirect) support for energy demand (in particular via tax reductions) is significant (EUR 27 billion in 2012) and substantially higher than the support for energy efficiency (EUR 9 billion).
Cost of most RES technologies is declining and is now almost competitive with conventional production technologies
The latest cost comparison published by IEA169 shows that, depending on the discount rate and technology, the levelised cost (LCOE) of nuclear and fossil fuel based electricity varies from USD 25 to 145 per MWh.
The LCOE figures for RES show a wider range, from USD 40 to 370 per MWh, depending on the technology and discount rate. Onshore wind is the cheapest technology, regardless of the discount rate. The LCOE of most RES technologies has significantly decreased since 2010, particularly for PV (from USD 500 to 200 per MWh). Overall, the average cost levels of RES based electricity are now closer to the LCOEs of conventional technologies such as Combined Cycle Gas Turbines (CCGT), indicating that renewable energy is becoming competitive.
Figure 21: LCOE ranges in USD/MWh (at discount rate of 3 %, 7 % and 10 %)
Bas
eloa
d g
ener
atio
n
168 This figure includes support to all RES, while the previous figure refers only to electricity related support. 169 IEA (2015), Projected costs of generating electricity, 2015 edition.
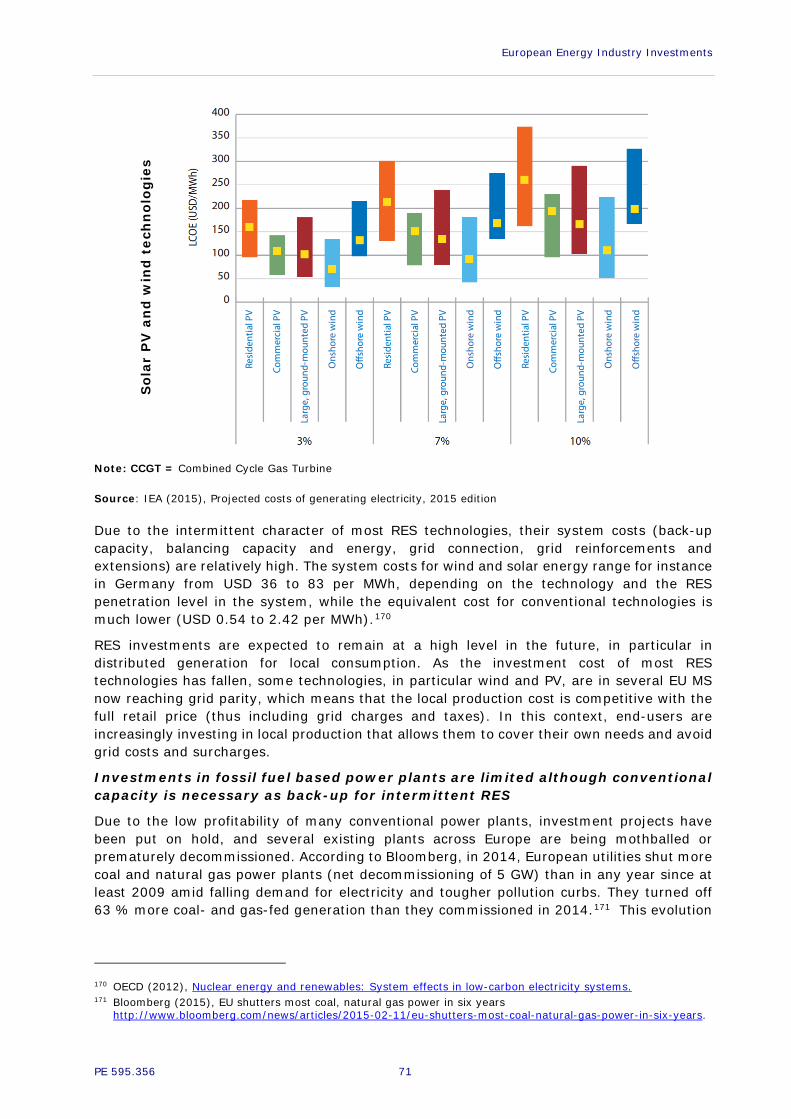
European Energy Industry Investments
PE 595.356 71
Sol
ar P
V a
nd
win
d t
ech
nol
ogie
s
Note: CCGT = Combined Cycle Gas Turbine
Source: IEA (2015), Projected costs of generating electricity, 2015 edition
Due to the intermittent character of most RES technologies, their system costs (back-up capacity, balancing capacity and energy, grid connection, grid reinforcements and extensions) are relatively high. The system costs for wind and solar energy range for instance in Germany from USD 36 to 83 per MWh, depending on the technology and the RES penetration level in the system, while the equivalent cost for conventional technologies is much lower (USD 0.54 to 2.42 per MWh).170
RES investments are expected to remain at a high level in the future, in particular in distributed generation for local consumption. As the investment cost of most RES technologies has fallen, some technologies, in particular wind and PV, are in several EU MS now reaching grid parity, which means that the local production cost is competitive with the full retail price (thus including grid charges and taxes). In this context, end-users are increasingly investing in local production that allows them to cover their own needs and avoid grid costs and surcharges.
Investments in fossil fuel based power plants are limited although conventional capacity is necessary as back-up for intermittent RES
Due to the low profitability of many conventional power plants, investment projects have been put on hold, and several existing plants across Europe are being mothballed or prematurely decommissioned. According to Bloomberg, in 2014, European utilities shut more coal and natural gas power plants (net decommissioning of 5 GW) than in any year since at least 2009 amid falling demand for electricity and tougher pollution curbs. They turned off 63 % more coal- and gas-fed generation than they commissioned in 2014.171 This evolution
170 OECD (2012), Nuclear energy and renewables: System effects in low-carbon electricity systems. 171 Bloomberg (2015), EU shutters most coal, natural gas power in six years http://www.bloomberg.com/news/articles/2015-02-11/eu-shutters-most-coal-natural-gas-power-in-six-years.

Policy Department A: Economic and Scientific Policy
72 PE 595.356
might endanger security of electricity supply in several MS, in particular if the planned expansion of interconnection capacity is not realised in a timely manner.
Figure 22: Electricity utility asset impairments and investment in 2014-2015 in the EU (billion USD’15)
Source: IEA (2016), World Energy Investment
This potentially critical situation is referred to in several publications, among others, the ENTSO-E Outlook 2014-2030 and mid-term Adequacy Forecast 2016, as well as a report of Friends of Europe, which concludes that “Given insufficient grid interconnections and unavailability of electricity storage on reasonable economic terms and on a large scale in the short term, Europe needs a balanced low-carbon mix with a significant share of dispatchable generation (hydro, biomass, nuclear, natural gas and CCS at a later stage) to complement renewables.” 172
RES support (per MWh) is decreasing and becoming more market based
Support for renewables across EU28 differs widely from one country to another, regarding instruments, level of support and amount of electricity produced receiving this support.173 The average support per MWh produced RES-E in the EU28 was around 54 EUR/MWh in 2008; it reached a peak of 70 EUR/MWh in 2010 and dropped to 62 EUR/MWh in 2012.174
172 Friends of Europe (2015), Europe’s Energy Union and the road to Paris and beyond. 173 CEER (2015), Status Review of Renewable and Energy Efficiency Support Schemes in Europe in 2012 and 2013. 174 DG ECFIN (2015), Energy Economic Developments - Investment perspectives in electricity markets.

European Energy Industry Investments
PE 595.356 73
Figure 23: RES-electricity support per unit of overall (RES + conventional) gross electricity produced (EUR/MWh in 2012)
Source: CEER (2015), Status Review of Renewable and Energy Efficiency Support Schemes in Europe in 2012 and 2013
Since 2010, the support per MWh has substantially decreased, mainly as a result of reforms of the support schemes and falling cost levels. Support is also increasingly granted via tendering, which has the effect of lowering subsidy levels.175
The competition amongst RES technologies and operators will be further enhanced by the implementation of new Environmental and Energy State Aid Guidelines (EEAG). In most MSs RES installations have been supported with fixed tariffs, which sheltered them from price signals and arguably led to market distortions as most renewables installations were generating electricity irrespective of the actual demand and market price and hence out-competed conventional electricity generation. The guidelines stipulate that feed-in tariffs should be progressively replaced by variable market premiums (or green certificates) which result from competitive bidding processes. RES generators must also sell their electricity in the market and be subject to balancing responsibilities, like any other producer. These guidelines should improve the integration of renewable energy into the market, increase the cost effectiveness of the support schemes and limit market and competition distortions. In 2015-2016, Member States had to start implementing competitive bidding procedures for a small share of their new capacity from renewables. From 2017 on, the use of tendering should in principle be widely implemented to support new installations.
Several Member States are already using a tendering procedure to allocate RES support, including the Netherlands (since 2011), Poland and UK (since 2015), Denmark (since 2008 only for offshore wind), Italy (since 2013), France (since 2004) and Germany (introduced for PV in 2014 and to be extended to wind energy as of 2017).176 Some stakeholders (e.g. WindEurope, previously the European Wind Energy Association - EWEA) argue that tenders may increase investors’ uncertainty over the price and hence deter investments.177 However, if tenders are properly designed (sufficient participants, organised on a regular basis, etc.), they should incentivise investments and enable the RES targets to be reached at least cost.
175 This can be illustrated by the results of two recent auctions: in September 2016 two offshore wind projects (350
MW) in Danish waters were awarded to Vattenfall at a price of only € 63.8 per MWh, while in July 2016, Dong Energy won a contract to develop a 700 MW Dutch offshore array at € 72.70 per MWh. Until then the lowest auction price for constructing and operating a wind farm was € 103 per MWh for a wind farm off the coast of Denmark.
176 Trinomics (2016), Studie betreffende de opportuniteiten van en mogelijkheden tot tendering van windenergie voor bepaalde zones.
177 EWEA (2015), Design options for wind energy tenders.
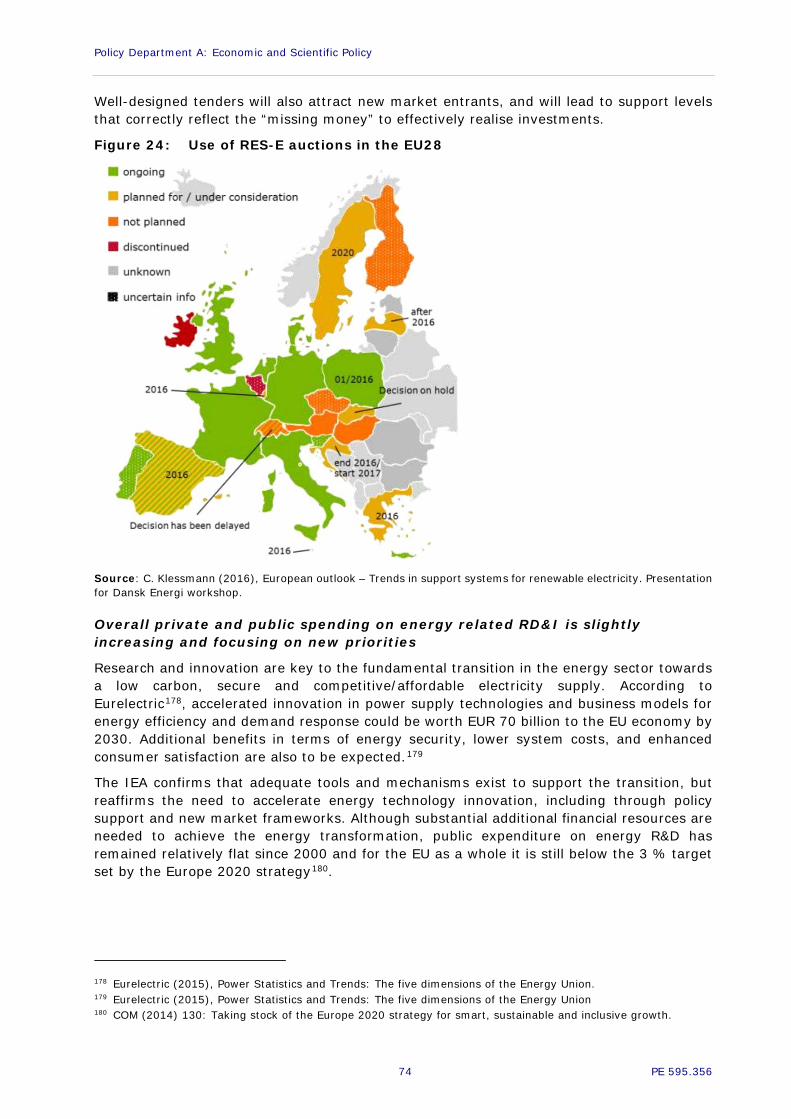
Policy Department A: Economic and Scientific Policy
74 PE 595.356
Well-designed tenders will also attract new market entrants, and will lead to support levels that correctly reflect the “missing money” to effectively realise investments.
Figure 24: Use of RES-E auctions in the EU28
Source: C. Klessmann (2016), European outlook – Trends in support systems for renewable electricity. Presentation for Dansk Energi workshop.
Overall private and public spending on energy related RD&I is slightly increasing and focusing on new priorities
Research and innovation are key to the fundamental transition in the energy sector towards a low carbon, secure and competitive/affordable electricity supply. According to Eurelectric178, accelerated innovation in power supply technologies and business models for energy efficiency and demand response could be worth EUR 70 billion to the EU economy by 2030. Additional benefits in terms of energy security, lower system costs, and enhanced consumer satisfaction are also to be expected.179
The IEA confirms that adequate tools and mechanisms exist to support the transition, but reaffirms the need to accelerate energy technology innovation, including through policy support and new market frameworks. Although substantial additional financial resources are needed to achieve the energy transformation, public expenditure on energy R&D has remained relatively flat since 2000 and for the EU as a whole it is still below the 3 % target set by the Europe 2020 strategy180.
178 Eurelectric (2015), Power Statistics and Trends: The five dimensions of the Energy Union. 179 Eurelectric (2015), Power Statistics and Trends: The five dimensions of the Energy Union 180 COM (2014) 130: Taking stock of the Europe 2020 strategy for smart, sustainable and inclusive growth.

European Energy Industry Investments
PE 595.356 75
Figure 25: Government budget for energy R&D in EU28 (2007-2014, in M EUR and EUR/inhabitant)
Source: EUROSTAT (gba_nabsfin07)
RES related overall R&D expenditures in Europe amounted in 2014 to USD 4.3 billion and were substantially higher than in other continents, mainly thanks to corporate R&D expenditures. China leads government (publicly financed) R&D with USD 1.7 billion committed in 2014, compared to USD 788 million in the US and USD 1.4 billion in Europe (see Figure 26).181
181 http://breakingenergy.com/2015/05/13/higher-rd-investment-in-renewable-energy-technologies-critical-for-
clean-energy-innovation-climate-action.

Policy Department A: Economic and Scientific Policy
76 PE 595.356
Figure 26: Corporate and government R&D renewable energy investment by region, 2014, and growth on 2013 (in billion USD)
Source: Frankfurt School-UNEP Centre/BNEF (2016), Global trends in renewable energy investment 2016
The R&D expenditure of the largest electricity companies is rather low (<1 % of their turnover in 2013); the “alternative energy utilities”182 are spending a substantially higher share (about 5 % of their turnover in 2013), but this is still below the R&D levels in companies from other sectors (see Figure 27).
182 Alternative energy utilities are those focused on non-fossil fuels. This statement is based on the figures of six
companies specialised in renewable energy and located in DE (3), UK, DK and LU.
0% /1%
0% /1%
-2% /7%
1% /2%
-2% /2%
111% /5%
-4% /2%
12% /0%
Growth:

European Energy Industry Investments
PE 595.356 77
Figure 27: Average R&D intensity for the top 1000 companies ranked by R&D in the EU per industry branch (in %)
Source: JRC (2015), EU R&D Scoreboard: The 2015 EU Industrial R&D Investment Scoreboard
The IEA confirms that a high level of ‘clean-energy’ innovation is essential for meeting the climate goals, and that clean-energy deployment is currently not ramping up fast enough. In particular, funds allocated to renewable energy R&D are in general still insufficient.
However, based on the figures described above we can conclude that Europe is not lagging behind in the RES domain, but that additional efforts are necessary to properly address other major challenges. New energy related R&D priorities have been defined in the Communication of the European Commission on the Strategic Energy Technology Plan (SET-Plan) published in September 2015; it also defines the 4 strategic priorities: renewable energy technologies, empowering consumers with a smarter energy system, energy efficiency and other low carbon technologies (CCS and nuclear).

Policy Department A: Economic and Scientific Policy
78 PE 595.356
Nuclear power plants are being phased out and there are relatively few new projects in development
Nuclear energy accounted for about 27 % of the electricity produced in the EU in 2014183 but its share is decreasing due to the closure of several plants (because of either political reasons or the fact that they have reached the end of their operating lifetime). A decommissioning of 122 GW of nuclear capacity, corresponding to 129 plants in 14 MSs, is expected in the near future.184
New build projects are envisaged in 10 MSs185, all of which are at different stages in development ranging from preparation, to licensing and construction.186 The latter are experiencing cost overruns and delays. In some countries (Spain, France, Belgium and UK) programs to extend the lifetime of nuclear power plants beyond 40 years have been launched. The UK aims to close all coal-fired power plants by 2025 and to fill the capacity gap with (new) gas and nuclear power plants.187
The medium and long-term future of nuclear power is highly unsure in the EU and will depend upon a number of factors, including the outcome of ongoing research and investment projects. Considering the current political and societal context and the electricity market conditions, it is unlikely that nuclear technology will represent a major share in the low carbon investments in 2020-2050.188
High investment levels in grid infrastructure and increasing private sector financing participation
The current energy trends (digitalisation, distributed generation, market integration and decarbonisation) lead to increasing investments in electricity grid and metering infrastructure, mainly needed to:
• Reinforce and extend cross-border interconnections;
• Reinforce and extend local grids to accommodate the grid connection and access of decentralised generation;
• Replace and refurbish ageing grid components for safety and reliability purposes;
• Adapt and modernise the grid infrastructure to make it more resilient and future proof (e.g. to allow bi-directional flows, integration of smart systems/metering).
Worldwide investment in transmission and distribution projects with private sector participation has been increasing, reaching USD 11 billion in 2012, compared to USD 1.4 billion in 2003.189 In most European MSs, transmission and distribution infrastructure is still mainly publicly owned, but private sector participation is increasing. As power generators in several EU MS are no longer allowed to finance grid assets because of the unbundling rules under the Third Energy Package, and as the other traditional financing sources such as municipalities or governments and banks are facing constraints due to public budget deficits,
183 Eurostat, http://ec.europa.eu/eurostat/statistics-explained/index.php/Nuclear_energy_statistics. 184 http://www.world-nuclear.org/information-library/country-profiles/others/european-union.aspx. 185 Finland, France, Slovakia, Hungary, UK, Bulgaria, Czech Republic, Lithuania, Poland and Romania. 186 COM (2016) 177: Nuclear Illustrative Programme presented under Article 40 of the Euratom Treaty for the
opinion of the European Economic and Social Committee. 187 The UK government has agreed on a ‘contract for difference’ (CfD) for Hinkley Point C (a 3200 MWe new nuclear
power plant project), that guarantees the generator an index-linked income of £92.50 per MWh (2012 prices) during 35 years. Further, the UK government offered to guarantee up to £2 billion of bonds that may be issued to finance its construction. Source: DECC (2016), Nuclear power in the UK.
188 With exceptions such as the new 3,200 MWe nuclear power plant to be built in Hinkley Point (UK). 189 ESMAP (2015), Private Sector Participation in Electricity Transmission and Distribution.

European Energy Industry Investments
PE 595.356 79
deleveraging and stricter financial regulations, institutional investors such as pension funds, insurance companies and sovereign wealth funds are increasingly being approached to co-finance energy investments. At present, only 1 % of large pension fund assets are allocated directly to infrastructure projects and an even smaller share goes to green infrastructure.190
The European Union is also providing financing to investments in key grid infrastructure required for the integration of the EU internal electricity market. The case studies on the Baltic States and the Iberian region illustrate the use and impact of these financing instruments (see annexes 4 and 5).
Most investments in grid infrastructure are included in the regulatory asset base and financed on a corporate level. The large extent of public ownership of grid operators has an impact on their financing framework and conditions, in particular on their ability to raise further equity and acquire debt. Public ownership typically results in less flexibility in equity financing. Sovereign ratings can also have an impact on the financing and debt capital costs of grid operators as sovereign guarantees often support their acquisition of debt.
Key actors in the climate/energy finance landscape
The group of actors active in financing energy investments is diverse and includes besides the public financial institutions also financial private actors such as commercial banks (especially for debt financing), corporations, institutional investors but also SMEs and households.191 These actors have been financing investments in electricity for years, in particular conventional generation and grid investments. These investments are mainly debt-financed and their process is well known. On the other hand, low carbon energy investments such as RES based power generation, carbon capture and storage and smart grids have a higher perceived risk and thus require more innovative financing.
Public financial institutions (PFIs) are publicly created and/or mandated financial institutions that often correct for the lack of market-based finance through the provision of missing financial services. PFIs in Europe192 are well positioned to act as a key leverage point for governments’ efforts to mobilize private investment in low-carbon projects and infrastructure. These institutions and special-purpose funds are typically established to meet broad objectives serving the public good as defined by national, regional or international policy objectives. Given the direct or implicit policy-oriented mandates under which these institutions operate, PFIs are, under certain circumstances, both able and willing to provide financing at below-market returns, typically pairing with commercial investors to draw in additional financing.
PFIs often have means to provide high volumes of stable, long-term finance while minimizing cost to national budgets. Depending on the institution, they can use their initial capitalization and balance sheet, state guarantees, and strong credit ratings to leverage low-cost funding from the international capital markets or through the use of household savings.
The role of these PFIs do differ a lot from MS to MS. For Germany for example of the EUR 37 billion invested in low carbon related projects in 2010, EUR 16.5 billion was invested by means of concessional debt (or 45% of these total investments). This is due to the specific role of KfW and the other public banks in Germany193. An opposite case is the example of
190 OECD (2015), Mobilising private investment in clean-energy infrastructure - what’s happening? 191 Project developers are assigned to the group of corporations and venture capitalists and private equity operators
are assigned to the group of institutional investors. 192 This includes National Promotional Banks as defined by the European Union, the European Investment Bank, as
well as different dedicated public investment and equity fund structures with development mandates. 193 Juergens et al (2012). The landscape of climate finance in Germany. Climate Policy Initiative.

Policy Department A: Economic and Scientific Policy
80 PE 595.356
Belgium194 where of the EUR 6.4 billion invested in low carbon related activities in 2013 only EUR 0.2 billion (or 3% of the total investments) was funded through concessional debt (thus PFIs). On the other hand, 31% of the total low carbon investments (or EUR 2.0 billion) was funded through public grants and subsidies.
The most active actors within the group of private financial institutions are institutional investors. Institutional investors are the largest source of private capital investments with roughly EUR 63 trillion195 of assets under management versus global financial assets of around EUR 190 trillion.196 In Europe, institutional investors’ assets under management amount to roughly EUR 13.5 trillion.197 While institutional investors are not the only relevant source for providing the capital needed for the low-carbon transition, their significant share of financial assets means they play a key role as a source of capital for achieving climate goals. However, despite the increase of their investments in absolute terms, sustainable energy investment still accounts for a very small share of institutional investors’ assets under management; although how minor is difficult to quantify precisely. Using the limited data available, analyses find that the share of investment in the portfolios of pension funds and insurance companies is around 1-2% for green, between 5-10% for brown, and around 20-25% for high-carbon sectors.198 The rest of the portfolio was classified as “other”. The highest share of climate-friendly investments is in the infrastructure funds of the alternative parts of institutional investors’ portfolios and the lowest share in the bond portfolio. The high share of “other” - assets with an unknown low carbon impact - illustrates the difficulty in providing a full picture of institutional investors’ current exposure to these assets.
Other financial investors (apart from institutional investors) falling under the broad umbrella of capital market investors include venture capital / private equity (VC/PE) and seed/angel capital investors.
Venture capital and private equity (VC/PE) is all money invested by venture capital and private equity funds in the equity of specialist companies developing renewable energy technology. VC is usually originated from high worth individuals and as a small part of the portfolio of large institutional investors, like pension funds and insurance companies. VC/PE investments had increased strongly in the 2006-2008 period in Europe and then dropped again and have remained stable at around USD 0.5 billion per year.199
Seed capital, retained earnings and angel investments in Europe is heavily complemented by direct and indirect government support. Government support comprises grants, subsidies and expenditures in research and development (R&D) via universities or directly to the researchers. Also European firms can attract funds from several EU funds to support the research, development and demonstration of innovative projects. The total average annual budget of these funds was around €25 billion in the period 2007-2013.200
Finally, one of the most important sources of finance for energy investments are private companies, SMEs and households. Private companies primarily use their own equity (savings) and channel this towards energy investments via balance sheet financing. In 2014,
194 Rademaekers et al (2016). Landscape of climate finance in Belgium. Federal Public Service (FPS) Health, Food
Chain Safety and Environment, Belgium. 195 Kaminker, Ch. et al. (2013), Institutional investors and green infrastructure investments: selected case studies,
OECD Working Papers on Finance, Insurance and Private Pensions, No.35, OECD Publishing. 196 Estimates from the McKinsey Global Institute based on 2012 trends. 197 OECD Institutional Investor database. 198 Trinomics (2014), Shifting Private Finance towards Climate-Friendly Investments, for DG CLIMA, Dec. 2014. 199 Trinomics (2014), Shifting Private Finance towards Climate-Friendly Investments, for DG CLIMA, Dec.2014. 200 De Bruyn, Sander et al (2016). Investment challenges of a transition to a low-carbon economy in Europe. CE
Delft.

European Energy Industry Investments
PE 595.356 81
nine of the largest European utilities invested a total of USD 11.9 billion in renewable energy.201 Next to private companies, we have the small-end users. Individual households – via self-financing from their own savings – have already unlocked vast amounts of money, in particular for energy efficiency measures in buildings and transport, as well as established renewable energies. In Germany, in 2010, companies and households invested EUR 14.4 billion202 (or 38% of the total low carbon related investments) funded by equity and own resources. In Belgium, this figure rose even to 50% of the total investments (EUR 3.2 billion)203.
Energy storage is developing and might become a game-changer
Energy storage has the potential to cost efficiently contribute to the energy and climate goals and targets, via services to facilitate RES integration and system balancing. Storage also has a positive impact on energy supply security and independence. For electricity systems with a high share of intermittent RES in particular, energy storage could play a major role in balancing supply and demand and ensuring grid stability.204
Today, excess electricity is mainly stored in large scale pumped hydro installations. This is a mature technology that represents more than 95 % of the current storage capacity in Europe. Between 2010 and 2015 about 5.9 GW of new pumped hydro capacity was built in EU27 + Switzerland and Norway, bringing the overall installed capacity to 56.4 GW.205
Pumped hydro had an essential role when Europe's electricity system was mainly composed of large thermal power plants with low flexibility and grids with weak interconnections.206 Today, the level of interconnection is much higher and modern fossil fuel based power plants (in particular natural gas combined cycles) are more flexible. Therefore, the role of electricity storage has evolved and it is mainly needed to fill the gap between the ramping down time of wind and solar and the ramping up time of conventional back-up plants.207
In the near future, excess electricity will increasingly be stored in batteries (home batteries, electric vehicles), while in the medium term, it may also be converted to hydrogen, which can be directly fed into the natural gas grid or be used to power fuel cell cars. Hydrogen may also be converted to natural gas (power to gas), or to methanol (for transport), or be converted back to electricity (through stationary fuel cells or gas engines). The hydrogen option is still in its development phase. Energy storage is expected to substantially contribute to the transition to a low-carbon energy supply and might become a genuine game-changer in the energy sector.
New financing instruments and funding models are being implemented to finance energy projects
The traditional mix of investors is evolving in response to the electricity sector’s changing financial needs and risk-reward attitudes. Electricity generators/suppliers are being forced to consider alternative financing partners and instruments due to decreasing returns. In this context, a new set of investors, including private equity firms, hedge funds and households,
201 Frankfurt School-UNEP Centre & BNEF (2016). Global trends in renewable energy investment. P. 46. 202 Juergens et al (2012). The landscape of climate finance in Germany. Climate Policy Initiative 203 Rademaekers et al (2016). Landscape of climate finance in Belgium. Federal Public Service (FPS) Health, Food
Chain Safety and Environment, Belgium 204 EEG – stoRE project (2012), The Role of Bulk Energy Storage in Facilitating Renewable Energy Expansion. 205 DG ENER (2013), Working paper: The future role and challenges of energy storage. Additional details, in
particular regarding the role of hydro storage, can be found in: JRC (2013), Assessment of the European potential for pumped hydropower energy storage.
206 DG ENER (2013), Working paper: The future role and challenges of energy storage. 207 Eurelectric (2011), Hydro in Europe: Powering Renewables.

Policy Department A: Economic and Scientific Policy
82 PE 595.356
is taking advantage of new financing opportunities and increasingly investing in energy technology and deployment.208
Households are increasingly investing in PV or are participating in local wind or biomass projects via cooperative structures, which are being set up in several MS to co-finance and enhance the local acceptability of RES projects. “Cooperatives Europe”209 has been set up at EU level with several cooperatives from across Europe to promote and develop this concept. Crowdfunding is another emerging finance method which allows the provision of energy and monetary benefits to local investors; several crowdfunding platforms have recently been set up to finance RES projects, e.g. Solar Schools (UK), GenCommunity (UK), Abundance Generation and Windcentrale (NL).210
In order to mitigate market risks and facilitate funding of investments in power generation, power purchase agreements (PPAs) between project developers and a single buyer company offer higher certainty by guaranteeing quantities purchased and price paid. In Europe, only a few countries (particularly France) are currently using this option. As most EU MSs haven’t adopted a single buyer model it is not expected that this type of PPAs will in the short and medium term be widely used in Europe; PPAs between independent generators and electricity suppliers (or end users) are however widely used in Europe and are an effective instrument to improve the bankability of investment projects.211
While green bonds started as a niche product, they have grown consistently over the past years. The EIB has issued the largest number of green bonds (over USD 17 billion) and was the largest issuer of green bonds in both 2014 and 2015.212 These green bonds were used to finance a range projects across different fields (such as energy efficiency and renewable energy) and their yields have been the same as for “non-green” bonds.213
Rising electricity bills for end-users
Despite the decreasing price trend in the wholesale electricity market since 2012, retail household and industrial electricity bills increased in the EU between 2008 and 2015 by respectively 32 % and 1 %214, mainly due to increasing network costs, taxes and levies (to recover e.g. RES subsidies and support for energy efficiency or to finance nuclear decommissioning215).
Although increasing electricity bills might positively affect energy efficiency and demand response, they have become a political issue in most MSs due to their impact on low-income and vulnerable households as well as on the competitiveness of energy-intensive industries exposed to international competition.
RES related charges have become a major component in the electricity bill. They increased in the EU by about 20 % per year in the past 6 years, and are expected to increase by another total 20 % up to 2021.216 However, it is suggested that the contribution of RES subsidies to
208 Bain and company (2015), Business and investment opportunities in a changing electricity sector. 209 The European region of the International Co-operative Alliance (https://coopseurope.coop/policy-topic/energy). 210 http://www.recrowdfunding.eu/news-updates/2014/7/14/top-5-renewable-energy-crowdfunding-platforms. 211 World Bank (2016), Power Purchase Agreements (PPAs) and Energy Purchase Agreements (EPAs) and Redpoint
Energy (2013), PPAs for independent renewable generators – an assessment of existing and future market liquidity.
212 Climate Bonds Initiative (2016), Bonds and Climate Change - The state of the market in 2016. 213 Friends of Europe (2015), Europe’s Energy Union and the road to Paris and beyond. 214 Eurostat. 215 Such a levy applies for instance in Germany and Slovakia. 216 WEF (2015), The Future of Electricity: attracting investment to build tomorrow’s electricity sector.

European Energy Industry Investments
PE 595.356 83
increased electricity bills is not as high as the cost of the avoided energy import.217 The taxes and levies’ component of the EU28 electricity prices for industry increased by 100 % between 2007 and 2015 and represented 40 % of the electricity bill in 2015, while the energy component remained stable.218 In household prices, this component went up by 72 % and represented 33 % of the electricity bill in 2015.219
Figure 28: Electricity prices for households and medium scale industry in the EU28 (in EUR/kWh)
Source: EUROSTAT (ten00117)
The overall electricity system cost is expected to increase in the coming decades. Increasing grid investments will lead to higher network tariffs, and the energy component will also become more expensive: OECD/IEA expects wholesale electricity rates to rise between 2015 and 2040 by 57 % in the EU (though other studies220 estimate that with the current price formation methodology and the rising share of RES, average wholesale prices would structurally remain at a low level), while industrial retail prices would rise in real terms by 15 %.221
Demand response (DR) has a high potential and is (slowly) developing in most EU MSs222
Demand response involves industrial, commercial and residential end-users adjusting their use of resources (such as their energy consumption, use of distributed generation or storage assets) during short time periods when provided with control signals and/or financial incentives. DR offers a broad range of benefits on system operation as well as on market efficiency. Moreover, by lowering peak demand, DR reduces price volatility and investment needs for generation and grid capacity.
In explicit DR schemes the aggregated demand side resources are traded in the market and end-users receive fees to change their consumption (or generation) patterns upon request. Implicit DR refers to consumers who are exposed and respond to time-varying electricity prices or network grid tariffs.
217 Friends of Europe (2015), Europe’s Energy Union and the road to Paris and beyond. 218 EUROSTAT (nrg_pc_205) comparing values for Band IC between 500 and 2000 MWh in EUR/KWh. 219 EUROSTAT (nrg_pc_204) comparing values for Band DC between 2500 and 5000 kWh in EUR/KWh. 220 Such as Comillas et al. (2013), Assessment report on the impacts of RES design options on future electricity
markets. 221 WEF (2015), The Future of Electricity: attracting investment to build tomorrow’s electricity sector. 222 SEDC (2015), Mapping Demand Response in Europe Today.

Policy Department A: Economic and Scientific Policy
84 PE 595.356
DR is well developed in the industrial and commercial market segments, in particular via interruptible supply contracts223, but a wide deployment in the residential sector is still hindered by regulatory and technical barriers. In 2015 DR was commercially active in six European countries (FI, FR, BE, GB, IE, CH), 4 national electricity systems were partially open for demand response (NL, NO, SE, AT) and there was preliminary development in two countries (DE, PL). 224 The inclusion of DR in the Network Codes (elaborated in 2015) represents a positive step towards widespread consumer engagement in Europe. There is however a critical need for more standardised regulation at European level, including clarified roles and responsibilities, to further facilitate and accelerate its deployment.
Figure 29: Map of explicit DR development in Europe
Note: BRP – Balance responsible party
Source: SEDC (2015), Mapping Demand Response in Europe Today
Increasing impact of digitalisation225
The electricity sector has long embraced digital technologies in the context of technical applications such as simulation, modelling for power plants and grids’ design, monitoring, control, planning, markets, forecasting, etc. This has allowed the industry to improve the quality of its services and to reduce costs.
Digitalisation of energy systems will play a key role in making the transition to a low carbon energy supply faster and probably also more reliable and less costly. The combination of decentralised energy production and internet communication are leading to a digital
223 Interruptible supply contracts allow for interruptions in electricity supply in exchange of either an overall
electricity price reduction, or a financial compensation at the time of interruption. 224 SEDC (2015), Mapping Demand Response in Europe Today. 225 http://www.europeanenergyinnovation.eu/Articles/Spring-2016/Digitalisation-of-Energy-A-vision-becoming-
today-a-reality.

European Energy Industry Investments
PE 595.356 85
revolution. Consumers become prosumers who generate their own electricity and store overcapacity in batteries or share it through an intelligent (bi-directional) grid. Key game changers are the Internet of Things226, big data and predictive analytics227, as well as the use of “smart” devices in buildings.
This leads to new possibilities: dynamic retail prices and smart appliances will allow end-users to automatically shift their consumption (e.g. to charge electric vehicles) to moments of time when energy is cheap due to abundant solar and/or wind energy production. Heating algorithms will predict the most cost-effective solution to heat a building. Battery devices will determine (based on prevailing price and grid tariff levels) when energy is stored and when it is injected into the grid.
This revolution leads to new business models and strategies for energy companies which are now launching new offerings and services. Some energy suppliers are targeting these new offers at specific client segments. For others, it is part of their core strategy of combining green electricity with innovation. Customers get a free “energy box” allowing them to track and control their consumption. By implementing these types of online offers, energy suppliers can improve their economic efficiency and increase their clients’ satisfaction.
A Capgemini report shows that 80 % of the utilities consider Big Data analytics as a source of new business opportunities but only 20 % have implemented initiatives in this area. Several difficulties are holding them back: data complexity, access and privacy issues (54 %), data storage and manipulation costs (26 %) and skills shortages (13 %).228
Increasing self-production of electricity by end-users and electrification of transport & heating
Partly because of the requirements of Energy Performance of Buildings Directive new and substantially renovated buildings need significantly less energy than old buildings. There are several other changes to building energy use that are well known and although relatively uncommon today are likely to become much more common in the future. For example, buildings’ electricity and heat needs can be increasingly met by local PV and heat pumps, combined with electrical (home and EV) batteries and thermal storage. Local electricity and heat installations can be interconnected via closed distribution energy grids, which allow local communities to become largely independent from the public grid and the energy generators/suppliers. This evolution will lead to a major shift towards more local and small-scale investments, both in energy generation and grids, and to changing roles for the market operators, from DSOs, who will become system rather than grid operators and data managers and generators/suppliers, who will still have to cover the residual energy demand of these prosumers but will focus more on services which allow their customers to minimise their overall energy use and cost. However, these changes will require an enabling regulatory and market framework as well as retail prices to be deregulated and closely linked to wholesale prices.
5.2. Evaluation of investment plans EU legislation regarding investment plans is rather limited. There is a common legal framework for transmission grid investments and Projects of Common Interest (PCIs), but for investments in “national” grid assets, there is no EU level legal provision which obliges grid operators or national authorities to establish investment plans. This issue is dealt with
226 The Internet of Things will allow end-users to monitor their energy consumption and to control energy production
and use automatically via technological solutions and algorithms thereby minimising their overall energy cost. 227 Increased efficiency will be possible by using pattern recognition of all the new data gathered. 228 Capgemini (2015), 17th Annual Edition of the European Energy Markets Observatory: Digital transformation
represents a fantastic opportunity for Utilities to adapt to the energy transition while increasing competitiveness.

Policy Department A: Economic and Scientific Policy
86 PE 595.356
at national level. For “commercial” investments (power generation, storage, demand response), individual companies might have their own investment plans, but in the current legal and regulatory context, establishing overall national or supranational investment plans would neither be a feasible nor appropriate approach.
In this section, we focus on the EU level initiatives, i.e. the implementation of PCIs and the ENTSO-E’s development plans. Some specific investment plans at national/regional level are assessed in the case studies.
The figure below shows the link between the different transmission development plans and the PCIs.
Figure 30: Investment plans in transmission infrastructure
Source: ENTSO-E website
5.2.1. ENTSO-E’s Ten-Year Network Development Plan (TYNDP) The Ten-Year Network Development Plan (TYNDP) is a biennial publication from ENTSO-E, which presents an overview of the transmission investment projects that are identified to ensure that the transmission grid facilitates EU energy and climate policy goals, i.e. maintain security of supply and facilitate RES development and the internal energy market (IEM). The publication consists of a main document (TYNDP), six Regional Investment Plans (RgIPs), which are developed by ENTSO-E’s Regional Groups, and a Scenario Outlook & Adequacy Forecast (SO&AF). The TYNDP provides the investment budget per MS for projects of pan-European significance.229
In compliance with Regulations 714/2009 and 347/2013, these eight reports jointly deliver a structured, systematic and comprehensive vision for European grid development up to 2030. The TYNDP assesses projects of pan-European significance, using a specific cost benefit analysis (CBA), where the benefits of each project include the increase in social and economic welfare of the impacted countries, the impact on security of supply, integration of RES,
229 A project of pan-European significance is a set of Extra High Voltage assets, which contributes to a grid transfer
capability increase; is at least partially located in one of the 32 TYNDP countries and comprises main equipment of at least 220 kV if it is an overhead AC line or at least 150 kV otherwise.

European Energy Industry Investments
PE 595.356 87
reduction of greenhouse gas emissions and the impact a project has on transmission losses, as well as the resulting technical resilience of the system.
The TYNDP is created via a bottom-up process and results from initiatives taken by TSOs in combination with their national regulators and authorities. The process is based on a comprehensive impact assessment, but national interests and impacts still largely determine grid development plans. This might be a major reason why the interconnection level is still rather low in some MSs (and well below the overall economically optimal level). A top down methodology to identify and select transmission grid investment projects that offer the highest overall added value at EU level, might be more efficient than the current approach; this could be achieved via an appropriate consultation structure at European or regional level with the three involved parties: TSOs, regulators and authorities.
At present, only a limited part of the available interconnection capacity is effectively used for trading, mainly due to technical reasons (unscheduled or loop flows which cause congestion). In Central Western Europe (CWE), only 31 % of the physical interconnection capacity was used for trading in 2015.230 The social welfare loss due to congestion at the borders amounted in 3 regional markets (CEE, CSE and CWE) to 983 million Euros in 2014, which is 24 % higher than in 2011, mainly due to increased price differences between price zones, and to a lesser extent to changes in the volumes of unscheduled flows.231
The TYNDP 2016 foresees up to 150 billion euros of investments in grid infrastructure for 200 projects in transmission and storage see Figure 31) to achieve key interconnection requirements in the EU.232 It assumes that the power sector should cut its GHG emissions by 50 to 80 % by 2030 and that in 2030 45 to 60 % of the electricity consumption will be RES based. The TYNDP investments would lead to all countries meeting the EU 10 % interconnection target by 2020 except for Spain. The overall interconnection capacities would double by 2030, and would lead to reduced congestion hours (- 40 %). The impact of this investment plan on the end-user’s bill is estimated at 1 to 2 EUR /MWh, but this increase would in principle be compensated for by the reduction they should enable in wholesale prices (1.5 to 5 EUR /MWh).
Figure 31: Investment cost breakdown per ENTSO-E member country (in billion euro)
Note: *TYNDP 2014 includes a project between Iceland and GB, nevertheless, cost figures are not allotted to the two countries due to the very long term status. Source: ENTSO-E – TYNDP 2014. Information not available in draft TYNDP 2016.
230 ACER/CEER (2016), Annual Report on the Results of Monitoring the Internal Electricity Markets in 2015. 231 ACER/CEER (2016), Annual Report on the Results of Monitoring the Internal Electricity Markets in 2015. 232 The main interconnections needed, according to the TYNDP 2016 (draft) include: Ireland - Great Britain; Norway and
continent - Great Britain; Nordic – Mainland West; Nordic/Baltic to continental Europe East; Baltic states integration; Central East integration; Iberian Peninsula integration; Italian Peninsula integration; South-East integration; Eastern Balkan border.
Policy Department A: Economic and Scientific Policy
88 PE 595.356
In the TYNDP 2014, the investment projects in Germany and UK represent more than half of the overall budget; these investments are mainly related to the shift in the power generation mix to more geographically dispersed and RES based power plants.
According to ENTSO-E, variable renewable energy uptake is the major driver for grid development by 2030. The generation fleet will experience a major shift in the next decade with the replacement of much ageing generating capacity in favour of mainly RES based generating capacity in different locations, further from load centres.233 Levels of overall installed generation capacity rise up to 1400 GW in 2030 across the ENTSO-E perimeter; solar and wind energy account for 390 to 420 GW. Prospects for total electricity production in 2030 range from the 2020 expected level of about 3100 TWh to 3400 TWh depending on the vision. Visions 1 and 2 forecast a substantial share of coal based generation for 2030, while carbon pricing in visions 3 and 4 shifts this generation towards gas-fired plants.234
Local smart grids will help improve energy efficiency and the local balance between generation and load. Nevertheless, ENTSO-E forecasts larger, more volatile power flows over longer distances across Europe, mostly North-South.
Most transmission investment needs are linked to renewable energy integration developments, either because of the need to enable direct connection of renewables or because the network section or corridor is a bridge that links renewables production and load centres.
Box 5: e-Highway2050
The e-Highway2050 project, commissioned by the EC and involving the TSOs, aimed to give a longer-term perspective on planning than ENTSO-E’s TYNDP. The study concluded that Europe does not need the sort of long-distance high-voltage, direct current (HVDC) network proposed a few years ago, but must attend to bottlenecks that need fixing by 2050. It also underlines that the 2030 grid plan from ENTSO-E will be insufficient to support the 2050 policy objective of an 80 % to 95 % cut in GHG emissions. Depending on the scenario, the annual transmission grid investment required to reach this 2050 target is EUR 10-20 billion, for an annual benefit of EUR 14-55 billion. The expected benefits outweigh the costs in all the scenarios.
Source: http://www.e-highway2050.eu/results/
5.2.2. Projects of Common Interest (PCI) The PCI initiative is expected to become a useful instrument to facilitate grid investments, as it efficiently addresses some major barriers that currently hamper investments. However, progress is still rather slow, and the implementation process should be boosted. A more structural cooperation between authorities and TSOs at regional level to cope with critical project related issues, such as permitting, costs/benefits allocation and financing would contribute to improving this process.
PCIs are selected from the TYNDP list of transmission and storage projects, as defined by regulation 347/2013. This regulation requires project promoters to draw up an implementation plan, including a timetable regarding feasibility and design studies, approvals by the authorities, permitting, construction and commissioning. It also obliges ACER and the
233 ENTSO-E (2014), 10-year Network Development Plan 2014. 234 ENTSO-E (2016), Future system perspectives.

European Energy Industry Investments
PE 595.356 89
Regional Groups to monitor the progress achieved in implementing the PCIs and, if necessary, make recommendations to facilitate their implementation.235
In 2013 the first list of PCIs was established by delegated Regulation C(2013)6766. It contained 248 projects, of which 132 were in electricity generation or transmission and 2 in smart grids.236 The updated PCI list237 has 195 key projects and includes 111 electricity projects (of which 3 are smart grid projects and 9 storage projects). Of these 111 projects, 20 are new and the rest were in the previous list.
By 2022, promoters reported that EUR 33 billion would have to be invested (CAPEX in 2016 values).238 83 of the electricity PCIs are expected to bring EUR 110.6 billion of (indicative) benefits.239
Figure 32: Type of electricity and smart grid PCIs
Source: Prepared by Trinomics based on Technical information on PCIs accompanying the Commission Delegated Regulation (EU) 2016/89
All MSs, except Malta and Finland, are involved in at least one PCI.
235 SWD (2014) 314: Implementation of TEN-E, EPR and PCI projects. 236 SWD (2014) 314: Implementation of TEN-E, EPR and PCI projects. 237 COMMISSION DELEGATED REGULATION (EU) 2016/89 of 18 November 2015 amending Regulation (EU) No
347/2013 of the European Parliament and of the Council as regards the Union list of projects of common interest. 238 Not all PCIs will be implemented (e.g. some of them are competing projects). Source: ACER (2016), Consolidated
report on the progress of electricity and gas projects of common interest for the year 2015. 239 ACER (2016), Consolidated report on the progress of electricity and gas projects of common interest for the year
2015.

Policy Department A: Economic and Scientific Policy
90 PE 595.356
Figure 33: Number of electricity PCIs per MS
Note: PCIs can be allocated to more than one country (interconnection PCIs)
Source: Prepared by Trinomics based on Technical information on PCIs accompanying the Commission Delegated Regulation (EU) 2016/89
a. Reporting and evaluation process
Project promoters of the selected PCIs report annually on the progress achieved, delays, and updated planning as required by Regulation 347/2013. To reduce administrative burden, this process is done via a set of forms in a single online reporting window. While this has proven successful, with most project promoters reporting in time, completeness and quality of the reporting vary greatly.240 Based on this reporting, ACER is required to monitor PCI implementation.241 The following sections are based on ACER’s latest report and an assessment of the latest PCI list and its accompanying technical information.242
b. Consistency of PCIs with National Network Development Plans and the TYNDP
PCIs are not always included in the National Network Development Plans (NDPs) of the host Member State(s). 14 of the 111 electricity PCIs are not included in any NDP, while 29 PCIs hosted by more than one MS are only included in one NDP. PCIs are mostly recognised as a national priority by the concerned MSs. In the Iberian Peninsula, for example, all PCIs are included within Spain and Portugal’s NDPs (see case study in annex 4). The German NDP also includes most PCIs relevant to the German transmission network. The permission process for PCIs, however, does not differ from regular national grid extension projects (see case study in annex 3).
The PCI list is not fully aligned with the latest TYNDP. The TYNDP 2014 does not include one transmission PCI and one smart grid PCI; while ENTSO-E’s Regional Investment Plans 2014 do not include three electricity PCIs (two smart grid and one transmission project).
c. Implementation
Only 17 % of the electricity PCIs were under consideration, while the majority (52 %) were already in the permitting or construction stage (See Figure 34). Around 75 % of the PCIs are expected to be commissioned between 2017 and 2022. According to ACER, this 240 For electricity projects, only one promoter was late and one promoter did not submit at all. 241 ACER has published two consolidated reports on the progress of electricity and gas Projects of Common Interest
(in 2015 and 2016). 242 ACER (2016), Consolidated report on the progress of electricity and gas projects of common interest for the year
2015; and Technical information on Projects of Common Interest accompanying the Commission Delegated Regulation (EU) 2016/89.

European Energy Industry Investments
PE 595.356 91
commissioning peak seems unrealistic as it would mean that the pace of construction and commissioning would far exceed the pace observed in the last 10-15 years – even if competing non-PCI projects are not taken into account.
Figure 34: Number of electricity PCIs according to their status and commissioning dates (as of 2016)
Note: One PCI has no commissioning date defined. Source: Prepared by Trinomics based on Technical information on PCIs accompanying the Commission Delegated Regulation (EU) 2016/89.
ACER report that approximately two-thirds of electricity PCIs are behind their initial 2012/2013 schedule. The average duration of delays is 26 months when compared to 2012 data; while average rescheduling is 4 years when compared to 2012 data. However, the implementation progress differs between regions: one PCI has been delayed in the Iberian Peninsula (e.g. PCI code number 2.17), but no PCI in the Baltic region is experiencing delay (see case study in annex 5).
The main cause for delays is the permitting process. Projects were also delayed due to interdependence with other investments and tendering procedures, and to a lesser extent for other reasons such as cross-border coordination, national law changes impacting the technical solution of the project, risks related to the national regulatory framework or financing issues.
The main reason for rescheduling was that priority was given to other transmission investments. Another important reason was better estimates of commissioning dates and planning.
Figure 35: Number of electricity PCI according to the assessment of their status (as of 2016, compared to 2015)

Policy Department A: Economic and Scientific Policy
92 PE 595.356
Source: Prepared by Trinomics based on ACER (2016), Consolidated report on the progress of electricity and gas projects of common interest for the year 2015. 30 projects were reported as facing difficulties (though most of them remained on time with their planning). The most frequent difficulties were related to permitting, and in five cases to the acquisition of land.
5.3. Evaluation of selected national investment/development plans
5.3.1. Germany Development of infrastructure for energy generation and transport in Germany is strongly influenced by geographical and historical factors. Electricity demand is highest in the southern and western regions which have the highest population density and strong industrial centres. The potential for renewable energy sources (RES) are also unevenly distributed: winds are strongest in the northern regions close to the North and Baltic Seas while solar potential is highest in the south. Pumped hydro storage, which requires a certain altitude difference, can also be found mainly in the southern part of Germany.
The electricity grid was built with a focus on historical demand centres and conventional power plants located nearby. Furthermore, interconnection between the eastern and western parts of the country was limited due to the division during the cold war.
The success of the Renewable Energy Act has led to a drastic change in the power generation structure in Germany. The share of renewables in gross electricity consumption in Germany increased from 6 % in 2000 to 31 % in in 2015 with EUR 15 billion invested in power generation from renewable energies in 2015.243 In contrast to the steep increase in renewable capacities; conventional generation capacities have decreased since 2000 and there is very limited fossil capacity under construction (5 GW in 2014).244
The grid infrastructure has not kept pace with this development. Whereas the security of supply remains high and the number of outages low245, missing transmission capacity has led to wind turbines having to be switched off when gusts were strongest and to an increasing need for redispatch. The rapid development of wind energy, mainly in northern and eastern parts of the country, together with cheap lignite power plants in the same regions and limited grid capacity in East-West directions have also led to loop flows from north-eastern Germany via Poland and the Czech Republic to the south of Germany and to Austria.246
Since grids are a natural monopoly, their operation and expansion are closely monitored by the Federal Grid Agency (Bundesnetzagentur, BNetzA) which coordinates and organises the process to adapt the German high voltage electricity grid to the requirements of the changing generation structure. The introduction of the Law on the Expansion of Energy Lines (Energieleitungsausbaugesetz, EnLAG) in 2009 simplified permitting procedures for new power lines and thus slowly led to an increase of investments into the power grid and new transmission lines. This process was significantly accelerated by the introduction of the Grid Development Plan (Netzentwicklungsplan) and the Federal Requirements Plan Act (BBPlG, Bundesbedarfsplangesetz of 23 July 2013, revised in 2016) which included the most important grid extensions for the next ten years. The four main transmission system operators (TSOs) in Germany (50Hertz, Amprion, TenneT and Transnet BW) play a crucial
243 BMWi (2016): Renewable Energy Sources in Germany. Key information 2015 at a glance. 244 BMWi (2015): Ein gutes Stück Arbeit: Die Energie der Zukunft. Vierter Monitoring-Bericht zur Energiewende. 245 Bundesnetzagentur/Bundeskartellamt (2016): Monitoring report 2015. 246 Loreck et. Al (2013): Auswirkungen des deutschen Kernenergie-Ausstiegs auf den Stromaustausch mit den
Nachbarländern.

European Energy Industry Investments
PE 595.356 93
role in identifying the priority projects for grid development and in reinforcing and building those power lines. TSOs generally support grid extension projects as there may be an incentive to gain some profits while realising an investment instead of having high operational costs for congestion management (Averch-Johnson-effect).247 Participation opportunities for citizens, researchers and non-governmental organisations in the development of investment plans have significantly increased since the introduction of the NDP; stakeholders are invited at various stages to comment.
Nevertheless, realisation of grid projects is still lagging behind the original schedule provided by the EnLAG. By September 2016 35 % of the 1800 km of new transmission lines have been installed, and TSOs expect that 45 % of the total projects will be installed by the end of 2017 and 85 % by the end of 2020. The last project is expected to be finalised by 2025, although the interconnection between Eisenhüttenstadt – Baczyna (PL) is not expected to be finalised before 2030.248
A major hurdle for infrastructure projects is the permitting process. Although there were some simplifications to accelerate grid expansion on a federal level, these simplifications must be adopted at the local level, but local processes are not always updated promptly. Furthermore, because of the federal system, different Länder can have different regulations for planning processes, leading to further delays. Some German grid extension projects defined in the NDP were accepted as PCI. While classification as PCI leads to financial support from the EU, the permitting processes are the same as for non-PCI grid extensions.
The main reason for delays in grid expansion projects is local resistance which complicates the permitting process. Even though participation opportunities have increased, they often either require significant knowledge of processes or only provide very limited possibilities to influence the official plans. The narrow perspective of the NDP scenarios which cover only a limited time frame and might not be in line with long term targets is a key critique of many stakeholders.249 This leads to frustration with, and subsequently opposition to, the process of electricity network expansion in Germany. Furthermore, local resistance has led to an increasing number of projects requiring underground cables instead of overhead lines, which leads to significantly higher costs and planning reviews and delays. This is a major barrier to fast project realisation. A key lesson learnt is that public participation processes are highly important. They should be designed to allow low-threshold interaction between the relevant authorities and citizens or organisations to encourage citizens and stakeholders to participate in these processes and thus increase public acceptance.
5.3.2. Iberian Peninsula At present, there is no need for investments in electricity generation to ensure security of supply. Therefore, current national plans in the Iberian Peninsula give priority to the development of the grid. The development plans are specifically designed to tackle the current main challenges of the MIBEL electrical system: improving the integration of renewable energy based capacity into the grid, enhancing the integration of the electrical system with other Member States and continuing the territorial grid optimisation. For this purpose, Spain and Portugal, with the support of European funds, have committed to ensuring an annual investment level of about EUR 850 million for the 2016-2020 period. The full realisation of national plans, which include the finalisation of the current PCI, may require additional funding.
247 Bundesnetzagentur (2015): Evaluierungsbericht nach § 33 Anreizregulierungsverordnung. 248 BMWi (2016): Bericht nach § 3 des Energieleitungsausbaugesetzes. 249 Gemeinde Prebitz (2016): Szenariorahmen 2030; Stellungnahme der Gemeinde Prebitz.

Policy Department A: Economic and Scientific Policy
94 PE 595.356
In view of the 2020 RES target, the Spanish and Portuguese national development plans also address incentives for investment in new renewable capacity. Both countries have a support scheme for incentivising new large projects, while small scale renewable generation is supported by specific investment schemes, co-financed by the ERDF.
Energy efficiency is a key component in the national development plans. A significant budget will be allocated for this purpose in the coming years with the objective of significantly reducing the per capita electricity demand by 2020.
The assessment of the national development plans of Spain and Portugal shows that the planned investment level will probably not allow the 2020 targets on renewable energy and interconnection to be reached. It also shows that the Iberian Peninsula will still need considerable investments to have a competitive and properly integrated low carbon electricity system and market by 2030.
5.3.3. The Baltic States When they joined the EU (in 2004) the electricity systems and markets of the Baltic States, Estonia (EE), Latvia (LV) and Lithuania (LT), were poorly interconnected to each other and there was no grid interconnection with the neighbouring EU Member States.
The Baltic Energy Market Interconnection Plan (BEMIP), which is part of the overall 'EU Strategy for the Baltic Sea Region' aims to integrate the Baltic States’ electricity system and market via new infrastructure, while eliminating energy islands. The regional investment plan BEMIP acknowledged that significant investments in transmission networks were required both for internal grid reinforcement and increasing interconnection. BEMIP is recognised as an example of good practice for regional cooperation.250
Several infrastructure projects were proposed to implement the BEMIP strategy and goals (some of which became PCIs). Almost all BEMIP projects are completed or under construction and received EU funding support.251 This has led to a significant increase of the interconnection capacity with EU countries from 4 %252 in early 2014 to 10 % after the completion of Estlink2 in 2014253, and to 22.8 % in 2015 after the completion of NordBalt and LitPol Link. BEMIP PCI are mostly progressing according to the reported schedule (with 82 % of electricity PCI on time), and no PCI is experiencing major difficulties in the BEMIP corridor.254 The fact that BEMIP projects benefit from EU financial assistance and that some of them are recognised as PCI with accelerated permit granting are both valuable aspects that have facilitated the implementation of BEMIP.
The Baltic States have made a political commitment to connect into the Synchronous Grid of Continental Europe (SGCE). The most important step towards synchronisation is a common regional political decision.255 National documents in all three countries reflect the need for grid interconnection.
According to the TYNDP assessment, CBAs for the Baltic projects show socio-economic welfare (SEW) contributions ranging from 35 to 80 M EUR/year, which corresponds to 50 M
250 https://www.em.gov.lv/en/news/5473-baltic-energy-market-interconnection-plan-is-a-great-example-of-
regional-cooperation. 251 https://ec.europa.eu/energy/sites/ener/files/documents/20142711_6th_bemip_progress_report.pdf. 252 While highly integrated with each other, this figure of 4 % represents the level of interconnection with other
European electricity markets via Finland in early 2014. 253 COM (2015) 82, Achieving the 10 % electricity interconnection target - Making Europe's electricity grid fit for
2020. 254 ACER (2016), Consolidated report on the progress of electricity and gas Projects of Common Interest. 255 Niglia, A. (2015), The Protection of Critical Energy Infrastructure Against Emerging Security Challenges.

European Energy Industry Investments
PE 595.356 95
EUR/year per additional GW of transfer capacity across the boundary range from Nordics and Baltics to Continental Europe East.256 When balancing the SEW contributions and the infrastructure investment costs, “the optimal level of interconnection ranges from 1 GW to 2.5 GW between the Nordics/Baltics and the Continental Europe East”.
5.4. Concluding remarks Electricity investments are at present mainly driven by policy (energy and climate goals and targets) and technology developments. In this context, the major investment trends are: the decarbonisation of the energy supply, a shift from mainly centralised large scale electricity generation to decentralised and small scale generation, and digitalisation of the energy system (smart appliances and systems). At the same time, end-users are becoming more actively involved in energy investments, either as investor in own assets for self-production, as co-financer of generation assets (e.g. crowd-funding and cooperatives for investments in renewables, such as wind-parks) or as investor in energy efficiency and demand response. This transition has a large impact on conventional power generation operators (limited investments in new capacity, profitability under pressure, phasing out of existing capacity), and on the electricity system (implementation of schemes to ensure system and supply security).
As a result of the unbundling on the one hand and the liberalisation of electricity generation and supply on the other hand, national overall investment plans are not established any more. Power generators are legally obliged to notify their investments but, in today’s competitive and rapidly changing economic and political situation, they do not publish investment plans any more. Grid operators are, however, legally obliged to establish investment plans and national authorities are assessing their security of supply via development plans at national/regional level. In this study, we have focused on transmission (including interconnection) related investment plans and some national/regional development plans. Based on this analysis and the identified investment needs (see chapter 2), we can conclude that the current investment levels and trends will in general allow the EU to meet its 2020 climate and energy targets, but that additional policy measures and higher investment levels will be needed to reach the 2030, and a fortiori the 2050, targets.
256 http://tyndp.entsoe.eu/exec-report/sections/chapters/16-nordic-east.html.
Policy Department A: Economic and Scientific Policy
96 PE 595.356
POLICY OPTIONS TO FOSTER INVESTMENTS IN THE ELECTRICITY SECTOR
In this chapter, we identify possible policy options and market arrangements to foster energy investments, and assess each option based on its effectiveness to incentivise low carbon investments and its contribution to the policy objectives: economic efficiency and competitiveness (including level playing field between MS, operators and technologies), sustainability and security of supply. We have also evaluated their implementation feasibility and proportionality. These are theoretical policy options that have been identified from literature on the basis of their ability to strengthen the drivers and/or reduce the barriers for investments. Chapter 7 provides our recommendations which are based on this assessment of the policy options as well as on our analyses in the previous chapters.
6.1. Identification and assessment of possible policy options The first group of policy options concerns methods of incentivising investments in the liberalised subsectors via properly functioning electricity and carbon markets. These policy options include:
• Liquid and EU wide integrated electricity wholesale and ancillary services markets.
• Market-based, predictable and harmonised national policies and support schemes.
• Internalisation of GHG emission cost via stronger carbon price signals.
• Abolishing price regulation in electricity retail and wholesale markets.
• EU wide capacity market with suppliers’ obligation to ensure RES development and security of supply.
If the carbon and electricity price signals generated by properly functioning markets are not sufficient to trigger the required investments, the following policy options can be considered to incentivise low carbon investments:
• An EU wide legal initiative to phase out outdated conventional power plants.
• Abolishing ETS and replacing it with an EU wide carbon tax.
• Tendering at (supra)national level for conventional and/or RES generation capacity (technology specific or technology neutral tendering).
The regulatory framework is very important to facilitate investments, both in the regulated (grids) and non-regulated subsectors; to this end we identified two specific policy options:
• Determining clear EU wide rules to encourage investments in flexibility (storage and demand response).
• Enabling a more rapid permitting procedure for investments in grids and power generation units.
Finally, we identified two policy options to improve the financial framework for electricity investments in the regulated and not regulated sub-sectors:
• Facilitating availability of, and access to, appropriate public and private financing instruments and partners for electricity investments.
• Providing more targeted and coordinated public support at EU level for research & development (including pilot projects) in innovative and promising technologies.
The remainder of this chapter further explains and evaluates these different options.

European Energy Industry Investments
PE 595.356 97
Liquid and EU wide integrated electricity wholesale and ancillary services markets with appropriate contract formulas
This policy option aims to offer adequate price signals to investors in power generation, storage and demand response by enlarging the market size (and hence reducing market power of incumbents) and setting up liquid and integrated supra-national markets for electricity and ancillary services.257 In this context, the possibility to conclude appropriate short and long-term physical and financial contracts via a liquid market platform or power exchange, in order to hedge market and counter-party risks will contribute to enhance investors’ certainty.
PROS CONS
• Higher economic efficiency and security of supply
• Enhanced and fairer competition • Overall lower and converging prices for
electricity and ancillary services • Support from industry
• Reduces MS, NRAs and TSOs’ sovereignty
• System and market integration is hindered by limited interconnection capacity
Market-based, predictable and harmonized national policies and support schemes
The main aim of this option is to create an enabling framework for investments by enhancing the investors’ trust (more stable legislation based on long term objectives and strategy), and by ensuring that national policies (taxes on generation, grid charges on generation/storage, energy mix, etc.) and national schemes (such as CRM and RES) do not distort the market and (cross-border) competition.258
PROS CONS
• Level playing field between MS and technologies
• Higher economic efficiency • Less market distortion • Lower regulatory risk • Support from industry
• Reduces MS’ sovereignty • Complex and slow implementation due
to subsidiarity
Internalisation of GHG emission cost via stronger carbon price signals
The aim of this option is to facilitate and accelerate the transition towards low carbon technologies by raising the price for carbon emissions.259 This result can be achieved by regulating the amount of available EUAs (e.g. sharper decrease of yearly cap aligned with the 2050 target or backloading of EUAs via dynamic market reserve) and/or the price. Most
257 The importance of adapting ancillary services markets and their relationship to energy markets is discussed in
Genoese, F. and C. Egenhofer (2015), The Future of the European Power Market. 258 Several studies have highlighted the need for an efficient long-term regulatory framework and coordinated MS
policies, including respectively: ENTSO-E (2014), Fostering Electricity Transmission Investments to Achieve Europe’s Energy Goals: Towards a Future-looking Regulation; and Friends of Europe (2015), Europe’s Energy Union and the road to Paris and beyond.
259 The following studies highlight the need for stronger price signals via an ETS reform, although proposals on how to achieve this vary: The Shift Project (2016), Strengthening the EU ETS price signal; Carbon Market Watch (2014), What’s needed to fix the EU’s carbon market; Capgemini (2015), 17th Annual Edition of the European Energy Markets Observatory; World Economic Forum (2015), The future of electricity : Attracting investment to build tomorrow’s electricity sector; Friends of Europe (2015), Europe’s Energy Union and the road to Paris and beyond.

Policy Department A: Economic and Scientific Policy
98 PE 595.356
emission trading schemes have some mechanism to manage the price; a similar adaptation could be envisaged for the ETS by implementing a yearly increasing floor price, either applicable to all ETS installations, or only to power plants. The introduction of a floor price in ETS or “climate levy” has been implemented or considered in a number of MSs, e.g. France; an EU wide measure would be more appropriate than diverging national initiatives. To avoid distortions, a similar carbon price should be put on the non ETS emissions via an EU wide carbon tax (which already exists in several MS) on the use of fossil fuels for buildings and transport.
PROS CONS
• Incentivises energy efficiency • Improves economic feasibility of low
carbon investments (in particular RES and CCS)
• Regulatory intervention in a market-based mechanism
• Higher electricity price for end-users • Opposition from some utilities
(depending on their generation fleet) and industrial end-users
Abolishing price regulation in electricity retail and wholesale markets
This option involves free price setting by market parties: retail prices would reflect wholesale prices and hence incentivise end-users to invest in equipment that allows them to reduce their consumption in peak periods and shift it to off-peak periods. Price regulation would be abolished in this option, including in the wholesale market, which would lead to higher remuneration levels during scarcity periods (price could be higher than variable cost of marginal plant and generate scarcity rent). This should more effectively incentivise investments in peak capacity (including storage) and demand response.
PROS CONS
• Security of supply can be ensured without regulatory measures
• Incentivises investments in generation/storage capacity and demand response
• Improves economic efficiency of electricity system
• Support from industry
• Reduces MS’ sovereignty • Requires regulatory oversight to
prevent market abuse • Leads to higher price volatility
EU wide or regional capacity market with suppliers’ obligation to ensure RES development and security of supply
This option is a market-based mechanism that would require electricity suppliers to source year-ahead sufficient capacity to cover the peak demand of their customers. The same mechanism could be used to stimulate RES development by imposing yearly increasing RES quota to suppliers.
PROS CONS
• Incentivises investments in conventional and RES capacity
• Incentivises investments in demand response
• High economic efficiency
• High implementation complexity and administrative cost
• Requires strict regulatory oversight • Electricity sector might oppose to this
option

European Energy Industry Investments
PE 595.356 99
An EU wide legal initiative to phase out outdated conventional power plants
Phasing out outdated conventional power plants would improve the investment climate for investments in state of the art technologies and would accelerate the transition to a low-carbon electricity system. As it is expected that the ETS will not trigger a timely decarbonisation of the power generation fleet, this policy initiative offers a way to incentivise the replacement of “obsolete” power plants with more efficient, environment friendly and flexible low-carbon generation assets. This could be achieved by imposing on power plants stricter EU harmonized standards for energy efficiency, emissions of local pollutants (NOx, SO2, PM), GHG emissions and safety. Some MS have already decided the gradual phase out of nuclear power plants, while other MS are considering a mandatory decommissioning of coal fired power plants after a certain lifetime or on the basis of other criteria. An EU wide initiative based on strict common standards might be more appropriate to avoid competition distortion. Power plants would have to comply with these higher standards (e.g. via specific investments in CCS and/or flue gases treatment) or would have to shut down.
PROS CONS
• It could build upon the Industrial Emissions Directive which already sets emission standards.260
• High potential for positive impact on sustainability (depending on stringency)
• Fosters low carbon investments, DR & EE
• Contributes to level playing field for generators
• Strong opposition from concerned power generators: risk of legal cases
• Overlaps with ETS unless a corresponding amount of allowances can be cancelled (as proposed by the ITRE committee in the European Parliament)
• Higher electricity cost for end-users • Enforcement issues • Long compliance period • Security of supply weakened for some
MSs
Abolishing ETS and replacing it with an EU wide carbon tax
If ETS fails to offer an adequate price signal to investors, and if the considered adaptations are not feasible or do not result in a sufficiently high and stable carbon price to incentivise investments in low carbon technologies, its abolishment and replacement with a carbon tax can be considered.261 This EU wide tax could equally apply to both ETS and non ETS emissions.
PROS CONS
• Level playing field for ETS and non ETS installations
• Predictable economic signal for investors
• Incentivises energy efficiency
• Not market based • Tax level cannot automatically be
adapted to actual emission levels and targets
• Higher electricity price for end-users • High implementation cost
260 The EU Directive on industrial emissions (IED, 2010/75/EU) regulates pollutant emissions from industrial
installations, covering e.g. emissions to air, water and land, generation of waste, use of raw materials, energy efficiency, noise, prevention of accidents, and site restoration.
261 Certain EU Member States already have a carbon tax on energy products in place, such as Denmark, Ireland, Slovenia, Sweden, Finland, France and the UK. Source: EC (2015), Tax Reforms in EU Member States – 2015. Tax policy challenges for economic growth and fiscal sustainability. European Economy Institutional Papers.

Policy Department A: Economic and Scientific Policy
100 PE 595.356
• Improves economic feasibility of low carbon investments
Tendering at (supra)national level for conventional and/or RES generation capacity (technology specific or technology neutral tendering)
In this option, the authorities would ensure security of supply and/or reaching the RES targets by regularly organising tenders, which can be technology neutral or technology specific (specific RES or conventional technologies). The remuneration levels can be output related and based on market prices (variable feed in premiums via contracts for difference) or determined independently of market prices (fixed feed in prices or premiums). It can also be coupled to the investment (capacity fee).
PROS CONS
• Effective measure to ensure security of supply and/or RES development
• Technology specific tenders incentivise investments in concerned technologies
• Technology neutral tenders offer high overall economic efficiency
• High implementation complexity and cost
• Requires strict regulatory oversight • Can harm market functioning • Considered by electricity industry as
“last resort” option to ensure generation adequacy
• Can lead to competition distortions between investors and technologies
Determining clear EU wide rules to encourage investments in flexibility (storage and demand response)
This option consists of determining a consistent set of market rules and regulatory provisions at EU level to facilitate storage and demand response. The rules should ensure a level playing field among all flexibility resources and market players. The rules should also offer clarity about critical issues such as the ownership of storage (in particular the possible role of grid operators in this domain) as well as the grid access conditions. The current situation in the EU is very heterogeneous and leads to competition distortion and lower overall economic efficiency. For DR, the rules should focus on the roles and responsibilities of the market parties (end-user, aggregator, supplier) and grid operators, and the instruments to facilitate demand response (in particular data exchange and smart metering).262
PROS CONS
• Effective measure to incentivise investments in storage and DR
• Higher economic efficiency of the electricity system
• Level playing field for flexibility resources
• Reduces MS’ sovereignty
262 The challenge of ensuring appropriate remuneration for flexibility options is detailed in NERA (2016), Making
Flexibility Pay: An Emerging Challenge in European Power Market Design.

European Energy Industry Investments
PE 595.356 101
Enabling a more rapid permitting procedure for investments in grids and power generation units
In this option, large investments in grids and power generation would be legally considered as “infrastructure of public interest” to facilitate and shorten the permitting process. In this option, such investments would only be subject to a single permit, which would integrate the variety of parallel permits (environment, building, etc.) which currently exist in different MS.263
PROS CONS
• Effective measure to reduce investors’ risks and administrative costs via one stop shop
• More efficient planning and permitting procedures
• Support from industry
• High implementation complexity • Reduces sovereignty of national and
local authorities • Can lead to legal cases from opponents
to electricity infrastructure (public versus private interests)
• May reduce public acceptance of infrastructure
Facilitating availability of, and access to, appropriate private and public financing instruments and partners for electricity investments
Capital availability is as such not considered as a major barrier for electricity investments by most stakeholders.264 However, the high capital intensity of most investments, combined with lower margins and increasing (regulatory and market) risks, lead to a lower investment appetite. In this policy option, we therefore suggest a political initiative to enhance, in close cooperation with the financial sector, the development and availability of specific instruments (in particular project or green bonds, project-based or sector-wide cooperative associations, revolving funds and hybrid securities) and of partnerships (with private equity funds and institutional investors such as pension funds) to facilitate the financing of electricity investments. In this context, the contribution of public funds could also be enhanced, e.g. by reallocating part of the CEF budget from transport to energy or by granting mezzanine debt265 via EFSI. This option could also include a centralised allocation of (part of) the congestion income from interconnections as a financing source for transmission infrastructure of pan-European interest.
PROS CONS
• Reduces investors’ risks • Can enhance leverage potential • Reduces financing cost of investments • Support from electricity industry
• Limited room in public budgets for additional funding
• Effectiveness and overall impact might be limited
263 As explained in earlier chapters, the TEN-E regulation includes a provision to facilitate permitting for PCIs.
However, permitting is an issue for most electricity infrastructure investments, in particular in transmission. Source: DG ENER (2015), Study on comparative review of investment conditions for electricity and gas Transmission System Operators (TSOs) in the EU.
264 This statement is based on interviews. 265 Mezzanine debt is part loan and part investment; it is not collateralized by assets and is usually in the second
position with assets (while a bank loan is always secured and in the first position). Mezzanine loans are made against the cash flow, not the assets of the business. Because of this feature, mezzanine debt providers (pension funds, infrastructure funds) use different criteria than banks in qualifying borrowers.

Policy Department A: Economic and Scientific Policy
102 PE 595.356
Providing more targeted and coordinated public support at EU level for research & development (including pilot projects) in innovative and promising technologies
In this option the public support for energy related R&D would be raised to contribute to reaching the overall target level of 3 %266 and would be more targeted towards technologies with a high potential. This option would also include better support for the first implementation phase (demonstration projects). This is designed to overcome the current situation, where there appears to be a financing problem, and limited policy support, for this stage which leads to a lack of support for commercially attractive technologies.267
PROS CONS
• Effective measure to reduce investors’ risks for research and demonstration projects
• Can leverage higher private financing for research and development programs
• Support from industry
• Not properly designed support schemes can lead to stranded investments and competition distortion between technologies and operators
• Limited room in public budgets to raise financial support
6.2. Assessment of the effectiveness of the proposed policy options and of their contribution to the policy objectives
The table below provides a qualitative assessment of the proposed policy options. They have been ranked according to their effectiveness to incentivise electricity investments; their implementation feasibility; their proportionality; and their contribution to the EU energy policy objectives of competitiveness, sustainability, and security of supply.
On the basis of this evaluation we can conclude that the first group of policy options, which aim to incentivise investments in the liberalised subsectors via properly functioning electricity and carbon markets, have in general the highest positive scores. The other considered policy options are to a certain extent also effective to incentivise investments and they contribute to some or all policy goals, but their implementation and/or proportionality seem rather critical issues.
266 This target refers to the EU’s overall (public and private) R&D investment approaching 3 % of gross domestic
product (http://ec.europa.eu/europe2020/pdf/targets_en.pdf). 267 CE Delft (2016), Investment challenges of a transition to a low-carbon economy in Europe – what sets the pace?

European Energy Industry Investments
PE 595.356 103
Table 13: Assessment of policy options
Policy option Barriers addressed Concerned investments
Effectiveness to incentivise investments
Implemen- tation
feasibility
Propor- tionality
Contribution to policy objectives
(competitiveness, sustainability,
security of supply)
Liquid and EU wide integrated electricity wholesale and ancillary services markets
Market concentration and limited market size Inadequate price signals
Generation, storage, demand response
++ (Generation, storage, DR) + ++
Higher security of supply & positive impact on competitiveness (lower & converging prices). Positive impact on sustainability (higher overall efficiency)
Determining clear EU wide rules to encourage investments in flexibility (storage and DR)
Divergent national policies leading to competition distortion
Flexible generation, storage, demand response
+++ (storage & flexible generation & DR)
+ + Positive impact on all policy goals
Providing more targeted and coordinated public support at EU level for R&D in innovative and promising technologies
Overlapping support schemes, unused funds
Generation, storage, demand response, grids
+ (all investments) +++ + Positive impact on all policy goals
Facilitating availability of, and access to, appropriate public and private financing instruments and partners
Limited access to and cost of financing means
Generation, storage, demand response, grids
+ (all investments) + + Positive impact on all policy goals
Internalisation of GHG emission cost via stronger carbon price signals
Too low carbon price to trigger investment
Generation, storage, demand response
++ (low carbon, DR, storage) + +
Positive impact on sustainability (reduced GHG) and competitiveness (level playing field)
Enabling a more rapid permitting procedure for investments in grids and power generation units
Complex/long permitting procedure High risk perception from investors
Generation, storage, grids
++ (generation, storage, grids) - - Positive impact on all policy
goals
Abolishing price regulation in electricity retail and wholesale markets
Divergent national policies Inadequate price signal for investments
Generation, storage, demand response
++ (peak capacity -including storage, and DR)
+ - Positive impact on security of supply (via investments in peak

Policy Department A: Economic and Scientific Policy
104 PE 595.356
Policy option Barriers addressed Concerned investments
Effectiveness to incentivise investments
Implemen- tation
feasibility
Propor- tionality
Contribution to policy objectives
(competitiveness, sustainability,
security of supply)
capacity, storage & DR) and competitiveness
Tendering at (supra)national level for conventional and/or RES generation capacity
Low profitability of generation Generation assets +++ (Conventional and/or RES)
- -
Positive impact on sustainability (increased RES) and security of supply. Possible positive impact on competitiveness
Market-based, predictable and harmonised national policies and support schemes
Divergent & unstable national policies (regulatory risk) Low investor trust
Generation, storage, demand response, grids
++ (all investments) - -
Positive impact on competitiveness (level playing field between MSs and technologies) and security of supply
Abolishing ETS and replacing it with an EU wide carbon tax
Too low carbon price to trigger investments
Generation, storage, demand response
++ (Low carbon, DR, storage) - - -
Positive impact on sustainability (reduced GHG) and competitiveness (level playing field)
EU wide capacity market with suppliers’ obligation to ensure RES development and security of supply
Low profitability for generation Not harmonised national policies
Generation, storage, demand response
+ (All investments) ++ (RES) - - -
Positive impact on sustainability (increased RES) and security of supply.
An EU wide legal initiative to phase out outdated conventional power plants
Low profitability of generation High capacity reserve margin
Generation, storage, demand response
+ (Low carbon, DR, storage)
- -
Positive impact on sustainability (reduced coal share in energy mix) – Negative impact on competition/competitiveness and security of supply
Note: Option with limited (+), medium (++) or high (+++) positive or negative (-) impact for the different assessment criteria.

European Energy Industry Investments
PE 595.356 105
RECOMMENDATIONS
7.1. Investors’ certainty should be enhanced by more consistent, stable and balanced policies based on long term strategy and objectives
The current policy measures have a strong focus on power generation with the development of grids, demand response and storage lagging behind, although they are equally important to reach the policy objectives. Moreover, most policies prioritise sustainability, and seem to neglect their impact on competitiveness and security of supply. More consistency and balance between policies is needed, and they should be defined to facilitate a cost-efficient transition to a secure low carbon energy supply. Grid investments should be facilitated by appropriate grid tariff regulation while investments in non-regulated assets should be enabled by market based and technology-neutral policies. Technology choices and energy mix should not be imposed by authorities in a competitive market. National policies and rules (taxes, grid charging principles, etc.) should offer certainty to investors and be coordinated at the regional or EU level, in particular via timely and consistent implementation of European legislation across Europe.268
7.2. Targeted and coordinated support schemes to foster investments in RES National support schemes should be carefully designed and coordinated at regional or EU level, and focus on technologies that can make a significant contribution to reaching the energy and climate goals and targets, and that are not yet competitive but have a sufficient potential for cost reduction.
Investments in mature technologies should in principle not receive public funding support but must be made feasible via market based mechanisms. If Member States choose to continue to provide support for mature RES after 2020, it should be done in the most cost-efficient and market-based way: the schemes should contribute to the market integration of RES and avoid market and competitive distortions. Tendering-based investment support can be considered a more appropriate option for this than operational support determined by authorities. Further alignment of the key characteristics of support schemes, based on common EU rules, should take place. The partial opening of support schemes, joint projects and regional schemes, or the implementation of an EU wide suppliers’ obligation to enable an annual increase in RES share, provide other means to increase consistency and adopt a more cost efficient and market based approach to RES.
7.3. Research, development & innovation (RDI) should focus on promising technologies as well as on new services, market models and data management
Innovation is key to the transition to a low carbon energy system, and should be fostered by coordinated EU-level and MS initiatives. Private and public R&D budgets should be targeted on different phases of R&D to facilitate both incremental and radical innovation. Public financing instruments and funds should leverage private-sector efforts to finance R&D.
The new energy related R&D priorities have been defined in the Strategic Energy Technology Plan (SET-Plan)269, i.e. renewable energy technologies, a smarter energy system, energy efficiency and other low carbon technologies (CCS and nuclear). In this context, it is deemed
268 The need for investors’ certainty is highlighted in several publications, e.g. Marsh (2014), The state of the Power
Industry: the lost era of regulatory certainty and WEC (2015), The Future of Electricity: Attracting investment to build tomorrow’s electricity sector.
269 C(2015) 6317, Towards an Integrated Strategic Energy Technology (SET) Plan: Accelerating the European Energy System Transformation.

Policy Department A: Economic and Scientific Policy
106 PE 595.356
appropriate to also specifically focus on storage and other flexibility solutions, and to strive for more cross-border, cross-sector cooperation and joint RD&I actions. RD&I should also underpin and facilitate the implementation of new market models (e.g. to value the flexibility potential on the demand side), new services and products, data management and communication technologies.
7.4. Coordinated and harmonised policies to stimulate investments necessary for security of supply
If existing market arrangements and capacities, including from import, storage and demand response do not ensure security of supply, capacity remuneration mechanisms (CRM) can be an appropriate instrument. To avoid market or competition distortions, CRMs should be carefully designed (market-based and market-wide, technology neutral, open for cross-border participation) and implemented at the regional or EU, rather than national, level. Both a decentralised obligation on suppliers270 and a central buyer mechanism could be considered to ensure long-term security of supply in a cost-efficient way.
7.5. Policy initiatives are needed to facilitate investments in storage Storage has a large potential to provide cost-efficient balancing of the electricity system. It should therefore be enabled to compete on equal terms with other sources of system flexibility, in particular demand response and flexible generation. Market platforms should be set up where storage operators can offer their flexibility to market parties and grid operators. Large scale storage is well established in Europe, and small scale storage is now being developed in some MSs, mostly linked to local RES production and smart systems. At present, the status and market rules (principles for grid charging, ownership) of storage are, however, not defined at EU level and MSs have implemented diverging principles and rules that lead to competition and market distortion, and hence to a sub-optimal system and market function. Therefore, a harmonised and supporting EU-level regulatory framework should be developed, with clear and non-discriminatory rules for storage that is owned and operated by either generators/suppliers or end-users. Grid operators should in principle not invest in storage but procure their needs for balancing services via the market.271 If specific schemes are implemented to ensure security of supply (CRM), storage should be allowed to participate on equal terms with other technologies.
7.6. Investments to increase interconnection capacity should be boosted The availability of interconnection capacity is of extreme importance to integrating national markets and systems and accommodating an increasing RES share. The PCI approach is a very good initiative but its concrete implementation should be boosted. Coordination of the regulatory approach and permitting seem to remain critical issues; a structural coordination between national authorities and regulators at regional level might facilitate this process. ENTSO-E has set up six regional groups to address the challenges for grid development and the integration of RES at a regional level through a structure which reflects the regions’ particularities and needs. Governments and regulators should consider setting up a similar structure to facilitate the coordination of supranational issues amongst them and with TSOs.
270 Such a legal obligation would require electricity suppliers to source year-ahead sufficient capacity to cover the
peak demand of their customers. 271 The Electricity New Market Design Package released on 30 November 2016 provides a clarification of the role of
grid operators with respect to energy storage, and comprises provisions to stimulate a market-based development of storage.

European Energy Industry Investments
PE 595.356 107
Delays in the realisation of cross-border investments due to diverging national views regarding cost allocation should be avoided by a proper implementation of the TEN-E regulation 347/2013, which provides concrete guidelines.272 If necessary ACER’s role could be reinforced to ensure adequate implementation.
The uniform interconnection target for all MSs (10% of installed generation capacity by 2020) is a good initiative, but it is not an effective driver for investments. A more differentiated approach towards target setting, which takes into account the impact of interconnection capacity on security of supply and market and system integration, would be more appropriate and allow for greater focus on investment projects with the largest overall social welfare.273 If MSs are reluctant to finance investments that offer European added value but mainly benefit other countries, a co-financing mechanism at EU level could be considered. Such a mechanism could be financed by the revenues from congestion at the borders and/or a specific, uniform European component in the national grid tariffs.
Due to the growth of RES, the availability of interconnection capacity for market transactions has become a critical issue. The methods to calculate and allocate capacity to market parties have been improved, but these improvements are being cancelled out by increasing unscheduled and loop flows. Consequently, the effective availability of capacity to the market has dramatically decreased and day-ahead wholesale prices in the different coupled bidding zones are diverging, after several years of increasing price convergence. This issue should be urgently addressed by proper technical and political measures and investments.274
7.7. Adequate regulation and supporting initiatives to incentivise grid investments
Access to financing sources is not, in general, a major problem for grid operators, as grid investments are considered low economic and technical risk assets with guaranteed revenues. However, the perception of regulatory risk has an impact on the cost of capital. Therefore, to reduce this risk and consequently the financing cost, national regulators should offer certainty that investments can effectively be recovered via the grid tariff (ensuring no sunk cost if projects or assets are abandoned for technical, economic or regulatory reasons), and that the remuneration will remain at a predictable and investor-attractive (market-based) level. Operational risks of grid operators (e.g. liability for black-outs, cost to mitigate congestion) should also be properly addressed in the regulation.
7.8. Facilitate access to co-financing instruments and partners, including European funds
In order to facilitate access to financing sources and limit the capital cost, authorities should offer certainty to investors as a way of reducing the regulatory risk. At present the availability and cost of capital do not seem to be a major barrier for investments. Investments are more constrained by an inappropriate legal / market framework than by the lack of financial sources. Several (new) instruments (cooperatives, green bonds,
272 Promoters propose cost-allocation (after consulting TSOs) but decision is the concerned regulators’ responsibility.
If no common decision can be taken, ACER provides binding decision. 273 The European Court of Auditors also recommends to consider electricity interconnection objectives based on
market needs rather than on production capacity; see its publication (2015) Improving the security of energy supply by developing the internal energy market: more efforts needed.
274 This policy recommendation is in line with the position of ACER (2016) in its Recommendation No 02/2016 of 11 November 2016 on the common capacity calculation and redispatching and countertrading cost sharing methodologies

Policy Department A: Economic and Scientific Policy
108 PE 595.356
crowdfunding, different types of debts) and partners (private equity companies, banks, pension funds) are available to co-finance electricity investments.
At the EU level, several instruments / programmes for granting financial funding or guarantees to energy infrastructure investments exist. These programmes effectively facilitate the financing of projects, enhance the leverage potential and/or reduce the risk exposure leading to lower capital costs. The European added value and additionality of these funds are difficult to quantify,275 but our case studies show that EU financial support to electricity transmission projects of supra-national interest is a key element for their effective realisation.
Considering the growing role of electricity in Europe’s energy mix we suggest considering a shift in the fund allocation.276 It may also be appropriate to define a more consistent approach across project types, ensuring that a common set of criteria are used for project evaluation.
Finally, we suggest that a further enhancement of the effectiveness of these instruments could be achieved by avoiding overlaps between EU programmes and promoting stronger interactions between investment projects. The access of new entrants and small players to these European instruments should also be facilitated.
7.9. Authorities should allow carbon and electricity markets and grid operators to offer appropriate price signals to investors
Currently, investors are not getting the right price signals to invest in low carbon technologies: fossil fuels are still subsidised and the carbon price does not (fully) internalise the external cost of the emissions. Phasing out subsidies to fossil fuels and reinforcing the ETS would help address this and would be positive measures in facilitating the transition to a low carbon energy supply. The backloading of 900 million EUAs277 in 2013 and the introduction of the Market Stability Reserve will slightly raise the carbon price levels, but the impact of these actions will not be sufficient.
To further enhance the effectiveness of the EU ETS two additional measures should be considered: an increase of the Linear Reduction Factor in line with the 2050 decarbonisation objective and a substantially higher Market Stability Reserve. If these measures are not feasible or sufficient, the implementation of an EU wide steadily increasing price floor should be considered278; a similar carbon tax should be applied on fossil fuel consumption in non- ETS sectors.
Electricity markets should offer effective price signals to investors; therefore, policymakers should not distort competitive wholesale market price formation by setting price caps or by imposing fixed feed-in tariffs for certain technologies. Retail prices should reflect the evolution of wholesale prices in order to incentivise end-users to benefit from the price volatility and contribute to balancing the electricity system. Thus, regulated retail prices should be progressively phased out and suppliers should be allowed and stimulated to offer enabling and innovative electricity price schemes in order to incentivise end-users to participate in the energy and/or ancillary services market, either directly or via their supplier or aggregator. Specific social measures or regulated prices should only be maintained for vulnerable consumers.
275 European Court of Auditors (2015), Improving the security of energy supply by developing the internal energy
market: more efforts needed. 276 E.g. by increasing the share of ESIF allocated to energy related projects (currently only 0.5%). 277 EU Allowance Unit of one tonne of CO2. 278 The UK government has established a minimum price that British electricity generators must pay for carbon
allowances. Starting from £15.70 in 2013, this minimum price steadily rises by roughly £2/year until it reaches £30 in 2020. From there it further increases by £4/year until it reaches £70 by 2030.

European Energy Industry Investments
PE 595.356 109
Grid tariffs should also offer adequate operational and investment price signals to grid users; time of use or capacity-based tariffs are in this respect more effective than flat rates. Grid tariffs should be fully cost-reflective and based on a transparent and non-discriminatory allocation of network costs. Investments in local production for self-consumption should be facilitated through appropriate market arrangements and grid tariffs that correctly reflect the actual benefits of distributed generation and the related system cost.
7.10. Adequate legal and regulatory framework to facilitate investments in energy efficiency and demand response
Energy efficiency investments should be further enhanced in order to reduce Europe’s primary energy dependence and cost, and thereby contribute to its affordability for citizens and industries. Targeted assistance may be required to facilitate investments for low-income households.
The development of demand response across Europe is varied; it is well developed in most MS in the professional market segment, particularly industrial and commercial companies, but the large potential in the residential segment has not yet been unlocked. To tap this potential, a clear and EU wide harmonised definition of roles and responsibilities, particularly for suppliers (or balance responsible parties), aggregators and grid operators would be helpful. This regulatory framework should also offer clarity regarding the contractual, financial and operational (data management and exchange) arrangements amongst the concerned parties. Moreover, the responsibility for grid imbalances should be borne by the market parties, including intermittent RES generators, that cause imbalances. Electricity pricing and grid tariffs are an important element of the market design that facilitates the development of demand response. End-user prices and grid tariffs that reflect the marginal cost allow the optimal capture of the full potential of demand response. Finally, a legal obligation for operators to equip all prosumers as well as end-users with a “high” consumption with a smart meter would be helpful to develop demand response279; for smaller consumers the current rules (roll-out subject to positive CBA) can be maintained.
7.11. Streamline and simplify permitting procedures and enhance public acceptance of energy infrastructure
Major grid and power generation infrastructure could be legally considered of public interest to facilitate and shorten the permitting procedure for investments. Governance should also be improved. National authorities should implement a one-stop-shop and a single permit, which integrates the different parallel permits (environment, building, etc.), that are currently needed in some MSs. Good governance and a full digitalisation of the procedure can contribute to offering more efficient communication and higher transparency.
Public acceptance of new infrastructure should be enhanced by actively involving the public in the consultation process during the permitting procedure, and by offering local citizens the possibility of financially participating in investments, e.g. via green bonds or cooperative companies as was shown in the German case (see section 5.3.1).
279 In Germany, a new “Smart meters operation act” (Messstellenbetriebsgesetz) has been endorsed in July 2016,
which requires operators to equip consumers with an annual consumption > 6000 kWh or an installed capacity > 7 kW with a smart meter.

Policy Department A: Economic and Scientific Policy
110 PE 595.356
REFERENCES • ACER/CEER (2016), Annual Report on the Results of Monitoring the Internal Electricity Markets in 2015.
• ACER (2016), Consolidated report on the progress of electricity and gas projects of common interest for the year 2015.
• Bain and company (2015), Business and investment opportunities in a changing electricity sector.
• BMWi (2015): Ein gutes Stück Arbeit: Die Energie der Zukunft. Vierter Monitoring-Bericht zur Energiewende. http://www.bmwi.de/BMWi/Redaktion/PDF/V/vierter-monitoring-bericht-energie-der-zukunft,property=pdf,bereich=bmwi2012,sprache=de,rwb=true.pdf.
• BMWi (2016): Renewable Energy Sources in Germany. Key information 2015 at a glance, http://www.erneuerbare-energien.de/EE/Redaktion/DE/Downloads/development-of-renewable-energy-sources-in-germany-2015-tischvorlage.pdf?__blob=publicationFile&v=8.
• BMWi (2016): Bericht nach § 3 des Energieleitungsausbaugesetzes, http://www.bmwi.de/BMWi/Redaktion/PDF/B/bericht-zum-stand-des-energieleitungsausbaus,property=pdf,bereich=bmwi2012,sprache=de,rwb=true.pdf.
• Bundesnetzagentur (2015): Evaluierungsbericht nach § 33 Anreizregulierungsverordnung, https://www.bundesnetzagentur.de/SharedDocs/Downloads/DE/Allgemeines/Bundesnetzagentur/Publikationen/Berichte/2015/ARegV_Evaluierungsbericht_2015.pdf?__blob=publicationFile&v=3.
• Bundesnetzagentur/Bundeskartellamt (2016): Monitoring report 2015, http://www.bundesnetzagentur.de/SharedDocs/Downloads/EN/BNetzA/PressSection/ReportsPublications/2015/Monitoring_Report_2015_Korr.pdf?__blob=publicationFile&v=4.
• C(2015) 8052 regarding the Union list of projects of common interest.
• C(2015) 6317, Towards an Integrated Strategic Energy Technology (SET) Plan: Accelerating the European Energy System Transformation.
• Capgemini (2015), 17th Annual Edition of the European Energy Markets Observatory
• Carbon Market Watch (2014), What’s needed to fix the EU’s carbon market.
• CE Delft (2016), Investment challenges of a transition to a low-carbon economy in Europe – what sets the pace?
• Cedigaz (2014), Gas and coal competition in the EU power sector.
• CEER (2015), Status Review of Renewable and Energy Efficiency Support Schemes in Europe in 2012 and 2013.
• CEPS (2016), Fostering investment in cross border energy infrastructure in Europe. Report of the High-Level Group on Energy Infrastructure in Europe.
• Climate Bonds Initiative (2016), Bonds and Climate Change - The state of the market in 2016.
• COM (2011) 112: A Roadmap for moving to a competitive low carbon economy in 2050.
• COM (2011) 885: Energy roadmap 2050.
• COM (2011) 0676: A growth package for integrated European infrastructures.
• COM (2014) 15: A policy framework for climate and energy in the period from 2020 to 2030.
• COM (2014) 130: Taking stock of the Europe 2020 strategy for smart, sustainable and inclusive growth.
• COM (2014) 330: European Energy Security Strategy.
• COM (2014) 356: Benchmarking smart metering deployment in the EU-27 with a focus on electricity.
• COM (2015) 484: On the implementation of the European Energy Programme for Recovery and the European Energy Efficiency Fund.
• COM (2015) 80: A Framework Strategy for a Resilient Energy Union with a Forward-Looking Climate Change Policy.
• COM (2015) 80 Annex 1: Roadmap for the Energy Union.
• COM (2015) 82: Achieving the 10 % electricity interconnection target. Making Europe’s electricity grid fit for 2020.
• COM (2015) 0337: Proposal for a revised ETS Directive.
• COM (2015) 576: Report on the functioning of the European carbon market.

European Energy Industry Investments
PE 595.356 111
• COM (2016) 177: Nuclear Illustrative Programme presented under Article 40 of the Euratom Treaty for the opinion of the European Economic and Social Committee.
• Comillas et al. (2013), Assessment report on the impacts of RES design options on future electricity markets
• Court of Auditors (2016) Implementing the EU budget through financial instruments – lessons to be learnt from the 2007-2013 programme period.
• CPI (2012), European Electricity Infrastructure: Planning, Regulation, and Financing - CPI Workshop Report.
• C. von Hirschhausen et al (2014). European Energy Sector: Large Investments Required for Sustainability and Supply Security. DIW Economic Bulletin 7.2014.
• Dan Werner (2014), Electricity market price volatility: the importance of ramping costs.
• De Bruyn, Sander et al (2016). Investment challenges of a transition to a low-carbon economy in Europe. CE Delft.
• DECC (2016), Nuclear power in the UK.
• DG ENER (2013), Working paper: The future role and challenges of energy storage.
• DG ENER (2015), Study on comparative review of investment conditions for electricity and gas Transmission System Operators (TSOs) in the EU.
• DG ECFIN (2015), Energy Economic Developments - Investment perspectives in electricity markets.
• Directive 2003/87/EC establishing a scheme for greenhouse gas emission allowance trading.
• Directive 2009/28/EC on the promotion of the use of energy from renewable sources.
• Directive 2012/27/EU on energy efficiency.
• E3G (2014), Energy Security and the Connecting Europe Facility: Maximising public value for public money.
• E3G (2015), G7 Coal phase out: Germany. A review for Oxfam.
• ECF (2010), Roadmap 2050: A practical guide to a prosperous, low-carbon Europe.
• ECF (2012), Power Perspectives 2030. On the Road to a Decarbonised Power Sector.
• EC (2015), Horizon 2020 Indicators – Assessing the results and impact of Horizon.
• EC (2015), Tax Reforms in EU Member States – 2015. Tax policy challenges for economic growth and fiscal sustainability. European Economy Institutional Papers.
• EC (2016), EU Reference Scenario 2016 - Energy, transport and GHG emissions. Trends to 2050.
• EC Press release (14 September 2016), State of the Union 2016: Strengthening European Investments for jobs and growth.
• Ecofys (2014), Subsidies and costs of EU energy.
• EDP (2016), Provisional Volumes Statement.
• EEA (2015), EEA Report No 4: Trends and projections in Europe 2015 – Tracking progress towards Europe’s climate and energy targets.
• EEG – stoRE project (2012), The Role of Bulk Energy Storage in Facilitating Renewable Energy Expansion.
• EIB (2015), Investing in infrastructure for a growing economy.
• ENTSO-E (2014), Fostering Electricity Transmission Investments to Achieve Europe’s Energy Goals: Towards a Future-looking Regulation.
• ENTSO-E TYNDP 2012.
• ENTSO-E (2014), 10-year Network Development Plan 2014.
• ENTSO-E (2014), Fostering Electricity Transmission Investments to Achieve Europe’s Energy Goals: Towards a Future-looking Regulation.
• ENTSO-E (2015), Winter Outlook 2015/2016 & Summer Review.
• ENTSO-E (2015), Scenario Outlook & Adequacy Forecast.
• ENTSO-E TYNDP 2016 (draft).
• ENTSO-E (2016), Future system perspectives.

Policy Department A: Economic and Scientific Policy
112 PE 595.356
• EP (2016), Assessment of Connecting Europe Facility.
• ESMAP (2015), Private Sector Participation in Electricity Transmission and Distribution.
• ESMAP (2015), Private Sector Participation in Electricity Transmission and Distribution.
• Eurelectric (2009), Power Choices.
• Eurelectric (2011), Hydro in Europe: Powering Renewables.
• Eurelectric (2013), Power Choices Reloaded.
• Eurelectric (2015), Power Statistics and Trends: The five dimensions of the Energy Union.
• European Court of Auditors (2015), Improving the security of energy supply by developing the internal market: more efforts needed.
• EWEA (2015), Design options for wind energy tenders.
• EWEA (2016), Wind in power – 2015 European statistics.
• EWI (2011), Roadmap 2050 – a closer look. Cost-efficient RES-E penetration and the role of grid extensions.
• EY (2013), Mapping power and utilities regulation in Europe.
• EY (2015), Renewable energy country attractiveness index.
• Frankfurt School-UNEP Centre/BNEF (2016), Global trends in renewable energy investment 2016.
• Friends of Europe (2015), Europe’s Energy Union and the road to Paris and beyond.
• Gemeinde Prebitz (2016): Szenariorahmen 2030; Stellungnahme der Gemeinde Prebitz; http://data.netzausbau.de/2030/Stellungnahmen_Szenariorahmen_2030.pdf.
• Genoese, F. and C. Egenhofer (2015), The Future of the European Power Market.
• Green Peace (2015) – Energy [R]evolution.
• IEA (2014), Technology Roadmap – Energy Storage.
• IEA (2015), Projected costs of generating electricity, 2015 edition.
• IEA (2016), World Energy Investment 2016.
• IFO Institute (2012), The impact of wind power generation on the electricity price in Germany.
• INEA (2016), Connecting Europe Facility -Energy. Supported actions - update May 2016.
• Juergens et al (2012). The landscape of climate finance in Germany. Climate Policy Initiative.
• Kaminker, Ch. et al. (2013), “Institutional investors and green infrastructure investments: selected case studies”, OECD Working Papers on Finance, Insurance and Private Pensions, No.35, OECD Publishing.
• Loreck et. Al (2013): Auswirkungen des deutschen Kernenergie-Ausstiegs auf den Stromaustausch mit den Nachbarländern, http://www.oeko.de/oekodoc/1634/2013-004-de.pdf.
• NERA (2016), Making Flexibility Pay: An Emerging Challenge in European Power Market Design.
• Niglia, A. (2015), The Protection of Critical Energy Infrastructure Against Emerging Security Challenges.
• OECD (2012), Nuclear energy and renewables: System effects in low-carbon electricity systems.
• OECD (2015), Mobilising private investment in clean-energy infrastructure - what’s happening?
• OECD/IEA (2012), Securing power during the transition.
• OECD/IEA (2014), World Energy Investment Outlook.
• Pöyry and Swanbarton (2014), Storage business models in the GB market.
• Rademaekers et al (2016). Landscape of climate finance in Belgium. Federal Public Service (FPS) Health, Food Chain Safety and Environment, Belgium.
• Redpoint Energy (2013), PPAs for independent renewable generators – an assessment of existing and future market liquidity.
• SEC (2011) 1565/2: Impact Assessment for the Energy Roadmap 2050.
• SEDC (2015), Mapping Demand Response in Europe Today.
• SWD (2013) 442: Incorporating demand side flexibility, in particular demand response, in electricity markets.

European Energy Industry Investments
PE 595.356 113
• SWD (2014) 15: Impact assessment fort the policy framework for climate and energy in the period from 2020 to 2030.
• SWD (2014) 16: Executive summary of the impact assessment fort the policy framework for climate and energy in the period from 2020 to 2030.
• SWD (2014) 313: Investment Projects in Energy Infrastructure.
• SWD (2014) 314: Implementation of TEN-E, EPR and PCI projects.
• SWD (2015) 135: Impact Assessment accompanying the proposal for a Directive amending Directive 2003/87/EC to enhance cost-effective emission reductions and low-carbon investments.
• The Shift Project (2016), Strengthening the EU ETS price signal.
• Trinomics (2014), Shifting Private Finance towards Climate-Friendly Investments, for DG CLIMA by Trinomics, Dec. 2014.
• Trinomics (2015), EU Energy governance for the future.
• Trinomics (2016), Energy Union: Key Decisions for the Realisation of a Fully Integrated Energy.
• Trinomics (2016), Studie betreffende de opportuniteiten van en mogelijkheden tot tendering van windenergie voor bepaalde zones.
• TU Vienna / EEG (2014), 2030 RES targets for Europe - a brief pre-assessment of feasibility and impact.
• Frankfurt School-UNEP Centre/BNEF (2016), Global trends in renewable energy investment 2016.
• VGB (2015), Investment Requirements in the EU Electricity Sector up to 2050.
• WEF (2015), The Future of Electricity: attracting investment to build tomorrow’s electricity sector.
• World Bank (2016), Power Purchase Agreements (PPAs) and Energy Purchase Agreements (EPAs).

Policy Department A: Economic and Scientific Policy
114 PE 595.356
ANNEX 1: INTERVIEWS • Eurelectric, 24 August 2016
- Marion LABATUT - Manager Wholesale and Retail markets
- Koen NOYENS - Manager Generation, Climate & Environment
- Charlotte RENAUD - Advisor
• FEBEG, 27 September 2016
- Marc Van den Bosch – General Manager
• ENTSO-E, 4 October 2016
- Dr. Susanne NIES - Corporate Affairs Manager
• PMV, 7 October 2016
- Tom MORTIER - Senior Investment Manager Energy
• Validation interviews (between 1st and 7th December)
- Izaak Habieb – Trinomics associate, Head of Commercial Information Management at Belfius until June 2016
- Franziska Flachsbarth - Oeko Researcher, Energy & Climate

European Energy Industry Investments
PE 595.356 115
ANNEX 2: ADDITIONAL INFORMATION ON SCENARIOS AND INVESTMENT NEEDS In chapter 2 we analysed the results of forecast studies published by the EC, ECF and OECD/IEA. In this annex we summarise the outcome of a more exhaustive list of studies which have quantified the electricity investment needs in the EU:
• EC (2016) – EU Reference Scenario 2016 - Energy, transport and GHG emissions. Trends to 2050
• OECD/IEA (2014) – World Energy Investment Outlook • EC (2011) – Energy Roadmap 2050 • ECF (2012) – Power Perspectives 2030 • ECF (2010) - Roadmap 2050: A Practical Guide to a Prosperous, Low-carbon Europe • Eurelectric – Power Choices (2009) and Power Choices Reloaded (2013) • EWI (2011) - Roadmap 2050 – a closer look • TU Vienna / EEG (2014) - 2030 RES targets for Europe - a brief pre-assessment of
feasibility and impact • ENTSO-E TYNDP 2012 and 2014 • VGB (2015) - Investment Requirements in the EU Electricity Sector up to 2050 • Greenpeace (2015) – Energy [R]evolution
Most of these studies assume a wide decarbonisation of the energy system by 2050. The investment needs projected by each of them depend on its assumptions regarding economic, technical and market developments and specific investment costs. Below we provide a short description of each study and the scenarios it covers.
Table 14: Overview of studies quantifying electricity investment needs
Report Time horizon & geographical coverage
Scenario & description
EC (2011) – Energy Roadmap 2050
EU27
2011-2050
• EU Reference scenario is based on policies adopted by March 2010 (including 2020 targets), trends and long-term projections on economic development.
• Current policy initiatives (CPI) scenario is an update of the Reference scenario; it includes measures adopted by April 2011.
• Decarbonisation scenario - High energy efficiency (EE) involves political commitment to very high energy savings leading to a 41 % reduction of primary energy consumption by 2050 compared to 2005.
• Decarbonisation scenario - High renewable energy sources (RES) involves strong support measures for RES leading to 75 % RES-share in gross final energy consumption in 2050 and 97 % in electricity consumption.
• Decarbonisation scenario - Diversified supply technologies (DST). All technologies compete on a market

Policy Department A: Economic and Scientific Policy
116 PE 595.356
Report Time horizon & geographical coverage
Scenario & description
basis, without preference or support measures (assuming public acceptance of nuclear and carbon capture and storage - CCS). Decarbonisation is driven by carbon pricing.
• Decarbonisation scenario - Delayed CCS. Similar to the DST scenario but assuming delayed CCS, leading to higher shares for nuclear energy.
• Decarbonisation scenario - Low nuclear. Similar to the DST scenario but assuming no new nuclear is being built, resulting in a higher penetration of CCS.
EC (2016) - EU Reference Scenario 2016
EU28
Up to 2050
• Reference scenario 2016. It focuses on trend projections – not forecasts, and starts from the assumption that the legally binding GHG and RES targets for 2020 will be achieved and that the policies agreed at EU and Member State level until December 2014 will be implemented.
ECF (2010) - Roadmap 2050
EU27, NO, CH
2010-2050
• Baseline based on 2030 projections extrapolated to 2050 (34 % RES, 49 % coal/gas, 17 % nuclear).280
• 100 % renewable scenario: it includes concentrated solar power from North Africa and enhanced geothermal systems
• Three decarbonisation pathways with varying shares of renewable, nuclear and CCS that ensure at least 95 % power sector decarbonisation by 2050 compared to 1990 levels while providing electricity supply reliability. The pathways are:
• 80 % RES, 10 % CCS, 10 % nuclear; • 60 % RES, 20 % CCS, 20 % nuclear; and • 40 % RES, 30 % CCS, 30 % nuclear.
ECF (2012) – Power Perspectives 2030
EU27, NO, CH
Up to 2030 / 2040
• On Track Case281: By 2020, full implementation of current plans (ENTSO-E TYNDP & NREAPs) with carbon price reflecting 20 % economy-wide emission reduction target. By 2030, building on implementation 2020 plans towards 50 % RES by 2030. No demand response or additional energy efficiency considered.
• Higher RES: ~60 % RES by 2030
280 Key assumptions for the baseline are that:
• energy intensities are on average 50 % lower by 2050 compared to 2010; • energy demand is expected to increase by 10 % reaching 1400 Mtoe in 2050, while power demand grows
by ~40 % over 45 years due to lower improvements in power intensity. 281 “On Track Case” has higher power demand assumptions (as extra EE measures are not included) and increased
scope in the grid modelling approach compared to ECF (2010) Roadmap 2050, leading to increased capex for “On track Case”.
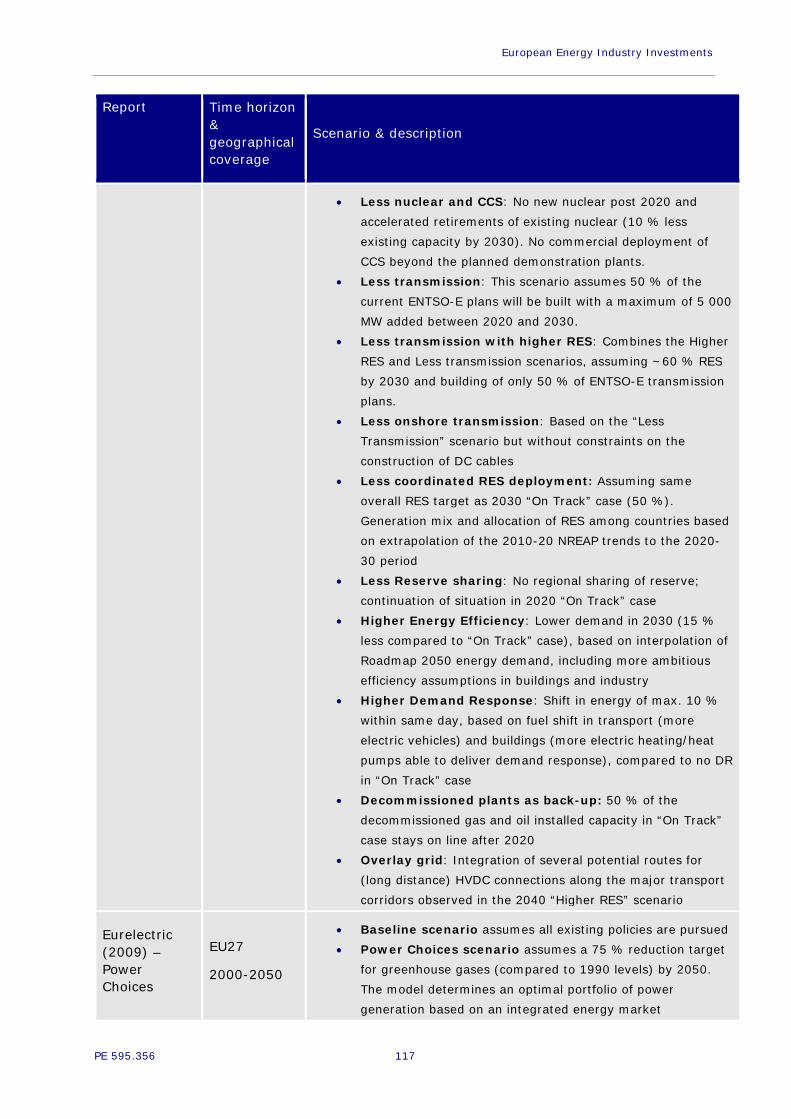
European Energy Industry Investments
PE 595.356 117
Report Time horizon & geographical coverage
Scenario & description
• Less nuclear and CCS: No new nuclear post 2020 and accelerated retirements of existing nuclear (10 % less existing capacity by 2030). No commercial deployment of CCS beyond the planned demonstration plants.
• Less transmission: This scenario assumes 50 % of the current ENTSO-E plans will be built with a maximum of 5 000 MW added between 2020 and 2030.
• Less transmission with higher RES: Combines the Higher RES and Less transmission scenarios, assuming ~60 % RES by 2030 and building of only 50 % of ENTSO-E transmission plans.
• Less onshore transmission: Based on the “Less Transmission” scenario but without constraints on the construction of DC cables
• Less coordinated RES deployment: Assuming same overall RES target as 2030 “On Track” case (50 %). Generation mix and allocation of RES among countries based on extrapolation of the 2010-20 NREAP trends to the 2020-30 period
• Less Reserve sharing: No regional sharing of reserve; continuation of situation in 2020 “On Track” case
• Higher Energy Efficiency: Lower demand in 2030 (15 % less compared to “On Track” case), based on interpolation of Roadmap 2050 energy demand, including more ambitious efficiency assumptions in buildings and industry
• Higher Demand Response: Shift in energy of max. 10 % within same day, based on fuel shift in transport (more electric vehicles) and buildings (more electric heating/heat pumps able to deliver demand response), compared to no DR in “On Track” case
• Decommissioned plants as back-up: 50 % of the decommissioned gas and oil installed capacity in “On Track” case stays on line after 2020
• Overlay grid: Integration of several potential routes for (long distance) HVDC connections along the major transport corridors observed in the 2040 “Higher RES” scenario
Eurelectric (2009) – Power Choices
EU27
2000-2050
• Baseline scenario assumes all existing policies are pursued • Power Choices scenario assumes a 75 % reduction target
for greenhouse gases (compared to 1990 levels) by 2050. The model determines an optimal portfolio of power generation based on an integrated energy market

Policy Department A: Economic and Scientific Policy
118 PE 595.356
Report Time horizon & geographical coverage
Scenario & description
Eurelectric (2013) – Power Choices Reloaded
EU27
2011-2050
• Eurelectric reference scenario includes policies up to end of 2011.
• Power Choices Reloaded scenario also determines an optimal portfolio of power generation based on an integrated energy market. (Mirroring the Commission’s energy roadmap DST scenario)
• Lost decade scenario assumes the same carbon emission reduction target as the Power Choices Reloaded scenario but explores the consequences of a delay in investments.
EWI (2011) – Roadmap 2050 – a closer look
EU27 (except CY & MT), NO, CH
Up to 2050
• Scenario A - “Optimal Grid Extension”: in this scenario generation and transmission grid costs are minimized without restrictions to grid extensions. Thus, it identifies the least-cost pathway to achieving GHG and RES-E targets in 2050.
• Scenario B – “Moderate transmission grid” assumes a moderate extension of European interconnectors limited to projects which have entered the planning or permission phase (based on ENTSO-E’s TYNDP), but whose commissioning is assumed to be delayed.
TU Vienna / EEG (2014) - 2030 RES targets for Europe
EU27
2006 to 2030
• This study assesses the pathways to reach different RES targets at EU level by 2030. The targets considered are 30 %, 35 %, 40 % and 45 %. Further, two demand variants are assessed for each target: a low and a high energy demand case based on PRIMES modelling (2011 EE and reference cases).
OECD/IEA (2014) – World Energy Investment Outlook
European Union
2014-2035
• New Policies Scenario in which the energy demand and supply projections reflect energy policies and measures adopted as of early 2014 and other announced commitments.
• 450 Scenario considers an emissions-reduction path consistent with the goal to limit the rise in long-term global temperatures to two degrees Celsius.
ENTSO-E - TYNDP 2012 & 2014
ETNSO-E member countries
2012-2022
2014-2030
• Implementation of projects of pan-European significance identified in the TYNDP 2012 and 2014 respectively.

European Energy Industry Investments
PE 595.356 119
Report Time horizon & geographical coverage
Scenario & description
VGB (2015) - Investment Requirements in the EU Electricity Sector up to 2050
2020-2045
• Green peace reference, based on the EU reference scenario 2013
• Regional policy, based on the Energy Roadmap 2050 scenario “High EE” (EC, 2011)
• Climate market, inspired by the Roadmap scenario “Diversified Supply Technologies” (EC, 2011) and the “Power Choices Reloaded” scenario (Eurelectric, 2013)
• Green policy, loosely based on the Energy Roadmap 2050 scenario “High RES” (EC, 2011)
Greenpeace (2015) – Energy [R]evolution
OECD Europe
2012-2050
• Greenpeace reference scenario reflects a continuation of current trends and policies
• Energy [r]evolution scenario is designed to achieve a set of environmental policy targets resulting in a pathway towards a widely decarbonised energy system by 2050
• Advanced energy [r]evolution scenario represents a more ambitious pathway towards a fully decarbonised energy system by 2050
The following table provides more details on each scenario, including their time horizon, key parameters (such as the electricity mix, the expected RES share and GHG emission reductions), and investment needs.

Policy Department A: Economic and Scientific Policy
120 PE 595.356
Source Scenario Time Horizon
% RES %EE savings % GHG reduction
Electricity mix (inc. % RES-E)
System cost of electricity/MWh
Overall electricity system costs
Cumulative generation investment
Cumulative grid investment
SWD(2014) 16, IA 2030 FWC Reference 2030
24.4% (2030, in FEC)
-21% (2030 vs projection)
-32.4% (2030 vs 1990) RES: 31% (2030)
176 EUR'10/MWh
2067 bn EUR (2011-2030, annual avg)
1 000 billion EUR (2011-2030)
740 billion EUR (2011-2030)
SWD(2014) 16, IA 2030 FWC GHG40 2030
26.5% (2030, in FEC)
-25.1% (2030 vs projection)
-26.5% (2030 vs 1990)
RES: 34.2% (2030)
179 EUR'10/MWh
2069 bn EUR (2011-2030, annual avg)
1 060 billion EUR (2011-2030)
820 billion EUR (2011-2030)
SWD(2014) 16, IA 2030 FWC GHG40/EE 2030
26.4% (2030, in FEC)
-29.3% (2030 vs projection)
-26.4% (2030 vs 1990)
RES: 34.1% (2030)
174 EUR'10/MWh
2089 bn EUR (2011-2030, annual avg)
960 billion EUR (2011-2030)
760 billion EUR (2011-2030)
SWD(2014) 16, IA 2030 FWC
GHG40/EE/RES30 2030
30% (2030, in FEC)
-30.1% (2030 vs projection)
-30% (2030 vs 1990)
RES: 39.7% (2030)
178 EUR'10/MWh
2089 bn EUR (2011-2030, annual avg)
1 100 billion EUR (2011-2030)
800 billion EUR (2011-2030)
SWD(2014) 16, IA 2030 FWC
GHG45/EE/RES35 2030
35% (2030, in FEC)
-33.7% (2030 vs projection)
-35% (2030 vs 1990)
RES: 47.3% (2030)
196 EUR'10/MWh
2102 bn EUR (2011-2030, annual avg)
1 360 billion EUR (2011-2030)
840 billion EUR (2011-2030)
EC (2011), Energy Roadmap 2050
EU reference 2050
25.5% (2050, gross final energy)
-3.5% (PEC 2005-2050)
- 39.2% (2005-2050)
RES: 40.3%, Nuclear: 26.4%, Fossil: 33.3% (2050)
129.4 EUR'08/MWh (2050, pre-tax)
2582 bn EUR (2011-2050, annual avg) NA
1 269 billion EUR'05 (2011-2050)
EC (2011), Energy Roadmap 2050 CPI 2050
29% (2050, gross final energy)
-11.6% (PEC 2005-2050)
- 40% (2005-2050)
RES: 48.8%, Nuclear: 20.6%, Fossil: 30.6% (2050)
133.6 EUR'08/MWh (2050, pre-tax)
2619 bn EUR (2011-2050, annual avg)
2 000 billion EUR (2011-2050)
1 357 billion EUR'05 (2011-2050)
EC (2011), Energy Roadmap 2050 High EE 2050
57.3% (2050, gross final energy)
-40.6% (PEC 2005-2050)
-80% (1990-2050)
RES: 64.2%, Nuclear: 14.2%, Fossil: 21.6% (2050)
123.5 EUR'08/MWh (2050, pre-tax)
2615 bn EUR (2011-2050, annual avg)
2 150 billion EUR (2011-2050)
1 518 billion EUR'05 (2011-2050)

European Energy Industry Investments
PE 595.356 121
Source Scenario Time Horizon
% RES %EE savings % GHG reduction
Electricity mix (inc. % RES-E)
System cost of electricity/MWh
Overall electricity system costs
Cumulative generation investment
Cumulative grid investment
EC (2011), Energy Roadmap 2050 DST 2050
54.6% (2050, gross final energy)
-33.3% (PEC 2005-2050)
-80% (1990-2050)
RES: 59.1%, Nuclear: 16.1%, Fossil: 24.8% (2050)
123.2 EUR'08/MWh (2050, pre-tax)
2535 bn EUR (2011-2050, annual avg)
2 450 billion EUR (2011-2050)
1 712 billion EUR'05 (2011-2050)
EC (2011), Energy Roadmap 2050 High RES 2050
75.2% (2050, gross final energy)
-37.9% (PEC 2005-2050)
-80% (1990-2050)
RES: 83.1%, Nuclear: 3.5%, Fossil: 9.6% (2050)
171 EUR'08/MWh (2050, pre-tax)
2590 bn EUR (2011-2050, annual avg)
3 200 billion EUR (2011-2050)
2 195 billion EUR'05 (2011-2050)
EC (2011), Energy Roadmap 2050
Delayed CCS 2050
55.7% (2050, gross final energy)
-32.2% (PEC 2005-2050)
-80% (1990-2050)
RES: 60.7%, Nuclear: 19.2%, Fossil: 20.1% (2050)
128.6 EUR'08/MWh (2050, pre-tax)
2525 bn EUR (2011-2050, annual avg)
2 550 billion EUR (2011-2050)
1 717 billion EUR'05 (2011-2050)
EC (2011), Energy Roadmap 2050
Low nuclear 2050
57.5% (2050, gross final energy)
-37.7% (PEC 2005-2050)
-80% (1990-2050)
RES: 64.8%, Nuclear: 2.5%, Fossil: 32.7% (2050)
133.2 EUR'08/MWh (2050, pre-tax)
2552 bn EUR (2011-2050, annual avg)
2 500 billion EUR (2011-2050)
1 793 billion EUR'05 (2011-2050)
EC (2016) - EU Reference Scenario 2016
EU Ref 2016 2050
31.16% (2050, gross FEC)
-23.9% in 2030 (vs 2007 projection)
-48% (1990-2050)
RES: 56%, Nuclear: 18%, Fossil: 26% (2050)
159 EUR'13/MWh (2050 after-tax)
10.6% of GDP in 2050
Fig 74 in full report, no data
ECF (2012) - Power perspectives 2030 On track 2030
-65% (2030 vs 1990)
RES: 50%, Nuclear: 16%, Fossil: 34% (2030)
LCOE: 89 EUR/MWh (2030, inc. CO2 prices)
1 028 (+57 back up) billion EUR (CAPEX 2030)
68 billion EUR (CAPEX 2030)
ECF (2012) - Power perspectives 2030
Higher RES 2030
RES: 60%, Nuclear: 16%, Fossil: 22% (2030)
LCOE: 86 EUR/MWh (2030, inc. CO2 prices)
1 393 (+66 back up) billion EUR (CAPEX 2030)
138 billion EUR (CAPEX 2030)
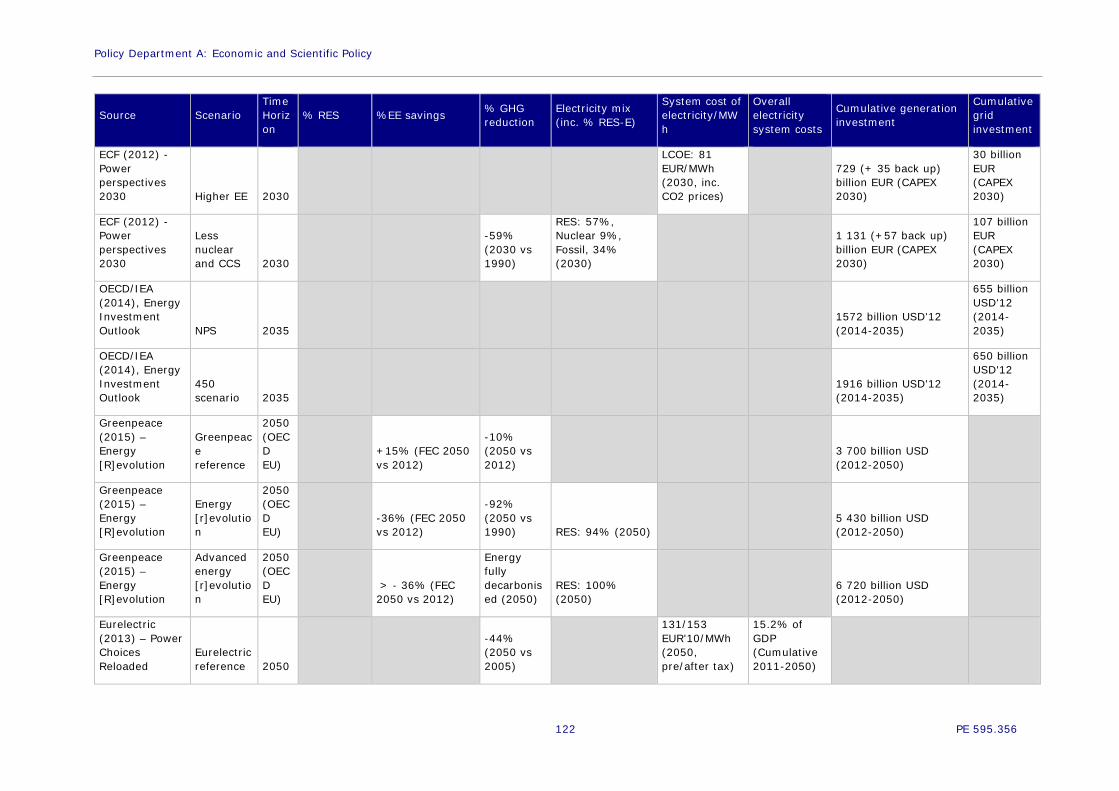
Policy Department A: Economic and Scientific Policy
122 PE 595.356
Source Scenario Time Horizon
% RES %EE savings % GHG reduction
Electricity mix (inc. % RES-E)
System cost of electricity/MWh
Overall electricity system costs
Cumulative generation investment
Cumulative grid investment
ECF (2012) - Power perspectives 2030 Higher EE 2030
LCOE: 81 EUR/MWh (2030, inc. CO2 prices)
729 (+ 35 back up) billion EUR (CAPEX 2030)
30 billion EUR (CAPEX 2030)
ECF (2012) - Power perspectives 2030
Less nuclear and CCS 2030
-59% (2030 vs 1990)
RES: 57%, Nuclear 9%, Fossil, 34% (2030)
1 131 (+57 back up) billion EUR (CAPEX 2030)
107 billion EUR (CAPEX 2030)
OECD/IEA (2014), Energy Investment Outlook NPS 2035
1572 billion USD'12 (2014-2035)
655 billion USD'12 (2014-2035)
OECD/IEA (2014), Energy Investment Outlook
450 scenario 2035
1916 billion USD'12 (2014-2035)
650 billion USD'12 (2014-2035)
Greenpeace (2015) – Energy [R]evolution
Greenpeace reference
2050 (OECD EU)
+15% (FEC 2050 vs 2012)
-10% (2050 vs 2012)
3 700 billion USD (2012-2050)
Greenpeace (2015) – Energy [R]evolution
Energy [r]evolution
2050 (OECD EU)
-36% (FEC 2050 vs 2012)
-92% (2050 vs 1990) RES: 94% (2050)
5 430 billion USD (2012-2050)
Greenpeace (2015) – Energy [R]evolution
Advanced energy [r]evolution
2050 (OECD EU)
> - 36% (FEC 2050 vs 2012)
Energy fully decarbonised (2050)
RES: 100% (2050)
6 720 billion USD (2012-2050)
Eurelectric (2013) – Power Choices Reloaded
Eurelectric reference 2050
-44% (2050 vs 2005)
131/153 EUR'10/MWh (2050, pre/after tax)
15.2% of GDP (Cumulative 2011-2050)

European Energy Industry Investments
PE 595.356 123
Source Scenario Time Horizon
% RES %EE savings % GHG reduction
Electricity mix (inc. % RES-E)
System cost of electricity/MWh
Overall electricity system costs
Cumulative generation investment
Cumulative grid investment
Eurelectric (2013) – Power Choices Reloaded
Power Choices Reloaded 2050
-80% (2050 vs 1990)
RES: 53.1%, Nuclear: 22.4%, Fossil: 24.5% (2050)
122/145 EUR'10/MWh (2050, pre/after tax)
15.5% of GDP (Cumulative 2011-2050)
Eurelectric (2013) – Power Choices Reloaded
Lost decade 2050
136/159 EUR'10/MWh (2050, pre/after tax)
16.3% of GDP (Cumulative 2011-2050)
EWI (2011) - Roadmap 2050 - A closer look
A - Optimal Grid Extension 2050
-80% (2050 vs 1990) RES: 80% (2050)
3 156 (inc. 39 - storage) billion EUR (2010-2050)
213 billion EUR'10 (2010-2050)
EWI (2011) - Roadmap 2050 - A closer look
B – Moderate transmission grid 2050
-80% (2050 vs 1990) RES: 80% (2050)
3 328 (inc 86 -storage) billion EUR (2010-2050)
97 billion EUR'10 (2010-2050)
Eurelectric (2009) – Power Choices Baseline 2050
20.7% (2050, gross final demand) FEC stabilises
- 40% (2050 vs 1990)
RES: 34%, Nuclear: 28%, Fossil: 38% (2050) 9.7% of GDP
979 billion EUR'05 (2025-2050)
Eurelectric (2009) – Power Choices
Power Choices 2050
30.8% (2050, gross final demand)
-20% PEC/-30% FEC in 2050 (compared to baseline)
-75% (2050 vs 1990)
RES: 40%, Nuclear: 28%, Fossil: 31% (2050) 10% of GDP
2 000 billion EUR'05 (2000-2050), 1 141 billion EUR'05 (2025-2050)

Policy Department A: Economic and Scientific Policy
124 PE 595.356
ANNEX 3: CASE STUDY: GERMANY
Investment trends, market characteristics and main operators in Germany Development of infrastructure for energy generation and transport in Germany is strongly influenced by geographical and historical aspects. Electricity demand is highest in the southern and western regions with high population density and strong industrial centres. Moreover, potentials for renewable energy sources (RES) are unevenly distributed: winds are strongest in the northern regions close to the North and Baltic Seas while solar potential is highest in the south. Pumped hydro storage, requiring a certain altitude difference, can also be found mainly in the southern part of Germany.
The electricity grid was built with a focus on historical demand centres and the conventional power plants located in close proximity. Long distance electricity transmission was not a primary goal of grid development. Furthermore, interconnection between the eastern and western parts of the country was limited due to the division during the cold war.
The German electricity market is organized on an energy only market basis. A common pricing zone with Austria has been in place since 2002 and since 2010, a coupling with electricity markets of France, BeNeLux and NordPool is in place (CWE). Political debates on the necessity of a capacity market are ongoing; a strategic capacity reserve has been installed to guarantee security of supply282.
The following sections 0 to 0 provide an overview on generation and grid capacity developments, evolution of electricity demand and market structure in Germany. Section 0 describes legislative and regulatory frameworks concerning the energy market, while section 0 analyzes the process surrounding the German grid development plan. Section 0 shows implementation statuses of German PCIs and finally section 0 presents lessons learnt and conclusions.
Installed power generation capacity Germany plays a key role in the European context as a promoter of RES, especially wind power and solar PV. The share of renewables in gross electricity consumption in Germany has increased from 6% in 2000 to 31% in in 2015 with 15 billion Euros invested in power generation from renewable energies in 2015283. At the same time, generation from nuclear power plants will be phased out by 2022 in line with national policy. This leads to a major shift in the technology and location of the generation capacity in Germany. Figure 36 shows the evolution of installed capacity for both conventional and RES based generation capacities in Germany until 2014.
While investments into coal fired power plants have been observed between 2000 and 2010 [Pahle, 2010284], installed capacities of conventional power plants have been constant or decreasing over the last 20 years. Investments into gas fired power plants, while important to the functioning of a generation system with a high share of fluctuating RES have not been observed. On the contrary, several relatively new gas fuelled capacities have either already been decommissioned by their operators or there are plans to do so in the near future.
Figure 36: Installed capacity (GW)
282 BMWi (2016): Energy of the future. An overall strategy for the energy transition,
http://www.bmwi.de/EN/Topics/Energy/Energy-Transition/overall-strategy,did=580202.html. 283 BMWi (2016): Renewable Energy Sources in Germany. Key information 2015 at a glance,
http://www.erneuerbare-energien.de/EE/Redaktion/DE/Downloads/development-of-renewable-energy-sources-in-germany-2015-tischvorlage.pdf?__blob=publicationFile&v=8.
284 Michael Pahle (2010): Germany’s dash for coal: Exploring drivers and factors. http://www.sciencedirect.com/science/article/pii/S0301421510000984.

European Energy Industry Investments
PE 595.356 125
Source: BMWi Energiedaten285
While investments into conventional generation capacities have been limited, the last ten to fifteen years have shown significant investments into renewable energy technologies.
Figure 37: Investments in renewable energy technologies (in billion Euro) shows this development which was strongly influenced by the introduction and subsequent revisions of the German Renewable Energy Act (EEG, see section 12) with high installation rates especially for PV between 2008 and 2011. Significant reductions of the feed-in tariff guaranteed for PV in the EEG after 2012 have slowed down this trend and led to lower investment figures as of 2011.
285 BMWi (2016): Zahlen und Fakten Energiedaten. Nationale und Internationale Entwicklung.
http://bmwi.de/BMWi/Redaktion/Binaer/energie-daten-gesamt,property=blob,bereich=bmwi2012,sprache=de,rwb=true.xls.
0
20
40
60
80
100
120
2000 2001 2002 2003 2004 2005 2006 2007 2008 2009 2010 2011 2012 2013 2014
Nuclear Lignite Hard coal Fuel oil Gas Hydro
Wind Solar PV Geothermal Biomass Other

Policy Department A: Economic and Scientific Policy
126 PE 595.356
Figure 37: Investments in renewable energy technologies (in billion Euro)
Source: BMWi286
Electricity consumption and peak load Electricity demand in Germany has been fairly constant over the last 10 years with the exception of 2008 where the economic crisis also impacted electricity consumption. Overall, generation is further influenced by electricity exports to neighbouring countries, with an increasing share in the last years. This can be explained by an increasing number of hours with low electricity prices where shares of both renewables and lignite are high.
286 BMWi (2015): Ein gutes Stück Arbeit: Die Energie der Zukunft. Vierter Monitoring-Bericht zur Energiewende.
http://www.bmwi.de/BMWi/Redaktion/PDF/V/vierter-monitoring-bericht-energie-der-zukunft,property=pdf,bereich=bmwi2012,sprache=de,rwb=true.pdf

European Energy Industry Investments
PE 595.356 127
Figure 38: Electricity generation and demand (in TWh)
Source: AG Energiebilanzen287, Öko-Institut e.V.
Peak load in Germany is usually reached between 11 am and 2 pm in winter months. Peak values of 82 GW have been observed, while average daily peak load is between 65 and 70 GW288.
Interconnections and transmission lines evolution (2007-2015) The German electricity grid was built with a focus on connecting demand centres to the power plants located close by and provided limited interconnection between eastern and western parts of the country due to the division during the cold war. The success of the Renewable Energy Act (EEG, see section 0), however has led to a drastic change in the power generation structure in Germany. The grid infrastructure has not kept pace with this development. Whereas the security of supply remains high and the number of outages low289, missing transmission capacity has led to wind turbines having to be switched off when gusts were strongest and to an increasing need for redispatch245. The rapid development of wind energy, mainly in northern and eastern parts of the country, together with cheap lignite power plants in the same regions and limited grid capacity in East-West directions have also led to loop flows from north-eastern Germany via Poland and the Czech Republic to the south of Germany and to Austria [Loreck, 2013290].
287 AG Energiebilanzen (2016): Stromerzeugung nach Energieträgern 1990 – 2015, http://www.ag-
energiebilanzen.de/index.php?article_id=29&fileName=20161019_brd_stromerzeugung1990-2015.pdf. 288 Bundesregierung (2016): Energielexikon. Spitzenlast,
https://www.bundesregierung.de/Content/DE/Lexikon/EnergieLexikon/S/2013-09-25-spitzenlast.html. 289 Bundesnetzagentur/Bundeskartellamt (2016): Monitoring report 2015,
http://www.bundesnetzagentur.de/SharedDocs/Downloads/EN/BNetzA/PressSection/ReportsPublications/2015/Monitoring_Report_2015_Korr.pdf?__blob=publicationFile&v=4.
290 Loreck et. Al (2013): Auswirkungen des deutschen Kernenergie-Ausstiegs auf den Stromaustausch mit den Nachbarländern, http://www.oeko.de/oekodoc/1634/2013-004-de.pdf.

Policy Department A: Economic and Scientific Policy
128 PE 595.356
The introduction of the Law on the Expansion of Energy Lines (Energieleitungsausbaugesetz, EnLAG) in 2009 has simplified permitting procedures for new power lines and thus slowly led to an increase of investments into the power grid and into new transmission lines. As illustrated in Figure 39, this process was significantly accelerated by the introduction of the Grid Development Plan (Netzentwicklungsplan) and the Federal Requirements Plan Act (BBPlG, Bundesbedarfsplangesetz) where extensive consultations were conducted to determine the most important grid extensions for the next ten years. Section 0 contains more detailed information on this process.
Figure 39: Investments into the German power grid by TSOs (in million Euro)
Source: Bundesnetzagentur, via statista291
Realisation of grid projects is still lagging behind the original schedule provided by the EnLAG. 35% of the 1800 km of new transmission lines have already been realised till September 2016 and TSOs expect a realisation of 45% of total projects by the end of 2017 and 85% by end of 2020. The last project is expected to be finalized by 2025 with the exception of the interconnection between Eisenhüttenstadt – Baczyna (PL) which is expected to be finalized not before 2030.292
Figure 40 shows investments by the German distribution grids by DSOs. These investments include maintenance of distribution grids, where investment needs are currently high since 291 Bundesnetzagentur (2016), Investments and expenditures into the German power grid infrasturcure by
transmission system operators, via de.statista.com, URL https://de.statista.com/statistik/daten/studie/168146/umfrage/investitionen-in-die-stromnetze-der-uebertragungsnetzbetreiber-seit-2007/, retrieved 30.09.2016.
292 BMWi (2016): Bericht nach § 3 des Energieleitungsausbaugesetzes, http://www.bmwi.de/BMWi/Redaktion/PDF/B/bericht-zum-stand-des-energieleitungsausbaus,property=pdf,bereich=bmwi2012,sprache=de,rwb=true.pdf.
0
500
1.000
1.500
2.000
2.500
3.000
2007 2008 2009 2010 2011 2012 2013 2014 2015(planned)
Mio
. €
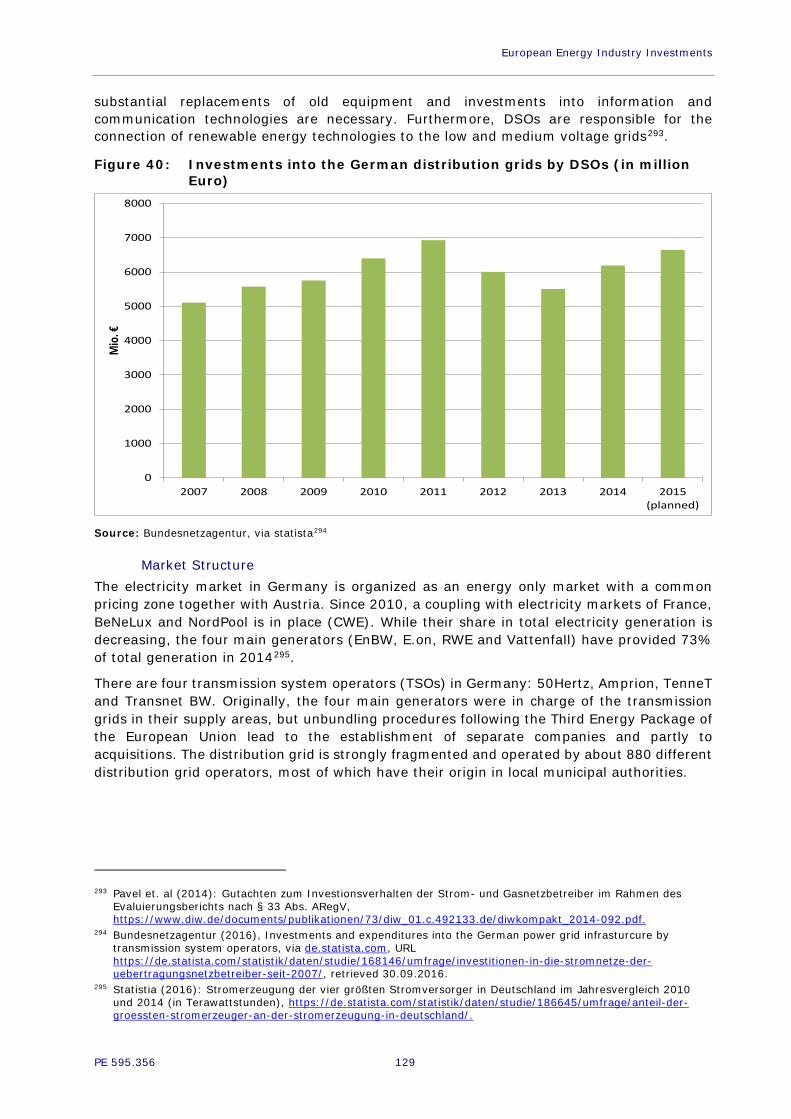
European Energy Industry Investments
PE 595.356 129
substantial replacements of old equipment and investments into information and communication technologies are necessary. Furthermore, DSOs are responsible for the connection of renewable energy technologies to the low and medium voltage grids293.
Figure 40: Investments into the German distribution grids by DSOs (in million Euro)
Source: Bundesnetzagentur, via statista294
Market Structure The electricity market in Germany is organized as an energy only market with a common pricing zone together with Austria. Since 2010, a coupling with electricity markets of France, BeNeLux and NordPool is in place (CWE). While their share in total electricity generation is decreasing, the four main generators (EnBW, E.on, RWE and Vattenfall) have provided 73% of total generation in 2014295.
There are four transmission system operators (TSOs) in Germany: 50Hertz, Amprion, TenneT and Transnet BW. Originally, the four main generators were in charge of the transmission grids in their supply areas, but unbundling procedures following the Third Energy Package of the European Union lead to the establishment of separate companies and partly to acquisitions. The distribution grid is strongly fragmented and operated by about 880 different distribution grid operators, most of which have their origin in local municipal authorities.
293 Pavel et. al (2014): Gutachten zum Investionsverhalten der Strom- und Gasnetzbetreiber im Rahmen des
Evaluierungsberichts nach § 33 Abs. ARegV, https://www.diw.de/documents/publikationen/73/diw_01.c.492133.de/diwkompakt_2014-092.pdf.
294 Bundesnetzagentur (2016), Investments and expenditures into the German power grid infrasturcure by transmission system operators, via de.statista.com, URL https://de.statista.com/statistik/daten/studie/168146/umfrage/investitionen-in-die-stromnetze-der-uebertragungsnetzbetreiber-seit-2007/, retrieved 30.09.2016.
295 Statistia (2016): Stromerzeugung der vier größten Stromversorger in Deutschland im Jahresvergleich 2010 und 2014 (in Terawattstunden), https://de.statista.com/statistik/daten/studie/186645/umfrage/anteil-der-groessten-stromerzeuger-an-der-stromerzeugung-in-deutschland/.
0
1000
2000
3000
4000
5000
6000
7000
8000
2007 2008 2009 2010 2011 2012 2013 2014 2015(planned)
Mio
. €

Policy Department A: Economic and Scientific Policy
130 PE 595.356
Table 15: Market structure
Germany
Main generators EnBW, E.on, RWE, Vattenfall, EPH, Steag
Transmission system operators (TSOs) 50Hertz, Amprion, TenneT, Transnet BW
Distribution system operators (DSOs) 880 different DSOs
Market Energy Only Market
Sources: https://de.statista.com/statistik/kategorien/kategorie/5/themen/40/branche/energie/
Supporting national framework for electricity investments Several laws are in place to regulate the electricity market and support low carbon energy sources:
The German Renewable Energy Sources Act (EEG) has triggered substantial investment in renewable energy capacity since its introduction in 2000. The EEG was originally based on a feed-in tariff system which guaranteed income flows for 20 years in combination with guaranteed grid connection and priority dispatch. The very low investment risk drew new players into the market – citizens, farmers, super markets and smaller investors. The support is funded through a surcharge on electricity consumption; for energy intensive industries the surcharge is reduced. With the 2014 version of the law the system is changing from a fixed feed-in tariff to an auction system for most technologies. Plant operators will sell their electricity directly and receive on top of the market price a variable premium to cover the difference between their bid at the auction and the actual spot market price for electricity. Producers can hence still count on a fixed income but its level is defined at the auction.
As of January 2017 the support for wind energy both onshore and offshore, solar PV and biomass power plants will be auctioned, which corresponds to 80% of new investments. In areas with limited transmission capacity a maximum amount of additional wind onshore capacity is set. Small installations (up to 750 kW) are exempted from the auctions and alleviated auctioning rules apply for small market participants in order to keep an enabling investment framework for citizens and local associations.
A long term deployment target path for renewables has been defined: 40–45% share in gross electricity consumption in 2025, 55–60% in 2035 and over 80% in 2050. Moreover, yearly instalment rate limits are specified which are designed to lead to the achievement of these shares. If renewables deployment will exceed the target path, auctioned capacity volumes will be reduced, if deployment stays below the path, volumes will be increased. Compared to the increase in installed capacity in the last 5 years, the target path slows down the trend, as instalment rates have been higher in the past as those defined in the EEG.

European Energy Industry Investments
PE 595.356 131
Figure 41: Share of renewables in gross electricity consumption
Source: BMWi296
Electricity generation in combined heat and power units (CHP) is supported via the CHP law (KWK-G - Gesetz für die Erhaltung, die Modernisierung und den Ausbau der Kraft-Wärme-Kopplung). The support follows a similar logic as the Renewable Energy Sources Act. CHP units complying with certain requirements (e.g. concerning fuel used, size) receive a premium on top of their income from electricity sales for a defined timespan (30,000 utilization hours). Whereas this supplement was determined by the authorities in the past, from end of 2017 onwards its level will be defined at auctions for installations between one and 50 MWs (both new and modernized CHP)297. Since 2009 also investment costs for the construction and modernization of distribution networks for heat and cold can be supported under certain conditions (minimum share of CHP in the network; maximum share of investment cost depending on the size of pipes, etc.). The support is financed by a surcharge on electricity bills; the total annual surcharge may not exceed 150 Mio Euros (up to 2015 the maximum amount was 750 Mio Euros). Industry with high electricity demand pays a reduced surcharge; following a request of the EU Commission the rules for reduction will be aligned with those of the EEG.
The Electricity Market Law (StrommarktG298) includes a provision on decommissioning of certain lignite fired power plants in order to achieve the climate targets. In October 2016 the lignite power plant in Buschhaus becomes a “system security reserve”, in October 2017, 2018 and 2019 units in Frimmersdorf, Niederaußem, Jänschwalde and Neurath are to follow. Together those units have an installed capacity of 270 GW. Units in the “system security reserve” have to guarantee their availability within 240 hours at the latest for operation at 296 BMWi, 2016, Renewable Energy Sources in Germany Key information 2015 at a glance, http://www.erneuerbare-
energien.de/EE/Redaktion/DE/Downloads/development-of-renewable-energy-sources-in-germany-2015-tischvorlage.pdf?__blob=publicationFile&v=8.
297 For small and large CHP units the level of the premium continues to be set by the authorities. 298 Gesetz zur Weiterentwicklung des Strommarktes (Strommarktgesetz) vom 26. Juli 2016, Bundesgesetzblatt
Jahrgang 2016 Teil I Nr. 37, ausgegeben zu Bonn am 29. Juli 2016, http://www.bgbl.de/xaver/bgbl/start.xav?startbk=Bundesanzeiger_BGBl&jumpTo=bgbl116s1786.pdf#__bgbl__%2F%2F*[%40attr_id%3D%27bgbl116s1786.pdf%27]__1475253896722.

Policy Department A: Economic and Scientific Policy
132 PE 595.356
the request of the grid operator (subject to certain conditions) during four years. The eight production units that will pass to the system security reserve are expected to receive on average 230 million Euro per year up to the year 2023 (1.6 billion Euro in total); these costs are added on the fee for grid network usage on the electricity bills. The security reserve has been highly controversial: lignite fired power plants are neither the most flexible generation resource nor will they be available at short notice but only with a time lag of 10 days.
The National Grid Development Plan (Netzentwicklungsplan, NEP) and the Federal Requirements Plan Act (BBPlG, Bundesbedarfsplangesetz) lay the ground for the expansion of the German electricity network299. This process is discussed in detail in section 0.
There are several ways in which investments into electricity storage facilities are promoted. The Energy Industry Act (Energiewirtschaftsgesetz, EnWG) regulates the exemption or reduction of grid usage charges to be paid by storage (Sec. 118 (6) EnWG) while the EEG defines the exemption of storage from the surcharge on electricity consumption (Sec. 60 (3) EEG 2014). Small scale battery storage facilities can also benefit from KfW loans (Kreditanstalt für Wiederaufbau)300.
The KfW also provides support through loans for investments into energy efficiency or renewable energy use, both for households as well as companies or public institutions301.
At present, there are no specific support programs for Demand Side Management (DSM) projects in Germany. Nevertheless, industrial processes with flexible load management can participate in the market for balancing reserve capacity and obtain remuneration in exchange for their readiness for load-shedding302.
Implementation of national investment and development plans: The Network Development plan and the Federal Requirements Plan Act Since grids are a natural monopoly, their operation and expansion is closely monitored by the Federal Grid Agency (Bundesnetzagentur, BNetzA) which is responsible for supervising the development of the formerly regulated markets for telecommunication, railways and energy (electricity and natural gas).
The process to adapt the German high voltage electricity grid to the requirements of the changing generation structure is coordinated and organized by the BNetzA. The transmission system operators (TSOs) are involved in this process which is organized as follows:
A Scenario Framework consisting of at least 3 different midterm scenarios is drafted by the TSOs, commented by stakeholders and approved by the BNetzA to determine possible future developments of the power system in Germany, with projections for renewable and conventional generation capacities and demand evolution. The current framework includes four scenarios with a 10-year horizon. For two scenarios, an extended timeframe of 20 years is determined. The scenarios differ in the assumptions on renewable energy deployment, relative share of coal vs. natural gas, electricity demand and climate protection targets.
299 BMWi (2016): Electricity Grids of the Future, http://www.bmwi.de/EN/Topics/Energy/Grids-and-grid-
expansion/electricity-grids-of-the-future,did=667654.html. 300 KfW (2016): Erneuerbare Energien – Speicher. Strom aus Sonnenenergie erzeugen und speichern, Kredit 275,
https://www.kfw.de/inlandsfoerderung/Unternehmen/Energie-Umwelt/F%C3%B6rderprodukte/Erneuerbare-Energien-%E2%80%93-Speicher-%28275%29/.
301 KfW (2016): Förderratgeber: Strom und Wärme nachhaltig nutzen, https://www.kfw.de/inlandsfoerderung/Unternehmen/Energie-Umwelt/Erneuerbare-Energien/F%C3%B6rderratgeber/.
302 Verordnung über Vereinbarungen zu abschaltbaren Lasten (Verordnung zu abschaltbaren Lasten–AbLaV) vom 16. August 2016: Bundesgesetzblatt Jahrgang 2016 Teil I Nr. 41, ausgegeben zu Bonn am 22. August 2016, https://www.bgbl.de/banzxaver/bgbl/start.xav?startbk=Bundesanzeiger_BGBl&jumpTo=bgbl116s1984.pdf.

European Energy Industry Investments
PE 595.356 133
A public consultation process takes place after the publication of the Scenario Framework. Based on the Scenario Framework, the TSOs model the approved scenarios, determine the corresponding grid expansion requirements, and publish on this basis their 1st Draft of the Network Development Plan (NDP). A second public consultation process is conducted by the BNetzA, which is open for all stakeholders such as citizens, researchers and industry associations.
The BNetzA approves the 1st Draft of the NDP taking into consideration the comments of the stakeholders and communicates the need for modifications, so that the TSOs start a second modelling round which ends in the approved 2nd Draft of the NDP which is the basis for the Federal Requirements Plan.
Every fourth year, the BNetzA extracts the most robust grid expansion projects defined in the NDP and determines them as “to be pursued as a priority” by regulating them by law in the Federal Requirements Plan. This starts the legislative process for these projects.
Finally, the Planning Approval Proceedings include the actual approval process for each single project. Environmental assessments and public discussions are part of this process which results in the determination of the exact route and technical details of the expansion in question. The TSOs are in charge of the Planning Approval Proceedings.303
The monitoring report of 2016 on the status of the law on the Federal Requirements Plan (Bundesbedarfsplangesetz, BBPlG)304 lists 69 km of grid reinforcements or new construction that have been realized and 350 km where the official approval process is completed. The total length of power lines included in the Federal Requirements Plan is 6100 km, of which 3500 km are reinforcements.
The Federal Requirements Plan replaces the ENLAG (Energieleitungsausbaugesetz, Law on the expansion of electricity lines), which was set up in 2009 to accelerate the construction and commissioning of planned power lines by regularising their planning processes. Its effectiveness might be questioned: There is still a significant delay in these projects. According to the last report of the Federal Ministry for Economic Affairs and Energy, the commissioning dates of some ENLAG projects are updated as commissioning is expected to occur later. Currently, the TSOs expect about 45% of the planned 1800km of electricity line expansions to be completed by the end of 2017, up to 2020 about 85% should be commissioned, and apart from one ENLAG project connecting Poland and Germany which will be delayed up to 2030, the other ENLAG-projects are said to be commissioned by 2025.305 There are no grid extension projects which will be declared as new ENLAG-projects.
The main reason for delays and non-realisations of grid expansion projects is local resistance which complicates permitting processes. Furthermore, local resistance has led to an increasing number of projects being realized with underground cables instead of overhead lines, which leads to significantly higher costs and planning reviews and delays. This is a major barrier to fast project realization.
Concerning the permitting processes, one can observe that although there were some simplifications in order to accelerate grid expansion on a federal level, the simplifications have to be adopted on the local level, but local processes are not always updated promptly. Furthermore, as a consequence of the federal system, different Länder can have different
303 BMWi (2016): Bericht nach § 3 des Energieleitungsausbaugesetzes,
https://www.bmwi.de/BMWi/Redaktion/PDF/B/bericht-zum-stand-des-energieleitungsausbaus,property=pdf. 304 Bundesnetzagentur (2016): Stand des Ausbaus ach dem Bundesbedarfsplangesetz (BBPlG) zum zweiten
Quartal 2016, http://data.netzausbau.de/Vorhaben/BBPlG/BBPlG-2016Q2_neu.pdf. 305 BMWi (2016): Bericht nach § 3 des Energieleitungsausbaugesetzes,
https://www.bmwi.de/BMWi/Redaktion/PDF/B/bericht-zum-stand-des-energieleitungsausbaus,property=pdf.

Policy Department A: Economic and Scientific Policy
134 PE 595.356
regulations for planning processes, leading to further delays. While classification as PCI leads to financial support through the EU, the permission processes are equal to other priority non-PCI grid extensions.
There is no direct link between the NDP and the TYNDP on the European level. However, since German TSOs are part of ENTSO-E and thus play a role in the preparation processes for both plans, consistency between projects listed is ensured.
It has to be stated that the TSOs and DSOs do generally support grid extension projects as there might still be an incentive to gain some profits while realising an investment instead of having high operational costs (Averch-Johnson-effect).306
Implementation of Projects of Common Interest (PCIs) Table 16 gives an overview on the status of PCI projects for Germany. Some German grid extension projects defined in the NDP were accepted as PCIs.
Table 16: List of PCIs defined in the German NDP 2025
PCI
Routing
Construction Status
Commissioning Date
Length (km)
1.3.1 Interconnection between Endrup (DK) and Niebüll (DE)
Under consideration
2022 80
1.3.2 Internal line between Brunsbüttel and Niebüll (DE)
Under construction 2018 200
1.4.1 Interconnection between Kassø (DK) and Audorf (DE) Permitting 2020 235
1.4.2 Internal line between Audorf and Hamburg/Nord (DE)
Under construction 2017 235
1.4.3 Internal line between Hamburg/Nord and Dollern (DE)
Under construction 2016 195
1.8 Germany — Norway interconnection between Wilster (DE) and Tonstad (NO) [currently known as "Nord Link"]
Under construction 2020 623
2.2.1 Interconnection between Lixhe (BE) and Oberzier (DE) Permitting 2019 100
2.3.2 Interconnection between Aubange (BE) and Bascharage/Schifflange (LU)
Planned, but not yet in permitting
2022 16
306 Bundesnetzagentur (2015): Evaluierungsbericht nach § 33 Anreizregulierungsverordnung,
https://www.bundesnetzagentur.de/SharedDocs/Downloads/DE/Allgemeines/Bundesnetzagentur/Publikationen/Berichte/2015/ARegV_Evaluierungsbericht_2015.pdf?__blob=publicationFile&v=3.

European Energy Industry Investments
PE 595.356 135
PCI
Routing
Construction Status
Commissioning Date
Length (km)
2.9 Germany internal line between Osterath and Philippsburg (DE) to increase capacity at Western borders
Planned, but not yet in permitting
2019 340
2.10
Germany internal line between Brunsbüttel-Grοβgartach and Wilster-Grafenrheinfeld (DE) to increase capacity at Northern and Southern borders
Planned, but not yet in permitting
2025 450-550
2.11.1
Interconnection between border area (DE), Meiningen (AT) and Rüthi (CH)
Under consideration
N/A 380
2.11.2
Internal line in the region of point Rommelsbach to Herbertingen (DE) Permitting 2019 157
2.11.3
Internal line point Wullenstetten to point Niederwangen (DE) and internal line Neuravensburg to the border area DE-AT
Planned, but not yet in permitting
2023 -
2.12 Germany — Netherlands interconnection between Niederrhein (DE) and Doetinchem (NL)
Permitting 2017 60
2.21 Hydro-pumped storage Riedl in the AT/DE border area. Capacity: 330-462 GWh (annually)
Permitting 2022 N/A
3.1.1 Interconnection between St. Peter (AT) and Isar (DE) Permitting 2020 171
3.12 Internal line in Germany between Wolmirstedt and Bavaria to increase internal North-South transmission capacity
Planned, but not yet in permitting
2022 600
3.13 Internal line in Germany between Wolmirstedt and Bavaria to increase internal North-South transmission capacity
Under construction 2016 110
3.14.1
Interconnection between Eisenhűttenstadt (DE) and Plewiska (PL)
Under construction 2030 252
3.15.1
Interconnection between Vierraden (DE) and Krajnik (PL)
Under construction 2017 26

Policy Department A: Economic and Scientific Policy
136 PE 595.356
PCI
Routing
Construction Status
Commissioning Date
Length (km)
3.15.2
Installation of phase shifting transformers on the interconnection lines between Krajnik (PL) — Vierraden (DE) and coordinated operation with the PST on the interconnector Mikułowa (PL) — Hagenwerder (DE)
Construction and commissioning
2017 N/A
4.1
Denmark – Germany interconnection between Tolstrup Gaarde (DK) and Bentwisch (DE) via offshore windparks Kriegers Flak (DK) and Baltic 1 and 2 (DE) [currently known as Kriegers Flak Combined Grid Solution]
Permitting / Construction 2018 50
Sources: European Commission, PCI fiches, http://ec.europa.eu/energy/infrastructure/transparency_platform/map-viewer/, download 30.08.2016
Key lessons learnt and conclusions There are several aspects that need to be considered when discussing the development of investments into generation and grid capacities. First of all, it is necessary to develop projections for the electricity sector that are consistent with the long term political goals and based on different possible economic and technical developments. Second, price peaks, investment plans of generators and grid congestion are important signals to convey information about required grid upgrades and extensions. Last, public participation processes are highly important to raise awareness for investment needs and improve acceptance and they should be designed to allow low-threshold interaction between the relevant authorities and citizens or organizations. These three points will be elaborated further in the following paragraphs.
The scenario framework developed by the German TSOs and approved by the FDA for the Network Development Plan represents a limited set of options for the future electricity sector. In the actual political framework, there is no room for an analysis of a broad range of possible developments between large-scale centralized and decentralized options. The considered timeframe (10 years, resp. 20 years for some scenarios) does not offer a long term perspective up to 2050. Furthermore, while focussing only on the electricity sector, the chosen scenarios might not be consistent with long-term climate protection scenarios for Germany307.
The narrow perspective of the NDP scenarios is a key critique of many stakeholders.308 To cope with this criticism, some projects focus on developing and analysing different scenarios in cooperation with several stakeholders.309 The German TSO 50Hertz developed and
307 Repenning et. al (2015): Klimaschutzszenario 2050. Studie im Auftrag des Bundesministeriums für Umwelt,
Naturschutz, Bau und Reaktorsicherheit, http://www.oeko.de/oekodoc/2451/2015-608-de.pdf. 308 Gemeinde Prebitz (2016): Szenariorahmen 2030; Stellungnahme der Gemeinde Prebitz;
http://data.netzausbau.de/2030/Stellungnahmen_Szenariorahmen_2030.pdf. 309 E.g. Timpe et. al (2016): Erhöhung der Transparenz uber den Bedarf zum Ausbau der
Stromübertragungsnetze. http://www.transformation-des-energiesystems.de/projekt/transparenz-stromnetze, Renewables Grid Initiative (2016): Future Scenario Exchange Workshop, 8th July 2016, http://renewables-

European Energy Industry Investments
PE 595.356 137
calculated five so-called “extreme sub-scenarios” for 2035. They found out that the developed future power grid seems to be robust.310 These findings might be criticized by other researchers, e.g. because the future power grid might not be optimized for a decarbonized power sector.311
Besides broadening the spectrum of scenarios for future framework, a completely different perspective on possible future energy systems could thus lead to a very different power grid as a result. Strongly decentralized power systems with local micro grids or systems with a strong focus on storage and power to gas so far aren’t considered in the official projections for grid extension plans.
The common electricity market between Germany and Austria leads to a single spot market price for the whole region. Physical network constraints (both between the two countries as well as within Germany) are not reflected in this pricing model. This leads to discrepancies between physical flows and commercial flows and puts stress on other countries such as Poland and the Czech Republic through loop flows. A possible solution could be to introduce nodal pricing or regional price zones. This would allow to for regionally differentiated pricing, reflecting needs for redispatch due to network constraints. Furthermore, in case of a high number of price zones, differentiated information on bottlenecks is available through the analysis of price differences.
Grid usage charges in Germany are regionalized and usually higher in regions where more grid enhancements and new connections (e.g. for wind farms) are constructed. This leads to reduced acceptance of these investments by the local population which might not profit from the additional generation capacities (see introduction of this case study for information on regional differences in generation and demand within Germany). A revised system for grid usage charges could lead to a more balanced distribution of charges between regions.
Participation opportunities for citizens, researchers and non-governmental organizations in the development of investment plans have significantly increased since the introduction of the NDP. However, these opportunities often either require significant knowledge of processes or only provide very limited possibilities to influence the official plans. This leads to frustration with and subsequently opposition to the process of electricity network expansion in Germany. A revision of participation opportunities could help to increase public acceptance and facilitate approval and implementation of the results of the planning process.
The procedures in place since 2012 concerning the electricity network expansion processes in Germany have increased transparency of planning and introduced participation opportunities. This process should be developed further and refined to allow that investments needed for a future-proof electricity system and network have a broad public acceptance.
grid.eu/fileadmin/user_upload/Files_RGI/Event_material/Summaries/RGI_Scenario_Exchange_Workshop__Minutes.pdf.
310 50Hertz (2016): 50Hertz Energiewende Outlook 2035; http://www.50hertz.com/Portals/3/Content/Dokumente/Netzausbau/Wof%C3%BCr%20Netzausbau/EWO%202035/50Hertz_Energiewende_Outlook_2035.pdf.
311 E.g. Agora Energiewende (2014): Robuste Stromnetze planen: Stellungnahme zum Szenariorahmen 2025, eingereicht anlässlich der Konsultation durch die Bundesnetzagentur, https://www.agora-energiewende.de/fileadmin/Projekte/2013/methoden-der-netzentwicklung/Stellungnahme_Szenariorahmen_2025_23062014.pdf; Jarass (2015): Kohlebedingter Netzausbau behindert Energiewende, https://www.dialog-energie-zukunft.de/kohlebedingter-netzausbau-behindert-energiewende/.
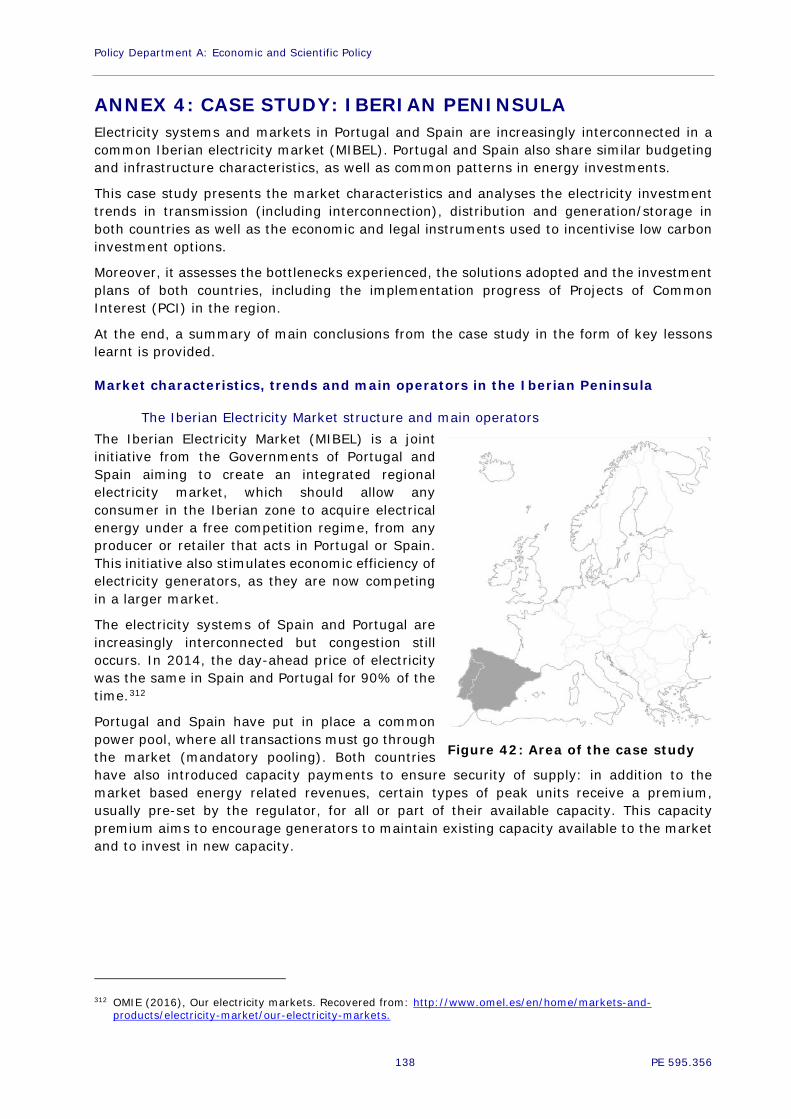
Policy Department A: Economic and Scientific Policy
138 PE 595.356
ANNEX 4: CASE STUDY: IBERIAN PENINSULA Electricity systems and markets in Portugal and Spain are increasingly interconnected in a common Iberian electricity market (MIBEL). Portugal and Spain also share similar budgeting and infrastructure characteristics, as well as common patterns in energy investments.
This case study presents the market characteristics and analyses the electricity investment trends in transmission (including interconnection), distribution and generation/storage in both countries as well as the economic and legal instruments used to incentivise low carbon investment options.
Moreover, it assesses the bottlenecks experienced, the solutions adopted and the investment plans of both countries, including the implementation progress of Projects of Common Interest (PCI) in the region.
At the end, a summary of main conclusions from the case study in the form of key lessons learnt is provided.
Market characteristics, trends and main operators in the Iberian Peninsula
The Iberian Electricity Market structure and main operators The Iberian Electricity Market (MIBEL) is a joint initiative from the Governments of Portugal and Spain aiming to create an integrated regional electricity market, which should allow any consumer in the Iberian zone to acquire electrical energy under a free competition regime, from any producer or retailer that acts in Portugal or Spain. This initiative also stimulates economic efficiency of electricity generators, as they are now competing in a larger market.
The electricity systems of Spain and Portugal are increasingly interconnected but congestion still occurs. In 2014, the day-ahead price of electricity was the same in Spain and Portugal for 90% of the time.312
Portugal and Spain have put in place a common power pool, where all transactions must go through the market (mandatory pooling). Both countries have also introduced capacity payments to ensure security of supply: in addition to the market based energy related revenues, certain types of peak units receive a premium, usually pre-set by the regulator, for all or part of their available capacity. This capacity premium aims to encourage generators to maintain existing capacity available to the market and to invest in new capacity.
312 OMIE (2016), Our electricity markets. Recovered from: http://www.omel.es/en/home/markets-and-
products/electricity-market/our-electricity-markets.
Figure 42: Area of the case study

European Energy Industry Investments
PE 595.356 139
a. Market Structure
The table below provides an overview of the market structure.
Table 17: Market structure
Spain Portugal
Main generators
Endesa Group; Iberdrola Group;
EDP / Hidrocantábrico Group;
Gas Natural Fenosa Group.
Energias de Portugal, SA (EDP)
Transmission system operators Red Eléctrica de España, S.A. (REE) Redes Energéticas
Nacionais (REN)
Distribution system operators
Endesa Distribución Eléctrica, S.L.;
Iberdrola Distribución Eléctrica, S.A.;
Unión Fenosa Distribución, S.A.;
Hidrocantábrico Distribución Eléctrica, S.A.; E.ON Distribución, S.L.
Energias de Portugal, SA (EDP)
Market Operator
OMIE - manages wholesale electricity market (cash or “spot”)
OMIP - manages derivatives market
Iberian Energy Market Operator (OMI)
Market (PX) MIBEL
Sources: CMS Guide to Electricity313
Installed generation capacity During the period 2010-2015, the total electricity capacity increased by over 4 GW in Spain and over 0.6 GW in Portugal, as a result of additional capacity in RES parallel to a decrease in conventional capacity314. Overall, the Iberian Peninsula electricity market is characterised by mature renewable technologies such as onshore wind, solar PV and hydro, which have reached a high share in the electricity consumption (37% in 2015315).
The following figure presents the Spanish and Portuguese electrical capacity by technology by end 2015.
313 CMS (2016), e-guides. Recovered from: https://eguides.cmslegal.com/electricity. 314 Spanish and Portuguese installed conventional capacity grew until 2010 respectively 2012, and then started to
decrease. 315 Share calculated by using data on production from renewable sources and total electricity demand from REE
(http://ree.es/es/estadisticas-del-sistema-electrico-espanol/indicadores-nacionales/series-estadisticas) and REN (Technical Data 2015).

Policy Department A: Economic and Scientific Policy
140 PE 595.356
Figure 43: Spanish and Portuguese electrical capacity by end 2015
Source: REE-Statistics-Installed electrical power 2015316 and REN-Technical Data 2015317.
Electricity consumption and peak load The reserve margins (calculated by dividing the firm capacity by the annual peak load) are relatively high. Moreover, as the overall installed capacity is about 20% higher than the firm capacity, there is from a security of supply perspective no need for new generation capacity in the short and medium term.
Figure 44: Reserve margin in Spain and Portugal
316 REE (2016), Electrical system statistics. Recovered from: http://ree.es/es/estadisticas-del-sistema-electrico-
espanol/indicadores-nacionales/series-estadisticas. 317 REN (2015), Technical Data. Recovered from: https://www.ren.pt/files/2016-04/2016-04-04142733_f7664ca7-
3a1a-4b25-9f46-2056eef44c33$$72f445d4-8e31-416a-bd01-d7b980134d0f$$ee3c56e5-6d14-4aa0-ac1f-ca5006917e03$$storage_image$$pt$$1.pdf.

European Energy Industry Investments
PE 595.356 141
Source: EDP- Energias de Portugal. Iberian Data. 2010318, 2011319, 2013320 and 2015321
Interconnections and transmission lines evolution a. Transmission lines in the Iberian Peninsula
Portugal is relatively well interconnected with Spain through an on-going action to improve the cross-border integration of its energy networks. The electricity interconnection capacity of Portugal with Spain was 7% of the total installed generating capacity in 2014, expecting to rise to above 10% target by 2018322, after the commissioning of the current PCIs. New PCIs are considered to reach the proposed target of 15% interconnection capacity by 2030.
b. Interconnections with other EU Member States Spain has a limited level of interconnection with other European countries, still substantially below the European target of 10% by 2020.
In the Iberian Peninsula as a whole, the installed electricity production capacity is 120 GW, while the peak load was in 2015 only 49.3 GW323. The excess capacity can however not be shared with the rest of Europe, as the interconnection with France represents only 2.4% and will reach 4.1% in 2020, assuming that a new western undersea interconnection cable is built by 2020. Interconnection with France has long been a bottleneck for electricity exchanges, and is still limited, although the Net Transfer Capacity (NTC) of 1.4 GW has doubled in 2015 when the Santa to Llogaia-Baixas interconnection has entered into commercial operation.
c. Imports/exports
The following figure shows the imports and exports of electricity of Spain and Portugal. Due to the limited interconnection with the rest of Europe exports from Spain go mainly to Portugal, and vice versa.
318 EDP (2010), Iberian Data. Recovered from:
http://www.edp.pt/pt/aedp/sectordeenergia/Dados%20Ibricos/DadosIbericos_2010_EN.pdf 319 EDP (2011), Iberian Data. Recovered from:
http://www.edp.pt/pt/aedp/sectordeenergia/Dados%20Ibricos/FolhetoDadosIbericos_A4_EN_25Jun.pdf 320 EDP (2013), Iberian Data. Recovered from:
http://www.edp.pt/pt/aedp/sectordeenergia/Dados%20Ibricos/DadosIbericos2013EN.pdf 321 EDP (2015), Iberian Data. Recovered from:
http://www.edp.pt/pt/aedp/sectordeenergia/Dados%20Ibricos/IberianData2015.pdf 322 ENTSO-E (2015), What, why, how-understand in a nutshell the final 2015 regional investment plans, TYNDP
2016 scenarios and projects list. Recovered from:https://www.entsoe.eu/Documents/TYNDP%20documents/TYNDP%202016/151216_TYNDP%202016%20webinar%20_%20what,%20why%20how_all%20presentations.pdf
323 EDP (2015), Energy with intelligence. Recovered from: Recovered from: http://www.edp.pt/pt/aedp/sectordeenergia/Dados%20Ibricos/IberianData2015.pdf

Policy Department A: Economic and Scientific Policy
142 PE 595.356
Figure 45: Electricity international flows (net balance) in Spain and Portugal
Source: REE- statistics- Installed capacity power324 and REN- Technical Data 2011-2015325.
Electricity tariff deficit in Spain and Portugal a. Spain’s electricity tariff deficit
In Spain, tariff debt is a major concern. As a result of an extensive reform of the renewable energies support scheme in 2013 and an adjustment of the charge to the power consumers since 2009, the annual deficit was reverted to a surplus of €550 million in 2014, but the accumulated debt is still very high: about €25 billion at the end of 2015. The Spanish power system has been operating at a financial loss since 2000 as the Spanish authorities limit the increase of electricity end-user prices. Thus, utilities cannot lawfully recover their generation and supply costs.
In the early 2000s, and between 2005 and 2008, rising natural gas prices contributed to the deficit increase. The deficit further expanded as of 2008 due to regulated costs (or so-called “access costs”) which include grid costs, subsidies for renewables and combined heat and power generation, and compensation for higher electricity costs on Spain’s islands.
Aiming to lower the deficit, Spain suspended the support to almost all new RES since 2012, introduced new taxes on generation since 2013, and limited increases in access fees. In 2013, feed-in tariffs and premiums were replaced with a scheme that guarantees a fixed return for investors; at the same moment the remuneration level for transmission and distribution system operators was changed and the capacity payments for combined-cycle gas plants
324 REE (2016), Electrical system statistics. Recovered from: http://ree.es/es/estadisticas-del-sistema-electrico-
espanol/indicadores-nacionales/series-estadisticas 325 REN (2011-2015), Technical Data. Recovered from:
http://www.centrodeinformacao.ren.pt/EN/InformacaoTecnica/TechnicalData/TechnicalData2011.pdf. http://www.centrodeinformacao.ren.pt/PT/InformacaoTecnica/DadosTecnicos/2014.pdf. https://www.ren.pt/files/2016-04/2016-04-04142733_f7664ca7-3a1a-4b25-9f46-2056eef44c33$$72f445d4-8e31-416a-bd01-d7b980134d0f$$ee3c56e5-6d14-4aa0-ac1f-ca5006917e03$$storage_image$$pt$$1.pdf
-11500
-9500
-7500
-5500
-3500
-1500
500
2500
4500
6500
8500
2009 2010 2011 2012 2013 2014 2015
Elec
tric
Ene
rgy
(GW
h)
Spanish export electrical Power Portuguese import electrical Power

European Energy Industry Investments
PE 595.356 143
were reduced. In 2015, Royal Decree 900/2015 established charges326 on existing and new self-consumption RES plants, both on capacity and generation levels.
The following figure illustrates the evolution of electricity costs, revenues and deficit for the period 2005-2013. The main reason for the generation cost increase is the expansion of renewable energy capacity. Before 2009, higher costs led to lower net revenues as the end-user price was regulated by the government. Since 2009, a higher proportion of the cost is passed to consumers, so the revenues started to rise.
Figure 46: Evolution of revenues and costs of the Spanish power system (EUR/MWh)
Source: Deloitte. Energy market reform in Europe.2015327
b. Portugal´s tariff deficit
In Portugal, the tariff debt is also substantial: the total accumulated tariff deficit was estimated by the regulator ERSE at EUR 4.69 billion (3.1% of GDP) at the end of 2014. The bulk of the Portuguese tariff deficit emerged in 2008, 2012 and 2013. The tariff deficit was mainly due to RES subsidies and support to thermal electricity generation and cogeneration. Since 2008, the mismatch between the wholesale electricity price and the retail price was the major factor contributing to the deficit.
326 According to RD 900/2015, these are not taxes or compensation for utility losses, but contributions to overall
system costs. Self-consumption installations under 10 kW and plants located not on the Spanish mainland will be spared the generation charge, but will still be subject to a fixed charge per kW of capacity.
327 Deloitte (2015), Energy market reform in Europe, European energy and climate policies: achievements and challenges to 2020 and beyond.

Policy Department A: Economic and Scientific Policy
144 PE 595.356
Figure 47: Evolution of the electricity tariff deficit in Portugal, 2007-2014
Source: IEA. The global energy outlook and what it means for Portugal. 2016328
Investments in generation and transmission The following table provides an overview of the investments made in the Iberian Peninsula329 in infrastructure in the electricity sector.
Table 18: Electricity infrastructure investments in Spain
Year Investment (M€)
Generation (non-renewable)
Generation (renewable)
Transmission/distribution Total
2000 883 400 1.114 2.397
2001 1.440 541 1.334 3.315
2002 1.821 406 1.576 3.803
2003 1.454 1.096 1.581 4.131
2004 1.472 1.148 1.823 4.443
2005 1.797 839 2.260 4.896
2006 2.410 910 2.346 5.666
2007 2.470 1.590 2.510 6.570
2008 2.570 1.770 2.610 6.950
2009 1.845 1.005 2.420 5.270
328 IEA (2016), the global energy outlook and what it means for Portugal. Recovered from:
https://www.iea.org/newsroomandevents/speeches/160413_Portugal_IDR_launch.pdf 329 The data of this table corresponds only to Spain as there is no analogous information available for Portugal.

European Energy Industry Investments
PE 595.356 145
Year Investment (M€)
Generation (non-renewable)
Generation (renewable)
Transmission/distribution Total
2010 1.555 580 2.245 4.380
2011 1.170 404 2.065 3.639
2012 1.008 190 2.015 3.213
2013 765 144 1.359 2.268
2014 665 57 1.560 2.282
Source: Own elaboration based on UNESA, Statistical reports. 2008-2014.330
The main share of investment has been made in the transmission/distribution sector, evolving from about 40% in 2001-2004 and 2006-2008 to about 70% in 2014. Investments in conventional generation were rather high until 2008, but have substantially declined since then, while RES investment levels have been very volatile over the whole period.
Investment in the electricity sector has mainly been driven by the political system of regulation (for grids) and incentives (for generation). Conversely, the main bottleneck for investments has been the uncertainty created by the changing system of incentives and the unstable political framework in the region.
The current system of incentives is hereafter described in more detail.
Drivers and barriers for RES investments The main driver for RES investment in Spain and Portugal has been feed-in tariffs (FIT) feed-in premiums (FIP) 331 schemes used by the countries from 2005 to 2013. The design of these schemes has recently changed, leading to an increasing legal uncertainty which has negatively impacted the investment in RES generation capacity in the region. In the following section, more details are provided on the supporting framework for RES and bottlenecks that hinder investments. a. Feed-in tariffs, feed-in premiums & Investment support schemes The following figure illustrates the relationship between RES investments and subsidies (FIT and FIP payments) in Spain. RES investments sharply increased until 2008, and as a result of the feed-in premium scheme, the subsidies/costs increased in the following years. The increased costs led to a high tariff deficit (see section 1.1.5 above), and the government decided to introduce a new regime for RES in 2013.
330 UNESA (2008-2014), Statistical reports. Recovered from: http://www.unesa.es/biblioteca/category/10-
memorias. 331 EEA (2014), Energy support measures and their impact on innovation in the renewable energy sector in
Europe. Recovered from: http://eea_energy.pbe.eea.europa.eu/energy-support/project-library.

Policy Department A: Economic and Scientific Policy
146 PE 595.356
Figure 48: Renewables – Investment & special premium system, 2000-2014
Source: UNESA, Economic and financial situation of electrical activity in Spain, 1998-2012332. CNMC, Tariff and premium payments of special regime facilities 2013, 2014.333
In 2013, Spain retroactively amended (RD 9/2013) the remuneration system for RES, CHP and wastes: the reasonable return (ROI) for RES was decreased to 7.5% before taxes, which resulted in a sharp reduction of the remuneration of renewable assets (Ashurst Madrid, 2014). The most controversial aspect of this new remuneration system was its retrospective effect, as it also affected existing installations. This political decision has jeopardised the investors’ confidence in the regulatory framework of the Spanish electricity market.
Summarising, the current Spanish remuneration system for renewable energy involves three parts334: i) the market price complemented with a subsidy calculated on the basis of the reasonable return, ii) an annual regulated remuneration for initial investments in capacity (applicable if market prices do not allow to recover the investments in capacity) and iii) an annual regulated remuneration for operation (applicable if the operational costs exceed the estimated electricity sales revenues).
In Portugal, the FIT regime continues to apply only to existing installations. On the other hand, a new regime for Small Production Units (UPP) and Self-Consumption Units (UPAC) is established as an unique regime according to ordinance 14/2015 (explained below in point
332 UNESA (2014), Economic and financial situation of electrical activity in Spain 1998-2012. Recovered from:
http://www.unesa.es/biblioteca/category/1-estudios. 333 CNMC (2013-2014), Tariff and premium payments of special regime facilities. Recovered from:
http://energia.cnmc.es/cne/doc/publicaciones/cne08_13.pdf, https://www.cnmc.es/Portals/0/Ficheros/Energia/EnergiaElectrica/Liquidaciones/141202_%20InfInfo%20de%20Resultados%20Liquidacion%20Complementaria%20de%20la%2014%202013%22SECTOS%20ELECTRICO.pdf, https://www.cnmc.es/Portals/0/Ficheros/Energia/Informes/Liquidaciones_Electricidad/151124_LIQ_DE_346_15_Liq_definitiva%202014_energiaelectrica.pdf.
334 Araoz and Rueda (2014), New regulatory framework for renewables in Spain. Recovered from: http://www.araozyrueda.com/en/archivos/notas-informativas-1/2014/new-regulatory-framework-for-renewables-in-spain.pdf.
0
200
400
600
800
1.000
1.200
1.400
1.600
1.800
2.000
0
1.000
2.000
3.000
4.000
5.000
6.000
7.000
8.000
9.000
10.000
1998 2000 2002 2004 2006 2008 2010 2012 2014 2016
Gen
erat
ion
capa
city
inve
stm
ent (
M€)
Spec
ial p
rem
ium
(M€)
Renewables - Investment & Special system premium
Special premium for renewables Generation capacity (renewable)

European Energy Industry Investments
PE 595.356 147
c. Alternative remuneration regimes) and replaced the previous system of remuneration for micro and mini generation units335, which continues to be applicable only to installations commissioned before January 2015.336 b. Third-Party Financing (TPF) Third-Party Financing (TPF) is a mechanism to facilitate energy related investment projects. In Spain, the Institute for Diversification and Energy Saving (IDAE), is the main promoter of this financing mechanism which is being used successfully since 1987, mainly for improvement of energy efficiency in buildings and for the installation of small scale renewable capacity. IDAE is currently funding (using ERDF support) investments in energy efficiency and micro-renewable generation; its grants available for the period 2014-2020 amount to € 507 million. In Portugal, the programme Efficient Building was launched in 2012 to support the installation of solar thermal systems (STS) in residential buildings and was open for applications until 3 June 2013. The programme had a €1 million budget and the subsidy covered 50% of the investment costs (installation included) up to €1,500. In 2016, there is an investment grant scheme for Efficient Building to support projects to improve energy efficiency in building, whose budget is € 1.1 million and covers up to 60% of the investment cost. It is financed by Fundo de Eficiência Energética (FEE) and it could be applied from the 8th of July to the 8th of November of 2016.337 c. Alternative remuneration regimes
In 2015, Portugal established a special regime for Small Production (UPP) and Self-Consumption Units (UPAC). This regime is similar to the previous remuneration regime for micro-production, but now UPACs are able to connect to the national grid and UPPs are supported through a bidding scheme. Additionally, another alternative regime has been introduced for wind plants, that can choose to accede to an alternative remuneration regime for an additional period of five or seven years after the end of the period of guaranteed remuneration upon the commitment to contribute to the sustainability of the National Electric System (SEN) through the payment of a compensation.
d. Other non-fiscal measures
• Building code: Since 2006 in Spain there is an obligation for new and renovated buildings to integrate solar PV or solar thermal systems. This provision mainly stimulated the deployment of solar thermal systems.
• Priority grid access: Until 2013 in Spain, renewable energy plants had not only priority access to the grid but also dispatch priority. Since 2014 (RD 413/2014 and IET/1045/2014), Spain restricted the dispatch priority for RES to “equality of economic conditions in the market”, which means that priority grid access is still granted but dispatch priority will be only granted if bidding prices for RES are equal or lower than conventional sources. In Portugal, priority grid access is granted to electricity produced from RES (except for hydro plants with an installed capacity exceeding 30MW).
• Major planning lines (Grandes Opcoes do Plano): Portugal's government is considering investments in solar energy as a priority for the next three years, according to the Grandes Opcoes do Plano (GOP) document338. The Portuguese government has planned
335 EEA (2014), An outline of these remuneration regimes can be found in EEA, 2014. Country profile – Portugal. 336 Res-Legal (2016), Feed-in tariff. Recovered from: http://www.res-legal.eu/search-by-
country/portugal/single/s/res-e/t/promotion/aid/feed-in-tariff-tarifas-feed-in/lastp/179/. 337 PNAEE (2016), efficient building. Recovered from: http://www.pnaee.pt/avisos-fee/11-fee/avisos/78-aviso-20-
edificios-eficientes. 338 PRESIDÊNCIA DO CONSELHO DE MINISTROS (2016), Grandes Opcoes do Plano 2016-2019. Recovered from:
http://www.gpeari.min-financas.pt/analise-economica/publicacoes/documentos-de-politica-economica/grandes-opcoes-do-plano-gop.

Policy Department A: Economic and Scientific Policy
148 PE 595.356
many actions to boost the renewables sector, including reassessing the National Dam Plan to encourage the development of small hydropower plants (HPPs) or promoting microgeneration in public buildings, wind projects both onshore and offshore, decentralized production of renewable energy and the use of forest biomass. To reduce the price of electricity, the government intends to limit the compensation for hydro power in years of drought, as has been done in Spain, to renegotiate the concessions in the energy sector and gradually establish an energy compensation system at market prices.
• PNAER 2020339: Within this plan, Portugal intends to promote the development of micro RES installations in the residential and industrial sector.
Drivers and barriers for conventional generation Apart from the revenues provided by the market, the support measures implemented by both governments have also favoured investments in conventional generation. Despite the strong increase in RES capacity which has led to an oversupply, conventional power plants still benefit from financial support via capacity payments and investment aid. This may explain why conventional generation capacity continued to grow (until 2010 in Spain and until 2012 in Portugal) despite a decrease in electricity demand (6 % in 2009) and financial margins and a strong increase in RES from 2005 to 2010.340
a. Remuneration due to the availability service
Portugal and Spain use flat-rate pumping and reservoirs power plants, coal, gas and oil for their availability of capacity per technology. In 2012, this remuneration varied between EUR 4 640/MW and EUR 1 220/MW and totalled EUR 191 million in Spain.28 This remuneration regime is still in place in both countries.
b. Funding for coal stockpiles
This measure provides funding to power plants to support the creation of coal stockpiles in Spain. Those stockpiles are meant to guarantee over 720 hours of power generation. Plants are, however, specifically required to stock domestic coal.29
c. Investment aid for conventional generation facilities with a capacity higher than 50 MW
Conventional power generation units with a capacity > 50 MW are eligible for a capacity payment for the first 10 years of operation. The payment level is adjusted each quarter by the transmission system operator (TSO). In 2012, these investment aids amounted to EUR 651 million341.
d. Tax exemption and reductions
Fuel Tax Exemption for Electricity Generators: the use of coal, coke, and fuel oil by conventional or CHP plants in Portugal is exempt from fuel excise tax.
e. Operating aid
In Spain there has historically been financial aid to coal production and consumption. Following graph provides an overview of the aid to coal production provided in 2001-2013, showing that this operating aid was reduced by 1.25% for underground mines and by 3.25% for opencast mines per year from 2006 to 2012. Currently, maintaining this measure is under 339 PRESIDÊNCIA DO CONSELHO DE MINISTROS (2013), PNAER 2020. Recovered from:
https://dre.pt/application/dir/pdf1sdip/2013/04/07000/0202202091.pdf. 340 EEA (2014), Energy support measures and their impact on innovation in the renewable energy sector in
Europe. Recovered from: http://eea_energy.pbe.eea.europa.eu/energy-support/project-library. 341 Regulatory Commission for Electricity and Gas (2012), Capacity remuneration mechanisms. Recovered from:
http://www.creg.info/pdf/Etudes/F1182EN.pdf.

European Energy Industry Investments
PE 595.356 149
discussion and, in any case, the remaining subsidies are being phased out to meet the requirements by the end of 2018 according to Decision 2010/787/EU.342
Figure 49: Spanish coal aid, 2001-2013
Source: Ministry of Industry, Energy and Tourism. Energy book 2001-2013.343
Regarding coal consumption, the government set up an obligation to use domestic coal, under Royal Decree 134/2010, due to the oversupply of domestic coal. The owners of the power plants which used domestic coal were compensated to help them cover their generation costs (national annual budget for this purpose was €400 million, maximum). The consequences were a regulated cost of the electricity system, which has increased the tariff deficit. The obligation was valid from 2010 to the end of 2014.28
Drivers and barriers for investment in grids
For 20 years, Portugal and Spain have mitigated the isolation of the Iberian electricity system through grid investments in both countries. The main driver for investments in the grid is the political framework and the regulation at national and European level. Detailed information on the current plans for grid development is provided in section 1.3 including the key barriers for their implementation.
Implementation of national investment and development plans
As showed in Table 18, the main share of the investment in the electricity sector concerns the transmission/distribution grids. The plans for future investment /development in the electricity grids would lead to an annual investment level of about € 850 million, as shown in the following table.
342 IEA (2015), Energy policies of IEA countries: Spain. Recovered from:
https://www.iea.org/publications/freepublications/publication/IDR_Spain2015.pdf. 343 Ministry of Industry, Energy and Tourism (2010), Spain’s national renewable energy action plan 2011-2020:
National electricity balance 2020. Recovered from: http://pvtrin.eu/assets/media/PDF/EU_POLICIES/National%20Renewable%20Energy%20Action%20Plan/202.pdf.

Policy Department A: Economic and Scientific Policy
150 PE 595.356
Table 19: Planned transmission grid investment in Portugal and Spain for years 2015344-2020
Year Planned transmission grid investment (M€)
Spain Portugal* Total
2015 592 145 737
2016 764 125 889
2017 743 160 903
2018 889 100 989
2019 622 100 722
2020 944 120 1.064
Note: *Information for Portugal is extracted from a national investment plan which is not yet approved345; Data does not include investment planned for energy efficiency and generation purposes.
Source: Own elaboration based on the Electricity transmission grid planning for 2015-2020 (Spain)346 and PDIRT 2016-2025 (Portugal)347. These figures include the financial contribution of European funds (see financing arrangements section below).
As a whole, the Iberian Peninsula investment plan will be focused on:
• Improving the integration of renewable energy based production capacity into the grid.
• Reinforcing the distribution grids. • Integrating the electrical system with other Member States. • Territorial optimization of the grid.
Even though the national plans of Spain and Portugal share common concerns and objectives, each country has its own national priorities and characteristics. The main development plans of Spain and Portugal are hereafter shortly presented.
Spain a. Transmission grid
In October 2015, the electricity transmission grid planning for 2015-2020 was approved. The expected improvement in energy efficiency along with the high current level of generation adequacy (and related transmission infrastructure) ensure the security of supply. For this reason, the development of the grid is focused on the development of international interconnections, interconnections between island systems and the link between the Spanish Peninsula and non-peninsular systems.
344 2015 is included as it was referenced in the latest grid development plan of Spain. 345 This plan updates the previous investment plan to the current macro-economic scenario of the country. 346 Ministry of Industry, Energy and Tourism (2015), Electricity transmission grid planning for 2015-2020 (Spain).
Recovered from:http://www.minetur.gob.es/energia/planificacion/Planificacionelectricidadygas/desarrollo2015-2020/Documents/Planificaci%C3%B3n%202015_2020%20%202015_12_03%20VPublicaci%C3%B3n.pdf
347 REN (2015). PDIRT 2016-2025: Development and investment plan of national transport grid. Recovered from: http://www.erse.pt/pt/consultaspublicas/consultas/Documents/53_Proposta%20PDIRT-E_2015/PDIRT%202016-2025%20-%20Junho%202015%20-%20Relat%C3%B3rio.pdf

European Energy Industry Investments
PE 595.356 151
b. Generation
Spain primarily relies on its current support scheme (see section 1.2) for incentivizing investments in generation capacity (for both renewable energy and conventional sources). As mentioned in the transmission grid plan, the Spanish legislator assumes that with the current level of generation capacity and with the expected improvement in energy efficiency, security of supply is ensured. For this reason, the only investment planned for future years is channelized though IDAE, which will make available investment grants in the period 2014-2020 that amount to 152 M€348 for small scale renewable generation. Regarding nuclear electricity generation, which accounts for about 22% of the electricity demand in the Iberian Peninsula, the phasing out of the five active nuclear plants in Spain is currently under discussion but their decommissioning is not considered in the current development plan (which assumes that generation from nuclear sources is constant for the period 2015-2020).
c. Energy efficiency
Spain established its action plan for energy efficiency 2014-2020349 according to Directive 2012/27/EU. For achieving the determined objective, a budget of 1.139 M€ has been allocated to develop actions for the: i) renewal of industrial equipment, ii) renewal of heating installations, air-conditioning, and lighting in buildings, and iii) more efficient use of all modes of transport.
Portugal a. Transmission grid
The Portuguese development and investment plan for the national electricity transmission grid (PDIRT) 2016-2025350 updates the analogous plan for 2012-2017. This plan is currently in public consultation, and hence not formally approved. It identifies investments in five domains: i) strategic development of the network, ii) support to the distribution network, iii) international integration, iv) management of end of useful life of the equipment, and v) geographical optimisation of the network.
b. Distribution grid
The Portuguese development and investment plan for the electricity distribution grid (PDIRD) 2015-2019 updates the analogous plan for 2010-2014. It identifies investments in four main domains351: i) security of supply; ii) improvement of technical service quality; iii) improvement of grid efficiency (reduction of losses); and iv) improvement of operational efficiency (reduction of operational costs).
c. Generation
Several development plans focus on the Portuguese objective of increasing its RES share: National Renewable Energy Action Plan, National Strategy for Energy 2020 and Commitment to green growth. Similar to Spain, Portugal relies on its support scheme for incentivizing future investment in generation capacity (for both renewable and conventional capacity). The
348 IDAE (2014). Actuaciones singulares en economía baja en carbono en el ámbito de las entidades locales.
Recovered from: http://www.fomento.gob.es/NR/rdonlyres/8CD065B1-CD45-42A9-B7E4-22D0662E4E50/133084/4_IDAE_ActuacionesSingularesEBC.pdf.
349 Ministry of Industry, Energy and tourism (2014), 2014-2020 National Energy efficiency action plan. Recovered from: https://ec.europa.eu/energy/sites/ener/files/documents/2014_neeap_en_spain.pdf.
350 EDP (2016), PDIRD 2016-2025: http://www.erse.pt/pt/consultaspublicas/consultas/Documents/53_Proposta%20PDIRT-E_2015/PDIRT%202016-2025%20-%20Junho%202015%20-%20Relat%C3%B3rio.pdf.
351 EDP (2014), PDIRD 2015-2019: Development and investment plan of distribution grid. Recovered from: http://www.erse.pt/pt/consultaspublicas/consultas/documents/49_1/pdird%202015-2019%20-%20plano.pdf.

Policy Department A: Economic and Scientific Policy
152 PE 595.356
national energy efficiency action plan also considers financial aid for small scale renewable generation, similar to Spain. There are no nuclear plants in Portugal.
d. Energy efficiency
The National Action Plan for Energy Efficiency (revised in 2016) is the main plan for energy efficiency in Portugal. It mainly focuses on the promotion of investments in transport, residential buildings and services and behavioral measures. The Eco AP programme has been established to improve the energy efficiency of the national administration premises.
Projects of Common interest The European energy infrastructure projects of common interest (PCIs) of the Iberian region are taken into account in the national development plans outlined above, and Spain and Portugal expect that these projects will be realized on time. Table 7 below provides information on the current PCI´s to be implemented in the Peninsula; they address issues of different nature:
• Interconnection between the Iberian Peninsula and France. PCI codes 2.7, 2.8 and 2.27.
• Interconnection between Spain and Portugal. PCI Code 2.17 • Territorial expansion of the grid within Spain (PCI code 2.6, 2.25.1, 2.25.2, 2.26) and
Portugal (PCI code 2.16.1, 2.16.2, 2.16.3).
Moreover, the TSOs of France, Portugal and Spain have jointly prepared a “Common strategy paper for the development of interconnections of the Iberian Peninsula with the internal electricity market and beyond”, which includes two additional projects to increase the interconnection capacity between Spain and France: one between País Vasco or Navarra (Spain) and Cantegrit (France) and another one between Aragón (Spain) and Marsillón (France). The TSOs have further assessed three other projects that would raise the cross-border capacity between Spain and France to 8 GW in 2020. These projects were endorsed by France, Portugal, Spain and the European Commission on 4 March 2015 and will benefit from EU funding and EIB loans. The three countries and the EC also agreed to set up a high-level group for South-West Europe, which should facilitate the realisation of these interconnection projects by 2020.

European Energy Industry Investments
PE 595.356 153
Table 20: PCIs involving Spain and/or Portugal
PCI Nº
Name Voltage
Capacity
Distance (km)
Current Status Date of commissioning
Max. EU contribution (EUR)
2.6 Spain internal line between Santa Llogaia and Bescanó (ES)
400 kV
1200-1400 MW
40 km Completed 2017
2.7 Bahía Vizcaya: Interconnection France- Spain between Aquitaine (FR) and the Basque Country (SP). New (HVDC subsea cable interconnection)
320-500 kV
2000 MW
360 km Planned but not yet in permitting
2025 3,250,000
2.8 Phase-shifting transformer in Arkale to increase capacity of the interconnection between Argia (FR) and Arkale (ES)
220 kV
Permitting 2017
2.27 Increase of exchange capacity between Spain and France (generic project)
225 kV
8000 MW
Feasibility study 2025
2.17 Spain-Portugal northern interconnection 400 kV
3200 MW
196 k m
Permitting 2018
2.25.1
Internal lines Mudejar-Morella (ES) and Mezquite-Morella (ES)
400 kV
Construction and commissioning
2016
2.25.2
Internal line Morella-La Plana (ES) 400 kV
Permitting 2018
2.26. Spain internal line La Plana/Morella-Godelleta 400 kV
Feasibility 2023
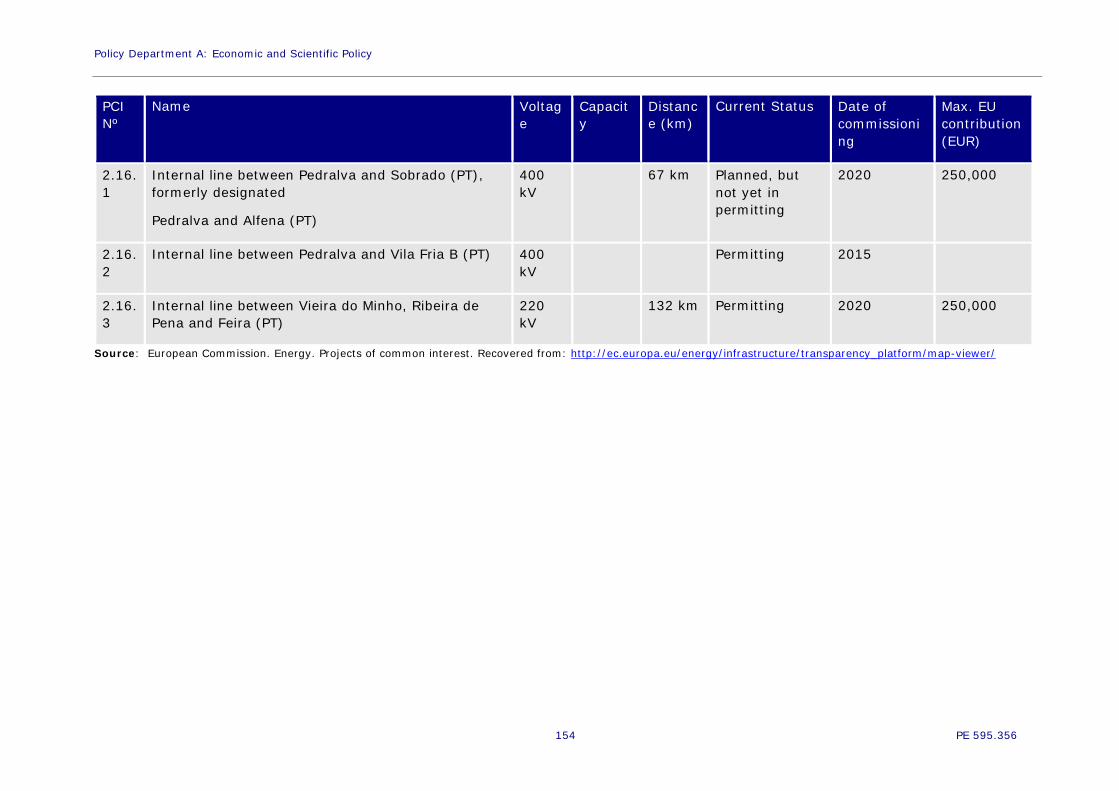
Policy Department A: Economic and Scientific Policy
154 PE 595.356
PCI Nº
Name Voltage
Capacity
Distance (km)
Current Status Date of commissioning
Max. EU contribution (EUR)
2.16.1
Internal line between Pedralva and Sobrado (PT), formerly designated
Pedralva and Alfena (PT)
400 kV
67 km Planned, but not yet in permitting
2020 250,000
2.16.2
Internal line between Pedralva and Vila Fria B (PT) 400 kV
Permitting 2015
2.16.3
Internal line between Vieira do Minho, Ribeira de Pena and Feira (PT)
220 kV
132 km Permitting 2020 250,000
Source: European Commission. Energy. Projects of common interest. Recovered from: http://ec.europa.eu/energy/infrastructure/transparency_platform/map-viewer/

European Energy Industry Investments
PE 595.356 155
Key barriers for the implementation of national development plans and PCI´s
The investments planned under national development plans rely on finance provided by the Spanish and Portuguese national budgets, and some of them are also supported by European funds. The final implementation of the development plans hence depends on the final availability of the funding. Other issues such as technical difficulties or coordination issues can also hinder the realisation of national plans. The main barriers for the realisation of national plans and PCI’s are:
• Macro-economic framework: the planned investment has been estimated under a specific macroeconomic forecast. The actual macro-economic evolution may put at risk some planned national investments in the electricity sector. This affects also the realisation of PCI´s, as they are jointly funded (MS and CEF).
• Unstable political framework: the political framework in the region could involve future adverse regulatory issues that may affect the effective implementation of investment plans and PCI´s.
• Cross-border coordination issues: Spanish and Portuguese development plans include several projects involving more than one MS. This requires a high degree of coordination between countries and political support.
• Time delays and cost issues: projects to be implemented as part of national development plans (including PCI´s) can suffer time delays and cost increases due to permitting procedures and technical issues.
• Further mobilisation of finance: the full implementation of national plans and PCI´s might need the mobilisation of additional financing sources.
• Energy efficiency: the forecasts used to develop national plans for the electricity sector anticipate a decrease in electricity demand. The effective development of energy efficiency and electricity demand might involve changes in national priorities.
Structuring/financing arrangements of the PCIs and other projects
National development plans and PCIs rely not only on direct funding provided by the MS involved, but also on the contribution of European funds. The investment figures presented in include the co-financing commitments of the Connecting Europe Facility (CEF) programme, Structural funds (such as the European Regional Development Fund) and the European Investment Bank.352
• Only three out of eleven PCI projects in the Iberian Peninsula are funded by CEF (see Table 20). The amount provided corresponds to 50% of the total investment cost, while the remaining 50% is attributable to the concerned countries.
• The ERDF 2014-2020 programme for sustainable development is funding actions to stimulate low carbon investments by local entities. IDAE manages the funds in Spain, which are mainly used to co-fund projects regarding energy efficiency and micro renewable energy production, and to a limited extent also grid projects.
• The EIB supports investment in the electricity sector in the Iberian Peninsula since 1980. The EIB has funded, along with national TSOs, DSOs and generators, many projects regarding: i) the modernisation of the grid, ii) installation of new production capacity, primarily renewable energy based, and iii) the expansion of the national grid.
352 These instruments are explained in chapter 4.

Policy Department A: Economic and Scientific Policy
156 PE 595.356
Prospects for achieving the energy and climate 2020 targets
As described in section 2.1 of this study, the EU has agreed on energy and climate targets which affect all MS. Achieving the 2020 targets was one of the most important objectives for Spain and Portugal when designing their national development plans. Table 21 illustrates the assessment for the achievement of these targets, considering the current situation and the planned developments.
Table 21: Expected achievement of the targets, considering the current situation and the planned developments
Greenhouse gas emissions Spain Portugal 2014 (base year 1990)
Total GHG 353,354 17.5% 8.8% GHG from public power production355 -3.7% -13.9%
2020 targets – Non ETS (base year 2005) 42,43 -10% -1%
Renewable Energy Spain Portugal
2014/2015
RES in 2014 42,43 16,2% 27%
RES-E in 2014 (2015) 356,357 40.9% (35.4%)
63.2% (50.5%)
2020 targets
RES 358 20% 31% RES-E 359,360 38.2% 60%
Comments: Spain and Portugal are not expected to achieve their 2020 targets under a BAU scenario.361 For this reason, Spain adopted a new legislation in 2015 to increase biofuel use in the transport sector. Spain expects to achieve a 19% share of renewables in its gross final consumption with the measures planned for 2015-2020. Electricity Interconnection Spain Portugal Interconnection Level 2014 362 3% 7% 2020 Interconnection target 363 10% Comments: The interconnection target of 10% by 2020 will not be achieved for the Iberian Peninsula. In fact, the interconnection level in 2020 after PCI implementation will still be lower in Spain (5-10%).
353 European Commission. Europe 2020 targets in Spain. Recovered from: http://ec.europa.eu/europe2020/europe-
2020-in-your-country/espana/progress-towards-2020-targets/index_es.htm. 354 European Commission. Europe 2020 targets in Portugal. Recovered from:
http://ec.europa.eu/europe2020/europe-2020-in-your-country/portugal/progress-towards-2020-targets/index_en.htm.
355 Spanish CRF submission 1990-2014, category 1A1a “Public electricity and heat production”. 356 REE-Statistics. Renewable Generation (Generación renovable). Recovered from: http://ree.es/es/estadisticas-
del-sistema-electrico-espanol/indicadores-nacionales/series-estadisticas. 357 REN-Technical Data 2015. Recovered from: https://www.ren.pt/files/2016-04/2016-04-04142047_7a820a40-
3b49-417f-a962-6c4d7f037353$$7319a1b4-3b92-4c81-98d7-fea4bfefafcd$$fe7585fb-f92a-49f7-9574-43f66d7223c6$$File$$pt$$1.pdf.
358 European Commission (2015). Renewable energy progress report. Recovered from: http://europa.eu/rapid/press-release_IP-15-5180_es.htm.
359 IDEA (2010). Plan 2011-2020: Spain’s national renewable energy action. Recovered from: http://pvtrin.eu/assets/media/PDF/EU_POLICIES/National%20Renewable%20Energy%20Action%20Plan/202.pdf.
360 IRENA, Wind report Portugal: Electricity from renewable energies 2020. Recovered from: https://www.irena.org/DocumentDownloads/Publications/IRENA_GWEC_WindReport_Portugal.pdf
361 EU Tracking Roadmap, 2014. Keeping track of renewable energy targets towards 2020. 362 European Commission (2015), Making Europe’s electricity grid fit for 2020. Achieving the 10% electricity
interconnection target. Recovered from: http://eur-lex.europa.eu/resource.html?uri=cellar:a5bfdc21-bdd7-11e4-bbe1-01aa75ed71a1.0003.01/DOC_1&format=PDF.
363 REE (2015), Strengthening interconnections- interconnection ratio 2020. Recovered from: http://www.ree.es/en/red21/strengthening-interconnections.

European Energy Industry Investments
PE 595.356 157
Key lessons learnt and conclusions
The analysis of the current situation, the study of the trends of the investments in generation and transmission/distribution and the evaluation of the development plans has led to the following key lessons/conclusions:
Spain and Portugal implemented renewable support schemes during 2005-2013 that led to significant increases in RES installed capacity. These schemes have been amended in both countries (2013 Spain and 2015 Portugal), and as a result the investment in RES capacity has sharply declined. The reasons for amending the support schemes were the budgetary constraints as of 2009 and the tariff deficit caused by the schemes. The future behaviour of investors under the new schemes is not yet certain. National Plans for future development include financial aid for the development of small scale RES; nevertheless, given the limited support, only a small increase in generation capacity can be expected. Analysis indicates that investments in renewable capacity in the coming years will remain at a very low level and that neither Spain nor Portugal will achieve their 2020 RES targets.
The installed conventional capacity is since 2010 decreasing in Spain and since 2012 also in Portugal, after a limited increase during the period 2000-2010, mainly due to support measures implemented by both countries driven by the need for security of supply. Most measures used to incentivise investment in conventional generation capacity are still in place. Nevertheless, the National Plans for the development of the electricity sector are now focusing on the development of the grid, and to a lesser extent, on the development of RES. Due to low political support and considering the economic context in the region, only limited investments in conventional capacity can be expected.
Spain and Portugal have incorporated the Energy Efficiency Directive 2012/27/EU in their national climate and energy plans. Both countries are allocating substantial resources to the implementation of incentives to improve energy efficiency. This policy is affecting the national development plans in the electricity sector, as forecasts anticipate a decrease in electricity demand. The actual development of energy efficiency and electricity demand will undoubtedly affect future investments in the electricity sector.
The increasing RES share in the electricity supply, in particular distributed generation, has necessitated huge investments in the distribution grids to facilitate their connection and access to the grid. This development will also drive the need for investments in flexibility, both at supply (storage) and demand side (demand response). This issue is not yet sufficiently addressed in the current energy policies and developments plans.
Spain and Portugal are making a big effort since 2000 to increase the interconnection between both countries and reinforce their internal electricity grid. The investment trends show that the main share of the national investment was focused on grid development. As a result, the Spanish and Portuguese electricity systems show a high level of interconnection. Nevertheless, the Iberian Peninsula electricity system has still a limited interconnection with the rest of Europe (well below the 10 % EU target for 2020). National development plans aim to enhance the national grids and increase the interconnection with France. An increased interconnection of the Iberian Peninsula with France will offer huge social welfare in terms of system and market integration, enhanced competition amongst generators, RES integration and security of supply. The unstable political situation, the uncertain macro-economic evolution of the region, the coordination between MS, possible time delays and cost increases are the main risks for the implementation of the interconnection development plans. The full realisation of national plans, which include the finalisation of the current PCI´s, might need additional funding. Currently, only three out of eleven PCI projects in the Iberian Peninsula are co-funded by CEF. The possibility for obtaining additional funding from European sources (CEF, structural funds and EIB) should be explored. Even if both countries accomplish to

Policy Department A: Economic and Scientific Policy
158 PE 595.356
realise all projects included in their national development plans, the Iberian Peninsula will still need considerable investments to have a competitive and properly integrated low carbon electricity system and market by 2030.

European Energy Industry Investments
PE 595.356 159
ANNEX 5: CASE STUDY: INVESTMENTS IN THE TRANSMISSION GRID IN THE BALTIC STATES The electricity systems and markets of the Baltic States, comprising Estonia (EE), Latvia (LV) and Lithuania (LT), were poorly interconnected to each other and with the neighbouring EU Member States when the Baltic States joined the EU in 2004. Since then, the Baltic grid has remained synchronised with the Russian grid, and the Baltic TSOs have significantly increased their interconnection capacity with EU countries. However, they still need to adopt the EU Network Codes and to synchronise their electricity systems with the EU.364
The Baltic Energy Market Interconnection Plan (BEMIP), which is part of the overall 'EU Strategy for the Baltic Sea Region' aims to integrate the Baltic States’ electricity system and market via new infrastructure, while eliminating energy islands. At the same time, BEMIP aims to extend the Nordic electricity market (Denmark, Finland, Iceland, Norway and Sweden) to Estonia, Latvia and Lithuania, and to synchronise the Baltic States’ grid with the continental European network.
In this case study, we assess the investment trends in the transmission grids and interconnections in the three Baltic States. It allows us to evaluate and highlight the advancement of the BEMIP and the contribution of Projects of Common Interest (PCIs)365 to the integration of national electricity systems and markets.
Investment trends, market characteristics and main operators in the Baltic States
Installed power generation capacity
The installed capacities tend to slightly increase every year as shown in Table 22.
Table 22: Installed electricity generation capacity (MW)
Country 2010 2011 2012 2013 2014 2015
Estonia 2487 2541 2650 2738 2711 2984
Latvia 2462 2462 2423 2568 2623 2883
Lithuania 3607 3672 3904 4083 4091 3794
Total 8556 8675 8977 9389 9425 9661
Source: ETNSO-E366
The breakdown per technology in 2014 is provided in the figure below. Both Latvia and Lithuania have considerable hydro capacity (54% and 22% of their total capacity respectively); while all three have some wind capacity installed (11% of total capacity in Estonia, 7% in Lithuania and 2% in Latvia). The share of other RES is still rather limited, but increasing in Latvia because of the use of solid biofuels.
364 http://www.ceep.be/integration-baltic-states-electricity/. 365 The EC has made a list of key energy infrastructure projects known as Projects of Common Interest (PCI) to help
create an integrated EU energy market. See chapter 4.1 for more details on PCI. 366 https://www.entsoe.eu/publications/statistics/statistical-factsheet/Pages/default.aspx.

Policy Department A: Economic and Scientific Policy
160 PE 595.356
Figure 50: Installed capacity per technology in 2014 (MW)
Source: Eurostat (nrg_113a)
Electricity consumption The electricity consumption has remained at the same level between 2010 and 2015 (see graph). The Baltic States present similar electricity consumption profiles mainly due to similar meteorological conditions.
Figure 51: Monthly energy consumption in GWh (2010-2015)
Source: ENTSO-E367
The maximum annual load in 2009-2015 is presented in the following table.
367 https://www.entsoe.eu/db-query/consumption/monthly-consumption-of-a-specific-country-for-a-specific-
range-of-time.

European Energy Industry Investments
PE 595.356 161
Table 23: Maximum load in MW (2009-2015)
Country 2010 2011 2012 2013 2014 2015
Estonia 1508 1367 1257 1512 1425 1490
Latvia 1269 1243 1112 1380 1380 1331
Lithuania 1630 1680 1688 1775 1810 1835
Source: https://www.entsoe.eu/publications/statistics/statistical-factsheet/Pages/default.aspx
The peak load was rather stable during the considered period. We also notice that the installed overall capacity is about twice the peak load; there is hence in the short term no need for investments in generation capacity.
Interconnections and transmission lines evolution (2006-2015)
The regional investment plan BEMIP acknowledged that significant investments in transmission networks were required both for internal grid reinforcement and increasing interconnection. The interconnection level of the Baltic States as reported in the Communication “Achieving the 10% electricity interconnection target - Making Europe's electricity grid fit for 2020”368 was only 4% of their overall power generation capacity in early 2014. While highly integrated with each other with important transmission capacities among them (Table 24), this figure of 4% represented the level of interconnection with other European electricity markets via Finland. With the completion of Estlink2 in 2014, the interconnection level increased to around 10%.
a. Transmission lines among the Baltic States, with Russia and Belarus
In 2009 two 330 kV transmission lines existed between Estonia and Latvia and four between Latvia and Lithuania. No 110 kV transmission line was in place. Figure 52 shows the transmission lines and interconnections in 2013 and 2015. In 2013 three 110 kV lines were put in place between Latvia and Lithuania and two between Estonia and Latvia in 2014.
Figure 52: Transmission lines in 2013 (left) and 2015 (right)
Source: https://www.entsoe.eu/publications/statistics/statistical-factsheet/Pages/default.aspx
368 COM (2015) 82.

Policy Department A: Economic and Scientific Policy
162 PE 595.356
The Baltic grid remains synchronised with the Russian grid and several transmission lines are in place with Russia and Belarus. The table below provides the transmission capacities among the Baltic States and between the Baltic States, Russia and Belarus.
Table 24: Transmission capacities (MW)
From/ To RU RU (Kaliningrad
region)
BY EE LV LT
RU 950 323 -
RU (Kaliningrad region) - - 600
BY - - 1800
EE 800 - - 1000 -
LV 291 - - 879 1350
LT - 680 1350 - 860
Source: https://umm.nordpoolspot.com/infra/connections
b. Interconnections with EU Member States
Before 2006 no grid interconnection existed between the Baltic countries and other EU countries. Since then, the following interconnectors are in place:
• ESTLINK 1 (350 MW) and ESTLINK 2 (650 MW) between Estonia and Finland, completed in 2006 and 2014.
• NordBalt (700 MW) connecting Lithuania to Sweden in 2015. • LitPol (500 MW) connecting Lithuania to Poland in 2015.
The evolution of the total interconnection capacity in MW and the interconnection levels as defined by the European Commission369 are presented in Table 25.
Table 25: Interconnection levels
2010 2011 2012 2013 2014 2015
Capacities (MW) 350 350 350 350 1000 2200
Level (%) 4.09% 4.03% 3.90% 3.73% 10.61% 22.77%
Source: https://www.entsoe.eu/publications/statistics/statistical-factsheet/Pages/default.aspx
The capacity of LitPol (interconnection between Lithuania and Poland) is expected to increase to 1000 MW in 2020. At that moment the interconnection capacity of the Baltic States will reach 2700 MW compared to 2200 MW in 2015. Supposing that the rest of the installed generation capacity in 2020 is equal to the one in 2015, the level of interconnection of the Baltic region will be 27.9 %.
369 http://eur-lex.europa.eu/resource.html?uri=cellar:a5bfdc21-bdd7-11e4-bbe1-
01aa75ed71a1.0003.01/DOC_1&format=PDF.

European Energy Industry Investments
PE 595.356 163
c. Imports/exports ratio and imports/exports difference
In 2009, the Baltics had an electricity surplus, mainly thanks to the availability of Lithuania’s Ignalina nuclear power plant370, which provided baseload electricity for the region. Its closure in 2009 set the region as a net importer as of 2010.
• Estonia is a net exporter (mostly to Latvia) but there is a tendency since 2014 (the construction of ESTLINK 2) of increasing electricity imports from Finland (reversing the previous exporting situation).
• Latvia is a net importer (mostly from Estonia) but it also exports electricity to Lithuania. Exports from Latvia to Lithuania are of the same order of magnitude as the imports of Latvia from Estonia. Electricity is from Estonia transiting to Lithuania via Latvia. Latvia also imports almost steadily electricity (about 1000 GWh/year) from Russia.
• Lithuania has important electricity imports from all neighbouring countries and it exports very little electricity since 2010 due to the closure of the Ignalina nuclear power plant.
Figure 53: Electricity balance and trading flows in 2014 (left) and expected in 2025 (right)
Source: Litgrid (2014), Development of the Lithuanian Electric Power System and Transmission Grids.
Market Structure The table below provides an overview of the market structure in the Baltic States.
Table 26: Market structure
Estonia Latvia Lithuania
Main generator* (share of power generation)
Eetsi Energia (84.4%)
Latvenergo AS (54.8%, state-owned)371
Lietuvos Energia (20.6%)
Transmission system operators (TSOs) Elering (state-owned)
AS Augstsprieguma tïkls (state-owned)372
Litgrid AB (97.5% state-owned)373
370 This nuclear power plant was phased out in line with Lithuania’ commitments stated in its accession to the
European Union treaty. 371 Latvenergo’s subsidiary “Latvijas elektriskie tīkli AS” owns the transmission assets. 372 https://ec.europa.eu/energy/sites/ener/files/documents/2012_044_lv_en.pdf. 373 https://ec.europa.eu/energy/sites/ener/files/documents/2013_071_lt_en.pdf.

Policy Department A: Economic and Scientific Policy
164 PE 595.356
Estonia Latvia Lithuania
Distribution system operators (DSOs)
Elektrilevi OÜ (87.5%), followed by VKG Elektrivõrgud OÜ and Imatra Elekter AS (Total: 27 DSOs)
Main DSO is Sadalestīkls JSC + 10 small local distribution companies
Main DSO is LESTO AB + 6 smaller DSOs
Market Nord Pool Spot, ELSPOT (day-ahead) & ELBAS (intra-day) Note : *Market shares for 2014 from Eurostat (ten00119)
Sources: https://www.mkm.ee/en/objectives-activities/energy-sector/electricity-market; https://ec.europa.eu/energy/sites/ener/files/documents/2014_countryreports_latvia.pdf; https://ec.europa.eu/energy/sites/ener/files/documents/2014_countryreports_lithuania.pdf; http://www.ast.lv/eng/electricity_market/electricity_market_in_latvia/; http://www.elforsk.se/Documents/Market%20Design/seminars/BalticRussia/01_Poyry.pdf.
Implementation of BEMIP The Baltic Energy Market Interconnection Plan (BEMIP) is part of the overall 'EU Strategy for the Baltic Sea Region’. The BEMIP, signed by the European Commission, along with Denmark, Estonia, Finland, Germany, Latvia, Lithuania, Poland, and Sweden, has been in place since 2009 and was updated in 2015374. The latest Action Plan (2015)375 lists several objectives and indicators in line with both the 2020 and 2030 energy and climate targets.
BEMIP’s key objectives and drivers
The overall aim of the BEMIP is to integrate the Baltic States’ energy market via new infrastructure and to eliminate energy islands. At the same time, BEMIP aims to extend the Nordic electricity market model (NORDEL) to Estonia, Latvia and Lithuania. Since 2015 synchronisation of the Baltic States grid with the continental European network, is also a goal of the BEMIP.
This is in line with the TYNDP assessment for the region which aims to enhance market flows between North and South, including stronger interconnection between the thermal-based Polish system and the Baltic system.376 Several scenarios were studied taking into account future developments like: further integration between Nordics and the Continent, north south flows, arctic consumption, Baltic integration, nuclear and thermal decommissioning377 and Baltic synchronisation378. The study resulted in four different scenarios-visions. “Flow patterns and energy balances show great variation between the analysed visions where flows are mainly southbound in vision 1, 2 and 3 where a large Nordic energy surplus is exported to the continent. In Vision 4, the net flow between the Nordic and continental system is low while interconnectors still have a high utilisation rate”379. As far as the Baltic synchronisation
374 Baltic Energy Market Interconnection Plan 2015 – Final report of the HLG. 375 PA Energy – BEMIP Action Plan (for competitive, secure and sustainable energy)
https://ec.europa.eu/energy/sites/ener/files/documents/BEMIP_Action_Plan_2015.pdf. 376 http://tyndp.entsoe.eu/exec-report/sections/chapters/16-nordic-east.html. 377 http://tyndp.entsoe.eu/insight-reports/nordic-baltic-sea/ 378 http://tyndp.entsoe.eu/insight-reports/baltic-synchronisation/. 379 http://tyndp.entsoe.eu/insight-reports/nordic-baltic-sea/
Figure 54: Signatories of BEMIP (in grey)

European Energy Industry Investments
PE 595.356 165
is concerned three scenarios were studied380: 1) Baltic States synchronous operation with continental European Network through Lithuania-Poland interconnection and also soft coupling supported by existing HVDC links; 2) Baltic States is synchronised with the Nordic countries through soft coupling supported by existing HVDC and new HVAC connections; and 3) The Baltic States technical capability to operate in the self-standing mode (asynchronous operation) with soft coupling supported by existing HVDC links.
There is strong political determination to integrate the Baltic States’ energy market. The main drivers for the BEMIP and investments in the region are:
• To further integrate the Baltic States into the European market and to improve market functioning;
• To decrease price differences between the Nordics/Baltics and the Eastern part of the Continental system;
• To enhance competition among generators; • To support RES integration and decrease overall CO2 emissions; • To improve energy supply security in the region.
To achieve this, there is a need to develop additional interconnections to the grids of Finland, Sweden and Poland. Moreover, reinforcing and extending networks between and within the Baltic States is also needed.
Level of implementation of BEMIP’s related PCIs Several infrastructure projects were proposed to implement the BEMIP strategy and goals. Additionally, to facilitate and accelerate the completion of the integrated EU energy market, the European Commission has selected 195 key energy infrastructure projects (known as Projects of Common Interest - PCIs), of which 17 ongoing in BEMIP. 14 of them are in the three Baltic countries out of which 11 concern electricity grids and interconnection lines in the Baltics and constitute tools for the implementation of the BEMIP.381 Additional information regarding PCIs, the selection criteria and benefits they may obtain is available in chapter 4.
Table 27 provides an overview of BEMIP projects and PCIs related to the power transmission grids in the Baltic States. (In some cases BEMIP projects became PCIs).
Almost all BEMIP projects are completed or under construction and received EU funding support.382 The works on 'Estlink 2'383, 'NordBalt' and 'LitPol Link'384 have been completed. BEMIP PCIs mostly progress according to the reported schedule (with 82% of electricity PCIs on time).385
380 http://tyndp.entsoe.eu/insight-reports/baltic-synchronisation/. 381 The remaining three PCIs related to synchronous operations (PCI 4.9) and two to power generation-storage
(PCIs 4.6 and 4.7). 382 https://ec.europa.eu/energy/sites/ener/files/documents/20142711_6th_bemip_progress_report.pdf. 383 Estlink is a submarine interconnection between Estonia and Finland, Estlink 1 is in place since 2007. EstLink II
is the second high-voltage direct interconnection between Estonia and Finland, which tripled the transmission capacity between the Baltic and Nordic regions. Before NordBalt and LitPol Link, Estlink 1 and 2 were the only connections from the Baltic States to the EU electricity market. Source:
http://www.iea.org/publications/freepublications/publication/Estonia2013_free.pdf. 384 The LitPol Link project, the first 500 MW and 163 km long electricity interconnector between Lithuania and
Poland. 385 ACER (2016), Consolidated report on the progress of electricity and gas Projects of Common Interest.

Policy Department A: Economic and Scientific Policy
166 PE 595.356
Box 6: Governance structure for interconnection lines
A case study on Estlink concludes that the governance structure of interconnection lines is very important.386 It states that “a joint venture contract between TSOs in many cases results in more efficient cable functionality”. Estlink, for example, shows how the investment project carried out by third party members (Eesti Energia of Estonia with 39.9%, Latvenergo of Latvia with 25%, Lietuvos Energija of Lithuania with 25%, and a 10.1% share divided between Pohjolan Voima and Helsingin Energia of Finland, all power generators) turns into the full ownership by national TSOs (Elering and Fingrid in Estonia and Finland respectively).
386 Pidlisna (2014), Opportunities and challenges for interconnection investment in Europe: Case example of Estlink
HVDC Power Cable between Estonia and Finland.

European Energy Industry Investments
PE 595.356 167
Table 27: Electricity grid and interconnection infrastructure projects in the three Baltic countries that are part of the BEMIP strategy
BEMIP No PCI No
Name New or reinforcement
Voltage Capacity Distance (km)
Initial StatusCurrent
Status
Date of commissioning
Estimated Total cost (M EUR)
Max. EU contribution
(M EUR)
EU Financial assistance? (% of EU
contribution) I3 4.5.1 LitPol Link
construction (LT to PL border)
a) (Lithuanian side) line Alytus - LT border with
PL
400 kV
500 MW back-to-
back (B2B) HVDC
converter
51 km Preparatory phase
Completed
2016 54.753
27.376
CEF387 (49%)
--- b) (Polish side) line Elk – PL
border with LT
400 kV
500 MW 112 km Preparatory phase
Completed
2016 --- ---
I4 --- LT grid reinforcement
(for LitPol)
Alytus-Kruonis 330 kV 1000 MW 53 km Preliminary phase Under
construction
--- --- 38 388 Yes (NA)
--- Visaginas – Kruonis
Under consideration
Under consideration
I5 --- LT grid reinforcement (for NordBalt)
Klaipeda – Telsiai
330 kV 900 MW 89 km Preparatory phase
Completed
End 2014 19.7 389 7.88 390 Yes (40%)
--- Musa - Panevezys
Preliminary phase
Preliminary phase
I6 --- Internal line between
Ventspils, tume and Imanta (LV)
Kurzeme Ring connection point
Riga LV and Grobina-Ventspils
--- 210 km Preliminary phase
Completed
July 2014 88 44 391 EEPR (50%)
387 It also received an EIB loan and a Nordic Bank Loan, and benefited from the EU's structural funds for construction works carried out in Poland. 388 http://www.eib.org/projects/pipeline/2014/20140100.htm; http://www.eib.org/attachments/strategies/ca_provisional_summary_20141216_en.pdf. 389 http://www.baltic-course.com/eng/energy/?doc=97808 ; http://www.baltic-course.com/eng/good_for_business/?doc=98070. 390 40%; http://www.litgrid.eu/index.php/grid-development-/infrastructure-projects-/klaipeda-telsiai/700; http://www.litgrid.eu/index.php/news-events-/news/new-high-voltage-transmission-line-
successfully-launched/2554. 391 http://ec.europa.eu/energy/eepr/projects/files/electricity-interconnectors/nordbalt-02_en.pdf.

Policy Department A: Economic and Scientific Policy
168 PE 595.356
BEMIP No PCI No
Name New or reinforcement
Voltage Capacity Distance (km)
Initial StatusCurrent
Status
Date of commissioning
Estimated Total cost (M EUR)
Max. EU contribution
(M EUR)
EU Financial assistance? (% of EU
contribution) 4.4.1 New: Ventspils-
Tume-Imanta 330 kV and 110 kV and
substation extension
--- 210 Preliminary phase Under
construction
2019 122.42 55.089 CEF support, 11/2014 (45%)
I11 4.2.1 Interconnection between Kilingi-
Nomme (EE) and Riga CHP2 substation (LV)
New 330 kV 1143 MVA 211 km Preparatory phase Under
construction
2020 172.771 112.301 CEF support, 11/2014 (65%)
4.2.2 Internal line between Harku and Sindi – (EE)
New 330 kV and 110
kV
1143 MVA and 240
MVA
140 km Preparatory phase Under
construction
2020 44.56 --- Not yet
I12 --- ESTLINK 2 Interconnection EE-FI
Preparatory phase
Completed
02/2014 320 100 392 EEPR support (31%)
I13 --- NordBalt 393 HVDC submarine cable between Nybro (SE) and Klaipeda (LT).
330 kV 700 MW 463 km Preparatory phase
Completed
2016
235 initial cost
550 final cost
131394
EEPR support (55% of
initial cost) (24% final
cost)
392 http://estlink2.elering.ee/public/Dokumendid/EL2_teabeleht_A4_eng.pdf. 393 http://www.litgrid.eu/index.php/grid-development-/strategic-projects-/nordbalt/136#nordbalt_visual; http://ec.europa.eu/energy/eepr/projects/files/electricity-interconnectors/nordbalt-
01_en.pdf; https://ec.europa.eu/energy/en/news/new-electricity-connections-between-lithuania-poland-and-sweden-create-baltic-ring; http://www.svk.se/en/grid-development/Developmentprojects/nordbalt1/.
394 https://ec.europa.eu/energy/en/news/new-electricity-connections-between-lithuania-poland-and-sweden-create-baltic-ring.

European Energy Industry Investments
PE 595.356 169
Other PCIs
--- 4.2.3 Internal line between Riga CHP2 and Riga
HPP (LV)
Reinforcement 330 kV 600 MW 12 Under consideration
2020 --- --- Not yet
--- 4.5.5 Internal line between Kruonis and Alytus (LT)
New 2x330kV and 500 MW B2B converter
2x1080 MVA
53 Permitting and Feasibility study
2017 and depends on
feasibility study
--- --- Not yet
--- 4.8.1 Interconnection between Tartu
(EE) and Valmiera (LV)
Reinforcement 330 kV 1000 MVA 133 Under consideration
2023 --- --- Not yet
--- 4.8.2 Internal line between Balti and Tartu (EE)
Reinforcement 330 kV 1143 MVA --- Under consideration
2030 --- --- Not yet
--- 4.8.3 Interconnection Tsirguliina (EE) and Valmiera
(LV)
Reinforcement 330 kV 1000 MVA 62 Under consideration
2024 --- --- Not yet
--- 4.8.4 Internal line between Eesti and Tsirguliina
(EE)
Reinforcement 330 kV 1143 MVA --- Under consideration
2030 --- --- Not yet
--- 4.8.5 LT part of interconnection between Alytus (LT) and LT/PL
border
New 400 kV --- --- Under consideration/
Under construction
2023 --- 27.376 Yes (2015)
--- 4.8.6 Internal line between Kruonis
and Visaginas (LT)
New 330 kV 1080 MVA 200 Under consideration
2022 --- --- Not yet
--- 4.9 Various aspects of the integration of the Baltic States’ electricity network into the continental European network, including their synchronous
operation (generic project)
Planned 2025 Partial cost: 250
125 CEF, 2014 (50%)395
Source: Prepared by Trinomics using: PCI list; DG ENER’s interactive map for PCIs; CEF call for proposals; INEA database on CEF-E projects and actions; CEF-Energy list of actions for 2014, 2015 and 2016; EEPR project database; BEMIP Action Plan & progress reports396
395 This support was provided for an action under PCI 4.3, now under PCI 4.9. This action is completed. 396 https://ec.europa.eu/energy/sites/ener/files/documents/20120726_1st_bemip_progress_report_final.pdf; https://ec.europa.eu/energy/sites/ener/files/documents/20142711_6th_bemip_progress_report.pdf; https://ec.europa.eu/energy/sites/ener/files/documents/2009_11_25_hlg_report_170609_0.pdf; https://ec.europa.eu/energy/sites/ener/files/documents/BEMIP_Action_Plan_2015.pdf

Policy Department A: Economic and Scientific Policy
170 PE 595.356
It is important to assess the implementation of BEMIP projects and the impact of the PCI as tool to accelerate the realisation of infrastructure of pan-European interest.
A comparison of different BEMIP progress reports between 2009397 and July 2013398, shows that two BEMIP projects (out of the total 8 projects at the time), were delayed mainly due to environmental procedures.
After the publication of the PCIs list, other projects were added (cf. Table 27). Data about the current status of BEMIP PCIs and current schedule details are given in the figures below.
Figure 55: Implementation status (left) and progress (right) of PCIs
Source: Prepared by Trinomics based on ACER (2016), Consolidated report on the progress of electricity and gas Projects of Common Interest.
According to ACER399, no PCI is experiencing difficulties in the BEMIP corridor. BEMIP projects progress very well and even better compared to PCIs in other regions (NSI East and NSI West), as 14 out of 17 are on time. Compared to other regions, delays in BEMIP are the shortest ones. Only one BEMIP transmission project is delayed, though the reason was neither environmental nor permitting issues; while three projects have been rescheduled (due to correlation with other prioritised transmission investments and changes in the overall planning data)400. A clear correlation between project status and timeliness is noticed: projects that are in a more advanced status tend to keep to schedule more than projects that are still under consideration.
National support for the implementation
The Baltic States have made a political commitment to connect into the Synchronous Grid of Continental Europe (SGCE), which is reflected in generic PCI 4.9. The most important step towards synchronization is a common regional political decision.401 This lengthy and complex process requires “large-scale harmonization of complicated engineering and system issues, careful implementation of cross border procedures and intergovernmental agreements”.402 A feasibility study concluded that synchronous operation within the SGCE is technically feasible but requires a reinforcement of the Baltic electricity transmission systems.403 The study states that the total investment and annual costs of the transition to synchronous operation
397 https://ec.europa.eu/energy/sites/ener/files/documents/20120726_1st_bemip_progress_report_final.pdf. 398 https://ec.europa.eu/energy/sites/ener/files/documents/20140225_5rd_bemip_progress_report.pdf. 399 ACER (2016), Consolidated report on the progress of electricity and gas Projects of Common Interest. 400 ACER (2015), Consolidated report on the progress of electricity and gas Projects of Common Interest. 401 Niglia, A. (2015), The Protection of Critical Energy Infrastructure Against Emerging Security Challenges. 402 Litgrid (2014), Development of the Lithuanian Electric Power System and Transmission Grids.
http://www.leea.lt/wp-content/uploads/2015/05/Network-development-plan-2015.pdf. 403 The report mentions that the different power link options are compared in terms of investment costs and benefits
for the electricity market, though these results are not available. Source: Litgrid (2014), Development of the Lithuanian Electric Power System and Transmission Grids.

European Energy Industry Investments
PE 595.356 171
are high relative to the market benefits. Nonetheless, according to Litgrid, “synchronisation will enable the Baltic States to reorient the management of their electricity systems toward the West, become part of the European power system and insulate themselves from Russia’s rapidly ageing electricity system”.
a. Latvia
Latvia’s Sustainable Development Strategy (2010)404 has as one of its objectives “To ensure energy independence of the state by increasing the provision of energy resources and integrating in the EU energy networks”. It explicitly called for the creation of energy interconnections.
b. Lithuania
National planning regarding transmission grid development includes the National Electrical Grids Strategy and the Litgrid Strategy for 2014-2023. The short term planning (2014-2016) explicitly mentioned completion of NordBalt & LitPol (meanwhile completed PCIs); while planning for 2017-2023 includes the transmission network development required for the connection of the planned nuclear power plant and the interconnection of the Baltic States to the SGCE for synchronous operation – including a second 400 kV cross-border line for synchronous operation with Poland.405
The total amount of investments in the power system development in 2014–2023 is estimated to reach €960 million of which over €300 are for strategic cross-border projects and €375 for grid adaptations for synchronous operation with SGCE. Only 4.7% of these investments are expected to be customer or generation companies’ initiatives, with the rest being Litgrid investments.
c. Estonia
Estonia’s report on electricity and gas markets406 acknowledges the relevant PCIs from the 2013 list. It highlights PCI 4.2.1 – which ensures better security of supply in the region, effective functioning of the electricity market and improves competitiveness. The PCI is incorporated into the development plans of the national grids of Latvia, Estonia and the EU (via the TYNDP).
Estonia’s TSO Elering in the 2015 security of supply report recognises that its three main objectives are: “firstly, the synchronisation of the transmission systems of the Baltic states with those of the rest of continental Europe; secondly, the final development of the regional electricity market as part of a pan-European electricity market; and thirdly, the creation of a competitive regional gas market, with many market participants and the necessary infrastructure”407. According to the report the synchronization is planned to be completed by 2025. However, the planned investments would still need to be realised in the event that the synchronous grid switch is not implemented in the Baltic States, but this means that investments would be realised over a longer period of time408.
Elering is expected to invest nearly 354 million euros during the period 2015-2019 in order to ensure security of supply in Estonia, while the new north-south electric rail Baltic project will require the strengthening of the grid in several regions409. The report refers to some power transmission projects such as: the modernisation and transformation of the Tallinn
404 https://www.cbs.nl/NR/rdonlyres/B7A5865F-0D1B-42AE-A838-FBA4CA31674D/0/Latvia_2010.pdf. 405 Litgrid (2014), Development of the Lithuanian Electric Power System and Transmission Grids. 406 Estonian Competition Authority (2014), Electricity and Gas Markets in Estonia - Report. 407 http://elering.ee/public/Infokeskus/Uuringud/Summary_of_Elerings_2015_Security_of_Supply_Report.pdf. 408 http://elering.ee/public/Infokeskus/Uuringud/Summary_of_Elerings_2015_Security_of_Supply_Report.pdf. 409 http://elering.ee/public/Infokeskus/Uuringud/Summary_of_Elerings_2015_Security_of_Supply_Report.pdf.

Policy Department A: Economic and Scientific Policy
172 PE 595.356
regional electricity network, the construction of the Kiisa-Topi-Kvartsi connection, and the optimisation of the Aruküla-Tapa regional network and the Harku-Lihula-Sindi 330/110 kV line currently under construction (PCI number 4.2.2) which is part of the third Estonia-Latvia electricity connection and part of the 330kV ring network that covers mainland Estonia.
EU support for the implementation
Important financial support from various EU funding tools (such as CEF and the EEPR) is being provided to PCIs that lie under the BEMIP. The lowest financial support was granted to the NordBalt project; it amounted to 24% of the final budget. For most of the projects EU funding support is above 40% of the (estimated) project costs (cf. Table 27). Those figures illustrate that EU funding assistance is crucial to the implementation of the BEMIP.
Key barriers for the implementation
In 2009 it was assumed that “with a well-functioning market, incentives for the right infrastructure investments will be in place without the need for public intervention. For this reason, the construction of new electricity interconnections is dependent on market development in the new Member States of the region”410. However, almost all BEMIP projects received EU funding support (mainly through ERDF and EIB).
The 2015 BEMIP action plan recognises the need for market-based investments in electricity. The actions required to improve the BEMIP action plan implementation411 are:
1) Develop competitive energy markets that provide incentives for investments; 2) Coordinate work on energy infrastructure projects; 3) Make best endeavours to implement in due time the infrastructure projects; and 4) Provide necessary support to, and coordinate work on, cross-border projects and
domestic projects that have a significant impact on other Member States. Coordination and the development of competitive, well-functioning markets are the two main challenges of the BEMIP implementation.
Impact of BEMIP on EU energy and environment policy targets
The BEMIP as part of the overall 'EU Strategy for the Baltic Sea Region’ is fully linked to the overall EU energy and climate policy targets presented in chapter 2.
Energy security is the top political priority in the field of energy and climate in the Baltic States. The level of interconnection with other EU and non-EU countries and the reserve generation capacity margin are the two main indicators to measure the level of energy security. As mentioned in Table 25, the interconnection level with the EU has already considerably increased from around 4% in 2010 to almost 23% in 2015 and it may reach almost 28% in 2020, surpassing the EU interconnection target.
In addition, the installed power generation capacity is around twice the peak demand which results in a high reserve margin that contributes to energy supply security.
BEMIP will substantially contribute to electricity markets and system integration and to enhanced competition and energy security in the Baltic region. The increased transmission and interconnection capacity will also contribute to a more efficient use of the production park, reduced GHG emissions and an increased potential to integrate RES.
410 https://ec.europa.eu/energy/sites/ener/files/documents/2009_11_25_hlg_report_170609_0.pdf. 411 https://ec.europa.eu/energy/sites/ener/files/documents/BEMIP_Action_Plan_2015.pdf.

European Energy Industry Investments
PE 595.356 173
According to the EEA (Table 28), Estonia Latvia and Lithuania are expected to fulfil their 2020 GHG emission and RES targets412. Latvia and Lithuania are likely also to meet their 2020 energy efficiency targets, while Estonia needs to make more efforts to reach its target.
Table 28: Progress of the Baltic countries towards 2020 climate and energy targets
Source: EEA (2015), Trends and projections in Europe 2015 — Tracking progress towards Europe's climate and energy targets
However, it is difficult to quantify the impact of the BEMIP towards those targets, although it is clear that reinforcing power grids is a milestone in order to further develop RES which leads to decreasing overall CO2 emissions.
Key lessons learnt / Conclusions
The need for an integrated approach, considering key projects in the region within an overall policy context like the BEMIP, rather than in an isolated way, was one of the key lessons learnt. 413 BEMIP is recognised as an example of good practice for regional cooperation.414
The fact that BEMIP projects benefit from EU financial assistance and that some of them are recognised as PCI with accelerated permit granting are both valuable aspects that have facilitated the implementation of BEMIP.
The combination of the BEMIP action and the PCIs substantially increased the level of interconnection of the Baltic countries with other EU member states. The European goal of 10% interconnection by 2020 is already achieved and overpassed (22.77% in 2015) while in 2013 it was less than 4%.
According to the TYNDP assessment, CBAs for the Baltic projects show socio-economic welfare (SEW) contributions ranging from 35 to 80 M EUR/year, which corresponds to 50 M EUR/year per additional GW of transfer capacity across the boundary range from Nordics and Baltics to Continental Europe East.415 When balancing the SEW contributions and the infrastructure investment costs, “the optimal level of interconnection ranges from 1 GW to 2.5 GW between the Nordics/Baltics and the Continental Europe East.”
412 EEA (2015), Trends and projections in Europe 2015 — Tracking progress towards Europe's climate and energy
targets, pages 19-20, 35, 47, 53. 413 CEPS (2016), Fostering investment in cross border energy infrastructure in Europe. Report of the High-Level
Group on Energy Infrastructure in Europe. 414 https://www.em.gov.lv/en/news/5473-baltic-energy-market-interconnection-plan-is-a-great-example-of-
regional-cooperation. 415 http://tyndp.entsoe.eu/exec-report/sections/chapters/16-nordic-east.html.

Policy Department A: Economic and Scientific Policy
174 PE 595.356
ANNEX 6: NET CHANGES IN INSTALLED POWER GENERATION CAPACITY PER MS BETWEEN 2005-2009 AND 2010-2014 (MW)
Member State
Combustible fuels416 Nuclear Hydro Wind & Solar Others417
‘05-‘09
‘10-‘14
‘05-‘09
‘10-‘14
‘05-‘09
‘10-‘14
‘05-‘09 ‘10-‘14 ‘05-
‘09 ‘10-‘14
BE 759 -917 100 0 5 4 825 3138 0 4
BG -2310 -108 -830 83 153 171 327 1213 0 0
CZ 198 1289 70 390 17 56 635 406 0 0
DK 3 -1468 0 0 -2 0 356 1686 0 0
DE 6865 11380 102 -8393 380 16 15827 32695 -108 20
EE 31 113 0 0 2 -1 73 233 0 0
IE 508 -70 0 0 0 0 750 837 0 0
GR 501 335 0 0 95 174 725 3074 0 0
ES 6961 -671 -212 -51 285 688 12968 4716 0 0
FR -823 -4413 -130 0 80 -107 4156 7766 0 1272
HR 97 -40 0 0 32 52 64 293 0 0
IT 11109 -3386 0 0 378 578 4352 18028 110 54
CY 297 42 0 0 0 0 NA 122 0 0
LV 333 314 0 0 0 14 3 39 0 0
LT 62 242 0 0 -1 1 97 224 0 0
416 Fossil fuels, biomass, biogas, waste and biofuels. 417 Geothermal, tide, wave, ocean and others.

European Energy Industry Investments
PE 595.356 175
Member State
Combustible fuels416 Nuclear Hydro Wind & Solar Others417
‘05-‘09
‘10-‘14
‘05-‘09
‘10-‘14
‘05-‘09
‘10-‘14
‘05-‘09 ‘10-‘14 ‘05-
‘09 ‘10-‘14
LU 12 20 0 0 0 196 10 95 0 0
HU 16 -312 74 0 4 4 187 75 0 13
MT 571 49 0 0 0 0 0 54 0 0
NL 3116 3543 61 -25 0 0 1016 1586 0 -30
AT 822 514 0 0 814 587 257 1736 -1 0
PL 206 -148 0 0 17 22 588 2755 -36 0
PT 1569 -1758 0 0 74 609 2375 1341 11 1
RO -279 -315 704 0 161 139 15 4148 0 0
SI -47 -19 10 22 91 42 4 215 0 0
SK -266 -428 -820 120 -25 7 -2 514 9 6
FI -1354 145 45 36 110 93 67 434 0 0
SE 1260 NA -632 530 307 -736 960 3127 0 0
UK 3112 -8760 -994 -928 90 80 2871 12866 1 2
Total 33329 -4827 -2452
-8216 3067 2689 49506 103416 -14 1342
Source: Prepared by Trinomics using Eurostat data (nrg_113a)

Policy Department A: Economic and Scientific Policy
176 PE 595.356
NOTES

