directorate general for internal policies2016)578984_en.pdf · sustainable impact assesments (tsia)...
TRANSCRIPT

DIRECTORATE GENERAL FOR INTERNAL POLICIES
POLICY DEPARTMENT A: ECONOMIC AND SCIENTIFIC POLICY
TTIP and Jobs STUDY
Abstract
This Policy Department A study concludes that TTIP could lead to substantial reallocation of jobs between and within industries. As growing exporting firms pay higher wages than shrinking import-competing ones, average wages would go up. Employment effects are highly uncertain: they could be negative in the short run but positive in the long run. In any case, their magnitude is likely to be very small. Adjustment costs do not undo TTIP’s overall economic desirability, but they call for adequately funded trade adjustment programmes.
IP/A/EMPL/2015-07 April 2016
PE 578.984 EN

This document was requested by the European Parliament's Committee on Employment and Social Affairs. AUTHOR(S) Gabriel Felbermayr, Ludwig Maximilian's University Munich and ifo Institute – Leibniz Institute for Economic Research RESPONSIBLE ADMINISTRATOR Susanne KRAATZ EDITORIAL ASSISTANT Irene VERNACOTOLA LINGUISTIC VERSIONS Original: EN ABOUT THE EDITOR Policy departments provide in-house and external expertise to support EP committees and other parliamentary bodies in shaping legislation and exercising democratic scrutiny over EU internal policies. To contact Policy Department A or to subscribe to its newsletter please write to: Policy Department A: Economic and Scientific Policy European Parliament B-1047 Brussels E-mail: [email protected]
Manuscript completed in April 2016 © European Union, Year This document is available on the Internet at: http://www.europarl.europa.eu/studies DISCLAIMER The opinions expressed in this document are the sole responsibility of the author and do not necessarily represent the official position of the European Parliament. Reproduction and translation for non-commercial purposes are authorised, provided the source is acknowledged and the publisher is given prior notice and sent a copy.

TTIP and Jobs
PE 578.984 3
CONTENTS
LIST OF ABBREVIATIONS 4
LIST OF BOXES 5
LIST OF FIGURES 5
LIST OF TABLES 6
EXECUTIVE SUMMARY 7
INTRODUCTION 9 1.
A SNAPSHOT OF TRANSATLANTIC TRADE, JOBS, AND LABOUR 2.MARKET INSTITUTIONS 11
2.1. A snapshot on EU-US trade relations 11
2.2. EU services trade 14
2.3. Extra-EU exports and employment in EU member states 15
2.4. Wages across the EU and the US 17
2.5. Labour market regulation across the Atlantic 19
CHANNELS AND MECHANISMS: GENERAL REMARKS 21 3.
3.1. Trade policy and employment: the conventional view 21
3.2. Trade policy and employment: more recent perspectives 23
3.3. Trade policy and wages 26
LABOUR MARKET EFFECTS OF TRADE AGREEMENTS: EX POST 4.EVALUATIONS 27
4.1. Effects of aggregate openness on long-term unemployment 27
4.2. Effects of existing agreements on aggregate openness 30
4.3. Short-term effects: possible peak in frictional unemployment 32
EX ANTE ANALYSIS OF THE LABOUR MARKET EFFECTS OF TTIP 33 5.
5.1. The potential economic gains from TTIP 33
5.2. Sectoral reallocation effects 37
5.3. Effects from TTIP on aggregate unemployment 42
5.4. Keynesian perspectives 43
5.5. Possible wage and income inequality effects from TTIP 43
POLICY OPTIONS 45 6.
6.1. Labour market policies: flexicurity 45
6.2. Trade adjustment programs 45
REFERENCES 46
ANNEX 50
Policy Department A: Economic and Scientific Policy
4 PE 578.984
LIST OF ABBREVIATIONS
ALMP Active labour market policy
CGE Computable general equilibrium model
EGF European Globalization Adjustment Fund
EPL Employment Protection Legislation
FDI Foreign direct investment
GDP Gross domestic product
ILO International Labour Organization
NAFTA North American Free Trade Agreement
LMR Labour market regulation
MNE Multinational enterprise
NTB Non-tariff barriers (used as synonymous to NTMs)
NTM Non-tariff measures (used as synonymous to NTBs)
PMR Product market regulation
R&D Research and development
RTA Regional trade agreement
SIA Sustainability Impact Assessment
SPS Sanitary and phytosanitary barriers to trade
TBT Technical barriers to trade
TPA Trade Promotion Authority
TTIP Transatlantic Trade and Investment Partnership
USA United States of America
WTI World Trade Institute

TTIP and Jobs
PE 578.984 5
LIST OF BOXES
Box 1: Estimating the labour market effects of trade agreements: methodological issues 31
Box 2: Economic effects of TTIP: Why do ex ante assessments come to different conclusions? 35
LIST OF FIGURES
Figure 1: EU-US trade in goods over time, bn Euro, 2004-2014 12
Figure 2: EU-US trade in important industries, bn Euro, 2004-2014 14
Figure 3: Export-supported number of jobs in EU member states and their share in total employment 15
Figure 4: Share in total employment of jobs supported by exports to the US and by FDI of US firms 16
Figure 5: Share in total employment of jobs in US owned firms 17
Figure 6: Hourly compensation, Euros, 2012, selected EU states compared to the US 18
Figure 7: Market income inequality measured by Gini coefficients, 2010, across EU stats compared to the US 18
Figure 8: Statutory minimum wage in the EU compared to the US, % of full-time median earnings (year 2014) 19
Figure 9: Employment protection legislation in EU member states and the US 20
Figure 10: Unemployment benefits in EU member states and the US (2013) 20
Figure 11: Overall effects of all regional trade agreements (RTAs) in force as of 2006 on structural unemployment rates in European countries (%-points) 30
Figure 12: Aggregate reallocation in absolute number of persons and as a % of total employment 40
Figure 13: Aggregate reallocation as a % of total employment and size of economic efficiency gains 40
Figure 14: Gains and adjustment costs of TTIP over time 41

Policy Department A: Economic and Scientific Policy
6 PE 578.984
LIST OF TABLES
Table 1: Main results 7
Table 2: Goods trade of EU countries with US (Nov. 2014 to Oct. 2015) 12
Table 3: EU services trade with US 15
Table 4: Different models and their assumptions 25
Table 5: Different conceptual frameworks and their predictions 25
Table 6: The long-run association of trade openness and structural unemployment rates in Europe 29
Table 7: Comparison of simulation strudies: Assumptions and broad results 34
Table 8: Potential effects of TTIP on real per capita income, results of selected studies 35
Table 9: Potential reallocation effects of TTIP, less skilled workers, CEPR study 38
Table 10: Potential reallocation effects of TTIP, more skilled workers, CEPR study 39
Table 11: Potential aggregate unemployment effects of TTIP, different studies 43
Table 12: Wage and distribution effects of TTIP in % (real magnitudes) 44

TTIP and Jobs
PE 578.984 7
EXECUTIVE SUMMARY Background This study analyzes and synthesizes existing literature on the employment and wage effects of European trade agreements in general and of the proposed Transatlantic Trade and Investment Partnership (TTIP) in particular. It complements the recent TTIP Sustainable Impact Assessment (TSIA) carried out by the European Commission (2016)and offers a more detailed perspective on the labor market effects of the agreement.
Aim The bargaining mandate of the EU Commission from June 17 2013 states that a key objective for TTIP is to “generate new economic opportunities for the creation of jobs”. This is echoed in the EU Parliament’s resolution adopted on 8 July 2015 which posits that “TTIP ... should be seen as an element in a broader European strategy to create jobs”. This focus on jobs contrasts with the conventional view amongst trade economists that “attempts to quantify the overall employment effect of trade are largely an exercise in futility” (Irvine, 2015). While long-run employment effects of TTIP are likely to be very small and potentially positive, short-run effects may be negative as workers have to move out of industries with comparative disadvantages.
Table 1: Main results
1. How have past episodes of trade liberalization affected labour market outcomes?
• There is very little ex post evaluation work on the long-run employment effects of existing trade agreements. However, cross-country studies show that higher international trade openness is associated to slightly lower structural unemployment rates. The direction of causality, however, is difficult to establish and effects are rather small. According to estimates, in the sample of EU countries, an increase of openness by 10 percentage points lowers the long-run unemployment rate by about 0.2 percentage points on average.
• Empirical evidence convincingly demonstrates that, on average, RTAs increase overall openness. In the EU, net trade creation effects due to RTAs have often ranged around 40 %. So, a country at average levels of openness and with a share of external trade of 70 % covered by RTAs, has benefitted from these agreements through a reduction of unemployment of about 0.4 percentage points. This is a minor but positive long-run effect, amounting to about 1 million jobs in the EU.
• Empirical evidence points towards short-run unemployment-increasing effects of trade liberalization episodes as workers have to move from shrinking firms and industries to growing ones. However, the literature finds that 3 years after liberalization, structural unemployment tends to fall below the initial level.
• Evidence from EU Eastern enlargement and the WTO entry of China shows job losses in regions specialized in import-competing industries while regions specialized in export-oriented industries experienced job gains. In Germany, the net effects of recent trade integration may have created some 440 000 jobs, while the US may have suffered net job losses. Results do not easily extend to other EU countries. However, they show that job destruction and job creation effects can be sizeable and that the economic costs to individual workers can be high.
2. What do ex ante assessments of TTIP predict and why do results differ?
• Most quantitative ex ante assessments of TTIP assume away any effects on aggregate employment. However, all studies predict – explicitly or implicitly – that workers relocate from shrinking firms and sectors to growing ones. These reallocation effects can involve a reduction in life income, in particular for the less

Policy Department A: Economic and Scientific Policy
8 PE 578.984
skilled and in countries with structural labour markets deficiencies. • More precisely, despite substantial uncertainties, estimates suggest that the
automotive sector (not only in Germany) might add employment of both high-skilled and low-skilled workers; similarly, the insurance sector (e.g., in France and the Netherlands) or processed food (e.g., in Spain, Italy, and Denmark) might create additional jobs. In contrast, the sectors of electrical machinery (e.g., in Germany) and metal products (e.g., in Poland or the Czech Republic) might shrink as workers are competed away into growing sectors.
• Studies differ as to the potential economic benefits to be expected from TTIP, mostly because they assume different scenarios. Typically, approaches borrowing from the experiences with existing RTAs typically find larger economic effects than studies that limit the scenario to specific tangible policy changes. So far, all existing studies ignore the effects of TTIP on R&D, technology adoption, or human accumulation, all of which can lead to dynamic economic benefits.
• The size of economic benefits (measured, e.g., by gains in real per capita incomes) is commensurate to the amount of reallocation of workers across sectors and industries. In the more conservative studies, about 0.3 % of the work force could be displaced by the agreement over a ten year adjustment period; in more ambitious studies, this share could be as high as 1.5 %. These calculations typically neglect firm-to-firm transitions within industries, and therefore may underestimate the effect. However, compared to the normal yearly labour market turnover TTIP-induced effects are almost negligible.
• Short-term reallocation can be seen as a one-time investment to unlock long-run efficiency gains. Studies using CGE models find that long-run benefits outweigh the costs. In one conservative study, long-run yearly gains are about 0.5 % of baseline GDP, while one-time reallocation needs affect about 0.6 % of the workforce. Even if reallocated worker transit through one year of unemployment, accumulated benefits outweigh costs by a factor of 9:1.
• Few studies calculate the potential effect of TTIP on long-run unemployment rates. For Europe, existing studies based on extended computable general equilibrium trade models find small positive aggregate job gains between 99 000 and 1 346 000 (0.04 % to 0.54 % of EU labour force). The Keynesian approach by Capaldo (2014), finds negative effects of 600 000 jobs (-0.24 % of EU labour force).
3. Which policy options exist?
• Labour market policies aiming at reducing adjustment to trade liberalization come with the negative effect that they undo some of the economic gains that would be otherwise achievable. Phasing-in provisions in the most vulnerable industries could smooth adjustment needs over time and lower their adverse impacts.
• Unemployment insurance systems can cushion a possible temporary surge in joblessness triggered by TTIP. If inadequate, they need to be revised.
• EU member states will likely differ with respect to the reallocation effects triggered by TTIP. Small countries such as Malta, Lithuania, or Bulgaria could be more severely affected. To facilitate the functioning of social security systems, these countries should have access to temporary assistance from central EU funds.
• To prepare for possible disruptions, the budget of the European Globalization Adjustment Fund (EGF) could be temporary increased. Also, eligibility rules could be extended to cover displacements due to a large trade agreement such as TTIP.

TTIP and Jobs
PE 578.984 9
INTRODUCTION 1.According to the Global Europe Strategy of 2006,1 one major objective of trade policy is to foster employment growth in Europe. This is reiterated in numerous official documents, e.g., in the “Trade for All” Communication of 2015 which states that “trade policy must deliver growth, jobs and innovation”. Similar wording is found in the US Congress’ bill granting trade promotion authority (TPA) to the US President. The creation of more and better jobs is also a declared goal of the Transatlantic Trade and Investment Partnership (TTIP) as evidenced by the EU negotiation mandate and the EU Parliament’s resolution on TTIP.2
This focus on jobs contrasts with the modelling strategy chosen in most quantitative studies on TTIP. Very few of them provide estimates of the impact of TTIP on the aggregate number of jobs. The recent SIA produced by Ecorys (2016) for the European Commission is no exception. Rather, they focus on long-run efficiency gains of the agreement which manifest themselves in higher wages and lower prices. By construction, they rule out any effects on employment or unemployment. The few studies that relax this assumption come up with very heterogeneous estimates, reflecting the particular choices made by the modellers.
It is likely that the effects of trade policy in general and of TTIP in particular on overall employment and the rate of unemployment are of minor importance if compared to the roles of fluctuations in aggregate demand or of labour market regulation (LMR). However, trade policy can have adverse short-run effects on unemployment when workers need to relocate from shrinking import-competing firms and industries to expanding export-orientated ones. On the other hand, if the agreement makes product markets more competitive and efficient, the long-run unemployment rate could be lower than without it. This is what empirical evidence on product market regulation (PMR) and past episodes of trade liberalization suggest. So, it is likely that the short-run and the long-run implications of TTIP for jobs in Europe come with opposite signs. In any case, the available research suggests that the effects of TTIP on the overall number of jobs and the structural rate of unemployment should be rather small.
Any type of reform of PMR, which leads to a restructuring of the economy, is likely to lead to a short-term spike in frictional unemployment. However, this restructuring process is necessary to achieve the gains from reform. If productive firms and innovative industries are to grow, less productive and less innovative industries have to provide the resources for their growth. The dismantling of trade barriers in the context of TTIP is likely to have the same effect. It triggers an adjustment process which makes the EU economy more productive, ultimately leading to higher wages for many workers and lower prices for consumers. Importantly, the balanced (i.e., reciprocal) lowering of trade barriers – in stark contrast to movements of exchange rates – simultaneously creates opportunities and threats. So, a well-conceived trade agreement will at the same time lead to job growth in certain areas and to job losses in others.
The available empirical literature suggests that short-term adjustment costs do indeed arise as a consequence of trade liberalization. The evidence, however, is mostly limited to trade opening episodes of Europe or the US with low-wage countries (e.g., China) that have very different patterns of comparative advantage. Since the structure of comparative advantage between the US and Europe is relatively similar, reallocation will occur mostly within industries rather than between them. This type of adjustment is less costly, because human capital is more portable within industries and less retooling is required. 1 EU Commission (2006). 2 Art. 7 of the Commission’s negotiating mandate from June 17 2013 stipulates: “The objective of the Agreement is to increase trade and investment between the EU and the US by realizing the untapped potential of a truly transatlantic market place, generating new economic opportunities for the creation of jobs and growth through increased market access and greater regulatory compatibility and setting the path for global standards.” (http://data.consilium.europa.eu/doc/document/ST-11103-2013-DCL-1/en/pdf). Similarly, the Resolution of the EU Parliament on TTIP from July 8 2015 says that “TTIP ... should be seen as an element in a broader European strategy to create jobs”. Also, the American Congress, in its bill granting Trade Promotion Authority (TPA) to the US President from May 22 2015, states the objective of trade policy to “promote full employment in the United States”.

Policy Department A: Economic and Scientific Policy
10 PE 578.984
The existing quantitative work on TTIP strongly suggests that the costs associated to this adjustment are one order of magnitude smaller than the benefits. The reason is that the benefits from efficiency gains due to TTIP accrue every year while the adjustment costs die off once the necessary reallocation of workers and capital has happened. Moreover, whenever the overall efficiency gains from TTIP are predicted to be small, the adjustment required to achieve these gains and the associated costs will be small, and vice versa. Established economic theory shows that the size of gains from trade is proportional to the amount of restructuring needed.
Moreover, the literature shows that the adjustment happens relatively quickly. Evidence from past liberalisation episodes points to short-lived unemployment increases. These are in general compensated by medium-term gains in job creation.
Nonetheless, it is important that European countries have the necessary instruments at hand to deal with the social costs arising during the adjustment process. Almost all of them have effective unemployment insurance schemes. They have ample experience with active labour market policies (ALMPs) aiming at speedy reemployment of workers made redundant by economic shocks. They include education measures, policies to promote mobility across regions, sectors, and firms, and effective labour market matching institutions. Because adjustment needs will differ among EU member states, it is important that there are also EU-wide instruments, such as the European Globalization Adjustment Fund (EGF).
As to the effects of TTIP on wages, the discussion touches on two aspects: First, how will average wages adjust to the agreement; second, how will wage inequality be affected. The US is not a low-wage country; so, there will be little direct pressure on wages from trade liberalization. Rather, it is plausible that the overall economic gains from TTIP will be shared by workers and capital owners in the same fashion that productivity gains from technological progress are shared. TTIP as such will not reverse the trend of a falling share of labour in total GDP, but there is no particular reason to expect it to strengthen it, neither. Existing quantitative work suggests that average wages should grow approximately at the same rate as GDP.
The picture is more involved when it comes to the distribution of labour income amongst workers. Empirical evidence shows that past trade liberalization episodes have contributed to higher inequality of gross wages, but the quantitative importance of trade for inequality is typically very small compared to the role of technological progress or institutional change. TTIP is likely to have similar effects as it augments the remuneration of certain skills, the demand for which increases with the agreement, but lowers the remuneration of other skills, the demand for which falls. The literature points towards very small inequality effects that are very heterogeneous across member states.
Moreover, as the agreement is likely to affect firms in similar industries differently, and since workers’ wages are often tied to the financial situation of firms, there will be effects within groups of workers with formally similar education as well. This aspect is typically overlooked in quantitative studies and would result in slightly higher inequality due to the agreement. However, one should not expect large effects either.
The remainder of this report is structured as follows. Section 2 reviews important stylized facts that matter for the assessment of the proposed TTIP agreement: the structure and dynamics of trade across the Atlantic, the number of jobs supported by it, and the design of labour market institutions. Section 3 discusses the channels through which TTIP could affect the number and quality of jobs in Europe. Section 4 summarizes empirical evidence on existing regional trade agreements and on past trade liberalization episodes. Section 5 explains and compares various quantitative studies that shed light on the potential effects of TTIP on European labour markets. Section 6 concludes with a brief discussion of policy options.

TTIP and Jobs
PE 578.984 11
A SNAPSHOT OF TRANSATLANTIC TRADE, JOBS, AND 2.LABOUR MARKET INSTITUTIONS
KEY FINDINGS
• About 15 % of all jobs in the EU are supported by exports to the rest of the world; almost 2 % of all jobs are supported by exports to the US. Affiliates by US firms in Europe offer almost 3 % of all jobs in the EU. Exporters and foreign-owned firms pay substantially higher wages, so that a reallocation of jobs towards internationally active firms boosts average pay.
• Exports to the US amount to about 2.6 % of EU GDP and imports to about 1.7 % of EU GDP. The US market accounts for almost a quarter of world supply and of world demand. This fact, and very heterogeneous trade exposure with the US suggests that the trade potential with the US is not fully realized.
• Europe has a strong and growing surplus in the area of services, which indicates the presence of a comparative advantage in the services area.
• The US is not a low-wage competitor to Europe. While wages are more dispersed in the US than in any EU member state, wages vary much more between EU countries than between US states. In contrast to the US, most EU member states have well-developed systems of labour market protection, which shelter workers from short-run shocks, but which may limit the aggregate productivity gains from TTIP.
2.1. A snapshot on EU-US trade relations
The labour market repercussions of a possible TTIP are necessarily proportional to the initial size of the transatlantic trade relationship and to the scope and depth of the agreement. For this reason, it is important to briefly recall the current situation.
In 2014, the EU exported goods worth 311 bn Euro to the US. This is about twice as much as exports to the next most important partner (China: 165 bn Euro). Exports of services to the US amounted to about 194 bn Euro. The EU imported goods worth 206 bn Euro and services worth 182 bn Euro from the US. Total exports to the US were 505 bn Euro and total imports from the US 388 bn Euro, leading to a bilateral surplus of 117 bn Euro.
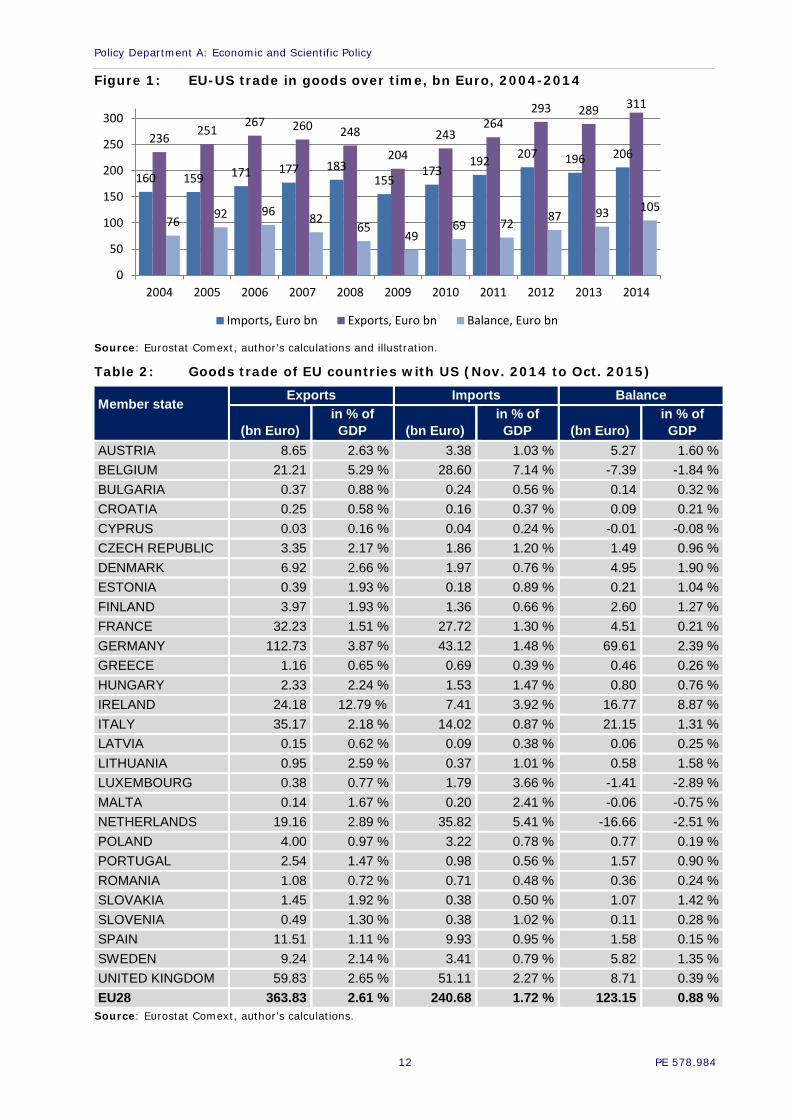
Figure 1 illustrates the evolution of EU-US trade in goods over time. It shows the decline of exports from 267 bn Euro in 2006 to 204 bn in 2009, and their subsequent recovery to the current level of 311 bn Euro. These numbers look impressive. However, they need to be put into perspective to understand the relative importance of US trade for labour market outcomes in the EU. Total exports of goods and services to the US amounted to about 3.6 % of EU GDP in 2014, total imports to 2.8 %, and the bilateral surplus to 0.8 % of GDP. In 2004, the EU exported goods worth 2.14 % of EU GDP; in 2014 that ratio has gone up to 2.23 %. The ratio of goods imports to GP increased from 1.45 % to 1.48 %. Despite impressive volumes, the relative importance of trade with the US is more modest than what many think and its dynamics over the last decade have by no means been spectacular.
Table 2 details the goods trade of EU countries with the US and compares exports, imports, and their balance to the level of GDP. The data refer to the most recent available 12 month period (November 2014 to October 2015). Compared to the year of 2014, the more recent data show a significant acceleration of trade with the US, most likely due to the depreciation of the Euro relative to the US dollar.
Policy Department A: Economic and Scientific Policy
12 PE 578.984
Figure 1: EU-US trade in goods over time, bn Euro, 2004-2014
Source: Eurostat Comext, author’s calculations and illustration.
Table 2: Goods trade of EU countries with US (Nov. 2014 to Oct. 2015)
Member state
Exports Imports Balance
(bn Euro) in % of GDP (bn Euro)
in % of GDP (bn Euro)
in % of GDP
AUSTRIA 8.65 2.63 % 3.38 1.03 % 5.27 1.60 % BELGIUM 21.21 5.29 % 28.60 7.14 % -7.39 -1.84 % BULGARIA 0.37 0.88 % 0.24 0.56 % 0.14 0.32 % CROATIA 0.25 0.58 % 0.16 0.37 % 0.09 0.21 % CYPRUS 0.03 0.16 % 0.04 0.24 % -0.01 -0.08 % CZECH REPUBLIC 3.35 2.17 % 1.86 1.20 % 1.49 0.96 % DENMARK 6.92 2.66 % 1.97 0.76 % 4.95 1.90 % ESTONIA 0.39 1.93 % 0.18 0.89 % 0.21 1.04 % FINLAND 3.97 1.93 % 1.36 0.66 % 2.60 1.27 % FRANCE 32.23 1.51 % 27.72 1.30 % 4.51 0.21 % GERMANY 112.73 3.87 % 43.12 1.48 % 69.61 2.39 % GREECE 1.16 0.65 % 0.69 0.39 % 0.46 0.26 % HUNGARY 2.33 2.24 % 1.53 1.47 % 0.80 0.76 % IRELAND 24.18 12.79 % 7.41 3.92 % 16.77 8.87 % ITALY 35.17 2.18 % 14.02 0.87 % 21.15 1.31 % LATVIA 0.15 0.62 % 0.09 0.38 % 0.06 0.25 % LITHUANIA 0.95 2.59 % 0.37 1.01 % 0.58 1.58 % LUXEMBOURG 0.38 0.77 % 1.79 3.66 % -1.41 -2.89 % MALTA 0.14 1.67 % 0.20 2.41 % -0.06 -0.75 % NETHERLANDS 19.16 2.89 % 35.82 5.41 % -16.66 -2.51 % POLAND 4.00 0.97 % 3.22 0.78 % 0.77 0.19 % PORTUGAL 2.54 1.47 % 0.98 0.56 % 1.57 0.90 % ROMANIA 1.08 0.72 % 0.71 0.48 % 0.36 0.24 % SLOVAKIA 1.45 1.92 % 0.38 0.50 % 1.07 1.42 % SLOVENIA 0.49 1.30 % 0.38 1.02 % 0.11 0.28 % SPAIN 11.51 1.11 % 9.93 0.95 % 1.58 0.15 % SWEDEN 9.24 2.14 % 3.41 0.79 % 5.82 1.35 % UNITED KINGDOM 59.83 2.65 % 51.11 2.27 % 8.71 0.39 % EU28 363.83 2.61 % 240.68 1.72 % 123.15 0.88 %
Source: Eurostat Comext, author’s calculations.
160 159 171 177 183 155
173 192 207 196 206
236 251 267 260 248
204 243
264 293 289 311
76 92 96 82 65
49 69 72 87 93 105
0
50
100
150
200
250
300
2004 2005 2006 2007 2008 2009 2010 2011 2012 2013 2014
Imports, Euro bn Exports, Euro bn Balance, Euro bn

TTIP and Jobs
PE 578.984 13
The table also illustrates the large degree of heterogeneity amongst EU member states with respect to the relative importance of trade with the US. Ireland is by far the country most strongly exposed to trade with the US. Exports amount to almost 13 % of GDP, imports to 4 % and the bilateral surplus to 9 %. Also, Belgium and the Netherlands are very strongly exposed, however, in contrast with most other member states, imports strongly exceed exports in these countries. This has to do with their role as gateways for overseas imports.
Germany is responsible for about a third of total EU exports to the US, for less than a fifth of total EU imports from the US, and for more than half of the surplus that the EU achieves with the US.
For Cyprus, Greece, or Romania trade with the US plays almost no role, for France and Italy it is significantly lower than for the average EU country. However, the table only provides a rough indication of the true importance of transatlantic trade: many Eastern European countries produce intermediate inputs which are supplied to final goods producers in other EU member states and who use them in the production of exports for the US markets. The data therefore tend to underestimate the role of the US market for countries such as Slovakia or Poland, but exaggerate it for countries such as Germany or the United Kingdom.
The heterogeneity shown in Table 2 is informative: the labour markets of countries that are strongly exposed to trade with the US will be affected more strongly than those of countries which barely trade with the US. However, a word of caution is warranted: to the extent that low trade with the US indicates high trade barriers which TTIP can bring down, trade creation will be stronger in countries which trade little with the US today. To capture these complexities, the simulation of a formal economic model is required.
Figure 2 illustrates the patterns and dynamics of EU-US trade in broadly defined industries. With the exception of raw materials, the EU enjoys substantial trade surpluses with the US in most areas. The largest surplus is achieved in machinery and transportation, where total exports amount to 135 bn Euros and imports to 89 bn Euros. Large surpluses also exist in the areas of chemicals and other manufactured goods. The agri-food sector (food, drinks, and tobacco) displays a particularly dynamic behaviour, even if total exports in 2014 are only about 14 bn Euro and are strongly concentrated on few products (wine, spirits, beer); see Bureau et al. (2014).
It is very likely that the trade effects of TTIP will differ from industry to industry. So, countries with different exposure in different industries will face potentially very different labour market effects. However, industries are connected through input-output linkages within and between countries, so that any estimate requires the simulation of relatively complex models.

Policy Department A: Economic and Scientific Policy
14 PE 578.984
Figure 2: EU-US trade in important industries, bn Euro, 2004-2014
Source: Eurostat. Author’s illustrations.
2.2. EU services trade
About a third of total EU exports to the US occur in the area of services. From 2003 to 2013, services exports have grown from about 112 bn Euro to 159 bn Euro; this amounts to a yearly growth rate of 3.5 %. At the same time, services imports from the US have grown from about 105 bn Euro to 146 bn Euro, at a slightly smaller yearly rate of growth. The EU has a bilateral surplus in services trade that has grown from about 8 bn Euro in 2003 to almost 13 bn Euro in 2013. While the EU enjoys bilateral surpluses with the US in both goods and services, services imports from the US are relatively more important as a share of total trade (43 % in 2013) than services exports to the US. This illustrates the relatively strong position of the US in the area of services. Heydon (2015) provides an excellent discussion of the transatlantic dimension of services trade and of the challenges and opportunities presented by TTIP in this sector.
0
5
10
15
20
25
05 06 07 08 09 10 11 12 13 14
Food, drinks, and tobacco (SITC 0+1)
Exports Imports
0
5
10
15
20
25
05 06 07 08 09 10 11 12 13 14
Raw materials (SITC 2+4)
Exports Imports
0
5
10
15
20
25
05 06 07 08 09 10 11 12 13 14
Mineral fuels, lubricants (SITC 3)
Exports Imports
0
25
50
75
100
125
150
05 06 07 08 09 10 11 12 13 14
Chemicals and related products (SITC 5)
Exports Imports
0
25
50
75
100
125
150
05 06 07 08 09 10 11 12 13 14
Other manufactured goods (SITC 6+8)
Exports Imports
0
25
50
75
100
125
150
05 06 07 08 09 10 11 12 13 14
Machinery & transportation (SITC 7)
Exports Imports

TTIP and Jobs
PE 578.984 15
Table 3: EU services trade with US
2003 (EU-25) 2013 (EU-28)
Value (Euro bn)
Share in total
trade (%) Value
(Euro bn)
Share in total
trade (%)
Growth rate p.a.
(%)
Exports to US 112.3 33 158.8 35 3.5
Imports from US 104.6 40 146.1 43 3.4
Balance 7.7
12.7 Source: Heydon (2015).
2.3. Extra-EU exports and employment in EU member states
In the year of 2011, exports of European firms to the rest of the world support more than 31 million jobs in the European Union. This amounts to about 15 % of all existing jobs. About 23 % (7.1 million) of these jobs exist in Germany; 13 % (4.0 million) in the United Kingdom, 10 % (3.1 million) in Italy and 8 % (2.6 million) in France; see Figure 3.
Figure 3: Export-supported number of jobs in EU member states and their share in total employment
Source: Arto et al. (2015). Data refer to EU27 and to year 2011.
In most EU member states export-supported jobs account for between 10 and 20 % of all jobs; in some smaller countries such as Luxembourg, Ireland or Hungary the share is substantially higher.
115 494
852
37 643
254 872 761
7.060
886 427
767
102
1.415 1.375
445 140 151
3.134
3.970
309
1.970
44
2583
413
1.597
347
0
20
40
60
0
2000
4000
6000
Luxe
mbo
urg
Irel
and
Hun
gary
Mal
taBul
gari
aLi
thua
nia
Sw
eden
Aus
tria
Ger
man
y
Cze
ch R
epub
licFi
nlan
dBel
gium
Esto
nia
Rom
ania
Net
herl
ands
Den
mar
kLa
tvia
Slo
veni
aIt
aly
Uni
ted
Kin
gdom
Slo
vaki
aPo
land
Cyp
rus
Fran
cePo
rtug
alSpa
inG
reec
e
% thsd. jobs
Number of jobs (thousands), left axis Share in total employment (%), right axis

Policy Department A: Economic and Scientific Policy
16 PE 578.984
Figure 4: Share in total employment of jobs supported by exports to the US and by FDI of US firms
Source: World Trade Institute (2016), author’s own calculations and illustration.
According to Arto et al. (2015), in all countries except one (Latvia) the number of jobs supported by exports increased between 1995 and 2011. On average, across EU member states (EU27), their number grew by an annual rate of 3.3 %; much more than the annual rate of growth of economic activity in that period which amounted to 1.9 % (real GDP, Eurostat data). In the EU15 countries, export-supported employment grew by 9.8 million between 1995 and 2011, while the total number of jobs grew by 23.0 million jobs according to Eurostat data. Hence, more than 4 out of 10 jobs created in this time period are in the export sector. The yearly growth rate of export-supported jobs in the EU15 group was 3.4 % a year; in contrast, total employment grew only by a yearly rate of 0.9 %. Therefore, the number of export-supported jobs grew about four times faster than the number of jobs supported by domestic demand.
Figure 4 shows the share of jobs that are supported by exports to the US in each EU member states. In Ireland, that share is almost 15 %; in six countries it lies above 2 % (Luxembourg, Malta, Denmark, UK, Germany, and Belgium). It is below 1 % in some Eastern and Southern countries. On average across the EU28 countries, the share is 1.71 %.
Figure 5 shows the share of jobs in US owned firms in EU member states: 2.8 % of all jobs in Europe are offered by affiliates of US firms. This share is substantially higher than the one supported by exports; this shows the important role of foreign direct investment (FDI) relative to trade in the transatlantic relationship. Note, however, that the shares shown in Figure 4 and Figure 5 cannot be summed to obtain the total share of jobs dependent on commercial ties with the US, as many US affiliates in Europe export back to America.
Empirical evidence shows very clearly that jobs in exporting firms tend to pay higher wages than jobs in firms selling domestically only, even if one accounts for the fact that exporting firms typically employ workers with higher levels of education or seniority and that they are usually larger.
This wage premium is found to lie above 5 % in many empirical studies.3 While these results cannot always be interpreted as causal in the sense that the mere inception of
3 Bernard and Jensen (1997) find an exporter wage premium of 7 to 11% in the U.S. Egger, Egger, and Kreickemeier (2013) found an exporter premium of about 6% in six European countries (Bosnia-Herzegovina,
0,7 0,7 0,8 0,8 0,9 0,9 0,9 1,0 1,0 1,1 1,2 1,2 1,2 1,2 1,2 1,4 1,4 1,5 1,8 1,8 1,9 2,1 2,3 2,4 2,5 2,8 3,5
14,8
0
2
4
6
8
10
12
14Bul
gari
aG
reec
eRom
ania
Slo
veni
aPo
land
Slo
vaki
aSpa
inCro
atia
Cyp
rus
Finl
and
Cze
ch R
epub
licFr
ance
Latv
iaLi
thua
nia
Port
ugal
Esto
nia
Hun
gary
Ital
yAus
tria
Sw
eden
Net
herl
ands
Bel
gium
Ger
man
yU
nite
d Kin
gdom
Den
mar
kM
alta
Luxe
mbo
urg
Irel
and
EU28 average

TTIP and Jobs
PE 578.984 17
export activities leads to an increase in wages, they suggest nevertheless that exporting firms offer attractive jobs. Hence, it makes sense to foster the internationalization of firms to boost high-quality employment. TTIP can be understood as an attempt to achieve exactly this.
Figure 5: Share in total employment of jobs in US owned firms
Source: World Trade Institute (2016), author’s own calculations and illustration.
Similarly, there is evidence that jobs in foreign owned firms pay higher wages. For example, Gelübcke (2013) shows that US owned firms in Germany pay about 16 % higher average wages as German own firms, holding firm size, and industry affiliation constant.
2.4. Wages across the EU and the US How lower trade barriers between the EU and the US could affect labour markets in EU member states depends on the pattern of comparative advantage between the EU and the US, and on institutions’ ability to facilitate job creation, protect workers, and manage their transition from shrinking to expanding firms and industries.
First of all, it is important to note that, compared to the EU average, the US is not a low-wage country. It does not have a pronounced comparative advantage in the production of labour intensive goods and will, therefore, not exert any strong downward pressure on European wages.
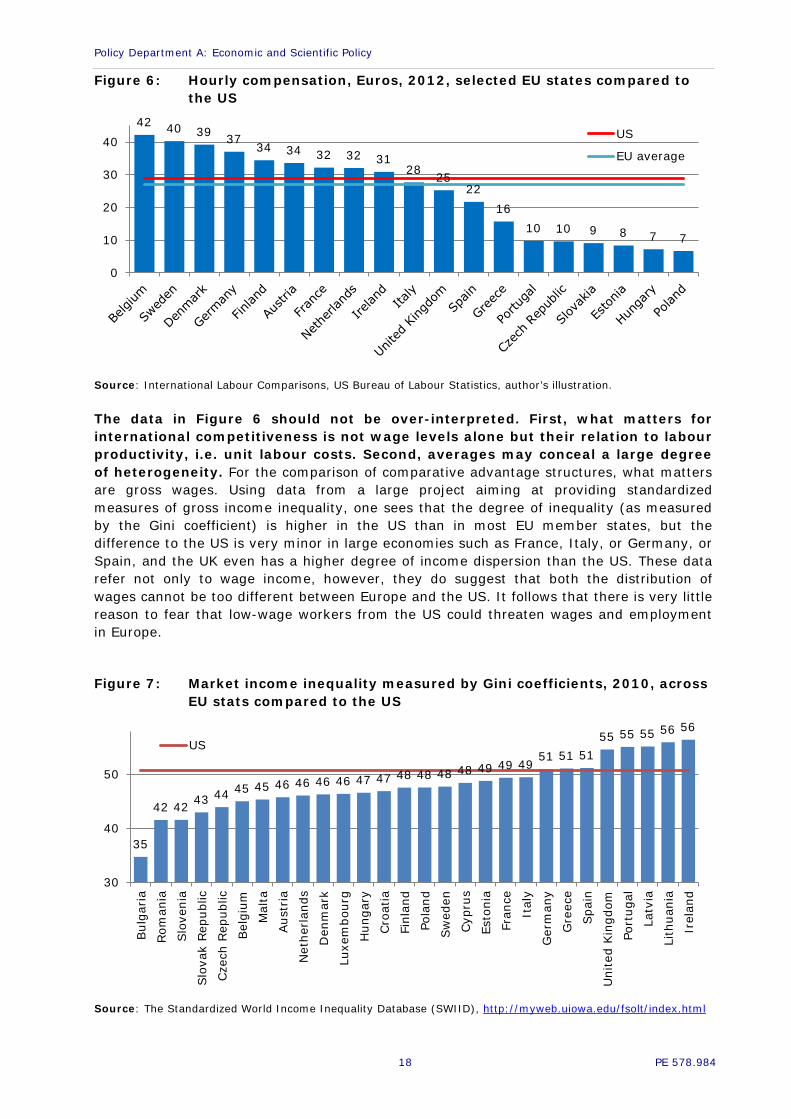
In 2012, expressed in Euros, the average hourly gross wage in the US was about 29 Euro, while it was about 27 Euro in the EU19; see Figure 6. Amongst the 19 countries for which harmonized data are available,4 9 have higher average wages than the US and 10 have lower wages. France, Netherlands, and Ireland have higher wages, but the difference to the US level is very minor. The degree of labour market competition that workers in Germany or France face from EU countries such as Poland is, by a large margin, more important than competition from US workers.
Croatia, France, Serbia and Slovenia); Farinas and Martin-Marcos (2007) find a similar magnitude for Spain. In Germany, the premium is between 10 and 12% (Baumgarten, 2013). 4 These countries account for about 92% of total employment in the EU28.
0,2 0,3 0,4 0,7 0,8 0,8 0,9 1,1 1,1 1,4 1,7 1,8 1,9 2,1 2,2 2,4 2,5 2,5 2,7 2,9 3,0 3,3 3,5 3,6 3,7
5,6 5,9
9,1
0
2
4
6
8
Cyp
rus
Cro
atia
Gre
ece
Lith
uani
aLa
tvia
Bul
gari
aSlo
veni
aPo
rtug
alM
alta
Spa
inIt
aly
Rom
ania
Slo
vaki
aFi
nlan
dG
erm
any
Aus
tria
Esto
nia
Fran
ceD
enm
ark
Sw
eden
Cze
ch R
epub
licPo
land
Hun
gary
Bel
gium
Net
herl
ands
Luxe
mbo
urg
Uni
ted
Kin
gdom
Irel
and
EU28 average
Policy Department A: Economic and Scientific Policy
18 PE 578.984
Figure 6: Hourly compensation, Euros, 2012, selected EU states compared to the US
Source: International Labour Comparisons, US Bureau of Labour Statistics, author’s illustration.
The data in Figure 6 should not be over-interpreted. First, what matters for international competitiveness is not wage levels alone but their relation to labour productivity, i.e. unit labour costs. Second, averages may conceal a large degree of heterogeneity. For the comparison of comparative advantage structures, what matters are gross wages. Using data from a large project aiming at providing standardized measures of gross income inequality, one sees that the degree of inequality (as measured by the Gini coefficient) is higher in the US than in most EU member states, but the difference to the US is very minor in large economies such as France, Italy, or Germany, or Spain, and the UK even has a higher degree of income dispersion than the US. These data refer not only to wage income, however, they do suggest that both the distribution of wages cannot be too different between Europe and the US. It follows that there is very little reason to fear that low-wage workers from the US could threaten wages and employment in Europe.
Figure 7: Market income inequality measured by Gini coefficients, 2010, across EU stats compared to the US
Source: The Standardized World Income Inequality Database (SWIID), http://myweb.uiowa.edu/fsolt/index.html
42 40 39 37 34 34 32 32 31
28 25 22
16 10 10 9 8 7 7
0
10
20
30
40 US
EU average
35
42 42 43 44 45 45 46 46 46 46 47 47 48 48 48 48 49 49 49 51 51 51
55 55 55 56 56
30
40
50
Bul
gari
a
Rom
ania
Slo
veni
a
Slo
vak
Rep
ublic
Cze
ch R
epub
lic
Bel
gium
Mal
ta
Aus
tria
Net
herl
ands
Den
mar
k
Luxe
mbo
urg
Hun
gary
Cro
atia
Finl
and
Pola
nd
Sw
eden
Cyp
rus
Esto
nia
Fran
ce
Ital
y
Ger
man
y
Gre
ece
Spa
in
Uni
ted
Kin
gdom
Port
ugal
Latv
ia
Lith
uani
a
Irel
and
US

TTIP and Jobs
PE 578.984 19
2.5. Labour market regulation across the Atlantic
Labour market regulation differs significantly between EU member states and the US. This has implications on the effective cost of employing workers (beyond wages) and on the ability of countries to adjust to trade policy changes.
Figure 8 shows that minimum wages tend to be more strongly binding in EU countries than in the US, where the average minimum wage is just 37 % of the median wage. In France, it is more than 60 %.
Figure 8: Statutory minimum wage in the EU compared to the US, % of full-time median earnings (year 2014)
Source: Online OECD Employment database. Germany refers to year 2015, author’s illustration.
On a scale between 0 and 6, Figure 9 shows the stringency of employment protection legislation (EPL) in EU member states (for which the OECD provides data) and compares with the US. All EU countries surveyed have stricter protection of permanent workers against individual and collective dismissals than the US. They also have stricter regulation of temporary forms of employment. However, there is substantial variation between EU member states. On the one hand, strict EPL can hinder speedy adjustment and make transitions following the reduction of trade barriers economically more costly. On the other hand, EPL may impede excessive labour churning. Research shows that EPL makes employment more stable in the face of macroeconomic volatility but can also reduce average employment creation as firms anticipate that adjustment of the labour force is more costly (Bertola et al., 2001).
Not only do EU member states have substantially stricter EPL than the US, European countries have much more developed social safety nets. Figure 10 makes this pattern very clear: 23 out of 27 EU countries have more generous unemployment benefit systems than the US as measured by the net (average) replacement rate (NRR). In the US, 32 % of preceding labour income is replaced; in Ireland, that rate is at 73 %, in France at 57 % and in Germany at 52 %. The unweighted average for the 27 EU countries shown in the figure is 49 %. The one large country with low replacement rate is Italy (23 %). In many EU countries, the NRR has fallen; e.g., since 2001, it has gone down by 11 percentage points in Germany; it has fallen by a similar amount in Denmark. In France and Spain it has fallen, but only modestly. In Italy it has even gone up.
0
10
20
30
40
50
60 US

Policy Department A: Economic and Scientific Policy
20 PE 578.984
Figure 9: Employment protection legislation in EU member states and the US
Source: OECD-IDB employment protection data base. www.oecd.org/employment/protection, author’s own illustrations. Scale from 0 (least restrictions) to 6 (most restrictions), last year available.
Prima facie, the pronounced differences in labour market institutions across the Atlantic have not systematically hurt European competitiveness relative to the US in the last decades. Most EU countries run substantial trade surpluses; see Table 2. Moreover, while the EU’s trade surplus has almost tripled from 2009 to 2014, it has consistently been positive over the last decade despite the overall trade position of Europe relative to the whole world being negative. However, it is possible that the pronounced institutional differences on labour markets exert a stronger effect when macroeconomic conditions (e.g., the exchange rate) are less conducive to a European surplus.
Figure 10: Unemployment benefits in EU member states and the US (2013)
Note: The figure shows a summary measure defined as the average of the net unemployment benefit (including social assistance and cash housing assistance) replacement rates for two earnings levels, three family situations and 60 months of unemployment. Source: OECD : www.oecd.org/els/benefits-and-wages-statistics.htm .
010203040506070
Irel
and
Den
mar
kN
ethe
rlan
dsFi
nlan
dLu
xem
bour
gSw
itzer
land
Bel
gium
Sw
eden
Fran
ceG
erm
any
Slo
veni
aCze
ch R
epub
licPo
rtug
alU
nite
d Kin
gdom
Mal
taSpa
inLa
tvia
Pola
ndEs
toni
aSlo
vak
Rep
ublic
Lith
uani
aCro
atia
Bul
gari
aH
unga
ryRom
ania
Ital
yG
reec
e
US
0
1
2
3
4
Regulation on temporary forms of employment
0
1
2
3Protection of permanent workers against individual and collective
dismissals
US

TTIP and Jobs
PE 578.984 21
CHANNELS AND MECHANISMS: GENERAL REMARKS 3.
KEY FINDINGS
• Most studies on trade agreements in general and on TTIP in particular assume away any effects on unemployment, following the wide-spread opinion that the unemployment rate is driven by labour market institutions and macroeconomic conditions rather than by microeconomic policies such as trade policy.
• However, more recent research argues that trade liberalization can give rise to higher transitory frictional unemployment in the short-run while it may generally affect the effectiveness of the labour market, resulting in lower or higher long-term unemployment.
• Trade liberalization amongst comparable countries is unlikely to generate large effects on aggregate labour income shares but may induce higher inequality among wage earners.
This chapter explains different concepts and assumptions in the modeling of labour market effects of trade liberalization. These ideas explain the ex post findings on existing RTAs discussed in Section 4 and also make explicit why results of ex ante studies on TTIP come to widely different conclusions regarding the job creation effects of the proposed agreement (Section 5).
3.1. Trade policy and employment: the conventional view
Trade policy can affect employment by (i) altering unemployment rates at given labour supply, or by (ii) leading to changes in labour supply at given unemployment rates. The first effect materializes if trade agreements raise wages and the supply of labour responds positively to wage increases. However, in theory such labour supply effects could even be negative as workers use higher wage income to lower hours worked. Moreover, econometric work on the estimation of labour supply elasticities typically concludes that they are very low (OECD, ILO, World Bank 2010). Hence, it makes sense to treat the supply of labour as by and large invariant to trade policies.
The role of trade balances The case for treating unemployment rates constant in trade models is more controversial. Lower trade barriers typically lead to an expansion of both exports and imports. Jobs are created in export-oriented firms and industries, but destroyed in import-competing ones. The question is: what is the net effect? Clearly, if lower trade costs lead to an asymmetric expansion of imports and exports, so that the trade surplus of a country grows or falls, the net balance of job creation and destruction might be positive or negative. Trade agreements such as TTIP are supposed to be “balanced”, i.e., reciprocal, so that they lead to a more or less proportionate expansion of both imports and exports, in particular in the long-run. Trade surpluses are usually not seen to be a function of trade costs but of macroeconomic variables such as exchange rates, interest rates, or the stance of fiscal or monetary policy which are not negotiated in trade agreements. Moreover, permanent imbalances would lead to financing constraints and are therefore not generally sustainable.
Therefore, economists have been very skeptical as to any long-term effects of trade policy measures on (un-)employment, which is supposed to be determined by macroeconomic conditions and labour market institutions. This has led Irvine (2015) to state that “attempts

Policy Department A: Economic and Scientific Policy
22 PE 578.984
to quantify the overall employment effect of trade are largely an exercise in futility” (Irvine, 2015). Earlier, Paul Krugman (1993) claimed that “The level of employment is a macroeconomic issue, depending in the short run on aggregate demand and depending in the long run on the natural rate of unemployment, with microeconomic policies like tariffs having little net effect. Trade policy should be debated in terms of its impact on efficiency, not in terms of phony numbers about jobs created or lost.” Consequently, the focus of studies on the potential effects of TTIP, such as CEPR (2013), lies usually not on potential effects on aggregate employment, but rather on the effects on the structure of sectoral employment or wages.
The role of institutions
This does not mean, however, that labour market regulations and trade policies do not interact at all. Trade theory has long emphasized that certain types of labour market rigidities could decrease or even render negative the gains from trade policy reform (Brecher, 1974; Davis, 1998, Felbermayr et al., 2011a). The most striking example is that of an inflation-indexed minimum wage that is binding for less skilled workers. A relatively skill-abundant region (such as the EU) which liberalizes trade with a skill-poor region (such as India) should specialize more strongly on products and services that draw more heavily on skills. This lowers the demand for less skilled workers. If, however, their wages cannot adjust, lower demand translates into unemployment; trade liberalization would then lead to welfare losses. Globalization can interact with dysfunctional labour markets to produce adverse outcomes. Empirical research shows that wages are to some extent flexible in all countries, even if adjustment may take a substantial amount of time (Dickens et al., 2006). Moreover, the extent of wage flexibility depends on features of labour market regulation.
Transitory effects
The literature also does not debate the possibility that trade liberalization episodes could give rise to transitory spikes in unemployment. The reason is that lower trade barriers should help export-oriented firms and industries to expand, taking advantage of new opportunities on foreign markets, while import-competing firms and industries would shrink under the pressure of additional competition. This leads to increased labour market churning, as workers relocate from shrinking firms to expanding ones. If this process is not instantaneous, it leads to temporarily higher frictional unemployment (Davidson and Matusz, 2006). Indeed, the empirical literature provides evidence for this (Dutt et al., 2009). The common view, however, is that the economy should ultimately return to the equilibrium level of unemployment which does not depend on trade policy. Even though, the costs of adjustment and the possible hardship that it entails for certain individuals should be accounted for. Most studies on TTIP (and other trade agreements) do this only in a very cursory manner if at all.
How costly labour reallocation is, depends on many factors. Two very important ones are: (i) How effective is the labour market in matching workers in search of a job with firms having open vacancies? Countries differ significantly with respect to the efficiency of this matching process (Sala et al., 2013; Arpaia et al., 2014). And (ii), does reallocation take place within or across sectors of economic activity? Typically, worker flows between shrinking and expanding firms in the same sector can occur faster and with less retooling, then flows between shrinking and expanding sectors. Since trade between the EU and the US is very strongly concentrated within the same industries (i.e., it is of intra-industry nature, see Felbermayr and Larch, 2013), TTIP is likely to induce more within-industry reallocation than between-industry reallocation, with the former less costly to workers and the society than the latter.
TTIP and Jobs
PE 578.984 23
Keynesian models
Keynesian models of effective demand, however, stress that labour market outcomes can be affected by insufficient aggregate demand. This moves effects on the overall trade balance to the center of the analysis: an increasing trade surplus adds to aggregate demand, while a falling one would subtract from it, thereby creating or destroying employment. This view is adopted by Capaldo (2014). It is highly controversial. Pelkmans et al. (2014) and Bauer and Erixon (2015) argue that it lacks a credible theory about why, how, and to what extent certain trade policy measures should boost or reduce the aggregate trade balance. Moreover, by construction designed to address short-run imbalances, it is unclear whether the model can inform about the long-run implications of structural policies where persistent surpluses or deficits are not sustainable.5
3.2. Trade policy and employment: more recent perspectives
Pro-competitive effects
Classical literature views unemployment effects of trade agreements as purely transitory. The view is, however, in contrast with macroeconomic literature on the labour market effects of product market regulation (PMR). For example, Blanchard and Giavazzi (2003) and a large body of applied research (conducted, i.a., at the OECD by Bassanini and Duval, 2006, 2009) argue, both theoretically and empirically, that more intense product market competition may well spur job creation as the power of monopolists to limit output (and employment) is curbed. Trade policy reform addresses, by-and-large, many aspects of PMR.
This is most relevant in the context of non-tariff trade barriers (NTBs), which are also at the core of negotiations in the context of TTIP. The costs of NTBs can affect the behavior of firms and consumers very much like tariffs when they are proportional to the value of products. It is more likely, however, that they take the form of fixed costs that are unrelated to the value of products of the sales volumes and that occur at the moment of entry into a foreign market or to maintain a foreign market presence; see Felbermayr and Jung (2009). NTBs can have more direct effects on the number of firms active on a market and, therefore, can influence the degree of product market competition. If NTBs take the form of variable costs, they can also affect the competitive situation, albeit in a more indirect way; see Melitz and Ottaviano (2008).
On markets with limited competition, firms may want to restrict output to keep prices high. This limits consumer surplus, but also lowers the level of employment. If the trade agreement spurs competition, e.g., by fostering entry of foreign competitors into hitherto oligopolistic domestic markets while giving domestic firms the same opportunity abroad, it may reduce monopolistic distortions, thereby expanding output and employment (Blanchard and Giavazzi, 2003). If the opposite happens, e.g., as the agreement entrenches monopolistic structures, employment can be harmed.
Empirical evidence, however, suggests that trade liberalization does boost product market competition (Badinger, 2007) so that beneficial effects on employment stemming from increased competition from TTIP seem likely. Such a mechanism has been demonstrated in simulation work for the European Union by Corcos et al. (2012).
Sectoral composition effects
Different industries are likely to be differently affected by the incidence of structural unemployment, e.g., due to differences in inherent job stability or in the difficulty to match 5 See any modern textbook on macroeconomics on the empirical performance of first-generation Keynesian models (Romer, 2011).

Policy Department A: Economic and Scientific Policy
24 PE 578.984
jobs to workers. Carrère et al. (2015) document a large degree of heterogeneity of sectoral matching efficiencies. The elimination of tariffs and NTBs due to a trade agreement can lead to the expansion of some industries and to the contraction of others. If industries with high inherent unemployment rates expand and those with low ones contract, the aggregate unemployment rate can rise even if industry-level unemployment rates remain unaffected. The opposite effect is possible, too, if friction-prone sectors lose relative importance. The key assumption here is that labour markets are sectorally segmented ex post (i.e., after trade policy reform has been undertaken). In other words, workers cannot change sectors (or occupations). This is a problematic and largely unrealistic assumption, as modern labour markets exhibit a high degree of labour market churning. Helpman and Itskhoki (2010) have made this point in a stylized model, and Carrère et al. (2015) have brought the mechanism to the TTIP debate.
Effects on job-creation incentives
Industry-level unemployment rates can be affected by the agreement if the expected benefits from creating vacancies change. This would happen if the costs of creating vacancies (e.g., in the form of investment into the required work place equipment) relative to the value of the output to be produced on a filled job change. This is the mechanism in Felbermayr et al. (2011a); also see the more accessible discussion in Felbermayr and Prat (2013). Typically, in models of international trade with frictional unemployment, wage bargaining, and free entry whenever trade liberalization creates overall benefits, part of the benefits will be directly accrue to workers through higher wages and indirectly through lower unemployment. This is the mechanism in ifo/Bertelsmann (2013).
Labour market regulation (LMR)
One less prominent channel through which trade liberalization can alter labour market outcomes is through changes in the institutional setup of labour markets. Häberli et al. (2011) have shown empirically that RTAs can lead to changes in LMR. They produce evidence that the generosity of unemployment benefit systems falls or employment protection legislation is rolled back. While both such institutional changes may lead to lower bargained wages of workers, they can lead to lower structural unemployment rates, which, in turn, benefits workers. However, there is also evidence that more open economies tend to have larger social insurance systems (Rodrik, 1998) and that the unemployment benefits increase as trade costs fall (Felbermayr et al., 2012). Potrafke (2015) offers a survey that covers more than 100 studies, many different proxies of employment protection, and varying samples of (mostly OECD) countries. He finds evidence that exposure to international competition (measured by a globalization index) has not led countries to systematically roll back worker protection.

TTIP and Jobs
PE 578.984 25
Table 4 compares different models and the main advantages and disadvantages of their main assumptions:
Table 4: Different models and their assumptions
ADVANTAGES DISADVANTAGES
Standard CGE models (e.g., CEPR, 2013)
• fully consistent general equilibrium model • long tradition in applied trade policy work • detailed sectoral information (market
structure, input-output linkages) • empirically validated adjustment
mechanisms
• long-term perspective only • assumes perfect labour
markets (no unemployment, no adjustment costs)
• empirical performance (ex post) debatable
• trade policy scenarios driven by expert opinion
Gravity-based CGE model (e.g., ifo/Bertelsmann, 2013)
• fully consistent general equilibrium model • trade policy scenarios driven by evidence
on past policy changes • model parameters structurally estimated
based on real data • simple structure allows flexible
adjustment mechanisms in the background (reduced form)
• structural (long-term) unemployment can be easily incorporated
• long-term perspective only • lack of sectoral detail reduces
policy relevance • popular in scientific
community, but little use in policy work so far
Keynesian models (e.g., Capaldo, 2014)
• acknowledges existence of unemployment and of macroeconomic imbalances
• focuses on the politically relevant short-term
• no modeling of trade policy no modeling of gains from trade, no optimal behavior of firms and workers
• assumes that macroeconomic imbalances persist over time
• strongly criticized in scientific community
Source: own compilation.
Table 5 summarizes the qualitative predictions of the different frameworks:
Table 5: Different conceptual frameworks and their predictions
Time
horizon Unemployment Labour supply Wages Examples
Standard CGE models long-term none none or
positive
positive on average, possibly negative for low-skilled workers
CEPR (2013), WTI (2016)
Models with frictional unemployment and aggregate labour market
long-term negative or zero none or
positive positive
Ifo/ Bertelsmann (2013)
Models with frictional unemployment and segmented sectoral labour markets
long-term ambiguous none or
ambiguous ambiguous
Carrère et al., (2015)
Keynesian models with cyclical unemployment
short-term
negative if current account surplus falls, positive if opposite
none or negative
negative if current account surplus falls, positive if opposite
Capaldo (2014)
Source: own compilation.

Policy Department A: Economic and Scientific Policy
26 PE 578.984
3.3. Trade policy and wages
There is a long tradition of research on the effects of trade liberalization on wages or rates of return to capital. The classical perspective is that of the so-called Stolper-Samuelson theorem: When trade liberalization leads a country to specialize on the production of products that do not use labour intensively, demand for labour falls, and the wage goes down relative to capital income. If, instead, it specializes on labour-intensive goods, the opposite holds true. So, if Europe lowers trade barriers with labour-rich emerging countries and, as a consequence, specializes on the production of goods that use human or physical capital intensively relative to labour, the share of labour in national income falls. However, in the context of trade with a country such as the US, where wages are not systematically lower than in the EU, such an effect is not likely. Also, transatlantic trade is mostly happening within industries (Felbermayr and Larch, 2013), while the Stolper-Samuelson logic applies to trade between industries. Altogether, empirical evidence for the Stolper-Samuelson mechanism is rather weak, in particular in OECD countries (Feenstra, 2004).
More recent literature stresses that trade can lead to increased wage dispersion, even if it occurs within narrowly defined industries. The idea is that more productive firms (which are larger and more likely to be exporters) pay higher wages than less productive ones (which are smaller and less likely to export). If trade costs fall, exporters can benefit from? a boost while non-exporters may be harmed due to import competition. This may lead to a further divergence of pay. Moreover, the set of firms which exports also changes. Applying a variant of this argument to a structural model of European countries, Egger et al. (2013) find that lower trade costs indeed increase wage dispersion amongst homogeneous workers. Empirical evidence of Baumgarten (2013) is consistent with this result. Related work by Felbermayr et al. (2014), which uses a different theoretical underpinning, does not find strong evidence for an inequality increasing effect of trade opening between 1996 and 2007 in Germany.
In all the papers cited above, lower tariffs and costs of non-tariff barriers (NTBs) lead to the expansion of exporting firms and sectors and to the shrinkage of import-competing firms and sectors, and because the former tend to pay higher wages, trade liberalization tends to increase the average real wage. Table 9 and Table 10 show which sectors are likely to benefit and which are likely to be hurt.
Note that the literature mostly focuses on inequality in gross wages. What matters for workers, however, are net wages. Most EU countries engage in substantial amount of redistribution, and net wages are much more equally distributed than gross wages (even if trends are similar).
In total, the consensus view is that trade probably increases the dispersion of gross wages but that other influences such as technological or institutional change are quantitatively much more important (Irvine, 2015). Moreover, what matters are net wages, not gross wages, and adjustable taxes and transfers drive substantial wedges between them. For these reasons, the effects of trade liberalization on wage inequality are not enough to resist a trade agreement such as TTIP.
TTIP and Jobs
PE 578.984 27
LABOUR MARKET EFFECTS OF TRADE AGREEMENTS: EX 4.POST EVALUATIONS
KEY FINDINGS
• Trade agreements, including those by the European Union, have typically increased trade openness of countries; this has been shown in official evaluation studies. However, these evaluation studies have never included aggregate employment effects.
• Carefully controlling for the effects of business cycles or institutional change, econometric cross-country studies show that in the EU28 countries, from 1995 to 2014, higher trade openness is, on average, associated to slightly lower long-term unemployment. However, the effects are very small. An agreement, which increases trade openness by 10 percentage points, is associated to a drop in unemployment rate of about 0.2 percentage points.
• In the short-run, trade liberalization can increase unemployment. Evidence suggests that adjustment to the permanently lower unemployment rate takes not much more time than two years.
There is ample empirical evidence that existing bilateral or multilateral trade agreements have on average indeed increased the overall trade openness of countries and that trade creation due to regional trade agreements (RTAs) has often been substantial. While evidence on the effects of specific European agreements on (un)employment is rare, there is some work that connects measure of trade openness to structural unemployment. There is also some scientific evidence on the role of Eastern enlargement of the EU and the entry of China into the WTO and? on European labour markets.
4.1. Effects of aggregate openness on long-term unemployment
Does higher openness to international trade lead to higher or lower long-term unemployment? What does empirical evidence say? A number of empirical studies shed light on this question. If one knows about the link between openness and unemployment one can form expectations about the effects of a proposed trade agreement on unemployment.
This subsection reviews macroeconomic studies which report average effects for larger samples of countries. They do not distinguish through which mechanisms trade openness may have affected labour market outcomes (Section 3).
There exists a plethora of estimates of the trade creating and trade diverting effects of RTAs. Two important meta-analyses synthesize the empirical literature on the effects of trade agreements. Cipollina and Salvatici (2010) find that the average trade effect of RTAs is 0.59 (corresponding to an increase in bilateral trade of about 80 %). Here the average is defined over a total of 1867 estimates of RTA effects (which are themselves averages over different country pairs and RTAs). In more recent work, Head and Mayer (2014) find a similar average effect, even though their sample of estimates is much smaller (257 estimates). The literature tends to find that NAFTA and EU are associated with larger trade effects than other agreements, and that the agreements negotiated by the EU or the US yield larger trade effects than other RTAs in which the EU or the US are not involved.
In general, the average trade effects of RTAs usually reported in empirical studies mask a large degree of heterogeneity between different agreements: deeper and more

Policy Department A: Economic and Scientific Policy
28 PE 578.984
comprehensive ones tend to create more additional trade than more shallow ones (Kohl, 2014).
In a study that looked specifically at the trade effects of the Interim Agreements of the European Union with Eastern European countries (signed between 1992 and 1997), and of the Europe agreements signed subsequently (between 1994 and 1999), Egger and Larch (2011) found additional trade between the EU15 countries and the new partners of between 30 % and 70 % in 1999. The effects vary across country pairs, and a large part of the trade creation is attributable to the Interim Agreements.
Summarizing, past experience very clearly indicates that trade agreements do create trade between its parties. They also lead to trade diversion, but the overall effect on aggregate openness is typically positive. The remaining question is whether there is a robust empirical link between openness and unemployment.
Table 6 uses presents regression results from two prominently published studies (Dutt et al. (2009) [DMR] or Felbermayr et al. (2011) [FPS]) in columns [1] to [2] and replicates the findings of these studies in columns [3] to [5] for more recent data. The difficulty in these analyses lies in the fact that it is very hard to establish the direction of causality: does more trade lead to lower unemployment, or does low unemployment lead to trade expansion? However, there are established statistical techniques, which can be used to sort out causality and which have been applied in the cited work.6
6 Researchers have used sophisticated econometric techniques (instrumental variables). Also, the models include so-called control variables to take out the effects of business cycles and labour market institutions. The estimates refer to long-run effects.
TTIP and Jobs
PE 578.984 29
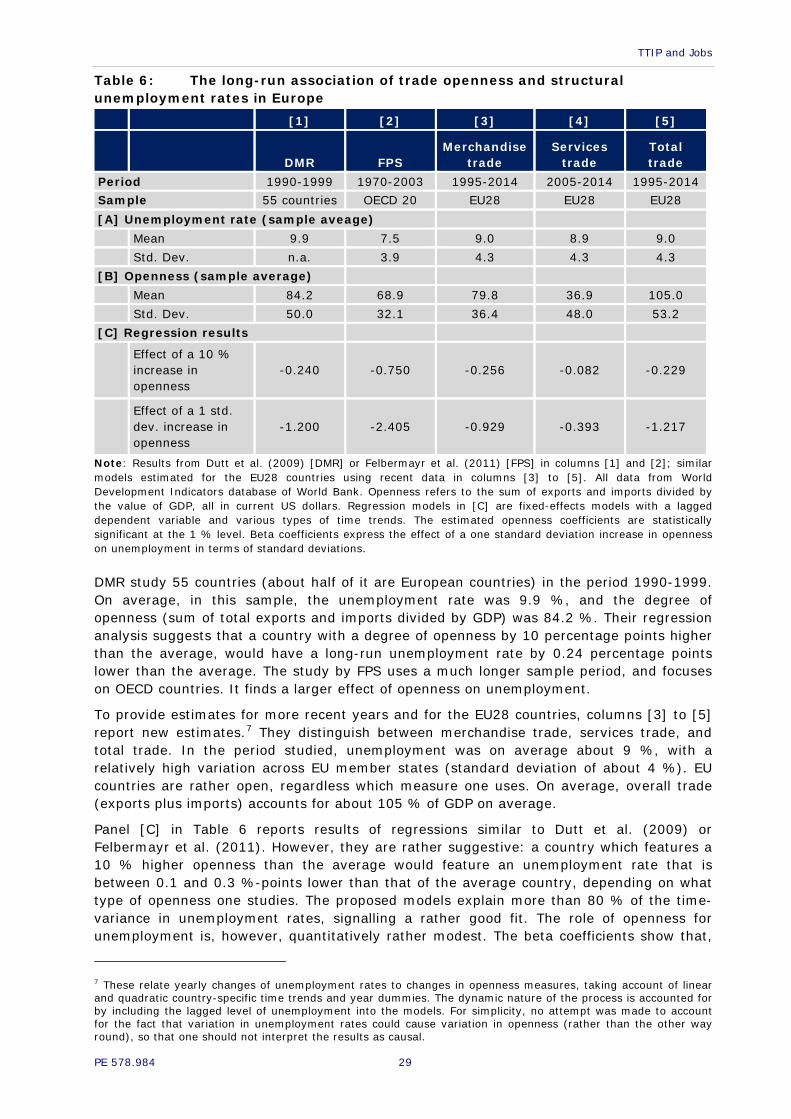
Table 6: The long-run association of trade openness and structural unemployment rates in Europe
[1] [2] [3] [4] [5]
DMR FPS
Merchandise trade
Services trade
Total trade
Period 1990-1999 1970-2003 1995-2014 2005-2014 1995-2014 Sample 55 countries OECD 20 EU28 EU28 EU28 [A] Unemployment rate (sample aveage)
Mean 9.9 7.5 9.0 8.9 9.0
Std. Dev. n.a. 3.9 4.3 4.3 4.3
[B] Openness (sample average)
Mean 84.2 68.9 79.8 36.9 105.0
Std. Dev. 50.0 32.1 36.4 48.0 53.2
[C] Regression results
Effect of a 10 % increase in openness
-0.240 -0.750 -0.256 -0.082 -0.229
Effect of a 1 std. dev. increase in openness
-1.200 -2.405 -0.929 -0.393 -1.217
Note: Results from Dutt et al. (2009) [DMR] or Felbermayr et al. (2011) [FPS] in columns [1] and [2]; similar models estimated for the EU28 countries using recent data in columns [3] to [5]. All data from World Development Indicators database of World Bank. Openness refers to the sum of exports and imports divided by the value of GDP, all in current US dollars. Regression models in [C] are fixed-effects models with a lagged dependent variable and various types of time trends. The estimated openness coefficients are statistically significant at the 1 % level. Beta coefficients express the effect of a one standard deviation increase in openness on unemployment in terms of standard deviations.
DMR study 55 countries (about half of it are European countries) in the period 1990-1999. On average, in this sample, the unemployment rate was 9.9 %, and the degree of openness (sum of total exports and imports divided by GDP) was 84.2 %. Their regression analysis suggests that a country with a degree of openness by 10 percentage points higher than the average, would have a long-run unemployment rate by 0.24 percentage points lower than the average. The study by FPS uses a much longer sample period, and focuses on OECD countries. It finds a larger effect of openness on unemployment.
To provide estimates for more recent years and for the EU28 countries, columns [3] to [5] report new estimates.7 They distinguish between merchandise trade, services trade, and total trade. In the period studied, unemployment was on average about 9 %, with a relatively high variation across EU member states (standard deviation of about 4 %). EU countries are rather open, regardless which measure one uses. On average, overall trade (exports plus imports) accounts for about 105 % of GDP on average.
Panel [C] in Table 6 reports results of regressions similar to Dutt et al. (2009) or Felbermayr et al. (2011). However, they are rather suggestive: a country which features a 10 % higher openness than the average would feature an unemployment rate that is between 0.1 and 0.3 %-points lower than that of the average country, depending on what type of openness one studies. The proposed models explain more than 80 % of the time-variance in unemployment rates, signalling a rather good fit. The role of openness for unemployment is, however, quantitatively rather modest. The beta coefficients show that,
7 These relate yearly changes of unemployment rates to changes in openness measures, taking account of linear and quadratic country-specific time trends and year dummies. The dynamic nature of the process is accounted for by including the lagged level of unemployment into the models. For simplicity, no attempt was made to account for the fact that variation in unemployment rates could cause variation in openness (rather than the other way round), so that one should not interpret the results as causal.

Policy Department A: Economic and Scientific Policy
30 PE 578.984
if openness goes up by one standard deviation (which is almost half of the average openness), then the unemployment rate would go down by between 0.1 and 0.3 standard deviations (also about half of the average levels).
Quantitative studies on the potential effects of TTIP produce estimates of the change in openness due to the agreement. For example, the findings in WTI (2016) imply that openness (as defined in Table 6) could go up by about 6.5 %. The estimates would suggest a decrease in long-term unemployment of about 0.15 percentage points (-0.229*6.5/10). With an average unemployment rate of 9.5 % in 2015 and a total number of approximately 23 million unemployed persons, the hypothesized increase in openness due to TTIP could lead to the net creation of about 360000 jobs for Europe. This number conflicts with the predictions of studies to be surveyed below; however, it gives a first hint on the magnitudes of potential positive effects.
4.2. Effects of existing agreements on aggregate openness
Focusing more narrowly on Europe, Heid and Larch (2014) provide estimates for RTAs in a sample of 28 OECD countries (including 18 EU members) from 1950-2006.8 Using a gravity model of international trade, they show that labour market frictions do not affect the correct design for the estimation of RTA effects, but that they matter for the overall evaluation of the welfare effects of RTAs. Their empirical analysis shows that RTAs increase bilateral trade by 31 % to 41 %, depending on details of statistical methods. This study also presents structural estimates of unemployment effects based on a model of frictional unemployment in which lower costs of international trade can incentivize the creation of additional jobs. This happens because cheaper imported goods are complements to domestic labour. The effects refer to the long-run. Figure 11 shows the results of Heid and Larch (2014). Compared with a counterfactual situation, in which no RTAs were in place, the situation of 2006 featured lower structural unemployment rates in all EU countries included in the analysis. On average, the unemployment reducing effect amounts to about 1.1 %; it tends to be higher in small countries, which depend more on international trade than large ones.
Figure 11: Overall effects of all regional trade agreements (RTAs) in force as of 2006 on structural unemployment rates in European countries (%-points)
Source: Heid and Larch (2014). The estimates refer to the estimated change in unemployment rates brought about by concluding all regional trade agreements that Europe had concluded until 2006.
8 The EU members covered are: Austria, Belgium, Czech Republic, Denmark, Finland, France, Germany, Greece, Hungary, Ireland, Italy, Netherlands, Poland, Portugal, Slovak Republic, Spain, Sweden, United Kingdom.
-1,4
-1,2
-1,0
-0,8
-0,6
-0,4
-0,2
0,0
Uni
ted
King
dom
Ger
man
y
Spai
n
Italy
Gre
ece
Fran
ce
Finl
and
Port
ugal
Pola
nd
Swed
en
Irela
nd
Slov
ak R
epub
lic
Hun
gary
Den
mar
k
Net
herla
nds
Czec
h Re
publ
ic
Aust
ria
Belg
ium
Average
TTIP and Jobs
PE 578.984 31
The results shown in Figure 11 are consistent with the econometric cross-country literature. However, they rely on a specific (but rather conventional) version of labour market model frictions and wage bargaining. Using a less standard model (e.g., in which workers care about wage differentials between them), different results may emerge (e.g., Egger et al., 2013). However, to date, no quantitative analysis of EU trade agreements has been undertaken using such a framework. Consequently, policy makers should treat the evidence with caution as different assumptions lead to different results.
Box 1: Estimating the labour market effects of trade agreements: methodological issues
The scientific literature on the employment effects of trade openness is too large to be surveyed here. There is very little work on the ex-post evaluation of specific trade agreements. The key challenge is that the dynamics of employment and unemployment are driven by many different factors which may correlate both with the timing, structure, or phase-in of a trade agreement and which may be imperfectly observable to the econometrician. Therefore, the few ex-post assessments that do exist all rely on a structural CGE model in which certain assumptions on the functioning of labour markets are made (e.g. perfect competition, perfect labour markets). The standard setup does not allow for involuntary unemployment at all. The study by Heid and Larch (2014) is an exception in that it provides for frictional unemployment. The problem, however, is that the framework utilizes one very specific theoretical channel through which trade affects long-run unemployment, namely the one by Felbermayr et al. (2011a). Other mechanisms, e.g., the one by Carrere et al. (2015) would lead to different results, even if they may not overturn the sign of the results. For this reason, one should not over-interpret the exact magnitudes of estimates.
Studies that relate aggregate unemployment rates on openness measures suffer from the problem that changes in labour market conditions may induce trade policy reform, so that the channel of causation could actually run from unemployment to openness rather than the other way round. Economists have long tried to use variation in openness which is unrelated to policies (such as the component driven by geography). The estimates presented in this section use such instrumental variable strategies. The assumption is that any variation in openness, whether driven by policy or not, has the same effect on labour market outcomes. Whether this is true cannot be empirically tested. Therefore, the results come with a large degree of uncertainty. A cautious and robust interpretation of the literature would be that trade leaves structural unemployment in the long-run unchanged. This is exactly the assumption used in many quantitative simulation models.
The evidence on the employment effects of NAFTA has been discussed in Irvine (2015). At the moment of signing the agreement there were dire warnings of massive job losses (Ross Perot’s famous dictum of the “giant sucking sound”), and proponents of the agreement were expecting strong job gains (+170 000 for the US; see Orme, 1996). Ex post, it is very difficult to attribute actual changes in aggregate employment to NAFTA without the use of a structural model (as in Heid and Larch, 2014). Burtless et al. (1998) use data from the US Department of Labour to show that from 1994 to 1997, that is, over almost four years, at most 140 000 workers were eligible for public adjustment assistance due to the creation of NAFTA. The yearly monthly gross turnover on the US labour market, in contrast, exceeds 2 million workers. Clearly, NAFTA did not cause any substantial job losses in the US. However, in the same period 1994 to 1997, the US economy created about 10 million jobs.

Policy Department A: Economic and Scientific Policy
32 PE 578.984
Short-term effects: possible peak in frictional unemployment In the short-term, trade liberalization can lead to a spike in frictional unemployment, as discussed in Section 3. Dutt et al. (2009) study a large number of (permanent and large) liberalization episodes and find that these are indeed associated with a temporary increase in unemployment. The effect is fairly strong (0.8 percentage points), but it fades away very quickly, too. On average, the net effect on unemployment is already beneficial in the first year after the liberalization episode. However, the empirical result would be entirely consistent with a change in the structure of unemployment towards a larger share of long-term unemployed. Recent empirical results by Autor et al. (2014) show that a substantial fraction of workers displaced by trade shocks can find it very hard to find new employment at all, so that they remain long-term unemployed, or even may decide to quit the labour market.
This evidence is suggestive, but it is based on a large sample of countries, many of which are not European. Also, labour market institutions should play an important role in the short-term adjustment process; in the analysis Dutt et al. (2009), however, they have no conditioning role.

TTIP and Jobs
PE 578.984 33
EX ANTE ANALYSIS OF THE LABOUR MARKET EFFECTS 5.OF TTIP
KEY FINDINGS
• Standard computable general equilibrium (CGE) studies, such as CEPR (2013) predict positive long-term income and trade effects of TTIP resulting from higher economic efficiency for virtually all EU countries. Short-run demand-driven models, such as Capaldo (2014), in contrast, warn that GDP and employment could fall if TTIP reduces aggregate demand. In all studies, effects come almost exclusively from lower costs of non-tariff barriers (NTBs).
• Positive income effects are necessary conditions for TTIP not to have adverse long-run labour market effects. However, the existence of positive income effects goes together with reallocation effects on the labour market. Without short-run adjustment, long-run efficiency gains would be substantially smaller.
• Overall, the extent of reallocation triggered by TTIP will be by an order of magnitude smaller than the usual labour market churning. Nonetheless, ignoring the costs of short-run adjustment costs would unduly inflate the overall economic benefits of TTIP.
• Very few studies explicitly model employment effects. They come to different predictions. Studies focusing on the long-term tend to find zero or positive employment effects; Capaldo (2014) stresses the possibility of short-run employment losses.
• TTIP could lead to higher wage inequality, both by changing the returns to education, but also by widening the wage distribution for workers with similar characteristics. However, most available studies (except Capaldo, 2014) suggest that these effects will be very minor compared with other drivers of wage inequality.
5.1. The potential economic gains from TTIP
The TTIP is likely to be a far and deep reaching agreement. It will have effects on many outcomes, but what matters most for employment growth in the long-run is its impact on the volume of economic activity. However, the size of the economic effect correlates positively with adjustment needs and, thus, with the short-run costs of economic restructuring. Before we discuss mechanisms linking the possible reduction of trade barriers to employment, it is useful to recapitulate the results of some leading studies. While their quantitative predictions may differ quite substantially (see Table 8),9 there is a large degree of consensus across the seemingly different studies.
(i) Virtually all of them agree that TTIP would increase real per capita income in the EU and the US; these gains need time to ramp up but permanently increase the level of per capita income.
(ii) When studies present country-level detail for the EU, they agree that virtually all member states win. This, too, is not a trivial prediction due to possible within-EU trade diversion (terms-of-trade) effects.
(iii) Studies also tend to agree that gains are not huge, but that they are larger than what one could obtain from other realistically pursuable trade agreements.
(iv) All studies concur that the bulk of gains derives from measures in the area of non-tariff barriers, i.e., the simplification of bureaucratic procedures, regulatory convergence, and the optimization of rules.
9 The table only presents a selection of studies which are representative for various approaches in the literature.

Policy Department A: Economic and Scientific Policy
34 PE 578.984
(v) All of them conclude that some third countries would lose from the initiative, unless trade costs for outsiders go down as well due to what is called spillover effects, e.g., by establishing world standards and thus lowering trade costs for outsiders, too. In this case, both outsiders and insiders would see gains from the agreement go up.
All studies except the one by Capaldo (2014) have in common that they are based on computable general equilibrium (CGE) models, that they operate under the presumption of full employment (see discussion of the few exceptions below), and that they refer to the long-run (effects take ten to twelve years to fully materialize). Table 7 provides an overview of assumptions and what they mean for EU-wide effects. Box 2 provides details.
The most important reason for these differences simply is that different modellers have made very different assumptions about what extent of trade cost reductions is feasible in a TTIP agreement. To put it simply, studies that use only specific changes of trade costs that can be directly related to trade policy (bottom-up approach) lead to smaller effects than studies which base the scenario on the observed trade effects of comparable existing agreements which may result not only from the direct but also from the indirect effects of policies (e.g., through public and private investment; top-down approach).
Table 7: Comparison of simulation strudies: Assumptions and broad results
CEPR (2013),
WTI (2016)
ifo / Bertelsmann
(2013)
CEPII (2013)
Aichele et al. (2014)
Egger et al. (2015)
Felbermayr et al.
(2015)
Capaldo (2014)
Assumptions
Time-horizon Long-run Long-run Long-run Long-run Long-run Long-run Short-run
Sector structure multiple single multiple multiple multiple multiple single
Base year 2027 2007 2025 2007 2011 2011 ?
Non-tariff-barriers Bottom-up Top-down Bottom-up Top-down Mix Top-down none
Scenario
Detailed sectoral scenarios, expert-informed
Trade cost reduction as in average existing agreement
Detailed sectoral scenarios, expert-informed
Trade cost reduction as in average existing agreement
Trade cost reduction as in average existing deep agreements
Trade cost reduction as in average existing deep agreements
from CEPR (2013)
Degree of ambition LOW HIGH LOW HIGH MIXED HIGH
from CEPR (2013)
Output market frictions
Imperfect competition in some sectors
Imperfect competition
Imperfect competition
Perfect competition in all sectors
Imperfect competition in some sectors
Imperfect competition
Fixed prices
Labour market frictions
none search frictions, wage bargaining
none none none none Fixed wages
Unemployment NO YES NO NO NO NO NO
Overall effects for EU (main scenario) GDP effect 0.50 % 3.00 % 0.30 % 2.10 % 2.30 % 3.90 % -0.50 %
Wage effec 0.50 % 2.34 % n.a. 2.10 % n.a. 3.90 % n.a.
Jobs n.a. +1.3 mn n.a. n.a. n.a. n.a. -0.6 mn
Source: Data from studies cited in the table. n.a. refers to “not available”.

TTIP and Jobs
PE 578.984 35
Table 8: Potential effects of TTIP on real per capita income, results of selected studies
[1] [2] [3] [4] [5] [6] [7]
CEPR (2013)/WTI
(2016)
ifo / Bertelsmann
(2013)
CEPII (2013)
Aichele et al. (2014)
Egger et al. (2015)
Felbermayr et al.
(2015)
Capaldo (2014)
Spillovers NO YES NO NO NO YES NO YES NO YES n.a.
USA 0.3 0.4 13.4 0.3 2.7 3.4 1.0 1.1 4.9 7.1 0.4
EU 0.4 0.5 3.0. 0.3 2.1 2.7 2.3 3.0 3.9 n.a. -0.4
Germany n.a. 0.6 4.7 0.4 2.6 3.4 1.4 2.3 3.5 7.1 -0.3
France n.a. 0.3 2.6 0.2 2.2 2.0 1.3 1.9 3.5 7.2 -0.5
UK n.a. 0.4 9.7 0.4 2.3 2.8 1.8 2.2 5.1 9.0 -0.1
Italy n.a. 0.5 4.9 n.a. 1.2 1.7 1.5 2.2 3.9 7.7 -0.0
Spain n.a. 0.4 6.6 n.a. 1.2 1.8 0.8 1.4 5.6 9.6 n.a.
Non-TTIP n.a. 0.1 -1.6 n.a. 0.4 1.5 n.a. n.a. -0.9 0.8 n.a.
World n.a. 0.3 3.3 n.a. 1.3 2.2 n.a. n.a. 1.6 3.9 n.a.
Source: Data from studies cited in the table. n.a. refers to “not available”.
Box 2: Economic effects of TTIP: Why do ex ante assessments come to different conclusions?10
Different quantitative trade models on the potential effects of TTIP have produced very different results. These are due to differences in (i) model structure, (ii) measurement of trade costs and non-tariff trade barriers, and (iii) scenario definition.
The role of model structure
All sensible quantitative studies on TTIP have made use of computable general equilibrium (CGE) models which typically describe a multi-country multi-sector world economy under the assumptions of perfect competition and full employment. These models have been useful in identifying vulnerable industries, mapping specific policies into outcomes, and in providing assessments on aggregate variables.
The conventional models, however, have been criticized for underestimating the trade flow effects of agreements (Kehoe, 2005) and the gains from trade. The latter is due to the fact that the standard CGE models do not allow for technological progress, technology adoption or human capital formation, which are all likely to be fostered by better access to global markets and stronger competition. Another element of criticism relates to a poor fit between models and parameter estimation. This has led to the development of “new quantitative trade theory” (NQQT, Ottaviano, 2014); see the seminal articles are Eaton and Kortum (2002) and Anderson and van Wincoop (2003); Costinot and Rodgriguez-Clare (2014) provide an overview. What these new approaches have in common is (i) a simpler, and thus more tractable model structure, (ii) the use of structural relationships generated by the model (such as the gravity equation) to econometrically identify the key parameters (such as trade elasticities), and (iii) scenario definitions for ex ante analysis that are based on the estimates of the treatment effects of comparable existing policies.
CEPR (2013), Aichele et al. (2014) and Egger et al. (2015) have used a multiple-sector model which is in the tradition of the older CGE literature. The ifo-Bertelsmann (2013) study and Felbermayr et al. (2015) have instead used a much simpler single-sector model, but applied the methods used in NQTT.
Multi-sector models have the advantage that they provide insights into the sectoral effects 10 Also see Pelkmans et al. (2014) for a discussion of different modeling philosophies and results.

Policy Department A: Economic and Scientific Policy
36 PE 578.984
of policy changes. Moreover, they capture differences in the structure of comparative advantage of countries; this is important in assessing the strength of trade diversion effects. If one is interested in long-run aggregate effects, the advantages of multi-sector models are less obvious, as the structure of comparative advantage cannot be assumed to be fixed.
In NQTT, multi-sector models are still the exception; see for surveys Head and Mayer, 2014, and Costinot and Rodríguez-Clare, 2014). With the usual assumption of perfect mobility between sectors multi-sector models are comparable to one-sector models in terms of the employment of workers: they are always ideally allocated. Therefore, the single sector view corresponds to the long-run where all structural adjustments have taken place. Additionally, it is consistent with structural changes in the economy that may happen due to TTIP, both in TTIP-member and non-member third countries. For this reason, the economic effects predicted in single sector models are typically larger.
In contrast, market structure does not make much of a difference. Felbermayr et al. (2015) use a monopolist competition model, which is, in many respects, isomorphic to a model with perfect competition; see Costinot and Rodríguez-Clare (2014). Also, the introduction of frictional unemployment (ifo-Bertelsmann, 2013; Heid and Larch, 2014) does not fundamentally change the properties of the model.
The Keynesian model of Capaldo (2014) differs dramatically from the standard approach in trade modeling. It assumes that employment and production are determined by demand conditions only; therefore it takes a short-run perspective (even if results simulated under these premises play out only gradually over time). It is no trade model in the sense that it does not model trade barriers (tariffs, NTMs), and does not per se generate any predictions on trade flows. Capaldo (2014) uses trade flow changes simulated in CEPR (2013) and implements them into the model. Because the results of the model depend entirely on the evolution of the trade balance, this is an important and crucial assumption.
The role of trade costs and non-tariff barriers (NTBs)
Traditional CGE models feature two types of observable trade costs: tariffs (or tariff equivalents of quantitative restrictions) and transportation costs as contained in input-output statistics. Modern approaches include the costs of NTBs (CEPR, 2013, is an excellent example). Putting aside definitional issues in the context of NTBs, there are basically two approaches to measure NTBs: A bottom-up approach, and a top-down approach. CEPR (2013) use the former strategy. It requires an enormous effort on data-collection and expertise to construct an NTB measure from surveys sent to firms and translated into tariff equivalents by researchers. The bottom-up approach requires accurate data for every single bilateral trade link covered in the model. With trade costs set by observational data, researchers have to calibrate expenditure shares to match the model to observed trade data. In contrast, the top-down approach does not postulate that NTBs can be directly measured, but infers them by fitting bilateral trade costs (often in so called ‘iceberg’ form) to the model such that it replicates the baseline trade matrix. Trade costs calibrated this way are typically much larger than those that one can directly observe. This implies that trade policy can have a much bigger potential impact as there are larger barriers to be removed.
The CEPR model differs from the others in that it allows for some NTBs to be not resource consuming but rent-creating (such as a quota would). The other studies assume NTBs consume resources. Reducing such wasteful barriers releases larger economic gains than rent-creating barriers, as there is a direct resource saving effect.
Scenario definition
Probably the quantitatively most important difference across studies is how researchers define the scenario. Typically, the idea is to do a simulation based counterfactual
TTIP and Jobs
PE 578.984 37
experiment: what happens if the model economy, calibrated to the observed (or projected) baseline data, is modified such that trade costs across the Atlantic are reduced. All studies assume that tariffs are fully eliminated. The CEPR study uses an expert-defined trade cost reduction schedule. Other studies use the estimated effects of existing regional trade agreements (RTAs) from an econometric analysis of a gravity model. The assumption is that TTIP lowers EU-US trade costs as much as existing trade agreements have between their member countries. This strategy has the advantage that it does not need to specify by how much NTMs would fall in the proposed agreement, but instead relies on past observed effects of similar RTAs. This approach may lead to under- or overestimation. On the one hand, the official ambition for TTIP is to go deeper than the average existing RTA, which will lead to an underestimation of the potential trade and welfare effects of TTIP when relying on the average effect of RTAs in the past. On the other hand, it is possible that the easy barriers to trade have long been removed across the Atlantic, which will then lead to an overestimation, because many past RTAs substantially lowered tariffs and NTMs. Egger et al. (2015) and Aichele et al. (2014) employ this strategy in a multi-sector setup; this requires the estimation of a large number of separate RTA coefficients, each for one sector. Studies differ in how to deal with the endogeneity of RTAs, what type of RTA to use to inform the exercise, and how to deal with parameter uncertainty. Finally, scenarios may differ regarding the assumption of spillovers, see above.
As a rule of thumb, across model with similar setups (e.g., Egger et al. (2015) and Aichele et al. (2014)), differences in quantitative results are almost entirely driven by differences in the imposed trade cost reductions.
Finally, the choice of base year is important, too. From 2005 to 2015, the relative weight of the transatlantic economy in world GDP has fallen by almost 10 percentage points, and this trend is to continue. Therefore, the earlier the base year, the larger are the potential gains from TTIP as the relative importance of the economy affected by the agreement is higher. This is particularly visible if one compares Ifo (2013) to Felbermayr et al. (2015). The latter study differs from the former in only two respects: it uses 2012 as the baseline year instead of 2007; and it uses a somewhat larger country sample (173 instead of 126 countries). The same scenario generates substantially larger effects in the former than in the latter.
5.2. Sectoral reallocation effects
The CEPR (2013) study uses a very cautious bottom-up approach which leads to a small positive income effect of TTIP; see Table 8. Accordingly, the underlying reallocation of labour from shrinking to expanding sectors is relatively modest. Table 9 and Table 10 shows the implied worker flows for less skilled and more skilled workers calculated from the published employment changes.

Policy Department A: Economic and Scientific Policy
38 PE 578.984
Table 9: Potential reallocation effects of TTIP, less skilled workers, CEPR study
Sectoral
employment shares
Number of jobs (in million.)
Employment change (%)
Employment change,
number of jobs (in thousands)
Agr forestry fisheries 5.4 7.23 0.07 5.06 Other primary sectors 0.6 0.80 -0.02 -0.16 Processed foods 3.7 4.96 0.28 13.88 Chemicals 3.1 4.15 0.08 3.32 Electrical machinery 0.5 0.67 -7.01 -46.95 Motor vehicles 2.4 3.21 1.27 40.83 Other transport equipment 1.2 1.61 -0.23 -3.70 Other machinery 5.2 6.97 0.17 11.84 Metals and metal products 3.3 4.42 -1.62 -71.61 Wood and paper products 3.2 4.29 -0.17 -7.29 Other manufactures 4.4 5.89 0.51 30.06 Water transport 0.3 0.40 0.42 1.69 Air transport 0.4 0.54 0.10 0.54 Finance 2.6 3.48 0.12 4.18 Insurance 0.9 1.21 0.56 6.75 Business services 10.3 13.80 -0.17 -23.45 Communications 1.7 2.28 -0.15 -3.42 Construction 10.6 14.20 0.17 24.14 Personal services 2.7 3.62 -0.05 -1.81 Other services 37.5 50.23 0.05 25.12 Sum 100.00 133.95 0.00** 162.89*
Source: Own calculations based on 2013 employment data from Eurostat and Francois et al. (2013), Table 36. *Total number of jobs reallocated across sectors. ** Numbers do not add exactly due to rounding error.
Table 9 shows that the total number of less skilled jobs reallocated across sectors as predicted by the CEPR simulations is 163 000. The overall number of jobs, by construction, is constant in this framework. The share of reallocated workers in total EU employment of less skilled workers is 0.12 %.
Table 10 turns to more skilled workers and finds that TTIP could trigger the reallocation of about 81 000. This amounts to 0.09 % of total high skilled employment in Europe. Over both skill classes, the total number of displaced workers is about 244 000 (0.11 % of total employment).
Aichele et al. (2014) also presents sectoral employment results. These confirm that the automotive sector could add employment in a significant way, reflecting the comparative advantage that European producers (not only in Germany, but also in the UK and in other countries) enjoy relative to US competitors.11 This expansion requires the reduction of employment in the electrical/electronic sectors, as engineering skills from these sectors are used in the automotive area. The studies also agree in predicting employment gains in “other services”, which include tourism, and negative effects in business services (where the US traditionally has a strong comparative advantage). Both studies also agree that job gains in the machinery sector are positive, but relatively small compared to the prominence that this sector has in negotiations.12 In other areas, the studies diverge: In contrast to CEPR (2013), Aichele (2014) sees job losses in agriculture and in the chemical industry, 11 For a detailed discussion of opportunities and threats in the automotive industry see Kolev and Matthes (2015). 12 For a detailed discussion see Pelkmans (2015).

TTIP and Jobs
PE 578.984 39
where EU producers face higher costs due to natural characteristics, regulatory differences, or the price of essential inputs (e.g., energy).
The numbers in Table 9 and Table 10 may underestimate the true amount of reallocation, because they rely on inter-industry mobility only. They do not reflect the possibility that workers will be moving from shrinking to growing firms within narrowly defined industries. However, since this type of movement is less problematic due to higher portability of skills, the focus on inter-industry effects is defendable.
The CEPR study is extreme in that it predicts only very small efficiency gains from TTIP. Some of the other studies cited in Table 8 calculate larger gains. Almost automatically this implies that reallocation effects need to be much larger, too. Figure 12 provides an illustration based on Aichele et al. (2014). In this study, the overall gains are more than 5 times as big than in the CEPR study; therefore, it is not surprising that the total reallocation of workers is about 2 million (about 0.85 % of total EU employment). In most countries the necessary reallocation affects are below 1 % of total employment; this share is particularly low in France, but substantially higher in Germany.
Table 10: Potential reallocation effects of TTIP, more skilled workers, CEPR study
Sectoral
employment shares
Number of jobs (in million.)
Employment change (%)
Employment change,
number of jobs (in thousands)
Agr forestry fisheries 0.5 0.45 0.07 0.31 Other primary sectors 0.4 0.36 -0.01 -0.04 Processed foods 1.6 1.43 0.28 4.00 Chemicals 2.4 2.14 0.08 1.71 Electrical machinery 0.4 0.36 -7.00 -25.00 Motor vehicles 1.3 1.16 1.28 14.86 Other transport equipment 0.7 0.63 -0.23 -1.44 Other machinery 4.3 3.84 0.18 6.91 Metals and metal products 1.5 1.34 -1.61 -21.57 Wood and paper products 1.6 1.43 -0.16 -2.29 Other manufactures 1.8 1.61 0.52 8.36 Water transport 0.2 0.18 0.43 0.77 Air transport 0.2 0.18 0.11 0.20 Finance 4.1 3.66 0.12 4.39 Insurance 1.5 1.34 0.57 7.64 Business services 16.6 14.82 -0.16 -23.72 Communications 2.6 2.32 -0.14 -3.25 Construction 4.5 4.02 0.18 7.23 Personal services 4.3 3.84 -0.04 -1.54 Other services 49.5 44.20 0.06 26.52 Sum 1.00 89.30 0.00** 80.87*
Source: Own calculations based on 2013 employment data from Eurostat and Francois et al. (2013), Table 34. *Total number of jobs reallocated across sectors. ** Numbers do not add exactly due to rounding error.
Figure 11 plots the share of workers reallocated due to TTIP against the income gains expected from the agreement. It is apparent that higher gains require more reallocation. In that sense, the simulation exercise of Aichele et al. (2014) confirms the intuition that adjustment due to reallocation can be seen as a necessary investment to unlock efficiency gains.

Policy Department A: Economic and Scientific Policy
40 PE 578.984
The reallocation effects occur over time as the effects of the agreement unfold. Assuming a ten year ramp-up period (as most studies to), even the high reallocation requirement of 2 million would spread out over time. Data from Eurostat suggest that the average annual change in employment in the EU manufacturing sector due to natural labour turnover was around 3 %. So, over a ten year period, roughly 30 % of the labour force would have been reallocated. This needs to be compared to the 0.85 % reallocation rate predicted in Aichele et al. (2014) or to the 0.11 % reallocation rate in the CEPR study. Hence, labour turnover induced by TTIP will be by at least 30 times smaller than natural turnover.
Figure 12: Aggregate reallocation in absolute number of persons and as a % of total employment
Source: Aichele et al., (2014), own calculations and illustration.
Figure 13: Aggregate reallocation as a % of total employment and size of economic efficiency gains
Source: Aichele et al., (2014), own calculations and illustration.
Because long-run efficiency gains largely depend on the sectoral reallocation of labour, blocking the restructuring of industries would endanger the overall benefits of TTIP. Also, more detailed sectoral assessments will be possible only once the text of the agreement (including sectoral Annexes, details on rules of origin, etc.) is fully available. At this point, it is possible to alert policy makers that job losses could occur in comparative disadvantage industries such as Electrical machinery / electronics, in business services, and possibly in metals and metal products. Clearly, countries will differ with respect to these effects. Germany, for example, has a competitive metals industry, UK has a very competitive services industry, and so on.
0
1
2
3
4
0
100
200
300
400
GERM
ANY
ITAL
Y
UN
ITED
KIN
GDO
M
SPAI
N
FRAN
CE
POLA
ND
ROM
ANIA
AUST
RIA
BULG
ARIA
PORT
UGA
L
NET
HERL
ANDS
CZEC
H RE
PUBL
IC
LITH
UAN
IA
BELG
IUM
SWED
EN
HUN
GAR
Y
SLO
VAKI
A
GREE
CE
IREL
AND
FIN
LAN
D
DEN
MAR
K
LATV
IA
MAL
TA
SLO
VEN
IA
ESTO
NIA
LUXE
MBO
URG
CYPR
US
Reallocated workers (thousands, left-hand-axis)
Share of reallocated workes in total employment (%, right-hand-axis)
01234
02468
IREL
AND
LITH
UAN
IA
LUXE
MBO
URG
MAL
TA
LATV
IA
BELG
IUM
GERM
ANY
AUST
RIA
UN
ITED
…
FRAN
CE
BULG
ARIA
SLO
VAKI
A
PORT
UGA
L
FIN
LAN
D
DEN
MAR
K
NET
HERL
ANDS
SWED
EN
GREE
CE
POLA
ND
ESTO
NIA
CZEC
H…
HUN
GAR
Y
ITAL
Y
SPAI
N
SLO
VEN
IA
CYPR
US
ROM
ANIA
Per capita income gains (% of baseline, left-hand-axis)
Share of reallocated workes in total employment (%, right-hand-axis)

TTIP and Jobs
PE 578.984 41
Notwithstanding the rather small reallocation needs relative to natural turnover, TTIP will very likely involve some costly adjustment by workers. However, this does not undo the overall economic advantageousness of the agreement. This is illustrated in Figure 14, which is based on the EU-wide per capita income effect of 0.5 % predicted in CEPR (2013). Assuming that the benefits of TTIP build up linearly over 10 years, per capita income would be 0.05 % higher than baseline in the first year. In the second year, it would be 0.1 % higher, and so forth, until it reaches 0.5 % in the 10th year and remains permanently higher by that amount. Using a discount rate of 3 %, results in the green curve in Figure 14.
On the adjustment process, the very pessimistic assumption is used that the full amount of job dislocation (0.11 % of employment) happens immediately and that only after 10 years all workers have found new jobs. With this setup, the adjustment costs in the first year cannot be much more than 0.11 % of GDP. Discounting the costs as before, the red curve in Figure 14 obtains. The black curve adds discounted benefits and costs. With the chosen extremely conservative example, TTIP produces net benefits from year 2 onwards. Summing the net discounted effects for 20 years, one obtains the net present value of TTIP. It is equal to 4.3 % of baseline income. In other words, TTIP is worth an increase in wealth of 4.3 % of baseline GDP.
Figure 14: Gains and adjustment costs of TTIP over time
Source: Own calculation based on the hypothesis of a 10-year adjustment period, total adjustment costs are 0.6 % and permanent income increase is 0.5 % of base-line income, assumed discount rate is 3 %.
-0,1
0
0,1
0,2
0,3
0 1 2 3 4 5 6 7 8 9 10 11 12 13 14 15 16 17 18 19 20
% of yearly base-
line income
years since ratification
Benefits, discounted Adjustment costs, discounted
Net effect, discounted

Policy Department A: Economic and Scientific Policy
42 PE 578.984
5.3. Effects from TTIP on aggregate unemployment
Two studies have allowed for unemployment in the ex-ante assessment of TTIP: the ifo-Bertelsmann study of 2012 and Carrère et al. (2015). The studies differ with respect to the model structure (single-sector versus multi-sector), but they both employ the top-down approach to NTBs. The econometric estimation of the cost reducing effect of TTIP differs quite substantially, however.
In Carrère et al. (2015), sectors differ with respect to their inherent unemployment rates. So, if TTIP reallocates workers from high-unemployment sectors to low-unemployment sectors, aggregate unemployment would fall. In the simulations, this is indeed the case in many countries, but not in others. For example, in Austria, the unemployment rate is predicted to go down from 3.8 % to 3.75 %, while it would increase from 7 % to 7.05 %. Obviously, these changes are very small. Therefore, the predicted number of jobs lost and gained is very small as well. The only EU country in which one can expect major changes is Spain: this country moves out of high-unemployment sectors into low-unemployment sectors (e.g., out of textiles into automotive). Overall, the EU would gain about 102 000 jobs. Out of total employment of 240 million, this is only 0.04 % of base line employment.
The ifo-Bertelsmann study, in contrast, uses a one-sector model, and allows for unemployment to react to the overall efficiency of the economy (see Section 3). The model predicts relatively large employment gains, which are proportional to the (equally large) income gains. For the EU, the study finds an employment gain of 1.35 million jobs. This is equivalent to about 0.5 % of total employment.

TTIP and Jobs
PE 578.984 43
Table 11: Potential aggregate unemployment effects of TTIP, different studies
Carrère et al., 2015 Ifo-Bertelsmann, 2013 Capaldo (2014)
baseline unemploy
-ment rate, % (2008)
% change in
unemploy-ment rate
Additio-nal jobs
baseline unemploy-ment rate, % (2010)
% change in
unemploy-ment rate
Additio- nal jobs
Additio- nal jobs
Austria 3.80 -1.42 2,306 4.39 -6.15 11,638
Belgium 7.00 0.71 -2,379 8.29 -0.97 4,062
Czech Rep. 4.40 -1.01 2,330 7.28 -5.77 22,278
Denmark 3.40 -1.43 1,407 7.46 -6.70 14,623
Estonia 5.50 -1.29 497
Finland 6.30 -1.27 2,179 8.4 -8.93 20,066
France 7.40 0.04 -745 9.36 -4.59 121,566 -130,000
Germany 7.50 0.02 -628 7.06 -6.09 181,092 -134,000
Greece 7.70 -1.39 5,250 12.53 -5.43 34,277
Hungary 7.80 -1.24 4,066 11.16 -4.75 22,613
Ireland 4.60 3.13 -4,418 13.64 -6.16 18,115
Italy 6.70 0.20 -3,333 8.42 -6.77 140,979 -3,000
Netherlands 2.80 1.10 -2,691 4.45 -7.64 29,535
Poland 7.10 -0.82 9,942 9.62 -5.51 93,333
Portugal 7.70 -1.56 6,663 10.79 -7.04 42,521
Slovak Rep.
14.37 -3.34 12,995
Slovenia 4.40 -1.24 568
Spain 8.40 -1.95 50,413 20.06 -3.09 143,098
Sweden 6.30 -1.34 4,045 8.37 -7.77 32,515
UK 5.40 -1.49 26,125 7.75 -16.39 400,203 -3,000
EU19 6.70 -0.56 101,597
1,345,5
-583,000
Source: Carrère et al. (2015) and Felbermayr et al. (2013), own calculations based on ILO unemployment data.
5.4. Keynesian perspectives
Finally, it is necessary to discuss a simulation study by Capaldo (2014) which predicts large job losses in Europe result of the TTIP agreement. The analytical framework that underlies this study is a macroeconomic model without the microeconomic mechanisms typical of trade models. It has no equations or variables to deal with trade policy, trade barriers or structural change. It assumes that the agreement leads to lower labour demand at constant wages. By doing so, the model predetermines job losses. The model would actually predict mass unemployment and recession from any reform that would reduce red tape. Serious concerns about the credibility of the Capaldo paper have been raised by Bauer and Erixon (2015, see also Chapter 3 of this study).
5.5. Possible wage and income inequality effects from TTIP
The CEPR (2013) and its extension – WTI (2016) – are the only studies that provide some estimation on the wage effects of TTIP in the low-skilled and the high-skilled labour market segments. Table 12 presents the effects.
Since the predicted GDP effects are relatively small, wage changes are modest as well. Note that they typically lie slightly below the GDP changes, so that the overall labour share in the economy would marginally fall.
Not surprisingly, given relatively similar wage and endowment structures of the trade partners, TTIP would only have extremely small effects on inequality.

Policy Department A: Economic and Scientific Policy
44 PE 578.984
Both types of workers are predicted to see wage changes of the same sign, except in 3 countries out of the 28 EU members. That is, both types of workers benefit. In ten out of 28 countries, low-skilled workers benefit less than high-skilled ones, so that inequality goes up. In 15 countries the contrary is true.
If one assumes larger trade cost reducing effects, TTIP will result in higher income gains, but it would not necessarily generate stronger effects on inequality. The reason is that the low inequality effects are driven by the fact that both partners have very similar structures of comparative advantage. This is independent of the magnitude of assumed trade cost reductions. Also, the sign patterns are unlikely to change: inequality goes up in some countries, but goes down in others.
The analysis in WTI (2016) relies on changes in returns to education (skills) only. As discussed in Section 3, more recent literature stresses the role of inequality within groups of similar workers. As shown by Felbermayr et al. (2014) for Germany, trade liberalization can affect this type of inequality as well. If TTIP creates winners and losers amongst firms, it will also create winners and losers amongst workers who differ only regarding their employer.
Table 12: Wage and distribution effects of TTIP in % (real magnitudes)
GDP Low-skilled wages
High-skilled wages
Austria 0.9 0.84 0.76 Belgium 1.1 1.08 1.01 Bulgaria 0.3 0.14 0.17 Croatia 0.2 0.19 0.23 Cyprus 0.6 0.51 0.52 Czech Republic 0.1 -0.07 0.03 Denmark 0.4 0.50 0.48 Estonia 0.1 -0.22 0.05 Finland 0.2 0.36 0.34 France 0.3 0.31 0.30
Germany 0.6 0.57 0.55
Greece 0.4 0.31 0.28
Hungary 0.1 0.09 0.21
Ireland 1.3 1.49 1.44 Italy 0.5 0.43 0.43 Latvia 0.4 0.42 0.37 Lithuania 1.6 1.42 1.32 Luxembourg 0.7 0.43 0.64 Malta -0.3 0.69 0.69 Netherlands 0.5 0.52 0.50 Poland 0.4 0.23 0.13 Portugal 0.4 0.36 0.35
Romania 0.2 -0.02 0.05 Slovakia 0.5 0.34 0.36 Slovenia 0.4 0.38 0.35 Spain 0.4 0.24 0.24 Sweden 0.5 0.53 0.48 United Kingdom 0.4 0.39 0.42 EU 28 0.5 0.51 0.50
Source: World Trade Institute (2016). Estimates are based on the CEPR (2013) model.

TTIP and Jobs
PE 578.984 45
POLICY OPTIONS 6.
KEY FINDINGS
• Generally, policies should facilitate the smooth and rapid adjustment of labour markets following TTIP. They should not block or hinder adjustment, as this would destroy the efficiency gains that the trade agreement is supposed to deliver.
• Unemployment insurance and active labour market policies can take care of the adjustment needs generated by TTIP.
• It is hard to find arguments based on efficiency or equity concerns that would justify special policy programs to deal with adjustment induced by trade policy. However, since adjustment costs and benefits from TTIP are not distributed evenly across countries, some use of EU funds to facilitate adjustment may be justified.
6.1. Labour market policies: flexicurity
In the face of adjustment needs – induced by trade liberalization or by something else – it is more efficient to protect workers rather than jobs. Policies that make the restructuring of economies more costly, e.g., by making employment adjustment at the firm-level difficult – reduce the gains from a more efficient allocation of workers across industries or firms. Thus, institutions and policies that facilitate flexibility but provide income security to the worker (e.g., through generous short-term unemployment benefits) are preferred to strict employment protection legislation.
Many EU member states have well-developed unemployment insurance systems which are well-suited to cushion a possible temporary surge in joblessness triggered by TTIP. They also have various active labour market programs which are designed to smooth adjustment processes regardless of their root cause. Legislators should make sure that these instruments of “flexicurity” are adequately financed, regularly evaluated, and adjusted to the changing needs of the labour market.
6.2. Trade adjustment programs
The main labour market challenge of TTIP relates to the management of the adjustment process. Workers will need to relocate from shrinking firms and sectors to growing ones. It is not obvious that such costly adjustment requires special policy action. On the one hand labour markets are prone to various inefficiencies which may warrant government action. These range from excessive market power of employers (in so called monopsonistic labour markets), to asymmetric information, and imperfect contractibility. Moreover, policy action may also be justified by equity motives.
On the other hand, why would trade-induced adjustment warrant special treatment compared to adjustments induced by new domestic regulation, by technological change, or by shifts in demand structures? This would only be the case if trade-related reallocation presents specific economic features that other types of reallocation do not share. This is questionable.
Special trade adjustment assistant programs, for example in the form of the European Globalization Adjustment Fund (EGF), may be necessary for political economy reasons as trade-induced reallocations are perceived as particularly unfair. It may be sensible to set up a special programme to deal with disruptions due to TTIP.
Finally, adjustment costs and benefits from TTIP are not always distributed evenly across countries. Reallocation needs will most likely not be evenly spread across the EU; according to one study, adjustment needs could be relatively more substantial in small countries such as Malta, Lithuania, or Bulgaria (Aichele et al, 2014). To facilitate the smooth functioning of social security systems, and to reduce possible divergences amongst EU member countries, these countries should have access to temporary assistance from central EU funds.
Policy Department A: Economic and Scientific Policy
46 PE 578.984
REFERENCES • Aichele, R., G. Felbermayr, and I. Heiland (2014). Going Deep: The Trade and Welfare
Effects of TTIP, CESifo Working Paper No. 5150.
• Anderson, J. E., and van Wincoop, E. (2003), Gravity with Gravitas: A Solution to the Border Puzzle, American Economic Review 93(1): 170-192.
• Arpaia, A., A. Kiss, and A. Turrini (2014). Is unemployment structural or cyclical? Main features of job matching in the EU after the crisis, Economic Papers 527, EU Commission.
• Arto I., Rueda-Cantuche, J.M., Amores, A. F., Dietzenbacher, E., Sousa, N., Montinari and Markandya, A. (2015). EU Exports to the World: Effects on Employment and Income. Luxembourg: Publications Office of the European Union.
• Autor, D. H., Dorn, D. and Hanson, G. H. (2013). The China syndrome: Local labour market effects of import competition in the united states, American Economic Review 103(6): 2121–68.
• Autor, D. H., Dorn, D., Hanson, G. H. and Song, J. (2014). Trade adjustment: Worker level evidence, Quarterly Journal of Economics 129(4): 1799-1860.
• Badinger, H. (2007). Has the EU’s Single Market Programme fostered competition? Testing for a decrease in markup ratios in EU industries, Oxford Bulletin of Economics and Statistics 69(4): 497-519.
• Bassanini, A., Duval, R. (2006). Employment Patterns in OECD Countries: reassessing the roles of policies and institutions. OECD Economics Department Working Paper No. 486.
• Bassanini, A., Duval, R. (2009). Unemployment, institutions and reform complementarities: re-assessing the aggregate evidence for OECD countries. Oxford Review of Economic Policy 25, 40–59.
• Bauer, M., and F. Erixon (2015). „Splendid Isolation” as Trade Policy: Mercantilism and Crude Keynesianism. ECIPE Occasional Paper 03/2015.
• Baumgarten, D., (2013). Exporters and the rise in wage inequality: Evidence from German linked employer-employee data. Journal of International Economics 90 (1): 201-217.
• Bernard, A. B., and J. B. Jensen (1997), Exporters, skill upgrading, and the wage gap, Journal of International Economics, 42(1-2), 3-31.
• Bertola, G., T. Boeri, and G. Nicoletti (2001), Welfare and Employment in a United Europe, MIT Press.
• Blanchard, O., and F. Giavazzi (2003). Macroeconomic effects of regulation and deregulation on product and labour markets. Quarterly Journal of Economics 118 (3), 879–907.
• Brecher, R. (1974). Minimum Wage Rates and the Pure Theory of International Trade. Quarterly Journal of Economics 88, 98-116.
• Bureau, J.-C., A.-C. Disdier, C. Emlinger, G. Felbermayr, L. Fontagné, J. Fouré and S. Jean (2014). Risks and Opportunities for the EU Agri-Food Sector in a Possible EU-US Trade Agreement, Study for the European Parliament IPBAGRIIC2013_129.
• Burtless, G., R. Lawrence, R. Litan, R. Shapiro (1998), Globaphobia: Confronting Fears about Open Trade, Washington, D.C.: Brookings Institution.

TTIP and Jobs
PE 578.984 47
• Capaldo, J. (2014). TTIP: European Disintegration, Unemployment and Instability, GDAE Working Paper No. 14-03.
• Carrère, C., A. Grujovic, and F., Robert-Nicoud (2015). Trade and frictional unemployment in the global economy, CEPR Discussion Paper 10692.
• Corcos, G., M. del Gatto, G. Mio, and G.I.P. Ottaviano (2012). Productivity and Firm Selection: Quantifying the 'New' Gains from Trade, Economic Journal 122-561: 754-798.
• Costinot, A. and Rodriguez-Clare, A. (2014), Trade Theory with Numbers: Quantifying the Consequences of Globalization, Chapter 4 in Gopinath, Helpman and Rogoff, Elsevier (eds.), The Handbook of International Economics, 197-261.
• Davidson, C., L. Martin and S. Matusz (2006). Long-run Lunacy, Short-run Sanity: A Simple Model of Trade with Labour Market Turnover, Review of International Economics, 14 (2) (May, 2006), pp. 261-276.
• Davis, D. (1998). Does European Unemployment Prop Up American Wages? National Labour Markets and Global Trade, American Economic Review 88, 478-494.
• Dauth, W., S. Findeisen, und J. Südekum (2014). The Rise of the East and the Far East: German Labour Markets and Trade Integration, Journal of the European Economic Association 12 (6): 1643-1675.
• Dickens, W., L. Götte, E. Groshen, S. Holden, J. Messina, M. Schweitzer, J. Turunen, M. Ward (2006). How Wages Change: Micro Evidence from the International Wage Flexibility Project, ECB Working Paper 697.
• Dutt, P., D. Mitra und P. Ranjan (2009). International Trade and Unemployment: Theory and Cross-National Evidence, Journal of International Economics 78(1): 32-44.
• Eaton, J. and S. Kortum (2002). Technology, Geography, and Trade, Econometrica 70: 1741-1779.
• European Commission (2016). Trade SIA on the Transatlantic Trade and Investment Partnership (TTIP) between the EU and the USA, Draft Interim Technical Report, (carried out by Ecorys). http://www.trade-sia.com/ttip/wp-content/uploads/sites/6/2014/02/TSIA-TTIP-draft-Interim-Technical-Report.pdf.
• Egger, P., and M. Larch (2011). An Assessment of the Europe Agreements’ Effects on Bilateral Trade, GDP, and Welfare, European Economic Review 55: 263-279.
• Egger, H. , P. Egger, and U. Kreickemeier (2013). Trade, Wages, and Profits, European Economic Review 64(1): 332-350.
• Egger, P., J. Francois, M. Machin, und D. Nelson (2015). Non-tariff barriers, integration, and the transatlantic economy, Economic Policy 30 (83): 539-584.
• European Commission, 2006. “Global Europe: Competing in the World. A Contribution to the EU’s Growth and Jobs Strategy”, http://trade.ec.europa.eu/doclib/docs/2006/october/tradoc_130376.pdf.
• Feenstra, R., 2004, “Advanced International Trade: Theory and Evidence”, Princeton University Press.
• Felbermayr, G., B. Heid, M. Larch und E. Yalcin (2015). Macroeconomic potentials of transatlantic free trade: a high resolution perspective for Europe and the world, Economic Policy 30 (83): 491-537.
• Francois, J., M. Manchin, H. Norberg, O. Pindyuk and P. Tomberger (2013). Reducing Transatlantic Barriers to Trade and Investment: An Economic Assessment, Report TRADE10/A2/A16 for the European Commission. [CEPR (2013)].

Policy Department A: Economic and Scientific Policy
48 PE 578.984
• Felbermayr, G. and M. Larch (2013). The Transatlantic Trade and Investment Partnership (TTIP): Potentials, Problems and Perspectives, CESifo Forum 14(2), 49–60.
• Felbermayr, G., W. Kohler, R. Aichele, G. Klee, and E. Yalcin (2015). Mögliche Auswirkungen der Transatlantischen Handels- und Investitionspartnerschaft (TTIP) auf Entwicklungs- und Schwellenländer, ifo Forschungsberichte 67, ifo Institut.
• Felbermayr, G., M. Larch, F. Krüger, L. Flach, E. Yalcin, and S. Benz (2013). Dimensionen und Auswirkungen eines Freihandelsabkommens zwischen der EU und den USA, ifo Forschungsberichte 62, Ifo Institute.
• Felbermayr, G., B. Heid, and S. Lehwald (2013). Transatlantic Trade and Investment Partnership (TTIP). Who benefits from a free trade deal? Part 1: Macroeconomic Effects, Bertelsmann Stiftung, Gütersloh [ifo / Bertelsmann, 2013].
• Felbermayr, G., S. Lehwald, U. Schoof, and M. Ronge (2013). States, Branches of industry, and Education Levels. Who Will Benefit in Germany from a Transatlantic Trade and Investment Partnership (TTIP)? Final Report, Part 2: Microeconomic Effects in Germany, Bertelsmann Stiftung, Gütersloh.
• Felbermayr, G., J. Prat and H.-J. Schmerer (2011a). Globalization and labour market outcomes: Wage bargaining, search frictions, and firm heterogeneity, Journal of Economic Theory 146(1), 39-73.
• Felbermayr G., J. Prat und H.-J. Schmerer (2011b). Trade and Unemployment: What Do the Data Say?, European Economic Review 55 (6): 741–758.
• Felbermayr, G., and J. Prat (2013). Efficiency Gains from Trade and Labour Market Outcomes, Nordic Economic Policy Review 1, 45-71.
• Felbermayr, G., M. Larch, and W. Lechthaler (2012). Endogenous Labour Market Institutions in an Open Economy, International Review of Economics and Finance 23: 30–45.
• Fontagné, L., J. Gourdon, and S. Jean (2013). Transatlantic Trade: Whither Partnership, Which Economic Consequences?, CEPII Policy Brief 2013-01 [CEPII, 2013].
• Gelübcke, John Weche (2013). The performance of foreign affiliates in German manufacturing: evidence from a new database, Review of World Economics 149(1): 151-182.
• Häberli, C., M. Janssen, and J.-A., Monteiro (2012). Regional Trade Agreements and Domestic Labour Market Regulation, In: Lippoldt, D. (ed.), Policy Priorities for International Trade and Jobs, OECD, Paris.
• Head, K. and Mayer, T. (2014), Gravity Equations: Workhorse, Toolkit, and Cookbook, Chapter 3 in Gopinath, Helpman and Rogoff, Elsevier (eds.), The Handbook of International Economics, Vol. 4, 131-195.
• Heid, B. and M. Larch (2014). International Trade and Unemployment: A Quantitative Framework, CESifo Working Paper 4013.
• Helpman, E., and O. Itskhoki (2010). Labour Market Rigidities, Trade and Unemploy- ment, Review of Economic Studies 77, 1100-1137.
• Heydon, K. (2015). TTIP: Challenges and Opportunities in the Area of Service”, Study for the EU Parliament (IP/A/IMCO/2014-14, PE 563.443).
• Irvine, D. (2015). Free Trade Under Fire, Princeton University Press, 4th edition.
• Kehoe, T. J., K. K. Ruhl, and J. B. Steinberg (2013). Global Imbalances and Structural Change in the United States. NBER Working Paper No. 419. Cambridge: National Bureau of Economic Research.

TTIP and Jobs
PE 578.984 49
• Kohl, T. (2014). Do we really know that trade agreements increase trade? Review of World Economics 150(103): 443-469.
• Kolev, G., and J. Matthes (2015). TTIP: Motor Vehicles, Study for the EU Parliament (IP/A/IMCO/2014-14, PE 542.234).
• Krugman, P. R. (1993). What Do Undergrads Need To Know About Trade, American Economic Review Papers and Proceedings 83(2): 23-26.
• Melitz, M., and G. Ottaviano (2008). Market Size, Trade, and Productivity. Review of Economic Studies 75: 295-316.
• OECD (Organization for Economic Cooperation and Development), ILO (International Labour Organization), World Bank, and WTO (World Trade Organization). 2010. Seizing the Benefits of Trade for Employment and Growth. Paris.
• Orme, W. (1996). Understanding NAFTA: Mexico, Free Trade, and the New North America, Austin: University of Texas Press.
• Ottaviano, G. I. P. (2014). European Integration and the Gains from Trade, CEP Discussion Paper No 1301.
• Pelkmans, J., A. Lejour, L. Schrefler, F. Mustilli, and J. Timini (2014), EU-US Transatlantic Trade and Investment Partnership, Study for European Parliamentary Research Service.
• Pelkmans, J. (2015). TTIP: Engineering, including Machinery, Study for the EU Parliament (IP/A/IMCO/2014-14, PE 542.233).
• Potrafke, N. (2015). The evidence on globalization, World Economy 38(3): 509-552.
• Rodrik, D. (1998). Why Do More Open Economies Have Bigger Governments?, Journal of Political Economy 106(5), 997-1032.
• Romer, D. (2011). Advanced Macroeconomics. McGraw Hill, Columbus (OH).
• Sala, L., U. Söderstrom, A. Trigari (2013). Structural and Cyclical Forces in the Labour Market during the Great Recession: Cross-Country Evidence, In: Giavazzi, F., and K. West (eds.), NBER International Seminar on Macroeconomics 2012.
• World Trade Institute (2016). TTIP and the EU Member States, World Trade Institute, University of Bern, Bern, January 2016 [WTI, 2016].

Policy Department A: Economic and Scientific Policy
50 PE 578.984
ANNEX

TTIP and Jobs
PE 578.984 51
NOTES
