director of agriculture agriculture department, government of gujarat
TRANSCRIPT

11the Meeting of General Council of National Food
Security Mission
Director of Agriculture
Agriculture Department, Government of Gujarat
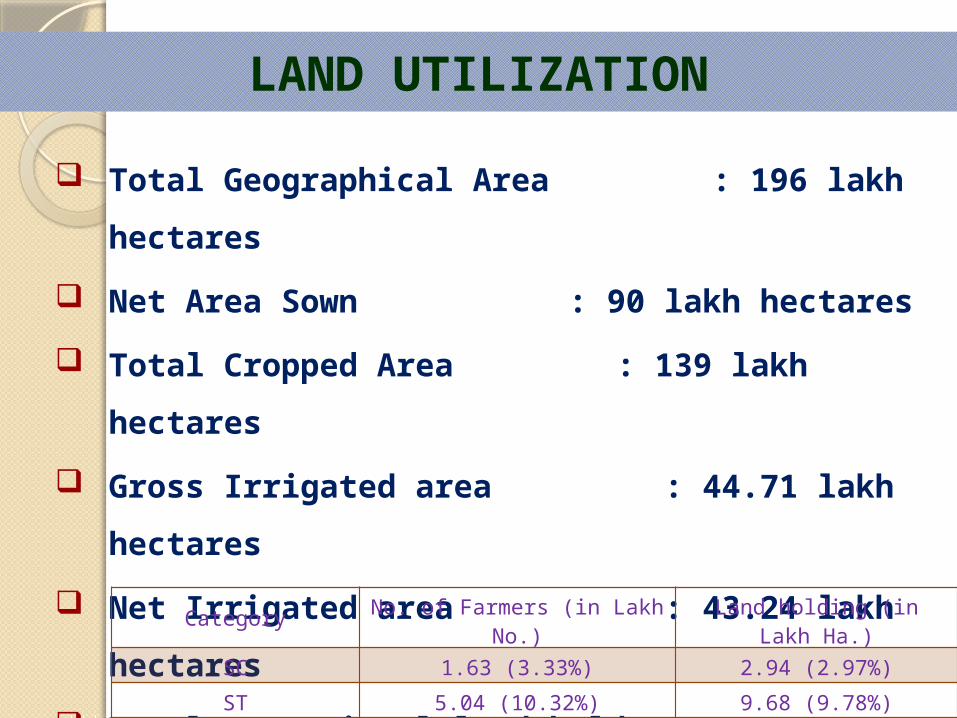
Total Geographical Area : 196 lakh
hectares
Net Area Sown : 90 lakh
hectares
Total Cropped Area : 139 lakh
hectares
Gross Irrigated area : 44.71 lakh
hectares
Net Irrigated area : 43.24 lakh
hectares
Total Operational land holder : 48.86 lakh
Average land holding : 2.03 ha
LAND UTILIZATION
Category No. of Farmers (in Lakh No.) Land holding (in Lakh Ha.)
SC 1.63 (3.33%) 2.94 (2.97%)
ST 5.04 (10.32%) 9.68 (9.78%)

Total Operational land holder :
48.86 lakh
Average land holding : 2.03
ha.
Category wise Land Holding
Agriculture Census 2010-11 ,
LAND HOLDING STATUS
Marginal18.16 Lakh
37%
Small14.29 Lakh
29%
Semi Medium10.80 Lakh
22%
Medium5.13 Lakh11%
Large0.49 Lakh
1%
SC ST General0
102030405060708090
100
1.63 (3.33%)
5.04 (10.32%)
42.19 (86.35%)
2.94 (2.97%)9.68 (9.78%)
86.36 (87.25%)
No .of Farmers in Lakh Land Holding in Lakh Ha.
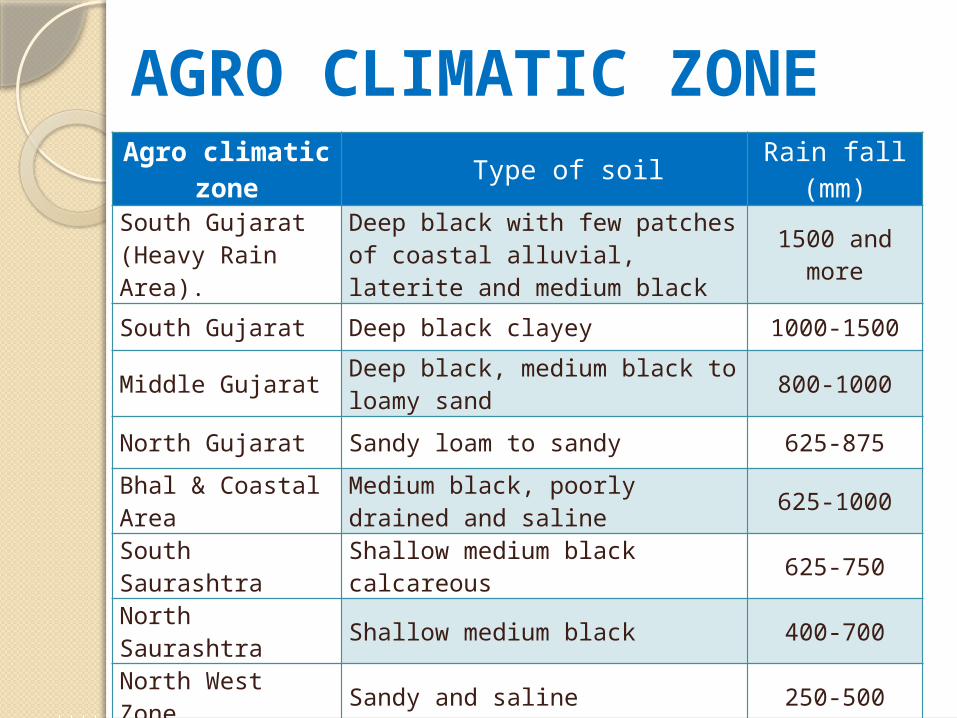
Agro climatic zone
Type of soil Rain fall (mm)
South Gujarat (Heavy Rain Area).
Deep black with few patches of coastal alluvial, laterite and medium black
1500 and more
South Gujarat Deep black clayey 1000-1500
Middle Gujarat Deep black, medium black to loamy sand 800-1000
North Gujarat Sandy loam to sandy 625-875
Bhal & Coastal Area
Medium black, poorly drained and saline 625-1000
South Saurashtra Shallow medium black calcareous 625-750
North Saurashtra Shallow medium black 400-700
North West Zone Sandy and saline 250-500
AGRO CLIMATIC ZONE

Kharif • Cotton• Ground Nut• Sesame• Castor• Paddy• Bajara• Maize• Tur• Mung
Rabi / Summer
• Wheat• Paddy• Maize• Mustard• Gram• Ground nut• Bajara• Mung• Sugarcane
Horticulture
• Mango• Banana• Chicku• Pomegranate• Vegetables• Seed Spices
CROPPING PATTERN
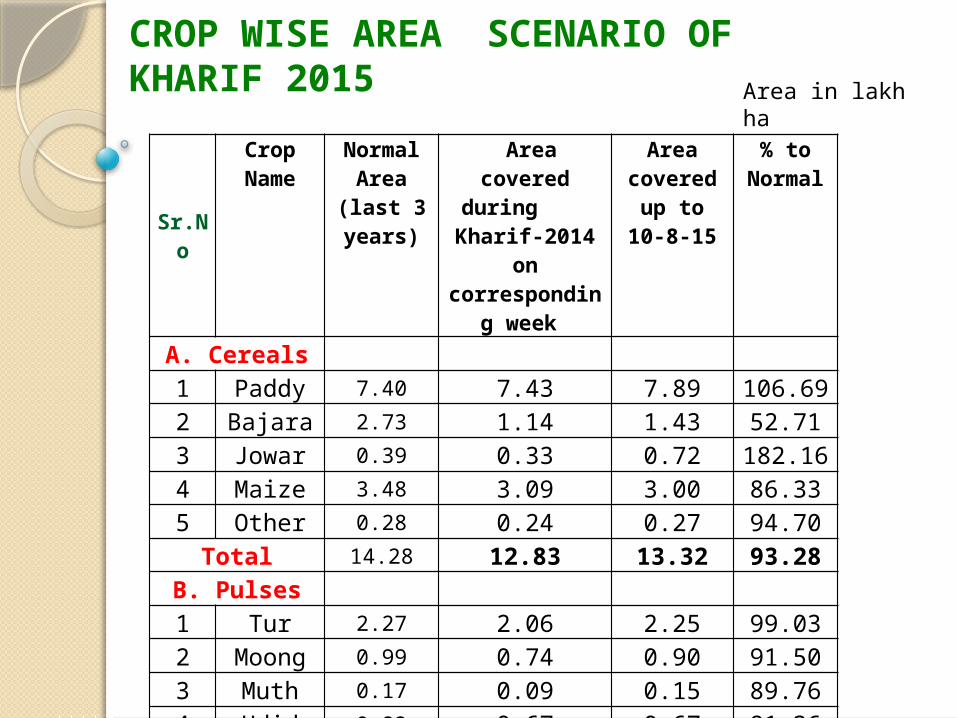
CROP WISE AREA SCENARIO OF KHARIF 2015
Area in lakh ha
Sr.No
Crop Name
Normal Area (last 3
years)
Area covered during Kharif-
2014 on corresponding
week
Area covered up to 10-8-15
% to Normal
A. Cereals1 Paddy 7.40 7.43 7.89 106.692 Bajara 2.73 1.14 1.43 52.713 Jowar 0.39 0.33 0.72 182.164 Maize 3.48 3.09 3.00 86.335 Other 0.28 0.24 0.27 94.70
Total 14.28 12.83 13.32 93.28B. Pulses1 Tur 2.27 2.06 2.25 99.032 Moong 0.99 0.74 0.90 91.503 Muth 0.17 0.09 0.15 89.764 Udid 0.82 0.67 0.67 81.365 Other 0.17 0.12 0.09 53.22
Total 4.41 3.69 4.06 91.93

Achievements of State in Food Grain Production during 2014-15
* Year 2014-15 APY as per Fourth estimate
CROP Area (000 ha)
Production(000 M.Tons)
Productivity Kg/Ha
Rice 785 1636 2085
Jowar 74 93 1257
Bajra 457 954 2088
Maize 423 672 1589
Ragi 20 18 919
Other cereals 31 32 1036
Total Cereal 1790
3406 1903
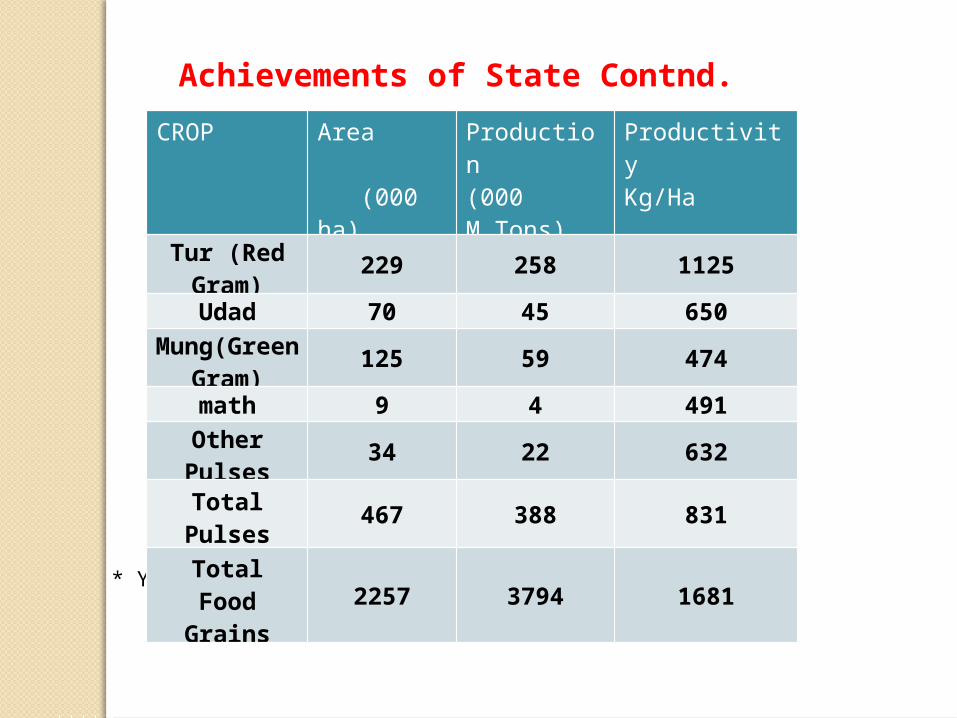
Achievements of State Contnd.
* Year 2014-15 APY as per Fourth estimate
CROP Area (000 ha)
Production(000 M.Tons)
Productivity Kg/Ha
Tur (Red Gram)
229 258 1125
Udad 70 45 650Mung(Green
Gram)125 59 474
math 9 4 491
Other Pulses 34 22 632
Total Pulses 467 388 831
Total Food Grains 2257 3794 1681
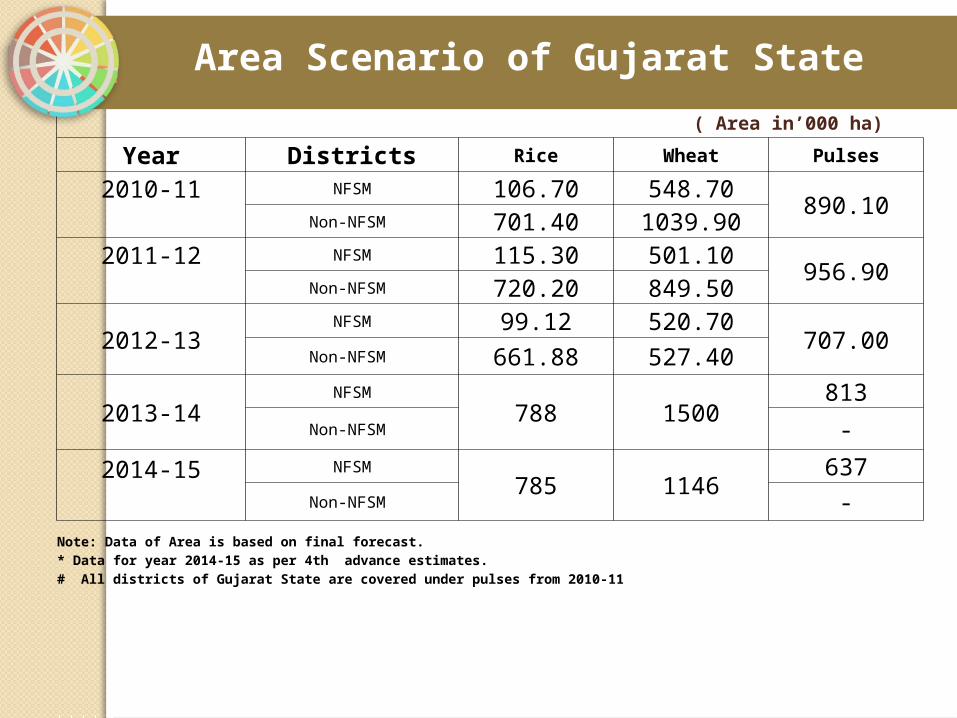
( Area in’000 ha) Year Districts Rice Wheat Pulses
2010-11
NFSM 106.70 548.70890.10
Non-NFSM 701.40 1039.902011-12
NFSM 115.30 501.10
956.90Non-NFSM 720.20 849.50
2012-13NFSM 99.12 520.70
707.00Non-NFSM 661.88 527.40
2013-14NFSM
788 1500813
Non-NFSM -
2014-15
NFSM785 1146
637Non-NFSM -
Note: Data of Area is based on final forecast.* Data for year 2014-15 as per 4th advance estimates.# All districts of Gujarat State are covered under pulses from 2010-11
Area Scenario of Gujarat State
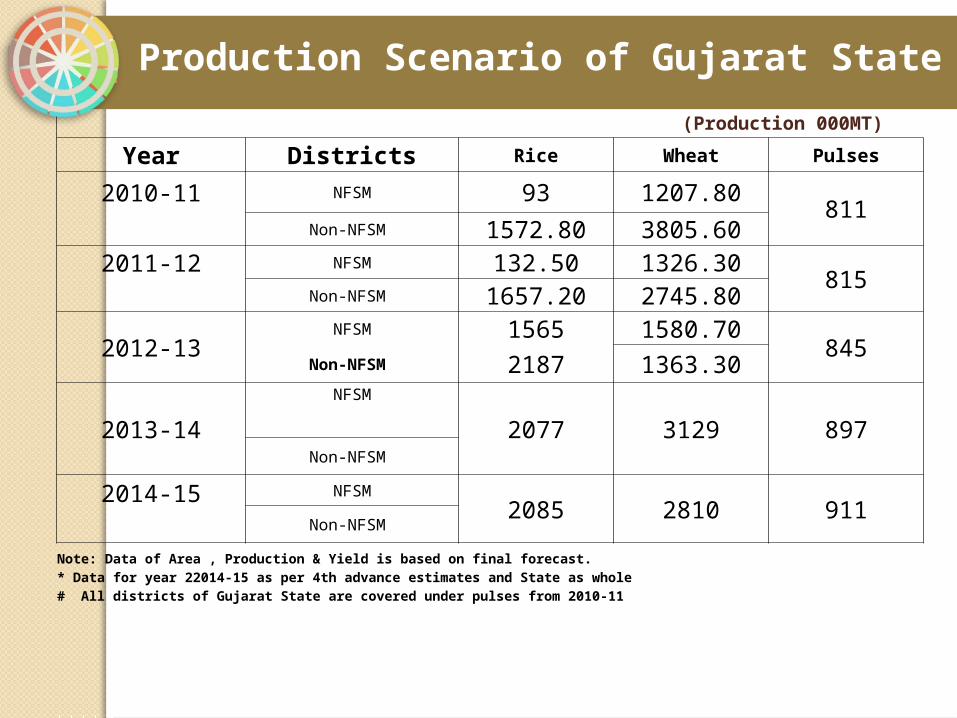
(Production 000MT) Year Districts Rice Wheat Pulses
2010-11
NFSM 93 1207.80811
Non-NFSM 1572.80 3805.602011-12
NFSM 132.50 1326.30
815Non-NFSM 1657.20 2745.80
2012-13NFSM 1565 1580.70
845Non-NFSM 2187 1363.30
2013-14
NFSM
2077 3129 897Non-NFSM
2014-15
NFSM2085 2810 911
Non-NFSM
Note: Data of Area , Production & Yield is based on final forecast.* Data for year 22014-15 as per 4th advance estimates and State as whole# All districts of Gujarat State are covered under pulses from 2010-11
Production Scenario of Gujarat State
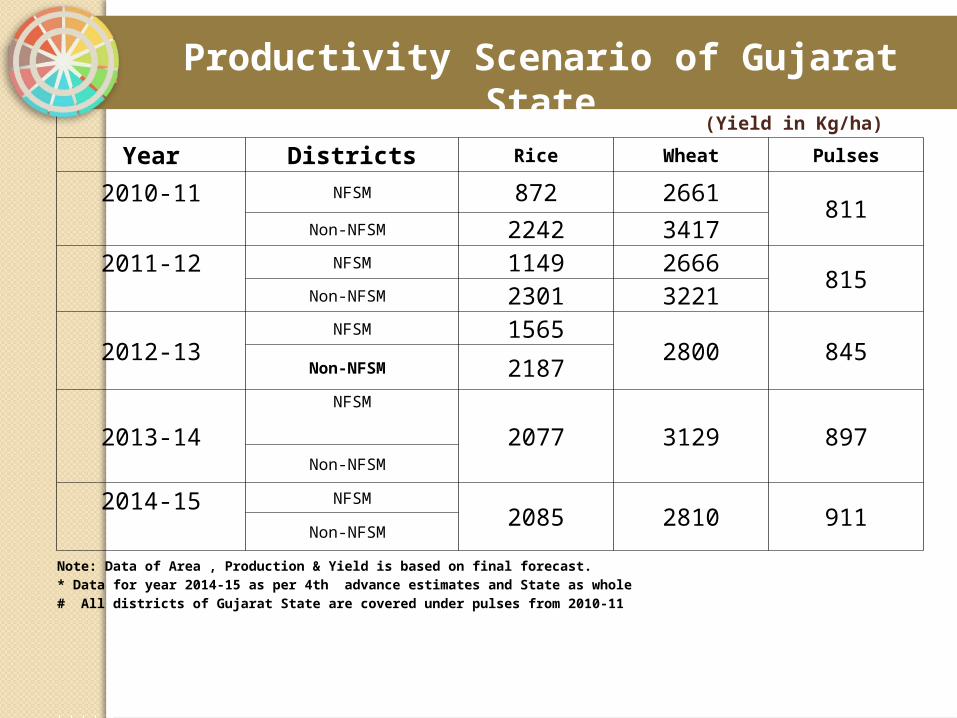
(Yield in Kg/ha) Year Districts Rice Wheat Pulses
2010-11
NFSM 872 2661811
Non-NFSM 2242 34172011-12
NFSM 1149 2666
815Non-NFSM 2301 3221
2012-13NFSM 1565
2800 845Non-NFSM 2187
2013-14
NFSM
2077 3129 897Non-NFSM
2014-15
NFSM2085 2810 911
Non-NFSM
Note: Data of Area , Production & Yield is based on final forecast.* Data for year 2014-15 as per 4th advance estimates and State as whole# All districts of Gujarat State are covered under pulses from 2010-11
Productivity Scenario of Gujarat State

Crop-wise Area of pulses 2010-11 to 2014-15
Sr. No.
CropArea (In 000’ Ha)
2010-11
2011-12
2012-13
2013-14
2014-15
1 Gram 175 240 136 247 169
2 Tur 277 244 228 210 229
3 Moong 177 266 115 183 129
4 Urad 102 103 95 91 70
5
Other
Pulses34 58 37 52
34

Crop-wise Production of pulses 2010-11 to 2014-15
Sr. No.
CropProduction (In 000’ MT)
2010-11
2011-12
2012-13
2013-14
2014-15
1 Gram 199 273 133 309 169
2 Tur 273 258 270 209 258
3 Moong 89 121 52 106 129
4 Urad 69 72 60 56 46
5
Other
Pulses17 34 22 35
27

Crop-wise Yield of pulses 2010-11 to 2014-15
Sr. No.
CropYield (In 000’ Kg/ha)
2010-11
2011-12
2012-13
2013-14
2014-15
1 Gram 1138 1139 978 1251 1000
2 Tur 986 1054 1185 996 1125
3 Moong 503 455 448 579 475
4 Urad 673 698 634 611 659
5
Other
Pulses500 581 588 665
792

Crop-wise Area of Cereals 2010-11 to 2014-15
Sr. No.
CropArea (In 000’ Ha)
2010-11
2011-12
2012-13
2013-14
2014-15
1 Joawar 126 124 80 247 169
2 Bajra 872 866 599 694 178
3 Maize 565 515 458 461 318
4 Rice 808 835 701 788 755
5 Wheat 1589 1351 1023 1500 1146
6
Total
Cereals 3960 3691 2861 3690 2566
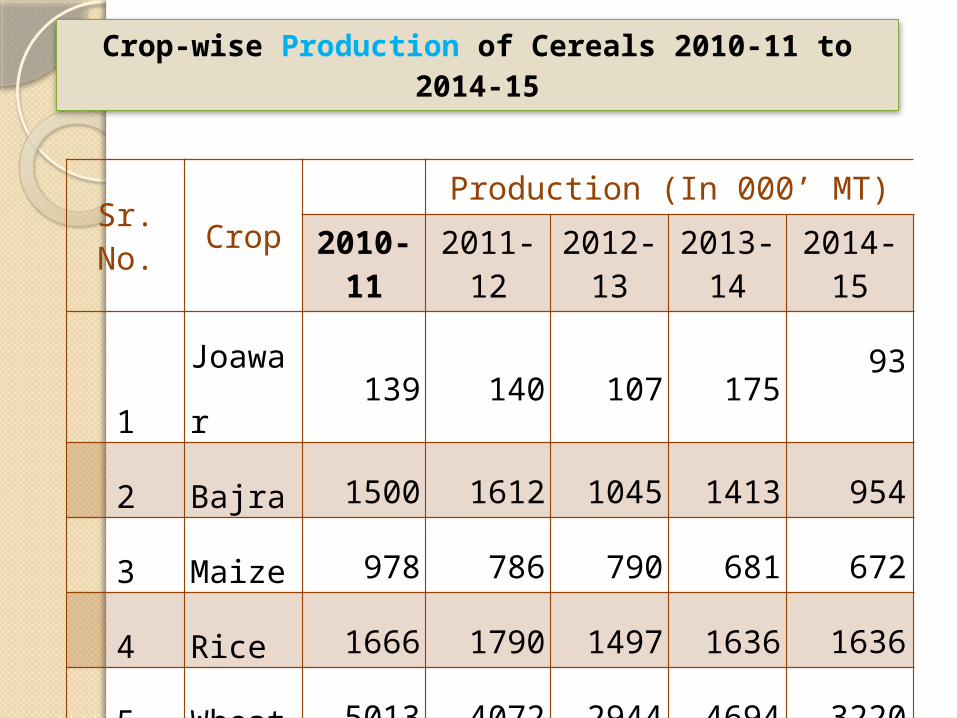
Crop-wise Production of Cereals 2010-11 to 2014-15
Sr. No.
CropProduction (In 000’ MT)
2010-11
2011-12
2012-13
2013-14
2014-15
1
Joawa
r139 140 107 175
93
2 Bajra 1500 1612 1045 1413 954
3 Maize 978 786 790 681 672
4 Rice 1666 1790 1497 1636 1636
5 Wheat 5013 4072 2944 4694 3220
6
Total
Cereal
s 9296 8400 6383 8599 6575
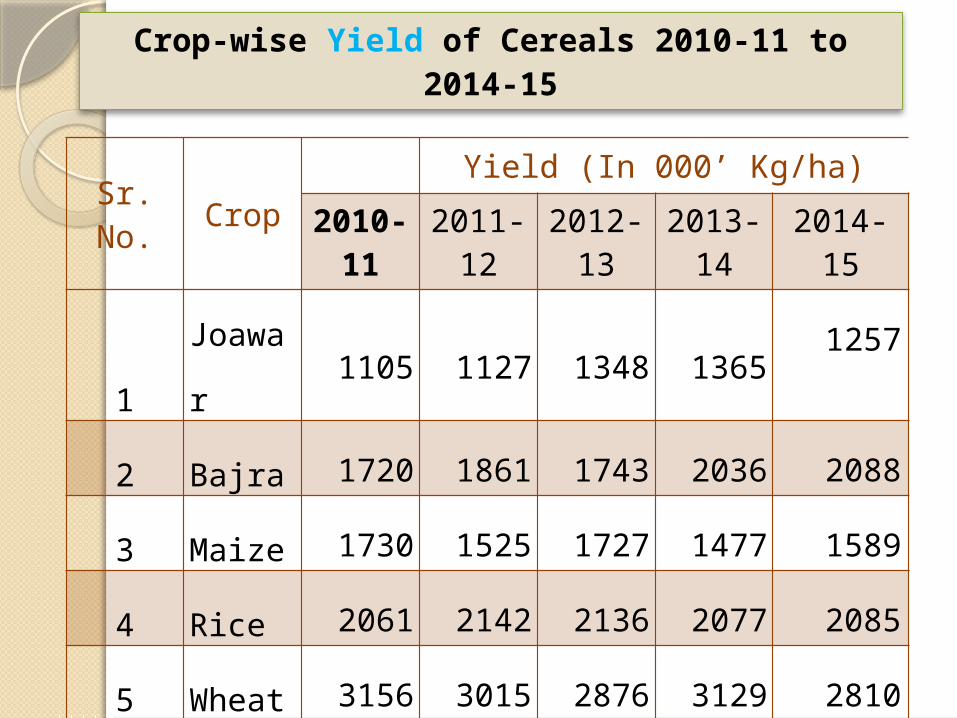
Crop-wise Yield of Cereals 2010-11 to 2014-15
Sr. No.
CropYield (In 000’ Kg/ha)
2010-11
2011-12
2012-13
2013-14
2014-15
1
Joawa
r1105 1127 1348 1365
1257
2 Bajra 1720 1861 1743 2036 2088
3 Maize 1730 1525 1727 1477 1589
4 Rice 2061 2142 2136 2077 2085
5 Wheat 3156 3015 2876 3129 2810
6
Total
Cereal
s 9772 9670 9830 10084 9829

Lessons Learnt Use of micro nutrients is increased in deficit
areas
Adoption of farm mechanization increased
Varietal replacement rate is increased i.e. PULSE (Tur)- Vaishali, GT-103, GJP- 1 PULSE (Moong)- Meha and Gujarat 4,
GBM-1, PULSE (Gram)- Guj. 2 and Guj. Gram 3
Distribution of soil health cards to all the farmers
Pre season arrangement of inputs through Gujarat State seed Corporation and Gujarat Agro Industries Corporation
Implementation of schemes in cluster approach

Lessons Learnt (cont..)
Increase in Seed Replacement Rate.
Learned importance of Varietal Replacement Rate
Increased use of on farm resources and low cost inputs like bio fertilizers, organic manures, crop residue management, vermi-compost etc.
Use of water saving devices and micro irrigation systems
Farmers learned to adopt INM and IPM
Local initiative component provide better understanding in water conservation
I-khedut portal for quick and transparent delivery of assistance
19
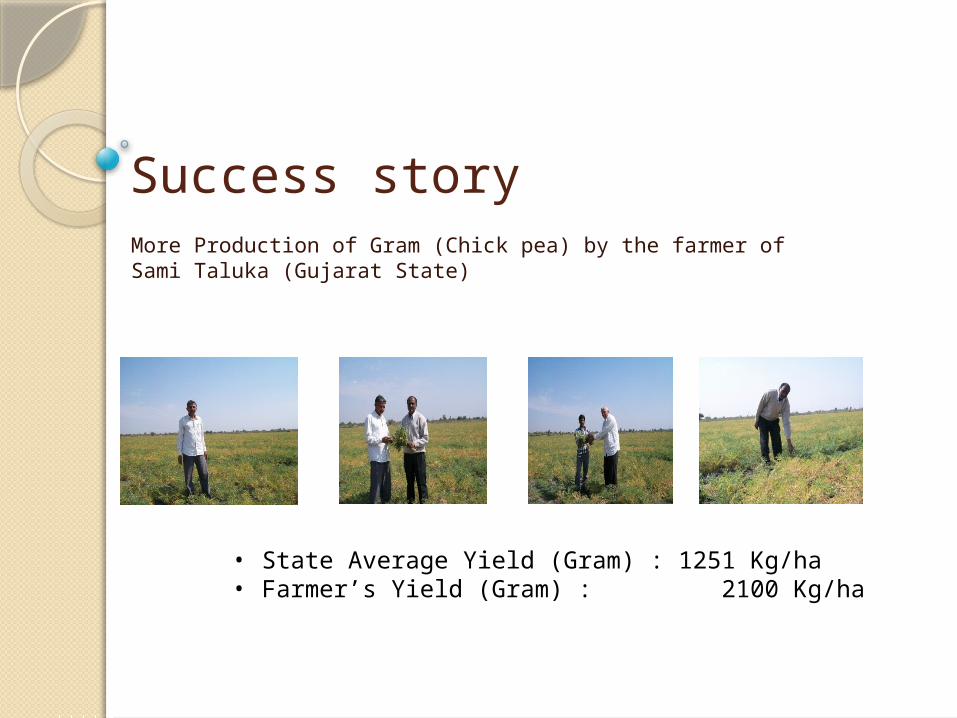
Success storyMore Production of Gram (Chick pea) by the farmer of Sami Taluka (Gujarat State)
• State Average Yield (Gram) : 1251 Kg/ha• Farmer’s Yield (Gram) : 2100 Kg/ha

SUCCESS STORY Out of the farmers growing Gram (Chickpea) of Sami taluka Dist. Patan, Nadoda Dajubhai Mansangbhai has done successful farming in Gram during the Year 2013-14. Introduction of the farmer is as below.
Farmers Name: Nadoda Dajubhai Mansangbhai
Village: Orumana
Ta: Sami (Sankheswar)
Dist,: Patan
State: Gujarat
(M) 09725364368
Words of Mr. Dajubhai- During the year sowing of Gram crop increased in Rabi season due to late rainy spell in Sami taluka. I received seed of Gram under National Food Security Mission scheme and follows the agricultural practices from sowing to harvesting under the guidance of State Agriculture department. Due to the utmost care was taken for judicious use of fertilizer and plant protection measures, I have taken more production crossing average yield.
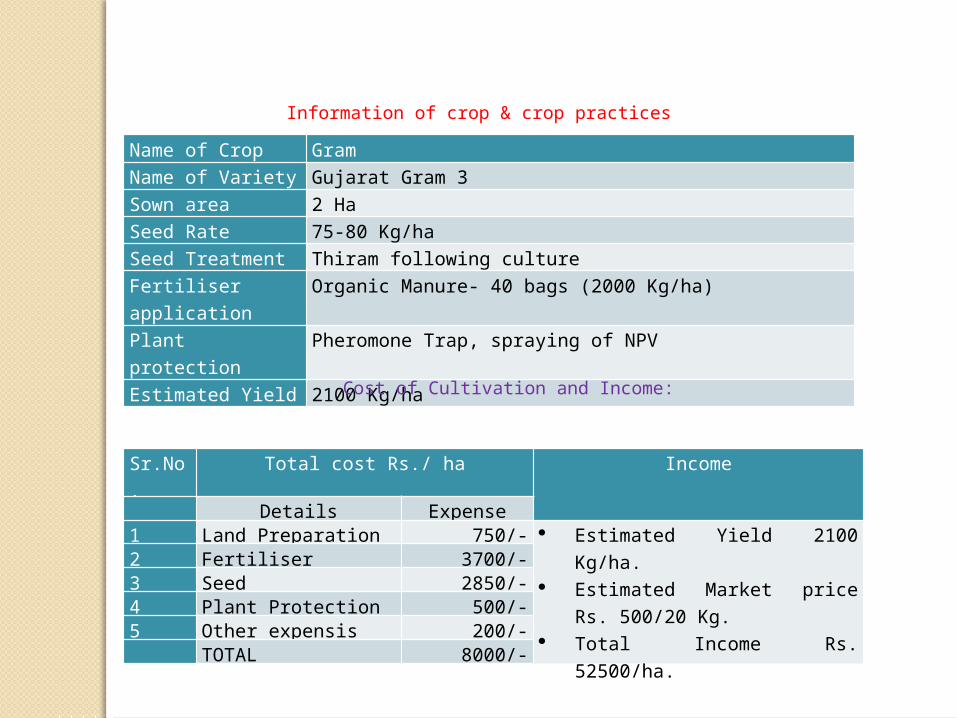
Name of Crop GramName of Variety Gujarat Gram 3Sown area 2 HaSeed Rate 75-80 Kg/haSeed Treatment Thiram following cultureFertiliser application
Organic Manure- 40 bags (2000 Kg/ha)
Plant protection Pheromone Trap, spraying of NPVEstimated Yield 2100 Kg/ha
Information of crop & crop practices
Sr.No. Total cost Rs./ ha Income Details Expense1 Land Preparation 750/- Estimated Yield 2100 Kg/ha.
Estimated Market price Rs. 500/20 Kg.
Total Income Rs. 52500/ha.
2 Fertiliser 3700/-3 Seed 2850/-4 Plant Protection 500/-5 Other expensis 200/- TOTAL 8000/-
Cost of Cultivation and Income:
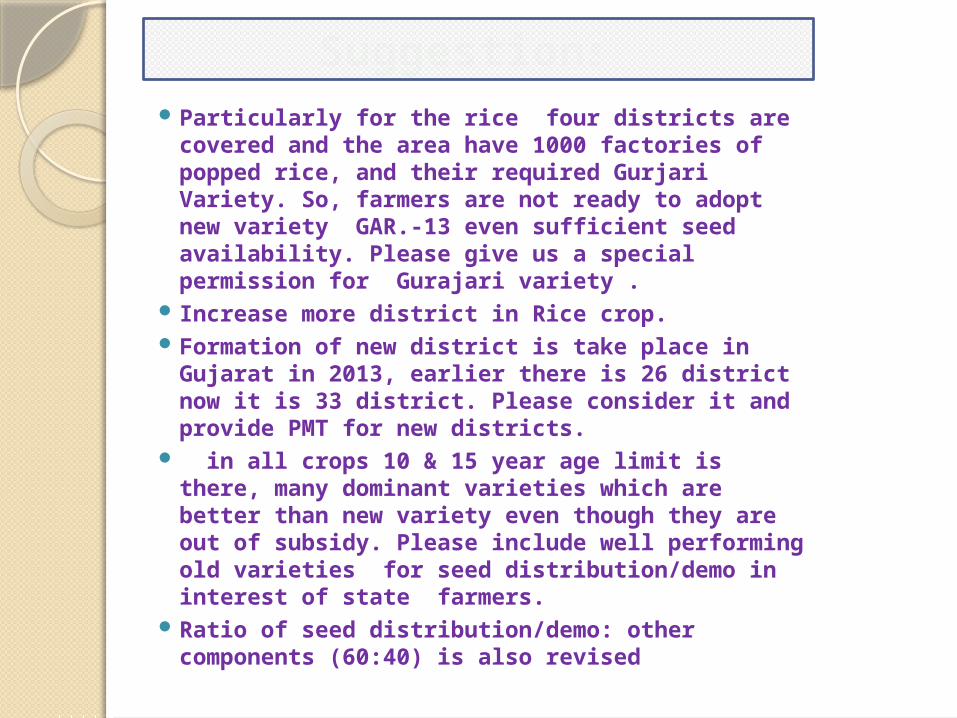
Suggestions Particularly for the rice four districts are
covered and the area have 1000 factories of popped rice, and their required Gurjari Variety. So, farmers are not ready to adopt new variety GAR.-13 even sufficient seed availability. Please give us a special permission for Gurajari variety .
Increase more district in Rice crop. Formation of new district is take place in
Gujarat in 2013, earlier there is 26 district now it is 33 district. Please consider it and provide PMT for new districts.
in all crops 10 & 15 year age limit is there, many dominant varieties which are better than new variety even though they are out of subsidy. Please include well performing old varieties for seed distribution/demo in interest of state farmers.
Ratio of seed distribution/demo: other components (60:40) is also revised

Field Demonstration Visit by Dr. D.P.Malik in Mehsana District

Thank you…