direct torsional actuation of microcantilevers using
TRANSCRIPT
Direct torsional actuation of microcantilevers using magnetic excitationNitya Nand Gosvami, Prathima C. Nalam, Annemarie L. Exarhos, Qizhan Tam, James M. Kikkawa, and RobertW. Carpick Citation: Applied Physics Letters 105, 093101 (2014); doi: 10.1063/1.4894737 View online: http://dx.doi.org/10.1063/1.4894737 View Table of Contents: http://scitation.aip.org/content/aip/journal/apl/105/9?ver=pdfcov Published by the AIP Publishing Articles you may be interested in Dynamics of surface-coupled microcantilevers in force modulation atomic force microscopy – magnetic vs. ditherpiezo excitation J. Appl. Phys. 111, 054303 (2012); 10.1063/1.3689815 High efficiency laser photothermal excitation of microcantilever vibrations in air and liquids Rev. Sci. Instrum. 82, 013702 (2011); 10.1063/1.3518965 Mode-selective noncontact excitation of microcantilevers and microcantilever arrays in air using the ultrasoundradiation force Appl. Phys. Lett. 97, 214101 (2010); 10.1063/1.3521256 Photoacoustic detection of gases using microcantilevers J. Appl. Phys. 106, 114510 (2009); 10.1063/1.3271157 Direct measurement of spatial modes of a microcantilever from thermal noise J. Appl. Phys. 106, 094313 (2009); 10.1063/1.3245394
This article is copyrighted as indicated in the article. Reuse of AIP content is subject to the terms at: http://scitation.aip.org/termsconditions. Downloaded to IP:
158.130.111.177 On: Tue, 27 Jan 2015 21:22:44
Direct torsional actuation of microcantilevers using magnetic excitation
Nitya Nand Gosvami,1 Prathima C. Nalam,1 Annemarie L. Exarhos,2 Qizhan Tam,1
James M. Kikkawa,2 and Robert W. Carpick1,a)
1Department of Mechanical Engineering and Applied Mechanics, University of Pennsylvania, Philadelphia,Pennsylvania 19104, USA2Department of Physics and Astronomy, University of Pennsylvania, Philadelphia, Pennsylvania 19104, USA
(Received 11 July 2014; accepted 24 August 2014; published online 3 September 2014)
Torsional mode dynamic force microscopy can be used for a wide range of studies including
mapping lateral contact stiffness, torsional frequency or amplitude modulation imaging, and
dynamic friction measurements of various materials. Piezo-actuation of the cantilever is commonly
used, but it introduces spurious resonances, limiting the frequency range that can be sampled, and
rendering the technique particularly difficult to apply in liquid medium where the cantilever oscilla-
tions are significantly damped. Here, we demonstrate a method that enables direct torsional actua-
tion of cantilevers with high uniformity over wide frequency ranges by attaching a micrometer-
scale magnetic bead on the back side of the cantilever. We show that when beads are magnetized
along the width of the cantilever, efficient torsional actuation of the cantilevers can be achieved
using a magnetic field produced from a solenoid placed underneath the sample. We demonstrate
the capability of this technique by imaging atomic steps on graphite surfaces in tapping mode near
the first torsional resonance of the cantilever in dodecane. The technique is also applied to map the
variations in the lateral contact stiffness on the surface of graphite and polydiacetylene monolayers.VC 2014 AIP Publishing LLC. [http://dx.doi.org/10.1063/1.4894737]
Atomic force microscopy (AFM) has become an essen-
tial tool in a large variety of scientific research ranging from
tribology1 to biology2 and even in geosciences3,4 and food
science,5 providing unprecedented details of the structural
and physical properties of materials at the nanometer or even
atomic scale. The unique ability of this technique to work in
liquid environment has enabled studies of soft surfaces such
as polymers6 and physisorbed molecular assemblies (e.g.,
DNA and membrane proteins).7–10 Soft and weakly bound
molecules are often measured using dynamic modes in order
to minimize shear forces between the tip and the sample
which can severely damage the sample.11 However, the com-
mon method of oscillating the cantilever with a piezo trans-
ducer typically introduces a forest of spurious peaks which
masks the cantilever resonance and introduces artifacts
which complicates data interpretation.12–14 It also severely
limits the frequency range that can be sampled; this hinders
the study of soft and biological materials, who have visco-
elastic responses which require measurements to be con-
ducted over many decades of frequency.15 Various methods
have been introduced to address these issues by directly driv-
ing the cantilever perpendicular to the sample surface, near
its first normal resonance using Lorentz force actuation
(idriveTM, Asylum Research, CA, USA),16,17 magnetic alter-
nating current (MAC) mode,12–14,18–23 electrostatic,24 and
photo-thermal actuation,25 which can achieve a highly uni-
form cantilever response vs. frequency to enable true molec-
ular or even atomic resolution imaging capabilities under
liquid environments. In another modification of this tech-
nique, the cantilever is actuated in lateral direction where the
tip oscillates nearly parallel to the sample surface.26 The
cantilever amplitude in this mode of oscillation is not sensi-
tive to long-range forces which act normal to the sample sur-
face,27 thus the change in cantilever amplitude and phase
arises from short-range interactions and in addition, oscilla-
tion of the tip parallel to the sample surface enables studies
of in-plane (i.e., shear) properties of material surfaces.28–38
The latter method still remains challenging to implement in
liquids as most of the proposed strategies employ piezo
actuation at the base of the cantilevers or requires sophisti-
cated instrumentation (e.g., for photothermal method)
which is difficult to implement on commercial AFMs.
Photothermal actuation method further suffers from its
inability to achieve large amplitudes for stiff cantilevers and
high laser power can locally heat the cantilever and sam-
ple.39 In order to address these issues, Yang et al., recently
proposed an alternative method of direct torsional actuation
using the Lorentz force technique.40 In this method, the
torsional twist in the AC current carrying cantilevers is pro-
duced by aligning the external magnetic field along the width
of the cantilever. However, this technique involves time-
consuming and expensive microfabrication process, such as
deposition of gold electrodes on the tip-side of the cantilever
for current flow. Furthermore, tip side coating is undesirable
for high resolution experiments where sharpness of the tip is
critical and the exposed gold electrodes might cause electro-
chemical reactions in electrolytes or ionized buffers, leading
to corrosion or delamination of the gold coating under high
current flow.16,40
Here, we report a method for direct actuation of the can-
tilever in torsional mode, where a spherical magnetic bead is
attached to the back of the cantilever and is actuated by a
solenoid placed underneath the sample plate. The technique
is capable of imaging at resonance (torsional tapping mode)
as well as at off-resonance frequencies (lateral force
a)Author to whom correspondence should be addressed. Electronic mail:
0003-6951/2014/105(9)/093101/5/$30.00 VC 2014 AIP Publishing LLC105, 093101-1
APPLIED PHYSICS LETTERS 105, 093101 (2014)
This article is copyrighted as indicated in the article. Reuse of AIP content is subject to the terms at: http://scitation.aip.org/termsconditions. Downloaded to IP:
158.130.111.177 On: Tue, 27 Jan 2015 21:22:44
modulation mode), which allows mapping of shear elastic
and shear viscoelastic properties of surfaces in air as well as
in liquid environments. We demonstrate the capability of
this technique to study in-plane surface properties by obtain-
ing high resolution lateral amplitude and phase contrast
images of a graphite surface in resonance as well as in off-
resonance modes and by mapping lateral contact stiffness
variations in molecular domains of polydiacetylene (PDA)
monolayers.
All the experiments were performed using a commercial
AFM (PicoPlus 5500, Agilent Technologies, Santa Clara
CA, USA), equipped with a solenoid mounted underneath
the sample plate to produce AC magnetic field. This AFM
also allows the possibility to magnetically actuate the canti-
lever using a solenoid which is placed in the cantilever
holder. This provides extra flexibility required for experi-
ments where different type of sample plates are needed, e.g.,
for variable temperature experiments or for stand-alone
applications where sample plates can not be used at all. This
method requires the use of one of these two types of sole-
noids to magnetically actuate the cantilever. While this may
not be feasible for all AFM systems, a number of commer-
cial and custom AFM systems are compatible with or even
include options for such solenoids. Silicon cantilevers (PPP-
LFMR, Nanosensors, Neuchatel, Switzerland) were used in
all the experiments. Ferromagnetic beads, made of a rare
earth-iron-boron intermetallic compound (MQP-S-11-9,
Magnequench, Singapore) were glued on the back side of the
cantilevers under an inverted optical microscope (Alessi
REL-4100A, Redwood City, CA, USA) by first applying a
small quantity of epoxy (two-part epoxy, J-B Weld, Sulphur
Springs, TX, USA) using a sharp tungsten wire (TGW0325,
World Precision Instruments, Sarasota, FL, USA) and then
placing the bead using a strand of hair.14 This process takes
approximately 10 min per cantilever. The cantilevers were
stored overnight in a dry N2 purged dry box to allow the ep-
oxy to fully cure. Later, the cantilevers were magnetized
using a superconducting magnet (Physical Property
Measurement System, Quantum Design, USA) under a mag-
netic field of 3 T such that the direction of the magnetic field
was perpendicular to the long axis of the cantilevers and par-
allel to the cantilever surface. Samples were inserted and
removed along the solenoid axis to ensure that magnetic re-
orientation did not occur during sample removal. This is a
crucial step because lateral stiffnesses in torsion of these
AFM cantilevers are typically one order of magnitude higher
than normal stiffnesses. Thus, large bending deflections will
occur with small misalignments of the bead’s magnetic
moment. This requires that the bead’s magnetic axis be
extremely well-aligned to achieve maximum selectivity of
torsional bending. The diameters of the magnetic beads
attached to the cantilevers were estimated using either bright
field optical microscopy (Olympus BX51) or using field
emission scanning electron microscopy (SEM, JOEL 7500F)
as shown in Fig. 1(a). The thermal noise spectrum of the can-
tilevers was acquired before and after gluing the beads using
a 16-bit high speed analog to digital converter (NI USB-
6259 BNC, National Instruments Corp., USA). The reso-
nance peaks were fit as described in detail in Ref. 41 to
obtain resonance frequencies and quality factors (Q) to
calculate normal and torsional spring constants using the
Sader method.41 The cantilever deflection sensitivities along
the normal direction were obtained by taking force curves on
a clean silicon wafer or glass substrates, whereas lateral
force sensitivities were obtained using the wedge calibration
method.42,43 Cantilevers were magnetically actuated using
the solenoid by sweeping the frequency of the AC drive sig-
nal (Fig. 1(b)). The normal or lateral cantilever amplitude
and phase signals were recorded using a digital lock-in am-
plifier supplied with the AFM controller. Highly oriented
pyrolytic graphite (HOPG) samples (SPI supplies, USA)
were freshly cleaved using a scotch tape and were mounted
in a fluid cell. The sample and the cantilevers were fully
immersed in the pure dodecane (�99%, Sigma-Aldrich) so-
lution during the measurements. PDA monolayers, deposited
using Langmuir-Blodgett (LB) method on silicon and atomi-
cally smooth mica surfaces,44 were also used to further
demonstrate imaging capabilities of our technique in labora-
tory air.
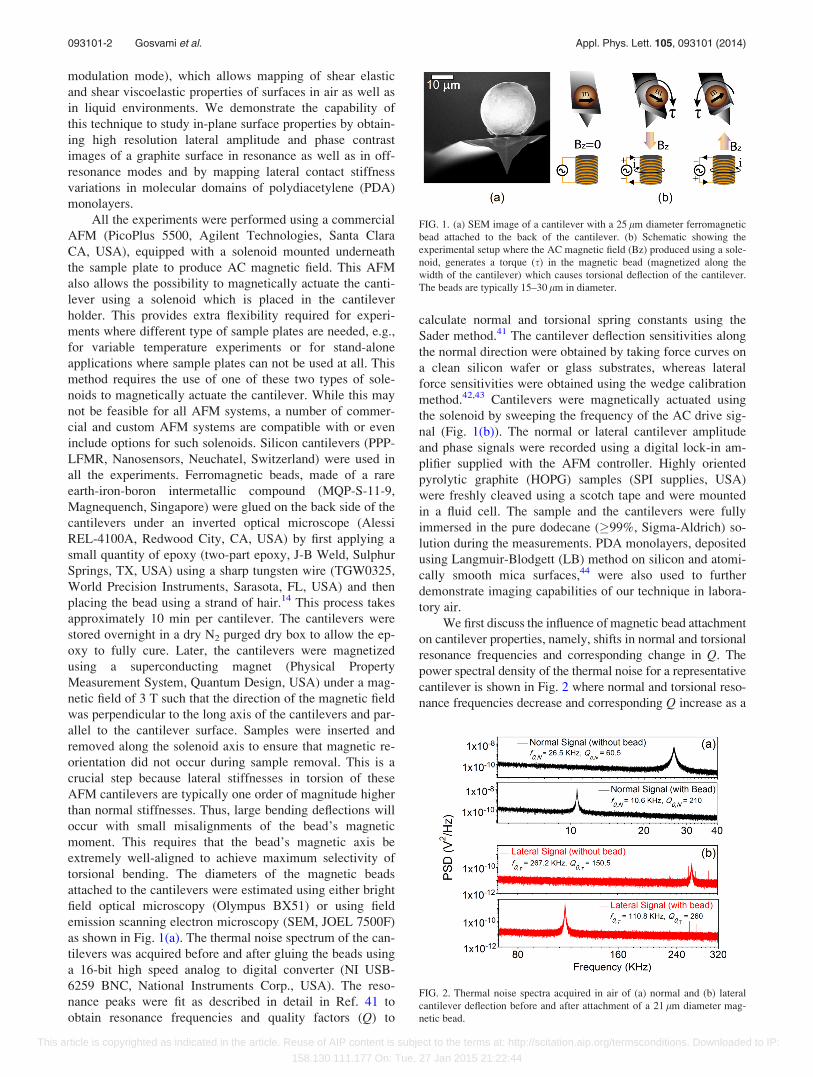
We first discuss the influence of magnetic bead attachment
on cantilever properties, namely, shifts in normal and torsional
resonance frequencies and corresponding change in Q. The
power spectral density of the thermal noise for a representative
cantilever is shown in Fig. 2 where normal and torsional reso-
nance frequencies decrease and corresponding Q increase as a
FIG. 1. (a) SEM image of a cantilever with a 25 lm diameter ferromagnetic
bead attached to the back of the cantilever. (b) Schematic showing the
experimental setup where the AC magnetic field (Bz) produced using a sole-
noid, generates a torque (s) in the magnetic bead (magnetized along the
width of the cantilever) which causes torsional deflection of the cantilever.
The beads are typically 15–30 lm in diameter.
FIG. 2. Thermal noise spectra acquired in air of (a) normal and (b) lateral
cantilever deflection before and after attachment of a 21 lm diameter mag-
netic bead.
093101-2 Gosvami et al. Appl. Phys. Lett. 105, 093101 (2014)
This article is copyrighted as indicated in the article. Reuse of AIP content is subject to the terms at: http://scitation.aip.org/termsconditions. Downloaded to IP:
158.130.111.177 On: Tue, 27 Jan 2015 21:22:44

result of attaching a magnetic bead (�21 lm diameter) to the
cantilever. The data acquired in air for 10 different cantilevers
using beads of diameters ranging from 18 to 28 lm revealed
that for the first normal mode, the resonance frequency (f0,N)
decreased by 50%–70% and quality factors (Q0,N) increased
by 200%–450%. For the first torsional mode, the resonance
frequency (f0,s) decreased by 40%–70% and quality factors
(Q0,s) increased by 60%–130% as a result of attaching the
magnetic beads. The shifts obtained for normal mode oscilla-
tions are primarily due to the added mass and are consistent
with a recent study by Hoof et al.13 We note that the shifts in
the torsional mode of the cantilevers show trends similar to
those observed for the normal mode. However, a compara-
tively smaller increase in Q is observed for the torsional mode.
This may be due to the difference in the hydrodynamic func-
tions for the normal and torsional oscillation modes,41 which
are not known for the cantilevers with attached beads used in
our experiments. One specific explanation for this effect could
be that the finite width of the cantilever partially masks the
spherical bead during normal cantilever oscillations, so hydro-
dynamic drag is not strongly affected. However, there is no
such shielding for the torsional mode, so a larger contribution
from hydrodynamic drag occurs. Thus, while Q is higher over-
all after adding the bead, the increase is not as significant for
the torsional mode.
Figure 1(b) shows a schematic of the experimental setup
where AC current (i) through the solenoid generates a fluctu-
ating magnetic field. The magnetic bead attached to the can-
tilever is subjected to a torque ðsÞ ¼ m� Bz (where m is the
magnetic moment of the magnetic bead and Bz is the compo-
nent of magnetic field produced by the solenoid along z-
axis), such that the magnetic moment of the bead tends to
align with the magnetic field produced by the solenoid result-
ing in actuated torsional bending of the cantilever. Varying
the magnitude of frequency and the drive current through the
solenoid, the frequency and amplitude of the torsional deflec-
tion of the cantilever can be controlled. Figure 3(a) shows
the normal and lateral forces acting on the cantilever at a
constant drive signal as a function of drive frequency. The
torsional force acting on the cantilever dominates over the
normal force by almost a factor of �100 over the entire
sweep frequency range, and no spurious peaks are observed.
The small cross-talk observed between the normal and lateral
signals could be due to various factors such as a slight angu-
lar misalignment of the photodetector with respect to the
cantilever chip, resulting in the photodiode axes being
rotated with respect to the torsional and flexural deflection
axes of the cantilever. This could also arise from a slight
misalignment of the solenoid with respect to the direction
perpendicular to the plane of the cantilever, which can give
rise to an additional magnetic force acting normal to the
plane of cantilever and is proportional to ð~m � ~rÞBz.
However, despite these factors, most of which may be fur-
ther improved but may not be completely eliminated, and
which will likely vary from one experiment to the next, simi-
lar amplitude vs. frequency response as in Fig. 3(a) was
observed for all the measured cantilevers. Figure 3(b) shows
the torsional amplitude and the phase response of the cantile-
ver as a function of drive frequency when immersed in dode-
cane where no spurious peaks are observed.
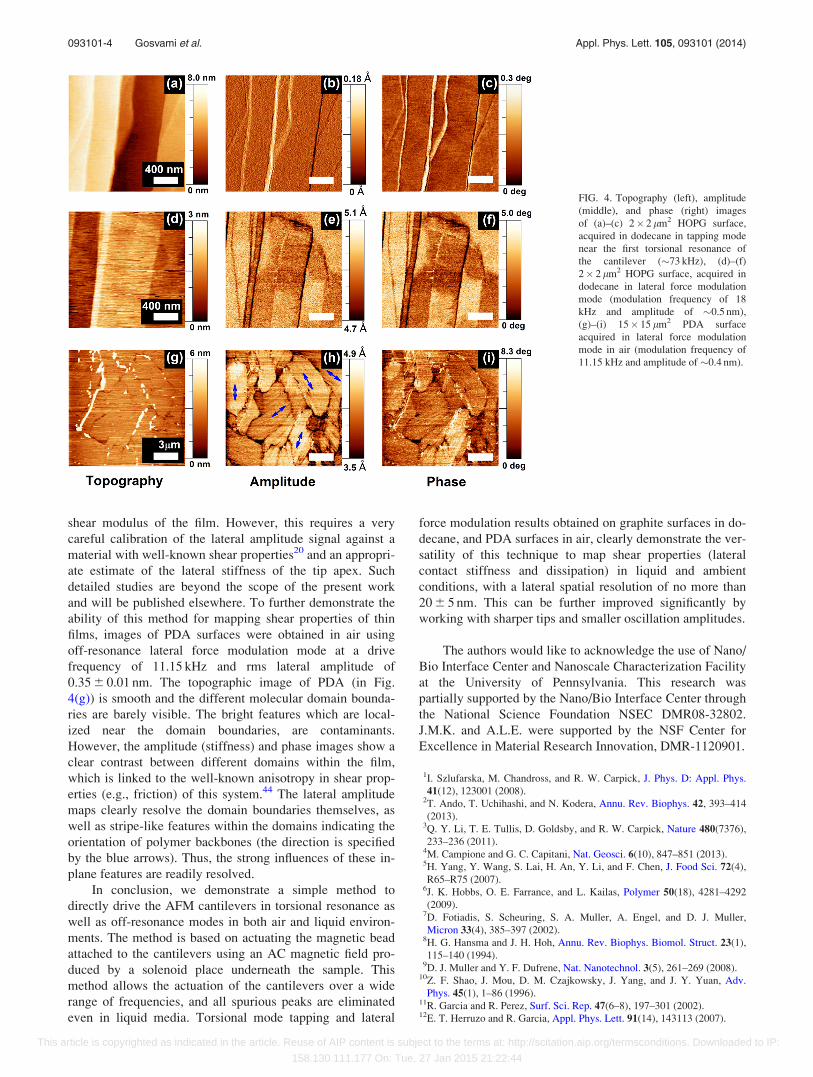
Figures 4(a)–4(f) demonstrate the ability of the cantile-
ver torsional actuation methods to perform stable and high
resolution imaging of HOPG surface under liquid. Figures
4(a)–4(c) show tapping mode images obtained on a freshly
cleaved HOPG surface immersed in dodecane near the first
torsional resonance of the cantilever. An oscillation fre-
quency of 73 kHz and a root mean squared (rms) oscillation
amplitude of 9.0 6 0.2 nm were used during imaging. Mono-
and multi-atomic steps of the HOPG surface are resolved
clearly in the topography image (Fig. 4(a)). Figure 4(b)
shows sub-Angstr€om level variation of the oscillation ampli-
tude (feedback) signal during imaging, indicating high imag-
ing stability of this method in liquids. In addition, strong
phase contrast (Fig. 4(c)) is observed near the step edges of
HOPG, which is consistent with the results obtained from
the piezo-actuated torsional tapping mode imaging con-
ducted by Huang and Su.30 The phase contrast near step
edges can be attributed to higher friction/energy-dissipa-
tion,45 clearly demonstrating that in-plane properties can
be mapped with 20 6 5 nm resolution using this method.
Furthermore, the ability of our method to achieve mapping
of lateral contact stiffness at off-resonance frequencies is
demonstrated in Figs. 4(d)–4(f), where the HOPG surface
was imaged in dodecane in contact mode with a 18 kHz mod-
ulation drive signal and rms lateral cantilever amplitude of
0.48 6 0.01 nm. The topography, amplitude, and phase sig-
nals shown in Figs. 4(d)–4(f), respectively, clearly reveal
single- and multiple-atomic steps (atomic step height of
0.35 6 0.05 nm, which agrees well with the theoretical value)
on the HOPG surface. The presence of dark and bright
regions observed in amplitude and phase signals at the topo-
graphically flat regions of the HOPG, can be related to bond-
ing of the top layer to the surface underneath, which can
influence the mechanical properties of the topmost layer,
particularly shear elastic and viscoelastic properties.46
Lateral amplitude variations are resolved down to picometers
(Fig. 4(e)), clearly indicating the ability of this method to
map shear properties and its variations with very high sensi-
tivity. The lateral amplitude signal can be converted to lat-
eral contact stiffness maps to quantitatively estimate elastic
FIG. 3. (a) Calibrated normal and torsional forces acting on a magnetically
actuated cantilever as a function of drive frequency (measured in air).
(b) Frequency response of lateral deflection and phase of the same cantilever
when immersed in dodecane.
093101-3 Gosvami et al. Appl. Phys. Lett. 105, 093101 (2014)
This article is copyrighted as indicated in the article. Reuse of AIP content is subject to the terms at: http://scitation.aip.org/termsconditions. Downloaded to IP:
158.130.111.177 On: Tue, 27 Jan 2015 21:22:44
shear modulus of the film. However, this requires a very
careful calibration of the lateral amplitude signal against a
material with well-known shear properties20 and an appropri-
ate estimate of the lateral stiffness of the tip apex. Such
detailed studies are beyond the scope of the present work
and will be published elsewhere. To further demonstrate the
ability of this method for mapping shear properties of thin
films, images of PDA surfaces were obtained in air using
off-resonance lateral force modulation mode at a drive
frequency of 11.15 kHz and rms lateral amplitude of
0.35 6 0.01 nm. The topographic image of PDA (in Fig.
4(g)) is smooth and the different molecular domain bounda-
ries are barely visible. The bright features which are local-
ized near the domain boundaries, are contaminants.
However, the amplitude (stiffness) and phase images show a
clear contrast between different domains within the film,
which is linked to the well-known anisotropy in shear prop-
erties (e.g., friction) of this system.44 The lateral amplitude
maps clearly resolve the domain boundaries themselves, as
well as stripe-like features within the domains indicating the
orientation of polymer backbones (the direction is specified
by the blue arrows). Thus, the strong influences of these in-
plane features are readily resolved.
In conclusion, we demonstrate a simple method to
directly drive the AFM cantilevers in torsional resonance as
well as off-resonance modes in both air and liquid environ-
ments. The method is based on actuating the magnetic bead
attached to the cantilevers using an AC magnetic field pro-
duced by a solenoid place underneath the sample. This
method allows the actuation of the cantilevers over a wide
range of frequencies, and all spurious peaks are eliminated
even in liquid media. Torsional mode tapping and lateral
force modulation results obtained on graphite surfaces in do-
decane, and PDA surfaces in air, clearly demonstrate the ver-
satility of this technique to map shear properties (lateral
contact stiffness and dissipation) in liquid and ambient
conditions, with a lateral spatial resolution of no more than
20 6 5 nm. This can be further improved significantly by
working with sharper tips and smaller oscillation amplitudes.
The authors would like to acknowledge the use of Nano/
Bio Interface Center and Nanoscale Characterization Facility
at the University of Pennsylvania. This research was
partially supported by the Nano/Bio Interface Center through
the National Science Foundation NSEC DMR08-32802.
J.M.K. and A.L.E. were supported by the NSF Center for
Excellence in Material Research Innovation, DMR-1120901.
1I. Szlufarska, M. Chandross, and R. W. Carpick, J. Phys. D: Appl. Phys.
41(12), 123001 (2008).2T. Ando, T. Uchihashi, and N. Kodera, Annu. Rev. Biophys. 42, 393–414
(2013).3Q. Y. Li, T. E. Tullis, D. Goldsby, and R. W. Carpick, Nature 480(7376),
233–236 (2011).4M. Campione and G. C. Capitani, Nat. Geosci. 6(10), 847–851 (2013).5H. Yang, Y. Wang, S. Lai, H. An, Y. Li, and F. Chen, J. Food Sci. 72(4),
R65–R75 (2007).6J. K. Hobbs, O. E. Farrance, and L. Kailas, Polymer 50(18), 4281–4292
(2009).7D. Fotiadis, S. Scheuring, S. A. Muller, A. Engel, and D. J. Muller,
Micron 33(4), 385–397 (2002).8H. G. Hansma and J. H. Hoh, Annu. Rev. Biophys. Biomol. Struct. 23(1),
115–140 (1994).9D. J. Muller and Y. F. Dufrene, Nat. Nanotechnol. 3(5), 261–269 (2008).
10Z. F. Shao, J. Mou, D. M. Czajkowsky, J. Yang, and J. Y. Yuan, Adv.
Phys. 45(1), 1–86 (1996).11R. Garcia and R. Perez, Surf. Sci. Rep. 47(6–8), 197–301 (2002).12E. T. Herruzo and R. Garcia, Appl. Phys. Lett. 91(14), 143113 (2007).
FIG. 4. Topography (left), amplitude
(middle), and phase (right) images
of (a)–(c) 2� 2 lm2 HOPG surface,
acquired in dodecane in tapping mode
near the first torsional resonance of
the cantilever (�73 kHz), (d)–(f)
2� 2 lm2 HOPG surface, acquired in
dodecane in lateral force modulation
mode (modulation frequency of 18
kHz and amplitude of �0.5 nm),
(g)–(i) 15� 15 lm2 PDA surface
acquired in lateral force modulation
mode in air (modulation frequency of
11.15 kHz and amplitude of �0.4 nm).
093101-4 Gosvami et al. Appl. Phys. Lett. 105, 093101 (2014)
This article is copyrighted as indicated in the article. Reuse of AIP content is subject to the terms at: http://scitation.aip.org/termsconditions. Downloaded to IP:
158.130.111.177 On: Tue, 27 Jan 2015 21:22:44
13S. Hoof, N. N. Gosvami, and B. W. Hoogenboom, J. Appl. Phys. 112(11),
114324 (2012).14E. L. Florin, M. Radmacher, B. Fleck, and H. E. Gaub, Rev. Sci. Instrum.
65(3), 639–643 (1994).15N. Yang, K. K. H. Wong, J. R. de Bruyn, and J. L. Hutter, Meas. Sci.
Technol. 20(2), 025703 (2009).16A. Buguin, O. Du Roure, and P. Silberzan, Appl. Phys. Lett. 78(19),
2982–2984 (2001).17J. I. Kilpatrick, A. Gannepalli, J. P. Cleveland, and S. P. Jarvis, Rev. Sci.
Instrum. 80(2), 023701 (2009).18M. A. Lantz, S. J. O’Shea, and M. E. Welland, Appl. Phys. Lett. 65(4),
409–411 (1994).19O. Pietrement and M. Troyon, Tribol. Lett. 9(1–2), 77–87 (2000).20X. Xu, M. Koslowski, and A. Raman, J. Appl. Phys. 111(5), 054303 (2012).21S. I. Yamamoto, H. Yamada, K. Matsushige, T. Ishida, W. Mizutani, and
H. Tokumoto, Surf. Sci. 433–435, 567–574 (1999).22W. H. Han, S. M. Lindsay, and T. W. Jing, Appl. Phys. Lett. 69(26),
4111–4113 (1996).23W. Hofbauer, R. J. Ho, R. Hairulnizam, N. N. Gosvami, and S. J. O’Shea,
Phys. Rev. B 80(13), 134104 (2009).24K. Umeda, K. Kobayashi, K. Matsushige, and H. Yamada, Appl. Phys.
Lett. 101(12), 123112 (2012).25G. C. Ratcliff, D. A. Erie, and R. Superfine, Appl. Phys. Lett. 72(15),
1911–1913 (1998).26O. Pfeiffer, R. Bennewitz, A. Baratoff, E. Meyer, and P. Gr€utter, Phys.
Rev. B 65(16), 161403 (2002).27C.-W. Yang and S. Hwang, Nanotechnology 21(6), 065710 (2010).28B. Bhushan and T. Kasai, Nanotechnology 15(8), 923–935 (2004).29N. Chen and B. Bhushan, J. Microsc. 220(2), 96–112 (2005).30L. Huang and C. M. Su, Ultramicroscopy 100(3–4), 277–285 (2004).
31P. Ihalainen, J. Jarnstrom, A. Maattanen, and J. Peltonen, Colloids Surf., A
373(1–3), 138–144 (2011).32T. Kunstmann, A. Schlarb, M. Fendrich, D. Paulkowski, T. Wagner, and
R. Moller, Appl. Phys. Lett. 88(15), 153112 (2006).33P. E. Mazeran and J. L. Loubet, Tribol. Lett. 7(4), 199–212 (1999).34M. Misawa and M. Ono, Jpn. J. Appl. Phys., Part 1 45(3S), 1978–1980
(2006).35N. Mullin and J. Hobbs, Appl. Phys. Lett. 92(5), 053103 (2008).36N. Mullin and J. K. Hobbs, Phys. Rev. Lett. 107(19), 197801 (2011).37M. Reinstadtler, T. Kasai, U. Rabe, B. Bhushan, and W. Arnold, J. Phys.
D: Appl. Phys. 38(18), R269–R282 (2005).38M. Reinstadtler, U. Rabe, A. Goldade, B. Bhushan, and W. Arnold, Tribol.
Int. 38(6–7), 533–541 (2005).39D. Kiracofe, K. Kobayashi, A. Labuda, A. Raman, and H. Yamada, Rev.
Sci. Instrum. 82(1), 013702 (2011).40C. W. Yang, R. F. Ding, S. H. Lai, H. S. Liao, W. C. Lai, K. Y.
Huang, C. S. Chang, and I. S. Hwang, Nanotechnology 24(30),
305702 (2013).41C. P. Green, H. Lioe, J. P. Cleveland, R. Proksch, P. Mulvaney, and J. E.
Sader, Rev. Sci. Instrum. 75(6), 1988–1996 (2004).42D. Ogletree, R. W. Carpick, and M. Salmeron, Rev. Sci. Instrum. 67(9),
3298–3306 (1996).43M. Varenberg, I. Etsion, and G. Halperin, Rev. Sci. Instrum. 74(7),
3362–3367 (2003).44R. W. Carpick, D. Y. Sasaki, and A. R. Burns, Tribol. Lett. 7(2–3), 79–85
(1999).45P. Egberts, Z. Ye, X. Z. Liu, Y. Dong, A. Martini, and R. W. Carpick,
Phys. Rev. B 88(3), 035409 (2013).46C. Lee, Q. Li, W. Kalb, X.-Z. Liu, H. Berger, R. W. Carpick, and J. Hone,
Science 328(5974), 76–80 (2010).
093101-5 Gosvami et al. Appl. Phys. Lett. 105, 093101 (2014)
This article is copyrighted as indicated in the article. Reuse of AIP content is subject to the terms at: http://scitation.aip.org/termsconditions. Downloaded to IP:
158.130.111.177 On: Tue, 27 Jan 2015 21:22:44