direct time study - wordpress.com · work systems and the methods, measurement, and management of...
TRANSCRIPT
Work Systems and the Methods, Measurement, and Management of Work
by Mikell P. Groover, ISBN 0-13-140650-7.
©2007 Pearson Education, Inc., Upper Saddle River, NJ. All rights reserved.
Learning Curves
Sections:
1. Learning Curve Theory
2. Crawford Model
3. Total Cumulative Time
4. Determining the Learning Rate
Chapter 19

Work Systems and the Methods, Measurement, and Management of Work
by Mikell P. Groover, ISBN 0-13-140650-7.
©2007 Pearson Education, Inc., Upper Saddle River, NJ. All rights reserved.
Learning Curve Phenomenon
Learning Curve Phenomenon: Reduction in
cycle time that occurs in a repetitive work
activity as the number of cycles increases
An important topic in time study
When a worker accomplishes a task over and over, the
time required for each successive cycle decreases as he
or she learns the task
At first the learning effect is rapid, and the cycle time
decreases significantly
As more and more cycles are completed, the cycle
time reduction becomes less and less

Work Systems and the Methods, Measurement, and Management of Work
by Mikell P. Groover, ISBN 0-13-140650-7.
©2007 Pearson Education, Inc., Upper Saddle River, NJ. All rights reserved.
Learning Curve Phenomenon
Learning Curve analysis has been applied for different
areas rather than cycle unit time:
1- It can estimates the product cost.
2- Product quality
3- Occupational safety
Learning Curve phenomenon is easiest to envision for individual worker,
the same kind of improvement occurs in the repetitive operations of workers
team.
Learning Curve is also called experience curve

Work Systems and the Methods, Measurement, and Management of Work
by Mikell P. Groover, ISBN 0-13-140650-7.
©2007 Pearson Education, Inc., Upper Saddle River, NJ. All rights reserved.
Learning Curve Theory
According to theory, there is a constant learning rate that
applies to a given repetitive task
Learning rate (LR) is the proportion by which the
dependent variable (e.g., task time) is multiplied every time
the number of task cycles doubles
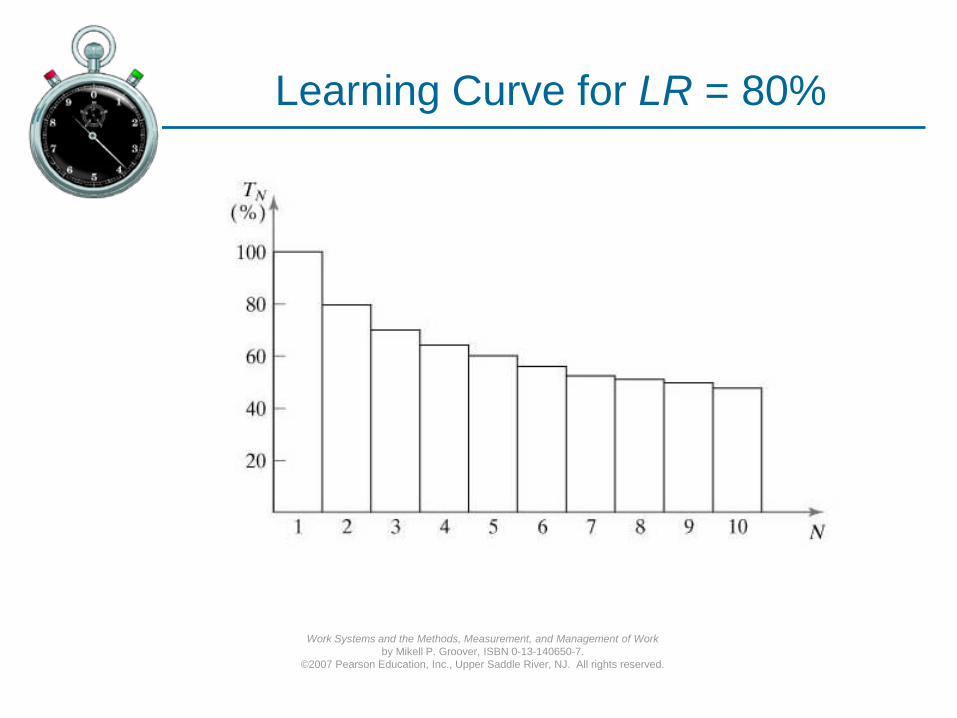
Example: If T1 = 10 hr and LR = 80%, then
T2 = 0.80(10) = 8.0 hr,
T4 = 0.80(8.0) = 6.4 hr
T8 = 0.80(6.4) = 5.12 hr
and so on
Work Systems and the Methods, Measurement, and Management of Work
by Mikell P. Groover, ISBN 0-13-140650-7.
©2007 Pearson Education, Inc., Upper Saddle River, NJ. All rights reserved.
Learning Curve for LR = 80%

Work Systems and the Methods, Measurement, and Management of Work
by Mikell P. Groover, ISBN 0-13-140650-7.
©2007 Pearson Education, Inc., Upper Saddle River, NJ. All rights reserved.
Learning Curve Theory (Cont.)
There is one important term related to the learning rate
which is called improvement rate.
Improvement rate is the percentage of improvement in
cycle time of the unit (dependent variable) as the number
of unit doubles.
Improvement Rate (IR) = 1- LR
IR = improvement rate expressed as a decimal fraction
LR = Learning rate expressed as a decimal fraction

Learning Curve Theory (Cont.)
The studies have been presented that the in industrial sector that
the learning rate range from 60% to less than 100%.
Learning rate of 60% indicates a very reduction in task time
while the number of cycles are doubled.
The means higher value of LR (value of LR closer to one)
slower learning in the task or operation. In contrast, the lower
value means faster learning.
Learning rate of 60% very reduction in task time while the
number of cycles are doubled.
Learning rate of 100% Meaning no learning
Higher than of 100% Meaning loss of learning

Log-Linear Model
When learning curve time data are plotted on log-log
coordinates, the plot yields a straight line with slope m
y = kxm
where y = dependent variable (time of the task), k = constant
representing the value of the dependent variable for the first
work cycle, x = number of work units completed, and m = slope
m = and LR = 2m
2ln
LRln
LR = Learning rate expressed as a decimal fraction
(e.g., 80% = 0.80)
m = learning curve slope

Work Systems and the Methods, Measurement, and Management of Work
by Mikell P. Groover, ISBN 0-13-140650-7.
©2007 Pearson Education, Inc., Upper Saddle River, NJ. All rights reserved.
Same Learning Curve in Log-Log Plot
Example: for learning rate less than 1.0 (100%), m is negative value so, the
slope is negative as presented in the Figure (m= -0.322 for 80% LR)
Work Systems and the Methods, Measurement, and Management of Work
by Mikell P. Groover, ISBN 0-13-140650-7.
©2007 Pearson Education, Inc., Upper Saddle River, NJ. All rights reserved.
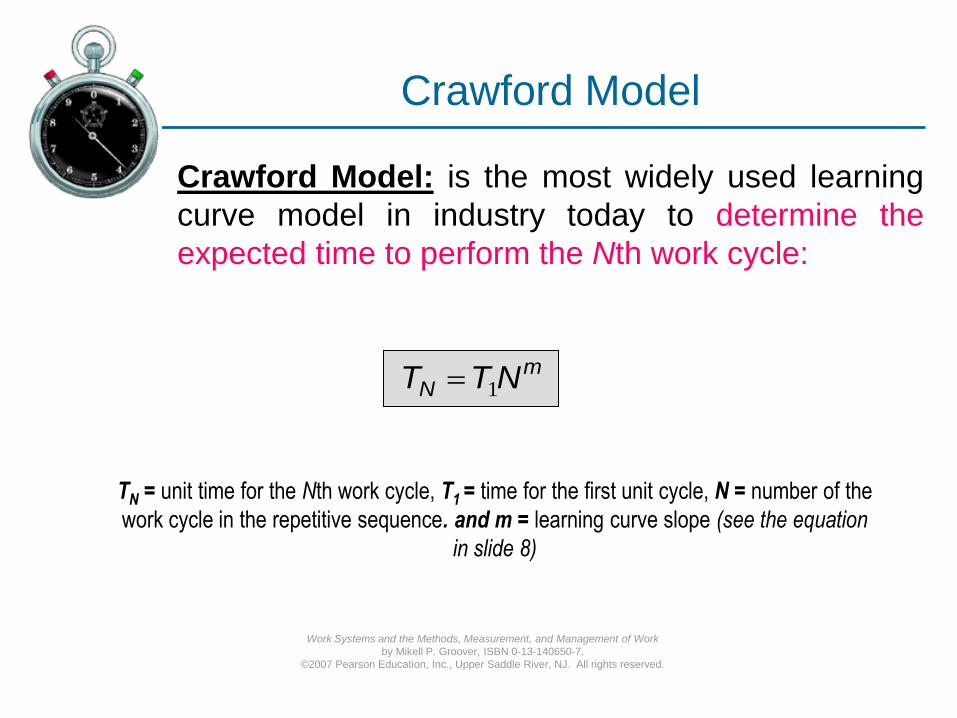
Crawford Model
Crawford Model: is the most widely used learning
curve model in industry today to determine the
expected time to perform the Nth work cycle:
m
N NTT 1
TN = unit time for the Nth work cycle, T1 = time for the first unit cycle, N = number of the
work cycle in the repetitive sequence. and m = learning curve slope (see the equation
in slide 8)
Work Systems and the Methods, Measurement, and Management of Work
by Mikell P. Groover, ISBN 0-13-140650-7.
©2007 Pearson Education, Inc., Upper Saddle River, NJ. All rights reserved.
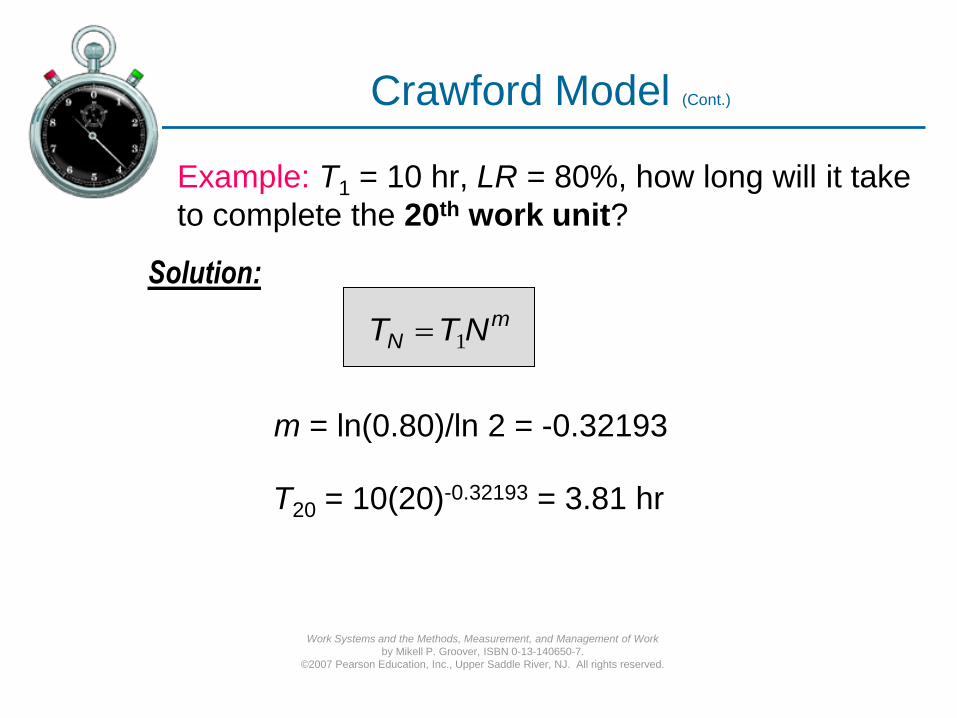
Crawford Model (Cont.)
Example: T1 = 10 hr, LR = 80%, how long will it take
to complete the 20th work unit?
m = ln(0.80)/ln 2 = -0.32193
T20 = 10(20)-0.32193 = 3.81 hr
mN NTT 1
Solution:

Work Systems and the Methods, Measurement, and Management of Work
by Mikell P. Groover, ISBN 0-13-140650-7.
©2007 Pearson Education, Inc., Upper Saddle River, NJ. All rights reserved.
Total Cumulative Time
Total cumulative time of the N work units. This time is
important and useful in bidding on a batch of N work units
for a prospective customer.
Total cumulative time is also necessary to estimate the
cost of the production as well as it helps to identify the
extra time of work (additional work shift) if needed.

Total Cumulative Time (TCT)
Total cumulative time for number of work
units cycles:
TTN = Total cumulative time for N work units, T1 = time for the first cycle, i = an
intermediate variable for the summing procedure
The
se b
oth
equa
tions
use
d to
det
erm
ine
TC
T (
Cra
wfo
rd
Mo
del
)
N = number of the work cycles units

Total Cumulative Time
Example: Determine the cumulative total time of the 20
work units of a task for learning rate of 80%, given that the time
of first unit is 10 hr?
Solution:
First way: summing the unit times for unit 1 through 20
using equation:
TT20 = 10 [(1)m + (2)m +(3)m + (4)m + (5)m + ……. (20)m ]
TT20 = 10 [(1)-0.32193 + (2) -0.32193 +(3) -0.32193 + ……. +(20) -0.32193 ]
m = ln(0.80)/ln 2 = -0.32193
TT20 = 10 [1+ 0.80+ 0.7021+ ……. +0.3812] = 104.85 hr

Total Cumulative Time (Cont.)
Solution:
Second way: using the approximation equation:
E(TT20) = 10
(20 + 0.5)1-0.32193 – (0.5) 1-0.32193
1 - 032193 = 105.12 hr
Note: The differences between to results is due to the error of correct value of TT20 of only 0.258% and
this percentage good for application and is not consider as a significant difference in the time.

Total Cumulative Time (Cont.)
Other equation to determine Total cumulative Time is the Wright
model equation:
TTN = T1 * Nm+1
Cumulative average time
N
TTT N
N
TTN = Total cumulative time for N work units, T1 = time for the first cycle
OR TN E(TTN)
= N

Work Systems and the Methods, Measurement, and Management of Work
by Mikell P. Groover, ISBN 0-13-140650-7.
©2007 Pearson Education, Inc., Upper Saddle River, NJ. All rights reserved.
Why the Learning Curve Occurs
Contributions of the worker
Worker becomes familiar with the task - the
worker learns the task
Worker makes fewer mistakes as the task is
repeated
Hand and body motions become more efficient,
and there is a rhythm and pattern developed
Minor adjustments in workplace layout to
reduce distances
Fewer delays that interrupt the operation

Work Systems and the Methods, Measurement, and Management of Work
by Mikell P. Groover, ISBN 0-13-140650-7.
©2007 Pearson Education, Inc., Upper Saddle River, NJ. All rights reserved.
Why the Learning Curve Occurs (Cont.)
Contributions of the larger organization
Methods improvements by the IE Department
Technological improvements
Better scheduling
Improved logistical support
Better motivation of workers

Determining the Learning Rate (LR)
There are two ways to obtain learning rate (LR):
(1) Industry average: Some typical values of learning rate for the Crawford
model are listed below:
Type of work LR, %
Assembly 84-85
Prototype assembly 65
Clerical operations 75-85
Inspection 86
Machining 90
Welding 85-90
Industry LR, %
Aerospace 85
Complex machines 75-85
Construction 70-90
Electronics mfg 90-95
Machine shop 90-95
Shipbuilding 80-85

Determining the Learning Rate (LR) Cont.
There are two ways to obtain learning rate (LR):
(2) Using the data from application: Some typical values of learning rate for
the Crawford model are listed below:
The learning rate can be estimated by determine the ratio of every time the
number of units doubles:
LR =
T2N
TN
Where N is any unit number and 2N is double that number

Determining the Learning Rate (LR) Cont.
Finding the slope from any two observations: if the data are not available or
missing for the doubling effect in unit time values. The LR can be determine by
calculate the slope learning for any two values
m =
lnTN2 – lnTN1
Where; m = learning curve slope and TN2 and TN1
are the unit times for units N2 and N1
ln(N2) – ln(N1)
Upper unit value
lower unit value
After determine the slope (m), then can find the LR by the below equation:
LR = 2m