direct electrochemistry of proteins and enzymes: an introduction
TRANSCRIPT

Direct electrochemistry of proteins and enzymes: an
introduction
Christophe Léger ?
Laboratoire de Bioénergétique et Ingénierie des Protéines,
Institut de Microbiologie de la Méditerranée, CNRS, AMU, Marseille, F
[email protected], http://bip.cnrs-mrs.fr/bip06
December 13, 2012
We introduce electrochemistry of redox proteins and enzymes in the context of functional stud-
ies. We explain the fundamental concepts of electrochemistry only as far as they are important
for understanding at a qualitative level the results that are presented. We have selected the latter
to illustrate the variety of mechanistic information that can be gained from electrochemical inves-
tigations. We explain the most classical electrochemical experiments, but most results discussed
herein were obtained using the con�guration called �protein �lm voltammetry�, where the protein
is adsorbed onto an electrode surface and electron transfer is direct. We shall not cover all aspects
of Faradaic bioelectrochemistry: for example we do not discuss catalytic mediated electrochem-
istry, the characterisation of the electrode/protein interface in relation to the design of electrodes
for immobilizing proteins, and applications in biotechnology (bio-fuel cells, bio-sensors, etc.).
Keywords: Redox enzymes, metalloenzymes, structure-function relationships, electrochem-
istry, direct electron transfer, protein �lm voltammetry, enzyme kinetics.
Contents
1 Introduction 1
2 Basics 2
2.1 Redox thermodynamics: the Nernst equation . . . . . . . . . . . . . . . . . . . . . . . . . . 2
2.2 Reference potential and reference electrodes . . . . . . . . . . . . . . . . . . . . . . . . . . . 4
2.3 The biological redox scale . . . . . . . . . . . . . . . . . . . . . . . . . . . . . . . . . . . . . 4
2.4 In�uence of coupled reactions (e.g. protonation or ligand binding) on reduction potentials . 4
2.5 Electron transfer (ET) kinetics . . . . . . . . . . . . . . . . . . . . . . . . . . . . . . . . . . 7
2.6 Kinetics of proton-coupled electron transfer: stepwise versus concerted mechanisms. . . . . 9
3 Electrochemistry under equilibrium conditions: potentiometric titrations 9
4 Dynamic electrochemistry 10
4.1 Distinction between equilibrium and dynamic electrochemistry . . . . . . . . . . . . . . . . 10
4.2 Electrodes for electron transfer to/from proteins . . . . . . . . . . . . . . . . . . . . . . . . 11

4.3 Electrochemical equipment . . . . . . . . . . . . . . . . . . . . . . . . . . . . . . . . . . . . 12
4.4 Vocab and conventions . . . . . . . . . . . . . . . . . . . . . . . . . . . . . . . . . . . . . . . 12
4.5 The capacitive current . . . . . . . . . . . . . . . . . . . . . . . . . . . . . . . . . . . . . . . 12
5 Di�usion controlled Voltammetry 13
5.1 . . . at stationary electrodes . . . . . . . . . . . . . . . . . . . . . . . . . . . . . . . . . . . . . 13
5.2 . . . at rotating electrodes . . . . . . . . . . . . . . . . . . . . . . . . . . . . . . . . . . . . . . 15
6 �non-catalytic� protein �lm voltammetry (PFV) 16
6.1 Non-catalytic voltammetry at slow scan rates to measure reduction potentials . . . . . . . . 16
6.2 Fast scan voltammetry to determine the rates of coupled reactions . . . . . . . . . . . . . . 20
7 Catalytic protein �lm voltammetry and chronoamperometry 22
7.1 Principle and general comments . . . . . . . . . . . . . . . . . . . . . . . . . . . . . . . . . . 22
7.2 Mass-transport controlled catalytic voltammetry . . . . . . . . . . . . . . . . . . . . . . . . 25
7.3 Chronoamperometry to measure Michaelis and inhibition constants . . . . . . . . . . . . . . 26
7.4 Chronoamperometry to resolve rapid changes in activity . . . . . . . . . . . . . . . . . . . . 28
7.5 Determining the reduction potentials of an active site bound to substrate . . . . . . . . . . 30
7.6 The e�ect of slow intramolecular electron transfer . . . . . . . . . . . . . . . . . . . . . . . . 32
7.7 Slow interfacial electron transfer . . . . . . . . . . . . . . . . . . . . . . . . . . . . . . . . . 32
7.8 Slow substrate binding . . . . . . . . . . . . . . . . . . . . . . . . . . . . . . . . . . . . . . . 32
7.9 Slow, redox-driven (in)activation . . . . . . . . . . . . . . . . . . . . . . . . . . . . . . . . . 33
8 Softwares 34
9 PFV Quiz 35
A Appendices 35
A.1 Notations and abbreviations . . . . . . . . . . . . . . . . . . . . . . . . . . . . . . . . . . . . 35
A.2 Derivation of eq. 9 . . . . . . . . . . . . . . . . . . . . . . . . . . . . . . . . . . . . . . . . . 36
References 36
1 Introduction
Direct electron transfer to proteins (without the need for mediators) was �rst reported in the
1970's, opening the way for detailed studies of biological reactions, and electrochemical investiga-
tions of large redox enzymes are now common.
Determining reduction potentials is only one application of the method; in studies of redox
proteins or small molecules, electrochemical techniques are used for learning not only about the
thermodynamics but also the kinetics of chemical reactions that immediately precede or follow elec-
tron transfer (e.g. protonation or substrate binding). Using direct electrochemistry, the turnover
rate of enzymes can also be measured with very high temporal resolution and potential control.
This greatly broadens the possibilities of enzyme kinetics. This technique has indeed been used to
study all aspects of catalysis: interfacial and intramolecular electron transfer, substrate di�usion
along substrate channels, active site chemistry, mechanism of reaction with inhibitors, redox-driven
(in)activation processes etc.
2
The proteins or enzymes that can be studied using direct electrochemistry have at least one
surface-exposed redox center, which is the entry point for electrons from the electrode. The chance
of success is greater when the protein of interest is small and hydrophilic, or, if it is an enzyme,
when it has a large turnover rate. The ammount of protein required depends on which method is
used, but it can be as small as a few pmol for a series of experiments carried out with the same
��lm� of adsorbed proteins. The electrochemical equipment is particularly cheap (compared to
many biophysical techniques) and available in most chemistry labs.
An extensive description of most of the electrochemical techniques will be found in refs [1, 2].
The physical aspects of electrochemistry, including hydrodynamics, are discussed in [3,4]. Savéant
provided a comprehensive discussion of voltammetric wave shapes under various conditions, with
emphasis on the case where the electrocatalyst di�uses in solution [5]. Refs. [6, 7] are insightful
textbooks on enzyme kinetics. There are many comprehensive reviews on the use of direct elecro-
chemistry to probe the mechanism of redox proteins and enzymes [8�22]. Refs [16, 20] focus on
hydrogenases. Armstrong and coworkers discuss in ref [17] the applications of redox enzymes in
electrochemical devices. Ref [19] summarizes recent advances in the electrochemistry ofmembrane-
bound redox enzymes. Lojou reviews in ref. [22] the strategies for connecting hydrogenases to
electrodes.
2 Basics
2.1 Redox thermodynamics: the Nernst equation
Consider a reaction mixture containing the oxidised and reduced forms of two di�erent species (1
and 2):
Ox1 + Red2 → Red1 + Ox2 (1)
The free energy of the reaction (∆rG, in units of J/mol) is given by
∆rG = ∆rG0 + RT ln
[Red1][Ox2][Ox1][Red2]
(2)
R is the gas constant, T the absolute temperature and ∆rG0 is the (tabulated) standard free
energy of the reaction (�Standard conditions� means that the activity of all constituents is unity,
and the pressure equals one bar).
If equilibrium between the di�erent species is reached, ∆rG = 0, and the ratio of concentrations(the reaction quotient) is linked to ∆rG
0 by the relation:
Keq =[Red1]eq[Ox2]eq[Ox1]eq[Red2]eq
= exp(−∆rG
0
RT
)(3)
Initially upon mixing Ox1 and Red2, the concentrations of various species in the solution do
not satisfy eq. (3), and ∆rG is non zero: the system is not at equilibrium. Thermodynamics
predicts that reaction (1) will spontaneously proceed in the direction given by dG = ∆rGdξ < 0,where dξ is the change in the extent of reaction, until the reaction quotient equals Keq.
During the reaction, Red2 is oxidised and gives electrons to Ox1. The overall reaction can be
3
written as the sum of two �half-reactions�:
Ox1 + ne− → Red1 (4a)
Red2 → Ox2 + ne− (4b)
It is possible to measure the �ux of electrons from Red2 to Ox1, and therefore the rate dξ/dt of the
overall reaction, by placing the species in a two-compartment cell (Ox1 in one compartment and
Red2 in the other). Place in each side an electrode at which the species can interact. When the two
electrodes are connected together, a current �ows, while the system evolves towards equilibrium.
This current results from a potential di�erence between the two electrodes, V = E2 − E1, the
value of which can be predicted applying the Nernst equation to each of the two electrodes.
E = E0 +RT
nFln
[Ox][Red]
(5)
E0 is the standard reduction potential of the redox couple Ox/Red. F = 96500C is the Faraday
constant.1
The electrode potential given by eq. 5 cannot be measured; only the di�erence between the
potentials of two electrodes can. The potential di�erence between the electrodes in compartments
1 and 2 is:
V = E2 − E1 = E02 − E0
1 +RT
nFln
[Ox2][Red1][Red2][Ox1]
(6)
The electrons are going to �ow from the cell whose electrode potential is the lowest to the other
until V and ∆rG are zero and the concentrations satisfy
Keq =[Red1]eq[Ox2]eq[Ox1]eq[Red2]eq
= exp(−nF
RT(E0
2 − E01))
(7)
This is equivalent to eq. (3), since reduction potentials and free energies are linked by
∆rG0 = −nF (E0
1 − E02) (8)
The Nernst equation can therefore be used to determine the direction in which a redox reaction
will proceed spontaneously (eq. 6). Reaction (1) will proceed forward signi�cantly (Keq will be
large) only if E01 > E0
2 . If E01 is �high�, Ox1 is called a strong oxidant and Red1 is a weak
reductant. But it may not be enough to compare standard reduction potentials, since the sign
of ln [Ox2][Red1][Ox1][Red2]
in eq. (6) can change the sign of V (and ∆rG) and thus the direction of the
current �ow. Also remember that thermodynamics predicts the direction but not the rate of the
reaction: a �spontaneous� reaction might not happen because its rate is very small, in which case
the equilibrium cannot be reached.
It makes more sense, in our opinion, to call E0 a standard reduction potential than a standard
redox potential: the sign of ∆rG0 relates to a reaction proceeding in a certain direction, and the
sign of a standard reduction potential (as de�ned in eq. 8) is what it is because the associated
1Note that the usage is to call E the �electrode potential�, but strictly speaking, it is the di�erence betweenthe electrical potential of the metal electrode and the electrical potential of the solution adjacent to the metal,ΦM −ΦS [2]. The term ΦS cancels in an expression of the potential di�erence between two electrodes, as in eq. 6.
4
half-reaction is a reduction.
The reader should make sure he/she distinguishes between an electrode potential (the di�erence
between two electrode potentials is measured using a voltmeter, it has unit of Volt, and relates to
the free energy of the reaction, in units of J/mol) and a standard reduction potential (a thermo-
dynamic property which is related by eq. 8 to a strandard free energy of reaction). This should
not be confused with the electrochemical potential, in units of J/mol, which is the equivalent of
the partial free energy (or chemical potential) of a charged species with an additional term that
accounts for the e�ect of the electric potential.
2.2 Reference potential and reference electrodes
If one is interested in studying only one half-reaction, it is convenient to make sure that the poten-
tial di�erence between the two electrodes re�ects the potential of the electrode one is interested
in. This can be done by using in the other compartment an electrode designed to have a constant
potential: this is called a �reference electrode�.
The Standard Hydrogen Electrode (SHE) is one of these. It consists of a platinum electrode
immersed in a pH=0 electrolyte under 1 bar of H2.
A real SHE is rarely practical. Instead one uses convenient reference electrodes such as:
Hg/Hg2Cl2/KCl (Standard Calomel Electrode, SCE, E(SCE)=241mV vs. SHE.) This is the most
commonly used reference electrode
Hg/Hg2SO4/K2SO4, used when chloride ions must be avoided. E(SCE)=615mV vs. SHE.
Ag/AgCl (E=200mV vs. SHE)
Since only potential di�erences can be measured, reduction potentials can only be reported
against a certain reference electrode. The International Union of Pure and Applied Chemistry
requires that this primary reference electrode be the SHE. All reduction potentials tabulated in
the literature are (or should be) quoted versus the SHE. Therefore, by convention, the potential
of the SHE is zero.
2.3 The biological redox scale
Because standard conditions (pH 0!) are not suitable for biological reactions, reduction potentials
are usually stated for pH 7, and termed E0′ or Em,7.
Figure 1 gives an idea of the range of reduction potentials spanned by biologically important
redox cofactors and redox couples. It is important to realize that biological processes occur in
water, and that the oxidation and reduction of water set the limits of the narrow range of relevant
potentials. The reaction of a biological molecule under extreme (very oxidizing or very reducing)
conditions may be interesting from the point of view of chemistry, but physiologically irrelevant.
2.4 In�uence of coupled reactions (e.g. protonation or ligand binding)
on reduction potentials
Redox reactions can be coupled to other chemical equilibria such as ligand binding (e.g. protons,
substrate, inhibitor. . . ) or conformational changes.
5

Figure 1: The biological redoxscale at pH 7. �OEC� standsfor the �oxygen evolving center� ofPhotosystem II.
∆rG0
3 = −nFE0acid
Red:H
∆rG0
2 =
-2.3RTlog10 KRed
Red∆
rG0
1 = −nFE0alk
+e−
+e−
+H++H+∆rG0
4 =
-2.3RTlog10 KOx
Ox
Ox:H
Figure 2: Square scheme for a pro-tonation reaction coupled to a re-dox process.
A very common (and physiologically important) coupled reaction is protonation, as represented
in the square scheme in �g. 2. KOx and KRed are the acidity constants for Ox and Red. Utilising
the principle of thermodynamic cycles (the sum of ∆rG0 values round the square is zero), these
acidity constants can be linked to the reduction potentials of the protonated and un-protonated
redox couples. Note that potentials alone cannot be summed; they must be scaled by n.
For an n-electron, one-proton process, the whole pH-dependence of the reduction potential is
given by:
E0′([H+]) = E0alk +
2.3RT
nFlog10
1 + [H+]KRed
1 + [H+]KOx
(9)
This equation is demonstrated in the appendix. Usually Red is a better base than Ox, so it has a
higher pKa, i.e. pKOx < pKRed.
For pH < pKOx, both Ox and Red are protonated.
Ox : H + ne− → Red : H (10)
The reduction potential is pH independent, and equals E0acid (�g. 2).
For pH between pKOx and pKRed, Ox is not protonated but Red is.
Ox + ne− + H+ → Red : H (11)
6
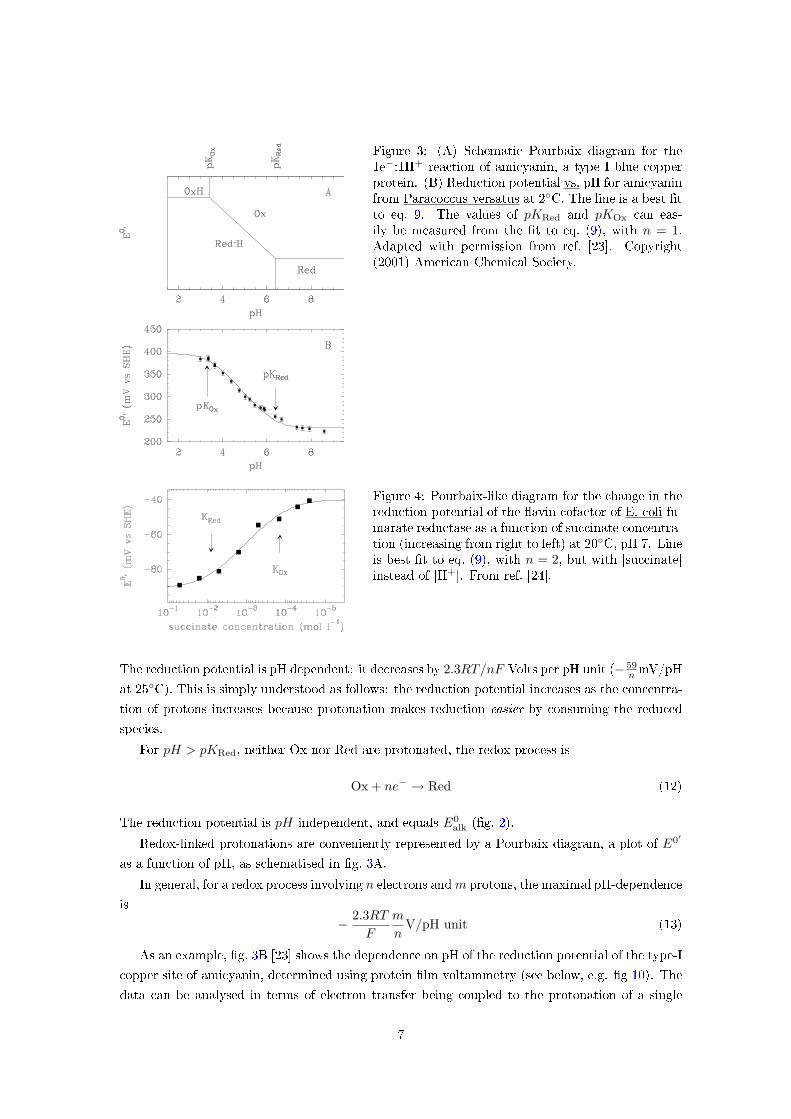
Figure 3: (A) Schematic Pourbaix diagram for the1e−:1H+ reaction of amicyanin, a type I blue copperprotein. (B) Reduction potential vs. pH for amicyaninfrom Paracoccus versatus at 2◦C. The line is a best �tto eq. 9. The values of pKRed and pKOx can eas-ily be measured from the �t to eq. (9), with n = 1.Adapted with permission from ref. [23]. Copyright(2001) American Chemical Society.
Figure 4: Pourbaix-like diagram for the change in thereduction potential of the �avin cofactor of E. coli fu-marate reductase as a function of succinate concentra-tion (increasing from right to left) at 20◦C, pH 7. Lineis best �t to eq. (9), with n = 2, but with [succinate]instead of [H+]. From ref. [24].
The reduction potential is pH dependent: it decreases by 2.3RT/nF Volts per pH unit (− 59n mV/pH
at 25◦C). This is simply understood as follows: the reduction potential increases as the concentra-
tion of protons increases because protonation makes reduction easier by consuming the reduced
species.
For pH > pKRed, neither Ox nor Red are protonated, the redox process is
Ox + ne− → Red (12)
The reduction potential is pH independent, and equals E0alk (�g. 2).
Redox-linked protonations are conveniently represented by a Pourbaix diagram, a plot of E0′
as a function of pH, as schematised in �g. 3A.
In general, for a redox process involving n electrons and m protons, the maximal pH-dependence
is
− 2.3RT
F
m
nV/pH unit (13)
As an example, �g. 3B [23] shows the dependence on pH of the reduction potential of the type-I
copper site of amicyanin, determined using protein �lm voltammetry (see below, e.g. �g 10). The
data can be analysed in terms of electron transfer being coupled to the protonation of a single
7
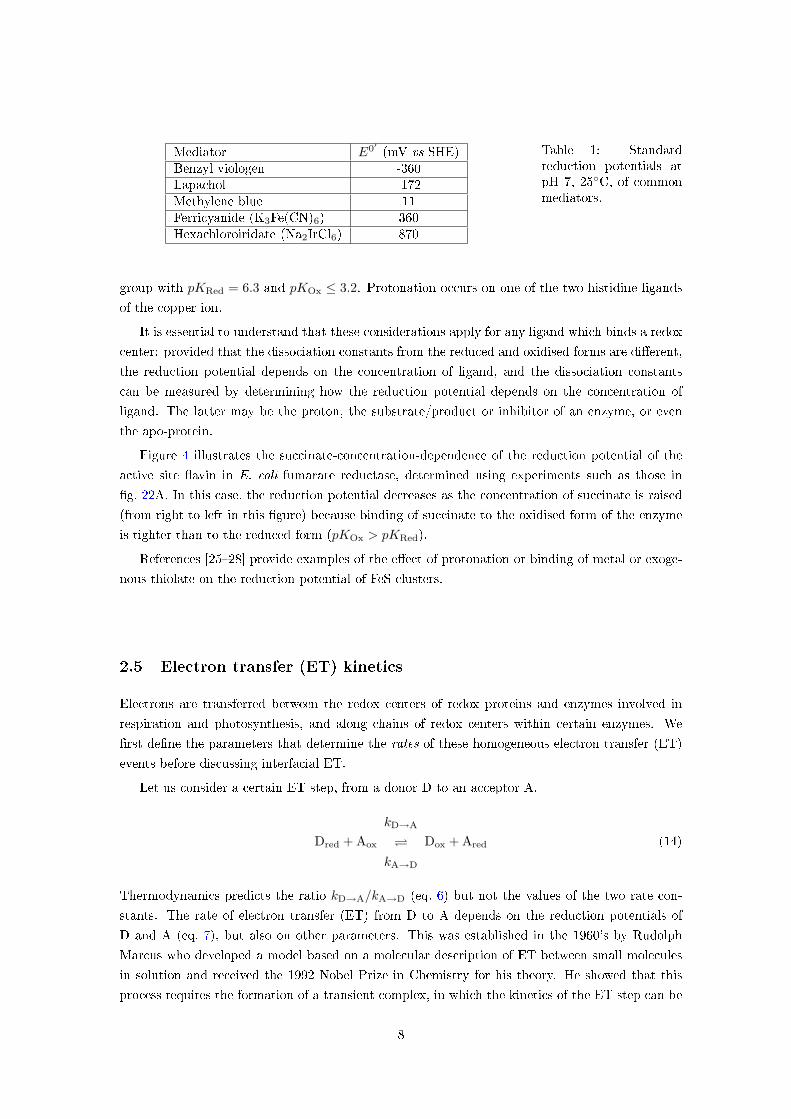
Mediator E0′ (mV vs SHE)Benzyl viologen -360Lapachol -172Methylene blue 11Ferricyanide (K3Fe(CN)6) 360Hexachloroiridate (Na2IrCl6) 870
Table 1: Standardreduction potentials atpH 7, 25◦C, of commonmediators.
group with pKRed = 6.3 and pKOx ≤ 3.2. Protonation occurs on one of the two histidine ligands
of the copper ion.
It is essential to understand that these considerations apply for any ligand which binds a redox
center: provided that the dissociation constants from the reduced and oxidised forms are di�erent,
the reduction potential depends on the concentration of ligand, and the dissociation constants
can be measured by determining how the reduction potential depends on the concentration of
ligand. The latter may be the proton, the substrate/product or inhibitor of an enzyme, or even
the apo-protein.
Figure 4 illustrates the succinate-concentration-dependence of the reduction potential of the
active site �avin in E. coli fumarate reductase, determined using experiments such as those in
�g. 22A. In this case, the reduction potential decreases as the concentration of succinate is raised
(from right to left in this �gure) because binding of succinate to the oxidised form of the enzyme
is tighter than to the reduced form (pKOx > pKRed).
References [25�28] provide examples of the e�ect of protonation or binding of metal or exoge-
nous thiolate on the reduction potential of FeS clusters.
2.5 Electron transfer (ET) kinetics
Electrons are transferred between the redox centers of redox proteins and enzymes involved in
respiration and photosynthesis, and along chains of redox centers within certain enzymes. We
�rst de�ne the parameters that determine the rates of these homogeneous electron transfer (ET)
events before discussing interfacial ET.
Let us consider a certain ET step, from a donor D to an acceptor A.
Dred + Aox
kD→A
kA→D
Dox + Ared (14)
Thermodynamics predicts the ratio kD→A/kA→D (eq. 6) but not the values of the two rate con-
stants. The rate of electron transfer (ET) from D to A depends on the reduction potentials of
D and A (eq. 7), but also on other parameters. This was established in the 1960's by Rudolph
Marcus who developed a model based on a molecular description of ET between small molecules
in solution and received the 1992 Nobel Prize in Chemistry for his theory. He showed that this
process requires the formation of a transient complex, in which the kinetics of the ET step can be
8

described by an equation of the form
kD→A = C exp(− (∆rG
0 + λ)2
4λRT
)(15)
• ∆rG0 is the standard free energy of the reaction, which is related to the standard reduction
potentials of the donor D and the acceptor A according to ∆rG0 = F (E0
D − E0A) (cf eq. 8).
• The parameter λ, called �reorganization energy,� is all the greater that large molecular rear-
rangements accompany the transfer (both the geometries of the molecules that are oxidized or
reduced and the polarization of the surrounding solvent are considered). Biological electron
transfers usually take place in the �normal region� (|∆rG0| < λ), where the rate constant
is increased when ∆E0 increases and λ decreases, but the �inverted region� plays a very
important role in photosynthetic electron transfers.
• The expression of the preexponential factor C depends on the strength of the electronic
coupling between the acceptor and the donor. If it is strong enough (�adiabatic� transfer), C
simply equates kT/h, as given by the classical transition state theory. When it is weak (this
is so for long-distance, �nonadiabatic� ET), C depends on the overlap of the molecular wave
functions of D and A, and therefore on the nature of the redox centers, on their distance and
on the intervening medium. An exponential decrease of C with distance is observed [29]. In
the literature, nonadiabatic transfers are often referred to as electron tunneling processes.
The relation between thermodynamics and kinetics is understood by calculating an equilibrium
constant from the ratio kD→A/kA→D (then compare with eq. 3):
kD→A
kA→D=
C exp(− (∆rG0+λ)2
4λRT
)C exp
(− (−∆rG0+λ)2
4λRT
) = exp−∆rG0/RT (16)
Now consider the electron transfer between a molecule and a metallic electrode (the case of
semiconducting electrodes is treated e.g. in ref [1]).
Redkox
kred
Ox + e−(electrode) (17)
The equation that gives the rate of ET is a complex function of the reduction potential of the
molecule E0′ , the electrode potential E, and the reorganization energy λ [5, 18] but a simpli�ed
rate equation, known as the �Butler Volmer equation,� predicts that the rates of oxidation and
reduction are independent on λ and exponentially increase and decrease (respectively) as the
electrode potential increases:
kox = k0 expF
2RT (E−E0′ ) (18a)
kred = k0 exp−F
2RT (E−E0′ ) (18b)
The preexponential factor k0 depends on the coupling between the electrode and the redox
9
molecule. The greater k0 the faster the electron exchange between the electrode and the re-
dox molecule; of course, this parameter has no physiological relevance. k0 is often called the rate
of electron transfer, but it is important to understand that rates of ET depend on electrode po-
tential, and the rate of ET equates k0 only when there is no driving force, at E = E0 (in which
case kox = kred = k0).
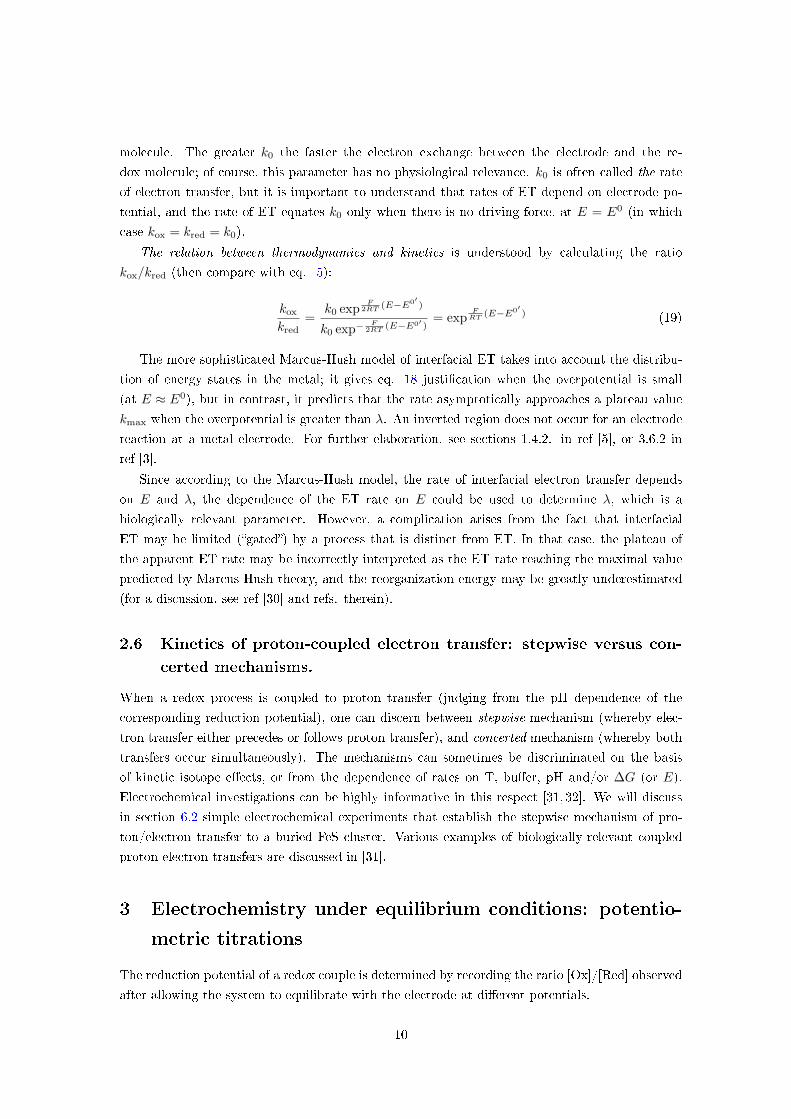
The relation between thermodynamics and kinetics is understood by calculating the ratio
kox/kred (then compare with eq. 5):
kox
kred=
k0 expF
2RT (E−E0′ )
k0 exp−F
2RT (E−E0′ )= exp
FRT (E−E0′ ) (19)
The more sophisticated Marcus-Hush model of interfacial ET takes into account the distribu-
tion of energy states in the metal; it gives eq. 18 justi�cation when the overpotential is small
(at E ≈ E0), but in contrast, it predicts that the rate asymptotically approaches a plateau value
kmax when the overpotential is greater than λ. An inverted region does not occur for an electrode
reaction at a metal electrode. For further elaboration, see sections 1.4.2. in ref [5], or 3.6.2 in
ref [3].
Since according to the Marcus-Hush model, the rate of interfacial electron transfer depends
on E and λ, the dependence of the ET rate on E could be used to determine λ, which is a
biologically relevant parameter. However, a complication arises from the fact that interfacial
ET may be limited (�gated�) by a process that is distinct from ET. In that case, the plateau of
the apparent ET rate may be incorrectly interpreted as the ET rate reaching the maximal value
predicted by Marcus-Hush theory, and the reorganization energy may be greatly underestimated
(for a discussion, see ref [30] and refs. therein).
2.6 Kinetics of proton-coupled electron transfer: stepwise versus con-
certed mechanisms.
When a redox process is coupled to proton transfer (judging from the pH dependence of the
corresponding reduction potential), one can discern between stepwise mechanism (whereby elec-
tron transfer either precedes or follows proton transfer), and concerted mechanism (whereby both
transfers occur simultaneously). The mechanisms can sometimes be discriminated on the basis
of kinetic isotope e�ects, or from the dependence of rates on T, bu�er, pH and/or ∆G (or E).
Electrochemical investigations can be highly informative in this respect [31, 32]. We will discuss
in section 6.2 simple electrochemical experiments that establish the stepwise mechanism of pro-
ton/electron transfer to a buried FeS cluster. Various examples of biologically-relevant coupled
proton-electron transfers are discussed in [31].
3 Electrochemistry under equilibrium conditions: potentio-
metric titrations
The reduction potential of a redox couple is determined by recording the ratio [Ox]/[Red] observed
after allowing the system to equilibrate with the electrode at di�erent potentials.
10

Figure 5: Potentiometric titration ofPseudomonas aeruginosa His117Gly azurin, atype-I blue copper protein (0.1mM protein, 20mMMES, pH 6, 33mM Na2SO4, 1M NaCl, 20◦C.) Thedi�erent symbols correspond to step-wise reductionand step-wise reoxidation. Plain line is best �tto eq. 20b with n = 1. The adsorption at 638nmis characteristic of the oxidised (blue) form of thecopper center. Mediators: K3Fe(CN)6, Na2IrCl6, 1,2-ferrocene dicarboxyl acid. Adapted with permissionfrom ref. [34]. Copyright (2000) American ChemicalSociety.
The potential is usually varied by adding titrants of an oxidant or a reductant. Unlike small
molecules, protein redox centers do not generally react rapidly with the measuring electrode and
equilibrium is not established quickly. To overcome this problem, small redox agents called media-
tors are added to the solution to transport electrons between the active site and the electrode. For
best results, these should have reduction potentials close to that of the active site being studied;
mixtures of mediators are often employed to cover a wide range. A short list of mediators and
their reduction potentials is given in table 1. See also ref [33].
The ratios [Ox]/[Red] are typically determined by examination of the optical or EPR spectra.
Very often, the concentration of Ox or Red is measured as a function of the electrode potential,
and the data are �tted with:
[Red] ∝ 11 + exp
(nFRT (E − E0′)
) (20a)
[Ox] ∝exp
(nFRT (E − E0′)
)1 + exp
(nFRT (E − E0′)
) (20b)
Fig. 5 is the result of a potentiometric titration of the �blue� (type-I) copper site in an azurin
mutant, followed by UV-vis spectroscopy. The oxidized copper site absorbs at ≈600nm due to a
Cys-S to Cu ligand-to-metal-charge-transfer, and the intensity of this band is therefore propor-
tional to the concentration of oxidized copper site.
Performing such experiment under fully anaerobic conditions requires a glove-box. . . or skills.
Dutton described the glassware that can be used on the bench for the anaerobic potentiometric
preparation of samples to be examined by EPR or UV-Vis spectroscopy [35,36].
4 Dynamic electrochemistry
4.1 Distinction between equilibrium and dynamic electrochemistry
In potentiometry experiments (sec. 3), the measurement of the electrode potential is carried out
under equilibrium conditions: the stepwise addition of titrant makes the concentrations change,
but when equilibrium is reached the rates of oxidation and reduction exactly cancel each other
and there is no net transformation. The reduction or oxidation is detected by spectroscopy, and
therefore this approach requires that the redox center has a distinct spectroscopic signature.
11
A completely di�erent approach consists in forcing the electrode potential to take a value that
is di�erent from the equilibrium potential. In that case, the system may evolve towards equilibrium
by taking electrons from (of giving electrons to) the electrode. This reduction (resp. oxidation) is
detected as a current (in unit of Ampere, that is Coulomb/second) which measures the amount
of electric charge passing the electrode per unit time. Therefore it is proportional to the rate of
reduction or oxidation.
4.2 Electrodes for electron transfer to/from proteins
To be successful, electrodes must exchange electrons quickly with the proteins, and preserve their
native properties. These electrodes may resemble natural environments or reaction partners for
the protein.
Electron transfer can be achieved if the redox center is exposed at the protein surface (or not
too deeply buried). In the case of enzymes whose active site is buried in the protein, a favorable
situation occurs when it is �wired� to the surface by a chain of redox cofactors; having one of these
centers exchanging electrons with the electrode is enough for achieving an electric connection of
the active site. Direct ET to enzymes was �rst reported in the late 1970's [37,38] and is now very
common, but not all redox enzymes can be electrically connected to electrodes.
Protein/electrode interactions may be tailored to be weak or strong. Weak interactions might
ideally give rise to di�usion-controlled electrochemistry (section 5), whereas with strong interac-
tions, the experiment may address just a small sample (��lm�) of protein molecules on the electrode
(sections 6 and 7).
Electrode surfaces for which protein electrochemistry is commonly observed are listed below:
• Metal (Au, Pt, Ag) surfaces on which a monolayer of adsorbate is self assembled (�Self
Assembled Monolayers� or SAMs [39]). The adsorbate is a bi-functional molecule of the
type X-(CH2)n-Y, where X is a substituant that anchors the molecule on the metal electrode
surface (e.g. a thiol) and Y is a functional group that interacts with the protein (typically
carboxyl for cytochromes c, or amino for acidic proteins such as plastocyanin or ferredoxins.)
• Pyrolytic graphite edge [40] or basal plane electrodes provide hydrophylic or hydrophobic
interactions, respectively. The former is sometimes used with co-adsorbates (aminocyclitols,
polymyxin, polylysine) which probably form cross-linkages between the protein and the
electrode surface.
• Graphite or carbon nanotubes can be functionalized by reducing a diazonium salt [41] to
expose aromatic functionalities [42] or amino groups [43, 44] that interact favorably with
hydrophobic or carboxylate-rich patches on the protein surface. Carbodiimide coupling can
then be used to form an amide bond between amino groups on the electrode surface and
protein carboxylates (or vice versa).
• Various electrode materials covered which either a �lm of non-biological surfactant (e.g.
DDAB) or layers of polyions have been used to incorporate large membrane-bound pro-
teins, but catalytic activity was generally greatly impaired. Suitable electrodes for integral
membrane enzymes are described in refs [19,45].
12

When the protein that is studied is an enzyme, proof that it is not denatured on the electrode
is that it can still catalyse the tranformation of its physiological substrate at a reasonnable rate
and in a range of electrode potential that is consistent with what we know about the catalytic cycle
and the redox properties of the cofactors. Checking the e�ects of known speci�c inhibitors can
also be useful. Upon starting a new project, and before embarking on detailed electrochemical
studies, it is essential to make sure that the catalytic properties of the adsorbed enzyme bear some
resemblance to those determined in biochemical experiments. In this chapter, we illustrate this by
also discussing the results of conventional experiments which con�rm certain unexpected results
obtained in electrochemical investigations of redox enzymes.
4.3 Electrochemical equipment
The experiment is carried out using an electrochemical analyser in conjunction with the cell. The
cell consists of three electrodes. The reference electrode is often contained in a side arm linked
to the main compartment by a capillary tip called a Luggin (after the glassblower who invented
it). The tip is positioned close to the working electrode. To avoid passing current through the
reference electrode (this would change its potential and also damage it), a third electrode, called
auxiliary or counter electrode, is used. The working electrode can also be rotated (sections 5.2
and 7) to control mass transport of solution species.
The analyser measures the current registered in response to the potential that is applied. In
general, the potential of the working electrode (versus the reference electrode) is modulated (e.g.
in a linear sweep) and the current �owing between the working electrode and the counter electrode
is recorded. Since the electrode potential is swept forward and back, the technique is called �cyclic
voltammetry�. The scan rate ν (in units of V/s) is a very important parameter which determines
the time-scale of the experiment and therefore the time constant of the processes which can be
resolved [5]. A voltammogram is a plot of current against electrode potential. Alternatively, in
an experiment called �chronoamperometry�, the electrode potential is held at a �xed value (or
sometimes stepwise changed) and the current is recorded as a function of time.
4.4 Vocab and conventions
A cathodic process is a reduction, the cathode is the electrode onto which the reduction occurs.
A anodic process is an oxidation, occuring at the anode.
In Europe, a cathodic current is counted as negative and an oxidation results in a positive
current. American people and softwares often use the opposite convention for the sign of the
current (see e.g. �g. 7).
4.5 The capacitive current
The measured current is usually the sum of a Faradaic current (which reveals the redox trans-
formations of molecules that come su�ciently close to the electrode) and a capacitive current
ic, which does not involve the passage of electrons across the electrode-solution interface. The
capacitive current (or �charging current�) arises as a consequence of the variation of the electrode
13
potential and it is proportional to the electrode surface A:
ic = CdE
dt= Cν (21)
where C, the capacitance of the electrode/electrolyte interface, is proportional to A.
In a voltammetric experiment, the magnitude of the capacitive current is therefore proportional
to scan rate ν. It is positive if E is increasing and negative if the electrode potential is swept down.
There is no capacitive contribution to the current if the potential is constant, but potential
steps (in chronoamperometry experiments) result in current transients that are approximately
exponential (ic < 0 if the potential is stepped down, ic > 0 if the potential is stepped up). This
current usually decays in less than a few seconds.
The capacitive current must be subtracted from the total current to obtain the Faradaic con-
tribution. It can sometimes be determined from a control experiment where there is no Faradaic
current, or extrapolated from the part of the signal where there is no Faradaic contribution (see
e.g. �g 10) [46].
5 Di�usion controlled Voltammetry
5.1 Di�usion controlled voltammetry at stationary electrodes
We consider a solution containing only the reduced form of a soluble electroactive species, and the
potential is swept linearly in time, as shown in �g. 6A, starting from a low potential. The current
response as a function of time is plotted in �g. 6B, and the cyclic voltammogram (current against
potential) in �g. 6C.
While the potential is lower than E0′ , no oxidation occurs and no current is measured [see (a)
in �gs. 6]. This is because the rate of oxidation kox = k0 expF
2RT (E−E0′ ) is much lower than the rate
of reduction kred = k0 exp−F2RT (E−E0′ ) (section 2.5). When the electrode potential approaches E0′ ,
Red starts being oxidised into Ox, giving electrons to the electrode. This is measured as a (positive)
current which increases as E and the rate of oxidation increase (b). However, the electrode oxidises
only species adjacent to it and the interface is soon depleted. The current reaches a maximum
before it starts to decrease (c). It tends to zero like t−1/2 (noting hat E changes in proportion to
time t). This decrease in current reveals that the size of the di�usion layer (i.e. the zone of the
solution adjacent to the electrode where the concentration of species di�er from that in the bulk)
increases by di�usion like the square root of time, and the concentration gradient that drives the
di�usion of Red from the bulk of the solution to the interface therefore decreases like t−1/2.
While a positive current is being measured, Ox produced by the reaction accumulates near the
electrode and di�uses slowly towards the bulk.
After the scan is reversed, (d), the current is still positive and decreasing: Red species are still
being oxidised since the electrode potential is above the reduction potential. Near the reduction
potential, the Ox species which have accumulated are now being reduced and a negative current
is observed (e) until the concentration of Ox near the interface drops down (f), and so does the
magnitude of the current.
This results in a peak-like response in both directions. The modeling of voltammograms is
14
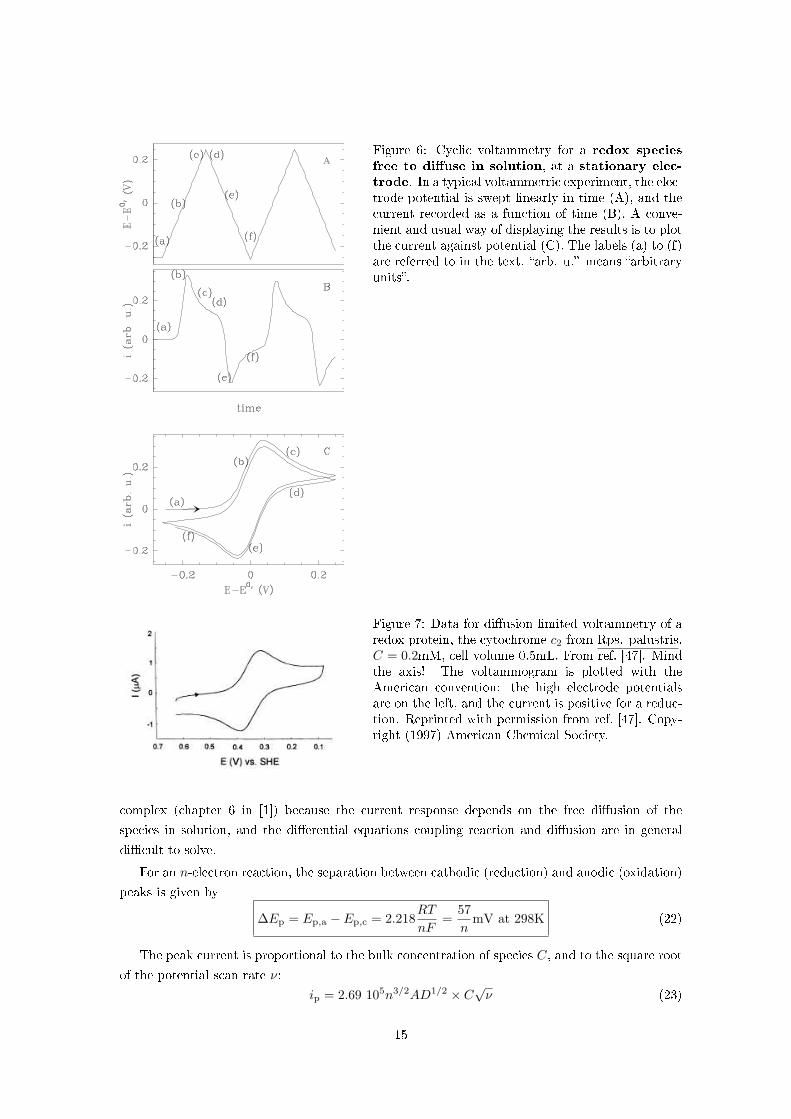
Figure 6: Cyclic voltammetry for a redox species
free to di�use in solution, at a stationary elec-
trode. In a typical voltammetric experiment, the elec-trode potential is swept linearly in time (A), and thecurrent recorded as a function of time (B). A conve-nient and usual way of displaying the results is to plotthe current against potential (C). The labels (a) to (f)are referred to in the text. �arb. u.� means �arbitraryunits�.
Figure 7: Data for di�usion limited voltammetry of aredox protein, the cytochrome c2 from Rps. palustris.C = 0.2mM, cell volume 0.5mL. From ref. [47]. Mindthe axis! The voltammogram is plotted with theAmerican convention: the high electrode potentialsare on the left, and the current is positive for a reduc-tion. Reprinted with permission from ref. [47]. Copy-right (1997) American Chemical Society.
complex (chapter 6 in [1]) because the current response depends on the free di�usion of the
species in solution, and the di�erential equations coupling reaction and di�usion are in general
di�cult to solve.
For an n-electron reaction, the separation between cathodic (reduction) and anodic (oxidation)
peaks is given by
∆Ep = Ep,a − Ep,c = 2.218RT
nF=
57n
mV at 298K (22)
The peak current is proportional to the bulk concentration of species C, and to the square root
of the potential scan rate ν:
ip = 2.69 105n3/2AD1/2 × C√
ν (23)
15
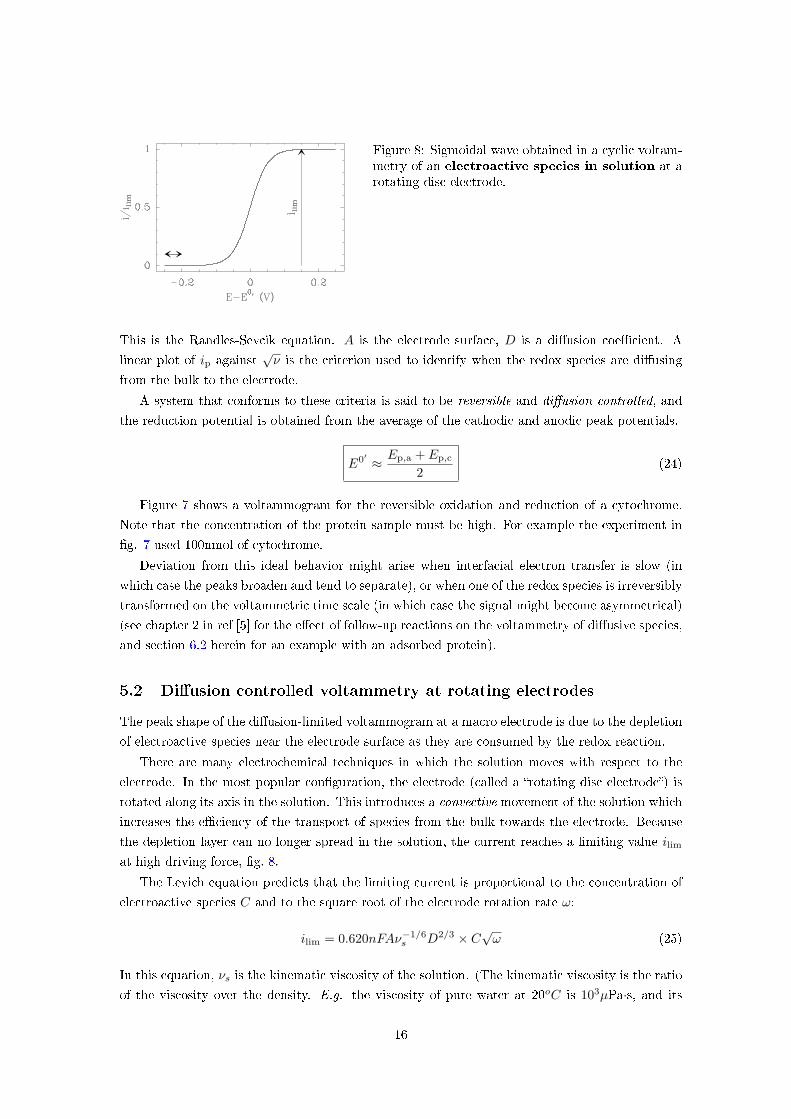
Figure 8: Sigmoidal wave obtained in a cyclic voltam-metry of an electroactive species in solution at arotating disc electrode.
This is the Randles-Sevcik equation. A is the electrode surface, D is a di�usion coe�cient. A
linear plot of ip against√
ν is the criterion used to identify when the redox species are di�using
from the bulk to the electrode.
A system that conforms to these criteria is said to be reversible and di�usion controlled, and
the reduction potential is obtained from the average of the cathodic and anodic peak potentials.
E0′ ≈ Ep,a + Ep,c
2(24)
Figure 7 shows a voltammogram for the reversible oxidation and reduction of a cytochrome.
Note that the concentration of the protein sample must be high. For example the experiment in
�g. 7 used 100nmol of cytochrome.
Deviation from this ideal behavior might arise when interfacial electron transfer is slow (in
which case the peaks broaden and tend to separate), or when one of the redox species is irreversibly
transformed on the voltammetric time scale (in which case the signal might become asymmetrical)
(see chapter 2 in ref [5] for the e�ect of follow-up reactions on the voltammetry of di�usive species,
and section 6.2 herein for an example with an adsorbed protein).
5.2 Di�usion controlled voltammetry at rotating electrodes
The peak shape of the di�usion-limited voltammogram at a macro electrode is due to the depletion
of electroactive species near the electrode surface as they are consumed by the redox reaction.
There are many electrochemical techniques in which the solution moves with respect to the
electrode. In the most popular con�guration, the electrode (called a �rotating disc electrode�) is
rotated along its axis in the solution. This introduces a convective movement of the solution which
increases the e�ciency of the transport of species from the bulk towards the electrode. Because
the depletion layer can no longer spread in the solution, the current reaches a limiting value ilim
at high driving force, �g. 8.
The Levich equation predicts that the limiting current is proportional to the concentration of
electroactive species C and to the square root of the electrode rotation rate ω:
ilim = 0.620nFAν−1/6s D2/3 × C
√ω (25)
In this equation, νs is the kinematic viscosity of the solution. (The kinematic viscosity is the ratio
of the viscosity over the density. E.g. the viscosity of pure water at 20oC is 103µPa·s, and its
16
density ≈ 1g/cm3; this gives a kinematic viscosity νs ≈ 10−2cm2/s.) A plot of i−1lim against ω−1/2
is called a Koutecky-Levich plot. The reduction potential E0′ is simply given by the half-wave
potential E1/2, the potential at which the current reaches half its limiting value.
E0′ = E1/2 (26)
The scan rate ν and direction do not enter the measurement if ν is small. When the current
depends on electrode potential but is independent of time, the voltammogram is said to be at
steady state.
This con�guration is not used for measuring the reduction potential of redox proteins, because
rotating the electrode in the solution requires that the volume of the electrochemical cell be large,
but it is important to understand the di�erence between this experiment and that show in �g
22A, since they give similar electrochemical responses for completely di�erent reasons.
The above considerations only apply to �macro�-electrodes (i.e. when the diameter of the
electrode is larger than the typical size of the di�usion layer). With a �micro�-electrode, whose
typical size is of the order of a few micrometers, the voltammogram may have a sigmoidal shape
even in the absence of convection (sec 5.2.2 in [1]). Reference [48] shows cyclic voltammograms of
amicyanin from P. denitri�cans at a 3µm gold micro electrode. Micro-electrodes have also been
used in the context of cell biology; their size make them suitable to detect electroactive species
released by a single cell. See e.g. ref [49] for a recent review.
6 Voltammetry of adsorbed proteins: Protein Film Voltam-
metry (PFV)
When the protein is immobilised on the electrode surface, di�usion is eliminated and much greater
thermodynamic and kinetic resolution can be obtained with extremely small sample quantities.
This approach was developed by F. Armstrong (now in Oxford) in the 1970's with small redox
proteins, and since the beginning of the 1980's with large redox enzymes. Over the last years,
this technique was used to study all sorts of aspects of the mechanism of redox proteins and
enzymes [18]: proton transfer [50] (cf section 6.2), inter and intramolecular electron transfer [51,52],
di�usion along substrate channels [53,54] (section 5) etc. The rest of this article will focus on the
principle and applications of protein �lm voltammetry.
6.1 Non-catalytic voltammetry at slow scan rates to measure reduction
potentials
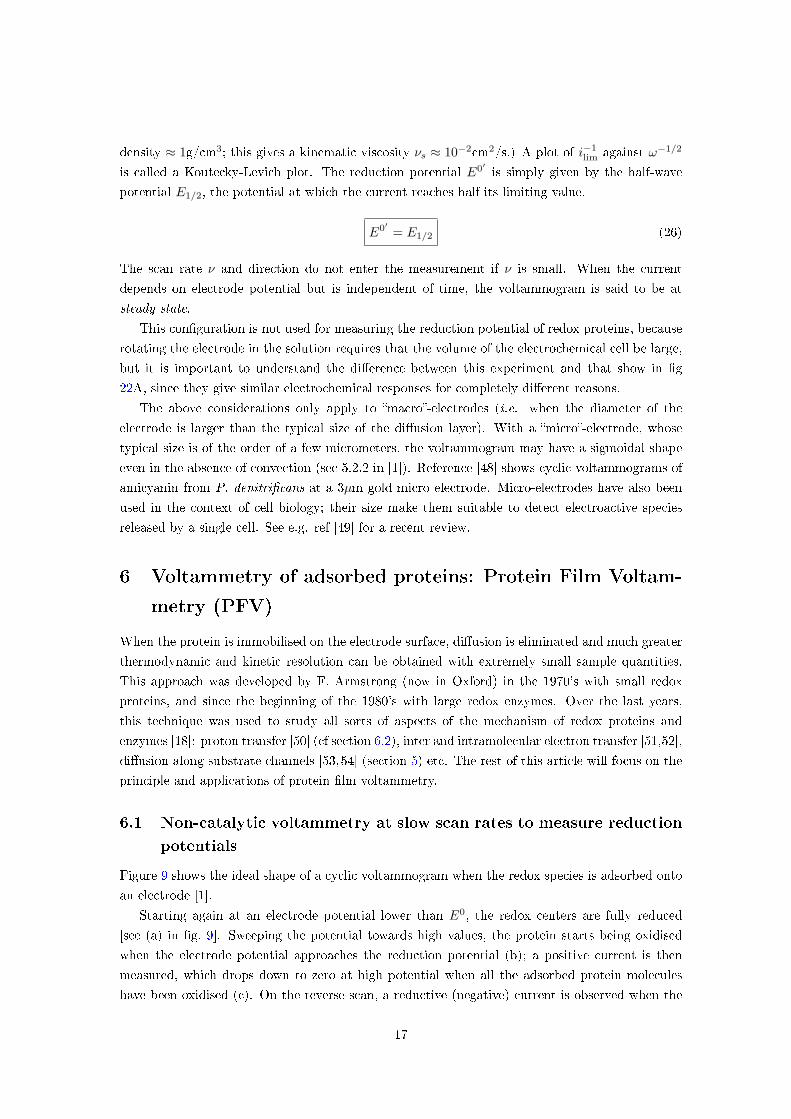
Figure 9 shows the ideal shape of a cyclic voltammogram when the redox species is adsorbed onto
an electrode [1].
Starting again at an electrode potential lower than E0, the redox centers are fully reduced
[see (a) in �g. 9]. Sweeping the potential towards high values, the protein starts being oxidised
when the electrode potential approaches the reduction potential (b); a positive current is then
measured, which drops down to zero at high potential when all the adsorbed protein molecules
have been oxidised (c). On the reverse scan, a reductive (negative) current is observed when the
17
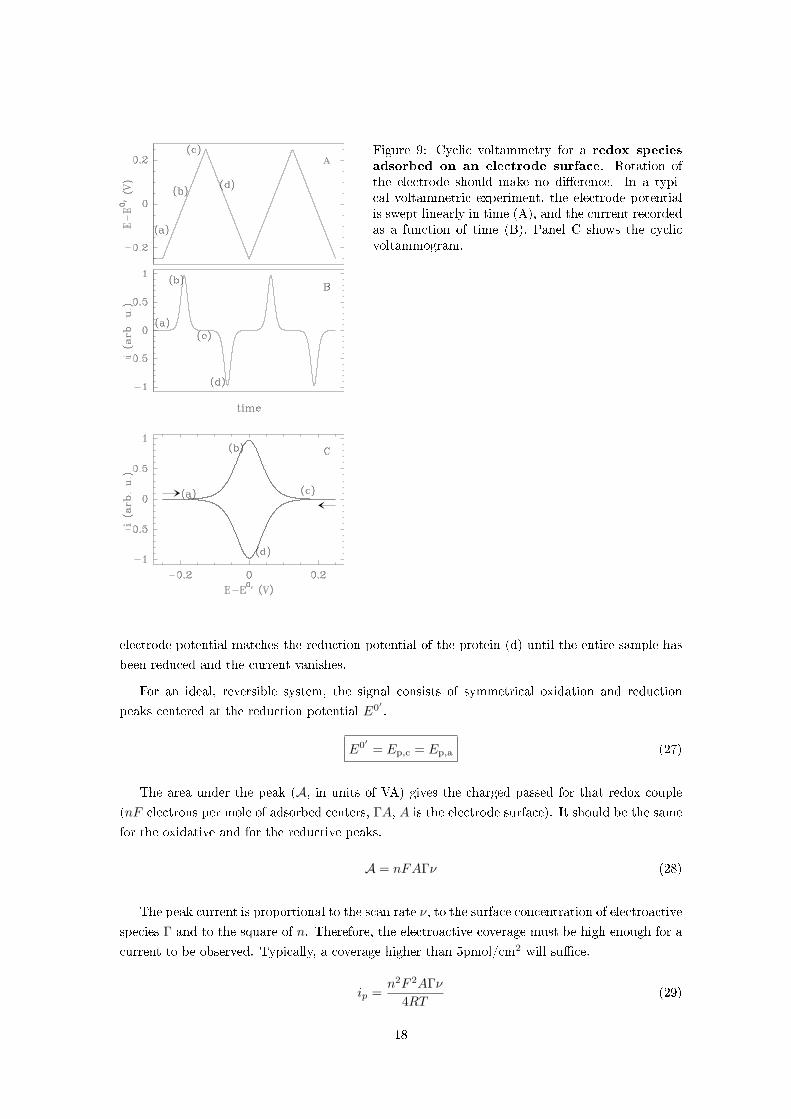
Figure 9: Cyclic voltammetry for a redox species
adsorbed on an electrode surface. Rotation ofthe electrode should make no di�erence. In a typi-cal voltammetric experiment, the electrode potentialis swept linearly in time (A), and the current recordedas a function of time (B). Panel C shows the cyclicvoltammogram.
electrode potential matches the reduction potential of the protein (d) until the entire sample has
been reduced and the current vanishes.
For an ideal, reversible system, the signal consists of symmetrical oxidation and reduction
peaks centered at the reduction potential E0′ .
E0′ = Ep,c = Ep,a (27)
The area under the peak (A, in units of VA) gives the charged passed for that redox couple
(nF electrons per mole of adsorbed centers, ΓA, A is the electrode surface). It should be the same
for the oxidative and for the reductive peaks.
A = nFAΓν (28)
The peak current is proportional to the scan rate ν, to the surface concentration of electroactive
species Γ and to the square of n. Therefore, the electroactive coverage must be high enough for a
current to be observed. Typically, a coverage higher than 5pmol/cm2 will su�ce.
ip =n2F 2AΓν
4RT(29)
18

Figure 10: Cyclic voltammogram forPseudomonas aeruginosa azurin adsorbed at apyrolytic graphite electrode. The dashed line isthe baseline and the inset shows the baseline sub-tracted current (the Faradaic current). 0◦C, pH 8.5.ν =20mV/s. ΓA ≈5.5pmol.
Figure 11: Cyclic voltammogram forSulfolobus acidocaldarius 7Fe ferredoxin adsorbedat a pyrolytic graphite electrode [55]. The dashedline is the baseline. 0◦C, pH 8.5, ν = 20mV/s.ΓA ≈3.5pmol.
Figure 12: Cyclic voltammograms (raw data out ofscale, base-line subtracted and deconvoluted signals)for E. coli fumarate reductase (FrdAB) adsorbed at apyrolytic graphite edge electrode. This enzyme con-tains 3 FeS clusters and a �avin cofactor. 20◦C, pH7 (top panel) & 9 (bottom panel), ν = 10mV/s. AtpH 7, FADox/FADred −50mV vs SHE, [2Fe2S]2+/+
−40mV , [4Fe4S]2+/+ −305mV , [3Fe4S]+/0 −65mV .ΓA ≈0.4pmol. Note the strong pH dependence of theFAD signal. Adapted with permission from ref [24].Copyright (2001) American Chemical Society.
A linear plot of ip against ν proves that the redox species are adsorbed onto the electrode.
The peak width at half height, δ, is:
δ ≈ 3.53RT
nF(30)
( 91n mV at 25◦C). Note that the expected dependence on temperature is not observed in experiments
[55,56].
Cooperative two-electron transfers give signals with up to four times the height and half the
width of one electron transfers; they are therefore more easily distinguished.
Figure 10 shows a non-catalytic voltammogram that makes it possible to determine the redox
potential of the copper site of azurin. In experiments, there is a capacitive contribution resulting
19
from �electrode charging� (section 4.5). The dashed line shows the interpolated capacitive current
which has to be subtracted to obtain the Faradaic current alone.
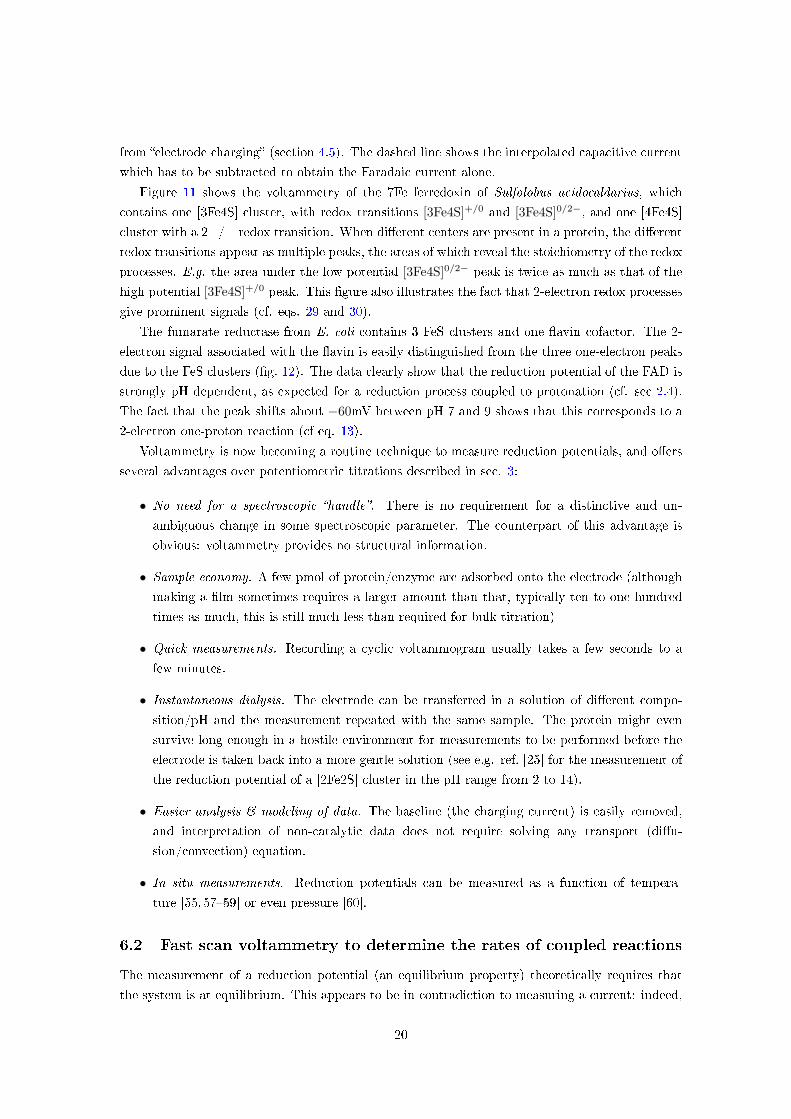
Figure 11 shows the voltammetry of the 7Fe ferredoxin of Sulfolobus acidocaldarius, which
contains one [3Fe4S] cluster, with redox transitions [3Fe4S]+/0 and [3Fe4S]0/2−, and one [4Fe4S]
cluster with a 2+/+ redox transition. When di�erent centers are present in a protein, the di�erent
redox transitions appear as multiple peaks, the areas of which reveal the stoichiometry of the redox
processes. E.g. the area under the low potential [3Fe4S]0/2− peak is twice as much as that of the
high potential [3Fe4S]+/0 peak. This �gure also illustrates the fact that 2-electron redox processes
give prominent signals (cf. eqs. 29 and 30).
The fumarate reductase from E. coli contains 3 FeS clusters and one �avin cofactor. The 2-
electron signal associated with the �avin is easily distinguished from the three one-electron peaks
due to the FeS clusters (�g. 12). The data clearly show that the reduction potential of the FAD is
strongly pH dependent, as expected for a reduction process coupled to protonation (cf. sec 2.4).
The fact that the peak shifts about −60mV between pH 7 and 9 shows that this corresponds to a
2-electron one-proton reaction (cf eq. 13).
Voltammetry is now becoming a routine technique to measure reduction potentials, and o�ers
several advantages over potentiometric titrations described in sec. 3:
• No need for a spectroscopic �handle�. There is no requirement for a distinctive and un-
ambiguous change in some spectroscopic parameter. The counterpart of this advantage is
obvious: voltammetry provides no structural information.
• Sample economy. A few pmol of protein/enzyme are adsorbed onto the electrode (although
making a �lm sometimes requires a larger amount than that, typically ten to one hundred
times as much, this is still much less than required for bulk titration)
• Quick measurements. Recording a cyclic voltammogram usually takes a few seconds to a
few minutes.
• Instantaneous dialysis. The electrode can be transferred in a solution of di�erent compo-
sition/pH and the measurement repeated with the same sample. The protein might even
survive long enough in a hostile environment for measurements to be performed before the
electrode is taken back into a more gentle solution (see e.g. ref. [25] for the measurement of
the reduction potential of a [2Fe2S] cluster in the pH range from 2 to 14).
• Easier analysis & modeling of data. The baseline (the charging current) is easily removed,
and interpretation of non-catalytic data does not require solving any transport (di�u-
sion/convection) equation.
• In situ measurements. Reduction potentials can be measured as a function of tempera-
ture [55,57�59] or even pressure [60].
6.2 Fast scan voltammetry to determine the rates of coupled reactions
The measurement of a reduction potential (an equilibrium property) theoretically requires that
the system is at equilibrium. This appears to be in contradiction to measuring a current: indeed,
20
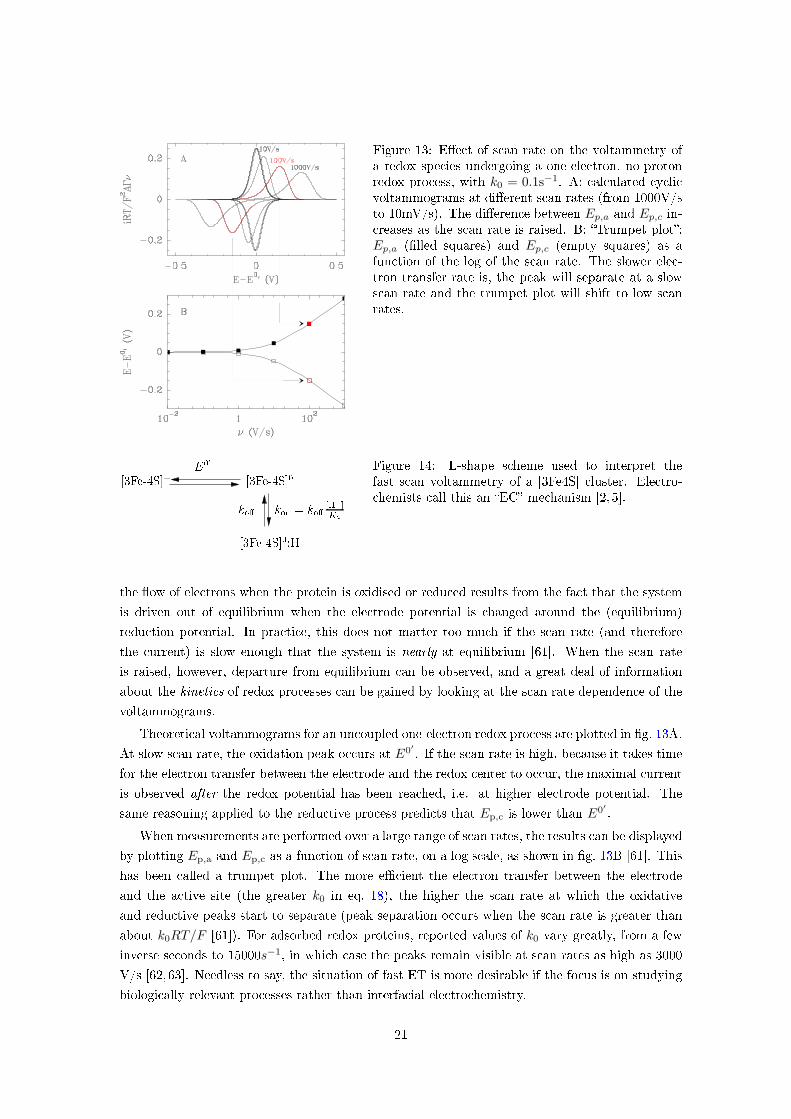
Figure 13: E�ect of scan rate on the voltammetry ofa redox species undergoing a one-electron, no-protonredox process, with k0 = 0.1s−1. A: calculated cyclicvoltammograms at di�erent scan rates (from 1000V/sto 10mV/s). The di�erence between Ep,a and Ep,c in-creases as the scan rate is raised. B: �Trumpet plot�:Ep,a (�lled squares) and Ep,c (empty squares) as afunction of the log of the scan rate. The slower elec-tron transfer rate is, the peak will separate at a slowscan rate and the trumpet plot will shift to low scanrates.
kon = ko� [H+]Ka[3Fe-4S]0:HE00 ko�[3Fe-4S]0[3Fe-4S]+ Figure 14: L-shape scheme used to interpret the
fast scan voltammetry of a [3Fe4S] cluster. Electro-chemists call this an �EC� mechanism [2,5].
the �ow of electrons when the protein is oxidised or reduced results from the fact that the system
is driven out of equilibrium when the electrode potential is changed around the (equilibrium)
reduction potential. In practice, this does not matter too much if the scan rate (and therefore
the current) is slow enough that the system is nearly at equilibrium [61]. When the scan rate
is raised, however, departure from equilibrium can be observed, and a great deal of information
about the kinetics of redox processes can be gained by looking at the scan rate dependence of the
voltammograms.
Theoretical voltammograms for an uncoupled one-electron redox process are plotted in �g. 13A.
At slow scan rate, the oxidation peak occurs at E0′ . If the scan rate is high, because it takes time
for the electron transfer between the electrode and the redox center to occur, the maximal current
is observed after the redox potential has been reached, i.e. at higher electrode potential. The
same reasoning applied to the reductive process predicts that Ep,c is lower than E0′ .
When measurements are performed over a large range of scan rates, the results can be displayed
by plotting Ep,a and Ep,c as a function of scan rate, on a log scale, as shown in �g. 13B [61]. This
has been called a trumpet plot. The more e�cient the electron transfer between the electrode
and the active site (the greater k0 in eq. 18), the higher the scan rate at which the oxidative
and reductive peaks start to separate (peak separation occurs when the scan rate is greater than
about k0RT/F [61]). For adsorbed redox proteins, reported values of k0 vary greatly, from a few
inverse seconds to 15000s−1, in which case the peaks remain visible at scan rates as high as 3000
V/s [62,63]. Needless to say, the situation of fast ET is more desirable if the focus is on studying
biologically relevant processes rather than interfacial electrochemistry.
21

Figure 15: E�ect of scan rateon the voltammetry of a redoxspecies undergoing a one-electron,one-proton redox process. Thedata are for the [3Fe4S]+/0 redoxcouple of a slow proton-transfermutant of Azodobacter vinelandiiferredoxin I (D15E) at low pH [50,64].
Fast scan voltammetry also gives information about the rates of the reactions that are coupled
to ET. If these coupled reactions (e.g. (de)protonation) are fast on the voltammetric time scale,
their e�ect is to shift the reduction potential of the redox couple (section 2.4), and also to decrease
the apparent rate of electron transfer, the parameter noted k0 in eq 18 (this e�ect is discussed
in a series of papers written by Etienne Laviron in the 1980's [65, 66], see also [32] and section
2.1.2.1 in ref [18]). In that case, the voltammogram remains reversible at very low scan rate, and
symmetrical but with greater peak separation when the scan rate is increased (�g. 13).
Recording voltammograms at increasing scan rates can be used for determining the value of k0,
but also to determine the rates of chemical processes that are coupled to electron transfer. From
a biological point of view, proton transfer is certainly the most important reaction coupled to
electron transfer, because the synthesis of ATP in most organism is coupled to long range proton
transfers across biological membranes [67], but the kinetics and mechanism of proton transfer are
di�cult to study using conventional techniques. It is remarkable that electrochemistry proved
very useful in this context [50,64], as described below.
Fig. 15 illustrates the voltammetric study of the [3Fe4S]+/0 one-electron one-proton reaction
(�g. 14), for a mutant of Azodobacter vinelandii ferredoxin I. High-resolution crystal structures
reveal that the [3Fe4S] is buried with no access to water molecules, and that a carboxylate group
from an aspartate (D15) is located close to the cluster on the protein surface. It was suggested that
a movement of this position 15 side chain may transfer a proton from the solvent to the cluster.
22
The experiments depicted in �g. 15 illustrate the use of fast-scan voltammetry to determine the
kinetics of protonation of the [3Fe4S] cluster in a mutant where D15 is replaced with a glutamate.
They were performed at pH 5.4, greater than pKOx and 1.3 pH unit lower than the pKRed = 6.7of the [3Fe4S] cluster, the reduced form of which is therefore protonated at equilibrium. The scans
were started from the high potential limit, and only the �rst scan is considered.
• At slow scan rates (panels A and B in �g. 15) oxidation and reduction peaks for the [3Fe4S]+/0
appear at the same electrode potential (≈ −350mV). Under these �close-to-equilibrium�
conditions, the reduction is followed by protonation, and oxidation proceeds along the reverse
route (�g. 14).
• When the scan rate is increased, oxidation and reduction peaks start to separate (�g. 15C).
• At scan rates between 1 and 10V/s, the reductive peak is still clearly visible, but the oxidation
peak vanishes (�g. 15D to F), because the cluster is trapped in the protonated form: it is
quickly protonated upon reduction, but the rate of de-protonation, koff in �g. 14, is too small
for the cluster to be de-protonated during the fast oxidative scan. The deprotonation of the
cluster �gates� its reoxidation.
• At very high scan rates, 20V/s and above (not shown), both peaks are observed, but the
average reduction potential is lower than at low scan rate, and matches the alkaline limit:
this is because the scan is reversed before the reduced cluster is protonated, and electron
transfer is therefore not coupled to protonation.
These very simple experiments determine the rates of (de)protonation. Electrochemistry can
achieve this because the time scale of potential modulation can be changed over orders of magni-
tude (1 min at 10mV/s to 1 ms at 1000V/s) to match that of the chemical events. In conjunction
with site-directed mutagenesis, crystallography, and molecular dynamics simulations, this made it
possible to obtain very original information about the molecular mechanism of protonation [50,64].
Several examples of voltammetric studies of coupled reactions, involving cytochromes and FeS
clusters, have been reported (see e.g. [30, 34,68]).
7 Catalytic protein �lm voltammetry and chronoamperom-
etry
7.1 Principle and general comments
In the absence of substrate and at su�ciently high coverage, a redox enzyme immobilized onto an
electrode gives peak-like signals resulting from the reversible transformation of its redox centers
(�g. 12). Upon adding substrate, the non-turnover peaks are transformed to sizeable �catalytic
waves� [69]: reaction with substrate transforms the active site, which is regenerated by electron
exchange with the electrode in a succession of catalytic cycles. The magnitude of the current
is proportional to electroactive coverage and to turnover rate, and so the relationship between
driving force (potential) and catalytic activity is traced in a single voltammetric experiment. Note
that catalysis may be observed even if coverage is too low to observe non-catalytic signals (as is
unfortunately often the case).
23
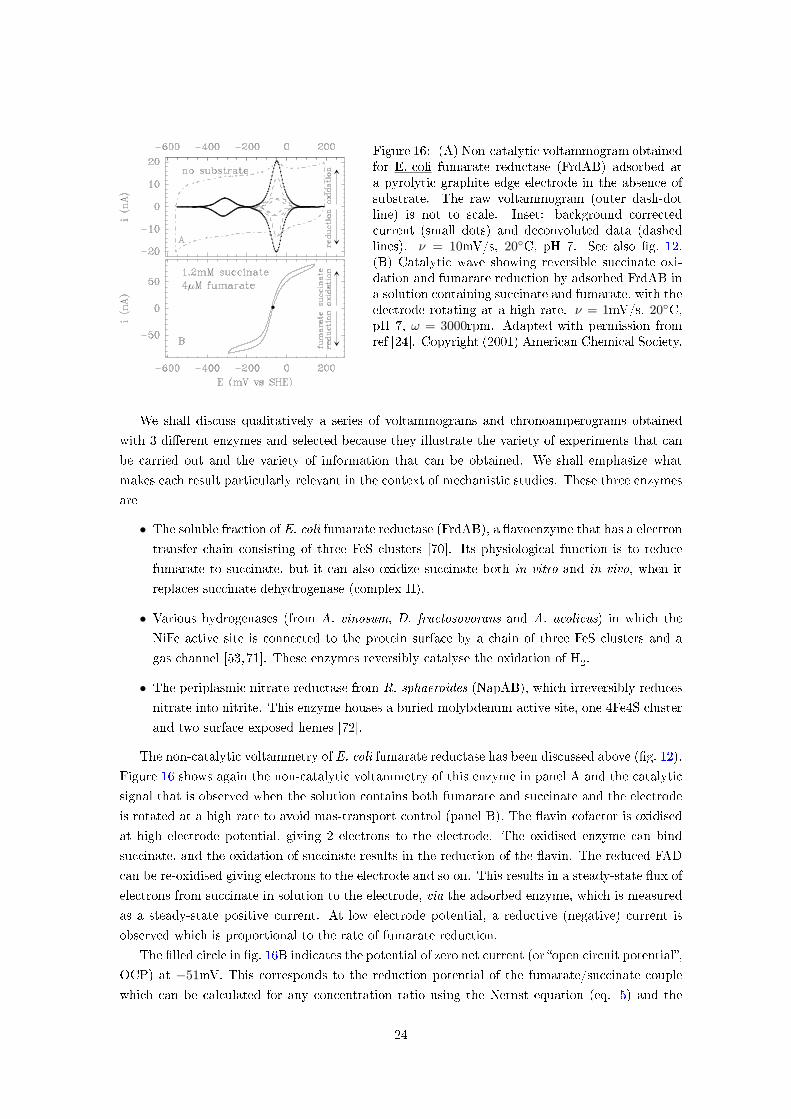
Figure 16: (A) Non-catalytic voltammogram obtainedfor E. coli fumarate reductase (FrdAB) adsorbed ata pyrolytic graphite edge electrode in the absence ofsubstrate. The raw voltammogram (outer dash-dotline) is not to scale. Inset: background correctedcurrent (small dots) and deconvoluted data (dashedlines). ν = 10mV/s, 20◦C, pH 7. See also �g. 12.(B) Catalytic wave showing reversible succinate oxi-dation and fumarate reduction by adsorbed FrdAB ina solution containing succinate and fumarate, with theelectrode rotating at a high rate. ν = 1mV/s, 20◦C,pH 7, ω = 3000rpm. Adapted with permission fromref [24]. Copyright (2001) American Chemical Society.
We shall discuss qualitatively a series of voltammograms and chronoamperograms obtained
with 3 di�erent enzymes and selected because they illustrate the variety of experiments that can
be carried out and the variety of information that can be obtained. We shall emphasize what
makes each result particularly relevant in the context of mechanistic studies. These three enzymes
are
• The soluble fraction of E. coli fumarate reductase (FrdAB), a �avoenzyme that has a electron
transfer chain consisting of three FeS clusters [70]. Its physiological function is to reduce
fumarate to succinate, but it can also oxidize succinate both in vitro and in vivo, when it
replaces succinate dehydrogenase (complex II).
• Various hydrogenases (from A. vinosum, D. fructosovorans and A. aeolicus) in which the
NiFe active site is connected to the protein surface by a chain of three FeS clusters and a
gas channel [53,71]. These enzymes reversibly catalyse the oxidation of H2.
• The periplasmic nitrate reductase from R. sphaeroides (NapAB), which irreversibly reduces
nitrate into nitrite. This enzyme houses a buried molybdenum active site, one 4Fe4S cluster
and two surface exposed hemes [72].
The non-catalytic voltammetry of E. coli fumarate reductase has been discussed above (�g. 12).
Figure 16 shows again the non-catalytic voltammetry of this enzyme in panel A and the catalytic
signal that is observed when the solution contains both fumarate and succinate and the electrode
is rotated at a high rate to avoid mas-transport control (panel B). The �avin cofactor is oxidised
at high electrode potential, giving 2 electrons to the electrode. The oxidised enzyme can bind
succinate, and the oxidation of succinate results in the reduction of the �avin. The reduced FAD
can be re-oxidised giving electrons to the electrode and so on. This results in a steady-state �ux of
electrons from succinate in solution to the electrode, via the adsorbed enzyme, which is measured
as a steady-state positive current. At low electrode potential, a reductive (negative) current is
observed which is proportional to the rate of fumarate reduction.
The �lled circle in �g. 16B indicates the potential of zero net current (or �open circuit potential�,
OCP) at −51mV. This corresponds to the reduction potential of the fumarate/succinate couple
which can be calculated for any concentration ratio using the Nernst equation (eq. 5) and the
24
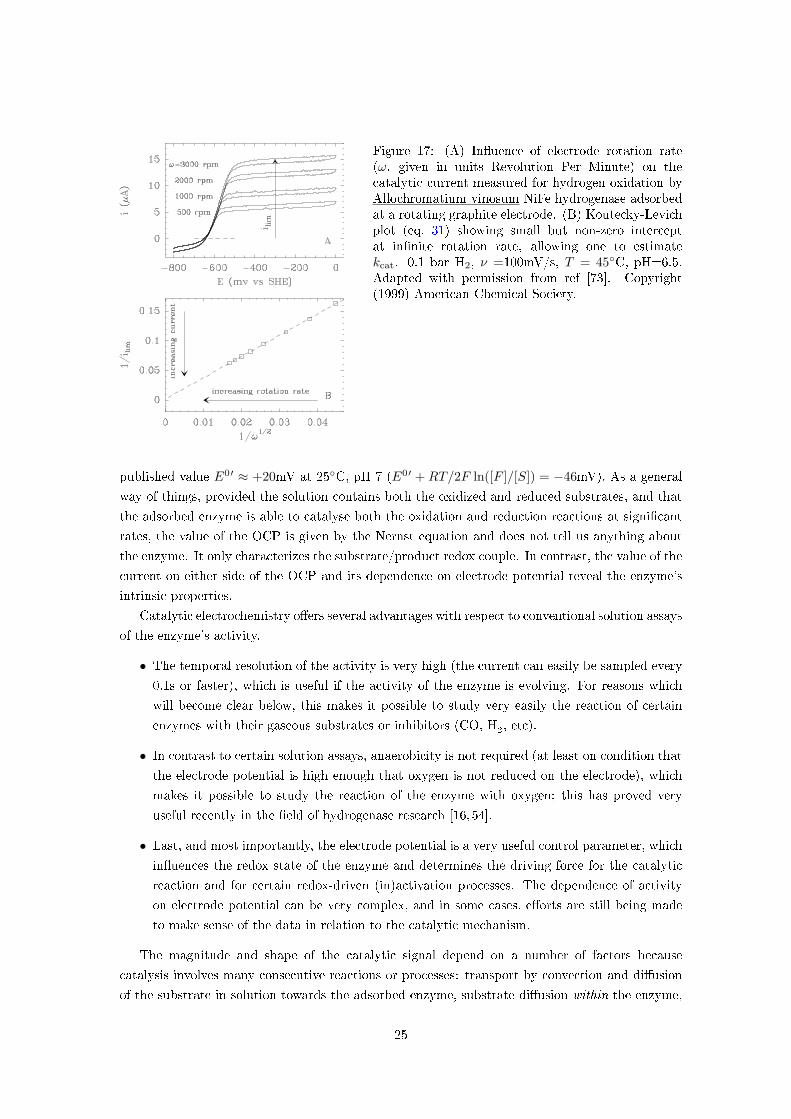
Figure 17: (A) In�uence of electrode rotation rate(ω, given in units Revolution Per Minute) on thecatalytic current measured for hydrogen oxidation byAllochromatium vinosum NiFe hydrogenase adsorbedat a rotating graphite electrode. (B) Koutecky-Levichplot (eq. 31) showing small but non-zero interceptat in�nite rotation rate, allowing one to estimatekcat. 0.1 bar H2, ν =100mV/s, T = 45◦C, pH=6.5.Adapted with permission from ref [73]. Copyright(1999) American Chemical Society.
published value E0′ ≈ +20mV at 25◦C, pH 7 (E0′ + RT/2F ln([F ]/[S]) = −46mV). As a general
way of things, provided the solution contains both the oxidized and reduced substrates, and that
the adsorbed enzyme is able to catalyse both the oxidation and reduction reactions at signi�cant
rates, the value of the OCP is given by the Nernst equation and does not tell us anything about
the enzyme. It only characterizes the substrate/product redox couple. In contrast, the value of the
current on either side of the OCP and its dependence on electrode potential reveal the enzyme's
intrinsic properties.
Catalytic electrochemistry o�ers several advantages with respect to conventional solution assays
of the enzyme's activity.
• The temporal resolution of the activity is very high (the current can easily be sampled every
0.1s or faster), which is useful if the activity of the enzyme is evolving. For reasons which
will become clear below, this makes it possible to study very easily the reaction of certain
enzymes with their gaseous substrates or inhibitors (CO, H2, etc).
• In contrast to certain solution assays, anaerobicity is not required (at least on condition that
the electrode potential is high enough that oxygen is not reduced on the electrode), which
makes it possible to study the reaction of the enzyme with oxygen; this has proved very
useful recently in the �eld of hydrogenase research [16,54].
• Last, and most importantly, the electrode potential is a very useful control parameter, which
in�uences the redox state of the enzyme and determines the driving force for the catalytic
reaction and for certain redox-driven (in)activation processes. The dependence of activity
on electrode potential can be very complex, and in some cases, e�orts are still being made
to make sense of the data in relation to the catalytic mechanism.
The magnitude and shape of the catalytic signal depend on a number of factors because
catalysis involves many consecutive reactions or processes: transport by convection and di�usion
of the substrate in solution towards the adsorbed enzyme, substrate di�usion within the enzyme,
25

its binding and transformation at the active site, product release and di�usion away from the
enzyme, regeneration of the redox state of the active site upon intramolecular electron transfer
(assuming there is a redox chain in the enzyme) and interfacial electron transfer between the
electrode and a redox center that is exposed at the protein surface.
The overall turnover rate depends on the slowest of these steps, noting that changing the
electrode potential changes the rates of the redox processes. This means that if one is interested
in studying the catalytic mechanism, one should try to reach a situation where interfacial electron
transfer and mass transport in solution do not limit the current. A good kinetic model will not
include all steps (this would lead to indetermination), but only those which in�uence the turnover
rate. Often the examination of the catalytic signal gives very useful information about which steps
matter, as discussed below. Although kinetic models exist and are adapted to many di�erent
situations, they will not be described below and we shall only refer the reader to the primary
literature. However, it is important to acknowledge that enzyme kinetics and electrochemistry are
quantitative sciences, and that by looking at the data too super�cially or qualitatively, one may
miss important information or misinterpret the data.
7.2 Mass-transport controlled catalytic voltammetry
Figure 17A illustrates the voltammetry for hydrogen oxidation by Allochromatium vinosum NiFe
hydrogenase adsorbed at a rotating disc electrode. In this experiment, the positive current at high
potential is proportional to the rate of catalytic H2oxidation and the negative current results
from proton reduction (H2evolution). The current tends to a limiting value at high potential,
which increases dramatically as the electrode rotation rate ω is raised [73]. This is because during
turnover the concentration of hydrogen near the electrode decreases, the enzyme is able to consume
H2 faster than it is brought to the electrode by the convective motion of the solution. The greater
the rotation rate, the more e�cient the transport of hydrogen from the bulk solution towards the
enzyme, and the greater the current (section 5.2). At in�nite rotation rate, the catalytic current is
�nite: mass transport is no longer rate limiting, and the extrapolated current reveals the intrinsic
e�ciency of the enzyme. The Koutecky-Levich plot in �g 17B appears to follow:
1ilim
≈ 1nFAΓ× (turnover rate)
+constant√
ω(31)
The equation above emphasizes departure from mass-transport control at high ω (compare to
eq. (25)), but it is not rigorous (see [74] and section 2.3.1 in ref. [18]).
This limitation by mass transport is all the more in�uential that the enzyme has high activity,
that the electrode coverage is high, and that the bulk concentration of substrate is small compared
to the Michaelis constant (indeed, under saturating conditions, a small decrease of interfacial
substrate concentration should have no e�ect on turnover rate).
The magnitude of the current is proportional to AΓ×kcat, and can give an estimate (sometimes
only a lower estimate) of kcat. Interestingly a study of hydrogenase showed that the turnover
number of the enzyme is signi�cantly higher than that observed in solution assays, using oxidizing
dyes [73]; in the latter case, it becomes evident that turnover in solution assays is limited by
electron transfer to the soluble electron partner, and that the electrode is a much faster electron
26

acceptor than the soluble dye.
7.3 Chronoamperometry to measure Michaelis and inhibition constants
In conventional biochemistry experiments, the rate of turnover is measured as a function of sub-
strate concentration to determine the Michaelis-Menten parameters (kcat, the maximal turnover
rate, and Km, the Michaelis constant):
turnover rate =kcat
1 + Km[S]
(32)
The same parameters can be determined from chronoamperometric experiments looking at the
substrate-concentration dependence of the current recorded at a �xed potential
i = nFAΓkcat
1 + Km[S]
(33)
In practice, this kind of measurement might be far from easy. (i) The limiting current is propor-
tional to AΓ, the total amount of enzyme adsorbed, which can be determined (with a very relative
accuracy) only when the electrode coverage is high enough for non-catalytic signals to be mea-
sured in the absence of substrate (eq. 28). (ii) The measurement of Km can be performed without
knowing the exact electroactive coverage. This requires however that the adsorbed �lm is stable
enough as a function of time for the coverage to be constant when currents are measured with
the same �lm in solutions of di�erent substrate concentrations. Reference [75] describes methods
for correcting the e�ect of �lm desorption. (iii) Last, eq. (33) does not take into account mass
transport of substrate in solution; this is correct only if there is no depletion of substrate near the
electrode. This should be checked for by looking at the rotation rate dependence of the current,
or using the rotation rate dependence to extrapolate the current at in�nite rotation rate.
Figure 18 shows the result of this simple chronoamperometric experiment, in a case where
it is particularly informative: nitrate reduction by the molybdoenzyme Rhodobacter sphaeroides
periplasmic nitrate reductase. Here, the e�ect of �lm desorption was corrected using a method
proposed in ref [75]. The nitrate reduction rates (negative current) shown in the middle row
were measured at two di�erent electrode potentials. The top panels show the concentration of
nitrate against time (each step corresponds to the injection in the electrochemical cell of a small
amount of a concentrated stock solution of nitrate). The bottom panels show the steady state
current at the end of each step plotted against nitrate concentration. At low potential (left
column), the change in current simply follows Michaelis Menten kinetics, whereas under less
reductive conditions (right column), high concentrations of nitrate inhibit the enzyme. This is
particularly relevant because experiments aimed at trapping catalytic intermediates before they
are characterized in spectroscopy are often carried out with very high concentrations of substrates;
in the case of nitrate reductase, were moderately reducing conditions are needed to detect a
Molybdenum(V) intermediate by EPR (the fully reduced Mo(IV) state is EPR-silent), �g. 18
demonstrates that these conditions favor the formation of an inactive enzyme, rather than a
catalytic intermediate [76]. Solution assays with two electron donors having di�erent reduction
potentials fully supported these electrochemical results [76].
27
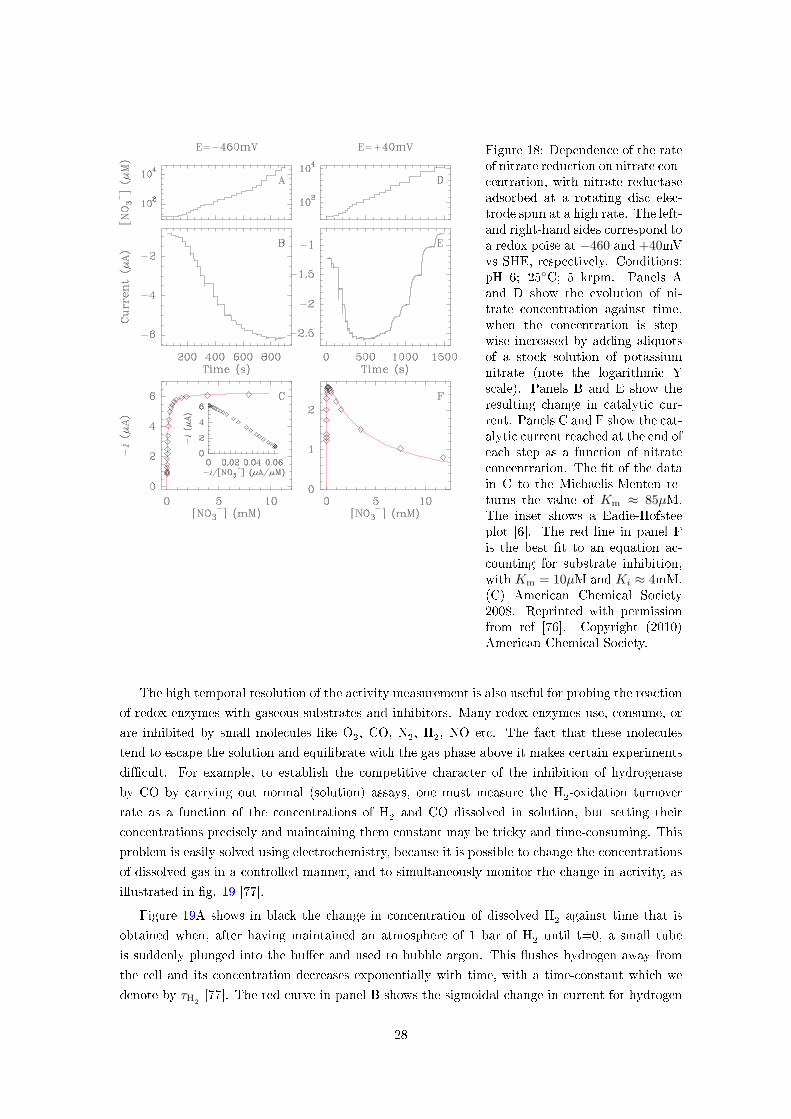
Figure 18: Dependence of the rateof nitrate reduction on nitrate con-centration, with nitrate reductaseadsorbed at a rotating disc elec-trode spun at a high rate. The left-and right-hand sides correspond toa redox poise at −460 and +40mVvs SHE, respectively. Conditions:pH 6; 25◦C; 5 krpm. Panels Aand D show the evolution of ni-trate concentration against time,when the concentration is step-wise increased by adding aliquotsof a stock solution of potassiumnitrate (note the logarithmic Yscale). Panels B and E show theresulting change in catalytic cur-rent. Panels C and F show the cat-alytic current reached at the end ofeach step as a function of nitrateconcentration. The �t of the datain C to the Michaelis-Menten re-turns the value of Km ≈ 85µM.The inset shows a Eadie-Hofsteeplot [6]. The red line in panel Fis the best �t to an equation ac-counting for substrate inhibition,with Km = 10µM and Ki ≈ 4mM.(C) American Chemical Society2008. Reprinted with permissionfrom ref [76]. Copyright (2010)American Chemical Society.
The high temporal resolution of the activity measurement is also useful for probing the reaction
of redox enzymes with gaseous substrates and inhibitors. Many redox enzymes use, consume, or
are inhibited by small molecules like O2, CO, N
2, H
2, NO etc. The fact that these molecules
tend to escape the solution and equilibrate with the gas phase above it makes certain experiments
di�cult. For example, to establish the competitive character of the inhibition of hydrogenase
by CO by carrying out normal (solution) assays, one must measure the H2-oxidation turnover
rate as a function of the concentrations of H2and CO dissolved in solution, but setting their
concentrations precisely and maintaining them constant may be tricky and time-consuming. This
problem is easily solved using electrochemistry, because it is possible to change the concentrations
of dissolved gas in a controlled manner, and to simultaneously monitor the change in activity, as
illustrated in �g. 19 [77].
Figure 19A shows in black the change in concentration of dissolved H2against time that is
obtained when, after having maintained an atmosphere of 1 bar of H2until t=0, a small tube
is suddenly plunged into the bu�er and used to bubble argon. This �ushes hydrogen away from
the cell and its concentration decreases exponentially with time, with a time-constant which we
denote by τH2[77]. The red curve in panel B shows the sigmoidal change in current for hydrogen
28
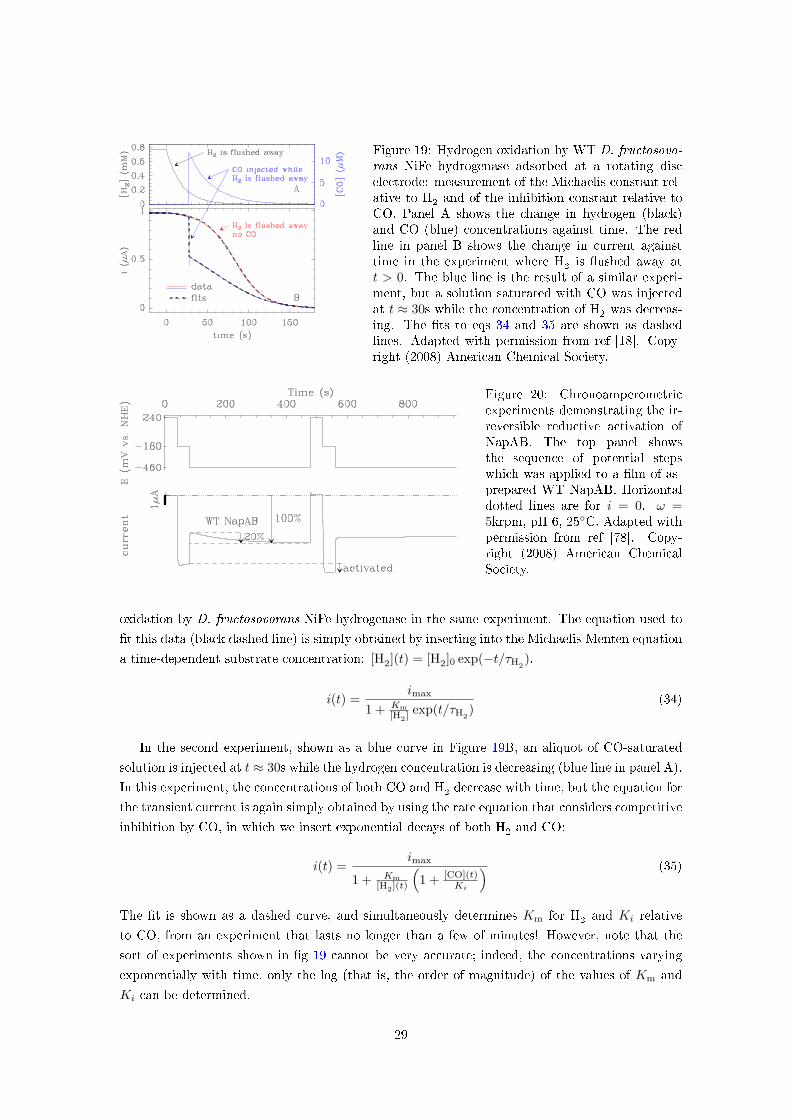
Figure 19: Hydrogen oxidation by WT D. fructosovo-rans NiFe hydrogenase adsorbed at a rotating discelectrode: measurement of the Michaelis constant rel-ative to H
2and of the inhibition constant relative to
CO. Panel A shows the change in hydrogen (black)and CO (blue) concentrations against time. The redline in panel B shows the change in current againsttime in the experiment where H
2is �ushed away at
t > 0. The blue line is the result of a similar experi-ment, but a solution saturated with CO was injectedat t ≈ 30s while the concentration of H
2was decreas-
ing. The �ts to eqs 34 and 35 are shown as dashedlines. Adapted with permission from ref [18]. Copy-right (2008) American Chemical Society.
Figure 20: Chronoamperometricexperiments demonstrating the ir-reversible reductive activation ofNapAB. The top panel showsthe sequence of potential stepswhich was applied to a �lm of as-prepared WT NapAB. Horizontaldotted lines are for i = 0. ω =5krpm, pH 6, 25◦C. Adapted withpermission from ref [78]. Copy-right (2008) American ChemicalSociety.
oxidation by D. fructosovorans NiFe hydrogenase in the same experiment. The equation used to
�t this data (black dashed line) is simply obtained by inserting into the Michaelis-Menten equation
a time-dependent substrate concentration: [H2](t) = [H2]0 exp(−t/τH2).
i(t) =imax
1 + Km[H2]
exp(t/τH2)
(34)
In the second experiment, shown as a blue curve in Figure 19B, an aliquot of CO-saturated
solution is injected at t ≈ 30s while the hydrogen concentration is decreasing (blue line in panel A).In this experiment, the concentrations of both CO and H
2decrease with time, but the equation for
the transient current is again simply obtained by using the rate equation that considers competitive
inhibition by CO, in which we insert exponential decays of both H2and CO:
i(t) =imax
1 + Km[H2](t)
(1 + [CO](t)
Ki
) (35)
The �t is shown as a dashed curve, and simultaneously determines Km for H2and Ki relative
to CO, from an experiment that lasts no longer than a few of minutes! However, note that the
sort of experiments shown in �g 19 cannot be very accurate; indeed, the concentrations varying
exponentially with time, only the log (that is, the order of magnitude) of the values of Km and
Ki can be determined.
29

7.4 Chronoamperometry to resolve rapid changes in activity
Nitrate reductase is reversibly inactivated at high concentration of nitrate and moderate potential
(�gs 18 and 22F); in addition to that, it also irreversibly activates the �rst time it is reduced.
This is clear from the chronoamperogram in Figure 20, which shows the response of a fresh �lm
of periplasmic nitrate reductase immersed into a solution of nitrate when the potential is stepped
as indicated in the upper panel. When the potential is poised at E = −160mV (at t = 40s), thecurrent is essentially constant. On the step to −460mV, at t = 80s, the activity �rst instantly
decreases (the current becomes less negative) and then slowly increases before it stabilizes. This
slow change in current demonstrates that the enzyme activates at low potential. The magnitude of
the activation phase accounts for 20% of the current reached after activation. The instant decrease
in activity when the potential is �rst stepped from −160 to −460mV is not surprising considering
the steady state pro�le in Figure 22D. When this sequence of potential steps is repeated with the
same �lm of enzyme (from t = 480s, the activity detected at E = −160mV is greater than at
the same potential in the �rst experiment, as indicated by the downward arrow, and no further
activation occurs on the second step to −460mV, at t ≈ 560s. Therefore, the activation proceeds
only once, on the �rst step to −460mV, and it is not reversed by taking back the enzyme to
oxidizing conditions (+240mV): it is irreversible.
This irreversible reductive activation cannot be detected in solution assays of the enzyme, be-
cause assaying the enzyme requires that it is reduced, and this reduction activates the sample.
Therefore the enzyme molecules that are already active and those that require reductive activa-
tion are indistinguishable in solution assays. In contrast, the temporal resolution of the activity
measurement in PFV is high enough that the activity can be measured while the enzyme is acti-
vating (�g 18). This is reminiscent of the �redox-cycling� experiment with R. capsulatus DMSO
reductase : the enzyme has greater activity for DMS oxidation after it has been reduced [79].
Furthermore, the reductive activation of nitrate reductase is very relevant because its amplitude
correlates with the concentration of a certain Mo(V) EPR signal (the so-called �high-g� signal)
present in the sample before activation, demonstrating that, unlike all expectations, this signature
arises from an inactive state which activates the �rst time the enzyme is reduced [78].
On a di�erent note, chronoampetrometry experiments with hydrogenase make it easy to char-
acterize quantitatively the kinetics of inhibition by CO (and also O2). The experiment in �g. 21
consists in monitoring the H2-oxidation current after the concentration of CO �rst suddenly in-
creases when an aliquot of solution saturated with inhibitor is injected in the electrochemical cell,
and then slowly returns to zero as the bu�er is �ushed by a stream of H2(ref [77] and section 2.4.2
in ref [18]). The concentration of H2is nearly constant, and the inhibitor concentration follows an
exponential decay (panel A). The concentration of inhibitor need not be independently measured
because its change against time is de�ned by the amount of inhibitor that is injected and by the
time constant of the decay, which is determined by �tting the change in current [77]. If binding
and/or release of the inhibitor is slow, the change in activity is delayed from the time of injection
and the rates of inhibition can be measured [53].
In the case of the WT enzyme from D. fructosovorans (at 40◦C), the decrease in activity after
CO injection is too fast to be resolved (black squares in �g. 21B). Also, the recovery of activity
follows exactly the decrease in CO concentration as the latter is �ushed away from the cell. In
30

Figure 21: Inhibition by CO of H2 oxidation by the na-tive form of D. fructosovorans NiFe hydrogenase anda variant where a double mutation narrows the gaschannel [53, 54]. Panel A: CO concentration againsttime. Panel B: the change in current against time forthe WT enzyme (black) and the mutant (red). Themodelling of these data directly gives the rates of dif-fusion along the channel [53, 54, 80]. The aliquot ofsolution saturated with CO was injected at t = 0. 1bar H2, E = −160mV, pH7, 40◦C, 3krpm. Reprintedwith permission from ref [18]. Copyright (2008) Amer-ican Chemical Society.
contrast, the red signal was obtained with a mutants of the enzyme, where amino acids whose
side chains point inside the substrate channel connecting the active site to the solvent have been
substituted [53]. Clearly, the binding and release of CO are much slower, suggesting that CO
di�uses slowly within the mutant, to and from the active site. The data can be �t to the model in
ref [80] to measure the rate constants corresponding to di�usion in the channel in either direction.
Independent experiments based on solution assays of the isotope-exchange reaction con�rmed the
e�ects of the mutations on the rates of intramolecular di�usion, and proved that the di�erence
between the two signals in �g. 21 is not an artifact resulting from the presence of the electrode [53].
Similar electrochemical experiments could be carried out to determine how the mutations of
amino acids whose side chains point into the channel of hydrogenase a�ect the rates of binding
and release of CO, O2and H
2, and protein �lm voltammetry is now a unique tool for studying
how the structure of gas channels a�ects intramolecular di�usion rates [53,54,81].
7.5 Determining the reduction potentials of an active site bound to
substrate
Chronoamperometry experiments are usually easy to analyse, whereas understanding the pro�le
of activity against potential sometimes demands e�ort. Figure 22 shows various catalytic voltam-
mograms obtained with FrdAB, NapAB and hydrogenases adsorbed at rotating disk electrodes.
We shall now discuss their shape (as opposed to merely their magnitude) and explain what can be
learned about the enzyme from each signal.
We examine �rst succinate oxidation by E. coli fumarate reductase, FrdAB (Fig. 22A). Like all
other data in this �gure, this signal was obtained with the electrode rotating at a very high rate, so
that mass transport was not in�uential. The background (capacitive) current is shown as a dotted
line. At low electrode potential, the enzyme and its active site are reduced and unable to oxidize
succinate, there is no activity and no Faradaic current. At very high potential the current tends
to a limit (a plateau), which is independent of electrode rotation rate, and represents the maximal
turnover rate when the enzyme is oxidized at a very high rate and therefore remains fully oxidized
in the steady-state. In between the two, the activity increases when the electrode potential becomes
high enough that the active site �avin becomes oxidized. The position of the in�ection point of
the main catalytic wave is a phenomenological parameter often called the �catalytic potential�. By
31
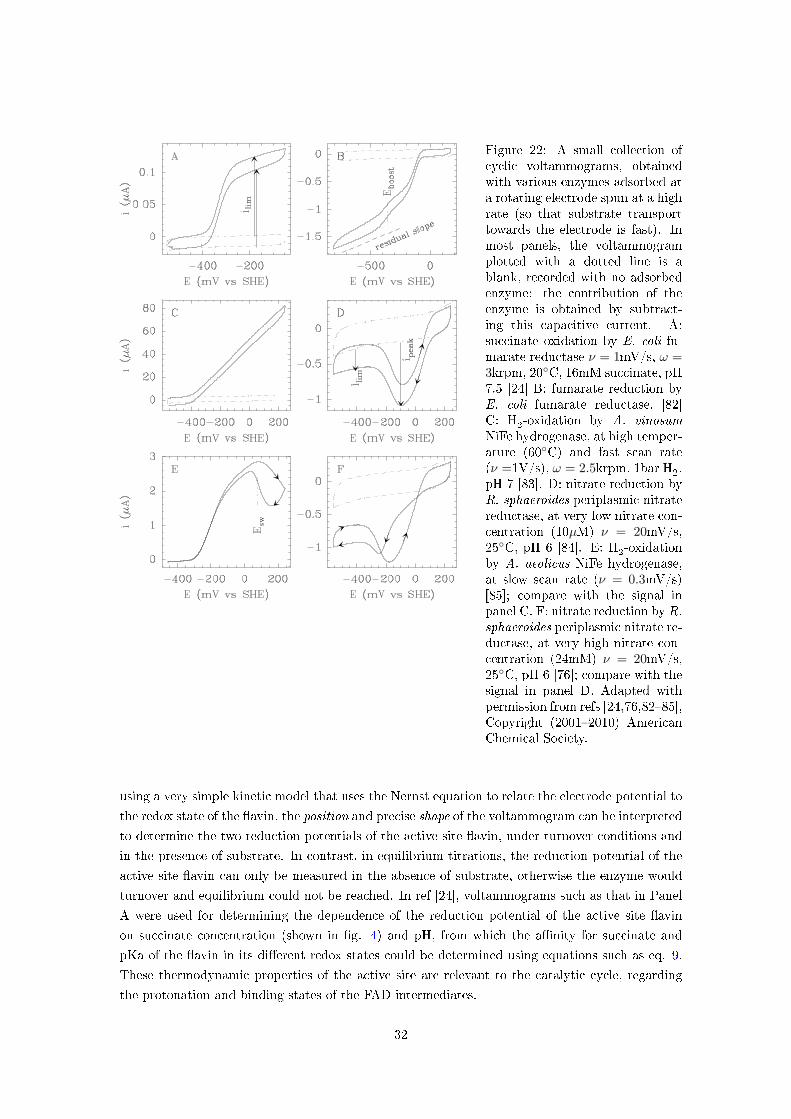
Figure 22: A small collection ofcyclic voltammograms, obtainedwith various enzymes adsorbed ata rotating electrode spun at a highrate (so that substrate transporttowards the electrode is fast). Inmost panels, the voltammogramplotted with a dotted line is ablank, recorded with no adsorbedenzyme: the contribution of theenzyme is obtained by subtract-ing this capacitive current. A:succinate oxidation by E. coli fu-marate reductase ν = 1mV/s, ω =3krpm, 20◦C, 16mM succinate, pH7.5 [24] B: fumarate reduction byE. coli fumarate reductase. [82]C: H
2-oxidation by A. vinosum
NiFe hydrogenase, at high temper-ature (60◦C) and fast scan rate(ν =1V/s), ω = 2.5krpm, 1bar H
2,
pH 7 [83]. D: nitrate reduction byR. sphaeroides periplasmic nitratereductase, at very low nitrate con-centration (10µM) ν = 20mV/s,25◦C, pH 6 [84]. E: H
2-oxidation
by A. aeolicus NiFe hydrogenase,at slow scan rate (ν = 0.3mV/s)[85]; compare with the signal inpanel C. F: nitrate reduction by R.sphaeroides periplasmic nitrate re-ductase, at very high nitrate con-centration (24mM) ν = 20mV/s,25◦C, pH 6 [76]; compare with thesignal in panel D. Adapted withpermission from refs [24,76,82�85],Copyright (2001�2010) AmericanChemical Society.
using a very simple kinetic model that uses the Nernst equation to relate the electrode potential to
the redox state of the �avin, the position and precise shape of the voltammogram can be interpreted
to determine the two reduction potentials of the active site �avin, under turnover conditions and
in the presence of substrate. In contrast, in equilibrium titrations, the reduction potential of the
active site �avin can only be measured in the absence of substrate, otherwise the enzyme would
turnover and equilibrium could not be reached. In ref [24], voltammograms such as that in Panel
A were used for determining the dependence of the reduction potential of the active site �avin
on succinate concentration (shown in �g. 4) and pH, from which the a�nity for succinate and
pKa of the �avin in its di�erent redox states could be determined using equations such as eq. 9.
These thermodynamic properties of the active site are relevant to the catalytic cycle, regarding
the protonation and binding states of the FAD intermediates.
32
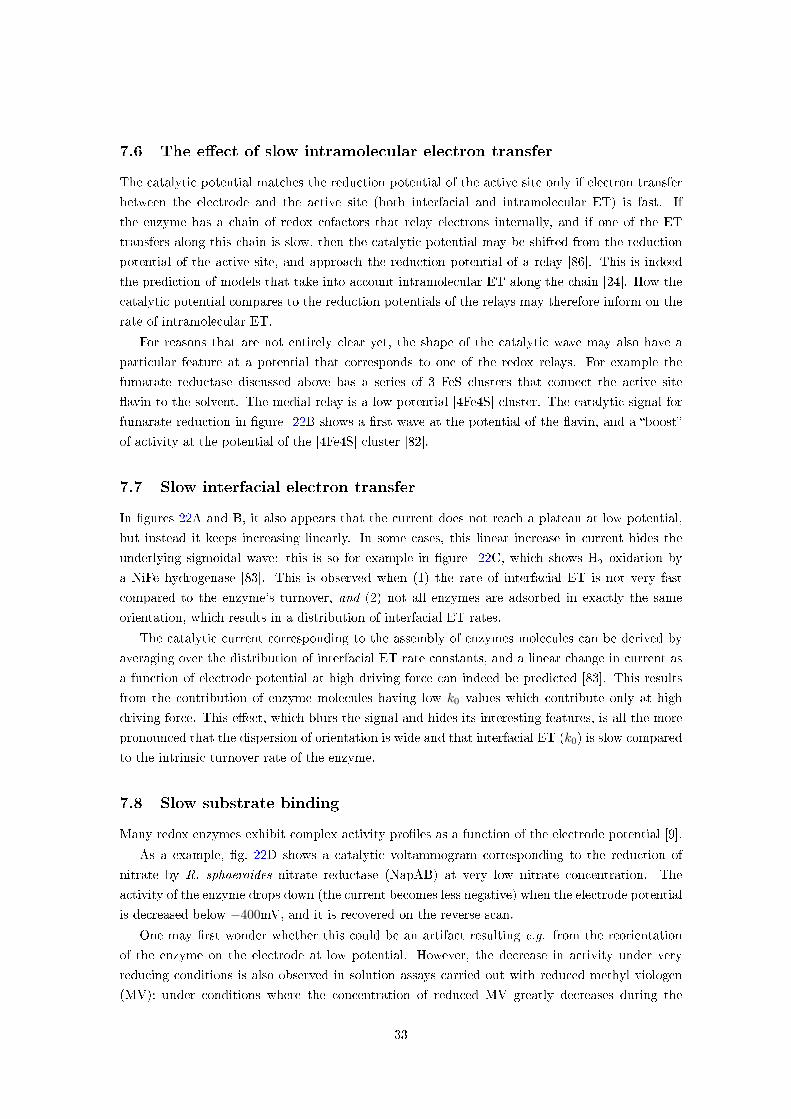
7.6 The e�ect of slow intramolecular electron transfer
The catalytic potential matches the reduction potential of the active site only if electron transfer
between the electrode and the active site (both interfacial and intramolecular ET) is fast. If
the enzyme has a chain of redox cofactors that relay electrons internally, and if one of the ET
transfers along this chain is slow, then the catalytic potential may be shifted from the reduction
potential of the active site, and approach the reduction potential of a relay [86]. This is indeed
the prediction of models that take into account intramolecular ET along the chain [24]. How the
catalytic potential compares to the reduction potentials of the relays may therefore inform on the
rate of intramolecular ET.
For reasons that are not entirely clear yet, the shape of the catalytic wave may also have a
particular feature at a potential that corresponds to one of the redox relays. For example the
fumarate reductase discussed above has a series of 3 FeS clusters that connect the active site
�avin to the solvent. The medial relay is a low potential [4Fe4S] cluster. The catalytic signal for
fumarate reduction in �gure 22B shows a �rst wave at the potential of the �avin, and a �boost�
of activity at the potential of the [4Fe4S] cluster [82].
7.7 Slow interfacial electron transfer
In �gures 22A and B, it also appears that the current does not reach a plateau at low potential,
but instead it keeps increasing linearly. In some cases, this linear increase in current hides the
underlying sigmoidal wave: this is so for example in �gure 22C, which shows H2oxidation by
a NiFe hydrogenase [83]. This is observed when (1) the rate of interfacial ET is not very fast
compared to the enzyme's turnover, and (2) not all enzymes are adsorbed in exactly the same
orientation, which results in a distribution of interfacial ET rates.
The catalytic current corresponding to the assembly of enzymes molecules can be derived by
averaging over the distribution of interfacial ET rate constants, and a linear change in current as
a function of electrode potential at high driving force can indeed be predicted [83]. This results
from the contribution of enzyme molecules having low k0 values which contribute only at high
driving force. This e�ect, which blurs the signal and hides its interesting features, is all the more
pronounced that the dispersion of orientation is wide and that interfacial ET (k0) is slow compared
to the intrinsic turnover rate of the enzyme.
7.8 Slow substrate binding
Many redox enzymes exhibit complex activity pro�les as a function of the electrode potential [9].
As a example, �g. 22D shows a catalytic voltammogram corresponding to the reduction of
nitrate by R. sphaeroides nitrate reductase (NapAB) at very low nitrate concentration. The
activity of the enzyme drops down (the current becomes less negative) when the electrode potential
is decreased below −400mV, and it is recovered on the reverse scan.
One may �rst wonder whether this could be an artifact resulting e.g. from the reorientation
of the enzyme on the electrode at low potential. However, the decrease in activity under very
reducing conditions is also observed in solution assays carried out with reduced methyl viologen
(MV): under conditions where the concentration of reduced MV greatly decreases during the
33

assay, so that the driving force for the reduction of nitrate decreases as a function of time, the
activity measured in solution increases before MV is completely exhausted [87] (see also ref [88]
for similar experiment with complex II). This mirrors the observation in �g 22D: starting from
the low potential limit, the activity increases when the electrode potential is increased. This
acceleration of turnover upon consumption of reduced MV was also made with the periplasmic
nitrate reductase from P. pantotrophus, which exhibits the same voltammetry as in �gure 22D
[89] and Rhodobacter capsulatus periplasmic DMSO reductase [90], which belongs to the same
family of molybdoenzymes. The membrane bound DMSO reductase from E. coli was the �rst
molybdoenzyme for which a signature like that in as �g. 22D was observed [91]. Therefore,
this peculiar relation between driving force and activity appears to be a common property of all
reductases from the DMSO reductase family.
Although the concept of pH optima for enzyme activity is well established [6,7], the possibility
that activity of redox enzymes might be optimised within a narrow range of potential has been
explored only recently. While pH optima give mechanistic information on protonation equilibria
during catalysis, potential optima provide information on the roles played by di�erent oxidation
states of redox-active sites. Certain redox transitions may regulate electron �ow to or from the
active site. Or substrate binding or atom transfer may occur only when the active site is in a
certain oxidation state. These relationships are di�cult to observe by conventional techniques
but can be revealed by protein �lm voltammetry, due to its ability to measure subtle changes in
catalytic activity as the electrode potential is varied.
Considering the signal in �g. 22D, we now wonder what makes the activity drops under very
reducing conditions. It has been proposed that the �switch o�� results from the reduction of the
[4Fe4S] cluster that relays electrons towards the active site [92]. However, there appears to be
no correlation between the reduction potential of the [4Fe4S] cluster and the position of the low
potential feature in the voltammogram [87]. It has also been proposed that the complex shape may
result from the fact that catalysis can follow distinct routes, as substrate binding either precedes
or follows the reduction of the active site, and the relative rates of the two reactions determine
which track is used [91]. Indeed, changing the electrode potential changes the rate of reduction of
the active site, which may make electron transfer faster or slower than substrate binding. When
substrate binding to any redox state of the active site is taken into account in kinetic models, all
sorts of complex waveshapes can indeed be predicted (see �g. 3 in ref [84]), and the signal in �g
22D can indeed be accurately predicted [84,93].
7.9 Slow, redox-driven (in)activation
So far, we have only considered steady-state voltammograms, where the current depends on elec-
trode potential but not on time, and the catalytic signal is therefore independent of scan rate and
sweep direction. For example the switch on and o� observed in �g 22D is observed at the same
potential irrespective of whether the potential is scanned towards positive of negative potential,
suggesting that whichever reaction triggers this modulation of activity is fast on the time scale of
the voltammetric experiment (not necessarily so on the time scale of turnover).
Sometimes, the enzyme undergoes slow activation or inactivation processes as the potential is
varied, and this results in a strong hysteresis: the magnitude of the current depends on time and
34

sample history, and the voltammogram depends on scan rate and direction (but this is not caused
by the di�usion of the substrate, contrary to the situation discussed in section 5).
For example, NiFe hydrogenases reversibly deactivate under oxidizing conditions due to the
over-oxidation of the active site. The enzyme has to be reduced (e.g. incubated with hydrogen or
reduced MV) for the activity to be recovered. Figure 22E is a catalytic voltammogram showing H2
oxidation with A. aeolicus NiFe hydrogenase. It is recorded essentially in the same conditions as in
�g. 22C but for a slow scan rate (recording a whole catalytic voltammogram at this scan rate takes
one hour). The activity of the enzyme, measured as a positive current, decreases above −200mV,and the activity is recovered as the potential is taken down. However, because the inactivation
and reactivation are slow on the time scale of the voltammetry, the (in)activation reactions lag
behind the change in electrode potential, resulting in a characteristic hysteresis. This inactivation
was not observed in the electrochemical experiments depicted in �g. 22C because the scan rate
was too fast: the enzyme was taken to high potential and back before the inactivation reaction
could proceed [69]. One can also design experiments in which the electrode potential is held, and
the slow change in current resulting from the (in)activation measured, to study the kinetics and
mechanism of (in)activation [85,94].
The shape of the signal in �g 22E is now fully understood, and a very important conclusion
from the theoretical study is that the potential where the activity is recovered on the scan towards
low potential is not the reduction potential of the inactive state [85] (a clear simple observation
suggesting that it is not a thermodynamic quantity is indeed that its value is greatly dependent of
scan rate over the entire range of accessible scan rates). This illustrates a pitfall of the qualitative
interpretation of the voltammograms: an in�ection point in a voltammogram cannot always be
equated to a reduction potential.
The catalytic voltammogram in �gure 22F may be the most complex reported to date. It shows
how the nitrate reductase signal in �g 22D is deformed by a reversible (in)activation process that
decreases the activity at high potential, and increases it under reducing conditions. The resulting
strong hysteresis at high potential is only detected at a high concentration of nitrate (1M in panel
E, compared to 10µM in panel D). This is another manifestation of the inhibition of the enzyme
by its substrate that we discussed in relation to �gure 18, right column [76].
8 Softwares
An open-source program called SOAS [46] has been developed, �rst in the group of F Armstrong
in Oxford and then in our lab in Marseilles, with the aim of analysing one-dimensional signals. It
o�ers a large set of commands for handling voltammetric and chronoamperometric data. It is free
of charge and can be compiled on computers running any �avor of Unix or Linux (including Mac
OS X). Binary installers for MacOS X and Debian/Unbuntu distributions of Linux are available.
See installation instructions on our web page at http://bip.cnrs-mrs.fr/bip06/software.html.
A new version of the program, QSOAS, is currently being developped in our group. It will
eventually become available for all OS (including Windows). Check our web pages for updates.
35
Figure 23: E�ect of electrode rotation on the cat-alytic voltammetry of E. coli fumarate reductase(FrdAB) in a solution initially free of fumarate.[S] =50mM≈200×Ksuccinate
m .
9 PFV Quiz
In �g. 23, we have plotted two voltammograms recorded with a �lm of E. coli fumarate reductase in
contact with a solution containing only succinate at a concentration [S] =50mM (approximately
200 times the Michaelis constant). The plain line corresponds to a stationary (non-rotating)
electrode, whereas the dashed voltammogram was recorded with the electrode rotating at 3000rpm.
(i) Why is the current at high potential rotation-rate independent in this case? (ii) Why are the
shapes of the voltammograms di�erent?
Acknowledgements
I am very grateful to F. Armstrong (Oxford University, UK) for introducing me to this research
�eld. Some of the data shown herein were obtained in his lab. I also thank him and A. K. Jones
(formerly in Oxord, now at Arizona State University, USA) for proofreading an early version of
this document. I thank Anne K. Jones, Harsh Pershad, Raoul Camba, James Mc Evoy and Lars
J. C. Jeuken for kindly providing some of the data shown herein.
Our work in Marseilles is funded by the CNRS (mainly), Aix-Marseille Université, the Agence
Nationale de la Recherche, the Region Provence-Alpes-Cote d'Azur and the city of Marseilles.
A Appendices
A.1 Notations and abbreviations
A: area under a pic (in units of VA). A: electrode surface. C: concentration of species, or
capacitance (eq. 21), or coupling prefactor (eq. 15).. D: di�usion coe�cient.. δ: peak width at
half heigth. η: overpotential. E: electrode potential. E0: reduction potential. Ep: peak potential.
ET: electron transfer. F : Faraday constant. Γ: electroactive coverage. i: current. ic: capacitive
current. Km: Michaelis constant. Ki: inhibition constant. k: rate constant. λ: reorganization
energy. m number of protons. MV: methyl viologen. n number of electrons. ν: scan rate. νs:
kinematic viscosity (eq. 25). OCP: open circuit potential. ω: electrode rotation rate. R: gas
constant. RDE: rotating disc electrode. T : temperature (in K). t: time. V : potential di�erence.
ξ: extent of reaction.
36

A.2 Derivation of eq. 9
We write the Nernst equation �rst for the alkaline couple Ox/Red, and then for both forms
(protonated and deprotonated) of the redox couple:
E = E0alk +
RT
nFln(
[Ox][Red]
)(36a)
E = E0′([H+]) +RT
nFln(
[Ox] + [OxH][Red] + [RedH]
)(36b)
We rewrite eq. 36b as follows:
E = E0′([H+]) +RT
nFln
[Ox](1 + [H+]
KOx
)[Red]
(1 + [H+]
KRed
) (37a)
E = E0′([H+]) +RT
nFln
[Ox][Red]
+RT
nFln
1 + [H+]KOx
1 + [H+]KRed
(37b)
Equating eq. 37b and eq. 36a gives eq. 9:
E0′([H+]) = E0alk +
2.3RT
nFlog10
1 + [H+]KRed
1 + [H+]KOx
(38)
Check that E0′([H+]) tends to E0alk when [H+] is small.
Using
E = E0acid +
RT
nFln
[OxH][RedH]
(39)
instead of eq. 36a gives
E0′([H+]) = E0acid +
2.3RT
nFlog10
(1 + KRed
[H+]
1 + KOx[H+]
)(40)
Check that E0′([H+]) tends to E0acid when [H+] is large.
The relation between E0alk and E0
acid is simply obtained by equating 36a and 39:
E0acid = E0
alk +RT
nFln
KOx
KRed(41)
Check that with pKOx < pKRed, E0acid > E0
alk
References
[1] Bard, A. J.; Faulkner, L. R. Electrochemical methods. Fundamental and applications. Third
edition; John Wiley & Sons, Inc.: 2004.
[2] Compton, R. G.; Banks, C. E. Understanding voltammetry; Imperial College Press: 2011.
37
[3] Newman, J.; Thomas-Alyea, K. E. Electrochemical systems; Wiley Interscience: 2004.
[4] Levich, V. G. Physical hydrodynamics; Prentice-Hall, Inc.: 1962.
[5] Savéant, J. M. Elements of molecular and biomolecular electrochemistry; John Willey & sons,
Inc.: 2006.
[6] Cornish-Bowden, A. Fundamental of Enzyme kinetics; Portland Press.: 2004.
[7] Laidler, K. J.; Bunting, P. S. The Chemical Kinetics of Enzyme Action; Clarendon Press.
Oxford: 1973.
[8] Armstrong, F. A.; Heering, H. A.; Hirst, J. Chem. Soc. Rev. 1997, 26, 169�179.
[9] Elliott, S. J.; Léger, C.; Pershad, H. R.; Hirst, J.; He�ron, K.; Blasco, F.; Rothery, R.;
Weiner, J.; Armstrong, F. A. Biochim. Biophys. Acta 2002, 1555, 54�59.
[10] Léger, C.; Elliott, S. J.; Hoke, K. R.; Jeuken, L. J. C.; Jones, A. K.; Armstrong, F. A.
Biochemistry 2003, 42, 8653�8662.
[11] Murgida, D. H.; Hildebrandt, P. Phys. Chem. Chem. Phys. 2005, 7, 3773�3784.
[12] Armstrong, F. A. Curr. Op. Chem. Biol. 2005, 9, 110�117.
[13] Vincent, K. A.; Armstrong, F. A. Inorg. Chem. 2005, 44, 798�809.
[14] Hirst, J. Biochim. Biophys. Acta 2006, 1757, 225�239.
[15] Bernhardt, P. V. Aust. J. Chem. 2006, 59, 233�256.
[16] Vincent, K. A.; Parkin, A.; Armstrong, F. A. Chem. Rev. 2007, 107, 4366�4413.
[17] Cracknell, J. A.; Vincent, K. A.; Armstrong, F. A. Chemical Reviews 2008, 108, 2439�2461.
[18] Léger, C.; Bertrand, P. Chem. Rev. 2008, 108, 2379�2438.
[19] Jeuken, L. J. Natural product reports 2009, 26, 1234�1240.
[20] Armstrong, F. A.; Belsey, N. A.; Cracknell, J. A.; Goldet, G.; Parkin, A.; Reisner, E.;
Vincent, K. A.; Wait, A. F. Chemical Society reviews 2009, 38, 36�51.
[21] Gates, A. J.; Kemp, G. L.; To, C. Y. Y.; Mann, J.; Marritt, S. J.; Mayes, A. G.;
Richardson, D. J.; Butt, J. N. Physical chemistry chemical physics : PCCP 2011, 13, 7720�
7731.
[22] Lojou, E. Electrochimica Acta 2011, in press.
[23] Jeuken, L. C.; Camba, R.; Armstrong, F. A.; Canters, G. W. J. Biol. Inorg. Chem. 2002,
7, 94�100.
[24] Léger, C.; He�ron, K.; Pershad, H. R.; Maklashina, E.; Luna-Chavez, C.; Cecchini, G.;
Ackrell, B. A. C.; Armstrong, F. A. Biochemistry 2001, 40, 11234�11245.
[25] Zu, Y.; Fee, J.; Hirst, J. J. Am. Chem. Soc. 2001, 123, 9906�9907.
38

[26] Butt, J. N.; Sucheta, A.; Armstrong, F. A.; Breton, J.; Thomson, A. J.; Hatchikian, E. C.
J. Am. Chem. Soc. 1993, 115, 1413�1421.
[27] Butt, J. N.; Fawcett, S. E. J.; Breton, J.; Thomson, A. J.; Armstrong, F. A. J. Am. Chem.
Soc. 1997, 119, 9729�9737.
[28] Fawcett, S. E. J.; Davis, D.; Breton, J. L.; Thomson, A. J.; Armstrong, F. A. Biochem. J.
1998, 335, 357�368.
[29] Gray, H. B.; Winkler, J. R. Proceedings of the National Academy of Sciences of the United
States of America 2005, 102, 3534�3539.
[30] Jeuken, L. J. C.; McEvoy, J. P.; Armstrong, F. A. J. Phys. Chem. B 2002, 106, 2304�2313.
[31] Costentin, C.; Robert, M.; Savéant, J.-M. Accounts of Chemical Research 2010, 43, 1019�
1029.
[32] Anxolabéhère-Mallart, E.; Costentin, C.; Policar, C.; Robert, M.; Savéant, J.-M. M.;
Teillout, A.-L. L. Faraday discussions 2011, 148, 83�95.
[33] Wardman, P. Journal of Physical and Chemical Reference Data 1989, 18, 1637�1755.
[34] Jeuken, L. J. C.; van Vliet, P.; Verbeet, M. P.; Camba, R.; McEvoy, J. P.; Armstrong, F. A.;
Canters, G. W. J. Am. Chem. Soc. 2000, 122, 12186�12194.
[35] Dutton, P. Biochimica et Biophysica Acta (BBA) - Bioenergetics 1971, 226, 63�80.
[36] Leslie Dutton, P. [23] Redox potentiometry: Determination of midpoint potentials of
oxidation-reduction components of biological electron-transfer systems. In , Vol. 54; Elsevier:
1978.
[37] Tarasevich, M. R.; Yaropolov, A. I.; Bogdanovskaya, V. A.; Varfolomeev, S. D. Journal of
Electroanalytical Chemistry and Interfacial Electrochemistry 1979, 104, 393�403.
[38] Yaropolov, A. I.; Karyakin, A. A.; Varfolomeev, S. D.; Berezin, I. V. Bioelectrochemistry
and Bioenergetics 1984, 12, 267�277.
[39] Love, J. C.; Estro�, L. A.; Kriebel, J. K.; Nuzzo, R. G.; Whitesides, G. M. Chemical
Reviews 2005, 105, 1103�1170.
[40] Blanford, C.; Armstrong, F. Journal of Solid State Electrochemistry 2006, 10, 826�832.
[41] Allongue, P.; Delamar, M.; Desbat, B.; Fagebaume, O.; Hitmi, R.; Pinson, J.; Savéant, J.-
M. Journal of the American Chemical Society 1997, 119, 201�207.
[42] Blanford, C. F.; Foster, C. E.; Heath, R. S.; Armstrong, F. A. Faraday discussions 2008,
140, 319�335.
[43] Rudiger, O.; Abad, J. M.; Hatchikian, E. C.; Fernandez, V. M.; de Lacey, A. L. J. Am.
Chem. Soc. 2005, 127, 16008�16009.
39

[44] Alonso-Lomillo, M. A.; Rudiger, O.; Maroto-Valiente, A.; Velez, M.; Rodriguez-Ramos, I.;
Munoz, F. J.; Fernandez, V. M.; de Lacey, A. L. Nano Lett. 2007, 7, 1603�1608.
[45] Gutiérrez-Sánchez, C.; Olea, D.; Marques, M.; Fernández, V. M.; Pereira, I. A.; Vélez, M.;
De Lacey, A. L. Langmuir : the ACS journal of surfaces and colloids 2011, 27, 6449�6457.
[46] Fourmond, V.; Hoke, K.; Heering, H. A.; Ba�ert, C.; Leroux, F.; Bertrand, P.; Léger, C.
Bioelectrochem. 2009, 76, 141�147.
[47] Battistuzzi, G.; Borsari, M.; Sola, M.; Francia, F. Biochemistry 1997, 36, 16247.
[48] Kudera, M.; Aitken, A.; Jiang, L.; Kaneko, S.; Hill, H. A. O.; Dobson, P. J.; Leigh, P. A.;
McIntire, W. S. J. Electroanal. Chem. 2000, 495, 36�41.
[49] Amatore, C.; Arbault, S.; Guille, M.; Lemaitre, F. Chem. Rev. 2008, 108, 2585�2621.
[50] Chen, K.; Hirst, J.; Camba, R.; Bonagura, C. A.; Stout, C. D.; Burgess, B. K.; Arm-
strong, F. A. Nature 2000, 405, 814�817.
[51] Dementin, S.; Belle, V.; Bertrand, P.; Guigliarelli, B.; Adryanczyk-Perrier, G.; Delacey, A.;
Fernandez, V. M.; Rousset, M.; Léger., C. J. Am. Chem. Soc. 2006, 128, 5209�5218.
[52] Léger, C.; Lederer, F.; Guigliarelli, B.; Bertrand, P. J. Am. Chem. Soc. 2006, 128, 180�187.
[53] Leroux, F.; Dementin, S.; Burlat, B.; Cournac, L.; Volbeda, A.; Champ, S.; Martin, L.;
Guigliarelli, B.; Bertrand, P.; Fontecilla-Camps, J.; Rousset, M.; Léger, C. Proc. Nat. Acad.
Sc. USA 2008, 105, 11188�11193.
[54] Liebgott, P.-P. et al. Nature chemical biology 2010, 6, 63�70.
[55] McEvoy, J. P.; Armstrong, F. A. Chem. Comm. 1999, 1635�1636.
[56] Chobot, S. E.; Hernandez, H. H.; Drennan, C. L.; Elliott, S. J. Angew. Chem. Int. Edit.
2007, 46, 4145�4147.
[57] Hagedoorn, P. L.; Driessen, M. C. P. F.; vandenBosch, M.; Landa, I.; Hagen, W. R. FEBS
Lett. 1998, 440, 311�314.
[58] Park, J. B.; Fan, C. L.; Ho�man, B. M.; Adams, M. W. W. J. Biol. Chem. 1991, 266,
19351�19356.
[59] Brereton, P. S.; Verhagen, M. F. J. M.; Zhou, Z. H.; Adams, M. W. W. Biochemistry 1998,
37, 7351�7362.
[60] Gilles de Pelichy, L. D.; Smith, E. T. Biochemistry 1999, 38, 7874.
[61] Laviron, E. J. Electroanal. Chem. 1979, 101, 19�28.
[62] Baymann, F.; Barlow, N. L.; Aubert, C.; Schoepp-Cothenet, B.; Leroy, G.; Armstrong, F. A.
FEBS Lett. 2003, 539, 91�94.
[63] Hirst, J.; Jameson, G. N. L.; Allen, J. W. A.; Armstrong, F. A. J. Am. Chem. Soc. 1998,
120, 11994�11999.
40
[64] Hirst, J.; Du�, J. L. C.; Jameson, G. N. L.; Kemper, M. A.; Burgess, B. K.; Armstrong, F. A.
J. Am. Chem. Soc. 1998, 120, 7085�7094.
[65] Laviron, E. J. Electroanal. Chem. 1980, 109, 57�67.
[66] Meunier-Prest, R.; Laviron, E. J. Electroanal. Chem. 1992, 328, 33�46.
[67] Nicholls, D. G.; Ferguson, S. J. Bioenergetic 3; Academic Press: 2002.
[68] Armstrong, F. A.; Camba, R.; Heering, H. A.; Hirst, J.; Jeuken, L. J. C.; Jones, A. K.;
Léger, C.; McEvoy, J. P. Faraday Discussions 2001, 116, 191�204.
[69] Limoges, B.; Savéant, J.-M. J. Electroanal. Chem. 2004, 562, 43�52.
[70] Iverson, T. M.; Luna-Chavez, C.; Cecchini, G.; Rees, D. C. Science 1999, 284, 1961�1966.
[71] Fontecilla-Camps, J. C.; Volbeda, A.; Cavazza, C.; Nicolet, Y. Chem. Rev. 2007, 107,
4273�4303.
[72] Arnoux, P.; Sabaty, M.; Alric, J.; Frangioni, B.; Guigliarelli, B.; Adriano, J. M.; Pignol, D.
Nat. Struct. Mol. Biol. 2003, 10, 928�934.
[73] Pershad, H. R.; Du�, J. L. C.; Heering, H. A.; Duin, E. C.; Albracht, S. P. J.; Arm-
strong, F. A. Biochemistry 1999, 38, 8992�8999.
[74] Heering, H. A.; Weiner, J. H.; Armstrong, F. A. J. Am. Chem. Soc. 1997, 119, 11628�11638.
[75] Fourmond, V.; Lautier, T.; Ba�ert, C.; Leroux, F.; Liebgott, P.-P.; Dementin, S.; Rous-
set, M.; Arnoux, P.; Pignol, D.; Meynial-Salles, I.; Soucaille, P.; Bertrand, P.; Léger, C.
Anal. Chem. 2009, 81, 2962�2968.
[76] Fourmond, V.; Sabaty, M.; Arnoux, P.; Bertrand, P.; Pignol, D.; Léger, C. The journal of
physical chemistry. B 2010, 114, 3341�3347.
[77] Léger, C.; Dementin, S.; Bertrand, P.; Rousset, M.; Guigliarelli, B. J. Am. Chem. Soc.
2004, 126, 12162�12172.
[78] Fourmond, V.; Burlat, B.; Dementin, S.; Arnoux, P.; Sabaty, M.; Boiry, S.; Guigliarelli, B.;
Bertrand, P.; Pignol, D.; Léger, C. J. Phys. Chem. B 2008, 112, 15478�15486.
[79] Bray, R. C.; Adams, B.; Smith, A. T.; Bennett, B.; Bailey, S. Biochemistry 2000, 39,
11258�11269.
[80] Almeida, M. G.; Guigliarelli, B.; Bertrand, P.; Moura, J. J. G.; Moura, I.; Léger, C. FEBS
Letts. 2007, 581, 284�288.
[81] Lautier, T.; Ezanno, P.; Ba�ert, C.; Fourmond, V.; Cournac, L.; Fontecilla-Camps, J. C.;
Soucaille, P.; Bertrand, P.; Meynial-Salles, I.; Léger, C. Faraday discussions 2011, 148,
385�407.
[82] Hudson, J. M.; He�ron, K.; Kotlyar, V.; Sher, Y.; Maklashina, E.; Cecchini, G.; Arm-
strong, F. A. J. Am. Chem. Soc. 2005, 127, 6977�6989.
41
[83] Léger, C.; Jones, A. K.; Albracht, S. P. J.; Armstrong., F. A. J. Phys. Chem. B 2002, 106,
13058�13063.
[84] Bertrand, P.; Frangioni, B.; Dementin, S.; Sabaty, M.; Arnoux, P.; Guigliarelli, B.;
Pignol, D.; Léger, C. J. Phys. Chem. B 2007, 111, 10300�10311.
[85] Fourmond, V.; Infossi, P.; Giudici-Orticoni, M.-T. T.; Bertrand, P.; Léger, C. Journal of
the American Chemical Society 2010, 132, 4848�4857.
[86] Elliott, S. J.; McElhaney, A. E.; Feng, C.; Enemark, J. H.; Armstrong, F. A. J. Am. Chem.
Soc. 2002, 124, 11612�11613.
[87] Fourmond, V.; Burlat, B.; Dementin, S.; Sabaty, M.; Arnoux, P.; Etienne, E.;
Guigliarelli, B.; Bertrand, P.; Pignol, D.; Léger, C. Biochemistry 2010, 49, 2424�2432.
[88] Sucheta, A.; Ackrell, B. A. C.; Cochran, B.; Armstrong, F. A. Nature 1992, 356, 361�362.
[89] Gates, A. J.; Richardson, D. J.; Butt, J. N. The Biochemical journal 2008, 409, 159�168.
[90] Adams, B.; Smith, A. T.; Bailey, S.; McEwan, A. G.; Bray, R. C. Biochemistry 1999, 38,
8501�8511.
[91] He�ron, K.; Léger, C.; Rothery, R. A.; Weiner, J. H.; Armstrong, F. A. Biochemistry 2001,
40, 3117�3126.
[92] Anderson, L. J.; Richardson, D. J.; Butt, J. N. Biochemistry 2001, 40, 11294�11307.
[93] Frangioni, B.; Arnoux, P.; Sabaty, M.; Pignol, D.; Bertrand, P.; Guigliarelli, B.; Léger, C.
J. Am. Chem. Soc. 2004, 126, 1328�1329.
[94] Jones, A. K.; Lamle, S. E.; Pershad, H. R.; Vincent, K. A.; Albracht, S. P. J.; Arm-
strong, F. A. J. Am. Chem. Soc. 2003, 125, 8505�8514.
42