direct biofiltration and nutrient (phosphorous
TRANSCRIPT
Direct Biofiltration and Nutrient
(Phosphorous) Enhancement for Polymeric
Ultrafiltration Membrane Fouling Control
by
Ishita Rahman
A thesis
presented to the University of Waterloo
in fulfillment of the
thesis requirement for the degree of
Master of Applied Science
in
Civil and Environmental Engineering
Waterloo, Ontario, Canada, 2013
©Ishita Rahman 2013
ii
AUTHOR'S DECLARATION
I hereby declare that I am the sole author of this thesis. This is a true copy of the thesis,
including any required final revisions, as accepted by my examiners.
I understand that my thesis may be made electronically available to the public.
iii
Abstract
Membrane filtration is growing in popularity as a viable technology for drinking water
treatment to meet high demand and regulatory requirements. While many improvements have
been made to the technology in the past decade, fouling continues to be one of the major
operational challenges associated with membranes as it increases operating costs and reduces
membrane life. Fouling control typically requires some form of pre-treatment. Biofiltration is
a “green” technique that can minimize chemical usage and waste during water treatment and
is a relatively new application as a pre-treatment for membranes.
Proteins and polysaccharides (biopolymers) have been found to contribute most to fouling
of low pressure polymeric membranes. Biofiltration has recently been demonstrated as an
effective pre-treatment method for reducing biopolymer-associated fouling of this type of
membrane (Hallé et al., 2009). Given that the concentration and composition of organic
matter in water is variable, there is an opportunity to explore the applicability of this robust
technology for different water types.
The primary goals of this research were to assess the effectiveness of direct biofiltration in
minimizing ultrafiltration polymeric (PVDF) membrane fouling and at the same time
evaluate the biofilter development, biofilter performance based on organics removal
potential, and the effect of phosphorus addition (as a nutrient) to the biofilter influent.
A pilot-scale treatment train was constructed at the Technology Demonstration Facility at
the Walkerton Clean Water Centre. It included two parallel dual media (sand/anthracite)
biological filters (preceded by roughing filters), followed by an ultrafiltration membrane unit.
Experiments were conducted using water from the Saugeen River (Ontario, Canada) whose
primary form of carbon is humic material. The biofilters were allowed to acclimate and

iv
biofilter performance and organics removal were tested over a fourteen month period, the last
four months of which were dedicated to phosphorus enhancement experiments. The
membrane fouling experiments started seven months following the start-up of the biofilters,
after confirmation of steady-state operation.
Biofilter water samples were analyzed for natural organic matter constituents along with
other water quality parameters, and biomass quantity and activity in the media were
measured. Biomass activity in the biofilter media and biopolymer removal through the
biofilter indicated a rapid acclimation period, and also demonstrated similar performance of
the parallel biofilters during start-up and steady-state operation. The biofilters achieved 21%
removal of the biopolymers on average following acclimation, while reduction of the humic
fractions was not observed. A linear relationship between biopolymer removal and its
concentration in the river water was observed (first-order process).
Membrane fouling experiments were conducted using both untreated and biofiltered river
water. The fouling rates were computed by monitoring changes in transmembrane pressure
over time. Analysis of the samples with liquid chromatography-organic carbon detection
confirmed the significant contribution of biopolymers to irreversible and reversible
membrane fouling rates even when only present at low concentrations.
During the phosphorus enhancement phase, two different phosphorus doses were fed into
the influent of one of the parallel biofilters in order to achieve a target C:N:P ratio of roughly
100:10:1. Although initially (first month of the dosing period) an increase in the removal of
dissolved organic carbon and ultraviolet-absorbance was observed in the phosphorus-
enhanced biofilter, this was not sustained. Phosphorus addition did not affect biopolymer

v
removal or biomass quantity and activity in the biofilter, and the membrane fouling
experiments during this period did not show any significant effect of phosphorus addition.

vi
Acknowledgements
I thank Almighty Allah for blessing me with the wonderful privileges of life and for granting
me the opportunity to seek knowledge and grow as a person.
I would like to express profound gratitude to my supervisors Dr. Peter M. Huck and Dr.
William B. Anderson for their continuous support and guidance throughout my master’s
studies, which was not limited to research. Your patience and encouragements has always
been a source of motivation for me. I am also grateful to Dr. Michele I. Van Dyke for the
tremendous support and time she had provided with her constructive reviews, technical
advice, and also in teaching me about different microbiological methods.
I would also like to thank all the members of the NSERC Chair in Water Treatment group.
I thank Dr. Sigrid Peldszus for her advice regarding membranes and LC-OCD and Ms. Dana
Herriman for her reviews and encouragements and for being patient and supportive with the
numerous documents I needed from time to time.
Special thanks to Dr. Monica Tudorancea for being so patient and helpful with analyzing
the LC-OCD samples. I also am grateful to Terry Ridgeway who spent hours to help me with
the construction of my experimental set-up and from whom I have learnt so much. I am also
thankful to Mark Sobon and Mark Merlau for their technical support and guidance.
My sincere thanks to Walkerton Clean Water Centre (WCWC) for providing the access to
their facility, water, and sampling related expenses. I am grateful to the dedicated staff of
WCWC, especially Dr. Souleymane Ndiongue and Dr. Xiaohui Jin who had provided
valuable advice and made all possible amendments for smooth running of the project. I am
indebted to Laura Zettler who had taken care of the set-up and ran the membrane experiments
whenever I could not be there; without her help continuing the work from Waterloo would

vii
have been impossible. I would also like to acknowledge the support from Dr. Larry Moore,
Jeff Avedesian, Lindsay Ariss, Victoria Colling, Devendra Borikar and Bonnie McGinnis (to
name a few) from WCWC.
The financial support for this project was provided by an Ontario Research Fund (ORF)
Research Excellence grant and by the Natural Sciences and Engineering Research Council of
Canada (NSERC) in the form of an Industrial Research Chair in Water Treatment at the
University of Waterloo. Thanks to GE Water and Process Technologies for providing the UF
membrane units and especially to Dr. Daniella B. Mosqueda-Jimenez for reviewing the
submitted manuscript section of this thesis. Thanks to the University of Waterloo for
providing the student privileges and financial assistance along with the learning
opportunities.
I would also like to thank my fellow grad students (both current and former): Leila Munla,
Feisal Rahman, Fei Chen, Jamie Croft, Lizanne Pharand and Ahmed El-Hadidy for their
valuable advice and help related to the project. I am grateful to Dr. Barbara Siembida-Lösch
for giving me the initial training on laboratory instruments and methods. I also thank the
chair students and undergraduate co-op students and research assistants: Samia, Jie, Silvia,
Leonore, Sarah, Hillary, Rachel, Tim, and also Dr. Ting Liu for helping me in the lab and
accompanying me and helping out with sampling occasionally. I am also grateful to Mark
Spanjers and Jessica McLeod from Civil and Environmental Engineering, and Daniel Worndl
and Richard Elgood from the Earth Sciences departments at the University of Waterloo for
generously allowing occasional access to their laboratory instruments.
Finally, I would like to thank my family for their unconditional love and trust and for
supporting me in every way in spite of being in different continents. Thanks to my husband

viii
for encouraging me to always do my best. And thanks to my wonderful friends back home
and in Canada. It’s been a wonderful and an exciting journey!

ix
Dedication
I dedicate this thesis to my loving family
Without you nothing would have been possible

x
Table of Contents
AUTHOR'S DECLARATION ............................................................................................. ii
Abstract ............................................................................................................................... iii
Acknowledgements ............................................................................................................. vi
Dedication ........................................................................................................................... ix
Table of Contents ................................................................................................................. x
List of Figures ................................................................................................................... xiv
List of Tables ................................................................................................................... xviii
List of Acronyms ............................................................................................................... xix
Chapter 1 Introduction ......................................................................................................... 1
1.1 Problem Statement ....................................................................................................... 1
1.2 Approach ...................................................................................................................... 3
1.3 Objectives .................................................................................................................... 3
1.4 Thesis Organization ..................................................................................................... 4
Chapter 2 Background Information...................................................................................... 6
2.1 Membrane Filtration in Drinking Water ...................................................................... 6
2.1.1 General overview .................................................................................................. 6
2.1.2 Membrane types and characteristics ..................................................................... 6
2.1.3 Rejection mechanisms and membrane fouling ..................................................... 9
2.1.4 Types of fouling .................................................................................................. 10
2.1.5 Fouling mechanisms ........................................................................................... 11
2.2 Membrane Filtration and NOM Fouling .................................................................... 12
2.2.1 NOM characteristics and composition ................................................................ 12
xi
2.2.2 NOM characterization ......................................................................................... 14
2.2.3 NOM in membrane fouling ................................................................................. 16
2.3 Membrane Pre-treatment Methods ............................................................................ 17
2.3.1 Coagulation ......................................................................................................... 17
2.3.2 Ozonation ............................................................................................................ 19
2.3.3 Biofiltration ......................................................................................................... 22
2.3.4 Others .................................................................................................................. 22
2.4 Biological Filtration in Drinking Water Treatment ................................................... 22
2.4.1 Application of biofiltration ................................................................................. 23
2.4.2 Biofiltration process ............................................................................................ 24
2.4.3 Factors affecting biofilter performance ............................................................... 26
2.4.4 Process modeling ................................................................................................ 27
2.5 Biofiltration as Membrane Pre-treatment .................................................................. 29
2.6 Nutrient Enhancement and Biofilter Performance..................................................... 34
2.7 Research Motivation .................................................................................................. 35
Chapter 3 Fouling of Low-Pressure Membranes during Drinking Water Treatment: Effect
of NOM Components and Biofiltration Pretreatment ........................................................ 37
3.1 Introduction ................................................................................................................ 37
3.2 Methods ..................................................................................................................... 38
3.2.1 Feed water ........................................................................................................... 38
3.2.2 Experimental set-up ............................................................................................ 39
3.2.3 Analyses .............................................................................................................. 41
3.3 Results and Discussion .............................................................................................. 42
xii
3.3.1 Water quality and biofilter performance ............................................................. 42
3.3.2 Biofilter performance in terms of organic removal............................................. 43
3.3.3 Effect of direct biofiltration in fouling reduction ................................................ 45
3.4 Conclusions ................................................................................................................ 52
3.5 Supplementary Information for Chapter 3 ................................................................. 54
Chapter 4 Effect of Phosphorus Addition on Biofilter Performance and Membrane Fouling
............................................................................................................................................ 57
4.1 Introduction ................................................................................................................ 57
4.2 Material and Methods ................................................................................................ 64
4.2.1 Feed water ........................................................................................................... 64
4.2.2 Experimental set-up ............................................................................................ 64
4.2.3 Sampling procedure ............................................................................................ 67
4.2.4 Water quality analysis ......................................................................................... 68
4.2.5 Biomass quantity and activity measurement ....................................................... 69
4.2.6 Membrane fouling experiments .......................................................................... 70
4.3 Results and Discussion .............................................................................................. 70
4.3.1 Saugeen River water quality ............................................................................... 70
4.3.2 Biofilter activity and performance ...................................................................... 77
4.3.3 Effect of phosphorus addition on biofilter performance ..................................... 82
4.3.4 Membrane fouling experiments .......................................................................... 93
4.4 Conclusions ................................................................................................................ 95
Chapter 5 Conclusions and Recommendations .................................................................. 97
5.1 Integration of Findings and Conclusions ................................................................... 97

xiii
5.2 Implementation of Findings in the Drinking Water Treatment Industry and
Recommendations for Future Research ............................................................................ 100
References ........................................................................................................................ 102
Appendix A Schematic and Photos of the Set-up ............................................................ 120
Appendix B Media Specifications.................................................................................... 130
Appendix C Raw Water Quality Data .............................................................................. 132
Appendix D Raw Water Biopolymer and Humic Substance Concentration ................... 134
Appendix E Nutrient Concentrations in Water Samples .................................................. 135
Appendix F Biomass Quantity (as ATP) and Activity (as FDA) Data ............................ 137
Appendix G Phosphorus Dosing Calculation Summary .................................................. 139
Appendix H List of Publications ...................................................................................... 140

xiv
List of Figures
Figure 2.1 Classification of membrane based on pore-size/operating pressure ........................ 7
Figure 2.2 Example of reversible and irreversible membrane fouling ................................... 11
Figure 2.3 Mechanism of fouling of membranes .................................................................... 12
Figure 2.4 LC-OCD chromatogram with organic carbon, UV, and organic nitrogen detector
signal responses indicating different NOM fractions elution times for Pfinz River (Germany)
water ........................................................................................................................................ 15
Figure 2.5 Increase in flux for a polypropylene microfiltration membrane with increased
alum dose (up to 50 mg/L for enhanced coagulation) for Salt River water ............................ 19
Figure 2.6 Increase in permeate flux with the application of ozonation prior to ultrafiltration
at constant transmembrane pressure ....................................................................................... 21
Figure 2.7 Biomass development and biological processes in biofilters ................................ 25
Figure 2.8 LC-OCD chromatogram showing removal of DOC fractions by biofilters
combined with roughing filter for Grand River water Ontario, Canada ................................. 32
Figure 2.9 Effect of using biofiltration pretreatment and increased biofilter EBCT on
membrane TMP (hence, fouling) using a UF membrane with Grand River water, Ontario .. 33
Figure 3.1 Schematic of the experimental set-up and sampling locations .............................. 39
Figure 3.2: Correlation between biopolymer removal by Biofilter 1 (n = 19) and Biofilter 2 (n
= 10) and raw water biopolymer concentration (MDL = 0.009 mg/L) ................................... 45
Figure 3.3 Comparison of fouling of a UF membrane measured over 10.5 hours using A)
untreated river water and B) biofilter effluent as the membrane feed. The experiment was
conducted from February 4 – 8, and the average temperature for A was 13.4°C and for B was
16.6°C ..................................................................................................................................... 47

xv
Figure 3.4 Relationship between biopolymer (A) and humic substance (B) concentrations in
membrane feed water and membrane hydraulically irreversible fouling rate with (i) untreated
water as feed (n = 5), and (ii) biofilter effluent as feed (n = 11); membrane flux 57 LMH at
20°C ........................................................................................................................................ 50
Figure 3.5 An example of increase in membrane TMP during a 21 h experiment with
untreated water as feed. ΔTMP per cycle is calculated as the difference between TMP at the
start and end (before backwash) of a particular 30 minute cycle (Experiment conducted on
December 10, 2012) ................................................................................................................ 51
Figure 3.6 Relationship between biopolymer and humic substance concentrations in
membrane feed water and membrane average hydraulically reversible fouling rate with (i)
untreated water as feed (n = 5), and (ii) biofilter effluent as feed (n = 11); membrane flux =
57 LMH at 20°C. Reversible fouling was quantified by taking average of ΔTMP from all
cycles during the length of the experiment. ............................................................................ 52
Figure 4.1 Experimental set-up schematic (where, RF = roughing filter, S = Water sample,
Sm = media sample) ................................................................................................................. 65
Figure 4.2 A) Concentration of nitrogen compounds in biofilter feed water (Saugeen River),
where Total-N = Nitrate-N + TKN; B) Concentration of total and ortho-phosphorus in
biofilter feed water; total phosphorus measurements were initiated on April 3, 2013
(Detection limit for both = 0.003 mg/L) ................................................................................. 73
Figure 4.3 Comparison of biomass quantity as measured by ATP in media samples collected
from each of the two dual-media biofilters. Samples were collected from the mid-point of
each of the anthracite and sand layers (28 and 67 cm from media surface). Start of P-dosing
(in BF2) is indicated along with feed water temperature. ....................................................... 78
xvi
Figure 4.4 Biomass quantity measured in BF1 at the upper-most anthracite port (4 – 12 cm
below media surface), mid-anthracite layer (24 – 32 cm) and mid sand layer (30 – 38 cm)
with lines showing the average, upper and lower ATP concentrations (n = 10). 0 cm is the top
surface of the media. ............................................................................................................... 79
Figure 4.5 Comparison of biomass activity as measured by FDA analysis in media samples
collected from each of the two dual-media biofilters. Samples were collected from the mid-
point of each of the anthracite and sand layers (28 and 67 cm from media surface). Start of P-
dosing (in BF2) is indicated along with feed water temperature. ........................................... 80
Figure 4.6 Percent DOC removal as shown by plotted values and by moving average lines for
Biofilter 1 and 2 throughout the experimental period (n = 20 without P; n =11 with P-added).
Average removal by BF1 and BF2 before P-dosing was 4% (indicated by horizontal dotted
line). ........................................................................................................................................ 82
Figure 4.7 Removal of UV absorbance at 254 nm wavelength by Biofilter 1 and 2 (n = 20
without P; n =11 with P-added), which measures mixture of aquatic humics and different
hydrophobic and hydrophilic NOM fractions of variable molecular weights in the water. ... 85
Figure 4.8 Concentrations of humic substances in the untreated water, and the effluents from
Biofilter 1 and 2 ...................................................................................................................... 86
Figure 4.9 Concentrations of biopolymers in the untreated water, and the effluents from
Biofilter 1 and 2 ...................................................................................................................... 86
Figure 4.10 Concentration and consumptions of total phosphate in the A) control biofilter
(BF1) influent and effluent, and B) BF2 (P-dosed biofilter 2) influent and effluent with
concentrations in untreated raw water during April and May, 2013 ...................................... 88
xvii
Figure 4.11 Total ATP at different depths of A) BF1 (No P added) and B) BF2 (P-added to
BF2 influent) during P-dosing experiment with water temperature. ...................................... 90
Figure 4.12 FDA at different depths of A) BF1 (No P added) and B) BF2 (P-added to BF2
influent) during P-dosing experiment with water temperature. .............................................. 91
xviii
List of Tables
Table 2.1 Observations from biofiltration pretreatment studies for membranes (surface water)
................................................................................................................................................. 30
Table 3.1: Biofilter feed water quality (Saugeen River) and biomass measured at biweekly
intervals from June 2012 to May 2013 (period of steady-state operation) ............................. 42
Table 3.2: Effect of direct biofiltration pretreatment on membrane fouling rate (flux was 57
LMH at 20°C) ......................................................................................................................... 48
Table 4.1 Literature phosphorus/nutrient dosing .................................................................... 61
Table 4.2 Concentration of total and dissolved organic carbon and DOC fractions in raw
Saugeen River water between November, 2012 and May, 2013 ............................................ 74
Table 4.3 Calculated C: N: P ratio for raw water during phosphate dosing phase ................. 77
Table 4.4 Removal of carbon, nitrogen and phosphorus through biofilters 1 and 2 ............... 83
Table 4.5 Difference in performance between BF1 (control) and BF2 (P-enhanced); February
4 to May 30, 2013 ................................................................................................................... 85
Table 4.6 ATP and FDA at different depths of parallel biofilters .......................................... 89
Table 4.7 Results from membrane experiments with BF1 (control) and BF2 (P-enhanced)
effluent as feed water .............................................................................................................. 94
Table 4.8 Removal of NOM and particles by UF membrane (membrane retention) during the
fouling experiments ................................................................................................................ 95
xix
List of Acronyms
AOC: Assimilable organic carbon
ATP: Adenosine triphosphate
BB: Building blocks
BDOC: Biodegradable dissolved organic carbon
BF1: Biofilter-1, used as control during phosphorus dosing experiment
BF2: Biofilter-2, phosphorus added biofilter
BOM: Biodegradable organic matter
BP: Biopolymers
C:N:P: Carbon, nitrogen, phosphorus ratio
DL: Detection limit
DOC: Dissolved organic carbon
DOM: Dissolved organic matter
EBCT: Empty bed contact time
EPS: Extracellular polymeric substances
FA: Fulvic acid
FDA: Fluorescein diacetate
GAC: Granular activated carbon
HPC: Heterotrophic plate count
HS: Humic substances
LC-OCD: Liquid chromatography with organic carbon detector
LMH: Liter per membrane area per hour
LMW: Low molecular weight

xx
MF: Microfiltration membrane
MWCO: Molecular weight cut off
NOM: Natural organic matter
PVDF: Polyvinyl fluoride
RF: Roughing filter
SUVA: Specific ultraviolet absorbance
TMP: Transmembrane pressure
TOC: Total organic carbon
UF: Ultrafiltration membrane
UV: Ultraviolet
UV254: Absorbance of ultraviolet (UV) light at a wavelength of 254 nm
ΔTMP: Difference of TMP during a cycle
1
Chapter 1
Introduction
1.1 Problem Statement
The well-being of humans can readily be related to the availability of potable water. Water,
though abundant on Earth is largely in oceans or trapped in glacial ice caps. The very small
percentage that can be used for drinking cannot be ingested directly and is also increasingly
being degraded by human development. Diseases and even death by the ingestion of
contaminated water is very common all over the world.
The history of water treatment goes back to the times of the ancient Greeks with their
simple, yet effective, methods for water treatment (e.g. boiling, sand filtration). With time
these methods were refined and new techniques have emerged. One of the newest approaches
in this field is the application of membrane filtration processes. Since their first application
for drinking water treatment in 1980s, the technology has seen tremendous development and
is now an established technology for drinking water treatment (Crittenden et al., 2005).
Membrane filtration has various uses in water treatment including, but not limited to,
particle and pathogen removal (Farahbakhsh et al., 2004). Large-scale treatment facilities are
increasingly using membranes for treatment purposes. Membranes can be of different types
and materials, and membrane modules have various configurations. Regardless of the
diversity, one of the major challenges with the use of membranes in water treatment is
‘fouling’. Fouling is an inevitable phenomenon associated with membrane based treatment
systems which occurs due to gradual blockage of membrane pores while water being filtered
through and thus results in reduction of the filtration efficiency of membrane units. Thus, it

2
increases the necessity for frequent backwashes and chemical cleanings, which reduce
membrane life and increase the cost associated with membrane operation. Hence, various
methods have been attempted to reduce or control fouling including pre-treating feed water
with chemical coagulants, ozone, adsorbents, ion exchange resins, or filtering the water
through granular media. The efficiency of these techniques is highly dependent on water
quality and the membrane itself. Of the various pretreatment options, biofiltration is a
relatively new and “green” technique that has the potential to minimize chemical usage and
wastes during water treatment.
Biopolymers (proteins and polysaccharides) have been demonstrated to contribute most to
fouling of low pressure polymeric membranes (Amy, 2008). Recent research by Hallé et al.
(2009) demonstrated the utility of biofiltration as an effective pre-treatment method for
reducing biopolymer-associated fouling of low pressure polymeric membranes. Considering
the fact that the concentration and composition of organic matter in different waters is
variable (Her et al., 2003), there is an opportunity to explore the applicability of this robust
technology for different water types.
The microorganisms in biofilters rely on the nutrients (carbon, nitrogen, phosphorus, iron
etc.) in water for growth and activity. Hence, the optimum nutrient conditions in the water for
favorable growth of microorganisms have also been a subject of interest. Research with
nutrients, especially phosphorus, has shown the potential for reduction of extracellular
polymeric substances and corresponding reductions in headloss in the filters and also
increases in organics removal potential (Lauderdale et al., 2012). However, it has not yet
been thoroughly investigated if nutrient enhancement in biofilters affects the fouling
reduction potential of the biofilters. This research aimed at quantifying biofilter development
3
and assessment of its performance as an ultrafiltration (UF) membrane pretreatment under
natural and phosphorus-enhanced conditions using a river characterized by elevated
concentrations of humic material as a water source.
1.2 Approach
To achieve the goal of this research a pilot-scale treatment train was built at the technology
demonstration facility at the Walkerton Clean Water Centre in Walkerton, Ontario. The set-
up included two parallel dual-media (sand/anthracite) biological filters which were preceded
by roughing filters to minimize the impact of varying raw water quality. Water treatment
experiments were conducted using water from the Saugeen River, Ontario, Canada which is
high in TOC with variable turbidity. Experiments with a bench-scale membrane unit to assess
the effect of the biofilters on fouling were initiated after an appropriate acclimation period for
the biofilters. Later in the project, one of the identical biofilters was dosed with phosphate
and the other was used as a control to observe the effect of nutrient addition. Biofilter
samples were collected at regular intervals from March, 2012 to May, 2013 and were
analyzed for natural organic matter (NOM) constituents using a variety of NOM
quantification techniques.
1.3 Objectives
The primary objectives of this research were to –
1. Quantify biofilter acclimation and development by measuring biomass quantity and
activity in the filters, and the removal of various natural organic matter (NOM) fractions,
especially biopolymers for their role in membrane fouling.
4
2. Confirm the reproducibility of the performance of the parallel biofilters under
identical operating conditions.
3. Assess the performance of biofiltration pretreatment for the improvement of UF
membrane performance by conducting comparison membrane experiments with untreated
raw water and biofilter effluent as membrane feed waters.
4. Compare the phosphorus-enhanced and control biofilters to assess the effects of
phosphorus addition in terms of biomass quantity and activity, NOM removal potentials, and
fouling mitigation.
1.4 Thesis Organization
Chapter 1 is the statement of research scope and objectives. Chapter 2 consists of a literature
review, provides general information relevant to this research, and identifies research gaps.
Chapters 3 and 4 of this thesis were written in paper format and as such they contain
separate literature reviews and experimental methods sections.
Chapter 3 is a summary of the ultrafiltration membrane fouling experiments conducted
with untreated and biofiltered water which provide an indication of its performance as
membrane pretreatment. This includes the detailed study of the performance of parallel
drinking water treatment biofilters during the start-up and steady-state periods focusing
mainly on NOM removal. The different water quality parameters of the studied river are also
presented here. This chapter was submitted to a scientific journal in August 2013 to be
considered for publication.
Chapter 4 contains the results from the biofilter phosphorus enhancement experiments.
Raw river water quality in terms of nutrient concentrations is presented here. Biofilter
performance in terms of NOM removal and biomass development is compared between the

5
phosphorus-dosed and control conditions. Finally, the results from the fouling experiments
with biofiltered water from the two conditions are compared.
Chapter 5 summarizes the findings from this research and provides recommendations for
future work.
6
Chapter 2
Background Information
2.1 Membrane Filtration in Drinking Water
2.1.1 General overview
A membrane is a thin sheet of synthetic material which is semi-permeable. Membrane
treatment processes exploit the properties of membranes as a separation technique for
removing chemical and microbial contaminants from water. Though industrial application of
this technology started in the 1950s, the use of membranes in drinking water treatment began
in the 1980s, mostly for microbial risk mitigation (Crittenden et al., 2005). Since then
membrane filtration has evolved tremendously and found novel applications in different
water treatment sectors. Membranes can be used for removal of organics, bacteria, viruses,
ions, in water re-use applications, and for desalination. As membranes have smaller
footprints, require less operator involvement, and can achieve various water treatment goals,
they are now considered as viable substitutes for more traditional filtration systems.
However, some costs associated with membrane operation (energy, membrane replacement,
cleaning, pretreatments, and concentrated waste disposal) are still problematic.
2.1.2 Membrane types and characteristics
Membranes can be classified based on material, pore-size/permeability, surface
characteristics, and operating conditions.
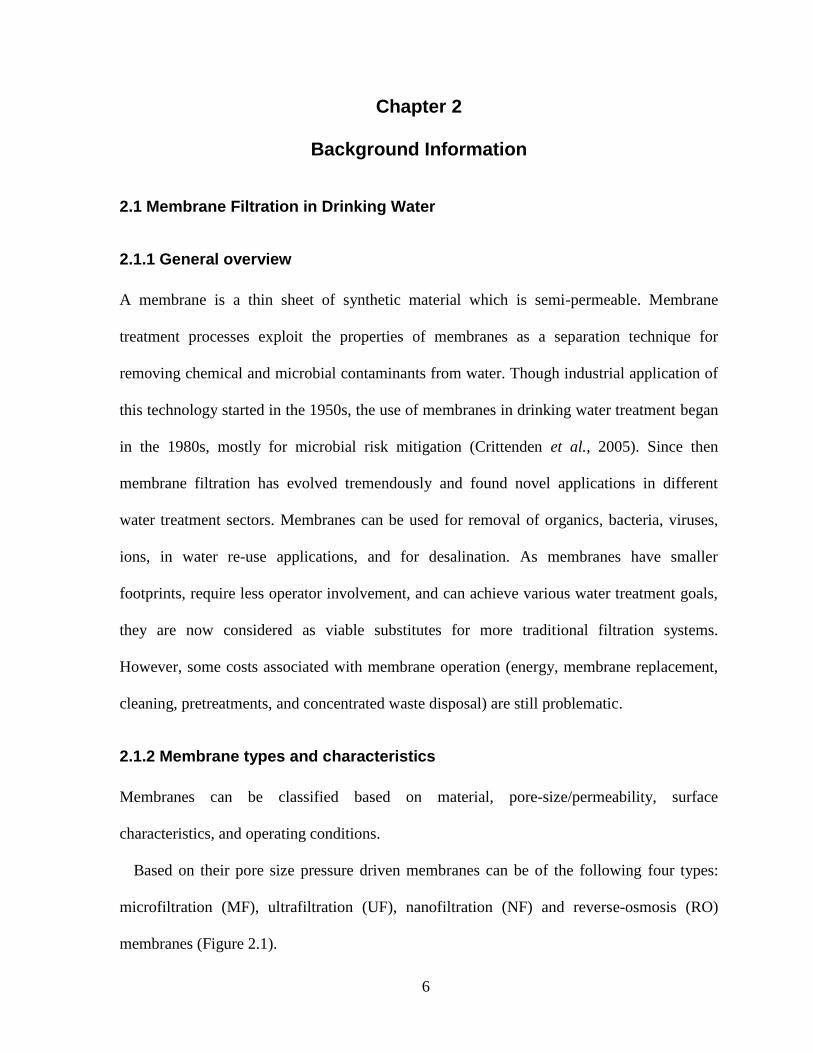
Based on their pore size pressure driven membranes can be of the following four types:
microfiltration (MF), ultrafiltration (UF), nanofiltration (NF) and reverse-osmosis (RO)
membranes (Figure 2.1).
7
Figure 2.1 Classification of membrane based on pore-size/operating pressure
(Adapted from Crittenden et al., 2005. This material is reproduced with permission of
Wiley & Sons, Inc.)
Of these four types, microfiltration membranes have the largest pore size (0.1 µm) and can
reject particles, algae, protozoa, and bacteria. Ultrafiltration membranes have a smaller pore
size (~0.01 µm) and in addition to the contaminants rejected by MF, will reject viruses and
small colloids. UF and MF membranes are classified as “low pressure membranes” and the
dominant exclusion mechanism for these two types of membranes is straining (Crittenden et
al., 2005).
The NF and RO membranes are classified as “high pressure membranes”. While
nanofiltration membranes can remove dissolved organic matter and divalent cations, reverse-
osmosis membranes can remove monovalent cations. In these cases, diffusion is the
exclusion mechanism (Crittenden et al., 2005).
Membranes are fabricated using variety of materials including cellulose acetate (CA),
polysulfone (PS), polyethersulfone (PES), polyamide (PA), polyvinylidene fluoride (PVDF)
and polypropylene (PP). Differences in materials produce different membrane properties. A
major classification based on materials includes the above membranes (polymeric) and those
Water
Microfiltration 0.1 µm
Ultrafiltration, 0.01 µm
Nanofiltration, 0.001 µm
Reverse osmosis, Nonporous
particles, sediments, algae, protozoa, bacteria
small colloids, viruses
DOM, divalent ions (Ca2+, Mg2+)
monovalent species(Na+, Cl-)
Low pressure
membranes
High pressure
membranes

8
which are ceramic-based (e.g. Al2O3, TiO2, CeO2, SiO2, etc.). Historically, polymeric MF/UF
membranes have most commonly been used in water treatment. However, ceramic
membranes are gaining popularity in this field of water treatment as they are more tolerant to
chlorine and ozonation, than polymeric membranes (Lehman and Liu, 2009) and their higher
cost can be compensated for by higher flux.
Membranes can be hydrophilic or hydrophobic which influences the permeability of the
membrane and the adsorption of the contaminants. Hydrophobic membranes tend to be less
permeable hence less prone to fouling (Crittenden et al., 2005). This property can be
determined based on contact angle (angle at which water meets membrane surface) , with
clean hydrophilic membranes having contact angles less than 20° and hydrophobic
membranes having angles greater than 50°. The change in the contact angles after fouling can
assist with characterizing the foulants (Lee et al., 2004).
A membrane’s surface charge depends on its composition and is usually negative for
polymeric membranes. Surface charge and roughness play an important role in fouling.
While negative surfaces reduce fouling by repulsing negatively charged particles (Cho et al.,
2000), it has been observed that rough surfaces tend to foul more (Lee et al., 2004).
Other classifications of membranes include pore geometries to differentiate between
microporous and asymmetric membranes (Hendricks, 2011). And depending on operational
configurations membranes are manufactured as flat sheet/tube and can be incorporated into
different types of modules like plate and frame, spiral wound, tubular, hollow-fiber, hollow-
fine fiber or track etched (Crittenden et al., 2005).
9
2.1.3 Rejection mechanisms and membrane fouling
Membranes remove or reject particles and organic matter as water passes through it. The
following are the important rejection mechanisms associated with membrane filtration:
Size exclusion- Size exclusion or straining is the principal mechanism associated with
membrane filtration. It is the mechanism where larger particles are retained on the
membrane surface and smaller particles pass through. However, depending on particle
and membrane characteristics and their interactions, particles smaller than the membrane
pores may be retained as well, while under some conditions larger flexible particles may
pass through the pores under pressure.
Electrostatic repulsion- As membrane surfaces are normally negatively charged higher
removals of negatively charged contaminants than positively charged or neutral
contaminants of the same size by electrostatic repulsion are expected (Nghiem et al.,
2005). This mechanism depends on solution pH.
Adsorption- Adsorption can act as a vital rejection mechanism when the membrane is
clean. But this capacity diminishes fast and is not good as a long-term process.
Accumulation of contaminants in membrane pores can decrease membrane life.
Absorbed contaminants can also partially diffuse through the membrane and thus
decrease the total rejection by the membrane.
Fouling- Though fouling is problematic in the context of membrane-based treatment
systems, the cake layer formed on the membrane surface can also function as a
mechanism for particle removal. As fouling or cake layer obscures the membrane surface
characteristics, some particles which would not ordinarily be removed may have affinity
to the cake layer formed by fouling.

10
2.1.4 Types of fouling
Fouling decreases the effectiveness of a membrane by accumulation of material (foulant)
within membrane pores and on the membrane surface (Crittenden et al., 2005). Fouling
reduces the flux through the membrane and thus increases the transmembrane pressure
(AWWA, 2005). Classification of fouling is based on foulant type are:
Particulate fouling by colloidal particles larger than the membrane pore size which form
cake layer on the membrane surface. This type of fouling is backwashable.
Fouling by dissolved organic matter which depends on the characteristics of the DOM
and membrane. This is discussed further in Section 2.2.3.
Biofouling, which is caused by microbial accumulation on and attachment to a membrane
surface. This type of fouling is predominantly associated with wastewater applications
and high pressure membranes.
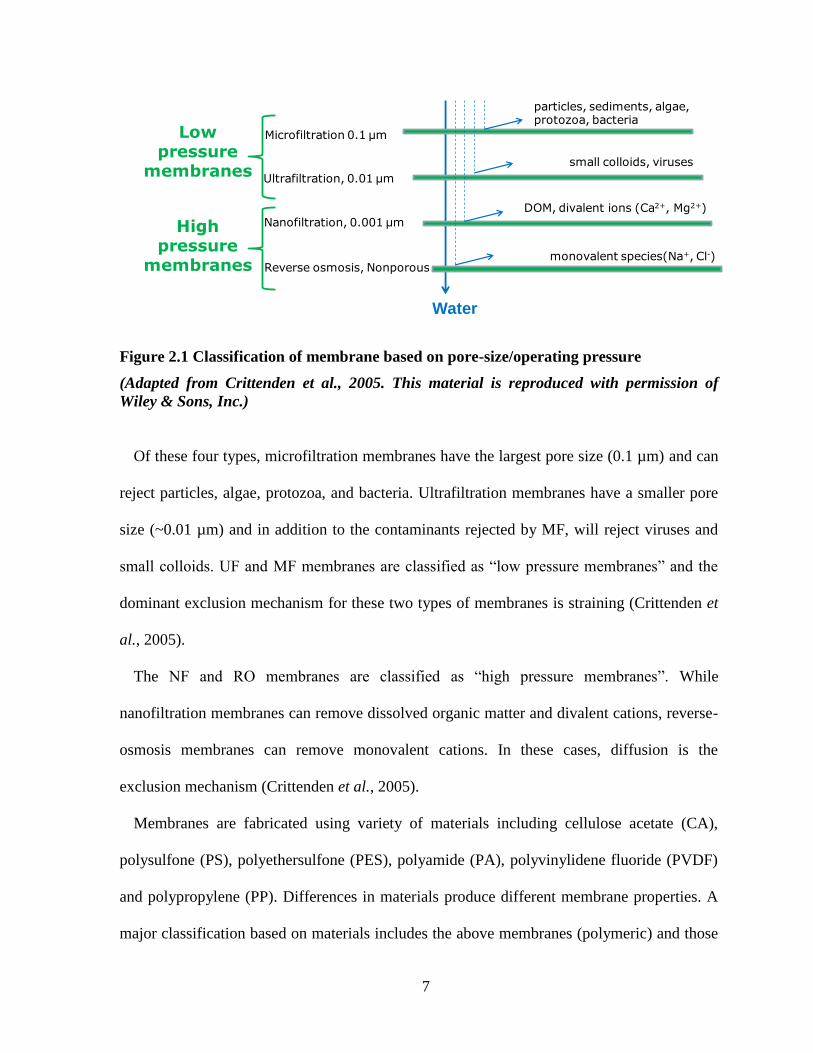
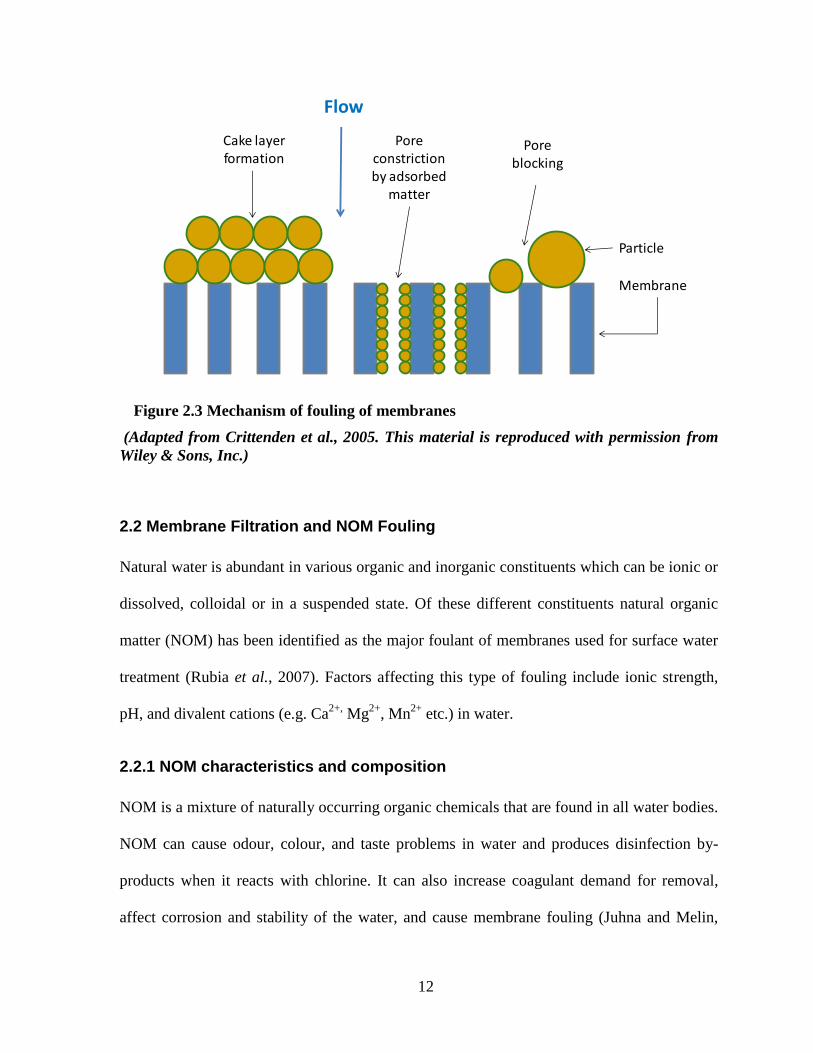
Fouling can also be classified by fouling mechanisms such as i) cake layer formation, ii)
pore constriction, and iii) pore sealing (Crittenden et al., 2005) as shown in Figure 2.3 and
discussed in Section 2.1.5.
Based on removal of foulant layer, fouling can be classified as i) reversible or ii)
irreversible (Figure 2.2). Accumulation of particles and organic matter on a membrane
reduces flux and a part of this flux decline can be recovered by backwashing and chemical
cleaning. This is known as reversible fouling. The part that cannot be removed during
cleaning cycles and leads to permanent degradation of the membrane is termed as irreversible
fouling.

11
Figure 2.2 Example of reversible and irreversible membrane fouling
2.1.5 Fouling mechanisms
Membrane and foulant properties affect fouling mechanisms. These mechanisms (Figure 2.2)
include:
Pore constriction – reduction in flux due to adsorption of small size particles within the
membrane pores decreasing total pore volume,
Pore sealing– pores get completely blocked by particles of similar size as the pore
diameter, and
Cake layer formation – particles larger than the pore size create a layer of deposited
material which increases resistance against flow and the transmembrane pressure.
Studies have shown that while cake layer formation is more common in UF
membranes, MF membranes often foul due to pore constriction (Lee et al., 2004).
Trn
asm
em
bra
ne
Pre
ssu
re →
Time, Volume →
Reversible BackwashableFouling
Hydraulically Irreversible Fouling
Cycle 1
Bac
kwas
h
Cycle 2
Bac
kwas
h
Fouling
Cycle 3
Bac
kwas
h
Cycle n
Bac
kwas
h
12
Figure 2.3 Mechanism of fouling of membranes
(Adapted from Crittenden et al., 2005. This material is reproduced with permission from
Wiley & Sons, Inc.)
2.2 Membrane Filtration and NOM Fouling
Natural water is abundant in various organic and inorganic constituents which can be ionic or
dissolved, colloidal or in a suspended state. Of these different constituents natural organic
matter (NOM) has been identified as the major foulant of membranes used for surface water
treatment (Rubia et al., 2007). Factors affecting this type of fouling include ionic strength,
pH, and divalent cations (e.g. Ca2+,
Mg2+
, Mn2+
etc.) in water.
2.2.1 NOM characteristics and composition
NOM is a mixture of naturally occurring organic chemicals that are found in all water bodies.
NOM can cause odour, colour, and taste problems in water and produces disinfection by-
products when it reacts with chlorine. It can also increase coagulant demand for removal,
affect corrosion and stability of the water, and cause membrane fouling (Juhna and Melin,
Cake layer formation
Pore blocking
Pore constrictionby adsorbed
matter
Flow
Membrane
Particle
13
2006). NOM comprises living and dead plants, animals, microorganisms, and their
degradation products. NOM, in its simplest form can be carbohydrates, lipids, amino acids,
nucleic acids, and their combinations with inorganic chemicals in water (Thurman, 1985).
NOM is moderately soluble in water is moderate and its molecular weight varies. NOM,
like other organics, consists mostly of carbon, oxygen, hydrogen, and small percentage of
nitrogen (Thurman, 1985).
NOM can be classified in various ways. A general classification (based on
biodegradability) is as humic substances (less biodegradable) and non-humic substances
(carbohydrates, lipids and amino acids, all of which are readily biodegradable). In terms of
particle size, NOM can be particulate organic carbon (POC) and dissolved organic carbon
(DOC). POC are larger sized organics (bacteria, algae, flocculated organics that are larger
than 0.2 or 0.45 µm, while particles smaller than this are considered DOC (Juhna and Melin,
2006, Thurman, 1985).
Based on solubility NOM can be classified as humic acid and fulvic acid. Humic acid
remains soluble in alkaline solution and precipitates at low pH, while fulvic acid is soluble in
acidic solution. Humic and fulvic acids have complex structures and the presence of
stereochemical isomers makes it difficult to acquire comprehensive structural data for them
(Jansen et al., 1996). Humic acids have much higher molecular weights (2000-10000 g/mole)
than fulvic acid (500-2000 g/mole) (Thurman et al., 1982). Larger sized components of
NOM include biopolymers (polysaccharides and proteins) which have been found to be
responsible for fouling in membranes (Amy, 2008). NOM also includes fibrils which are
linear aggregates of biopolymers (Makdissy et al., 2010), building blocks (degradation
products of humics), and colloidal organic molecules.

14
2.2.2 NOM characterization
Some of the important methods/analyses used to characterize NOM are described below.
Total and dissolved organic carbons (TOC/DOC) are a measurement of CO2 produced by
oxidation or combustion of organics.
Visible, UV- absorbance, SUVA, and UV intensity are related to organics in water. High
UV absorbance is related to the presence of humic substances.
SUVA is the indication of aromaticity and treatability of the water (for coagulation
treatment). An SUVA value of >4 indicates the presence of highly hydrophobic and
higher molecular weight (MW) aquatic humics, while a value of <2 indicates the
presence of highly hydrophilic, lower MW humics and SUVA between 2 to 4 signifies a
mixture of hydrophobic and hydrophilic, and mixed MW humic and non-humic
substances in water (Edzwald and Tobiason, 1999). Smaller SUVA values indicate that
the water contains more biodegradable organics (Juhna and Melin, 2006).
Methods of NOM characterization using size exclusion include the use of high
performance size exclusion chromatography HP-SEC. An example of which is liquid
chromatography-organic carbon detection (LC-OCD) analysis which uses a
chromatographic column and phosphate buffer and includes UV and organic nitrogen
detectors (Huber et al., 2011). This technique is sensitive and requires comparatively
simple sample preparation and with combined functions of the detectors and elution times
can characterize the NOM into the following fractions:
o Biopolymers (A in Figure 2.4) – hydrophilic fraction with high MW (≥10 kDa),
including polysaccharides and protein like materials, does not have a UV
response.

15
o Humic substances (B) – includes humic and fulvic acids, where humic acids are
eluded earlier (at 43.4 min) than fulvic acids (46.7 min), which are largest peaks
in the chromatogram and this fractions absorbs UV.
o Building blocks (C) – these are lower-MW humic-like materials, possibly
produced from degradation of humic substances (0.3 – 0.45 kDa)
o Low MW acids (D) – these are anions at neutral pH of the phosphate buffer and
may sometimes include small amounts of low MW humics which can be
separated by using empirical formulae
o Low MW neutrals (E) – hydrophilic to amphilic in nature, includes low MW
alcohols, aldehydes, ketones, amino acids and sugars, no/low UV response
Figure 2.4 is an example of an LC-OCD-derived chromatogram.
Figure 2.4 LC-OCD chromatogram with organic carbon, UV, and organic nitrogen
detector signal responses indicating different NOM fractions elution times for Pfinz
River (Germany) water
(Reprinted from Huber et al., 2011, with permission from Elsevier)
16
Another NOM detection technique in use is fluorescence excitation emission matrix
(FEEM) (Peiris et al., 2010). This technique involves excitation of electrons followed by
light emission at different wavelengths for NOM characterization.
The above methods and various other methods including pyrolysis gas chromatography-
mass spectrometry (Pyr-GC-MS), nuclear magnetic resonance (NMR), Fourier transform
infrared spectroscopy (FTIR), and liquid chromatography-mass spectrometry (LC-MS) are
described in detail by Matilainen et al. (2011).
2.2.3 NOM in membrane fouling
NOM plays an important role in membrane fouling (Hong and Elimelech, 1997). Lee et al.
(2004) showed that the hydrophilic fraction of NOM can provide a good estimate of fouling
for low-pressure membranes. The study also indicated the greater fouling potential of
proteins and polysaccharides i.e. biopolymers (Lee et al., 2004).
Hallé et al. (2009) observed marked increases in transmembrane pressure after each
backwash cycle were associated with biopolymer concentration increases in water. NOM is
considered to be the main reason for building up fouling layer on membranes by Cornelissen
et al., (2006). However, the effect of polysaccharides and proteins on membrane material is
not yet fully established (Huang et al., 2009; Ratajczak et al., 2012).
Ionic strength, pH, and divalent cations in water influence membrane fouling by NOM.
Ionic strength and pH affect the surface charge of the membranes and NOM which often
results in less repulsion between membrane surfaces and NOM (Cho et al., 2000) and
subsequent deposition of NOM on the membrane surface thus causes fouling.
Divalent cations aid NOM fouling by increasing the ionic strength of the particles and also
by forming complexes with NOM creating larger compounds which are more likely to be

17
rejected by a membrane (Sobeck and Higgins, 2002; Farahbakhsh et al., 2004). However,
this is dependent on a particular NOM molecule’s shape, size, charge density, and
aromaticity (Cho et al., 2000).
2.3 Membrane Pre-treatment Methods
Membrane filters are bound to foul to an extent depending on the characteristics of the water.
The faster the membranes get fouled, the more expensive it is from an operational point-of-
view as chemical cleaning will add to costs and it will also reduce the life of the membrane.
To reduce or control membrane fouling, various pretreatment options are currently in
practice. However, optimum operating conditions, interactions between chemical
pretreatment and membranes, cost, and compatibility are yet to be resolved (Farahbakhsh et
al., 2004). A few common pre-treatment techniques for low-pressure membranes are
described in the following sections.
2.3.1 Coagulation
Coagulation is the most common and cost effective pretreatment process for low-pressure
membranes. It involves the application of chemicals to destabilize and neutralize the charge
of the suspended particles (NOM) in water and increase their size by formation of flocs for
ease of removal (Gaulinger, 2007). Though coagulants can be available as inorganic metal
salts and organic macromolecules, metal salts such as alum, ferric chloride, and sulfate and
polyaluminum chloride (PACl) are most commonly used (Huang et al., 2009).
Coagulation occurs by two mechanisms i) charge neutralization or ii) sweep flocculation.
Charge neutralization is dominant in the pH range of 5.5-6.5 when metal species of charge
opposite to that of particles neutralize the surface charge those particles resulting in removal

18
as precipitates by forming flocs. Sweep flocculation occurs at higher coagulant doses and
higher pH (>6.5). The coagulant metal ions in water form metal hydroxide (aluminum
hydroxide) which precipitates due to its low solubility. In this case, suspended particulates
get attached to the precipitated metal hydroxides and settle out (Gregory and Duan, 2001;
Gao et al., 2011).
Removal of NOM by coagulation can occur through any of the two mechanisms depending
on the pH. Humic substances being negative charged can precipitate as metal-humic
complexes with positively charged metal coagulants. Or at higher pH humics can absorb on
the metal hydroxides. However, it is difficult to distinguish between the mechanisms
(Gregory and Duan, 2001).
Coagulation processes can be classified as standard (with sedimentation) and in-line
coagulation (Gao et al., 2011). While some researchers acknowledge the benefits of standard
coagulation (Liang et al., 2008), others (Dong et al., 2007, Konieczny et al., 2009) using in-
line coagulation also found reduction in fouling by increased removal of hydrophilic
compounds by getting deposited on the cake layer formed on the membrane surface.
In most studies (Choi and Dempsey, 2004; Howe and Clark, 2002; Ratajczak et al., 2012)
coagulation has proved to be a good pretreatment for polymeric membranes (Figure 2.5). An
exception is the study by Maartens et al. (1999) where higher flux reduction was observed
with metal-ion coagulants. However, fouling reduction depends on the coagulant nature and
optimum dose (Barbot et al., 2008). Non-optimized coagulant dosages may increase fouling
even more than without any pretreatment at all (Howe and Clark, 2002, Choi and Dempsey,
2004, Ratajczak et al., 2012). A higher dose than optimum can also increase irreversible
fouling (Meyn et al., 2010).
19
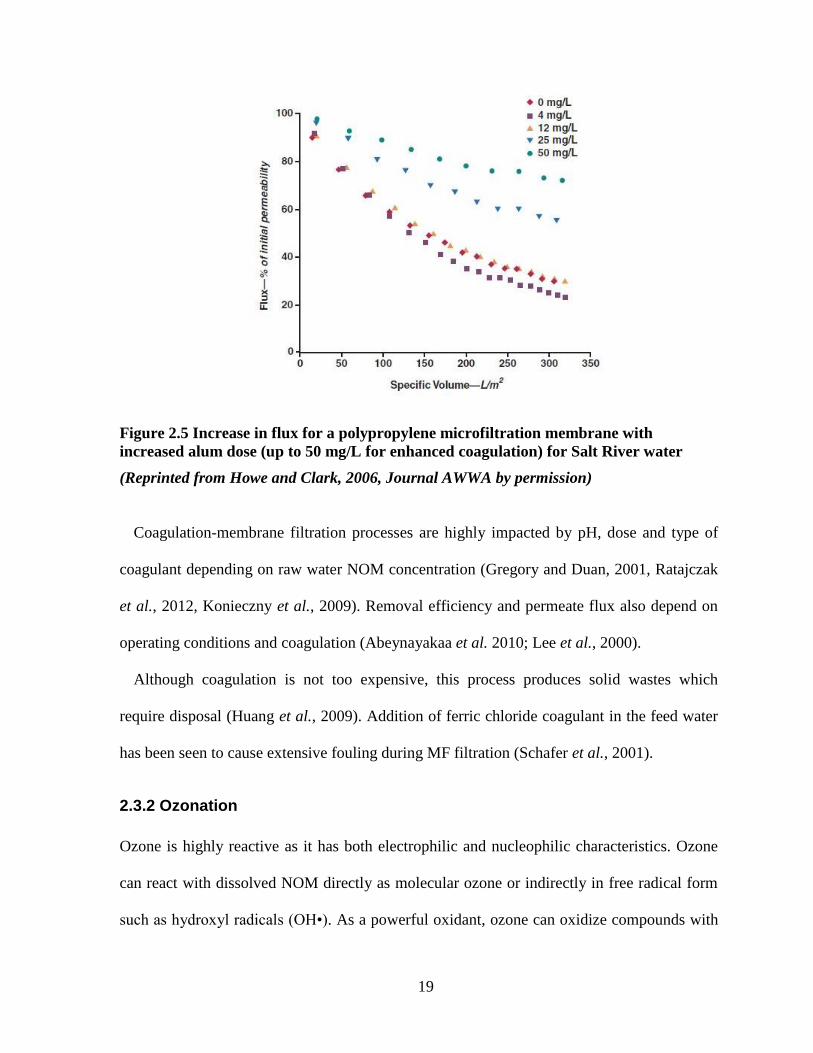
Figure 2.5 Increase in flux for a polypropylene microfiltration membrane with
increased alum dose (up to 50 mg/L for enhanced coagulation) for Salt River water
(Reprinted from Howe and Clark, 2006, Journal AWWA by permission)
Coagulation-membrane filtration processes are highly impacted by pH, dose and type of
coagulant depending on raw water NOM concentration (Gregory and Duan, 2001, Ratajczak
et al., 2012, Konieczny et al., 2009). Removal efficiency and permeate flux also depend on
operating conditions and coagulation (Abeynayakaa et al. 2010; Lee et al., 2000).
Although coagulation is not too expensive, this process produces solid wastes which
require disposal (Huang et al., 2009). Addition of ferric chloride coagulant in the feed water
has been seen to cause extensive fouling during MF filtration (Schafer et al., 2001).
2.3.2 Ozonation
Ozone is highly reactive as it has both electrophilic and nucleophilic characteristics. Ozone
can react with dissolved NOM directly as molecular ozone or indirectly in free radical form
such as hydroxyl radicals (OH•). As a powerful oxidant, ozone can oxidize compounds with

20
carbon-carbon double bonds and also aromatic compounds (Beltran, 2004). In the reaction of
ozone with NOM, oxygenated saturated bonds are formed which can be carboxylic,
aldehydic, or ketonic groups that are hydrophilic in nature (von Gunten, 2003a). Also,
unsaturated bonds present in humics can be easily broken down by ozone to form low
molecular weight compounds (van Geluwe et al., 2009). This reaction may increase
membrane flux as the hydrophilic products are less likely to cause fouling (Geluwe et al.,
2011). The breaking down of the humic substances is considered to be from the periphery in
the “outside-in trimming mechanism” hypothesized by Jansen et al. (2006), where the central
part of the molecule remains intact with the double bonds and bonds on the outer side break
resulting in the degradation into small compounds (<200 Da).
In the case of proteins and polysaccharides, pore constriction or blocking is common in
low-pressure membrane because of the size of these molecules. Ozone depolymerises the
polysaccharides by oxidizing the in β-D-glycosidic linkages (Wang et al., 1999). In the case
of reacting with protein it was seen in the study of Cataldo (2003) that in solid state, proteins
are not affected by ozone, but when in solution, ozone oxidizes aromatic amino acids.
Ozonation also modifies the secondary and tertiary structures of protein. However, ozonation
cannot break the polyamide bond of the main chain of the protein (Cataldo, 2003). By
breaking the NOM to smaller particles, ozone facilitates the removal of these particles and
hence reduces flux drop through the membranes (Karnik et al., 2005; Lee et al., 2005b). The
effect of divalent cations on ozone-induced reduction of membrane flux drop is yet to be
elucidated. While some researchers have suggested less flux decline due to secondary
removal of small (nano) particles by divalent ion-NOM complexes on fouling layers
21
(Lohwacharin and Takizawa, 2009), others have suggested the reduction in flux is due to the
formation of a dense cake layer (Hong and Elimelech, 1997, Costa et al., 2006).
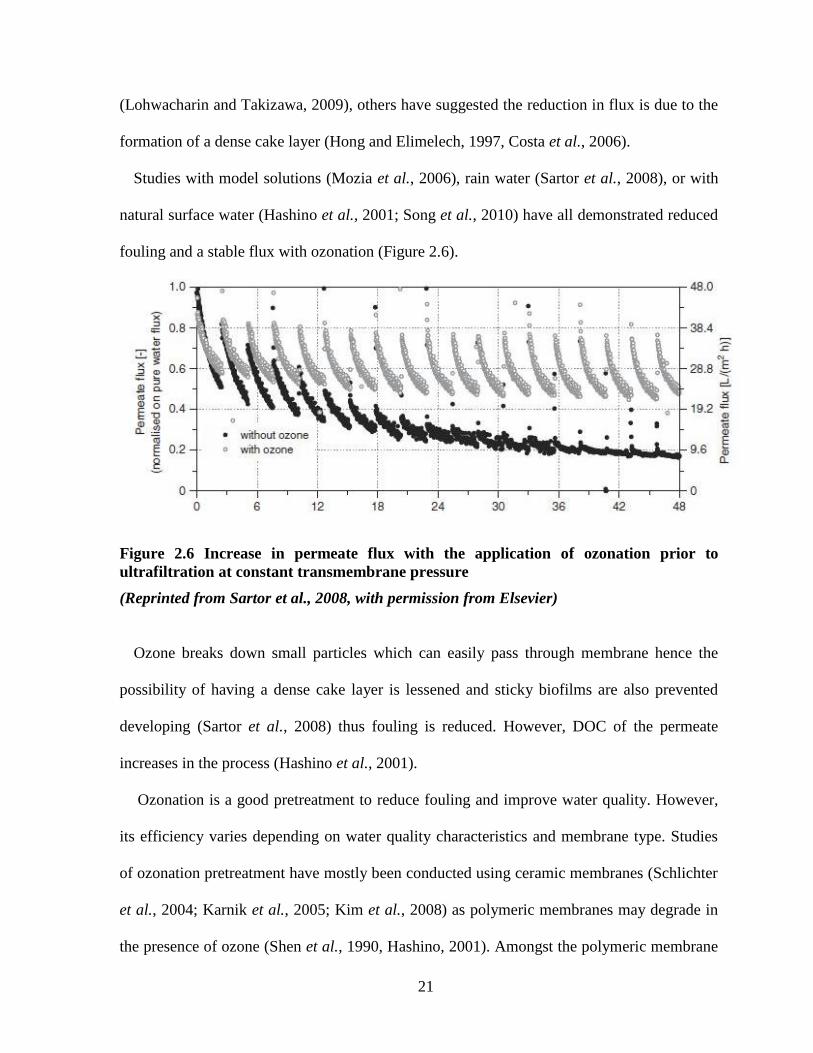
Studies with model solutions (Mozia et al., 2006), rain water (Sartor et al., 2008), or with
natural surface water (Hashino et al., 2001; Song et al., 2010) have all demonstrated reduced
fouling and a stable flux with ozonation (Figure 2.6).
Figure 2.6 Increase in permeate flux with the application of ozonation prior to
ultrafiltration at constant transmembrane pressure
(Reprinted from Sartor et al., 2008, with permission from Elsevier)
Ozone breaks down small particles which can easily pass through membrane hence the
possibility of having a dense cake layer is lessened and sticky biofilms are also prevented
developing (Sartor et al., 2008) thus fouling is reduced. However, DOC of the permeate
increases in the process (Hashino et al., 2001).
Ozonation is a good pretreatment to reduce fouling and improve water quality. However,
its efficiency varies depending on water quality characteristics and membrane type. Studies
of ozonation pretreatment have mostly been conducted using ceramic membranes (Schlichter
et al., 2004; Karnik et al., 2005; Kim et al., 2008) as polymeric membranes may degrade in
the presence of ozone (Shen et al., 1990, Hashino, 2001). Amongst the polymeric membrane

22
materials, polyvinylidenefluoride (PVDF) is the least vulnerable to ozone degradation
compared to polyethylene, polysulfone, and polycrylonitrile (Mori et al., 1998; Hashino et
al., 2001; Farahbakhsh et al., 2004). Optimum dosing is critical based on site specific criteria
and the process may not be cost effective. Also the potential formation of bromate, a
regulated ozone by-product, needs to be taken into consideration.
2.3.3 Biofiltration
Biofiltration can act as a membrane pretreatment in two ways; as a i) direct biofiltration
pretreatment and as ii) biofiltration after ozonation. A detailed description of biofiltration
processes and their potential as membrane pretreatment options is explained in detail in
Sections 2.4 and 2.5.
2.3.4 Others
Other pretreatment techniques include absorption using PAC (Bérubé et al., 2002), ion
exchange, MIEX® resin (Kabsch-Korbutowicz et al., 2008), and combinations of different
pretreatment techniques (Ødegaard et al., 2010; Gao et al., 2011).
2.4 Biological Filtration in Drinking Water Treatment
Biofiltration is a “green” technique for water treatment. It has been widely used in
wastewater treatment applications and its use in drinking water treatment in Europe has been
practiced since the 1970’s (Rittmann and Huck, 1989). However, this technique has gained
popularity in North America only relatively recently due to its potential to deal with modern
water treatment challenges (Brown, 2007).
Drinking water biofiltration is typically in the form of regular slow or rapid filtration with
sand or anthracite, biologically active carbon filtration, or filtration with other types of media

23
in the absence of chlorine. Lack of the presence of a disinfectant allows for growth of
biofilms on the filter media which have the potential to remove different organics and
contaminants (Huck et al., 2011).
2.4.1 Application of biofiltration
Electron donors in natural water include BOM, NH4+
, Fe+2
, NO2-, Mn
+2, and S which are the
cause of bio-instability of the water (Rittmann and McCarty, 2001). BOM, wit concentration
of <10 µg/L when measured as AOC and <50 µg/L when measured as BDOC, is considered
a requirement to ensure biostability. The presence of an ozonation process in a treatment
train can increase the easily biodegradable portion of NOM even further (Rittmann, 1995). If
uncontrolled, this can result in bacterial re-growth in distribution systems, reduced dissolved
oxygen levels, problems associated with taste, odour, nitrate, corrosion, and also the
formation of disinfection-by-products (such as THMs, haloacetic acids, chlorinated
aromatics). Hence, ensuring biostability of the finished water is important, where biofiltration
can play an important role.
Biofiltration is a robust process that can be inserted in any stage of a treatment plant. It
does not require chemical addition, or pH, temperature, or oxidation potential adjustments
like many other treatment processes (Juhna and Melin, 2006). It produces less chemical
waste/sludge and thus can be cost effective (Brown, 2007). It can remove trace contaminants
and odour causing compounds from water (Elhadi et al., 2006), control bacterial re-growth in
the distribution system (Persson et al., 2006), and aid in denitrification (NO3- to N2) of water
(Rittmann and McCarty, 2001). The process uses indigenous bacteria which are not harmful
to human health, and the filter environment is not favorable for the growth of pathogenic
bacteria (Rittmann and McCarty, 2001). Biofiltration is usually followed by some

24
disinfection/membrane treatment process which makes the treated water safe for human
consumption (Brown, 2007).
Biofiltration also has the potential to remove organic foulants of membranes (Peldszus et
al., 2011; Filloux et al., 2012) and thus can play a role in fouling control and energy
consumption for membrane filtration processes (Mosqueda-Jimenez and Huck, 2006). The
role of biofiltration in membrane fouling reduction is further confirmed using advanced
liquid chromatography with organic carbon detection (LC-OCD) by Hallé et al. (2009).
2.4.2 Biofiltration process
Biofilters are colonized by native bacteria in the water and in the case of drinking water these
bacteria are usually heterotrophic (mostly oligotrophs) which use organic compounds as
electron donors (Brown, 2007). An ideal environment for the growth of bacteria must include
nutrients as well and being oligotrophic, they can survive and achieve substantial removal
efficiently in low nutrient conditions which is common in drinking water treatment scenarios
(Rittmann and Huck, 1989). Bacteria use red-ox reactions for energy generation and in the
process of reducing primary electron donor substrate (BOM) to CO2 (aided by O2) secondary
removal of contaminants may be achieved (Rittmann, 1995).
The filter becomes biologically active with the “aggregation and attachment” of bacteria to
the media (Figure 2.7). Biofilm growth in water may take several months and is mostly
dependant on water characteristics (Chaudhury et al., 2003). Microorganisms, (both bacteria
and protozoa) attach to the media using extracellular polymer (EPS) which provides habitat
and protects bacteria, and ensures significant biofilm retention to achieve a treatment credit
(Rittmann, 1995).
25
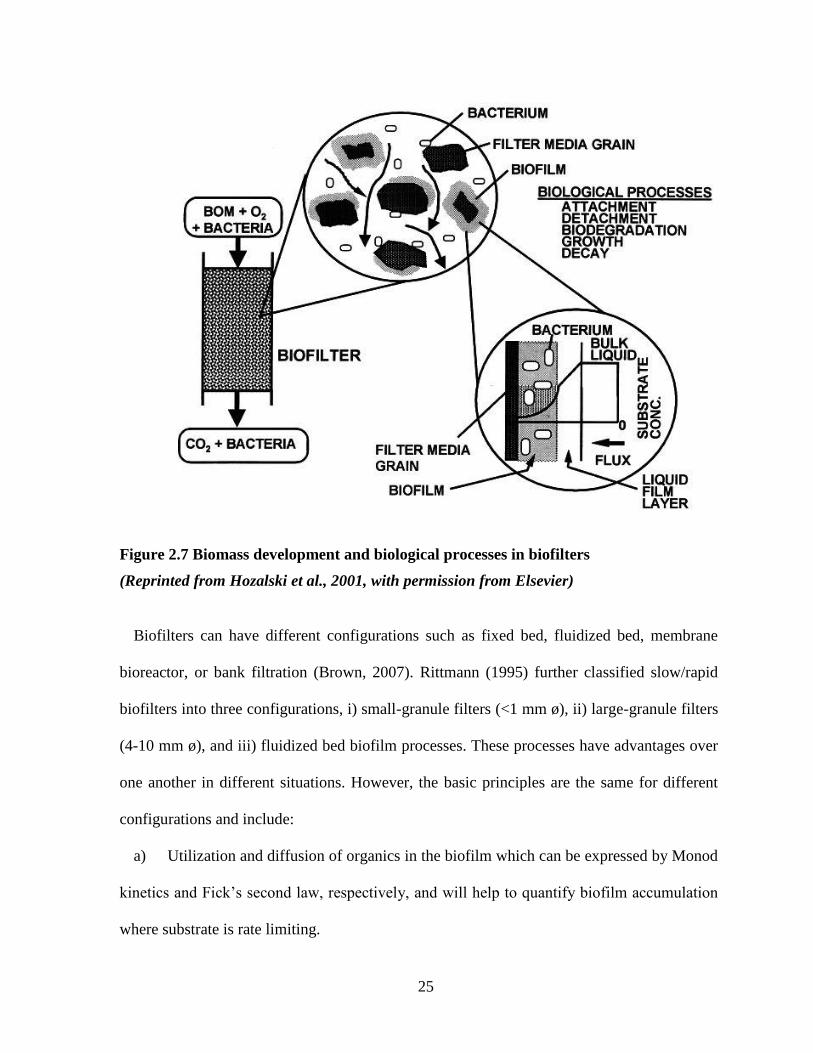
Figure 2.7 Biomass development and biological processes in biofilters
(Reprinted from Hozalski et al., 2001, with permission from Elsevier)
Biofilters can have different configurations such as fixed bed, fluidized bed, membrane
bioreactor, or bank filtration (Brown, 2007). Rittmann (1995) further classified slow/rapid
biofilters into three configurations, i) small-granule filters (<1 mm ø), ii) large-granule filters
(4-10 mm ø), and iii) fluidized bed biofilm processes. These processes have advantages over
one another in different situations. However, the basic principles are the same for different
configurations and include:
a) Utilization and diffusion of organics in the biofilm which can be expressed by Monod
kinetics and Fick’s second law, respectively, and will help to quantify biofilm accumulation
where substrate is rate limiting.
26
b) Transfer of mass between liquid and biofilm.
c) Biofilm development and detachment (due to shear stress, turbulence, abrasion etc.).
During steady-state operation the decay/detachment and growth of bacteria in the filter are
in a state of balance (Chaudhury et al., 2003).
2.4.3 Factors affecting biofilter performance
Brief descriptions of the various factors that affect biofiltration process are provided below.
A more detailed description can be found in the review of Urfer et al. (1997).
Filter Media – Biofilter media can be non-adsorptive (sand/anthracite) or adsorptive
(GAC). Surface area, texture, and cost of the media play an important role in selection.
Compared to other common media types (sand/anthracite), GAC surface appear better for
bacteria attachment due to its irregularities. GAC has demonstrated better performance in
organic removal and biomass development than sand-anthracite filters, especially
mesoporous GAC (Pirbazari et al., 1990; Wang et al., 1995).
Contact time – Empty bed contact time can substantially affect biofilter performance if it is
too short. Increased EBCT is associated with increased organic removal (Servais 1992).
Though EBCT depends on hydraulic loading and depth, these do not regulate BOM removal
(Zhang and Huck, 1996; Servais et al., 1994; Wang et al., 1995). EBCT may be different
depending on treatment goals and stage of the biofilter, however, EBCT has an optimum
value, beyond which increasing contact time will not aid removal (Zhang and Huck, 1996).
Backwashing – There can be different backwash strategies for biofilters such as water
only, with air scour, and using chlorinated or non-chlorinated for backwashing. Backwashing
has important effects on long term performance (Bouwer and Crowe, 1988) and is
recommended when re-starting after a shut-down due to endotoxin build-up (Anderson et al.,

27
2008). Though suspected, Servais et al. (1991) did not observe significant biomass loss
during backwash. Collapse pulsing was subsequently suggested as a better backwash strategy
by Servais et al. (1991) and Ahmad et al. (1994).
Temperature – Biological activity is temperature dependant and in colder temperature a
biofilter requires longer contact time for efficient organics removal (Servais et al., 1992).
Temperature also affects media selection. GAC has been shown to perform better than sand-
anthracite filters at colder (1 – 3°C) temperatures, while they perform similarly in warmer
(21 – 24°C) environments (Emelko et al., 2006).
Other parameters that affect biofilter performance are extreme pH, toxic substances,
preceding treatment processes such as ozonation (Rittmann and Huck, 1989), and influent
organic concentrations (Zhang and Huck, 1996). However, organic removal is not necessarily
proportional to the amount of biomass present (Wang et al., 1995).
2.4.4 Process modeling
Various models are available for the prediction of bioreactor performance using different
water quality (feed, available organics, and nutrients) and system environmental parameters
(contact time, temperature etc.) as inputs (Brown, 2007). Most consider steady-state
conditions (balanced growth and loss) and have some limitations. A non-steady-state
condition may arise during changes in operating condition (e.g. backwash) or start-up period
(Rittmann and Huck, 1989).
Most drinking water treatment situations deal with much lower raw water BOM
concentrations compared to levels dealt with in wastewater treatment situations and BOM is
often rate limiting (Rittmann and McCarty, 2001). A model estimates flux of substrate at the
biofilm surface as a function of substrate concentration. As microorganisms use organics

28
they are constantly being diffused into the biofilm and this reduces the concentration of
substrate at the biofilm surface more than in bulk liquid, making it difficult to replicate in a
model (Rittmann and Huck, 1989).
Some biofiltration process models which have application for drinking water biofilters
include the:
Steady-state biofilm model by Rittmann and McCarty (1980) which uses Monod
kinetics and Fick’s law and introduced the concept of Smin (below this biofilm cannot
be maintained), however, biofilm growth and time are not considered.
Kinetics of biofilms on activated carbon (BFAC) model by Chang and Rittman (1987)
considered biofilm growth, mass transfer, biodegradation and adsorption, filter depth,
bed porosity, but does not consider backwash induced non-steady state conditions
CHARBROL model by Billen et al (1992) is for designing biofiltration processes by
estimation of BDOC removal and biomass distribution at select temperatures and
EBCTs.
First order biofilm model (with the concepts of steady-state model by Rittmann and
McCarty) by Zhang and Huck (1996), introduced the concept of dimensionless contact
time X*. A related parameter biofiltration factor ‘BF’ was proposed by Huck and
Sozański (2008) which can be used as an important design parameter for biological
filters and be defined by percent removal of AOC.
BIOFILT model developed by Hozalski and Bouwer (2001) includes non-steady state
conditions attributed to backwashing.
29
2.5 Biofiltration as Membrane Pre-treatment
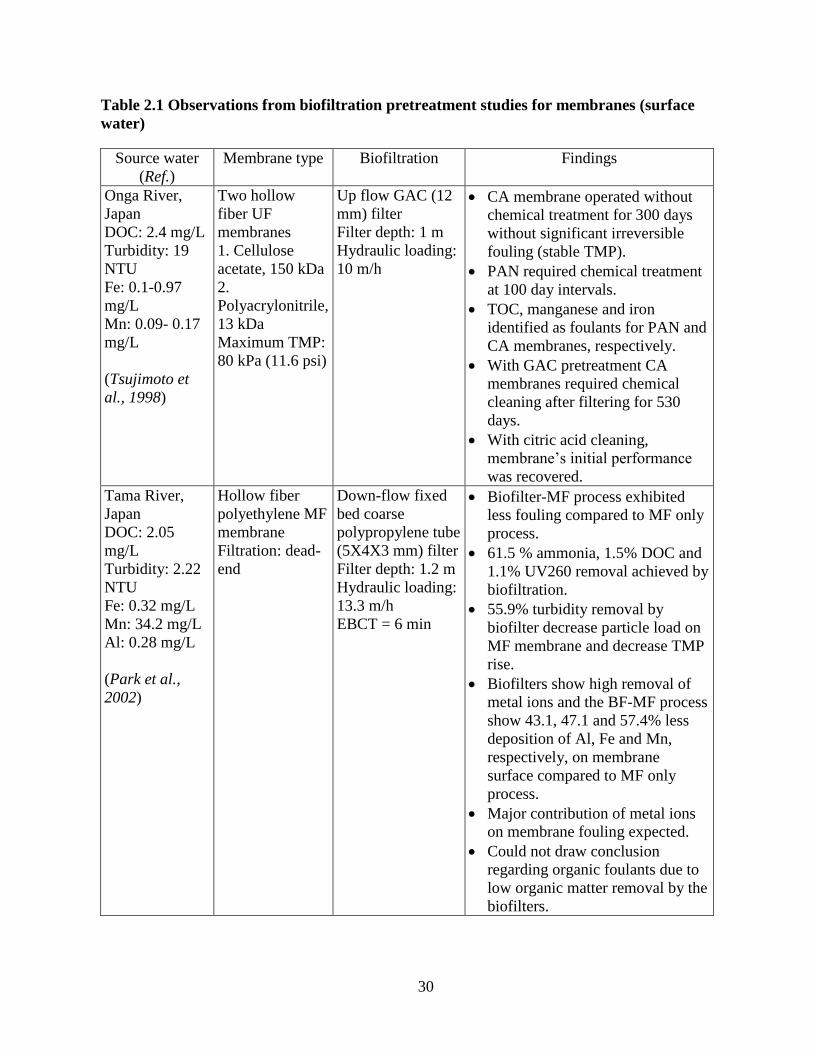
Biofiltration can be employed as a membrane pretreatment directly or following ozonation.
Table 2.1 presents some studies where direct biofiltration has been used as membrane
pretreatment and significant fouling reduction has been achieved compared to direct
polymeric membrane filtration processes. While two earlier studies (Tsujimoto et al., 1998;
Park et al., 2002) examined the effect of TOC and metal foulants, more recent studies focus
on identifying the fractions of DOC responsible for fouling.
30
Table 2.1 Observations from biofiltration pretreatment studies for membranes (surface
water)
Source water
(Ref.)
Membrane type Biofiltration Findings
Onga River,
Japan
DOC: 2.4 mg/L
Turbidity: 19
NTU
Fe: 0.1-0.97
mg/L
Mn: 0.09- 0.17
mg/L
(Tsujimoto et
al., 1998)
Two hollow
fiber UF
membranes
1. Cellulose
acetate, 150 kDa
2.
Polyacrylonitrile,
13 kDa
Maximum TMP:
80 kPa (11.6 psi)
Up flow GAC (12
mm) filter
Filter depth: 1 m
Hydraulic loading:
10 m/h
CA membrane operated without
chemical treatment for 300 days
without significant irreversible
fouling (stable TMP).
PAN required chemical treatment
at 100 day intervals.
TOC, manganese and iron
identified as foulants for PAN and
CA membranes, respectively.
With GAC pretreatment CA
membranes required chemical
cleaning after filtering for 530
days.
With citric acid cleaning,
membrane’s initial performance
was recovered.
Tama River,
Japan
DOC: 2.05
mg/L
Turbidity: 2.22
NTU
Fe: 0.32 mg/L
Mn: 34.2 mg/L
Al: 0.28 mg/L
(Park et al.,
2002)
Hollow fiber
polyethylene MF
membrane
Filtration: dead-
end
Down-flow fixed
bed coarse
polypropylene tube
(5X4X3 mm) filter
Filter depth: 1.2 m
Hydraulic loading:
13.3 m/h
EBCT = 6 min
Biofilter-MF process exhibited
less fouling compared to MF only
process.
61.5 % ammonia, 1.5% DOC and
1.1% UV260 removal achieved by
biofiltration.
55.9% turbidity removal by
biofilter decrease particle load on
MF membrane and decrease TMP
rise.
Biofilters show high removal of
metal ions and the BF-MF process
show 43.1, 47.1 and 57.4% less
deposition of Al, Fe and Mn,
respectively, on membrane
surface compared to MF only
process.
Major contribution of metal ions
on membrane fouling expected.
Could not draw conclusion
regarding organic foulants due to
low organic matter removal by the
biofilters.

31
Source water
(Ref.)
Membrane type Biofiltration Findings
Grand River,
ON, Canada
DOC: 5-7 mg/L
Turbidity: 0.45-
62 NTU
Alkalinity: 160-
250 mg/L as
CaCO3
Hardness: 200-
350 mg/L as
CaCO3
(Hallé et al.,
2009)
Hollow fiber
PVDF UF
membrane
(GE/Zenon,
Canada), 400
kDa
Filtration: dead-
end
Maximum TMP:
9 psi
Run length- 5
days
Two dual
(anthracite/sand)
media biofilters in
down-flow mode
Biofilter preceded
by gravel roughing
filter (RF) for
turbidity removal
Total depth- 1.2 m
Hydraulic loading:
5 m/h
Biofilter 1: depth:
0.4 m, EBCT- 5
min
Biofilter 2: depth:
1.17 m, EBCT- 14
min
Average 11% DOC removal by
RF-BF combined system during
active period (in winter biofilters
considered inactive).
Fractions of DOC more important
than total DOC in assessing
biofiltration efficiency as
membrane pretreatment.
Average % biopolymer removal
by BF1 and BF2, 40 ± 26% and
60 ± 22% respectively.
Low removal of humic substance
and low molecular weight acids
and high (95-98%) removal of
turbidity observed from the
biofilters.
Increased biopolymer removal by
membrane with increased fouling.
With higher EBCT filter, greater
removal for biopolymers and
lower reversible and irreversible
fouling were observed, while
other water quality parameters
remain unchanged.
Biopolymers found to be more
important foulants for this water
and membrane type.
Grand River,
ON, Canada
DOC: 5-7 mg/L
Turbidity: 1.38-
24.6 NTU
Alkalinity: 160-
250 mg/L as
CaCO3
Hardness: 200-
350 mg/L as
CaCO3
(Huck et al.,
2011)
Hollow fiber
PVDF pilot-UF
membrane (GE/
Zenon, Canada)
Pore size: 0.04
µm
Filtration: Dead-
end
Run length -
>200 h
Three dual
(anthracite/sand)
media biofilters in
down-flow mode
following gravel
RF
Hydraulic loading:
5 m/h
Biofilter 1: depth:
0.4 m (Ø-20cm),
EBCT- 5 min
Biofilter 2: depth:
0.83 m (Ø-20cm),
EBCT- 10 min
Biofilter 3: depth:
0.55 m (Ø-15cm),
EBCT- 15 min
Lower irreversible fouling
observed with higher EBCTs.
TMP recovery data indicated
importance of frequent
maintenance cleaning.
Biofilters removed turbidity to <1
NTU and turbidity removal
efficiency seen to increase with
increasing EBCT.
Relating turbidity removal and
TMP increase indicated no direct
relation between turbidity and
irreversible fouling.
Increased biopolymer removal
achieved with increased EBCT.

32
Biofiltration achieved excellent turbidity removal in all cases listed in Table 2.1, although
that was not the objective of the process as studied since it was not considered to be a final
treatment step. DOC removal is affected by temperature. Peldszus et al (2012) found about
15% DOC removal in warmer temperatures and reported that it dropped to less than 5%
during the winter. Figure 2.8 shows substantial removal of biopolymers by the biofilters, as
the main fraction seen to be rejected by the UF membrane used (Hallé et al., 2009).
Figure 2.8 LC-OCD chromatogram showing removal of DOC fractions by biofilters
combined with roughing filter for Grand River water Ontario, Canada
(Reprinted with permission from Hallé et. al, 2009, © American Chemical Society)
As mentioned previously, EBCT is very important for good performance of biofilters and
different studies at bench- and pilot-scale have found benefits in using longer EBCT for
fouling reduction (Hallé et al., 2009; Huck et al., 2011; Peldszus et al., 2012). Hallé et al.
(2009) observed different degrees of fouling with two filters having different EBCTs while
the percentage DOC removal was similar which indicates the importance of DOC fractions
instead of the total DOC in fouling. They also found a positive correlation between
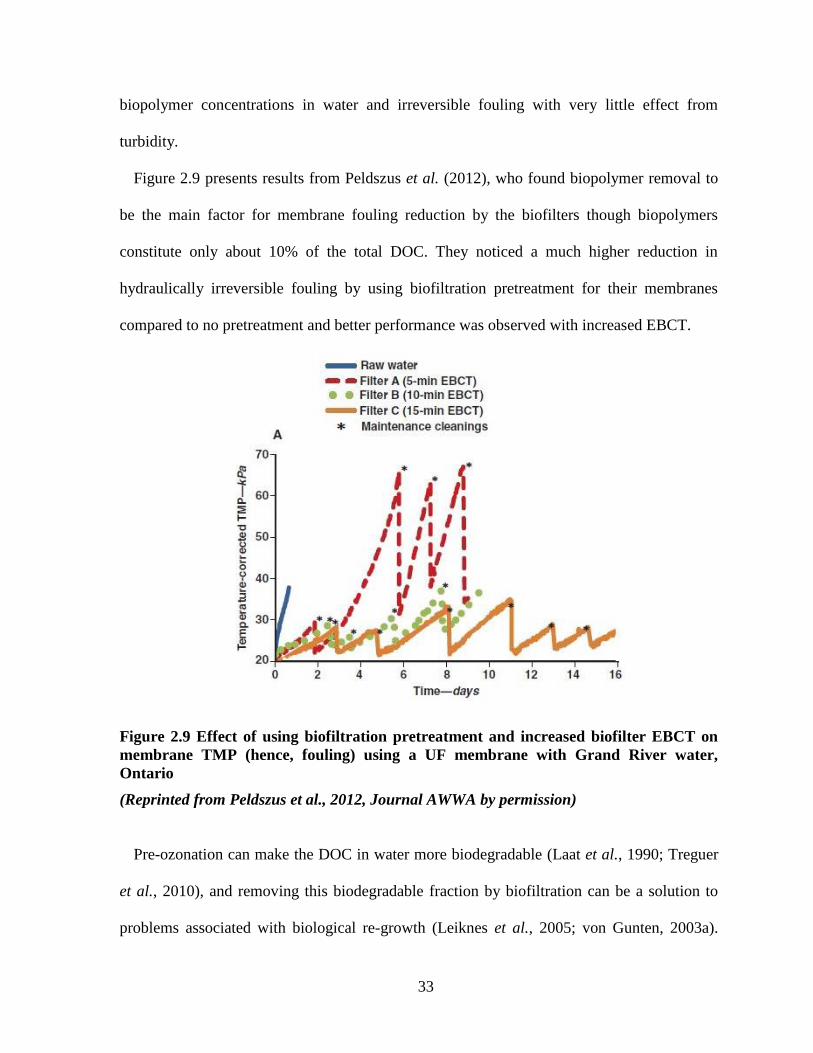
33
biopolymer concentrations in water and irreversible fouling with very little effect from
turbidity.
Figure 2.9 presents results from Peldszus et al. (2012), who found biopolymer removal to
be the main factor for membrane fouling reduction by the biofilters though biopolymers
constitute only about 10% of the total DOC. They noticed a much higher reduction in
hydraulically irreversible fouling by using biofiltration pretreatment for their membranes
compared to no pretreatment and better performance was observed with increased EBCT.
Figure 2.9 Effect of using biofiltration pretreatment and increased biofilter EBCT on
membrane TMP (hence, fouling) using a UF membrane with Grand River water,
Ontario
(Reprinted from Peldszus et al., 2012, Journal AWWA by permission)
Pre-ozonation can make the DOC in water more biodegradable (Laat et al., 1990; Treguer
et al., 2010), and removing this biodegradable fraction by biofiltration can be a solution to
problems associated with biological re-growth (Leiknes et al., 2005; von Gunten, 2003a).
34
Hence, an ozone-biofiltration combined pretreatment can be applied as a robust process that
will decrease the NOM-loading on the membranes as well as reducing the threat of DBP
formation. This pretreatment technique was shown to be beneficial in reducing membrane
fouling (Nishujima and Okada, 1998); however, Geismar et al. (2012) found no significant
effect of BAC after ozonation on the total fouling index.
2.6 Nutrient Enhancement and Biofilter Performance
Biofiltration processes are highly dependent on the availability of organic carbon as well as
key elements (nutrients) as these are essential for the sustenance and growth of biofilm
bacteria. Based on biomass chemistry, different ratios of balanced nutrient conditions have
been suggested (Rittman and McCarty, 2001, LeChevallier et al., 1991; Sathasivan et al.,
1999). The approximate C:N:P ratio of 100:10:1 (Redfield, 1958; USPEA, 1992) is
considered important for balanced growth of heterotrophic bacteria and been used to estimate
organic or nutrient limitation in biofilters. Lauderdale et al. (2012) used this C:N:P ratio to
add phosphorus to their biofilters when they found a phosphorus limitation in their biofilters.
They also related the phosphorus limitation to increased headloss experienced in their filters.
By adding phosphorus in the form of phosphoric acid to one filter they observed a
remarkable improvement in the hydraulic performance of the filter (15% decrease in terminal
headloss, 75% increase in DOC removal and 30% increase in ATP). Others doing similar
nutrient enhancement experiments have also observed positive changes in biofilter
performance (Li et al., 2010; Sang et al., 2003). However, this is not the case for all studies.
In some cases even with what appeared to be a phosphorus limited condition, phosphorus
addition did not result in significant improvement in biofilter performance (Melin et al.,
2002; Vahala et al., 1998). Similar experiments for other nutrients such as nitrogen, metal
35
ions, and peroxide have also been performed (Lauderdale et al., 2012). However, such
experiments looking at the effect of enhancement on membrane fouling control were not
found in the literature.
2.7 Research Motivation
Although a number of studies have been conducted to-date to find a sustainable membrane
fouling reduction mechanism, only a few have investigated direct biofiltration as a
pretreatment for membranes. Bench- and pilot-scale studies by Hallé et al. (2009) and Huck
et al. (2011) with Grand River water in Southern Ontario, Canada have demonstrated the
potential of this technique. Their research has opened the doors to further exploration and
optimization of this technique with different source waters that will have different
characteristics and NOM concentrations, and different operating conditions which may pose
new challenges. A previous study by Croft (2012) who compared different water sources of
Southern Ontario with respect to NOM composition, reported similar highly variable SUVA
and TOC in two Ontario rivers (the Grand and Saugeen), but very different biopolymer
concentrations (maximum biopolymer concentration 0.7 mg/L and 0.35 mg/L for Grand and
Saugeen rivers, respectively). Croft (2012) also found high variation in the humic substance
concentration in the Saugeen River. As NOM, especially biopolymers, are important in the
context of low-pressure membrane fouling, follow-up biofiltration pretreatment studies for
ultrafiltration membranes would provide new information and an opportunity to verify
previously reported findings. In addition, more in-depth study of biomass development and
organic removal (using LC-OCD) in parallel biofilters would also provide insight to process
reproducibility, microbial activity, and biofilter performance and dynamics.

36
The Saugeen River water historically has low levels of phosphorus. Recent phosphorus
enhancement studies for biofilters have not examined its effect on different NOM fractions or
how the addition of phosphorus affects the removal of potential membrane foulants. Hence, a
phosphorus enhancement study would have the potential to provide new knowledge
regarding engineered biofiltration and also membrane fouling mitigation mechanisms.
37
Chapter 3
Fouling of Low-Pressure Membranes during Drinking Water
Treatment: Effect of NOM Components and Biofiltration
Pretreatment
This chapter is based on a manuscript of the same title submitted to a scientific journal for
publication on August 2013. Hence, it contains a separate introduction, methods, results and
discussion and conclusions sections. Cited references are in the consolidated list of
references at the end of the thesis.
3.1 Introduction
Fouling is a challenge for membrane-based drinking water treatment processes. Fouling
decreases the effectiveness of the membrane by accumulation of material (foulant) within
membrane pores and on the membrane surface (Crittenden et al., 2005). This reduces the flux
through the membrane and increases the transmembrane pressure (TMP) (AWWA, 2005).
Two general types of fouling based on backwash recoverability are reversible (or
backwashable) fouling and irreversible fouling. Natural organic matter (NOM) plays an
important role in membrane fouling (Hong and Elimelech, 1997) and in particular the
biopolymer fraction of the NOM has been identified as containing the critical NOM
constituents that are responsible for fouling (Peldszus et al., 2011; Filloux et al., 2012).
As fouling results in increased cost for operation and cleaning, as well as a decreased
membrane life, various pretreatment options have been studied and practiced to control or
reduce fouling. Pretreatment can include both chemical and biological processes, through the
addition of coagulants, ozone, adsorbents, or by filtering the water through granular media.
38
The efficiency of these techniques is highly dependent on the feed water quality and the
membrane itself. Of these different pre-treatment methods, biofiltration has emerged as a
“green” technique that minimizes chemical usage and wastes generated during water
treatment (Brown, 2007; Zhang and Huck, 1996).
Direct biofiltration involves either slow or rapid filtration using sand, anthracite,
biologically active carbon or other types of media, without the application of chlorine. The
absence of chlorination allows for growth of biofilm on the filter media (Huck et al., 2011)
which have the potential to remove biodegradable organic matter (BOM) (Urfer et al., 1997).
Temperature, source water quality, media type, surface area for biofilm growth,
backwashing, and empty bed contact time (EBCT) are some important factors which affect
the overall performance of biofilters (Urfer et al., 1997).
Biofiltration has the potential to remove proteins and polysaccharides (biopolymers) and
thus reduce fouling of low pressure polymeric membranes (Hallé et al., 2009). However, the
concentration and composition of organic matter in different types of water are not
necessarily similar (Her et al., 2003) and this difference may have a considerable impact on
fouling behavior (Amy, 2008). Hence, this study evaluated the effectiveness of biofiltration
pretreatment for the reduction of membrane fouling using a pilot system and a different river
water type than has previously been examined.
3.2 Methods
3.2.1 Feed water
The feed water for this study was collected weekly in two 20000 L batches from the Saugeen
River near Walkerton, Ontario, Canada. The river flows northwest to Lake Huron through a
watershed that is mostly agricultural land with some forest cover and smaller urban
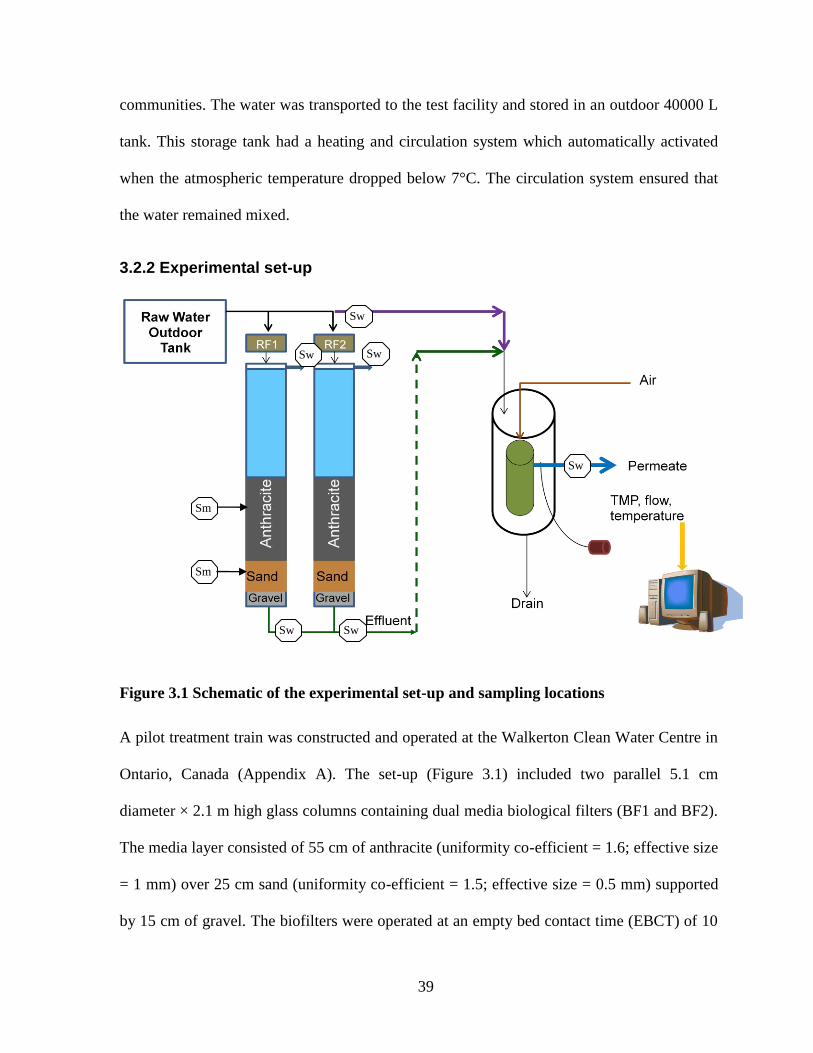
39
communities. The water was transported to the test facility and stored in an outdoor 40000 L
tank. This storage tank had a heating and circulation system which automatically activated
when the atmospheric temperature dropped below 7°C. The circulation system ensured that
the water remained mixed.
3.2.2 Experimental set-up
Figure 3.1 Schematic of the experimental set-up and sampling locations
A pilot treatment train was constructed and operated at the Walkerton Clean Water Centre in
Ontario, Canada (Appendix A). The set-up (Figure 3.1) included two parallel 5.1 cm
diameter × 2.1 m high glass columns containing dual media biological filters (BF1 and BF2).
The media layer consisted of 55 cm of anthracite (uniformity co-efficient = 1.6; effective size
= 1 mm) over 25 cm sand (uniformity co-efficient = 1.5; effective size = 0.5 mm) supported
by 15 cm of gravel. The biofilters were operated at an empty bed contact time (EBCT) of 10
Sw Sw
Sw
Sw Sw
Sw
Sm
Sm

40
min corresponding to a hydraulic loading rate of 5 m/h. They were gravity fed and operated
in down-flow mode. The biofilters were each preceded by a roughing filter (RF1 and RF2) to
minimize the impact of varying turbidity and particle loads on the biofilters. The biofilters
were backwashed once per week using biofilter effluent. The backwash process included air
scour for 1 min followed by 4 min of air-water collapse pulsing. The water flow was then
gradually increased to achieve 25% (1 min) and then 50% (4 min) bed expansion after the air
was shut down.
For the membrane fouling experiments, a bench-scale ZeeWeed®-1 (GE Water and
Process Technologies, Oakville, Ontario, Canada) polyvinylidene fluoride (PVDF) hollow
fiber ultrafiltration membrane was used. The bench-scale membrane module had a nominal
surface area of 0.047 m2, nominal pore size of 0.04 µm, and was operated at constant flow,
outside-in configuration of 57 L/m2h (LMH) flux (temperature corrected to 20°C). The clean
membrane surface was non-ionic and hydrophilic (GE, 2013). The clean membrane surface
was non-ionic and hydrophilic. The membrane module was maintained in a vertical position
in a clear PVC cylindrical tank and was designed to cycle automatically (El-Hadidy et al.,
2013). Each cycle included 30 min of permeation followed by a 20 s backwash with air
sparging. At the end of each cycle the tank was completely drained and then re-filled with
fresh feed water (40 s). Membrane fouling experiments were conducted in batch mode using
both untreated and biofiltered river water. The set-up also included a temperature sensor,
pressure transducer, and flow monitor connected to a data logger (HOBO Energy Logger,
model H22-001, Onset, Cape Cod, Massachusetts, USA) for continuous measurements
during the experiments. To measure fouling for both untreated and biofiltered water using the
same batch of river water, the run length was selected to be 1.5 days or until it reached our

41
target maximum TMP (55.2 kPa or 8psi) of the membrane, whichever was reached first.
Between each experiment the membrane module was chemically cleaned by placing it in 200
mg/L NaOCl for 5 h, followed by 5 g/L citric acid solution soak at room temperature also for
5 h, and rinsed thoroughly with deionised water between steps. The module was also tested
for integrity using a pressure calibrator (Meri-cal DP2001I, Meriam Instruments, Ohio, USA)
so that the pressure drop through the membrane was not more than 0.3 psi per 2 min, and
each experiment was preceded by a clean water permeability test. Fouling rates were
calculated using the transmembrane pressure data from a pressure transducer (model 68075-
02, Cole-Parmer, Montreal, Canada) and corrected for temperature (20°C) (see
supplementary information).
3.2.3 Analyses
Samples were collected from selected points in the treatment train including the roughing
filter inlet (raw), roughing filter outlets (RF1 and RF2 effluent), and biofilter outlets (BF1
and BF2 effluent), and were analyzed for different water quality parameters including
turbidity, pH, temperature, hardness, alkalinity, conductivity, UV254 absorbance, and SUVA
using standard methods. Total and dissolved organic carbon (TOC/ DOC) were measured
using a TOC analyzer (OI-Analytical TOC analyzer, model 1010, College Station, TX,
USA). Liquid chromatography with organic carbon detection (LC-OCD) analysis was
employed to measure the concentrations of the various NOM fractions, especially
biopolymer and humic substances in water (Huber et al., 2011). The DOC measured with the
LC-OCD was usually a little lower (~10%) than that obtained from the dedicated TOC
analyzer instrument.
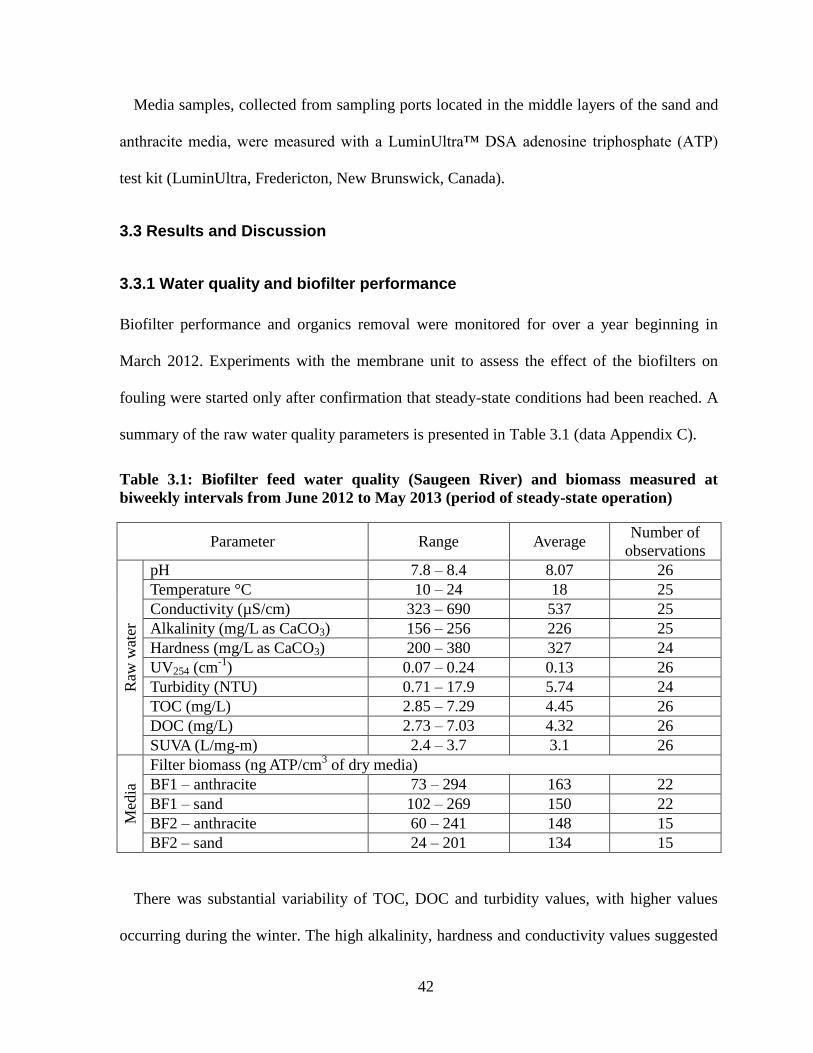
42
Media samples, collected from sampling ports located in the middle layers of the sand and
anthracite media, were measured with a LuminUltra™ DSA adenosine triphosphate (ATP)
test kit (LuminUltra, Fredericton, New Brunswick, Canada).
3.3 Results and Discussion
3.3.1 Water quality and biofilter performance
Biofilter performance and organics removal were monitored for over a year beginning in
March 2012. Experiments with the membrane unit to assess the effect of the biofilters on
fouling were started only after confirmation that steady-state conditions had been reached. A
summary of the raw water quality parameters is presented in Table 3.1 (data Appendix C).
Table 3.1: Biofilter feed water quality (Saugeen River) and biomass measured at
biweekly intervals from June 2012 to May 2013 (period of steady-state operation)
Parameter Range Average Number of
observations
Raw
wat
er
pH 7.8 – 8.4 8.07 26
Temperature °C 10 – 24 18 25
Conductivity (µS/cm) 323 – 690 537 25
Alkalinity (mg/L as CaCO3) 156 – 256 226 25
Hardness (mg/L as CaCO3) 200 – 380 327 24
UV254 (cm-1
) 0.07 – 0.24 0.13 26
Turbidity (NTU) 0.71 – 17.9 5.74 24
TOC (mg/L) 2.85 – 7.29 4.45 26
DOC (mg/L) 2.73 – 7.03 4.32 26
SUVA (L/mg-m) 2.4 – 3.7 3.1 26
Med
ia
Filter biomass (ng ATP/cm3 of dry media)
BF1 – anthracite 73 – 294 163 22
BF1 – sand 102 – 269 150 22
BF2 – anthracite 60 – 241 148 15
BF2 – sand 24 – 201 134 15
There was substantial variability of TOC, DOC and turbidity values, with higher values
occurring during the winter. The high alkalinity, hardness and conductivity values suggested
43
groundwater infiltration into the river. The specific UV absorbance (SUVA) range confirmed
the presence of aquatic humics. Although the river water temperature varied seasonally (0 to
24°C), the pilot feed remained above 10°C due to the feed water collection and storage
process employed at the test facility.
The biomass (total ATP) development in both filters was similar (confirmed by a paired t-
test, α = 0.05). Following 3 months biofilter acclimation the ATP concentrations in the filters
remained steady and did not exhibit any seasonal changes.
3.3.2 Biofilter performance in terms of organic removal
The LC-OCD results confirmed the elevated humic content in the Saugeen River (54 to 89%
of DOC) with biopolymers accounting for only 2 to 11% of the DOC (data Appendix D).
There was no substantial removal of humic substances through the biofilters during the
experimental period indicating biofilm organisms could not break down this class of
compounds. Although biopolymer concentrations in the feed water were low, average
biopolymer removals of 20% and 22% were achieved by BF1 and BF2, respectively (RF
combined), with values that ranged between 10 to 35% throughout the year. Biofiltration
achieved substantial turbidity removal (27 to 88%) and only relatively low removals of TOC
(0 to 12%), DOC (0 to 12%) and SUVA (0 to 17%), while the other chemical properties of
water did not change. Low DOC removal by the biofilters was expected as humic substances,
which account for most of the DOC, were not removed.
The concentration of biopolymers removed by Biofilters 1 and 2 demonstrated a positive
correlation with the concentration of biopolymer present in the feed (Figure 3.2). While it
would have been helpful to have additional data above 0.2 mg/L, this relationship was clearly
valid in the lower concentration range (0.08 – 0.17 mg/L) and the Y-intercepts were less than
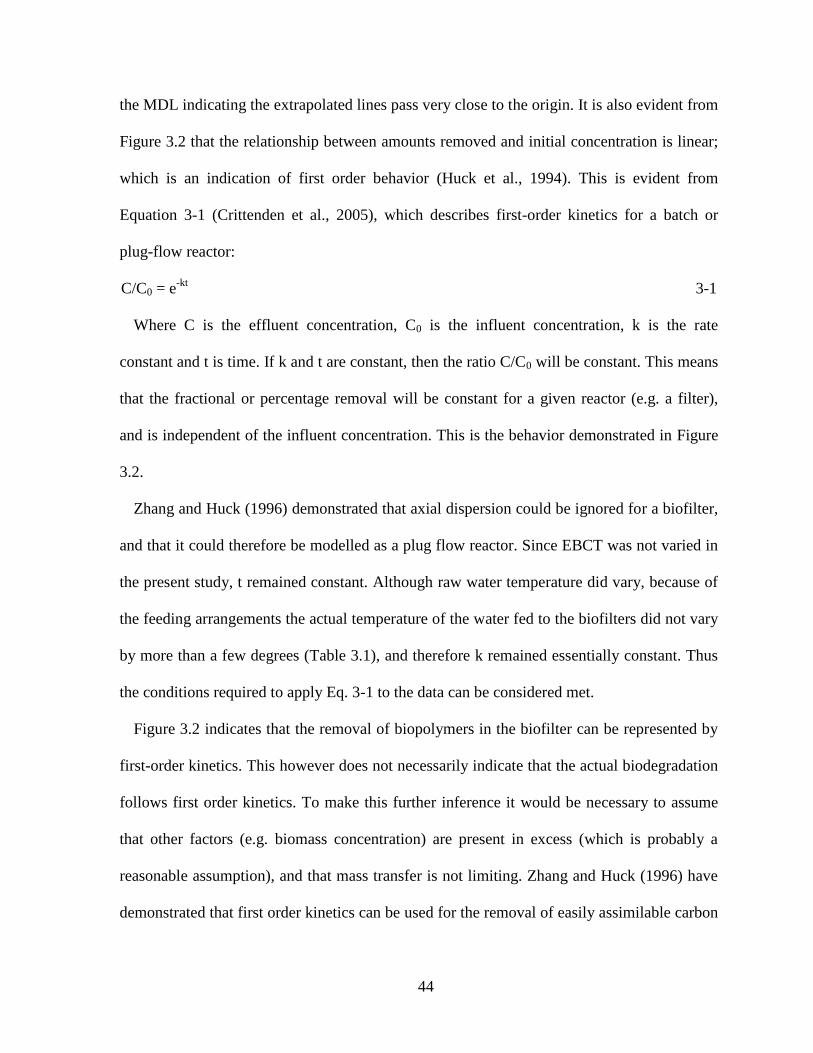
44
the MDL indicating the extrapolated lines pass very close to the origin. It is also evident from
Figure 3.2 that the relationship between amounts removed and initial concentration is linear;
which is an indication of first order behavior (Huck et al., 1994). This is evident from
Equation 3-1 (Crittenden et al., 2005), which describes first-order kinetics for a batch or
plug-flow reactor:
C/C0 = e-kt
3-1
Where C is the effluent concentration, C0 is the influent concentration, k is the rate
constant and t is time. If k and t are constant, then the ratio C/C0 will be constant. This means
that the fractional or percentage removal will be constant for a given reactor (e.g. a filter),
and is independent of the influent concentration. This is the behavior demonstrated in Figure
3.2.
Zhang and Huck (1996) demonstrated that axial dispersion could be ignored for a biofilter,
and that it could therefore be modelled as a plug flow reactor. Since EBCT was not varied in
the present study, t remained constant. Although raw water temperature did vary, because of
the feeding arrangements the actual temperature of the water fed to the biofilters did not vary
by more than a few degrees (Table 3.1), and therefore k remained essentially constant. Thus
the conditions required to apply Eq. 3-1 to the data can be considered met.
Figure 3.2 indicates that the removal of biopolymers in the biofilter can be represented by
first-order kinetics. This however does not necessarily indicate that the actual biodegradation
follows first order kinetics. To make this further inference it would be necessary to assume
that other factors (e.g. biomass concentration) are present in excess (which is probably a
reasonable assumption), and that mass transfer is not limiting. Zhang and Huck (1996) have
demonstrated that first order kinetics can be used for the removal of easily assimilable carbon

45
(AOC) in biofiltration. In their review article, Huck and Sozański (2008) note that several
investigations have shown mass transfer to be not limiting for the removal of easily
biodegradable compounds in drinking water biofilters and biofilms. Whether mass transfer
would also not be limiting for the generally higher molecular weight biopolymers and
whether the actual biodegradation (as opposed to simply the overall removal process) follows
first order kinetics remains to be determined.
Figure 3.2: Correlation between biopolymer removal by Biofilter 1 (n = 19) and
Biofilter 2 (n = 10) and raw water biopolymer concentration (MDL = 0.009 mg/L)
3.3.3 Effect of direct biofiltration in fouling reduction
To determine the effect of direct biofiltration as a pretreatment to reduce membrane fouling,
five sets of comparison experiments were conducted between November, 2012 and April,
y = 0.2821x - 0.0093
R² = 0.6309
y = 0.2702x - 0.0051
R² = 0.5855
0
0.04
0.08
0.12
0.16
0.2
0 0.05 0.1 0.15 0.2 0.25 0.3
Bio
po
lym
er
Re
mo
ved
(m
g/L
)
Biopolymer Concentration in Water (mg/L)
BF1 BF2
46
2013. Each comparison experiment first measured membrane fouling using untreated water,
the membrane was then cleaned and fouling was measured using Biofilter 1 effluent. Each
comparison experiment was done during the same week using the same batch of river water
in order to keep the feed water quality comparable. Afterwards, six individual experiments
were conducted with biofiltered water.
An example of the UF membrane fouling experiments (conducted from February 4 to 8,
2013) is presented in Figure 3.3. During the experimental run with untreated water (Figure
3.3A), the TMP increased above the target maximum of 55.2 kPa (8 psi) at about 10 hours
with a rapid drop in flux from 58 to 38 LMH (normalized to 20°C). With Biofilter 1 effluent
as feed water (Figure 3.3B), the TMP reached only 35.2 kPa (5.2 psi) over the same time and
the flux decreased from 57 to 50 LMH. In this experiment, biofiltration pretreatment resulted
in a 62% reduction in the irreversible fouling rate and a 43% reduction of average (per cycle)
reversible fouling rate (based on TMP). As well the drop in flux due to fouling when using
biofilter effluent was 22% less compared to untreated water.

47
Figure 3.3 Comparison of fouling of a UF membrane measured over 10.5 hours using
A) untreated river water and B) biofilter effluent as the membrane feed. The
experiment was conducted from February 4 – 8, and the average temperature for A was
13.4°C and for B was 16.6°C
0
10
20
30
40
50
60
0
10
20
30
40
50
60
0 2 4 6 8 10 12
Flu
x (L
MH
)
No
rmal
ize
d T
MP
(kP
a)
Time (h)
TMP Flux
0
10
20
30
40
50
60
0
10
20
30
40
50
60
0 2 4 6 8 10 12
Flu
x (L
MH
)
No
rmal
ize
d T
MP
(kP
a)
Time (h)
TMP Flux
(B)
(A)

48
Table 3.2 summarizes NOM (DOC, biopolymers, humics) removal by the biofilters for the
five experiments and the corresponding decrease in hydraulically irreversible fouling
resulting from biofiltration as pretreatment. The DOC concentrations presented here were
obtained from the LC-OCD instrument as a comparison with the biopolymer and humic
fractions measured using the same instrument. Results show that direct biofiltration reduced
the fouling rates substantially and in 4 out of 5 experiments (exception Feb 11 – 14), and a
greater percent biopolymer reduction was found to be related to a greater percent reduction in
both irreversible and average reversible fouling rates. Table 3.2 also indicates that the
concentration of biopolymers was important and not the presence of humic material in terms
of membrane fouling alleviation. It also illustrates the effectiveness of the biofiltration
pretreatment in reducing fouling even at low biopolymer concentrations and relatively low
biopolymer removals (10 to 30%).
Table 3.2: Effect of direct biofiltration pretreatment on membrane fouling rate (flux
was 57 LMH at 20°C)
Experiment
date
(2012-
2013)
Run
length
a
(h)
Biofilter feed (mg/L)
b
Removals by
biofilter (%) Fouling reduction c (%)
DOC BP HS DOC BP HS Irreversible Reversible
Nov 26- 30 26.5 4.69 0.138 3.71 0.5 19 0 52 42
Dec 10-14 21.0 6.24 0.128 4.70 8.0 30 6 68 55
Feb 4-8 10.5 5.44 0.238 4.38 1.0 21 0 62 43
Feb 11- 15 27.0 4.55 0.112 3.63 1.0 16 0 14 8
Apr 1-3 21.0 4.15 0.128 3.31 1.5 10 2 49 36
a length of each membrane experiment (raw/effluent) used for determination of fouling rate,
b as determined by the LC-OCD instrument; BP = biopolymers, HS = Humic substances,
c attributable to the biofilter based on TMP
Figure 3.3 (A and B) confirms the observations from Table 3.2. The irreversible fouling
rate was highly correlated with the biopolymer concentration in the feed, both in the case of

49
untreated and biofiltered water (Figure 3.3A). The correlations presented in the figures seem
to be biased by one high data-point. Although this particular data-point cannot be ignored,
the correlation was recalculated excluding this point and still a considerable correlation (R2
=
0.60) was found with similar slopes for untreated and biofiltered feed. This confirms
observations from previous research on the Grand River water, with biopolymer
concentrations ranging from 0.09 – 0.53 mg/L (Hallé et al., 2009), regarding the important
role of protein-like substances (biopolymer component) in irreversible fouling of low-
pressure membranes (Peldszus et al., 2011). Filloux et al. (2012) found a similar correlation
(R2 = 0.88) between UF membrane fouling resistance and biopolymer concentration (~0.3 –
1.5 mg/L) in wastewater effluent. The results obtained from the experiments with Saugeen
River water (biopolymer concentrations 0.06 – 0.26 mg/L) confirm the importance of the
biopolymer fraction in fouling.
In the case of humic substances, however, it was found that they did not play a similar role
in irreversible fouling (Figure 3.4B), which again confirms the findings of Peldszus et al.
(2011). A similar comparison of fouling rate and turbidity showed that the raw water
turbidity of the water was not related to hydraulically irreversible fouling (results not shown),
as reported by Hallé et al. (2009) and Peldszus et al. (2011).
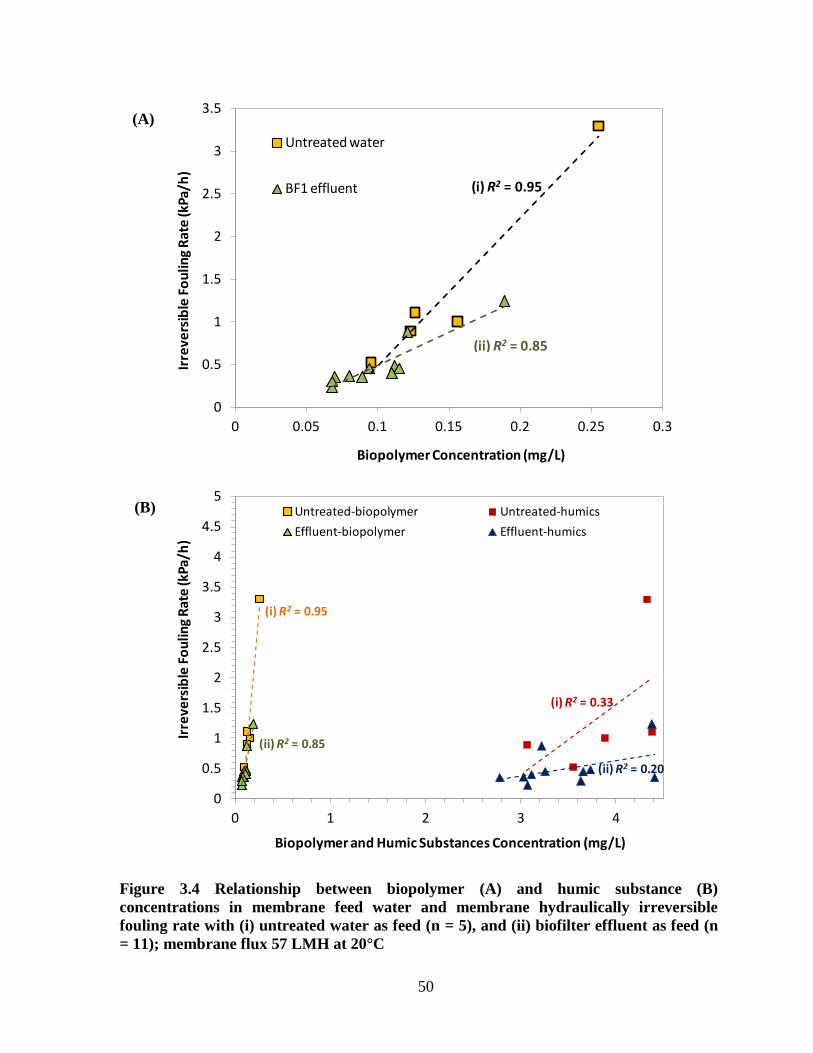
50
Figure 3.4 Relationship between biopolymer (A) and humic substance (B)
concentrations in membrane feed water and membrane hydraulically irreversible
fouling rate with (i) untreated water as feed (n = 5), and (ii) biofilter effluent as feed (n
= 11); membrane flux 57 LMH at 20°C
0
0.5
1
1.5
2
2.5
3
3.5
0 0.05 0.1 0.15 0.2 0.25 0.3
Irre
vers
ible
Fo
ulin
g R
ate
(kPa
/h)
Biopolymer Concentration (mg/L)
Untreated water
BF1 effluent
(ii) R2 = 0.85
(i) R2 = 0.95
0
0.5
1
1.5
2
2.5
3
3.5
4
4.5
5
0 1 2 3 4
Irre
vers
ible
Fo
ulin
g R
ate
(kPa
/h)
Biopolymer and Humic Substances Concentration (mg/L)
Untreated-biopolymer Untreated-humics
Effluent-biopolymer Effluent-humics
(i) R2 = 0.95
(i) R2 = 0.33
(ii) R2 = 0.20
(ii) R2 = 0.85
(A)
(B)

51
Hydraulically reversible fouling was seen to be lower during the initial cycles and
increased to a mostly stable value, indicating a possible change in the fouling layer (Figure
3.5). The average reversible fouling during an experimental run was also found to be related
to biopolymer concentration and not with humic substances (Figure 3.6) or feed water
turbidity. This observation again confirms that of Hallé et al. (2009). Peldszus et al. (2011)
found a weak correlation between reversible fouling and protein content, but suggested that a
combined foulant could result in this fouling effect rather than a single type of foulant.
Figure 3.5 An example of increase in membrane TMP during a 21 h experiment with
untreated water as feed. ΔTMP per cycle is calculated as the difference between TMP at
the start and end (before backwash) of a particular 30 minute cycle (Experiment
conducted on December 10, 2012)
0
2
4
6
8
10
0 5 10 15 20
ΔTM
P p
er c
ycle
(K
Pa)
Cycle

52
Figure 3.6 Relationship between biopolymer and humic substance concentrations in
membrane feed water and membrane average hydraulically reversible fouling rate with
(i) untreated water as feed (n = 5), and (ii) biofilter effluent as feed (n = 11); membrane
flux = 57 LMH at 20°C. Reversible fouling was quantified by taking average of ΔTMP
from all cycles during the length of the experiment.
3.4 Conclusions
The following conclusions can be drawn from this pilot-scale study using Saugeen River
water to evaluate the effect of biofiltration on membrane fouling control:
1. Parallel biofilters performed similarly and achieved on average 21% removal of
biopolymers under steady-state conditions. The concentration of biopolymers removed by the
biofilters was significantly correlated with the biopolymer concentration present in the feed
water.
0
2
4
6
8
10
12
14
16
18
20
0 1 2 3 4
Re
vers
ible
Fo
uli
ng
Rat
e (k
Pa/h
)
Biopolymer and Humic Substances Concentration (mg/L)
Untreated-biopolymer Untreated-humics
Effluent-biopolymer Effluent-humics
(i) R2 = 0.94
(i) R2 = 0.51
(ii) R2 = 0.21
(ii) R2 = 0.84
53
2. Both irreversible and reversible fouling rates of the membranes were related to the
biopolymer concentrations of both untreated and biofiltered water. A similar relationship was
not found for the humic substances concentrations in the studied water.
3. Low concentrations of biopolymers can increase the rate of UF membrane fouling (in
the range of 0.10 to 0.26 mg/L in untreated water).
4. Direct biofiltration resulted in 14 to 68% and 8 to 55% improvement in the
hydraulically irreversible and reversible fouling rates of UF membrane, respectively,
compared to water without pretreatment.

54
3.5 Supplementary Information for Chapter 3
Procedure used to normalize TMP to 20°C (El-Hadidy, 2011)
The transmembrane pressure (TMP) and water temperature during a membrane experiment
were recorded every 10 seconds and the TMP was normalized to 20°C using the following
equation-
TMP corrected at 20°C = TMP * 1.025 ^ (T- 20°C); where T = water temperature in °C
Procedure used to normalize flux for 20°C (AWWA, 2005)
Flux corrected to 20°C, J_20=J ×μ/μ_20
Where, J = flux at ambient temperature
µ = viscosity at ambient temperature
µ20 = viscosity of water at 20°C
Relationship between temperature and influent biopolymer concentration and removal
There was no apparent relationship between temperature and the concentration of
biopolymers in the influent water (Figure S3-1).
As well, the effect of temperature on the biopolymer removal was not significant (Figure
S3-2). It should be noted that the temperature was above 10°C for all experiments (See
Chapter 3 section 3.3.1 for explanation).

55
Figure S3-1: Relationship between biopolymer concentration in raw water (from outdoor
tank) and raw water temperature on different sampling days (n = 23)
Figure S3-2: Relationship between temperature and biopolymer removal by the biofilters (RF
combined); n =18
R² = 2E-08
0
0.05
0.1
0.15
0.2
0.25
0.3
0 5 10 15 20 25
Bio
po
lym
er
con
cen
trat
ion
m
g/L
Temperature °C
R² = 0.0543
R² = 0.031
0
0.02
0.04
0.06
0.08
0.1
0.12
0.14
0 5 10 15 20 25
Bio
po
lym
er
Re
mo
ved
mg/
L
Temperature °C
BF1 BF2
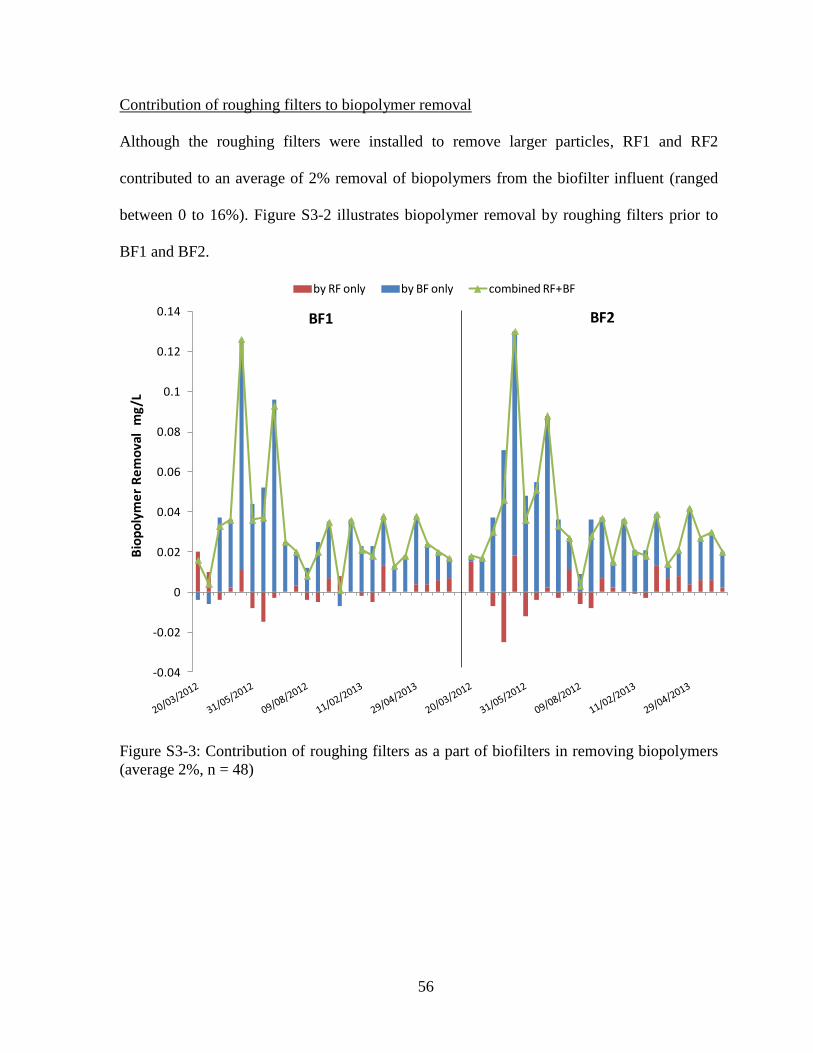
56
Contribution of roughing filters to biopolymer removal
Although the roughing filters were installed to remove larger particles, RF1 and RF2
contributed to an average of 2% removal of biopolymers from the biofilter influent (ranged
between 0 to 16%). Figure S3-2 illustrates biopolymer removal by roughing filters prior to
BF1 and BF2.
Figure S3-3: Contribution of roughing filters as a part of biofilters in removing biopolymers
(average 2%, n = 48)
-0.04
-0.02
0
0.02
0.04
0.06
0.08
0.1
0.12
0.14
Bio
po
lym
er
Re
mo
val
mg
/L
BF1
by RF only by BF only combined RF+BF
BF2

57
Chapter 4
Effect of Phosphorus Addition on Biofilter Performance and
Membrane Fouling
This chapter is intended to be submitted (with further modifications) to scientific journal for
consideration for publication as a paper. Hence, it contains a separate introduction, methods,
results and discussion and conclusions sections. Cited references are in the consolidated list
of references at the end of the thesis.
4.1 Introduction
Biological filtration has long been used in the field of water treatment in the form of slow
sand filtration or river bank filtration, and it is finding newer uses and gaining popularity for
its robustness. Now it is used as rapid filtration in drinking water treatment to reduce
chlorination by-product pre-cursors (Juhna and Melin, 2006), following ozonation to control
bacterial regrowth (Persson et al., 2006), for removing nitrogen compounds (Yu et al., 2007),
trace contaminants, odour causing substances (Huck and Sozański, 2008), and biodegradable
organic matter (Urfer et al., 1997). Biofiltration process can be applied without prior
flocculation or ozonation as “direct biofiltration”. Direct biofiltration, as a pretreatment, also
has the potential to reduce polymeric ultrafiltration membrane fouling by removing the
fractions of natural organic matter (NOM) responsible for increasing membrane fouling
(Hallé et al., 2009). Generally any filter that receives water which does not contain chlorine
will act as a biofilter (Huck et al., 2011). Natural water contains organic and particulate
matter, dissolved oxygen, inorganic nutrients, and also microorganisms (bacteria, protozoa
etc.) which are deposited in and attach to the filter media as water passes through forming a

58
biological film/layer (Hozalski and Bouwer, 2001) and this biofilm grows on the media in the
absence of chlorine (Huck and Sozański, 2008). Limitation of nutrients may also inhibit
biofiltration performance as it relates to removal of biodegradable organic carbon, which is
usually the main treatment objective for employing biofiltration (Sang et al., 2003, Nishijima
et al., 1997).
Drinking water biofiltration for the removal of organic carbon is an aerobic process and
most microorganisms involved are heterotrophic in nature requiring organic carbon for food
(Rittmann and McCarty, 2001). Heterotrophs use organic carbon for energy generation,
which is basically an oxidation - reduction process, and for reproduction (Brown, 2007).
Along with carbon, a microbial cell requires nitrogen, phosphorus, sulfur, iron and other
nutrients to grow. Based on the general biomass formula (C5H7O2P0.1N) it is expected that
bacteria require 2 to 8 g of ammonia or nitrate/100 g of carbon. As N has a (-) III oxidation
state in this formula, bacteria would prefer (but would not be limited to) ammonia over an
oxidized form of nitrogen (nitrite/nitrate) which requires energy to be reduced to a (-) III
state, and the inorganic phosphorous requirement for bacterial growth is about 1/5th that of
nitrogen (Rittmann and McCarty, 2001). However, a very high percentage of total
phosphorus available in water remains in a bound form which has to be broken down by
bacteria to a more biodegradable form (e.g. ortho-phosphate) before it can be utilized
(Wetzel, 1975; Lehtola et al., 2002). For optimal growth of microorganisms, Redfield (1934)
found the ratios of carbon, nitrogen and phosphorus as 100:16:1.8 by weight analyzing
planktons in seawater, and later reported the required ratio of to be 106:16:1 analyzing
plankton from different sources, and 105:15:1 for seawater (Redfield, 1958). Metcalf and
Eddy (1991) stated this ratio to be 100:20:1 (wastewater) and Sathasivan et al. (1999)

59
suggested a C:P ratio of 100:1.7 – 2.0 for (oligotrophic) drinking water environments. A
more commonly used adaptation of this C:N:P ratio for drinking water is 100:10:1 according
to LeChevallier et al. (1991). However, the approximation of 100:10:1 was not based on the
experimental results reported in the said literature. Many researchers have investigated the
effects of nutrients on biofilm development and biofilter performance, due to the important
role of nutrients in microbial growth and structure (Keinanen et al., 2002) and also in
regulating the excretion of extracellular polymeric substances. LeChevallier et al. (1991) and
Van der Kooij (1982) first demonstrated the importance of assimilable organic carbon (AOC)
in the growth of heterotrophic bacteria. However, recent studies have shown that, for some
water types, phosphorus may be the limiting nutrient. Yu et al. (2003) measured a 54%
increase in bacterial regrowth potential with the addition of 0.05 mg/L KH2PO4 in Huai River
basin water in China, and suggested the effect of phosphorous limitation was greater than
that of other nutrients, including carbon. Miettinen et al. (1997), while studying microbial
regrowth in a drinking water distribution network, found that microbial growth could be
accelerated by adding as little as 0.01 mg/L of PO4-P. Pokanska et al. (2005) associated
microbially available phosphorus limitation with a lower biofilm formation rate for Belgian
water. Lehtola et al. (2002) found a good correlation between microbial growth potential and
microbially available phosphorus for Flemish drinking waters, and that a variety of treatment
processes (e.g. GAC, chemical coagulation, and soil infiltration) can remove phosphorus
from water. Thus, upstream processes could cause further phosphorus limitations for a
biofilter.
Some studies on the effect of phosphorus enhancement with respect to biofilter
performance are presented in Table 4.1. These studies have used a variety of different water

60
sources (river, lake, and subterranean) in lab, pilot, and full -scale biofilters. Five of the seven
studies presented (Lauderdale et al., 2012; Li et al., 2010; Sang et al., 2003; Yu et al., 2003;
Nishijima et al., 1997) found positive changes in biofilter performance (increased organics
and nutrient removal, and higher biomass quantity and activity) with phosphorus addition,
while the remaining two (Melin et al., 2002; Vahala et al., 1998) found no enhancement of
growth even though the raw water for all of these studies appeased to be phosphorus-limited
according to their C:N:P ratios. However, the effect of phosphorus-enhancement on potential
membrane foulant removal has not been reported to-date. As phosphorus-enhancement has
been shown to increase the removal of organics, the removal of potential membrane foulants
may increase as well, which will result in better performance of biofiltration as membrane
pretreatment.
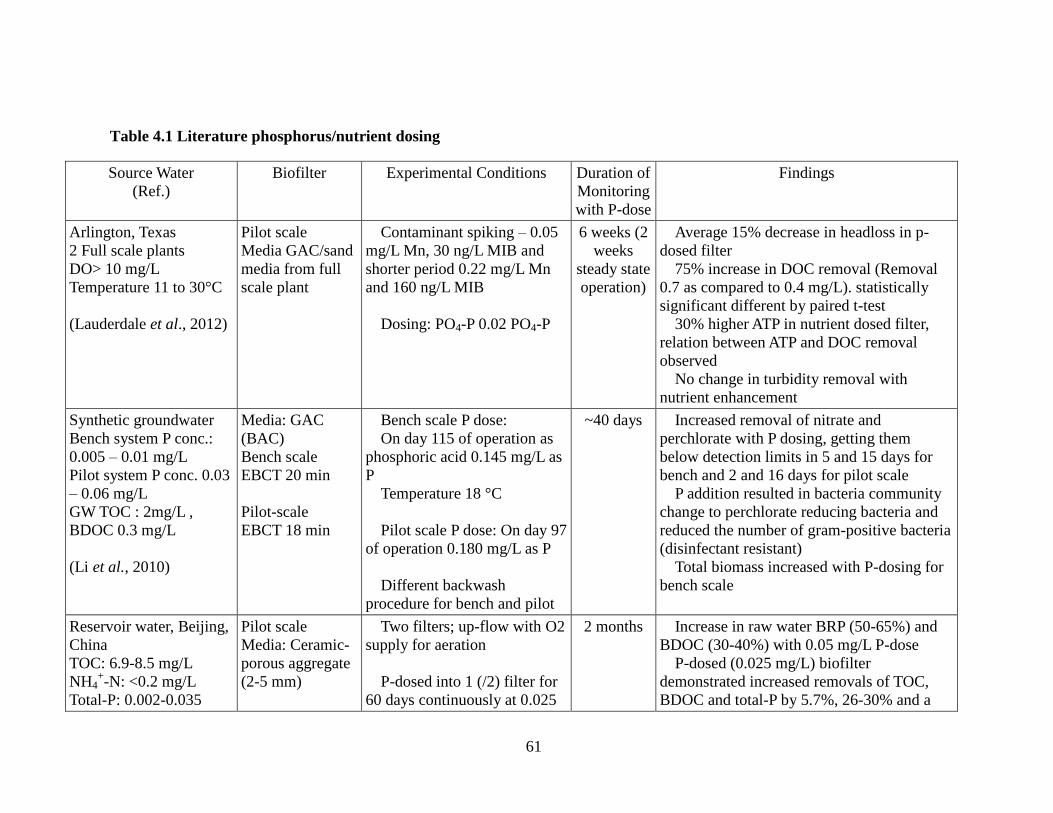
61
Table 4.1 Literature phosphorus/nutrient dosing
Source Water
(Ref.)
Biofilter Experimental Conditions Duration of
Monitoring
with P-dose
Findings
Arlington, Texas
2 Full scale plants
DO> 10 mg/L
Temperature 11 to 30°C
(Lauderdale et al., 2012)
Pilot scale
Media GAC/sand
media from full
scale plant
Contaminant spiking – 0.05
mg/L Mn, 30 ng/L MIB and
shorter period 0.22 mg/L Mn
and 160 ng/L MIB
Dosing: PO4-P 0.02 PO4-P
6 weeks (2
weeks
steady state
operation)
Average 15% decrease in headloss in p-
dosed filter
75% increase in DOC removal (Removal
0.7 as compared to 0.4 mg/L). statistically
significant different by paired t-test
30% higher ATP in nutrient dosed filter,
relation between ATP and DOC removal
observed
No change in turbidity removal with
nutrient enhancement
Synthetic groundwater
Bench system P conc.:
0.005 – 0.01 mg/L
Pilot system P conc. 0.03
– 0.06 mg/L
GW TOC : 2mg/L ,
BDOC 0.3 mg/L
(Li et al., 2010)
Media: GAC
(BAC)
Bench scale
EBCT 20 min
Pilot-scale
EBCT 18 min
Bench scale P dose:
On day 115 of operation as
phosphoric acid 0.145 mg/L as
P
Temperature 18 °C
Pilot scale P dose: On day 97
of operation 0.180 mg/L as P
Different backwash
procedure for bench and pilot
~40 days Increased removal of nitrate and
perchlorate with P dosing, getting them
below detection limits in 5 and 15 days for
bench and 2 and 16 days for pilot scale
P addition resulted in bacteria community
change to perchlorate reducing bacteria and
reduced the number of gram-positive bacteria
(disinfectant resistant)
Total biomass increased with P-dosing for
bench scale
Reservoir water, Beijing,
China
TOC: 6.9-8.5 mg/L
NH4+-N: <0.2 mg/L
Total-P: 0.002-0.035
Pilot scale
Media: Ceramic-
porous aggregate
(2-5 mm)
Two filters; up-flow with O2
supply for aeration
P-dosed into 1 (/2) filter for
60 days continuously at 0.025
2 months Increase in raw water BRP (50-65%) and
BDOC (30-40%) with 0.05 mg/L P-dose
P-dosed (0.025 mg/L) biofilter
demonstrated increased removals of TOC,
BDOC and total-P by 5.7%, 26-30% and a

62
Source Water
(Ref.)
Biofilter Experimental Conditions Duration of
Monitoring
with P-dose
Findings
mg/L
Turbidity: 3-10 NTU
(Sang et al., 2003)
mg PO4-P/L rate (as H3PO4)
Temperature: 10-23 °C
remarkable 109-143% respectively
Biomass quantity (phospholipid) and
microbial activity (OUR) also increased by
13-22% and 35-45% respectively (higher
close to the raw water inlet)
More bacteria was found in the effluent of
the dosed filter, compared to the control filter
Surface water plant
coag/sedimentation
effluent, Huai River
Basin, China
Turbidity: 1.73- 5.94
NTU
PO4-P: 0.00883 – 0.032
mg/L
NO3-N: 0.11- 0.36 mg/L
Ammonia-N: 0.07 – 0.30
mg/L
(Yu et al., 2003)
Pilot scale
Media: GAC
(0.55 cm)/Sand
(0.35 cm)
Two biofilters
EBCT: 6.4 – 7.2
min
P dose: 0.014 mg/L as
K2HPO4-P
Temperature: 19.7 – 31.5 °C
1 month 6% increase in COD removal by P-dosed
filter compared to control filter, while both
filters performed similarly at natural
condition (before P-dosing)
Small Full scale (1.5
years) ozonation-
biofiltration plant, Mid-
Norway
Total P: 0.0011 – 0.002
mg/L
(Melin et al., 2002)
Full scale
Media: GAC-
phonolith-CaCO3
EBCT: 26-30 min
Bench test for P (0.1 mg/L)
+ N (1 mg/L) dosing
Ozonated water in 1 L bottle
with bacteria inoculums
Temperature: 2 – 14 °C
1 month TOC removal and total p did not have good
correlation
HPC bacteria ten times higher in P-dosed
water bottle test
Efficient biofilter performance possible
even at P-limiting condition
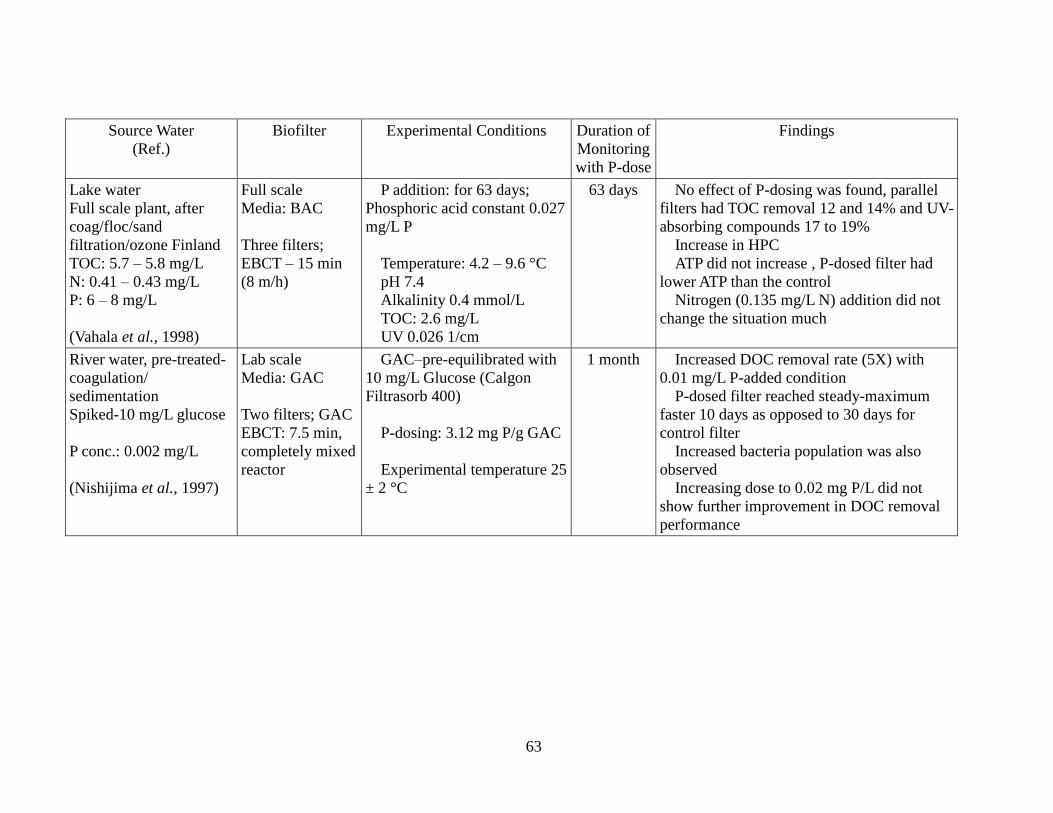
63
Source Water
(Ref.)
Biofilter Experimental Conditions Duration of
Monitoring
with P-dose
Findings
Lake water
Full scale plant, after
coag/floc/sand
filtration/ozone Finland
TOC: 5.7 – 5.8 mg/L
N: 0.41 – 0.43 mg/L
P: 6 – 8 mg/L
(Vahala et al., 1998)
Full scale
Media: BAC
Three filters;
EBCT – 15 min
(8 m/h)
P addition: for 63 days;
Phosphoric acid constant 0.027
mg/L P
Temperature: 4.2 – 9.6 °C
pH 7.4
Alkalinity 0.4 mmol/L
TOC: 2.6 mg/L
UV 0.026 1/cm
63 days No effect of P-dosing was found, parallel
filters had TOC removal 12 and 14% and UV-
absorbing compounds 17 to 19%
Increase in HPC
ATP did not increase , P-dosed filter had
lower ATP than the control
Nitrogen (0.135 mg/L N) addition did not
change the situation much
River water, pre-treated-
coagulation/
sedimentation
Spiked-10 mg/L glucose
P conc.: 0.002 mg/L
(Nishijima et al., 1997)
Lab scale
Media: GAC
Two filters; GAC
EBCT: 7.5 min,
completely mixed
reactor
GAC–pre-equilibrated with
10 mg/L Glucose (Calgon
Filtrasorb 400)
P-dosing: 3.12 mg P/g GAC
Experimental temperature 25
± 2 °C
1 month Increased DOC removal rate (5X) with
0.01 mg/L P-added condition
P-dosed filter reached steady-maximum
faster 10 days as opposed to 30 days for
control filter
Increased bacteria population was also
observed
Increasing dose to 0.02 mg P/L did not
show further improvement in DOC removal
performance

64
This study investigated how phosphorous enhancement would affect a biological filter
operating with high organic content feed water from a southern Ontario river that was
phosphorus-limited (according to its calculated C:N:P ratio) with a special focus on
ultrafiltration (UF) membrane fouling reduction. The objectives of this work were to examine
the effect of phosphorus addition with respect to biofilter effluent water quality, biofilter
biomass quantity and activity, and to determine if phosphorus-enhanced biofiltration was
more effective in controlling ultrafiltration membrane fouling than non-enhanced
biofiltration.
4.2 Material and Methods
4.2.1 Feed water
The feed water for this study was collected weekly in two 20,000 L batches from the
Saugeen River near Walkerton, Ontario, Canada and stored in an outdoor 40,000 L tank. This
storage tank had a heating and circulation system which automatically activated when the
atmospheric temperature dropped below 7°C. The circulation system ensured that the water
remained mixed. The raw water went directly to the biofilters without any pretreatment steps
(and no coagulation) in between.
4.2.2 Experimental set-up
A pilot treatment train was constructed and operated at the technology demonstration facility
at the Walkerton Clean Water Centre in Ontario, Canada (Figure 4.1). The set-up included
two parallel 5.1 cm diameter × 2.1 m high glass columns containing dual media biological
filters (BF1 and BF2). The media layer consisted of 55 cm of anthracite (uniformity co-
efficient = 1.6; effective size = 1 mm) over 25 cm sand (uniformity co-efficient = 1.5;
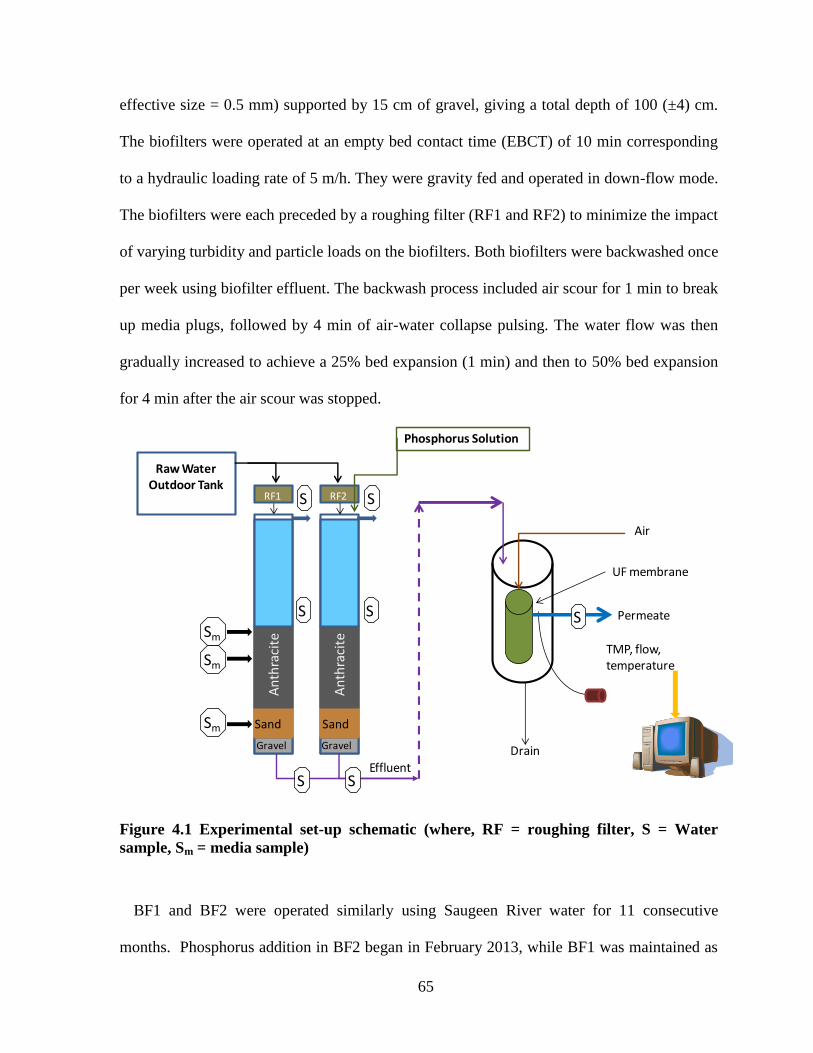
65
effective size = 0.5 mm) supported by 15 cm of gravel, giving a total depth of 100 (±4) cm.
The biofilters were operated at an empty bed contact time (EBCT) of 10 min corresponding
to a hydraulic loading rate of 5 m/h. They were gravity fed and operated in down-flow mode.
The biofilters were each preceded by a roughing filter (RF1 and RF2) to minimize the impact
of varying turbidity and particle loads on the biofilters. Both biofilters were backwashed once
per week using biofilter effluent. The backwash process included air scour for 1 min to break
up media plugs, followed by 4 min of air-water collapse pulsing. The water flow was then
gradually increased to achieve a 25% bed expansion (1 min) and then to 50% bed expansion
for 4 min after the air scour was stopped.
Figure 4.1 Experimental set-up schematic (where, RF = roughing filter, S = Water
sample, Sm = media sample)
BF1 and BF2 were operated similarly using Saugeen River water for 11 consecutive
months. Phosphorus addition in BF2 began in February 2013, while BF1 was maintained as
An
thra
cite
Sand
Gravel
An
thra
cite
Sand
Gravel
Raw Water Outdoor Tank
RF1 RF2
Effluent
Air
Permeate
TMP, flow, temperature
Drain
S S
SS
SS S
Phosphorus Solution
Sm
Sm
Sm
UF membrane
66
a control. Initially a K2HPO4 solution was added continuously to the biofilter column inflow
for 2 months at a 6.5 mL/min flow rate using a dosing pump (LMI Milton Roy pump, model
P021-35251, Acton, MA, USA) to add 0.01 mg/L of phosphorus to the biofilter influent
(Appendix G). The dose was then increased to 0.05 mg P/L and continued for an additional
40 days (until the end of May, 2013). The K2HPO4 stock solutions were prepared in 1 L
ultrapure water, mixed well, and autoclaved for 30 minutes.
For the membrane fouling experiments, a bench-scale ZeeWeed®-1 (GE Water and
Process Technologies, Oakville, Ontario, Canada) polymeric (PVDF) ultrafiltration hollow
fiber membrane was used. The membrane had an outside-in configuration with a nominal
surface area of 0.047 m2, nominal pore size of 0.04 µm, and was operated at a constant flux
of 57 L/m2h (LMH) (temperature corrected 20°C). The clean membrane surface was non-
ionic and hydrophilic. The membrane module was maintained in a vertical position in a clear
PVC cylindrical tank and was designed to cycle automatically using a programmable logic
controller (Allen-Bradley 1760-L18AWA-EX Pico Controller w/RTC, 18 I/O Expandable,
AC, Ser A, Rockwell Automation, 1 Allen Bradley Dr, Cleveland, OH, USA) (El-Hadidy et
al., 2013). Each cycle included 30 min of permeation (Masterflex L/S Easy-Load II pump
head, model 77202-50, Cole-Parmer, Montreal, Canada) followed by a 20 s backwash with
air sparging. At the end of each cycle the tank was completely drained and then re-filled with
fresh feed water (40 sec). The set-up also included a temperature sensor (HOBO 12-Bit
Temperature Smart Sensor, Onset, Cape Cod, MA, USA), pressure transducer (model 68075-
02, Cole-Parmer, Montreal, Canada), and flow monitor connected to a data logger (HOBO
Energy Logger, model H22-001, Onset, Cape Cod, MA, USA) for continuous measurements
during the fouling experiments. The membrane was chemically cleaned between each fouling

67
experiment by placing it in 200 mg/L NaOCl for 5 h, followed by a 5 g/L citric acid solution
at room temperature for 5 h, and rinsed thoroughly with deionized water between steps.
Before each experiment, the module was tested for integrity using a pressure calibrator
(Meri-cal DP2001I, Meriam instrument, OH, USA) so that the pressure drop through the
membrane was not more than 2 kPa (0.3 psi) over 2 min, which is recommended by the
manufacturer. Each experiment was also preceded by a clean water permeability test with
deionized water to test for cleaning efficiency at four different fluxes (32, 45, 57, 70 LMH).
A detailed description of the methods can be found in El-Hadidy (2011).
4.2.3 Sampling procedure
Water samples were collected from selected points in the treatment train including the
roughing filter inlet (raw), biofilter influent approximately 15 cm above the media surface
(BF1 and BF2 Influent), and biofilter outlets (BF1 and BF2 effluent). While raw water and
biofilter effluent samples could be collected from the lines directly, for the biofilter influent
samples, flexible tubing (from the open top of the biofilter column) was lowered into the
column to approximately 10 cm above the surface of the media. The influent water sample
was pumped out through the tube at a slow rate without disturbing the system. To ensure the
collection of representative samples, water was allowed to flow out of the lines before
samples were collected. The sampling bottles were rinsed with the samples three times before
collecting the water, and were filled to the top without headspace. Samples requiring filtering
were filtered with 0.45 µm disk filters (Supor® Membrane Disc Filters, Pall® Life Sciences,
Pall Corporation, Port Washington, NY, USA) immediately after arriving at the laboratory
and both filtered and unfiltered samples were stored at 4°C until analysis.

68
Media sampling was conducted after collecting water samples, so that the water samples
were not affected by the media disturbance. For media sample collection, the biofilters were
first fully drained. Media samples were collected from three sampling ports: i) top-most
anthracite port (4 – 12 cm), ii) mid-anthracite layer (24 – 32 cm) and iii) mid sand layer (63 –
71 cm) from the media surface, respectively (Figure 4.1) using sterile glass pipette tips. The
samples were transferred into sterile tubes and stored at 4°C until analysis. The biofilters
were replenished with sufficient sand and anthracite to replace what was removed, and the
columns were backwashed before restarting the inflow.
4.2.4 Water quality analysis
Phosphorus and nitrogen in raw and biofiltered water were analyzed by an Ontario Ministry
of Environment accredited laboratory (ALS Global Environmental Laboratory, Waterloo).
These samples were collected in containers provided by the laboratory. Total phosphorus and
ortho-phosphorus were measured based on American Public Health Association (APHA)
method 4500-P B E and both had a detection limit (DL) of 0.003 mg/L. Total nitrogen
concentration was calculated by adding the concentrations of nitrate, nitrite (US
Environmental Protection Agency (EPA) method 300.0 IC) and total Kjeldahl nitrogen
(APHA method 4500-N). Ammonia-N was analyzed colorimetrically both at the commercial
laboratory (EPA 350.1; DL = 0.05 mg/L) and with a HACH kit (Method 10023; DL = 0.02
mg/L; Amver™ Low Range Ammonia Reagent Set 26045-45, Hach Company, Loveland,
CO, USA) and spectrophotometrically (Odyssey DR/2500 Spectrophotometer, Hach
Company, Loveland, CO, USA).
TOC and DOC were measured using OI-Analytical TOC analyzer (model 1010, College
Station, TX, USA) by wet-oxidation. LC-OCD (DOC-Labor Dr. Stefan Huber, Karlsruhe,

69
Germany) analysis was employed to measure the concentrations of the various NOM
fractions in water (Huber et al., 2011). TOC, DOC and LC-OCD analyses were all conducted
at the University of Waterloo laboratory.
Turbidity (2100P Portable Turbidimeter, Hach Company, Loveland, CO, USA), pH (Orion
bench top pH meter, model 420A, Cole-Parmer, Montreal, Canada), and conductivity
(Conductivity Portable Meter, Mandel Scientific Company Inc., Guelph, ON, Canada) were
analyzed for all water samples. UV254 absorbance was measured with a UV-VIS
Spectrophotometer (8453, Hewlett-Packard, CA, USA). SUVA was calculated using UV254
and DOC measured by TOC analyzer (Potter and Wimsatt, 2005; EPA method 415.3).
Hardness (method 2340 C) and alkalinity (method 2320 B) in raw water samples were
measured according to APHA (2012).
4.2.5 Biomass quantity and activity measurement
Biomass quantity in the media samples was measured using a LuminUltra™ DSA adenosine
triphosphate (ATP) test kit (LuminUltra, Fredericton, New Brunswick, Canada). Total ATP
was calculated by measuring the extracted media (RLU) with a luminometer (Modulus
Luminometer, model 9200-102, Turner BioSystems, Sunnyvale, CA, USA). To assess
overall biological activity in the media, a fluorescein diacetate (FDA) hydrolysis assay was
used (Green et al., 2006). Briefly, the process involved a 3 h incubation of media samples in
a sodium phosphate buffer at 37°C, while the enzymes (proteases, lipases and esterase) that
can hydrolyse the FDA cause a release of visible fluorescein. The fluorescein was then
measured using a spectrophotometer and compared with a fluorescein standard curve.

70
4.2.6 Membrane fouling experiments
Membrane fouling experiments were conducted in batch mode using biofiltered Saugeen
River water. To assess fouling for biofiltered water from each biofilter column separately,
but using the same batch of river water, the run length was selected to be 1.5 days or until our
target maximum TMP reached 55.2 kPa (8 psi), whichever was reached first. Fouling rates
were calculated using the transmembrane pressure data (corrected to 20°C).
4.3 Results and Discussion
4.3.1 Saugeen River water quality
Carbon, nitrogen and phosphorus monitoring data
The Saugeen River is located in southern Ontario, Canada, and is a part of the lower Saugeen
watershed (908 km2) which is mostly agricultural land (76%), with 19% forest cover, and
only 1.2% urban area (Saugeen Valley Conservation Authority, 2008). Natural and human
activities in the watershed (such as decay of vegetation and animal waste, fertilizers,
detergents, treatment plant effluent, landfill leachate, etc.) are responsible for the presence
and circulation of nutrients in water (USEPA, 1992). If the nutrients, especially phosphorus
and nitrogen, are available in excess they can cause detrimental effects such as
eutrophication. However, these two nutrients, along with carbon, are the most important
nutrients for the growth and survival of bacteria. If one of the nutrients is limited the biofilm
growth and thus the performance of biofilters can be negatively impacted. For this reason,
this study first assessed the nutrient levels in the Saugeen River. Biofilter feed water was
analyzed for various forms of nitrogen species (total nitrogen, nitrate, nitrite and ammonia),

71
phosphorus (total and ortho phosphorus), along with carbon (TOC, DOC and molecular
weight fractions) measurements.
Historical data (Saugeen Valley Conservation Authority, 2010) indicated that the 4-year
average total phosphorus in the lower Saugeen River (Walkerton) has been well below 0.06
mg/L since 1965, and has been gradually decreasing since 1981. The concentration of total
phosphorus was reported as 0.04 mg/L (data from 2002 – 06) in the lower main Saugeen
River (Saugeen Valley Conservation Authority, 2008) and 0.015 mg/L (median value of data
from 2007 – 11) in a report by the Ontario Ministry of the Environment (2012). Overall, the
total phosphorus concentrations in the Saugeen River have been reported as below or very
close to the Ontario Provincial Water Quality Objective (PWQO) of 0.03 mg/L. However,
the historical nitrate concentration has gradually been increasing over the years (Saugeen
Valley Conservation Authority, 2011a, b), even though nitrate has been lower than the
maximum threshold value (3 mg/L) suggested by the Canadian Water Quality Guidelines
(Canadian Council of the Ministers of the Environment, 2012). The Ontario Ministry of the
Environment (2012)found, for the rivers in Ontario, also show that there was an increase in
nitrogen and phosphorus concentrations during colder periods of the year (December to
February) in the general for the rivers in Ontario. A 2003 study on Saugeen River in
particular show similar increase in total-P with slight increase in nitrate + nitrite
concentration during late Fall (Mohamed, 2009)..
The raw water nutrient data collected from November 2012 to May 2013 are presented in
Figure 4.2 (data Appendix E). Figure 4.2 A shows that nitrate in the river water was higher
than the other forms of nitrogen (1.35 to 2.94 mg/L) and made up 70 to 90% (average 82%)
of the total nitrogen. The nitrate-N concentration was higher during the colder period, which

72
is in agreement with the Ontario Ministry of the Environment (2012) report. Nitrite-N
remained under detection limit (0.10 mg/L) throughout the test period, and ammonia-N (DL
0.05 mg/L) was only detected once (May 23). TKN was fairly consistent and ranged between
0.3 – 0.6 mg/L. Figure 4.2B shows that ortho-phosphorus was low and typically close to the
detection limit (0.003 mg/L), and reached a maximum of 0.01 mg/L on March 18. Total
phosphorus measurements were initiated on April 3, 2013, and results show that ortho-P
ranged from 25 –70% of the total-P (average 38%; std. dev. 17%). Overall data show that
there was high total nitrogen (> 1.5 mg/L), and low total phosphorus (< 0.025 mg/L) in the
raw water suggested by Dodds et al. (1998).
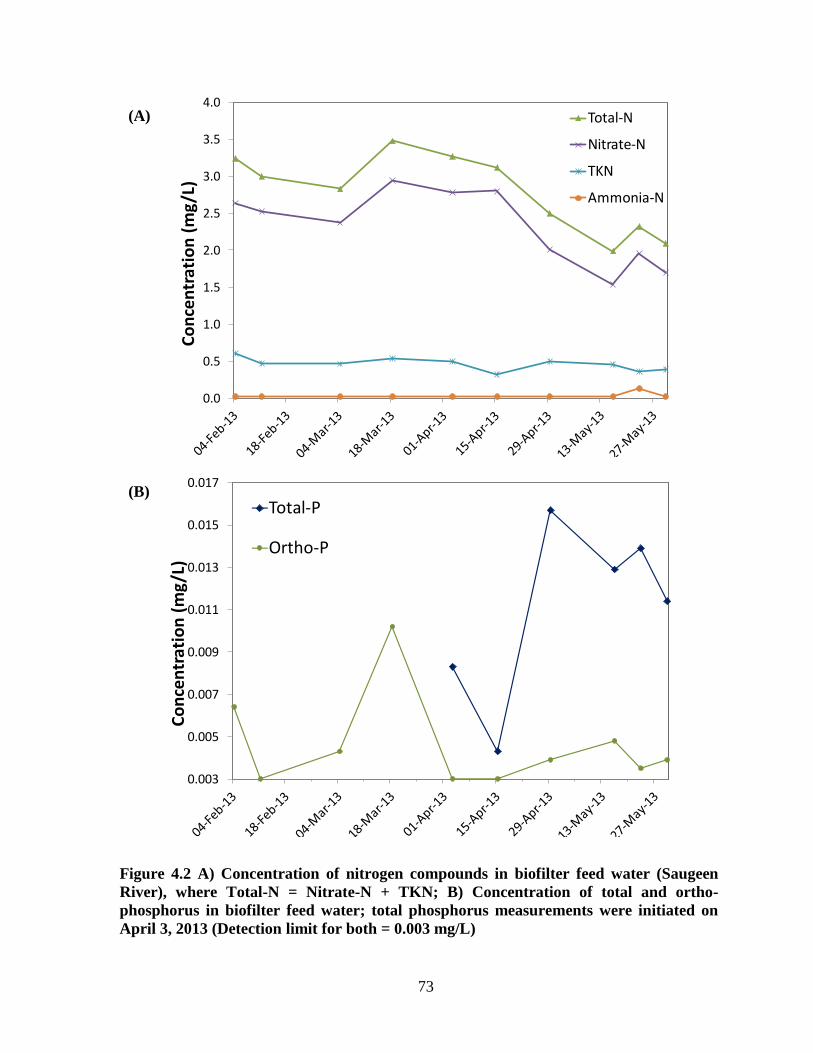
73
Figure 4.2 A) Concentration of nitrogen compounds in biofilter feed water (Saugeen
River), where Total-N = Nitrate-N + TKN; B) Concentration of total and ortho-
phosphorus in biofilter feed water; total phosphorus measurements were initiated on
April 3, 2013 (Detection limit for both = 0.003 mg/L)
0.0
0.5
1.0
1.5
2.0
2.5
3.0
3.5
4.0
Co
nce
ntr
ati
on
(m
g/L
)
Total-N
Nitrate-N
TKN
Ammonia-N
0.003
0.005
0.007
0.009
0.011
0.013
0.015
0.017
Co
nce
ntr
ati
on
(m
g/L
)
Total-P
Ortho-P
(A)
(B)

74
Humic material made up the largest component of the NOM in the raw river water, while
the other components, including biopolymers were present in low in concentrations (Table
4.2). DOC during this 7 month period ranged between 4.15 to 6.32 mg/L, which is not
unusual for river water. However, during the full 14 months of biofilter operation, lower
DOC values (as low as 2.66 mg/L) were also observed, and humic substances made up 54 to
89% of the total DOC, while biopolymers were 2 to 11% (Chapter 3). In a separate study,
Croft (2012) collected 5 samples directly from Saugeen River between 2011 and 2012, in
which the DOC ranged from 2.7 to 6.8 mg/L. This range is similar to those measured in this
study. Croft (2012) also found biopolymers to be 3 to 11% of the total DOC, and large
variations in humic concentrations were observed which is consistent with measurements
made in the current study.
Table 4.2 Concentration of total and dissolved organic carbon and DOC fractions in
raw Saugeen River water between November, 2012 and May, 2013
Conc.
(mg/L) TOC DOC BP HS BB LMWA LMWN TN TP
Max 6.41 6.32 0.26 4.38 0.55 0.06 0.43 3.48 0.016
Min 4.23 4.15 0.07 2.81 0.33 0.00 0.22 1.92 0.004
Avg 5.00 4.88 0.12 3.54 0.45 0.01 0.29 2.71 0.011
SD 57% 57% 5% 51% 6% 2% 6% 0.4% 56%
(n =13 for C; n = 11 for N; n = 6 for P)
BP = biopolymers, HS = humic substances, BB = building blocks, LMNW = low molecular
weight neutrals, LMWA = low molecular weight acids, TN = total nitrogen, TP = total
phosphorus
C:N:P ratio
The C:N:P ratio can be calculated in different ways. A common method is to use ammonia-N
and ortho-P as key nitrogen and phosphorus sources as these are considered to be
biologically available (USEPA, 1992; Lauderdale et al., 2012). However, various forms of
these nutrients can also be utilized by bacteria. Phosphorus in water can be present in organic

75
or inorganic form, as particulate or dissolved phosphorus (ortho-P), or as polyphosphate
(largely from detergent), or bound with organic colloids (Wetzel, 1975). The concentration of
available inorganic soluble phosphorus (ortho-P) is usually a very low percentage (<5%) of
the total phosphorus (Wetzel, 1975). However, bacteria can degrade dissolved organic
phosphorus to ortho-P for their requirements (Wetzel, 1975). The data presented in Figure
4.2 (B) indicate the water does not contain much ortho-P; hence, it is postulated that the
bacteria could be meeting their phosphorus needs by degrading other forms of available
phosphorus (or potentially recycling P in the biofilm), and therefore total-P was used in
C:N:P calculations. As well, Figure 4.2 (A) shows the available forms of nitrogen in the raw
water and for almost all sampling days there was no detectable ammonia-nitrogen in the
water. This is not uncommon in oligotrophic environments or oxygenated water such as sea
water or drinking water (Wetzel, 1975). Kirchman and Wheeler (1998) and Allen et al.
(2002) both found much higher nitrate uptake than ammonia by heterotrophic bacteria in
seawater, and Simon et al. (2013), following addition of NH4Cl in nitrogen limited
conditions during sea water biofiltration, did not see an improvement in NOM removal
capacity. Considering the findings from the above literature and experimental data from this
study, nitrate/total-N may have to be considered as N sources, which has precedence in
previous literature by Miettinen et al. (1997).
Simon et al. (2013) also found that biofilter activity related more to biodegradable DOC
than to available ammonia. Biodegradable portions of DOC, or biodegradable organic matter
(BOM), can be measured using various culture-based techniques including assimilable
organic carbon (AOC) which measures an increase in growth of P17 and NOX bacteria
strains (van der Kooij, 1992), and biodegradable dissolved organic carbon (BDOC) methods

76
which measure the removal of DOC in the test water over time (Servais et al., 1989).
However, due to the complexity of these methods, for this study only total DOC
measurements were performed. Using total DOC for the C:N:P ratio would be an
overestimation of the available carbon, as according to the literature biodegradable carbon is
a small portion of the total DOC. For instance, AOC can be 0.03 to 27% of the total DOC
depending on the nature of water, and was found to be less than 9% for surface waters in a
study by van der Kooij, (1982). BDOC was found to be between 27 to 54% of the total DOC
for polluted waters, and 28.5% for a less polluted water (Servais et al. 1989). Bradford et al.
(1994) found AOC to be between 0.5 to 31% of the total DOC, but could not find a good
correlation between these two forms of organic carbon. Hence, it is hard to predict the
biodegradable portion of DOC without direct measurements. However, both of these
techniques have their limitations and Huck (1990) in a review article regarding various BOM
measurement methods suggested further studies to better understand the application and
correlation between these techniques.
As such, C:N:P ratios were computed using total DOC, total nitrogen, and total phosphorus
concentrations for April and May, 2013, a period in which data for all variable was available
(Table 4.3). Although using DOC as available carbon was an overestimation as total DOC is
not readily available to bacteria (also true for total nitrogen and total phosphorus), it was
considered that this can still provide an indication of the representative ratio. Results are
shown for the computed C:N:P ratio for the raw water (BF1 influent), and suggested
potential phosphorus limiting conditions in the water feeding the biofilters (according to the
100:10:1 ratio for balanced conditions).
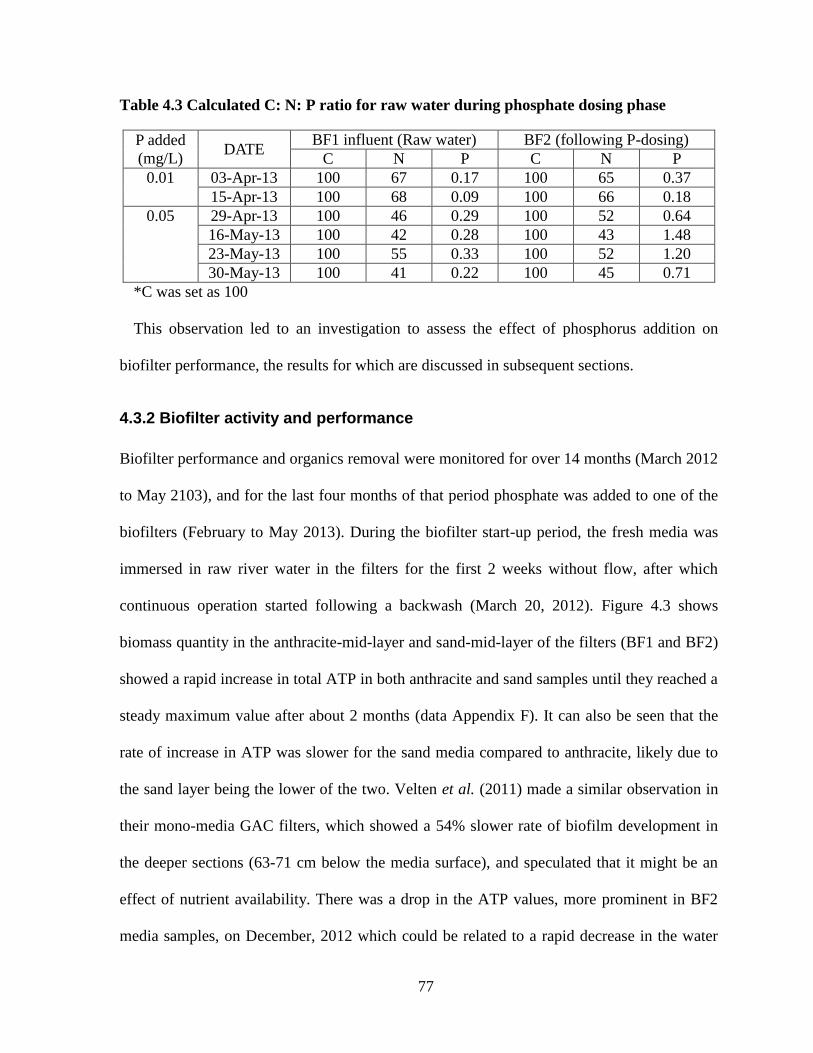
77
Table 4.3 Calculated C: N: P ratio for raw water during phosphate dosing phase
P added
(mg/L) DATE
BF1 influent (Raw water) BF2 (following P-dosing)
C N P C N P
0.01 03-Apr-13 100 67 0.17 100 65 0.37
15-Apr-13 100 68 0.09 100 66 0.18
0.05 29-Apr-13 100 46 0.29 100 52 0.64
16-May-13 100 42 0.28 100 43 1.48
23-May-13 100 55 0.33 100 52 1.20
30-May-13 100 41 0.22 100 45 0.71
*C was set as 100
This observation led to an investigation to assess the effect of phosphorus addition on
biofilter performance, the results for which are discussed in subsequent sections.
4.3.2 Biofilter activity and performance
Biofilter performance and organics removal were monitored for over 14 months (March 2012
to May 2103), and for the last four months of that period phosphate was added to one of the
biofilters (February to May 2013). During the biofilter start-up period, the fresh media was
immersed in raw river water in the filters for the first 2 weeks without flow, after which
continuous operation started following a backwash (March 20, 2012). Figure 4.3 shows
biomass quantity in the anthracite-mid-layer and sand-mid-layer of the filters (BF1 and BF2)
showed a rapid increase in total ATP in both anthracite and sand samples until they reached a
steady maximum value after about 2 months (data Appendix F). It can also be seen that the
rate of increase in ATP was slower for the sand media compared to anthracite, likely due to
the sand layer being the lower of the two. Velten et al. (2011) made a similar observation in
their mono-media GAC filters, which showed a 54% slower rate of biofilm development in
the deeper sections (63-71 cm below the media surface), and speculated that it might be an
effect of nutrient availability. There was a drop in the ATP values, more prominent in BF2
media samples, on December, 2012 which could be related to a rapid decrease in the water

78
temperature. However, ATP levels recovered quickly, and overall results show that
temperature did not ATP concentrations in the biofilters. Change in ATP concentrations
during the P-dosing period is discussed in more detail in section 4.3.3.
Figure 4.3 Comparison of biomass quantity as measured by ATP in media samples
collected from each of the two dual-media biofilters. Samples were collected from the
mid-point of each of the anthracite and sand layers (28 and 67 cm from media surface).
Start of P-dosing (in BF2) is indicated along with feed water temperature.
Figure 4.4 illustrates the variation of biomass quantity with depth, confirming, as expected,
a higher average biomass quantity close to the top surface of the media. In terms of the
relationship of depth with biomass, Servais et al. (1991) found decreasing biomass and
activity with depth during warmer temperature, which was not seen during the colder times
of the year. They also found higher BOM removal in the top 40 cm of the filter. Servais et al.
(1994) later reported similar vertical stratification at a different location.
0
5
10
15
20
25
0.1
1
10
100
1000
10000
Tem
pe
ratu
re (°
C)
ng
ATP
/cm
3M
ed
ia
BF1_anthracite BF2_anthraciteBF1_sand BF2_sandTemperature
P-dosing

79
Figure 4.4 Biomass quantity measured in BF1 at the upper-most anthracite port (4 – 12
cm below media surface), mid-anthracite layer (24 – 32 cm) and mid sand layer (30 – 38
cm) with lines showing the average, upper and lower ATP concentrations (n = 10). 0 cm
is the top surface of the media.
Microbial activity in the media was measured with FDA hydrolysis on the same samples.
The FDA assay is widely used to measure total microbial activity from environmental
samples, and provides a measure of overall enzymatic activity, as FDA can be hydrolyzed by
a range of non-specific esterases, proteases and lipases which are widespread among
microorganisms (Adam and Duncan, 2001). The results in Figure 4.5 show a similar rapid
increase in activity as ATP, especially for the anthracite samples, and similarly the increase
of activity in the sand samples was slower than in anthracite (data Appendix F). Like ATP,
FDA results reached a maximum value by 2 months and then remained essentially constant,
and there were no significant temperature effects observed on activity during the steady-state
-90
-80
-70
-60
-50
-40
-30
-20
-10
0
0 50 100 150 200 250 300 350 400
Dep
th f
rom
top
of
BF1
med
ia (c
m)
tATP (ng/cm3 of dry media)
Line of Average ATP
Line of Maximum ATP
Line of Minimum ATP
Feb 04; T = 14 °C
Feb 11; T = 11 °C
Mar 04; T = 10 °C
Mar 18; T = 15 °C
Apr 03; T = 14 °C
Apr 15; T = 16 °C
Apr 29; T = 16 °C
May 16; T = 19 °C
May 23; T = 20 °C
May 30; T = 20 °C

80
operation (Figure 4.5). Others have shown that FDA hydrolysis correlates well with ATP and
cell density (Stubberfield and Shaw, 1990). However, our correlation was not as good as
others (r = 0 – 0.5 for different depths and media) and we were unable to identify the reasons
behind the difference in findings. Also in this study, activity at the top though was found to
be higher on average (Table 4.6). Using different methods to measure activity, others have
also shown that, activity, like biomass quantity, was higher at the top surface of biofilters due
to the greater availability of substrate (Sang et al., 2003). Also, ATP and FDA did not
demonstrate seasonal variations. This finding agrees with those of Persson et al. (2006) in the
case of attached biomass quantity while working with fairly humic water from Lake
Delsjöarna; however, they found respiratory activity (measured as oxygen consumption) to
be dependent on temperature.
Figure 4.5 Comparison of biomass activity as measured by FDA analysis in media
samples collected from each of the two dual-media biofilters. Samples were collected
from the mid-point of each of the anthracite and sand layers (28 and 67 cm from media
surface). Start of P-dosing (in BF2) is indicated along with feed water temperature.
0
5
10
15
20
25
0
1
10
100
1000
10000
Tem
per
atu
re °C
FDA
(µ
g/c
m3
of d
ry m
ed
ia)
BF1_anthracite BF2_anthracite
BF1_sand BF2_sand
Temperature
P-dosing

81
A t-test (α = 95%) confirmed that there was no significant difference between biomass
quantity and activity in the two biofilters during the period of identical operation after the
biofilm quantity and activity reached their maximums (i.e. control conditions). From the data,
it can be seen that within approximately 3 months of operation the biofilm quantity and
activity reached a maximum. The removals of organics, however, were variable over this
time period. From the literature, the required time to steady-state operation was found to be 2
weeks for a lab-scale-GAC biofilter (Nishijima et al. 1997) and 3 weeks for a full-scale
GAC-phonolith (volcanic rock)-CaCO3 biofilter (Melin et al. (2002), respectively, based on
TOC removal. Servais et al. (1994), who studied GAC biofilters, found steady-state DOC
removal may occur well before steady-state biomass development is reached. During their
study, 100 days was required for acclimation with respect to biomass development. These
results are comparable to the finding of the current research, although the media types were
different. The biological availability of substances in the feed is known to be an important
factor related to the length of the acclimation period (Xiang et al., 2013), and this may result
in different acclimation values between studies.
While some researchers have suggested that the amount of biofilm or activity may not be
related to organics removal (Juhna and Melin, 2006, Wang et al., 1995), others, for example,
Fonseca et al. (2001) found DOC removal to be related to activity. The DOC removals by the
two filters (average 0 to 12% for both) as shown in Figure 4.6 were very similar during the
steady-state operation period before phosphorus dosing (until February 2013). The removals
of biopolymers by the biofilters were also identical (21% and 24% for BF1 and BF2,
respectively) (discussed in detail in Chapter 3). However, no relationship was found between
either DOC or biopolymer removal and biomass quantity or activity in this study.
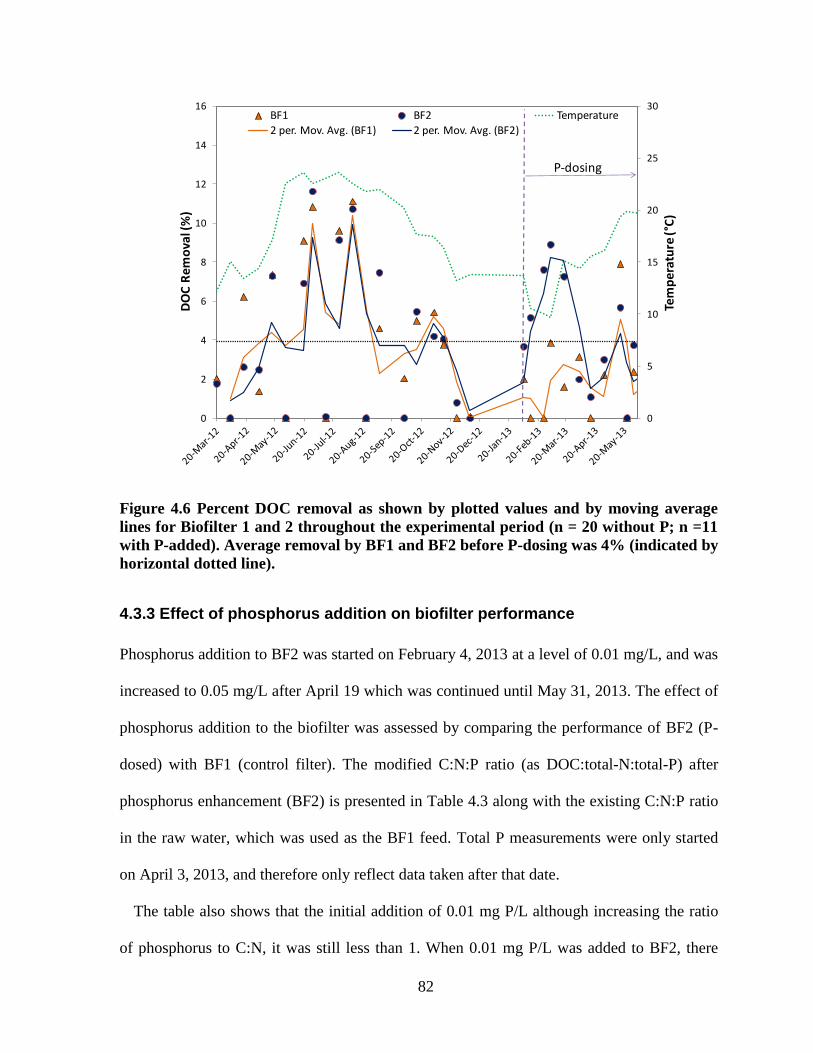
82
Figure 4.6 Percent DOC removal as shown by plotted values and by moving average
lines for Biofilter 1 and 2 throughout the experimental period (n = 20 without P; n =11
with P-added). Average removal by BF1 and BF2 before P-dosing was 4% (indicated by
horizontal dotted line).
4.3.3 Effect of phosphorus addition on biofilter performance
Phosphorus addition to BF2 was started on February 4, 2013 at a level of 0.01 mg/L, and was
increased to 0.05 mg/L after April 19 which was continued until May 31, 2013. The effect of
phosphorus addition to the biofilter was assessed by comparing the performance of BF2 (P-
dosed) with BF1 (control filter). The modified C:N:P ratio (as DOC:total-N:total-P) after
phosphorus enhancement (BF2) is presented in Table 4.3 along with the existing C:N:P ratio
in the raw water, which was used as the BF1 feed. Total P measurements were only started
on April 3, 2013, and therefore only reflect data taken after that date.
The table also shows that the initial addition of 0.01 mg P/L although increasing the ratio
of phosphorus to C:N, it was still less than 1. When 0.01 mg P/L was added to BF2, there
0
5
10
15
20
25
30
0
2
4
6
8
10
12
14
16
Tem
per
atu
re (°
C)
DO
C R
emo
val (
%)
BF1 BF2 Temperature
2 per. Mov. Avg. (BF1) 2 per. Mov. Avg. (BF2)
P-dosing
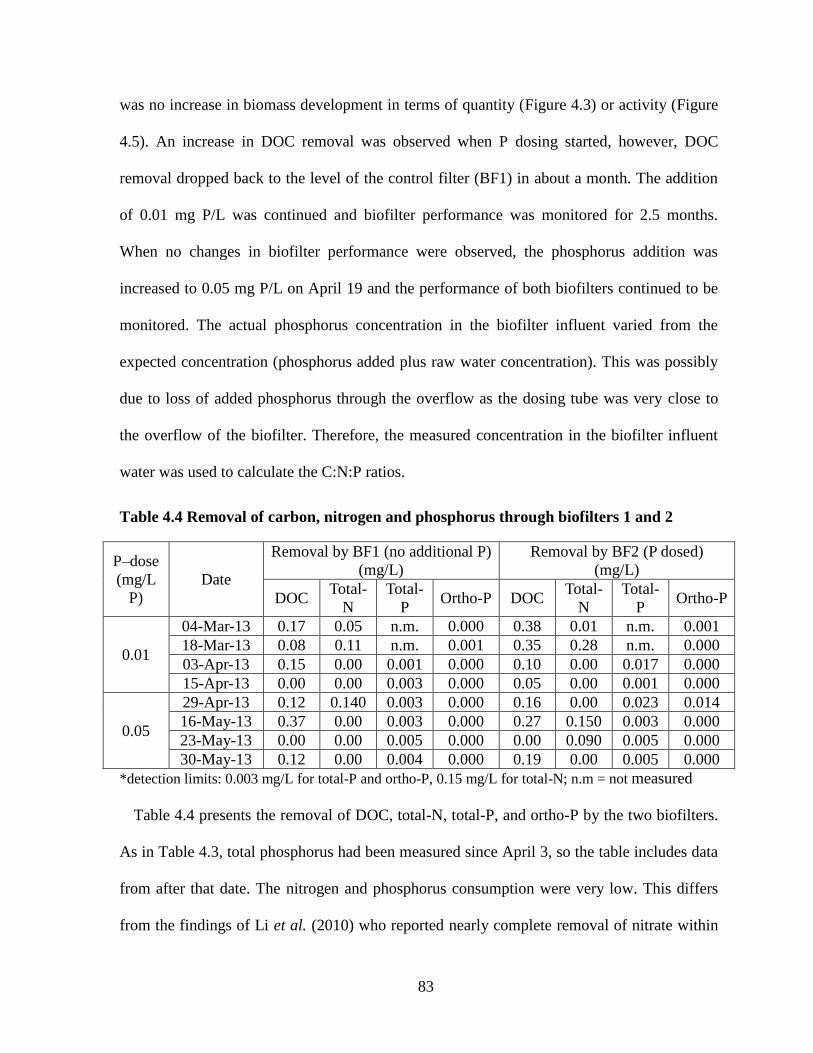
83
was no increase in biomass development in terms of quantity (Figure 4.3) or activity (Figure
4.5). An increase in DOC removal was observed when P dosing started, however, DOC
removal dropped back to the level of the control filter (BF1) in about a month. The addition
of 0.01 mg P/L was continued and biofilter performance was monitored for 2.5 months.
When no changes in biofilter performance were observed, the phosphorus addition was
increased to 0.05 mg P/L on April 19 and the performance of both biofilters continued to be
monitored. The actual phosphorus concentration in the biofilter influent varied from the
expected concentration (phosphorus added plus raw water concentration). This was possibly
due to loss of added phosphorus through the overflow as the dosing tube was very close to
the overflow of the biofilter. Therefore, the measured concentration in the biofilter influent
water was used to calculate the C:N:P ratios.
Table 4.4 Removal of carbon, nitrogen and phosphorus through biofilters 1 and 2
P–dose
(mg/L
P)
Date
Removal by BF1 (no additional P)
(mg/L)
Removal by BF2 (P dosed)
(mg/L)
DOC Total-
N
Total-
P Ortho-P DOC
Total-
N
Total-
P Ortho-P
0.01
04-Mar-13 0.17 0.05 n.m. 0.000 0.38 0.01 n.m. 0.001
18-Mar-13 0.08 0.11 n.m. 0.001 0.35 0.28 n.m. 0.000
03-Apr-13 0.15 0.00 0.001 0.000 0.10 0.00 0.017 0.000
15-Apr-13 0.00 0.00 0.003 0.000 0.05 0.00 0.001 0.000
0.05
29-Apr-13 0.12 0.140 0.003 0.000 0.16 0.00 0.023 0.014
16-May-13 0.37 0.00 0.003 0.000 0.27 0.150 0.003 0.000
23-May-13 0.00 0.00 0.005 0.000 0.00 0.090 0.005 0.000
30-May-13 0.12 0.00 0.004 0.000 0.19 0.00 0.005 0.000
*detection limits: 0.003 mg/L for total-P and ortho-P, 0.15 mg/L for total-N; n.m = not measured
Table 4.4 presents the removal of DOC, total-N, total-P, and ortho-P by the two biofilters.
As in Table 4.3, total phosphorus had been measured since April 3, so the table includes data
from after that date. The nitrogen and phosphorus consumption were very low. This differs
from the findings of Li et al. (2010) who reported nearly complete removal of nitrate within

84
2 days of the start of phosphorus dosing into their pilot-scale BAC filter. Table 4.4 also
shows that the removal of total-P within the filters was very low as well, and there was no
removal of ortho-P in the filters. One possible explanation for the “0”-removal values of
ortho-P and nitrogen could be that the biofilm bacteria re-cycled the nutrients from breaking
down dead cells (Melin et al., 2002). Li et al. (2010) also reported no significant increase in
nitrate uptake with phosphorus addition in BAC biofilters. In Table 4.4 the DOC removal
from April 3 on was also somewhat similar in the two biofilters, unlike examples from
literature which found a 75% increase (Lauderdale et al., 2012) and a 6 times (Nishijima et
al., 1997) increase in DOC removal with P-dose of 0.02 mg/L (P-dosing duration: 6 weeks)
and 0.01 mg/L (P-dosing duration: 4 weeks) into their GAC biofilters, respectively.
However, as mentioned earlier, better performance in DOC removal was observed for a short
period of time (just over a month) during the start of 0.01 mg P/L dosing (Figure 4.6). This is
especially important as the DOC removal had been similar (average 3.7% for BF1, 4.1% for
BF2) for both biofilters since acclimation (for 8 months). Removal of UV-absorbing
components, as measured by UV absorbance at λ = 254 nm, was also significantly higher (α
= 95%, n = 10) in BF2 during the initial phosphorus addition period (Figure 4.7). The LC-
OCD results confirmed that this increased removal in DOC was in the humics substances
fraction (Figure 4.8) and not the biopolymers Figure 4.9). However, an improvement in DOC
and humics removal was not observed at the higher (0.05 mg P/L) phosphorus dose. There
was no significant difference between parallel biofilters (Table 4.5) with respect to removing
the lower molecular weight NOM fractions (p-value 0.5 and 0.7 for building blocks and
LMW neutrals, respectively).

85
Table 4.5 Difference in performance between BF1 (control) and BF2 (P-enhanced);
February 4 to May 30, 2013
Parameter
Raw Water Quality
(mg/L)* % Removal by BF1 % Removal by BF2
n p-value
Max Min Avg Max Min Avg SD Max Min Avg SD
Turbidity 15.00 4.27 8.07 84 51 69 13 85 52 72 12 9 0.104
UV254 0.18 0.12 0.15 4 0 2 1 6 0 3 2 10 0.020
TOC 5.65 4.34 4.91 9 0 2 3 7 0 4 2 10 0.158
DOC 5.40 4.23 4.78 8 0 2 2 9 0 4 3 10 0.049
Biopolymers 0.159 0.079 0.108 29 10 21 5 32 11 24 6 9 0.037
Humics 3.68 2.81 3.29 5 0 2 2 9 0 4 3 8 0.046
Avg = average; SD = standard deviation
Raw water quality parameters (average): temperature = 15.6°C; pH = 8.1; alkalinity = 231
mg/L as CaCO3; hardness = 295 mg/L as CaCO3; conductivity = 449 µS/cm
*except turbidity (NTU) and UV254
Figure 4.7 Removal of UV absorbance at 254 nm wavelength by Biofilter 1 and 2 (n =
20 without P; n =11 with P-added), which measures mixture of aquatic humics and
different hydrophobic and hydrophilic NOM fractions of variable molecular weights in
the water.
0
5
10
15
20
25
30
0.000
0.002
0.004
0.006
0.008
0.010
0.012
0.014
Tem
per
atu
re (°
C)
UV
254
Rem
ova
l (cm
-1)
BF1 BF2 Temperature
2 per. Mov. Avg. (BF1) 2 per. Mov. Avg. (BF2)
P-dosing
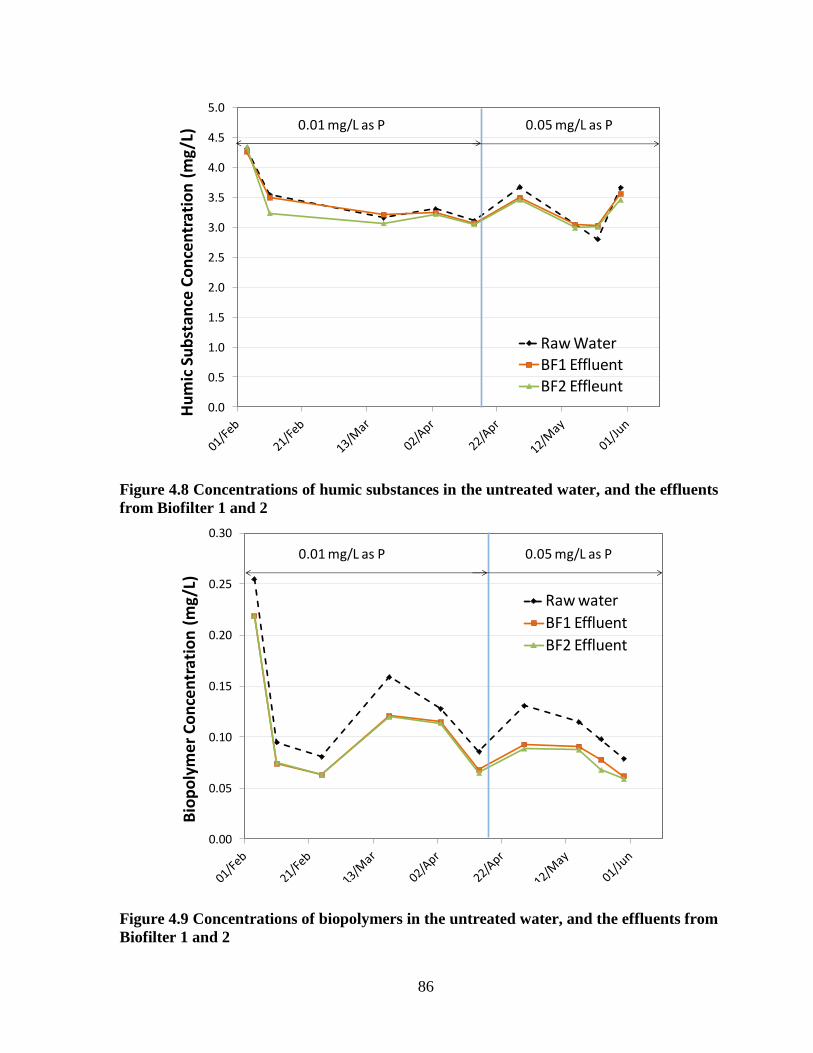
86
Figure 4.8 Concentrations of humic substances in the untreated water, and the effluents
from Biofilter 1 and 2
Figure 4.9 Concentrations of biopolymers in the untreated water, and the effluents from
Biofilter 1 and 2
0.0
0.5
1.0
1.5
2.0
2.5
3.0
3.5
4.0
4.5
5.0
Hu
mic
Su
bst
ance
Co
nce
ntr
atio
n (
mg/
L)
Raw WaterBF1 EffluentBF2 Effleunt
0.01 mg/L as P 0.05 mg/L as P
0.00
0.05
0.10
0.15
0.20
0.25
0.30
Bio
po
lym
er
Co
nce
ntr
ati
on
(m
g/L
)
Raw water
BF1 Effluent
BF2 Effluent
0.01 mg/L as P 0.05 mg/L as P
87
Figure 4.10A and B show that total phosphorus consumption within the filters was not
different despite biofilter-2 receiving a much higher amount. The only exception was the 1st
sampling date (April 29) collected after 0.05 mg P/L addition was started. This day showed
high total and ortho phosphorus consumption. This could simply be an outlier or an
indication that the filters were going through some changes in microbial structure.
Unfortunately in our study there were too few data points collected immediately after P
addition to confirm.

88
Figure 4.10 Concentration and consumptions of total phosphate in the A) control
biofilter (BF1) influent and effluent, and B) BF2 (P-dosed biofilter 2) influent and
effluent with concentrations in untreated raw water during April and May, 2013
0.001
0.003 0.003 0.003
0.0050.004
0
0.01
0.02
0.03
0.04
0.05
0.06
0.07
0.08
Apr_3 Apr_15 Apr_29 May_16 May_23 May_30
Co
nce
ntr
atio
n (m
g/L)
Sample days
Total - P
RW
BF1-INF
BF1-EFF
0.017
0.0010.023
0.003
0.005
0.005
0
0.01
0.02
0.03
0.04
0.05
0.06
0.07
0.08
Apr_3 Apr_15 Apr_29 May_16 May_23 May_30
Co
nce
ntr
ati
on
(m
g/L
)
Sample days
Total - P
Raw
BF2-INF
BF2-EFF
Dose: 0.05 mg/L as PDose: 0.01 mg/L as P(B)
(A)
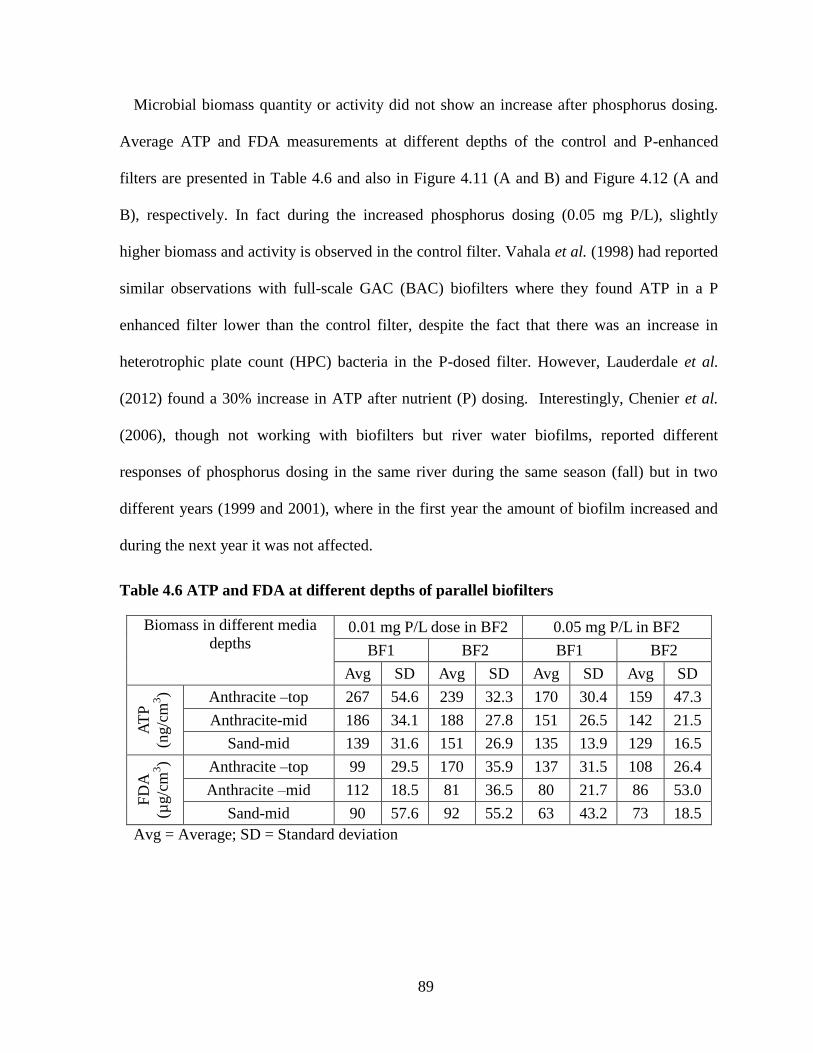
89
Microbial biomass quantity or activity did not show an increase after phosphorus dosing.
Average ATP and FDA measurements at different depths of the control and P-enhanced
filters are presented in Table 4.6 and also in Figure 4.11 (A and B) and Figure 4.12 (A and
B), respectively. In fact during the increased phosphorus dosing (0.05 mg P/L), slightly
higher biomass and activity is observed in the control filter. Vahala et al. (1998) had reported
similar observations with full-scale GAC (BAC) biofilters where they found ATP in a P
enhanced filter lower than the control filter, despite the fact that there was an increase in
heterotrophic plate count (HPC) bacteria in the P-dosed filter. However, Lauderdale et al.
(2012) found a 30% increase in ATP after nutrient (P) dosing. Interestingly, Chenier et al.
(2006), though not working with biofilters but river water biofilms, reported different
responses of phosphorus dosing in the same river during the same season (fall) but in two
different years (1999 and 2001), where in the first year the amount of biofilm increased and
during the next year it was not affected.
Table 4.6 ATP and FDA at different depths of parallel biofilters
Biomass in different media
depths 0.01 mg P/L dose in BF2 0.05 mg P/L in BF2
BF1 BF2 BF1 BF2
Avg SD Avg SD Avg SD Avg SD
AT
P
(ng/c
m3) Anthracite –top 267 54.6 239 32.3 170 30.4 159 47.3
Anthracite-mid 186 34.1 188 27.8 151 26.5 142 21.5
Sand-mid 139 31.6 151 26.9 135 13.9 129 16.5
FD
A
(µg/c
m3) Anthracite –top 99 29.5 170 35.9 137 31.5 108 26.4
Anthracite –mid 112 18.5 81 36.5 80 21.7 86 53.0
Sand-mid 90 57.6 92 55.2 63 43.2 73 18.5
Avg = Average; SD = Standard deviation
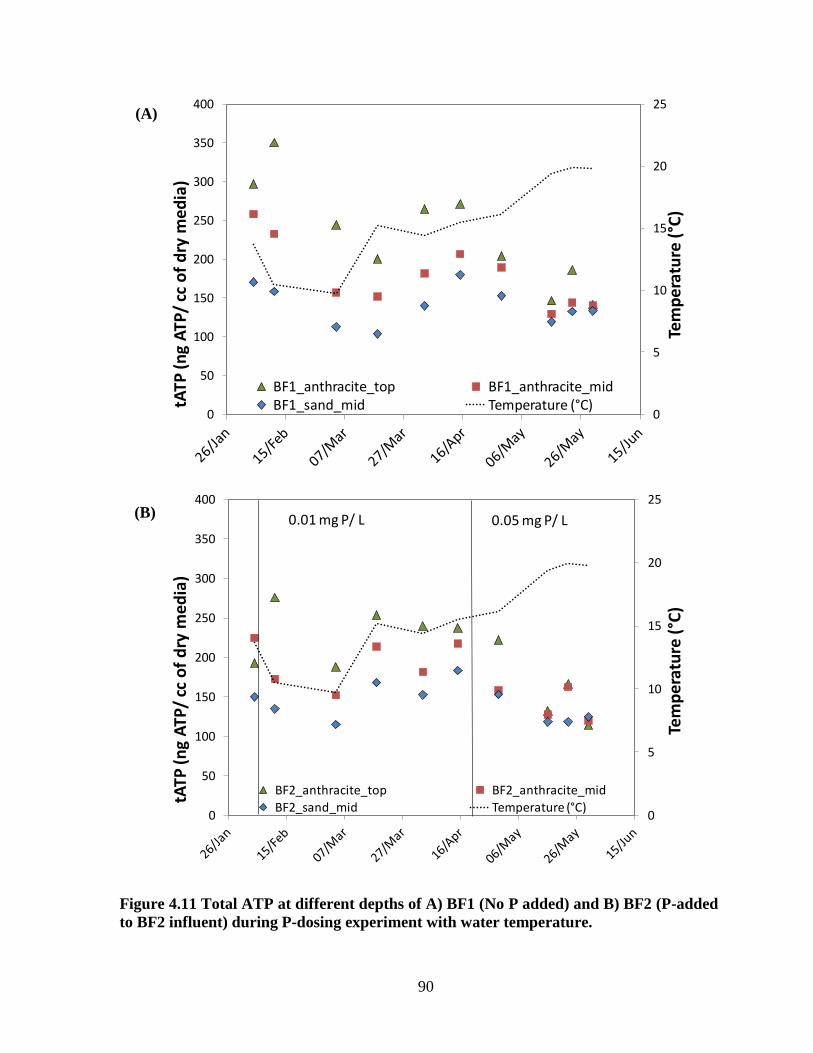
90
Figure 4.11 Total ATP at different depths of A) BF1 (No P added) and B) BF2 (P-added
to BF2 influent) during P-dosing experiment with water temperature.
0
5
10
15
20
25
0
50
100
150
200
250
300
350
400
Tem
per
atu
re (
°C)
tATP
(ng
ATP
/ cc
of
dry
med
ia)
BF1_anthracite_top BF1_anthracite_midBF1_sand_mid Temperature (°C)
0
5
10
15
20
25
0
50
100
150
200
250
300
350
400
Tem
per
atu
re (
°C)
tATP
(ng
ATP
/ cc
of
dry
med
ia)
BF2_anthracite_top BF2_anthracite_mid
BF2_sand_mid Temperature (°C)
0.01 mg P/ L 0.05 mg P/ L
(A)
(B)

91
Figure 4.12 FDA at different depths of A) BF1 (No P added) and B) BF2 (P-added to
BF2 influent) during P-dosing experiment with water temperature.
0
5
10
15
20
25
0
50
100
150
200
250
Tem
pe
ratu
re °
C
FDA
(µ
g/cm
3)
BF1_sand BF1_anthracite BF1_anthracite-92 Temperature
0
5
10
15
20
25
0
50
100
150
200
250
Tem
pe
ratu
re °
C
FDA
(µ
g/cm
3)
BF2_sand BF2_anthracite BF2_anthracite-92 Temperature
0.05 mg P/L0.01 mg P/L
(A)
(B)

92
An absence of any upward trend in biomass quantity and activity during the four months of
phosphorus enhancement indicated many possibilities. A possible explanation why an
increase in biofilm activity was not observed is that increased the numbers of bacteria in the
biofilters could be removed with the effluent due to lack of adhesion capacity (Sang et al.,
2003, Vahala et al., 1998). Also, phosphorus addition may have changed the microbial
dynamics or community in the filter (Li et al., 2010), but had not significantly improved its
activity or performance. If the experimental feed water was indeed phosphorus-limited,
previous literature studies have shown slower but continuous organic removal at phosphorus
limited conditions (Melin et al., 2002). Some other factors might have played a role
(biodegradable portion of organic carbon, bioavailability of nitrogen) in C:N:P calculations.
DOC was used as carbon source in calculating the ratio, which is not fully biodegradable. If
microbially available organic carbon was the limiting factor, which is a common scenario in
drinking water context (Urfer et al., 1997), it would mean the low ratio of phosphorus had
been an underestimation. Hypothetically, assuming the biodegradable portion of the DOC as
20% of the total DOC (based of AOC and BDOC percentages in the literature) the calculated
C:P ratios (as in Table 4.3) would be very close of the target ratio of 100:1 (C:P = 100:0.47
to 1.64, calculated setting 20% DOC as 100). The same would be true, if the biofilters were
actually nitrogen limited as there was no detectable ammonia present in water, and utilization
of nitrate or organic nitrogen is a slower and energy-intensive process. Characteristics of the
indigenous bacteria community and microbiologically available portion of phosphorus
(Miettinen et al., 1997) are also some important factors here.

93
4.3.4 Membrane fouling experiments
The role of biopolymers, which include polysaccharides or protein-like substances, in
membrane fouling had previously been demonstrated by Hallé et al. (2009). Biopolymers
were also shown to be important for the membrane fouling experiments conducted for this
study (with the control biofilter), where direct biofiltration was found to be effective in
biopolymer removal (on average 21%) and UF membrane fouling reduction (Chapter 3).
And, during the phosphorus enhancement experimental period (February to May, 2013),
biopolymer removal by control and enhanced biofilters were 21% and 24%, respectively,
which is similar to the observations from the previous 10 months of operation at natural
conditions. For the membrane fouling experiments, effluent from biofilter 1 and later biofilter
2 was used as membrane feed (following a fouling experiment and chemical cleaning). The
fouling rates were measured using the transmembrane pressure (TMP) difference.
Irreversible fouling here is defined as the rate of increase in the non-backwashable TMP
during the full length of the experiment. Reversible fouling was calculated as the rate of
average increase in TMP (average of the difference between final and initial TMP for all
cycles) during a 30 min cycle. The fouling experiments with control and P-dosed biofilter
effluent were done during the same week to keep the water quality as comparable as possible.
A total of 5 sets of these experiments were conducted during the P-dosing period. The results
from these experiments are presented in Table 4.7. As biopolymer removal in the P-dosed
biofilter was not substantially different, a measurable change in the membrane fouling rates
was not expected and the data in Table 4.7 confirms this.

94
Table 4.7 Results from membrane experiments with BF1 (control) and BF2 (P-
enhanced) effluent as feed water
Dat
es o
f th
e tw
o m
embra
ne
exper
imen
ts (
2013)
BF1 Feed BF2 Feed
Len
gth
of
exper
imen
t (h
)
Bio
poly
mer
s (m
g/L
) in
fee
d
Turb
idit
y (
NT
U)
in f
eed
Rev
ersi
ble
(av
g.)
Fouli
ng
Rat
e (k
Pa/
h)
Irre
ver
sible
Fouli
ng R
ate
(kP
a/h)
Bio
poly
mer
s (m
g/L
) in
fee
d
Turb
idit
y (
NT
U)
in f
eed
Rev
ersi
ble
(av
g.)
Fouli
ng
Rat
e (k
Pa/
h)
Irre
ver
sible
Fouli
ng R
ate
(kP
a/h)
Mar 4 – 8 0.07 2.35 4.33 0.35 0.068 1.09 3.86 0.33 29.8
Mar 18 – 21 0.121 3.23 6.68 0.88 0.085 2.94 5.14 0.66 28.2
May 15 – 17 0.11 0.8 5.33 0.37 0.088 2.82 7.51 1.34 18.7
May 22– 24 0.08 0.8 4.49 0.37 0.068 0.98 4.13 0.45 22.9
May 28– 31 0.068 0.81 3.65 0.30 0.059 0.89 3.09 0.36 24.5
From the table it is clear that phosphorus addition did not make a noticeable change with
respect to membrane fouling rates. The difference in the irreversible fouling rate seen during
the experiment on the week of May 15 was clearly a biased set of data as the turbidity of the
raw water had varied too much (1.4 and 10.4 NTU during BF1 and BF2 experiments,
respectively) for an unbiased comparison. The change in turbidity was due to the water level
getting low in the storage tank during the experiment with BF2 effluent as feed. As the
recirculation system in the storage tank was kept running during the membrane experiments
it stirred up settled particles from the tank bottom increasing the turbidity. Other than that
experiment, the overall reversible fouling rate was slightly lower for BF2 effluent.
Irreversible fouling rates, however, were very close and there was no difference in
performance by either filter, although the biopolymer concentration was slightly lower in the
effluent of BF2. The reason that biopolymers were slightly lower in the feed was possibly
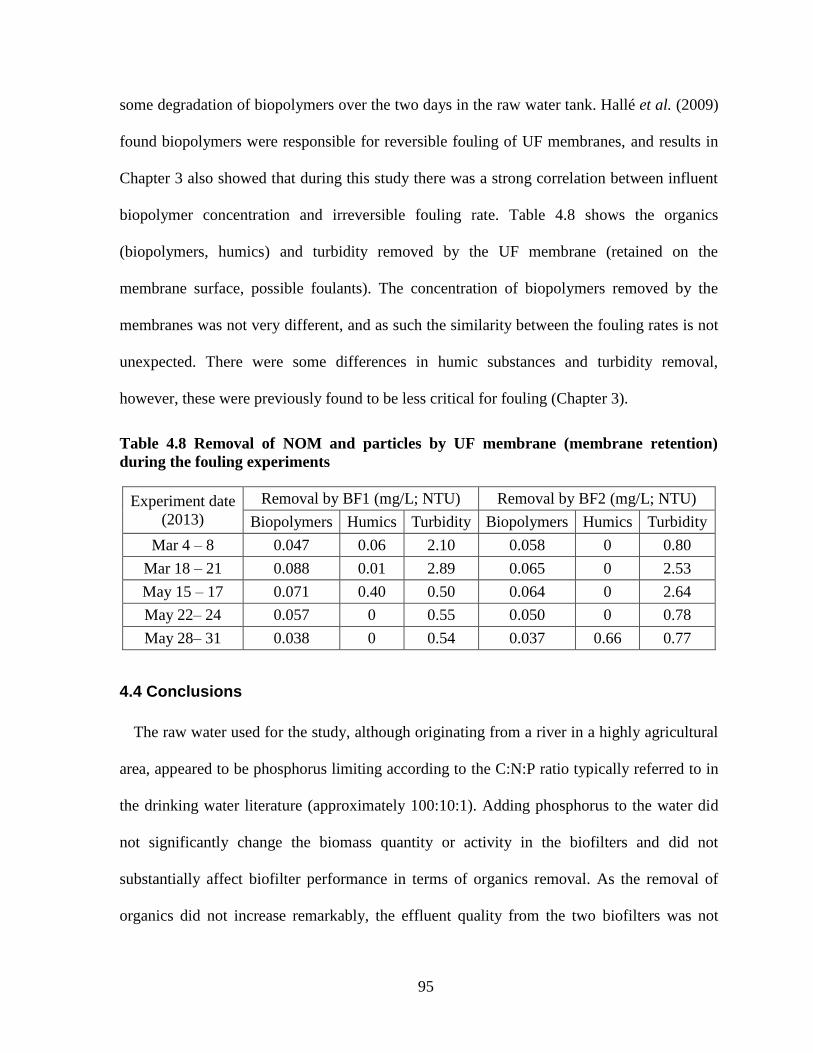
95
some degradation of biopolymers over the two days in the raw water tank. Hallé et al. (2009)
found biopolymers were responsible for reversible fouling of UF membranes, and results in
Chapter 3 also showed that during this study there was a strong correlation between influent
biopolymer concentration and irreversible fouling rate. Table 4.8 shows the organics
(biopolymers, humics) and turbidity removed by the UF membrane (retained on the
membrane surface, possible foulants). The concentration of biopolymers removed by the
membranes was not very different, and as such the similarity between the fouling rates is not
unexpected. There were some differences in humic substances and turbidity removal,
however, these were previously found to be less critical for fouling (Chapter 3).
Table 4.8 Removal of NOM and particles by UF membrane (membrane retention)
during the fouling experiments
Experiment date
(2013)
Removal by BF1 (mg/L; NTU) Removal by BF2 (mg/L; NTU)
Biopolymers Humics Turbidity Biopolymers Humics Turbidity
Mar 4 – 8 0.047 0.06 2.10 0.058 0 0.80
Mar 18 – 21 0.088 0.01 2.89 0.065 0 2.53
May 15 – 17 0.071 0.40 0.50 0.064 0 2.64
May 22– 24 0.057 0 0.55 0.050 0 0.78
May 28– 31 0.038 0 0.54 0.037 0.66 0.77
4.4 Conclusions
The raw water used for the study, although originating from a river in a highly agricultural
area, appeared to be phosphorus limiting according to the C:N:P ratio typically referred to in
the drinking water literature (approximately 100:10:1). Adding phosphorus to the water did
not significantly change the biomass quantity or activity in the biofilters and did not
substantially affect biofilter performance in terms of organics removal. As the removal of
organics did not increase remarkably, the effluent quality from the two biofilters was not

96
distinct enough to have a discernible effect during the membrane experiments. As such, for
this particular water, biofilter phosphorus enhancement did not lead to additional
improvement in the reduction of UF membrane fouling.
A number of reasons could be responsible for these outcomes. Although nitrogen was
abundant in the raw water, it was primarily available in the form of nitrate or organic
nitrogen (as measured by TKN), and may have been poorly or slowly utilized by bacteria in
the biofilters (Melin et al., 2002). The biodegradable organic matter (carbon) in the water
could have been the limiting factor as well. As only a small portion of the organic carbon is
available for microbes, especially for the raw feed water (Saugeen River) which had a high
humic concentration (less biodegradable). It could also be the nature of the indigenous
microorganisms, which might be adapted for a low phosphorus environment, as the river
historically has low levels of phosphorus. Further studies, to improve our understanding of
membrane foulant layers along with the nutrient requirements for optimal biofiltration
performance are necessary. The overall finding from this phase of research was, even when
the concentration of orthophosphate (or even total phosphorus) is low, it does not necessarily
mean the biofilters are phosphorus-limited and in such cases phosphorus enhancement by
itself may not improve biofilter performance with respect to the removal of organic foulants.
97
Chapter 5
Conclusions and Recommendations
5.1 Integration of Findings and Conclusions
The first objective of this research was to examine the effectiveness of direct biofiltration for
controlling NOM-associated fouling of polymeric UF membranes employed in drinking
water treatment applications. Using the Saugeen River in Ontario, Canada, as a raw water
source and NOM characterization by LC-OCD analysis, an attempt was made to relate water
quality with biofilter performance and irreversible and reversible membrane fouling.
The second objective involved the assessment of phosphorus addition to the biofiltration
process. The C:N:P ratio for the Saugeen River suggested that phosphorus may have been a
rate-limiting nutrient in terms of growth of the microorganisms in the biofilters. To test this
hypothesis, phosphorus was added to the influent of biofilter-2 at concentrations of 0.01 mg
P/L and later 0.05 mg P/L for a combined total of 4 months, while biofilter-1 was operated as
an un-amended control. During this time the parallel biofilters were compared to quantify
changes in biomass quantity, biomass activity, organics removal, and other water quality
parameters. UF membrane fouling experiments were conducted separately with biofilter-1
and biofilter-2 effluent waters and membrane fouling rates were monitored. The raw river
water trucked in to the centre and stored in an outdoor storage tank with an automatic
circulation (heating) system which activated when the air temperature dropped to below 7°C
(water temperature range during filter operation was 10 – 24° C). Under the conditions
investigated, the following can be concluded from this study:
1. Through 14 months of parallel biofilter operation, about 20% of influent biopolymers
were consistently removed, despite their relatively low concentrations (0.08 mg/L to 0.26
98
mg/L) in raw water. A linear relationship was found between the initial concentration of
biopolymers in the raw water and amount removed through the biofilters, indicating that
removal could be represented by a first-order process.
2. The parallel biofilters performed similarly in terms of biomass development during
start-up, biomass quantity generation and activity during steady-state operation, and for
particle and organics removal. Seasonal effects on biofilter performance could not be
assessed due to the configuration of the system (which involved automatic heating of an
outdoor tank to prevent freezing).
3. The raw water sometimes contained an elevated humic substance concentration (1.36
mg/L to 5.06 mg/L) which made up a substantial portion of the dissolved organic carbon
(DOC), ranging from 54 to 89%. However, the biofilters did not substantially remove humic
substances during the 14 months experimental period which is consistent with expectations.
4. UF membrane reversible and irreversible fouling rates, which were calculated based
on ΔTMP (transmembrane pressure), were found to be highly correlated with the biopolymer
concentration in the water, in spite of the low concentration of biopolymers in the membrane
feed water, which ranged from 0.10 to 0.26 mg/L for untreated water and 0.07 to 0.19 mg/L
in biofiltered water. This was quite remarkable given that the corresponding DOC
concentrations were on the order of 5 mg/L. It is also intriguing that the removal of only a
small amount of biopolymer material could lead to substantial improvement in UF membrane
fouling rates.
5. There was no relationship between fouling (both reversible and irreversible) and the
concentration of humic substances present in the membrane feed water (for both untreated
and biofiltered waters). Although increased fouling was observed in one elevated turbidity
99
event (up to 18 NTU), a strong relationship between fouling rate and turbidity was not
observed.
6. When UF membrane fouling rates using untreated (raw) and biofiltered water were
compared, it was observed that there was 14 to 68% reduction in the hydraulically
irreversible fouling rate and an 8 to 55% reduction in the hydraulically reversible fouling
rate. This confirmed the effectiveness of biofiltration pretreatment for removing material that
can cause fouling of UF membranes.
7. The addition of phosphorus in the influent of biofilter-2 improved the influent C:N:P
ratio in general and helped to achieve the target ratio (100:10:1) on some occasions.
However, it did not improve biofilter performance substantially in terms of the removal of
organics. This was true at both the low and high phosphate doses. Although in the early
phase of low P dosing (approximately one month) increased DOC removal was observed in
the phosphorus-enhanced biofilter, the portion of DOC which was removed was mostly
humic in nature (based on UV removal). There was no change in biopolymer removal
performance (21% and 24%) for the two biofilters.
8. The biomass quantity and activity in the biofilters were not affected by phosphorus
dose or seasonal changes in the raw water character or temperature (ranging between 10 to
24°C), at least as indicated by the quantification methods used in this study.
9. Membrane fouling experiments did not result in significantly different reversible or
irreversible fouling rates using either the P-amended or the control biofilter as feed waters.
This makes sense as the biofilter effluents continued to produce similar concentrations of
biopolymers, an important membrane foulant, but also indicates that there was no change in
biopolymer composition.

100
10. The data collected suggest that although the concentration of phosphorus was low in
the raw water studied, it was not a growth-limiting nutrient for the microorganisms inhabiting
the biofilter. Carbon and nitrogen while appearing to be available in higher concentrations,
might not have been in a readily available form, thus either could be a growth-limiting factor
or a combination of nutrients could be responsible. It is also likely that the indigenous
bacteria were accustomed to the low phosphorus levels, which could be the reason for not
demonstrating a change in performance/consumption of the surplus phosphorus in the
biofilters.
5.2 Implementation of Findings in the Drinking Water Treatment Industry and
Recommendations for Future Research
Results of this study confirm previous observations regarding the potential of direct
biofiltration as pretreatment for low-pressure polymeric ultrafiltration membranes, but using
a different type of water matrix than had previously been examined. Reductions in the
membrane fouling rate lead to less frequent backwashes and chemical cleanings; hence, this
technology can be used in treatment plants with membrane-based systems to reduce
membrane operating costs and reduce the volume of cleaning chemicals required. This will
be especially useful in remote communities, as biofiltration operation is simple and
commercial ultrafiltration membrane processes are becoming easier to use.
The study also provides further insight into the role of biopolymers in ultrafiltration
membrane fouling and biopolymer removal kinetics (first-order) in the biofilters. The
information can be useful for decisions regarding source water and treatment process
selection. It should be noted that in the case of river water with elevated humic substance
concentrations such as the Saugeen River, that humics were not effectively removed by the

101
biofilters under the conditions investigated. In this case, humic substances were not
detrimental to filter or membrane performance, but if a treatment process was designed for
other objectives (e.g. DBP precursor reduction), it would be necessary to incorporate other
processes to achieve the required humics removal. Also, adjustment in operating conditions
in terms of empty bed contact time and backwashing frequency may be necessary if turbidity
removal credits are expected from biofiltration alone.
The attempt to engineer the biofilters for better performance with the addition of
phosphorus did not provide conclusive data to support theories involving nutrient limitation.
Hence, it is recommended that the effect of phosphorus and other nutrients, in particular,
nitrogen and carbon be further examined. Other than the nutrient analyses done for this study,
quantification of biodegradable organic carbon is recommended. And from analysis point of
view, a more refined statistical analysis using the data may provide additional interesting
information.
Finally, the membrane fouling reduction potential of biofiltration should be further
explored with different membrane types. High-pressure membranes and ceramic membranes
are growing in popularity in the field of drinking water treatment. Investigation of the
applicability of biofiltration pretreatment for these types of membranes is recommended for
future research..
102
References
Abeynayakaa, A., C.V. Le Anh Tuana, H. Yonekawab, and Y. Watanabec, 2010. Pre-treatment
Options for Hybrid Ceramic Microfiltration Systems for Surface Water Treatment. In:
International Conference on Sustainable Built Environment (ICSBE-2010), 307-315.
Adam, G. and H. Duncan, 2001. Development of a Sensitive and Rapid Method for the
Measurement of Total Microbial Activity Using Fluorescein Diacetate (FDA) in a Range of
Soils. Soil Biology and Biochemistry. 33 (7-8): 943-951.
Ahmad, R., A. Amirtharajah, A. Al-Shawwa, and P.M. Huck, 1994. Optimum Backwashing
Strategies for Biological Filters. In Proc. 1994 American Water Works Association Water
Quality Technology Conference (WQTC), San Francisco.
Allen, A.E., M.H. Howard-Jones, M.G. Booth, M.E. Frischer, P.G. Verity, D.A. Bronk, and
M.P. Sanderson, 2002. Importance of Heterotrophic Bacterial Assimilation of Ammonium
and Nitrate in the Barents Sea During Summer. Journal of Marine Systems. 38 (1-2): 93–108.
Amy, G. 2008. Fundamental Understanding of Organic Matter Fouling of Membranes.
Desalination. 231 (1-3): 44-51.
APHA-AWWA-WEF., 2012. Standard Methods for the Examination of Water and Wastewater.
America Public Health Association, Washington DC.
AWWA 2005 Microfiltration and Ultrafiltration Membranes for Drinking Water - Manual of
Water Supply Practices, M53 (1st Edition). American Water Works Association, Denver,
CO.
Barbot, E., S. Moustier, J.Y. Bottero, P. Moulin, 2008. Coagulation and Ultrafiltration:
Understanding of the Key Parameters of the Hybrid Process. Journal of Membrane Science.
325 (2): 520-527.
103
Beltran, F.J., 2004. Ozone Reaction Kinetics for Water and Wastewater Systems. CRC Press
LLC, Florida, USA.
Bérubé, P.R., D.S. Mavinic, E.R. Hall, S.E. Kenway, and K. Roett, 2002. Evaluation of
Adsorption and Coagulation as Membrane Pretreatment Steps for the Removal of Organic
Material and Disinfection-by-product Precursors. Journal of Environmental Engineering and
Science. 1 (6): 465-476.
Billen, G., P. Servais, C. Ventresque, and P. Bouillot, 1992. Functioning of Biological Filters
Used in Drinking-Water Treatment: the CHABROL Model. Journal of Water Supply:
Research and Technology-AQUA. 41 (4): 231-241.
Bouwer, E.J., and P.B Crowe, 1988. Biological Processes in Drinking Water Treatment.
Journal of American Water Works Association. 80 (9): 82-93.
Bradford, S.M., C.J. Palmer, and B.H. Olson, 1994. Assimilable Organic Carbon
Concentrations in Southern California Surface and Groundwater. Water Research. 28 (2):
427–435.
Brown, J.C., 2007. Biological Treatment of Drinking Waters. The Bridge. 37 (4): 30-36
Cataldo, F., 2003. On the Action of Ozone on Proteins. Polymer Degradation and Stability. 82
(1): 105-114.
CCME (Canadian Council of Ministers of the Environment), 2012. Canadian Water Quality
Guidelines for the protection of aquatic life: Nitrate Ion. Canadian Environmental Quality
Guidelines, Canadian Council of Ministers of the Environment, Winnipeg. http://ceqg-
rcqe.ccme.ca/ (accessed on October 6, 2013)
Chang, H.T., and B.E. Rittmann, 1987. Mathematical Modeling of Biofilm on Activated
Carbon. Environmental Science & Technology. 21 (3): 273-280.

104
Chaudhary, D.S., S. Vigneswaran, H.H. Ngo, W.G. Shim, and H. Moon, 2003. Biofilter in
Water and Wastewater Treatment. Korean Journal of Chemical Engineering, 20 (6): 1054-
1065.
Chenier, M.R., D. Beaumier, N. Fortin, R. Roy, B.T. Driscoll, J.R. Lawrence, and C.W. Greer,
2006. Influence of Nutrient Inputs, Hexadecane, and Temporal Variations on Denitrification
and Community Composition of River Biofilms. Applied and Environmental Microbiology.
72 (1): 575-584.
Cho, J., G. Amy, and J. Pellegrino, 2000. Membrane Filtration of Natural Organic Matter:
Factors and Mechanisms Affecting Rejection and Flux Decline with Charged Ultrafiltration
(UF) Membrane. Journal of Membrane Science. 164 (1-2): 89-110.
Choi, K.Y.J. and B.A. Dempsey, 2004. In-line Coagulation with Low-Pressure Membrane
Filtration. Water Research. 38 (19): 4271-4281.
Cornelissen, E., W. Siegers, J. Ogier, and E. Beerendonk, 2006. Influence of Calcium-NOM
Complexes on Fouling of Nanofiltration Membranes in Drinking Water Production. Water
Science & Technology: Water Supply. 6 (4): 171-178.
Costa, A.R., M.N. de Pinho, and M. Elimelech, M., 2006. Mechanisms of Colloidal Natural
Organic Matter Fouling in Ultrafiltration. Journal of Membrane Science. 281 (1-2): 716-725.
Crittenden, J.C., R.R. Trussell, D.W. Hand, K.J. Howe,and G. Tchobanoglous, 2005. Water
Treatment Principles and Design (2nd edition). John Wiley & Sons, Hoboken, N.J., USA.
Croft, J., 2012. Natural Organic Matter Characterization of Different Source and Treated
Waters; Implications for Membrane Fouling Control. Master’s thesis, University of
Waterloo, Waterloo, Ontario, Canada. http://uwspace.uwaterloo.ca/handle/10012/7107

105
Dodds, W.K., J.R. Jones, and E.B. Welch, 1998. Suggested Classification of Stream Trophic
State: Distributions of Temperate Stream Types by Chlorophyll, Total Nitrogen, and
Phosphorus. Water Research, 32 (5): 1455-1462.
Dong, B.Z., Y. Chen, N.Y. Gao, and J.C. Fan, 2007. Effect of Coagulation Pretreatment on the
Fouling of Ultrafiltration Membrane. Journal of Environmental Sciences. 19 (3): 278-283.
Edzwald, J.K., and J.E. Tobiason, 1999. Enhanced Coagulation: US Requirements and a
Broader View. Water Science and Technology. 40 (9): 63-70.
Elhadi, S.L., P.M. Huck, and R.M. Slawson, 2006. Factors Affecting the Removal of Geosmin
and MIB in Drinking Water Biofilters. Journal of American Water Works Association. 98
(8): 108-119.
El-Hadidy, A., 2011 Removal of Enteric Viruses by Ultrafiltration Membranes. Master’s thesis,
University of Waterloo, Waterloo, Ontario, Canada. http://hdl.handle.net/10012/6152
El-Hadidy, A.M., S. Peldszus, and M.I. Van Dyke, 2013. An Evaluation of Virus Removal
Mechanisms by Ultrafiltration Membranes Using MS2 and phiX174 Bacteriophage.
Accepted for publication in Journal of Separation and Purification Technology. September
2013.
Emelko, M.B., P.M. Huck, B.M. Coffey, and E.F. Smith, 2006. Effects of Media, Backwash:
And Temperature on Full-scale Biological Filtration. Journal of American Water Works
Association. 98 (12): 61-73.
Farahbakhsh, K., C. Svrcek, R.K. Guest, and D.W. Smith, 2004. A Review of the Impact of
Chemical Pretreatment on Low-Pressure Water Treatment Membranes. Journal of
Environmental Engineering and Science. 3 (4): 237-253.

106
Filloux, E., H. Gallard, and J.P. Croue, 2012. Identification of Effluent Organic Matter
Fractions Responsible for Low-Pressure Membrane Fouling. Water Research. 46 (17): 5531-
5540.
Fonseca, A.C, R.S. Summers, and M.T. Hernandez, 2001. Comparative Measurements of
Microbial Activity in Drinking Water Biofilters. Water Research. 35 (16): 3817-3824.
Gao, W., H. Liang, J. Ma, M. Han, Z.L. Chen, Z.S. Han, and G.B. Li, 2011. Membrane Fouling
Control in Ultrafiltration Technology for Drinking Water Production: A Review.
Desalination. 272 (1-3): 1-8.
Gaulinger, S., 2007. Coagulation Pre-Treatment for Microfiltration with Ceramic Membranes.
Techneau, D 2.3.2.1,
http://www.techneau.org/fileadmin/files/Publications/Publications/Deliverables/D2.3.2-1.pdf
(accessed on October 6, 2013)
GE, 2013 Zeeweed 500D Module Fact Sheet. Doc# FSpw500D-MOD_EN.
https://knowledgecentral.gewater.com/kcpguest/documents/Fact%20Sheets_Cust/Americas/E
nglish/FSpw500D-MOD_EN.pdf (accessed on October 13, 2013)
Geismar, N., P.R. Bérubé, and B. Barbeau, 2012. Variability and Limits of the Unified
Membrane Fouling Index: Application to the Reduction of Low-Pressure Membrane Fouling
by Ozonation and Biofiltration. Desalination and Water Treatment. 43 (1-3): 91-101.
Green, V.S., D.E. Stott, and M. Diack, 2006. Assay for Fluorescein Diacetate Hydrolytic
Activity: Optimization for Soil Samples. Soil Biology and Biochemistry. 38 (2006): 693-701.
Gregory, J. and J. Duan, 2001. Hydrolyzing Metal Salts as Coagulants. Pure and Applied
Chemistry. 73 (12): 2017-2026.
107
Gurung, D.P., L.J.M. Githinij, and R.O. Ankumah, 2013. Assessing the Nitrogen and
Phosphorus Loading in the Alabama (USA) River Basin Using PLOAD Model. Air, Soil and
Water Research. 2013 (6): 23-36.
Hallé, C., P.M. Huck, S. Peldszus, J. Haberkamp, and M. Jekel, 2009. Assessing the
Performance of Biological Filtration as Pretreatment to Low Pressure Membranes for
Drinking Water. Environmental Science and Technology. 43 (10): 3878-3884
Hashino, M., Y. Mori, Y. Fujii, K. Nakatani, H. Hori, K. Takahashi, N. Motoyama, K. Mizuno,
T. Minegishi, 2001. Advanced Water Treatment System Using Ozone and Ozone Resistant
Microfiltration Module. Water Science and Technology: Water Supply. 1 (5-6): 169-175.
Hendricks, David W., 2011. Fundamentals of Water Treatment Unit Processes; Physical,
Chemical, and Biological. Book News, Inc., Portland, OR.
Her, N., G. Amy, D. McKnight, J. Sohn, and Y. Yoon, Y., 2003. Characterization of DOM as a
Function of MW by Fluorescence EEM and HPLC-SEC Using UVA, DOC, and
Fluorescence Detection. Water Research. 37 (17): 4295-4303.
Hong, S., and M. Elimelech, 1997. Chemical and Physical Aspects of Natural Organic Matter
(NOM) Fouling of Nanofiltration Membranes. Journal of Membrane Science. 132 (2): 159-
181.
Howe, K.J. and M.M. Clark, 2006. Effect of Coagulation Pretreatment: on Membrane Filtration
Performance. Journal of American Water Works Association. 98 (4): 133-146.
Howe, K.J., and M.M. Clark, 2002. Fouling of Microfiltration and Ultrafiltration Membranes
by Natural Waters. Environmental Science and Technology. 36 (16): 3571-3576.
Hozalski, R.M., and E.J. Bouwer, 2001. Non-steady State Simulation of BOM Removal in
Drinking Water Biofilters: Model Development. Water Research. 35 (1): 198-210.

108
Huang, H., K. Schwab, and J.G. Jacangelo, 2009. Pretreatment for Low Pressure Membranes in
Water Treatment: a Review. Environmental Science & Technology. 43 (9): 3011-3019.
Huber, S.A, A. Balz, M. Abert, and W. Pronk, 2011 Characterisation of Aquatic Humic and
Non-Humic Matter with Size-Exclusion Chromatography - Organic Carbon Detection -
Organic Nitrogen Detection (LC-OCD-OND). Water Research. 45 (2): 879-885.
Huck, P.M. and M.M. Sozański, 2008. Biological Filtration for Membrane Pre-treatment and
Other Applications: Towards the Development of a Practically-oriented Performance
Parameter. Journal of Water Supply: Research and Technology—AQUA. 57 (4): 203-224.
Huck, P.M., 1990. Measurement of Biodegradable Organic Matter and Bacterial Growth
Potential in Drinking Water. Journal of American Water Works Association. 82 (7): 78-86.
Huck, P.M., S. Peldszus, C. Hallé, H. Ruiz, X. Jin, M. Van Dyke, G. Amy, W. Uhl, M.
Theodoulou, D.B. Mosqueda-Jimenez, 2011. Pilot Scale Evaluation of Biofiltration as an
Innovative Pre-treatment for Ultrafiltration Membranes for Drinking Water Treatment. Water
Science & Technology: Water Supply. 11 (1): 23-29.
Huck, P.M., S. Peldszus, C. Hallé, H. Ruiz, X. Jin, M. Van Dyke, G. Amy, W. Uhl, M.
Theodoulou, and D.B. Mosqueda-Jimenez, 2011 Pilot Scale Evaluation of Biofiltration as an
Innovative Pre-Treatment for Ultrafiltration Membranes for Drinking Water Treatment.
Water Science and Technology: Water Supply. 11 (1): 23-29.
Huck, P.M., S. Zhang and M.L. Price, 1994. BOM Removal during Biological Treatment: A
First Order Model. Journal of the American Water Works Association. 86 (6): 61-71.
Jansen, R.H.S., A. Zwijnenburg, W.G.J. Van Der Meer, and M. Wessling, 2006. Outside-in
Trimming of Humic Substances during Ozonation in a Membrane Contactor. Environmental
Science and Technology. 40 (20): 6460-6465.

109
Jansen, S.A., M. Malaty, S. Nwabara, E. Johnson, E. Ghabbour, G. Davies, and J.M. Varnum,
1996. Structural Modeling in Humic Acids. Materials Science and Engineering: C,4 (3):
175-179.
Juhna, T. and E. Melin, 2006. Ozonation and Biofiltration in Water Treatment - Operational
Status and Optimization Issues. Techneau, D.5.3.1 B
http://www.techneau.org/fileadmin/files/Publications/Publications/Deliverables/D5.3.1B-
OBF.pdf. (accessed on August 10, 2013)
Kabsch-Korbutowicz, M., K. Majewska-Nowak, and T. Winnicki, 2008. Water Treatment
Using MIEX® DOC/Ultrafiltration Process. Desalination. 221 (1): 338-344.
Karnik, B.S., S.H. Davies, K.C. Chen, D.R. Jaglowski, M.J. Baumann, and S.J. Masten, 2005.
Effects of Ozonation on the Permeate Flux of Nanocrystalline Ceramic Membranes. Water
Research. 39 (4): 728-734.
Keinanen, M.M., L.K. Korhonen, M.J. Lehtola, I.T. Miettenen, P.J. Martikainen, T. Vartiainen,
M.H. Suutari, 2002. The Microbial Community Structure of Drinking Water Biofilms can be
Affected by Phosphorus Availability. Applied and Environmental Microbiology. 68 (1): 434-
439.
Kim, J., S.H. Davies, M.J. Baumann, V.V Tarabara, and S.J. Masten, 2008. Effect of Ozone
Dosage and Hydrodynamic Conditions on the Permeate Flux in a Hybrid Ozonation–Ceramic
Ultrafiltration System Treating Natural Waters. Journal of Membrane Science. 311 (1-2):
165-172.
Kirchman, D.L., and P.A. Wheeler. 1998. Uptake of Ammonium and Nitrate by Heterotrophic
Bacteria and Phytoplankton in the sub-Arctic Pacific. Deep Sea Research Part I. 45 (1998):
347–365.
110
Konieczny, K., D. Sąkol, J. Płonka, M. Rajca, and M. Bodzek, 2009. Coagulation-
Ultrafiltration System for River Water Treatment. Desalination. 240 (1-3): 151-159.
Lauderdale, C., P. Chadik, M.J. Kirisits, and J. Brown, 2012. Engineered Biofiltration:
Enhanced Biofilter Performance Through Nutrient and Peroxide Addition. Journal -
American Water Works Association. 104 (5): E298-E309.
LeChevallier, M.W., W. Schulz, W., R.G. Lee, 1991. Bacterial Nutrients in Drinking Water.
Applied and Environmental Microbiology. 57 (3): 857-862.
Lee, J.D., S.H. Lee, M.H. Jo, P.K. Park, C.H. Lee, and J.W. Kwak, 2000. Effect of Coagulation
Conditions on Membrane Filtration Characteristics in Coagulation-Microfiltration Process
for Water Treatment. Environmental Science and Technology. 34 (17): 3780-3788.
Lee, N., G. Amy, J.P. Croue, and H. Buisson, 2004. Identification and Understanding of
Fouling in Low-Pressure Membrane (MF/UF) Filtration by Natural Organic Matter (NOM).
Water Research. 38 (20): 4511-4523.
Lee, S., K. Lee, W.M. Wan, and Y. Choi, 2005. Comparison of Membrane Permeability and a
Fouling Mechanism by Pre-Ozonation Followed by Membrane Filtration and Residual Ozone
in Membrane Cells. Desalination. 178 (1-3): 287-294.
Lehman, S.G. and L. Liu, 2009. Application of Ceramic Membranes with Pre-Ozonation for
Treatment of Secondary Wastewater Effluent. Water Research. 43 (7): 2020-2028.
Lehtola, M.J., I.T. Miettinen, T. Vartiainen, and P.J. Martikainen, 2002. Changes in Content of
Microbially Available Phosphorus, Assimilable Organic Carbon and Microbial Growth
Potential During Drinking Water Treatment Processes. Water Research. 36 (15): 3681-3690.
111
Leiknes, T. and M. Lazarova, 2005. Development of a Hybrid Ozonation Biofilm-Membrane
Filatration Process for the Production of Drinking Water. Water Science & Technology. 51(6-
7): 241-248.
Li, X., G. Upadhyaya, W. Yuen, J. Brown, E. Morgenroth, and L. Raskin, L., 2010. Changes in
the Structure and Function of Microbial Communities in Drinking Water Treatment
Bioreactors upon Addition of Phosphorus. Applied and Environmental Microbiology. 76
(22): 7473-7481.
Liang, H., W. Gong, and G. Li, 2008. Performance Evaluation of Water Treatment
Ultrafiltration Pilot Plants Treating Algae-Rich Reservoir Water. Desalination. 221 (1-3):
345-350.
Lohwacharin, J., and S. Takizawa, 2009. Effects of Nanoparticles on the Ultrafiltration of
Surface Water. Journal of Membrane Science. 326 (2): 354-362.
Maartens, A., P. Swart, and E.P. Jacobs, 1999. Feed-Water Pretreatment: Methods to Reduce
Membrane Fouling by Natural Organic Matter. Journal of Membrane Science. 163 (1): 51-
62.
Makdissy, G., P.M. Huck, P., M.M. Reid, G.G. Leppard, J. Haberkamp, M. Jekel, and S.
Peldszus, 2010. Investigating the Fouling Layer of Polyamide Nanofiltration Membranes
Treating two Different Natural Waters: Internal Heterogeneity Yet Converging Surface
Properties. Journal of Water Supply: Research and Technology-AQUA. 59 (2-3): 164-178.
Matilainen, A., E.T. Gjessing, T. Lahtinen, L. Hed, A. Bhatnagar, and M. Sillanpää, 2011. An
Overview of the Methods Used in the Characterisation of Natural Organic Matter (NOM) in
Relation to Drinking Water Treatment. Chemosphere. 83 (11): 1431-1442.

112
Melin, E., B. Eikebrook, M. Brugger, H. Odegaard, 2002. Treatment of Humic Surface Water
at Cold Temperatures by Ozonation and Biofiltration. Water Science and Technology: Water
Supply. 2 (5): 451-457.
Metcalf & Eddy, 1991. Wastewater Engineering: Treatment, Disposal, and Reuse. Eds. George
Tchobanoglous, and Franklin L. Burton. McGraw-Hill, NY
Meyn, T., and T. Leiknes, 2010. Comparison of Optional Process Configurations and Operating
Conditions for Ceramic Membrane MF Coupled with Coagulation/Flocculation Pre-
Treatment for the Removal of NOM in Drinking Water Production. Journal of Water Supply:
Research and Technology-AQUA, 59 (2-3): 81-91.
Miettinen, I.T., T. Vartiainen, and P.J. Martikainen, 1997. Phosphorus and Bacterial Growth in
Drinking Water. Applied and Environmental Microbiology. 63 (8): 3242-3245.
Ministry of the Environment, 2012. Water Quality in Ontario, 2012 Report. PIBS# 9493e,
www.ene.gov.on.ca/environment/en/resources/STDPROD_108596.html (accessed on
October 3, 2013)
Mohamed, M., T. Howell, and A. Todd. 2009. Water Quality on the Shores of Lake Huron
Adjacent to the Saugeen , Maitland , and Bayfield River Mouths. Ontario Ministry of the
Environment, Environmental Monitoring and Reporting Branch.
http://www.healthylakehuron.ca/docs/Water_Quality_on_the_ShoresOfLakeHuron_2003_No
v09.pdf (accessed on October 24, 2013)
Mori, Y., T. Oota, M. Hashino, M. Takamura, and Y. Fujii, 1998. Ozone-Microfiltration
System. Desalination, 117 (1-3): 211-218.
Mosqueda-Jimenez, D.B., and P.M. Huck, 2006. Characterization of Membrane Foulants in
Drinking Water Treatment. Desalination. 198 (1-3): 173-182.
113
Mozia, S., M. Tomaszewska, and A.W. Morawski, 2006. Application of an Ozonation–
Adsorption–Ultrafiltration System for Surface Water Treatment. Desalination, 190 (1-3):
308-314.
Nghiem, L.D., A.I. Schäfer, and M. Elimelech, 2005. Pharmaceutical Retention Mechanisms
by Nanofiltration Membranes. Environmental Science & Technology, 39 (19): 7698-7705.
Nishijima, W., E. Shoto, and M. Okada, M., 1997. Improvement of Biodegradation of Organic
Substance by Addition of Phosphorus in Biological Activated Carbon. Water Science and
Technology. 36 (12): 251-257.
Ødegaard, H., S. Østerhus, E. Melin, and B. Eikebrokk, 2010. NOM Removal Technologies–
Norwegian Experiences. Drinking Water Engineering and Science, 3 (1): 1-9.
Park, J., S. Takizawa, H. Katayama, and S. Ohgaki, 2002. Biofilter Pretreatment for the Control
of Microfiltration Membrane Fouling. Water Supply, 2 (2): 193-199.
Peiris, R.H., C. Hallé, H. Budman, C. Moresoli, S. Peldszus, P.M. Huck, and R.L. Legge, 2010.
Identifying Fouling Events in a Membrane-based Drinking Water Treatment Process Using
Principal Component Analysis of Fluorescence Excitation-emission Matrices. Water
Research. 44 (1): 185-194.
Peldszus, S., C. Hallé, R.H. Peiris R.H., M. Hamouda, X. Jin, R.L. Legge, H. Budman, C.
Moresoli, and P.M. Huck, 2011. Reversible and Irreversible Low-Pressure Membrane
Foulants in Drinking Water Treatment: Identification by Principal Component Analysis of
Flourescence EEM and Mitigation by Biofiltration Pretreatment. Water Research. 45 (16):
5161-5170.

114
Peldszus, S., J. Benecke, M. Jekel, and P.M. Huck, 2012. Direct Biofiltration Pretreatment for
Fouling Control of Ultrafiltration Membranes. Journal of American Water Works
Association. 104 (7): E430-E445.
Persson, F., G. Heinicke, W. Uhl, T. Hedberg, and M. Hermansson, 2006. Performance of
Direct Biofiltration of Surface Water for Reduction of Biodegradable Organic Matter and
Biofilm Formation Potential. Environmental Technology. 27 (9): 1037-1045.
Polanska, M., K. Huysman, C. Van Keer, 2005. Investigation of Microbially Available
Phosphorus (MAP) in Flemish Drinking Water. Water Research. 39 (11): 2267-2272.
Potter, B.B., and J.C. Wimsatt, 2005. Method 415.3: Determination of Total Organic Carbon
and Specific UV Absorbance at 254 nm in Source Water and Drinking Water. US
Environmental Protection Agency, Cincinnati. Doc# EPA/600/R-09/122
Ratajczak, M.J., K.N. Exall, and P.M. Huck, P. M., 2012. Factors Affecting Coagulation as a
Pretreatment to Ultrafiltration Membranes. Water Quality Research Journal of Canada. 47
(2): 103-116.
Redfield, A.C., 1934. On the Proportions of Organic Derivatives in Sea Water and their
Relation to the Composition of Plankton. Pages 176-192 in James Johnstone Memorial
Volume, edited by R.J. Daniel. Liverpool University Press, Liverpool, U.K.
Redfield, A.C., 1958. The Biological Control of Chemical Factors in the Environemnt.
American Scientist. 46 (3): 205–221.
Rittman, B.E., and P.L. McCarty, 2001. Environmental Biotechnology: Principles and
Applications. McGraw-Hill, Boston, Massachusetts.
Rittmann, B.E. and P.M. Huck, 1989. Biological Treatment of Public Water Supplies. Critical
Reviews in Environmental Science and Technology. 19 (2): 119-184.

115
Rittmann, B.E., 1995. Fundamentals and Applications of Biofilm Processes in Drinking Water
Treatment. Handbook of Environmental Chemistry. 5: 61-87.
Sang, J., X. Zhang, L. Li, and Z. Wang, 2003. Improvement of Organics Removal by Bio-
Ceramic Filtration of Raw Water with Addition of Phosphorus. Water Research. 37 (19):
4711-4718.
Sartor, M., B. Schlichter, H. Gatjal, and V. Mavrov, 2008. Demonstration of a New Hybrid
Process for the Decentralised Drinking and Service Water Production from Surface Water in
Thailand. Desalination. 222 (1-3): 528-540.
Sathasivan, A., S. Ohgaki, 1999. Application of New Bacterial Regrowth Potential Method for
Water Distribution System – a Clear Evidence of Phosphorus Limitation. Water Research. 33
(1): 137-144.
Saugeen Valley Conservation Authority, 2008. Lower Main Saugeen River Watershed 2008
Report Card. Hanover, Ontario.
http://www.saugeenconservation.com/downloads/Lower_Main_2.pdf. (accessed on October
6, 2013)
Saugeen Valley Conservation Authority, 2011a. Saugeen Conservation Water Quality Data
Summary Report 2010, Ontario.
http://www.saugeenconservation.com/downloads/SaugeenConservation_WaterQualityDataS
ummaryReport2010.pdf. (accessed on April 18, 2013)
Saugeen Valley Conservation Authority, 2011b. Saugeen Conservation Water Quality Status
Report 2010. Ontario.
http://www.saugeenconservation.com/downloads/SaugeenConservation_WaterQualityStatus
Report2010.pdf. (accessed on April 18, 2013)

116
Schäfer, A.I., A.G. Fane, and T.D. Waite, 2001. Cost Factors and Chemical Pretreatment
Effects in the Membrane Filtration of Waters Containing Natural Organic Matter. Water
Research. 35 (6): 1509-1517.
Schlichter, B., V. Mavrov, and H. Chmiel, 2004. Study of a Hybrid Process Combining
Ozonation and Microfiltration/Ultrafiltration for Drinking Water Production from Surface
Water. Desalination, 168 (1-3): 307-317.
Servais, P., A. Anzil, and C. Ventresque, 1989. Simple Method for Determination of Water
Simple Method for Determination of Biodegradable Dissolved Organic Carbon in Water.
Applied and Environmental Microbiology. 55 (10): 10–13.
Servais, P., B. Gilles, C. Ventresque, and G.P. Bablon, 1991. Microbial Activity in GAC Filters
at the Choisy-le-Roi Treatment Plant. Journal - American Water Works Association. 83 (2):
62-68.
Servais, P., G. Billen, P. Bouillot, and M. Benezet, 1992. A Pilot Study of Biological GAC
Filtration in Drinking-Water Treatment. Journal of Water Supply: Research and Technology-
AQUA. 41 (3): 163-168.
Servais, P., G. Billen,and P. Bouillot, 1994. Biological Colonization of Granular Activated
Carbon Filters in Drinking-Water Treatment. Journal of Environmental Engineering. 120 (4):
888-899.
Simon, F.X., E. Rudé, E. Berdalet, J. Llorens, and S. Baig, 2013. Effects of Inorganic Nitrogen
(NH₄Cl) and Biodegradable Organic Carbon (CH₃COONa) Additions on a Pilot-scale
Seawater Biofilter. Chemosphere. 91 (9): 1297–303.
Sobeck, D.C., and M.J. Higgins, 2002. Examination of Three Theories for Mechanisms of
Cation-induced Bioflocculation. Water Research. 36 (3): 527-538.

117
Song, Y., B. Dong, N. Gao, and S. Xia, 2010. Huangpu River Water Treatment by
Microfiltration with Ozone Pretreatment. Desalination. 250 (1): 71-75.
Stubbereld, L.C.F. and P.J.A Shaw, 1990. A Comparison of Tetrazolium Reduction and FDA
Hydrolysis with Other Measurements of Microbial activity. Journal of Microbiological
Methods. 12 (3): 151-162.
Thurman, E.M., 1985. Organic Geochemistry of Natural Waters. Nijhoff/Junk Publ.,
Dordrecht, Netherlands.
Thurman, E.M., R.L. Wershaw, R.L. Malcolm, and D.J. Pinckney, 1982. Molecular Size of
Aquatic Humic Substances. Organic Geochemistry. 4 (1): 27-35.
Treguer, R., R. Tatin, A. Couvert, D. Wolbert, and A. Tazi-Pain, 2010. Ozonation Effect on
Natural Organic Matter Adsorption and Biodegradation–Application to a Membrane
Bioreactor Containing Activated Carbon for Drinking Water Production. Water Research, 44
(3): 781-788.
Tsujimoto, W., H. Kimura, T. Izu, and T. Irie, 1998. Membrane Filtration and Pre-Treatment
by GAC. Desalination, 119 (1-3): 323-326.
Urfer, D., and P.M. Huck, 2001. Measurement of Biomass Activity in Drinking Water
Biofilters Using a Respirometric Method. Water Research. 35 (6): 1469-1477.
Urfer, D., P.M. Huck, S.D.J. Booth, and B.M. Coffey, 1997. Biological Filtration for BOM and
Particle Removal: A Critical Review. Journal of the American Water Works Association. 89
(12): 83-98.
USPEA, 1992. Control of Biofilm Growth in Drinking Water Distribution System. United
States Environmental Protection Agency, Washington DC.
http://nepis.epa.gov/Adobe/PDF/30004JBW.pdf

118
Vahala, R., V. Moramarco, R.M. Niemi, J. Rintala, and R. Laukkanen, 1998. The Effects of
nutrients on Natural Organic Matter (NOM) Removal in Biological Activated Carbon (BAC)
Filtration. Acta hydrochimica et hydrobiologica. 26 (3): 196-199.
van der Kooij, D. 1992. Assimilable Organic Carbon as an Indicator of Bacterial Regrowth.
Journal - American Water Works Association. 84 (2): 57-65.
Van Der Kooij, D., A. Visser, and W.A.M. Hijnen, 1982. Determining the concentration of
easily assimilable organic carbon in drinking water. Journal of the American Water Works
Association. 74 (10): 540-545.
Van Geluwe, S., L. Braeken, and B. Van der Bruggen, 2011. Ozone Oxidation for the
Alleviation of Membrane Fouling by Natural Organic Matter: A Review. Water Research, 45
(12): 3551-3570.
Van Geluwe, S., L. Braeken, C. Vinckier, and B. Van der Bruggen, 2009. Ozonation and
Perozonation of Humic Acids in Nanofiltration Concentrates. Desalination and Water
Treatment. 6 (1-3): 217-221.
Velten, S., M. Boller, O. Köster, J. Helbing, H. Weilenmann, and F. Hammes, 2011.
Development of Biomass in a Drinking Water Granular Active Carbon (GAC) Filter. Water
Research. 45 (19): 6347-6354.
Von Gunten, U., 2003. Ozonation of Drinking Water: Part I. Oxidation Kinetics and Product
Formation. Water Research. 37 (7): 1443-1467.
Wang, J.Z., R.S. Summers, and R.J. Miltner, 1995. Biofiltration Performance: Part 1,
Relationship to Biomass. Journal – American Water Works Association. 87 (12): 55-63.
Wang, Y., R.I. Hollingsworth, and D.L. Kasper, 1999. Ozonolytic Depolymerization of
Polysaccharides in Aqueous Solution. Carbohydrate Research. 319 (1-4), 141-147.

119
Wetzel, R.G., 1975. Limnology. WB Saunders Company. Philadelphia.
Xiang, H., X. Lu, X., L. Yin, F. Yang, G. Zhu, and W. Liu, 2013. Microbial Community
Characterization, Activity Analysis and Purifying Efficiency in a Biofilter Process. Journal
of Environmental Sciences. 25 (4): 677-687.
Yu, X., X. Zhang, X. Liu, X. Zhao, and Z. Wang, 2003. Phosphorus Limitation in Biofiltration
for Drinking Water Treatment. Journal of Environmental Sciences. 15 (4): 494-499.
Yu, X., Z. Qi, X. Zhang, P. Yu, B. Liu, L. Zhang, and L. Fu, 2007. Nitrogen Loss and Oxygen
Paradox in Full-scale Biofiltration for Drinking Water Treatment. Water Research. 41 (7):
1455-1464.
Zhang, S. and P.M. Huck, 1996. Removal of AOC in Biological Water Treatment Processes: A
Kinetic Modeling Approach. Water Research. 30 (5):1195-1207.

120
Appendix A
Schematic and Photos of the Set-up

121
Figure A-1: Schematic drawing of experimental set-up
Drain
P
RF1 RF2
BF1 BF2
Fw1 Fw2
Pumped
Biofilter
Effluent
BF = biofilter
F = flowmeter (w = water; a = air)
P= pump; Pd = dosing pump
PLC = programmable logic controller
RF = roughing filter
S = solenoid valve
Raw
Water
Pressurized
Air
Overflow
Sair
Sdrain
Sfill
Membrane
Overhead
Feed Tank
Data Logger
Temperature
Sensor
P
Pressure
Transducer Permeate
Volume
Measureme
nt
Pd
P-dosing
Tank
PLC
Fa1
P BF2
Eff.
BF1
Eff.

122
Figure A-2: Fresh sand and anthracite media in the glass columns

123
Figure A-3: Roughing filters with gravel as media
Figure A-4: Phosphorus dosing pump and solution holding tank
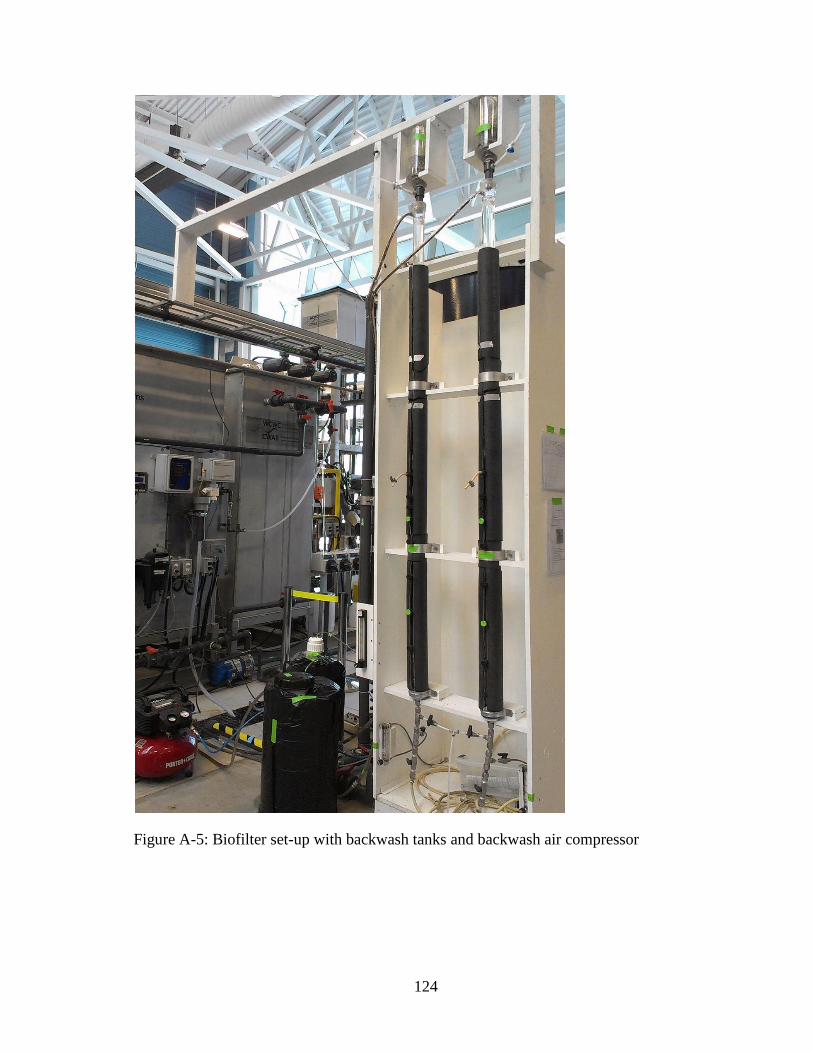
124
Figure A-5: Biofilter set-up with backwash tanks and backwash air compressor
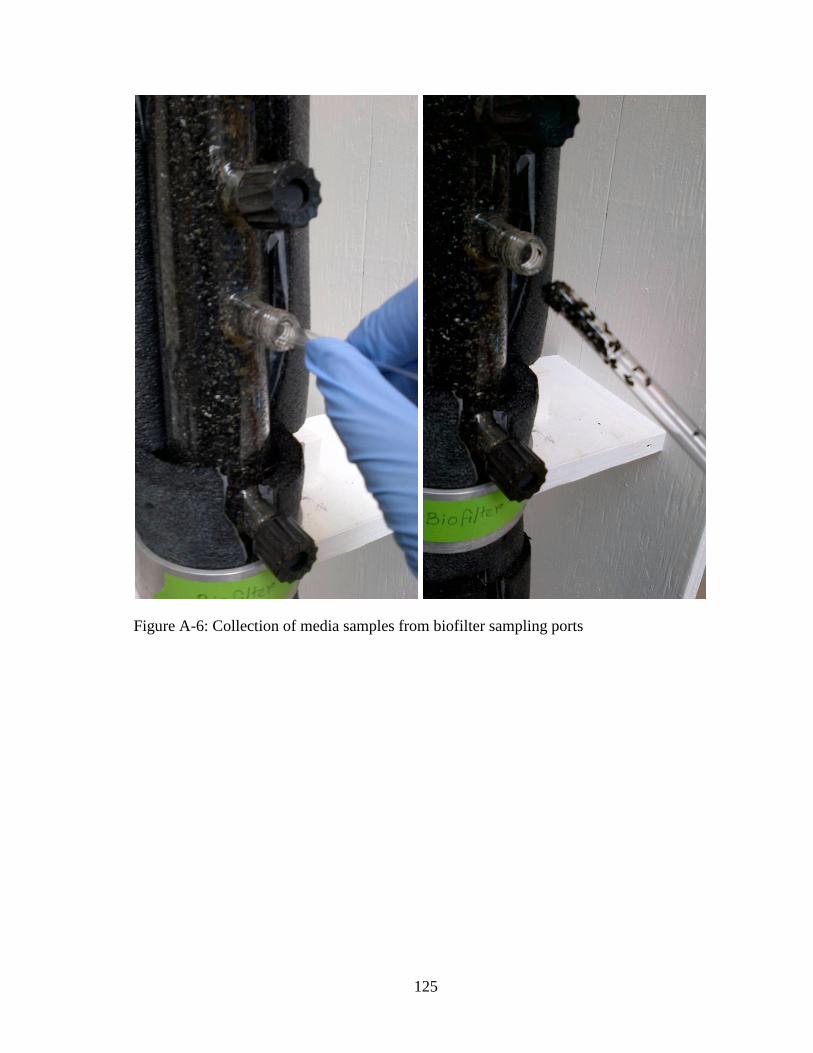
125
Figure A-6: Collection of media samples from biofilter sampling ports

126
Figure A-7: Membrane set-up

127
Figure A-8: Membrane set-up parts- membrane holder tank, water flow-meter, permeation
pump, temperature sensor, data logger
Figure A-9: Membrane set-up flow measurement system
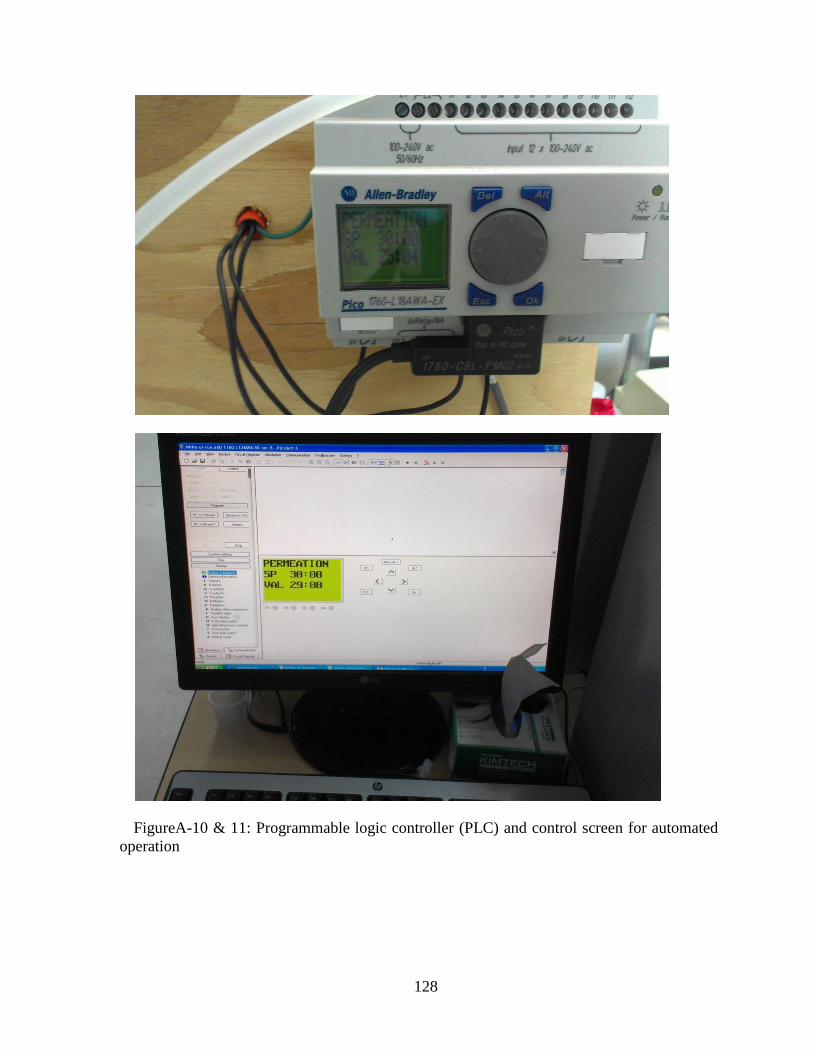
128
FigureA-10 & 11: Programmable logic controller (PLC) and control screen for automated
operation

129
Figure A-12: ZW-1 bench scale membrane unit
Figure A-13: Fouled membrane unit before chemical cleaning

130
Appendix B
Media Specifications
Media sieve analysis: Anthracite
# Sieves: 7, 10, 20, 40, 60, 100, 200
Material wt. (initial): 500 g
Gradation Table:
Sieve ID Opening
(mm)
Individual
wt. retained (g)
Cumulative
wt. retained (g)
Cumulative
% retained
% passing
7 2.800 0.1 0.1 0.02 99.98
10 2.000 24.2 24.3 4.86 95.14
20 0.850 458.2 482.5 96.60 3.40
40 0.425 16.6 499.1 99.92 0.08
60 0.250 0.4 499.5 100.00 0.00
100 0.150 0 499.5 100.00 0.00
200 0.075 0 499.5 100.00 0.00
Pan 0.000 0 499.5 100.00 0.00
Total= 499.5
Error %= 0.001
Gradation Graph:
Effective size: D10 = 0.9 mm
0
10
20
30
40
50
60
70
80
90
100
0.010 0.100 1.000 10.000
% p
assi
ng
particle size(mm)
Sieve analysis of Anthracite

131
Uniformity coefficient = D60/D10 = 1.5/ 0.9 = 1.6
Sand (Anthrafilter, Brantford, Ontario)
Effective size: 0.5 mm
Uniformity coefficient 1.5

132
Appendix C
Raw Water Quality Data D
ate
Tem
per
ature
(°C
)
pH
Turb
idit
y (
NT
U)
TO
C (
mg/L
)
DO
C (
mg/L
)
UV
254 (
cm -
1)
SU
VA
(L
/mg
-M)
Tota
l H
ardnes
s
(mg/L
as
CaC
O3)
Alk
alin
ity (
mg/L
as C
aCO
3)
Conduct
ivit
y
(µS
/cm
)
20-Mar-12 12.2 7.89 4.96 4.88 0.171 3.50 182 384
03-Apr-12 15 8 4.93 4.83 0.143 2.97 241 520
17-Apr-12 13.4 7.92 4.04 3.96 0.097 2.45 258 573
03-May-12 14.4 8.23 5.96 4.51 4.33 0.133 3.07 236 530
17-May-13 17.2 8 3.50 4.85 4.88 0.150 3.08 244 554
31-May-12 22.5 8.03 1.34 3.73 3.38 0.121 3.59 242 572
19-Jun-12 23.6 7.98 1.60 3.76 3.83 0.106 2.78 334 226 580
28-Jun-12 22.5 7.98 3.70 3.41 3.34 0.094 2.80 346 222 609
12-Jul-12 23 7.91 1.50 2.96 2.77 0.077 2.77 358 216
26-Jul-12 23.6 8.12 0.71 2.85 2.73 0.071 2.59 372 212 676
09-Aug-12 22.6 8.16 1.12 3.11 3.09 0.085 2.76 364 214 657
23-Aug-13 21.8 8.16 3.54 3.69 3.39 0.099 2.93 352 218 636
06-Sep-12 22 7.76 0.74 2.97 2.99 0.079 2.65 370 216 690
20-Sep-12 18.2 8.03 3.50 3.42 0.090 2.62 364 220 656
02-Oct-12 20.3 8.06 6.21 3.04 2.92 0.087 2.98 352 224 560
15-Oct-12 17.7 8.15 1.31 3.14 2.95 0.084 2.85 374 234 580
02-Nov-12 17.5 8.16 4.82 5.59 5.50 0.182 3.31 352 236 542

133
Dat
e
Tem
per
ature
(°C
)
pH
Turb
idit
y (
NT
U)
TO
C (
mg/L
)
DO
C (
mg/L
)
UV
254 (
cm -
1)
SU
VA
(L
/mg
-M)
Tota
l H
ardnes
s
(mg/L
as
CaC
O3)
Alk
alin
ity (
mg/L
as C
aCO
3)
Conduct
ivit
y
(µS
/cm
)
12-Nov-12 16.4 8.13 9.93 7.29 7.03 0.239 3.40 330 238 650
26-Nov-12 13.2 7.97 6.41 5.19 5.16 0.167 3.24 380 256 602
10-Dec-12 13.8 8.07 4.28 5.60 5.46 0.195 3.57 338 236 611
04-Feb-13 13.7 7.97 17.90 6.61 6.52 0.205 3.14 200 156 323
11-Feb-13 10.5 7.96 8.72 5.38 5.21 0.125 2.40 276 206 419
25-Feb-13 8.27 5.06 4.67 4.61 0.135 2.93 308 238 475
04-Mar-13 9.7 8.14 15.00 4.34 4.31 0.122 2.83 328 246 477
18-Mar-13 15.2 8.02 6.84 5.04 4.85 0.152 3.14 272 212 411
03-Apr-13 14.4 8 4.27 4.99 4.84 0.152 3.14 272 220 400
15-Apr-13 15.5 8.39 4.65 4.58 0.152 3.31 410
29-Apr-13 16.1 7.88 11.60 5.65 5.40 0.166 3.07 250 214 368
16-May-13 19.4 8.05 10.40 4.74 4.68 0.156 3.33 306 240 489
23-May-13 19.9 8.28 4.67 4.59 4.23 0.157 3.72 322 252 521
30-May-13 19.8 8.16 6.06 5.10 5.07 0.184 3.62 318 248 520
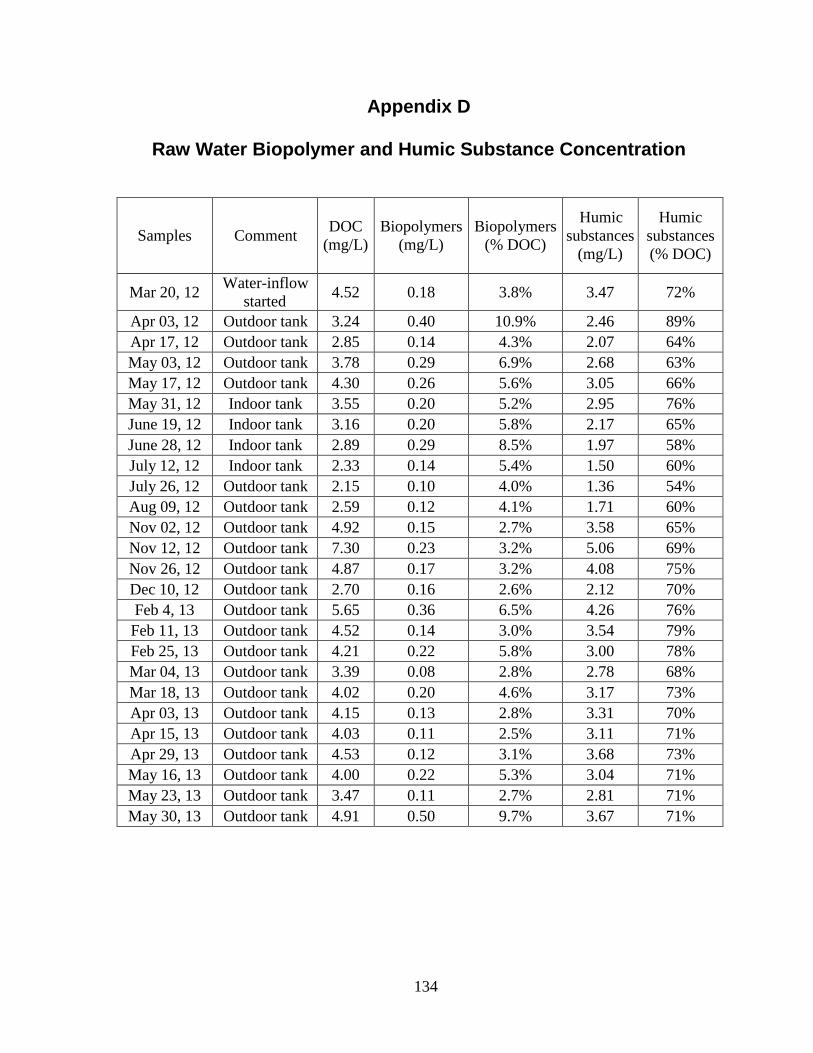
134
Appendix D
Raw Water Biopolymer and Humic Substance Concentration
Samples Comment DOC
(mg/L)
Biopolymers
(mg/L)
Biopolymers
(% DOC)
Humic
substances
(mg/L)
Humic
substances
(% DOC)
Mar 20, 12 Water-inflow
started 4.52 0.18 3.8% 3.47 72%
Apr 03, 12 Outdoor tank 3.24 0.40 10.9% 2.46 89%
Apr 17, 12 Outdoor tank 2.85 0.14 4.3% 2.07 64%
May 03, 12 Outdoor tank 3.78 0.29 6.9% 2.68 63%
May 17, 12 Outdoor tank 4.30 0.26 5.6% 3.05 66%
May 31, 12 Indoor tank 3.55 0.20 5.2% 2.95 76%
June 19, 12 Indoor tank 3.16 0.20 5.8% 2.17 65%
June 28, 12 Indoor tank 2.89 0.29 8.5% 1.97 58%
July 12, 12 Indoor tank 2.33 0.14 5.4% 1.50 60%
July 26, 12 Outdoor tank 2.15 0.10 4.0% 1.36 54%
Aug 09, 12 Outdoor tank 2.59 0.12 4.1% 1.71 60%
Nov 02, 12 Outdoor tank 4.92 0.15 2.7% 3.58 65%
Nov 12, 12 Outdoor tank 7.30 0.23 3.2% 5.06 69%
Nov 26, 12 Outdoor tank 4.87 0.17 3.2% 4.08 75%
Dec 10, 12 Outdoor tank 2.70 0.16 2.6% 2.12 70%
Feb 4, 13 Outdoor tank 5.65 0.36 6.5% 4.26 76%
Feb 11, 13 Outdoor tank 4.52 0.14 3.0% 3.54 79%
Feb 25, 13 Outdoor tank 4.21 0.22 5.8% 3.00 78%
Mar 04, 13 Outdoor tank 3.39 0.08 2.8% 2.78 68%
Mar 18, 13 Outdoor tank 4.02 0.20 4.6% 3.17 73%
Apr 03, 13 Outdoor tank 4.15 0.13 2.8% 3.31 70%
Apr 15, 13 Outdoor tank 4.03 0.11 2.5% 3.11 71%
Apr 29, 13 Outdoor tank 4.53 0.12 3.1% 3.68 73%
May 16, 13 Outdoor tank 4.00 0.22 5.3% 3.04 71%
May 23, 13 Outdoor tank 3.47 0.11 2.7% 2.81 71%
May 30, 13 Outdoor tank 4.91 0.50 9.7% 3.67 71%
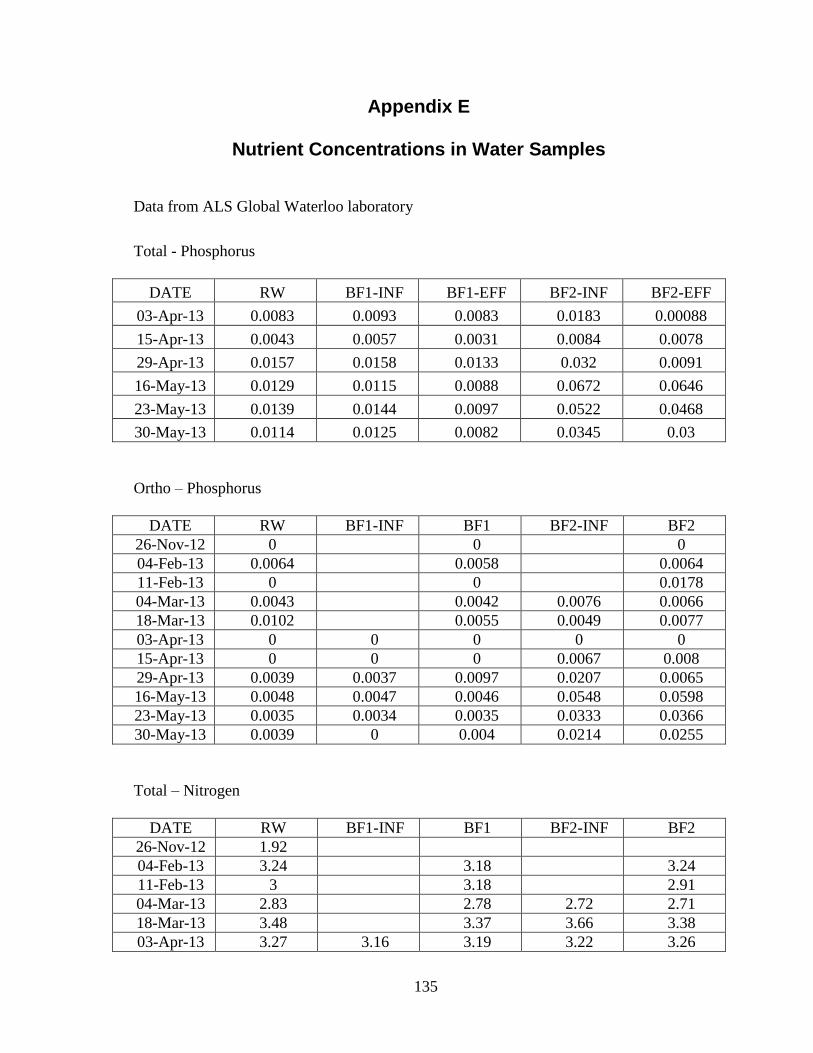
135
Appendix E
Nutrient Concentrations in Water Samples
Data from ALS Global Waterloo laboratory
Total - Phosphorus
DATE RW BF1-INF BF1-EFF BF2-INF BF2-EFF
03-Apr-13 0.0083 0.0093 0.0083 0.0183 0.00088
15-Apr-13 0.0043 0.0057 0.0031 0.0084 0.0078
29-Apr-13 0.0157 0.0158 0.0133 0.032 0.0091
16-May-13 0.0129 0.0115 0.0088 0.0672 0.0646
23-May-13 0.0139 0.0144 0.0097 0.0522 0.0468
30-May-13 0.0114 0.0125 0.0082 0.0345 0.03
Ortho – Phosphorus
DATE RW BF1-INF BF1 BF2-INF BF2
26-Nov-12 0 0 0
04-Feb-13 0.0064 0.0058 0.0064
11-Feb-13 0 0 0.0178
04-Mar-13 0.0043 0.0042 0.0076 0.0066
18-Mar-13 0.0102 0.0055 0.0049 0.0077
03-Apr-13 0 0 0 0 0
15-Apr-13 0 0 0 0.0067 0.008
29-Apr-13 0.0039 0.0037 0.0097 0.0207 0.0065
16-May-13 0.0048 0.0047 0.0046 0.0548 0.0598
23-May-13 0.0035 0.0034 0.0035 0.0333 0.0366
30-May-13 0.0039 0 0.004 0.0214 0.0255
Total – Nitrogen
DATE RW BF1-INF BF1 BF2-INF BF2
26-Nov-12 1.92
04-Feb-13 3.24 3.18 3.24
11-Feb-13 3 3.18 2.91
04-Mar-13 2.83 2.78 2.72 2.71
18-Mar-13 3.48 3.37 3.66 3.38
03-Apr-13 3.27 3.16 3.19 3.22 3.26

136
DATE RW BF1-INF BF1 BF2-INF BF2
15-Apr-13 3.12 3.12 3.23 3.11 3.11
29-Apr-13 2.5 2.64 2.5 2.49 4.25
16-May-13 1.99 1.96 2.06 2.06 1.91
23-May-13 2.32 2.26 2.45 2.28 2.19
30-May-13 2.09 2.19 2.2 2.04 2.62
Nitrate – N
DATE RW BF1-INF BF1 BF2-INF BF2
26-Nov-12 1.35
04-Feb-13 2.64 2.65 2.64
11-Feb-13 2.53 2.58 2.36
04-Mar-13 2.37 2.34 2.32 2.32
18-Mar-13 2.94 2.91 2.91 2.92
03-Apr-13 2.78 2.79 2.79 2.78 2.89
15-Apr-13 2.8 2.8 2.8 2.8 2.78
29-Apr-13 2.01 2.01 2.01 1.99 1.96
16-May-13 1.54 1.53 1.54 1.5 1.47
23-May-13 1.96 1.96 1.97 1.92 1.92
30-May-13 1.7 1.7 1.7 1.67 1.68
TKN
DATE RW BF1-INF BF1 BF2-INF BF2
26-Nov-12 0.57
04-Feb-13 0.6 0.53 0.6
11-Feb-13 0.47 0.6 0.55
04-Mar-13 0.46 0.44 0.4 0.39
18-Mar-13 0.54 0.46 0.75 0.46
03-Apr-13 0.49 0.37 0.4 0.44 0.37
15-Apr-13 0.32 0.32 0.43 0.31 0.33
29-Apr-13 0.49 0.63 0.49 0.5 2.29
16-May-13 0.45 0.43 0.52 0.56 0.44
23-May-13 0.36 0.3 0.48 0.36 0.27
30-May-13 0.39 0.49 0.5 0.37 0.94
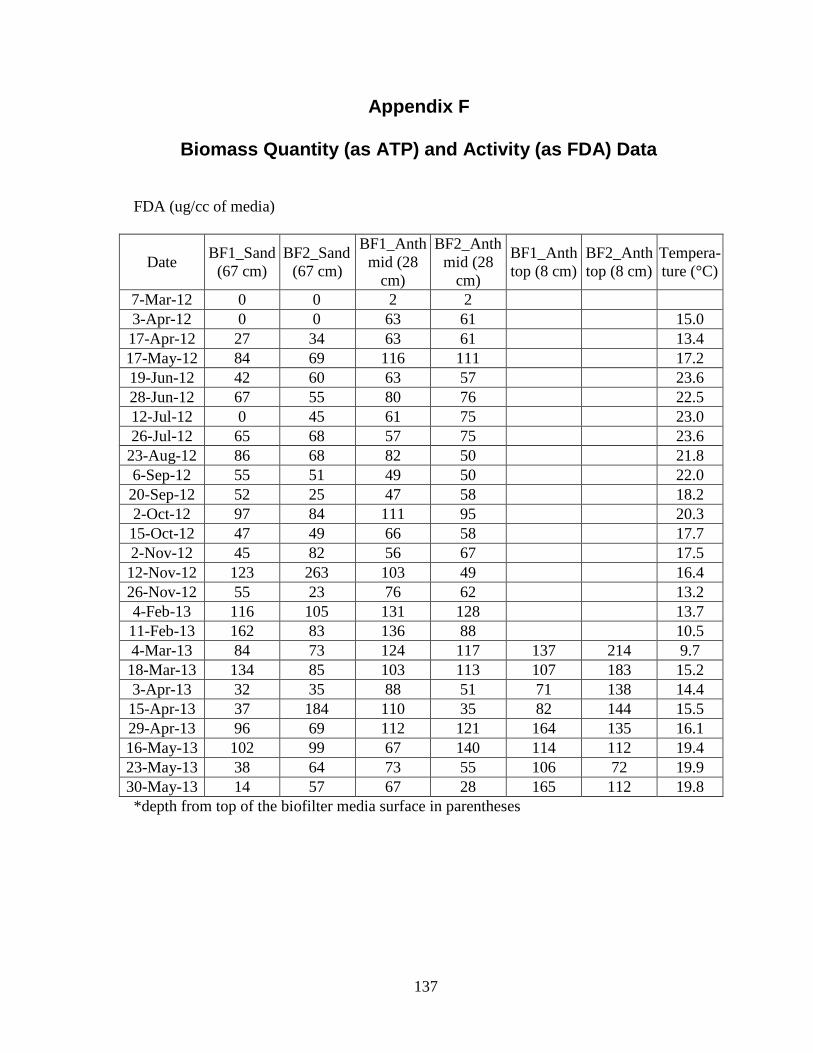
137
Appendix F
Biomass Quantity (as ATP) and Activity (as FDA) Data
FDA (ug/cc of media)
Date BF1_Sand
(67 cm)
BF2_Sand
(67 cm)
BF1_Anth
mid (28
cm)
BF2_Anth
mid (28
cm)
BF1_Anth
top (8 cm)
BF2_Anth
top (8 cm)
Tempera-
ture (°C)
7-Mar-12 0 0 2 2
3-Apr-12 0 0 63 61 15.0
17-Apr-12 27 34 63 61 13.4
17-May-12 84 69 116 111 17.2
19-Jun-12 42 60 63 57 23.6
28-Jun-12 67 55 80 76 22.5
12-Jul-12 0 45 61 75 23.0
26-Jul-12 65 68 57 75 23.6
23-Aug-12 86 68 82 50 21.8
6-Sep-12 55 51 49 50 22.0
20-Sep-12 52 25 47 58 18.2
2-Oct-12 97 84 111 95 20.3
15-Oct-12 47 49 66 58 17.7
2-Nov-12 45 82 56 67 17.5
12-Nov-12 123 263 103 49 16.4
26-Nov-12 55 23 76 62 13.2
4-Feb-13 116 105 131 128 13.7
11-Feb-13 162 83 136 88 10.5
4-Mar-13 84 73 124 117 137 214 9.7
18-Mar-13 134 85 103 113 107 183 15.2
3-Apr-13 32 35 88 51 71 138 14.4
15-Apr-13 37 184 110 35 82 144 15.5
29-Apr-13 96 69 112 121 164 135 16.1
16-May-13 102 99 67 140 114 112 19.4
23-May-13 38 64 73 55 106 72 19.9
30-May-13 14 57 67 28 165 112 19.8
*depth from top of the biofilter media surface in parentheses
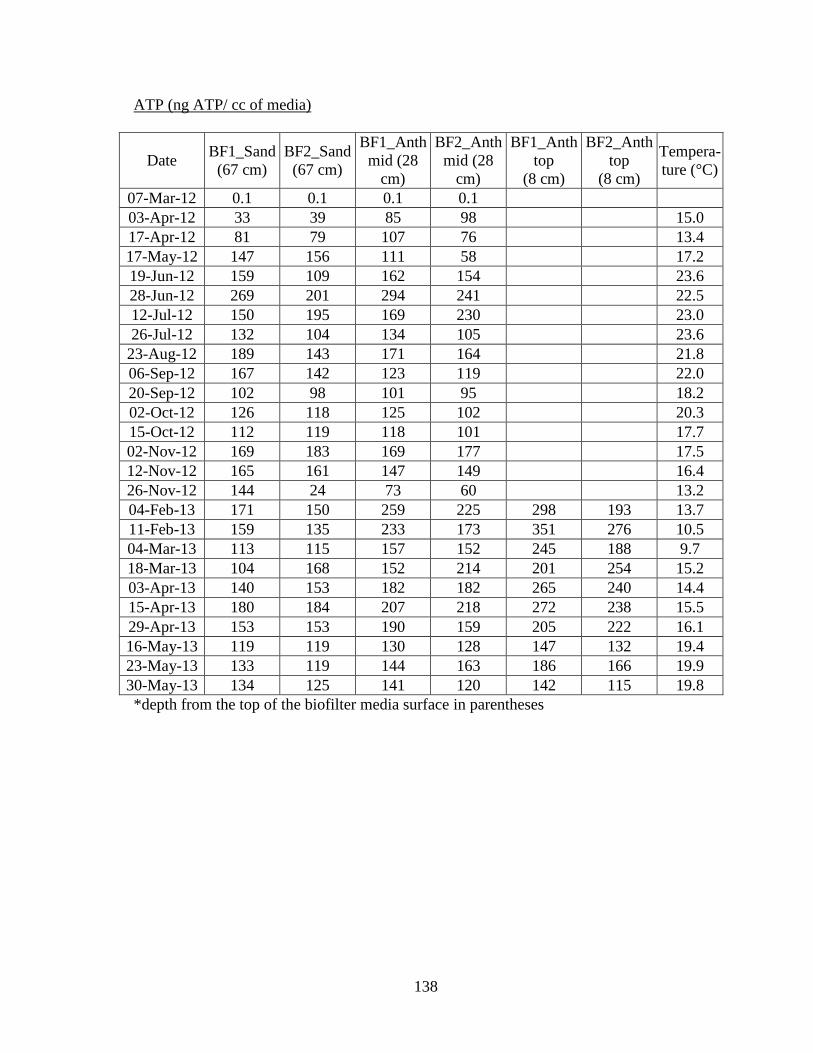
138
ATP (ng ATP/ cc of media)
Date BF1_Sand
(67 cm)
BF2_Sand
(67 cm)
BF1_Anth
mid (28
cm)
BF2_Anth
mid (28
cm)
BF1_Anth
top
(8 cm)
BF2_Anth
top
(8 cm)
Tempera-
ture (°C)
07-Mar-12 0.1 0.1 0.1 0.1
03-Apr-12 33 39 85 98 15.0
17-Apr-12 81 79 107 76 13.4
17-May-12 147 156 111 58 17.2
19-Jun-12 159 109 162 154 23.6
28-Jun-12 269 201 294 241 22.5
12-Jul-12 150 195 169 230 23.0
26-Jul-12 132 104 134 105 23.6
23-Aug-12 189 143 171 164 21.8
06-Sep-12 167 142 123 119 22.0
20-Sep-12 102 98 101 95 18.2
02-Oct-12 126 118 125 102 20.3
15-Oct-12 112 119 118 101 17.7
02-Nov-12 169 183 169 177 17.5
12-Nov-12 165 161 147 149 16.4
26-Nov-12 144 24 73 60 13.2
04-Feb-13 171 150 259 225 298 193 13.7
11-Feb-13 159 135 233 173 351 276 10.5
04-Mar-13 113 115 157 152 245 188 9.7
18-Mar-13 104 168 152 214 201 254 15.2
03-Apr-13 140 153 182 182 265 240 14.4
15-Apr-13 180 184 207 218 272 238 15.5
29-Apr-13 153 153 190 159 205 222 16.1
16-May-13 119 119 130 128 147 132 19.4
23-May-13 133 119 144 163 186 166 19.9
30-May-13 134 125 141 120 142 115 19.8
*depth from the top of the biofilter media surface in parentheses
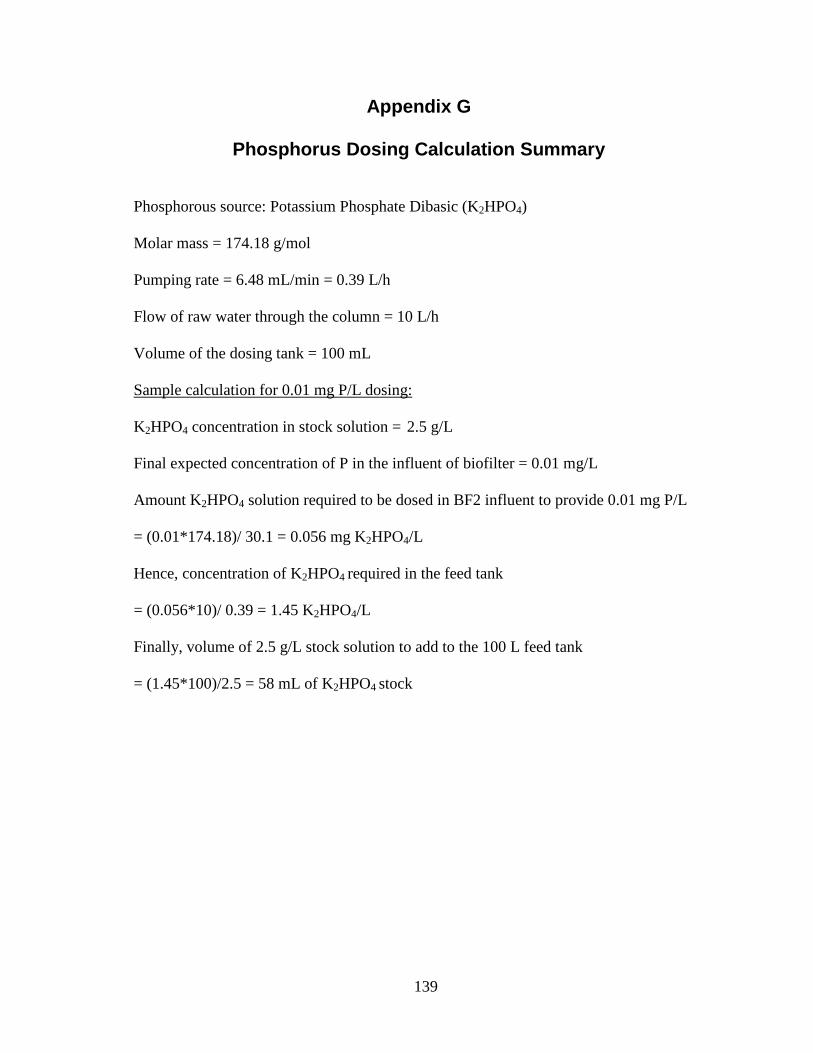
139
Appendix G
Phosphorus Dosing Calculation Summary
Phosphorous source: Potassium Phosphate Dibasic (K2HPO4)
Molar mass = 174.18 g/mol
Pumping rate = 6.48 mL/min = 0.39 L/h
Flow of raw water through the column = 10 L/h
Volume of the dosing tank = 100 mL
Sample calculation for 0.01 mg P/L dosing:
K2HPO4 concentration in stock solution = 2.5 g/L
Final expected concentration of P in the influent of biofilter = 0.01 mg/L
Amount K2HPO4 solution required to be dosed in BF2 influent to provide 0.01 mg P/L
= (0.01*174.18)/ 30.1 = 0.056 mg K2HPO4/L
Hence, concentration of K2HPO4 required in the feed tank
= (0.056*10)/ 0.39 = 1.45 K2HPO4/L
Finally, volume of 2.5 g/L stock solution to add to the 100 L feed tank
= (1.45*100)/2.5 = 58 mL of K2HPO4 stock

140
Appendix H
List of Publications
Refereed Journal Articles (Submitted)
Rahman, I., S. Ndiongue, X. Jin, M.I. Van Dyke, W.B. Anderson, and P.M. Huck, 2013.
Fouling of Low Pressure Membranes during Drinking Water Treatment: Effect of NOM
Components and Biofiltration Pretreatment. Water Science and Technology: Water Supply.
Accepted for publication.
Conference Proceedings/ Presentations (Abstract Reviewed)
Rahman, I., S. Ndiongue, X. Jin, L.F. Moore, M.I. Van Dyke, W.B. Anderson, and P.M.
Huck, 2013. Biofiltration as a Pretreatment to Control Low Pressure Membrane Fouling
during drinking Water Treatment. Proceedings, the 2013 OWWA/OMWA Joint Annual
Conference and Trade Show, Ottawa, Ontario. MON-03 (University Research).
Rahman, I., X. Jin, S. Ndiongue, L.F. Moore, W.B. Anderson, and P.M. Huck, 2013.
Biofiltration as a Pretreatment to Control Membrane Fouling during Drinking Water
Treatment. Proceedings, AWWA's 2013 Biological Treatment Symposium, Denver,
Colorado. THU04-03.
Rahman, I., S. Ndiongue, X. Jin, M.I. Van Dyke, W.B. Anderson, and P.M. Huck, 2013.
Low-pressure Membrane Fouling Minimization with Biofiltration Pretreatment during
Drinking Water Treatment. Presented at the 7th IWA Membrane Technology Conference,
Toronto, ON. August 25-29, 2013.
Invited Presentation
Rahman, I., W.B. Anderson, and P.M. Huck, 2013. Biofiltration Pretreatment for
Ultrafiltration Membrane Fouling Control. Invited seminar presented to staff of the
Walkerton Clean Water Center, Walkerton, Ontario. August 30, 2013.