diplomarbeit - ef china · concentrating solar power - state of the art, cost analysis and...
TRANSCRIPT

IER Universität Stuttgart Institut für Energiewirtschaft und Rationelle Energieanwendung
Concentrating Solar
Power - State of the
Art, Cost Analysis and
Pre-Feasibility Study
for the Implementation
in China
Wen Zhang
Band 487
. . . . . . . . . . . . . . . . . . . . . . . . . . . . . . . . . . . . . . . . . . . . . . . . . . . . . ......................
Diplomarbeit


Concentrating Solar Power - State of the Art, Cost Analysis
and Pre-Feasibility Study for the Implementation in China
Diplomarbeit
angefertigt von
Wen Zhang
Pfahlbühlstr. 71
71384 Weinstadt
Matr. Nr. 2116552
Betreuer: Prof. Dr.-Ing. A. Voß
Dr. sc. agr. L. Eltrop, IER
Studienrichtung: Umweltschutztechnik
Vertiefungsfach: Energie und Umwelt II
Beginn der Arbeit: 1. Juli 2009
Ende der Arbeit: 18. Dezember 2009
Institut für Energiewirtschaft und Rationelle Energieanwendung, Stuttgart
Prof. Dr.-Ing. A. Voß
Abteilung Systemanalyse und Erneuerbare Energien (SEE)
Dr. sc. agr. L. Eltrop

AKNOWLEDGEMENTS
Many people have supported me in completing this thesis. In particular, I would like to thank my thesis supervisor Dr. Ludger Eltrop (Department of System Analysis and Renewable En-ergy, University Stuttgart) and my thesis advisors Dr. Ole Langniß and Dipl.-Ing. Bruno Fey (Department of Energy Economics, Fichtner GmbH & Co. KG) for their encouragement and
fruitful discussions. I would also like to thank the Energy Foundation for financing this project.
I would like to thank all the colleagues in Department of Energy Economics of Fichtner for
their useful advices and kindly help.
I would also like to thank my parents and my friends for teaching me all about life.

I Contents
Contents
1 EXECUTIVE SUMMARY ......................................................................................................................... 8
2 CSP STATE OF THE ART TECHNOLOGY ........................................................................................ 10
2.1 SOLAR RESOURCES FOR CSP ................................................................................................................... 10 2.2 CSP TECHNOLOGY .................................................................................................................................. 12
2.2.1 Parabolic Trough Systems ............................................................................................................. 13 2.2.1.1 Parabolic Reflector ................................................................................................................................... 14 2.2.1.2 Heat Absorber .......................................................................................................................................... 15 2.2.1.3 Heat Transfer Fluid (HTF) ....................................................................................................................... 15
2.2.2 Linear Fresnel Reflector System ................................................................................................... 16 2.2.2.1 Fresnel Reflector ...................................................................................................................................... 17 2.2.2.2 Absorber .................................................................................................................................................. 18
2.2.3 Solar Tower Systems ..................................................................................................................... 19 2.2.3.1 Heliostat ................................................................................................................................................... 19 2.2.3.2 Tower and Receiver ................................................................................................................................. 21
2.2.4 Dish-Stirling Systems .................................................................................................................... 25 2.2.4.1 Parabolic Reflector (dish) ........................................................................................................................ 25 2.2.4.2 Receiver ................................................................................................................................................... 26
2.3 SOLAR POWER CONVERSION SYSTEMS.................................................................................................... 26 2.3.1 Rankine Cycle Systems ................................................................................................................. 26 2.3.2 Integrated Solar Combined Cycle System (ISCCS) ...................................................................... 27 2.3.3 Hybrid Solar/Rankine-Cycle Generation Systems ........................................................................ 28 2.3.4 Stirling Motor ................................................................................................................................ 28
2.4 THERMAL STORAGE DEVICES .................................................................................................................. 30 2.5 TECHNOLOGY COMPARISON OF CSP ....................................................................................................... 30
3 GLOBAL CSP PROJECTS – A REVIEW ............................................................................................. 33
3.1 PARABOLIC TROUGH PROJECTS ............................................................................................................... 35 3.1.1 Commercial Activities .................................................................................................................. 35 3.1.2 Andasol 1-3: Parabolic Trough Plant with Thermal Storage......................................................... 38
3.1.2.1 Site Selection ........................................................................................................................................... 38 3.1.2.2 Power Plant Components ......................................................................................................................... 40 3.1.2.3 Operation ................................................................................................................................................. 43
3.2 SOLAR POWER TOWER PROJECTS ............................................................................................................ 44 3.2.1 Projects Overview ......................................................................................................................... 44 3.2.2 PS 10: An 11MW Solar Tower Power Plant in Southern Spain.................................................... 45
3.2.2.1 Location ................................................................................................................................................... 46 3.2.2.2 Power Plant Components ......................................................................................................................... 46 3.2.2.3 Operation ................................................................................................................................................. 49
4 COST STATUS OF CSP ........................................................................................................................... 50
4.1 METHODOLOGY FOR CALCULATION OF LEVELIZED ENERGY COST ......................................................... 50 4.1.1 Definition of Levelized Energy Cost ............................................................................................. 50 4.1.2 Methodology ................................................................................................................................. 50
4.2 OVERVIEW OF CSP COSTS ....................................................................................................................... 52 4.2.1 Parabolic Trough ........................................................................................................................... 52
4.2.1.1 Investment Cost ....................................................................................................................................... 52 4.2.1.2 Operating & Maintenance Cost ................................................................................................................ 58 4.2.1.3 Levelized Energy Cost ............................................................................................................................. 60

Contents II 4.2.1.4 LEC for project Andasol 1 ....................................................................................................................... 60 4.2.1.5 Cost Reduction Prospects ......................................................................................................................... 62
4.2.2 Solar Power Tower ....................................................................................................................... 63 4.2.2.1 Investment Cost ........................................................................................................................................ 63 4.2.2.2 Operating & Maintenance Costs ............................................................................................................... 68 4.2.2.3 Levelized Energy Cost ............................................................................................................................. 69 4.2.2.4 LEC for Project PS 10 .............................................................................................................................. 70 4.2.2.5 Cost Reduction Prospect........................................................................................................................... 71
4.2.3 Cost Comparison of Different CSP Systems ................................................................................. 71
5 PRE-FEASIBILITY STUDY OF A CSP PROJECT IN CHINA ... ...................................................... 73
5.1 BACKGROUND ........................................................................................................................................ 73 5.2 SITE SELECTION ...................................................................................................................................... 75
5.2.1 Solar Resource .............................................................................................................................. 75 5.2.2 Land Requirement ........................................................................................................................ 77 5.2.3 Infrastructure ................................................................................................................................ 78 5.2.4 Water Availability ........................................................................................................................ 79 5.2.5 Location ........................................................................................................................................ 80
5.3 SYSTEM DESIGN ..................................................................................................................................... 82 5.4 COST STATUS OF CSP PROJECT IN CHINA ............................................................................................... 84
5.4.1 Investment Cost ............................................................................................................................ 84 5.4.2 O & M Cost .................................................................................................................................. 86 5.4.3 Levelized Energy Cost ................................................................................................................. 88 5.4.4 Comparison with PV in China ...................................................................................................... 91

III Appendices
Appendices
A. CSP Projects Overview B. Cost Calculation for Trough C. Cost Calculation for Tower D. HVAC/DC Transmission Projects until 2020 in China E. Climate of Three Selected Locations F. Cost Calculation of China Case Study

Tables IV
Tables
Table 2-1: Technology comparison of CSP ............................................................................ 31 Table 3-1 : Commercial parabolic trough plants worldwide (status Juli 2009)...................... 35
Table 3-2 : Key data of SEGS power plants ........................................................................... 36 Table 3-3: Major data of Nevada Solar One power plant ....................................................... 37
Table 3-4: Technical data of Andasol project /SM 2008/ ....................................................... 38
Table 4-1: Technical data for S&L and Fichtner projections ................................................. 52
Table 4-2 : Cost of support structure for parabolic trough power plant ................................. 53
Table 4-3 : Cost of receivers for parabolic trough power plant .............................................. 54
Table 4-4 : Cost of mirrors for parabolic trough power plant ................................................ 54
Table 4-5 : Cost of solar balance of a plant for parabolic trough power plant ....................... 55
Table 4-6: Cost of power block and balance of plant for parabolic trough power plant ........ 56
Table 4-7: Break up of two-tank thermal storage cost......................................................... 56
Table 4-8: Cost of thermal storage for parabolic trough power plant .................................... 57
Table 4-9: Comparison of total investment cost for parabolic trough power plant ................ 58
Table 4-10: Cost of thermal storage for parabolic trough power plant .................................. 59
Table 4-11: Levelized energy costs for parabolic trough power plant ................................... 60
Table 4-12: LEC for parabolic trough power plant Andasol 1 ............................................... 61
Table 4-13 : Cost of Site development and Infrastructure for solar tower power plant ......... 64
Table 4-14 : Cost of heliostat field for solar tower power plant ............................................. 65
Table 4-15 : Cost of receiver system for solar tower power plant .......................................... 65
Table 4-16 : Cost of Tower & Piping for solar tower power plant ......................................... 66
Table 4-17: Cost of power block and balance of plant for solar tower power plant .............. 67
Table 4-18: Cost of thermal storage for solar tower power plant ........................................... 67
Table 4-19: Comparison of total investment cost for solar tower power plant ...................... 68
Table 4-20: Cost of thermal storage for parabolic trough power plant ................................... 69
Table 4-21 : Levelized energy costs for solar tower power plant ........................................... 69
Table 4-22: LEC for solar tower power plant PS10 ............................................................... 70
Table 5-1: Main siting factors of concentrating solar power plant ......................................... 75
Table 5-2: Distribution of solar energy resource in China ..................................................... 77
Table 5-3: Technical data of the planned parabolic trough solar power plant ....................... 83
Table 5-4: Comparison of costs of relevant products / services and CRP .............................. 84
Table 5-5: Comparison of major cost components for parabolic trough plant in China and in Europe/North America ............................................................................................................ 85 Table 5-6: Comparison of staffing costs between China and Germany ................................. 87
Table 5-7: Comparison of LEC of parabolic trough plant in Europe/North America with in China ........................................................................................................................................ 88
Table 5-8: Forecast of PV market in China by 2010 and 2020 .............................................. 92

V Figures
Figures
Figure 2-1: Earth’s solar energy budget /Mierlo 2007/ ...........................................................10
Figure 2-2: Globally solar resources distribution /SS 2006/ ...................................................11
Figure 2-3: Energy conversion path in CSP plant ...................................................................13
Figure 2-4: Component parts of solar field for parabolic trough power plant /Renewables 2009/ .........................................................................................................................................14
Figure 2-5: Reflector of parabolic trough power plant /SullivanS 2009/ ...............................14
Figure 2-6: Receiver of a parabolic trough plant /SS 2006/ ...................................................15
Figure 2-7: Component parts of the solar filed for linear Fresnel reflector power plant ........17
Figure 2-8: Fresnel reflectors of a LFR power plant /Greenpacks 2008/ ...............................17
Figure 2-9: Absorbers of a LFR power plant /Pye 2008/ ........................................................18
Figure 2-10: Receiver used in linear Fresnel reflector system NOVA-1 /Meyer 2009/ .........18 Figure 2-11: Basic layout scheme of a solar power tower plant /Sullivan 2009/ ...................19
Figure 2-12: Dual axis optical solar tracking /Heliotrack 2009/ .............................................19
Figure 2-13: Faceted glass/metal heliostats /Thomas 2000/ ...................................................20
Figure 2-14: Membrane heliostats /Thomas 2000/ .................................................................21
Figure 2-15: The functional principle of the Phoebus receiver /Kaltschmitt et al. 2007/ .......23
Figure 2-16: Closed Vertical tube receivers with molten salt /Kaltschmitt et al. 2007/ .........24
Figure 2-17: Basic scheme of a dish-Stirling plant /Bergermann et al. 1996/ ........................25
Figure 2-18: Rankine Cycle system /EEL&MRCL 1999/ ......................................................27
Figure 2-19: Integrated Solar Combined Cycle System (ISCCS) /EEL&MRCL 1999/ .........28 Figure 2-20: Function process of the Stirling motor /Bergermann 2001/ ...............................29
Figure 3-1: World cumulative installed CSP capacity 1985 – 2014 /REW 2009/ ..................33
Figure 3-2: Current large-scale CSP projects global ..............................................................34
Figure 3-3: Location of the Andasol project /Andasol 2008/ .................................................39
Figure 3-4: Monthly total direct radiation at the site of Andasol project /SM 2008/ .............40
Figure 3-5: Parabolic through power plant Andaosl 1 /SM 2008/ ..........................................41
Figure 3-6: Two-tank molten salt thermal storage system /SM 2008/ ....................................43
Figure 3-7: Basic operation shame of Andasol 1 /New 2009/ ................................................43
Figure 3-8: Location of solar tower plant PS10 /FTPR 2005/ ................................................46
Figure 3-9: Tower of PS10 /FTPR 2005/ ................................................................................47 Figure 3-10: Thermal storage tanks of PS 10 /FTPR 2005/ ....................................................48
Figure 3-11: Basic system design of solar tower plant PS 10 /FTPR 2005/ ...........................49
Figure 4-1: Major cost components for parabolic trough power plant Andasol 1 ..................61
Figure 4-2: Cost reduction of parabolic trough power plant until 2025 /ESRELA 2008/ ......63 Figure 4-3: Cost reduction of solar tower power plant until 2025 /S&L 2009/ ......................71
Figure 5-1: Increase of electricity generation and installed capacity in China between 1980 and 2007 ...................................................................................................................................73
Figure 5-2: Primary energy consumption in China 2006 ........................................................74
Figure 5-3: Forecast of major energy reserves in china and in the world ...............................74
Figure 5-4: Solar resource of China (DNI data with unit: kWh/ (m²•day)) /GENI 2008/ ......76

Figures VI
Figure 5-5: HVDC/AC transmission net in 2010 /NI 2007/ ................................................... 78
Figure 5-6: HVDC/AC transmission net in 2015-2020 /NI 2007/ ......................................... 79
Figure 5-7: Water resource distribution of China /See 2008/ ................................................. 80
Figure 5-8: Selected locations of distribution channels ......................................................... 80
Figure 5-9: Monthly solar radiation in selected locations ...................................................... 81
Figure 5-10: Air temperature and wind speed of selected locations ...................................... 82
Figure 5-11: Process diagram of the planned parabolic trough solar power plant ................. 83
Figure 5-12: Comparison of cost reduction potential for investment cost ............................. 85
Figure 5-13: Distribution of investment cost for parabolic trough project in China .............. 86
Figure 5-14: Costs distribution of O&M ................................................................................ 87 Figure 5-15: Cost distribution O&M in China ....................................................................... 88
Figure 5-16: Electricity cost reduction for parabolic trough plant until 2020 ........................ 89
Figure 5-17: Electricity cost for three scenarios in China ...................................................... 90
Figure 5-18: Electricity cost at the load center ....................................................................... 91 Figure 5-19: China PV market development 2004-2020 ....................................................... 92
Figure 5-20: PV cost development in California and China .................................................. 93
Figure 5-21: Comparison of current electricity cost ............................................................... 93

VII Acronyms and Abbreviations
Acronyms and Abbreviations
Term Definition or Clarification
CSP Concentrating solar power
$M Millions of U.S. dollars
BOP Balance of Plant
Crf Capital recovery factor
CRP Cost-reduction-potential
DNI Direct normal irradiation
EJ Exa joules
GWe Gigawatts (electrical)
HCE Heat collection element
HTF Heat transfer fluid
ISCCS Integrated solar combined-cycle system
kWe Kilowatts (electrical)
kWhe Kilowatt-hours (electrical)
LEC Levelized energy cost
LFR Linear Fresnel reflector
MWe Megawatts (electrical)
MWhe Megawatt-hours (electrical)
MWht Megawatt-hours (thermal)
MWt Megawatts (thermal)
NREL National Renewable Energy Laboratories
O&M Operation and maintenance
PV Photovoltaic
PW Petawatts
R&D Research and development
S&L Sargent & Lundy LLC
SCA Solar collector assembly
SEGS Solar energy generation station
STG steam turbine and generator

Executive Summary 8
1 Executive Summary
Once in the past century, mainly the western industrialized countries were responsible for a
steady increase of global energy demand. Nowadays primarily the emerging and developing
countries provide a sharply growth of global energy consumpution, despite efficiency gains
in energy use, due to their growing populations and infrastructures. And they will also in-
crease the global energy demand in the future. In the reference scenario of the International
Energy Agency (IEA), for example, the global energy demand will be increased for a further
55% by 2030 compared to 2005. /IEA 2008/ Since the current energy supply is based for the
predominant part on the fossil fuels and their reserves are finite, there are today already sig-
nificant price increases caused by the changes of in supply and demand.
In addition to the limited fossil resources, their intensive use has also negative effects on hu-
man and nature. Among those, the carbon dioxide emissions from fossil fuels combustion are
particularly serious. To limit the global warming and the resulting consequences to a mana-
geable and acceptable level (2C target), according to climate experts, the emission of harmful
greenhouse gases must be reduced of at least 50% by the middle of the century.
Since the combustion of fossil fuels in conventional power plants accounts for a large share
of anthropogenic greenhouse gas emissions, a significant emission reduction must be taken
place in this field. Clean energy generation offers enormous potential to reduce CO2 emis-
sions and the possibility of sustainable energy supply. Within the renewable energy sources,
solar energy has besides the wind and hydropower the especially great potential.
Concentrating solar power (CSP) technology uses direct solar radiation to generate power. The CSP plants concentrate sunlight to raise the temperature of a transfer fluid in the receiver and run turbines to generate electricity. Through the implementation of thermal storage or fossil fuels fired backup, CSP plants can generate electricity according to the demand and thus replace the conventional power plants. While CSP are useful only in locations where the annual direct solar radiation over 1800 kWh/m2, there is also the possibility of the electricity transmission. The solar-generated electricity can be transmitted from these locations to the load centers with high-voltage transmission lines, so that CSP-produced electricity could be available in the future in almost all countries. To date, the four major approaches to CSP technology are the parabolic trough, linear Fresnel reflector, solar tower and dish-Stirling systems. Since the first commercial CSP plant has been operated in California, USA, there is now al-ready over 660MW CSP plants in operation worldwide. The CSP industry will keep a rapid growth in the near future, approximately 1.2GW plants are under construction as of April 2009 and another 13.9GW plants with varied CSP technologies are announced globally by 2014. The most plants of those have been or will be constructed in the USA and Spain. The

9 Executive Summary
other Countries, which have or will have CSP plants, are Algeria, China, Germany, Israel, Morocco, UAE, etc. /REW 2009/ Compared with conventional technologies the cost of electricity generation through CSP is still much higher. However, through technology development, the mass production of key components and scale-up factors, it will have a significant cost reduction. It can be assumed that CSP plants are already able to compete directly with fossil fuel power plants in the next 10-15 years. With the rapid economic growth in China, the energy consumption has increased sharply in
the past 20 years. And in the future, the energy demand of China will be even larger. In the
Westchina and Nordchina, there are abundant solar radition resouces for the large-scale im-
plementation of CSP technology. It is estimated that solar power in almost 2% of desert area
(ca. 23,960 km²) in China was able to satisfy all of the Chinese electricity consumption in
2008 (3,450 billion kWh /NBSC 2009/). After the promulgation of the renewable energy law
(REL) in China in 2006, a long term target has been set up that 1000MW energy generation
capacity for CSP plants will be reached by 2020. Due to all these reasons, the CSP deploy-
ment for electricity generation in China will achieve a rapid and sustained growth
This study provides a summary assessment of four major concentrating solar power (CSP) technologies and a review of major projects built mainly in USA and Spain. The cost of these CSP projects is compared and analyzed. Based on these information, a preliminary feasibility study of a CSP project in China is prepared to indicate the enormous market potential of CSP technology.
CSP Technology State of the Art
2 CSP Technology State of the Art
2.1 Solar Resources for CSP
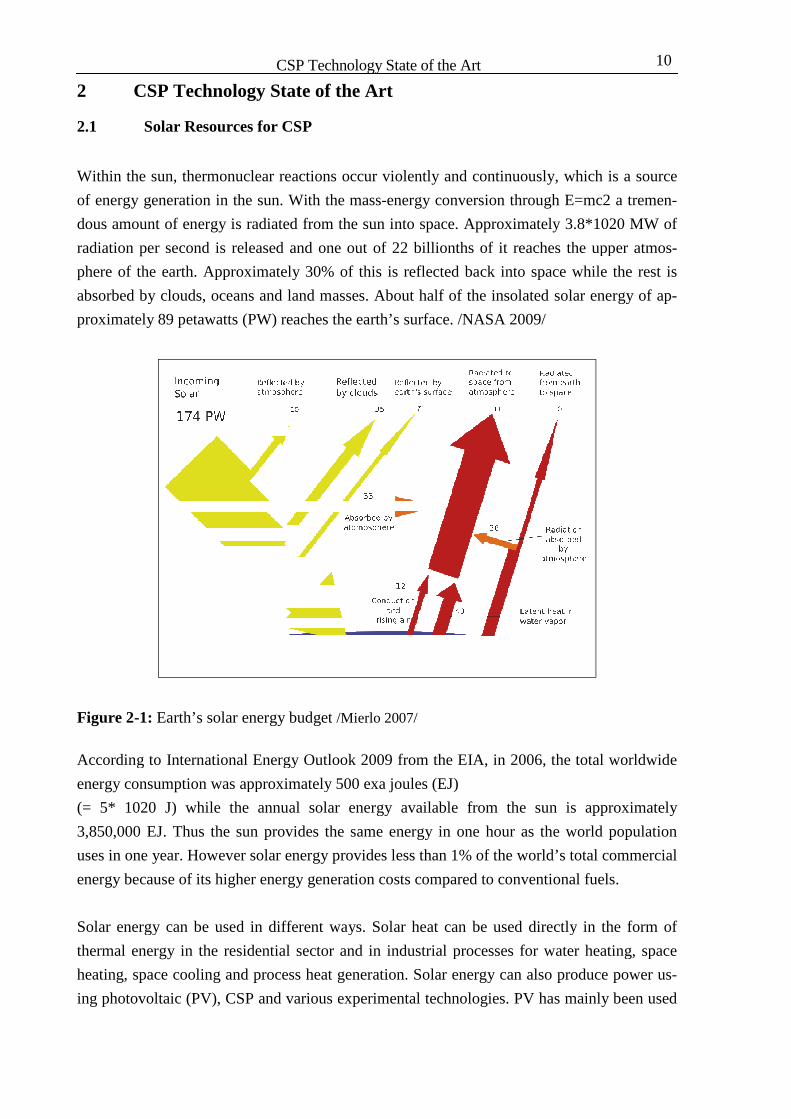
Within the sun, thermonuclear reactions occur violently and continuously, which is a source
of energy generation in the sun.
dous amount of energy is radiated from the
radiation per second is released
phere of the earth. Approximately 30%
absorbed by clouds, oceans and land masses. About half
proximately 89 petawatts (PW) reaches the
Figure 2-1: Earth’s solar energy budget
According to International Energy Outlook 2009 from the EIA, i
energy consumption was approximately 500
(= 5* 1020 J) while the annual solar energy
3,850,000 EJ. Thus the sun provides
uses in one year. However solar energy provides less than 1% of the world
energy because of its higher energy
Solar energy can be used in different ways.
thermal energy in the residential sector and in industrial processes for water heating, space
heating, space cooling and process heat generation. Solar energy can also produce power u
ing photovoltaic (PV), CSP and various experimental technologies. PV has mainly been used
CSP Technology State of the Art
State of the Art
Solar Resources for CSP
Within the sun, thermonuclear reactions occur violently and continuously, which is a source
of energy generation in the sun. With the mass-energy conversion through E
amount of energy is radiated from the sun into space. Approximately 3.8*10
and one out of 22 billionths of it reaches the upper atmo
arth. Approximately 30% of this is reflected back into space while the rest is
absorbed by clouds, oceans and land masses. About half of the insolated solar energy
reaches the earth’s surface. /NASA 2009/
Earth’s solar energy budget /Mierlo 2007/
According to International Energy Outlook 2009 from the EIA, in 2006, the
approximately 500 exa joules (EJ)
) while the annual solar energy available from the sun is approximately
Thus the sun provides the same energy in one hour as the world
solar energy provides less than 1% of the world’s total commercial
higher energy generation costs compared to conventional fuels
Solar energy can be used in different ways. Solar heat can be used directly
in the residential sector and in industrial processes for water heating, space
ng and process heat generation. Solar energy can also produce power u
(PV), CSP and various experimental technologies. PV has mainly been used
10
Within the sun, thermonuclear reactions occur violently and continuously, which is a source
through E=mc2 a tremen-
3.8*1020 MW of
the upper atmos-
to space while the rest is
the insolated solar energy of ap-
the total worldwide
un is approximately
the world population
s total commercial
generation costs compared to conventional fuels.
directly in the form of
in the residential sector and in industrial processes for water heating, space
ng and process heat generation. Solar energy can also produce power us-
(PV), CSP and various experimental technologies. PV has mainly been used

11 CSP Technology State of the Art
in the small and medium-sized applications with the PV cells while the CSP plants are used
in much larger-scale generation.
To become feasible and cost-effective, CSP systems require a high level of direct normal
irradiation (DNI1) at the sites. This is an important factor in the economics of a solar plant
and can be measured by satellite. Figure 2-2 below provides one such attempt to map suit-
able regions worldwide for the implementation of CSP technology.
Figure 2-2: Globally solar resources distribution /SS 2006/
Suitable sites should offer at least 2,000 kilowatt hours (kWh) of electricity per m² of sunlight
annually, while the best sites will offer greater than 2,500kWh/m² annually. Suitable loca-
tions are where the climate and vegetation do not offer high levels of atmospheric humidity
such as, steppes, bush, savannahs, semi-deserts and true deserts. And they are ideally located
within ±40° of latitude. Among the most promising areas of the world for CSP are therefore
the South-Western United States, Central and South America, Africa, the Middle East, the
Mediterranean countries of Europe, Iran, Pakistan and the desert regions of India, and the
former Soviet Union, China and Australia.
Using CSP technology, one square kilometer of land in the obove-mentioned regions is
enough to generate as much as 100 to 200 Gigawatt-hours (GWh) of solar electricity per year.
This is equivalent to the annual energy-production of a 50MW conventional coal or gas-fired
power plant. 1 DNI is the direct normal radiation on a surface which is always perpendicular to the direction of the
direct radiation from the sun.

CSP Technology State of the Art 12
2.2 CSP Technology
CSP system produces electricity by converting solar energy into high temperature heat with
reflectors and receivers. The heat is then used to produce electricity through a conventional
turbine-generator system. Currently, there are four major CSP technologies, the parabolic
trough systems, linear Fresnel reflector systems, solar tower systems and dish systems. The
further research is being undertaken examining various CSP technologies for larger genera-
tion capabilities and higher thermodynamic efficiencies.
Parabolic trough systems A parabolic trough system consists of trough-shaped mirror reflectors to concentrate the solar radiation on to receiver tubes containing thermal transfer fluid which is then heated to pro-duce steam. This is the most developed, economically viable and widely accepted of the CSP technologies. Currently, most of the CSP projects that are under construction employ this technology.
Linear Fresnel reflector systems A linear Fresnel reflector system uses an array of flat or slightly curved reflectors which re-flect solar rays and concentrate them onto an elevated inverted linear absorber tube for heat-ing the fluids and converting the solar energy into electricity. Spain is implementing a pilot project using this technology which is still in the nascent stage. Currently, Fresnel systems are less efficient but also less costly than other CSP technologies.
Solar tower systems (Central receiver systems) A solar tower system employs an array of large individually tracked plain mirrors (heliostats) to concentrate solar radiation on to a central receiver on top of a tower to produce steam for electricity generation. Currently, CSP plants in Spain such as PS10 and PS20 are implement-ing central receiver system technology.
Dish-Stirling systems Dish-Stirling systems in contrast with the other approaches are comparatively smaller units consisting of a dish-shaped concentrator that reflects solar radiation onto a receiver mounted at a focal point that heats thermal fluid for power generation. This technology has the advan-tage of functioning as a stand-alone system and can provide decentralized power. Currently, small CSP projects are planned in USA, Europe and Australia using this technology.
Regarding their technical features, the conversion path of all the concentrating solar power
technologies rely on four basic elements: the concentrator, receiver, transport-storage system,
and power conversion system (See figure below). The Fossil- fired backup system is an alter-
native component of CSP plants.

13
Figure 2-3: Energy conversion path in CSP plant
The concentrator captures and concentrates the solar radiation, which is then delivered to the
receiver. The receiver absorbs the concentrated sunlight and transfers its heat to a working
fluid. The transport-storage system
system; in some solar-thermal plants a portion of the thermal energy is stored for later use.
Several solar thermal power conversion systems have been successfully demonstrated inclu
ing the Rankine, Brayton, combined or Stirling cycles. Four emerging solar thermal power
generation concepts - the parabolic trough; the solar power tower; the parabolic dish and the
linear Fresnel reflector system
below.
2.2.1 Parabolic Trough
In the parabolic trough systems, a solar collector concentrates the sunlight with the curved
mirrors and reflects it onto a heat absorber receiver which is located in the focal line of the
collector. The receiver consists of a special tube through which heat transfer fluid is warmed
up to about 400°C. Then the heat transfer fluid is used to boil water in a conventional steam
generator to produce electricity.
As shown in the picture below, the reflector, absorber t
ing (heat transfer fluid circuit) are the main components of a parabolic trough plant.
discussed in the following section.
CSP Technology State of the Art
y conversion path in CSP plant
The concentrator captures and concentrates the solar radiation, which is then delivered to the
receiver. The receiver absorbs the concentrated sunlight and transfers its heat to a working
storage system passes the fluid from the receiver to the power
thermal plants a portion of the thermal energy is stored for later use.
Several solar thermal power conversion systems have been successfully demonstrated inclu
e, Brayton, combined or Stirling cycles. Four emerging solar thermal power
the parabolic trough; the solar power tower; the parabolic dish and the
linear Fresnel reflector system - will be described in the Section Current Technology S
rough Systems
In the parabolic trough systems, a solar collector concentrates the sunlight with the curved
mirrors and reflects it onto a heat absorber receiver which is located in the focal line of the
consists of a special tube through which heat transfer fluid is warmed
up to about 400°C. Then the heat transfer fluid is used to boil water in a conventional steam
generator to produce electricity.
As shown in the picture below, the reflector, absorber tube (receiver) and the solar field pi
ing (heat transfer fluid circuit) are the main components of a parabolic trough plant.
discussed in the following section.
The concentrator captures and concentrates the solar radiation, which is then delivered to the
receiver. The receiver absorbs the concentrated sunlight and transfers its heat to a working
passes the fluid from the receiver to the power-conversion
thermal plants a portion of the thermal energy is stored for later use.
Several solar thermal power conversion systems have been successfully demonstrated includ-
e, Brayton, combined or Stirling cycles. Four emerging solar thermal power
the parabolic trough; the solar power tower; the parabolic dish and the
will be described in the Section Current Technology Status
In the parabolic trough systems, a solar collector concentrates the sunlight with the curved
mirrors and reflects it onto a heat absorber receiver which is located in the focal line of the
consists of a special tube through which heat transfer fluid is warmed
up to about 400°C. Then the heat transfer fluid is used to boil water in a conventional steam
ube (receiver) and the solar field pip-
ing (heat transfer fluid circuit) are the main components of a parabolic trough plant. These are

CSP Technology State of the Art 14
Figure 2-4: Component parts of solar field for parabolic trough power plant /Renewables 2009/
2.2.1.1 Parabolic Reflector
The parabolic reflector consists of one surface with a reflecting layer, for exemple metal foil
or thin glass mirrors, or with several curved mirror segments. In commercial projects, the
second variant is more usually applied. Reflectors are mounted on a steel framework and
track the sun using a single axis system following the longitudinal axis.
Figure 2-5: Reflector of parabolic trough power plant /SullivanS 2009/
15 CSP Technology State of the Art
To achieve high reflectivity over the mean value of 94% the mirrors typically utilize back-
silvered white low iron glass with the weatherproof attributes. Through regular cleaning, this
high reflectivity of the mirror segments can be maintained. /Kaltschmitt et al. 2007/
In the projects SEGS in the USA and Andasol I in Spain mirrors from the company
FLAGSOL have been used. The reflectors are made up of a number of sub modules each
with a typical length of 12m. The type 100 has an overall length of 100m and 8 sub modules.
The larger parabolic trough reflector Skal-ET150 has a length of 150m and an aperture width
of 5.77 m and consists of 12 sub modules. /Flagsol 2008/
The reflectors are tracked with the sun along their long axis by drives. The driving system of
SKAL-ET reflector consists of two hydraulic cylinders that are installed on the drive pylon.
2.2.1.2 Heat Absorber
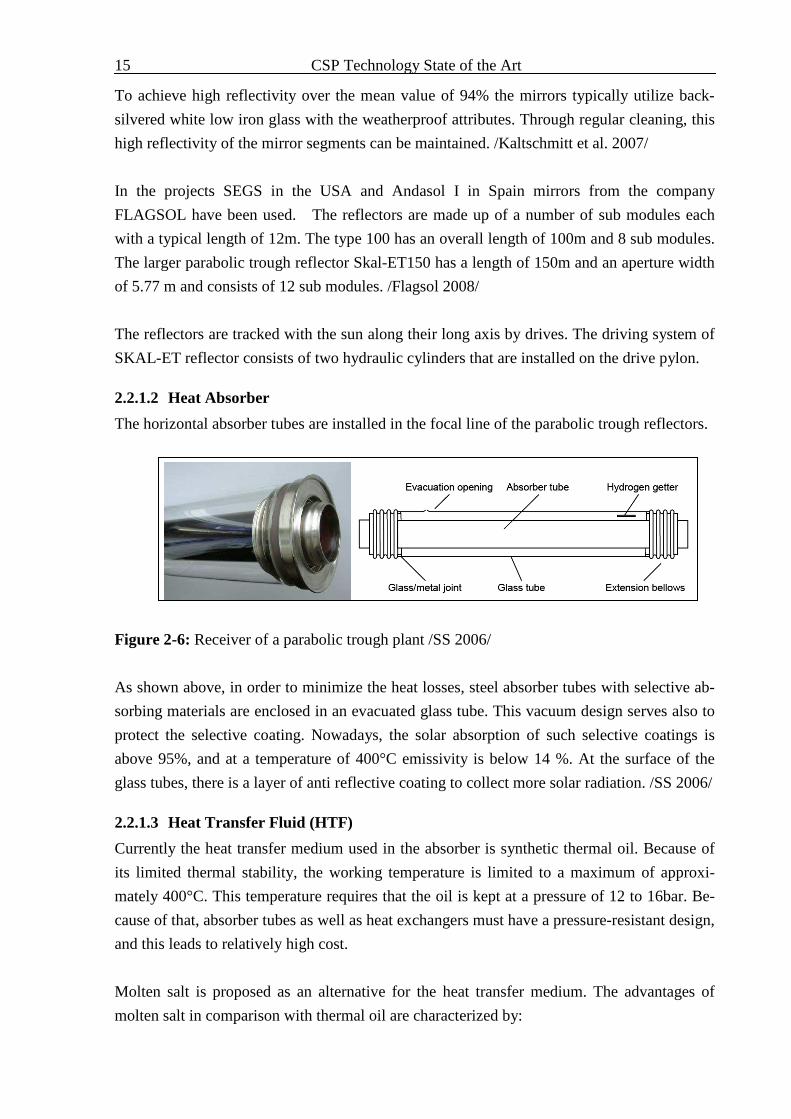
The horizontal absorber tubes are installed in the focal line of the parabolic trough reflectors.
Figure 2-6: Receiver of a parabolic trough plant /SS 2006/
As shown above, in order to minimize the heat losses, steel absorber tubes with selective ab-
sorbing materials are enclosed in an evacuated glass tube. This vacuum design serves also to
protect the selective coating. Nowadays, the solar absorption of such selective coatings is
above 95%, and at a temperature of 400°C emissivity is below 14 %. At the surface of the
glass tubes, there is a layer of anti reflective coating to collect more solar radiation. /SS 2006/
2.2.1.3 Heat Transfer Fluid (HTF)
Currently the heat transfer medium used in the absorber is synthetic thermal oil. Because of
its limited thermal stability, the working temperature is limited to a maximum of approxi-
mately 400°C. This temperature requires that the oil is kept at a pressure of 12 to 16bar. Be-
cause of that, absorber tubes as well as heat exchangers must have a pressure-resistant design,
and this leads to relatively high cost.
Molten salt is proposed as an alternative for the heat transfer medium. The advantages of
molten salt in comparison with thermal oil are characterized by:

CSP Technology State of the Art 16
• lower specific costs
• higher heat capacity
• potentially higher working temperature
However, with the higher melting temperature and higher viscosity it requires more heating
and pumping power,
Furthermore,research into the direct steam generation design has lead to greater cost sav-
ings and potential for greater efficiency. As the only working medium, steam has the advan-
tage of a higher working temperature while there are no requirements for a secondary heat
transfer fluid loop and heat exchangers.
2.2.2 Linear Fresnel Reflector System
A linear Fresnel reflector (LFR) power plant collects sunlight with individual long, narrow
mirror segments and several of the mirror segments share one linear receiver above them. On
top of the receiver, there is another long mirror to focus the light to the receiver.
The LFR system uses one axis tracking. This is similar to the trough design but different
compared to the solar tower and with dual-axis. The structure of LFR system is simpler than
the trough and dish-Stirling design, because the narrow flat mirrors are used instead of para-
bolic formed mirrors and these mirrors do not support the receiver and the receiver is station-
ary. As a result the cost can be reduced and the collector could have a longer lifetime. Each
mirror will be adjusted by the small motors and they could also reflect sunlight to different
receivers at different times of day. This design provides the possibility of more mirrors in-
stalled on the available land area.
The Figure below shows a typical linear Fresnel reflector system.

17 CSP Technology State of the Art
Figure 2-7: Component parts of the solar filed for linear Fresnel reflector power plant /Pye 2009/
2.2.2.1 Fresnel Reflector
The Fresnel reflector uses low-iron glass. The individual mirror segments are mounted on the
steel frame at the same height and they can be roted through 360° driving by a solar tracking
system. During the strong wind or hailstrom the mirrors can turn upside down to avoid dam-
age to equipment. The lower width of the Fresnel reflectors will be also reduced their wind
loads. The following figure shows the reflector structure of LFR system.
Figure 2-8: Fresnel reflectors of a LFR power plant /Greenpacks 2008/

CSP Technology State of the Art 18
Due to their simpler structure, Fresnel reflectors have a lower concentrations and a lower
optical efficiency than parabolic trough reflectors, though individually micro-adjustment of
each reflectors can compensate for such disadvantages. However, the sophisticated tracking
system and the required large number of drives lead to high costs.
2.2.2.2 Absorber
Figure 2-9: Absorbers of a LFR power plant /Pye 2008/
For the linear Fresnel system absorber, tube groups are used due to their wider focal line. The
cross sections of the absorbers are shown above. Pipes are mounted inside the trapezoidal
cavity and the bottom of the cavity is covered with a transparent cover, which is intended to
reduce convective losses by trapping a layer of hot air next to the hot steam pipes. This cover
is commonly made with low-iron glass because the angled glass reduces reflective losses of
solar radiation and low-iron glass has improved optical properties compared to standard grade
window glass. This is the so-called secondary concentrator. The following figure illustrates
the mechanisms of secondary reflection.
Figure 2-10: Receiver used in linear Fresnel reflector system NOVA-1 /Meyer 2009/

19 CSP Technology State of the Art
2.2.3 Solar Tower Systems
At a solar tower plant the solar radiation is collected by mirrors called heliostats with a dual
axis tracking system, and are controlled so that they gather the incident solar light and reflect
it on top of a tower, where the solar energy is absorbed by a receiver. The receiver absorbs
the concentrated solar energy and then passes it to the heat transfer fluid which flows through
the receiver. According to different types of heat transfer such as fluid, water/ steam, molten
salt, liquid sodium and air, the temperature of the receiver can reach from 500°C to over
1000°C. The Figure below shows the basic layout of a solar power tower plant.
Figure 2-11: Basic layout scheme of a solar power tower plant /Sullivan 2009/
2.2.3.1 Heliostat
The heliostats field consists of a large number of individual heliostats (from several hundreds
to thousands). Heliostats are mirrors that are managed by a dual axis optical solar tracking
system. The analog solar tracking circuit controls two mechanical actuators that move a mir-
ror plane on two axes. The mirror plane will reflect the sunlight to a stationary target during
the day and then return to a preset morning position after sunset. The tracking electronics are
capable of tracking the sun with sub degree accuracy.
Figure 2-12: Dual axis optical solar tracking /Heliotrack 2009/

CSP Technology State of the Art 20
A heliostat consists of:
• a sunlight reflector,
• a tracking unit with the drive motor,
• the foundation
• the electronic control system
The heliostats represent a heavy weight of the total cost of solar tower power plant. There-
fore, great effort is expended on the development of heliostats with good optical quality, high
reliability, with a long life and low area-specific costs. Due to economic considerations, large
heliostats with areas from 100 to 200 m² are applied in the current projects. Two main types
of the heliostats are available these being the faceted glass/metal heliostats and membrane
heliostats and are described below. /Kaltschmitt et al. 2007/
Faceted glass/metal heliostats
Faceted glass/metal heliostats typically consist of several quadrate reflecting facets each with
sizes between 2 and 4m². These reflecting facets are mounted on a steel framework. Each
heliostat has an individual drive to track the sun and concentrate the solar energy onto the
receiver, so that each of them has a different orientation. This leads to a high focusing accu-
racy but also high costs. Currently wide faceted glass/metal heliostats are more usually util-
ized in commercial solar tower plants. The glass/metal heliostat illustrated in the figure below
is an example of this.
Figure 2-13: Faceted glass/metal heliostats /Thomas 2000/

21 CSP Technology State of the Art
This concentrator width of the heliostat amounts to 12.08m and concentrator height of the
heliostat amounts to 10.06m. The size of the individual facets is 3 by 1.1m each. The total
weight without foundation is 6.5t. /Thomas 2000/
Membrane heliostats
In order to decrease the weight of the heliostat and thus reduce the material and drive costs,
stretched membrane heliostats have been developed. Taut Plastic foils or metal membranes
are mounted on a circular frame to generate tension in the membrane. And thin glass mirrors
are covered out of the membrane to keep a long lifetime of heliostats. This smooth surface
can provide a high efficiency of solar reflection. The membrane can be deformed through
changing the pressure inside the heliostat and than the focus length can be adjusted.
Figure 2-14: Membrane heliostats /Thomas 2000/
The figure above shows an example of a metal membrane heliostat. This heliostat is installed
on a steel framework with six wheels for vertical rotation. The heliostat has a diameter of
14m and a concentrator area of 150m². Its weight excluding the foundation is approximately
7.5t. The drive mechanisms of this heliostat decline the cost of power plant. /Thomas 2000/
2.2.3.2 Tower and Receiver
The only receiver of central solar tower power plant is located on the top of the tower. As
support of the receiver the tower is commonly with a height of 80 to 100m and made of con-
crete or steel lattices. A higher tower is preferable for bigger and denser heliostats field but it
should to avoid the shades or objects that block the sun. At the same time, the technical fac-
tors, e.g. tracking precision and the economic factors, e.g. tower costs should also be consid-
ered to determine the height of the tower.

CSP Technology State of the Art 22
The Receiver of solar tower power plant transforms the solar energy collected by heliostats
into the thermal energy of working fluid. This working fluid could be commonly water/steam
and molten salts. In further research air is applied for use in high temperature power towers.
Water/steam receivers are the most used receiver in solar tower power plants, e.g. in the early
power plant 10MW Solar One in the USA and in the world largest solar tower PS20 in Spain.
Meanwhile the molten salt receiver and open volumetric air receiver are applied in some
demonstrate plants.
In the following section, the open volumetric air receiver,the molten salt receiver and the
water/steam receiver are described.
Open volumetric air receiver
At the site of the open volumetric air receiver ambient air is drawn through an absorber,
which has been heated by concentrated solar radiation at 600 to 800°C. As absorber material,
steel wire or porous ceramics are applied. Due to the porous absorber structure the receiver is
characterized principally by low thermal losses, because the external surface area of the ab-
sorber is much smaller than the porous heat transfer area (volumetric effect). Other advan-
tages of the volumetric receiver consist of:
• good manageability of heat transfer medium air,
• relatively simple structure,
• sufficiently high outlet temperature,
• the low thermal inertia and
• short start-up time.
A clear disadvantage when compared to other receivers is the low specific heat capacity of
heat transfer medium air, which leads to a high flow rate on the one hand and the other no
energy-efficient direct storage of hot air.
23 CSP Technology State of the Art
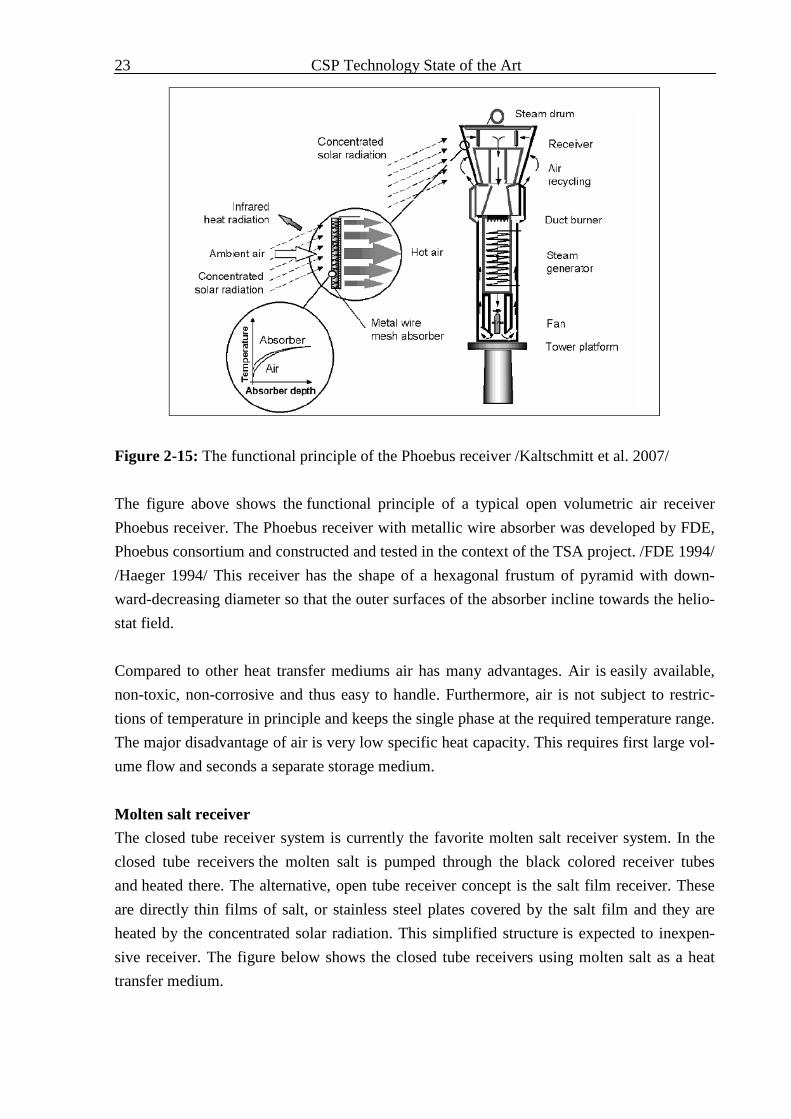
Figure 2-15: The functional principle of the Phoebus receiver /Kaltschmitt et al. 2007/
The figure above shows the functional principle of a typical open volumetric air receiver
Phoebus receiver. The Phoebus receiver with metallic wire absorber was developed by FDE,
Phoebus consortium and constructed and tested in the context of the TSA project. /FDE 1994/
/Haeger 1994/ This receiver has the shape of a hexagonal frustum of pyramid with down-
ward-decreasing diameter so that the outer surfaces of the absorber incline towards the helio-
stat field.
Compared to other heat transfer mediums air has many advantages. Air is easily available,
non-toxic, non-corrosive and thus easy to handle. Furthermore, air is not subject to restric-
tions of temperature in principle and keeps the single phase at the required temperature range.
The major disadvantage of air is very low specific heat capacity. This requires first large vol-
ume flow and seconds a separate storage medium.
Molten salt receiver
The closed tube receiver system is currently the favorite molten salt receiver system. In the
closed tube receivers the molten salt is pumped through the black colored receiver tubes
and heated there. The alternative, open tube receiver concept is the salt film receiver. These
are directly thin films of salt, or stainless steel plates covered by the salt film and they are
heated by the concentrated solar radiation. This simplified structure is expected to inexpen-
sive receiver. The figure below shows the closed tube receivers using molten salt as a heat
transfer medium.

CSP Technology State of the Art 24
Figure 2-16: Closed Vertical tube receivers with molten salt /Kaltschmitt et al. 2007/
Molten salt consists of sodium or potassium nitrate (NaNO3, KNO3). In contrast to air, the
molten salt has a much higher heat capacity and can be directly used as heat storage medium.
As a result, the design cost of heat storage structure will be greatly reduced. Another advan-
tage of the molten salt is that the heat transfer medium exists always in the liquid phase and
thus no two-phase flows occur. Since the salt isn’t allowed to crystallize, represents the
permanent liquid phase also a disadvantage that, all plant parts filled with salt (tanks, pipes,
and valves) must be heated at night during operation breaks (melting point 120 to 140°C). It
increases the operating cost of the power plant. Another drawback to the molten salts is their
high corrosivity.
The development of molten salt receivers was driven primarily by American research institu-
tions as well as companies (Boeing, Bechtel pursued, etc) and its operation was successfully
tested in the 10MW demonstrate plant Solar Two in 1996, California. Currently the 15MW
solar tower power plant Solar Tres, which is based on the Solar Two concept, is under con-
struction in Spain
Water/steam receiver
The structure of the water/steam receiver is essentially consistent with the previ-
ously described molten salt tube receiver. Instead of the molten salt water is evaporated in the
receiver tube and possibly overheated so that the steam turbine system is directly supplied
with the saturated steam.
On a number of demonstration projects of solar power tower using water/steam receiver in
the 1980s showed that direct steam generation in the receiver had numerous problems. Most
of them were provided by the two-phase flows (water/steam) and the related difficulties in

25 CSP Technology State of the Art
heat transfer and material fatigue. In recent years the Spanish company Abengoa has devel-
oped the technical mature saturated steam receiver and it is applied in the solar tower PS10.
A storage tank of saturated steam was integrated into the system in order to ensure the con-
tinuous operation during the time with insufficient or without solar radiation.
2.2.4 Dish-Stirling Systems
In a solar dish-Stirling system, the reflective surface which is dish-shaped collects and re-
flects the solar radiation onto a receiver, which absorbs the solar energy and transfers it to a
Stirling engine. Then the mechanical power from the engine operates a generator to produce
electricity. The main components of a solar dish plant are the parabolic reflector, receiver,
and a Stirling motor as a thermal engine with attached generator. As with the solar power
tower system the dish concentrator tracks the sun with a dual axes tracking system. The fig-
ure below illustrates the basic layout schema of a dish-Stirling plant.
Figure 2-17: Basic scheme of a dish-Stirling plant /Bergermann et al. 1996/
2.2.4.1 Parabolic Reflector (dish)
The parabolic reflector (dish) concentrates sunlight onto a focal point. The size of this spot is
dependent on the concentrator precision, condition of the surface and focal distance. For the
operation of the Stirling engine high temperatures are required. Therefore a large point-focus
concentrator with an axial symmetrical shape is implemented in this system. Currently dish
reflectors achieve concentration ratios of between 1,500 and 4,000 and their common maxi-
mum diameters are 25m. /Liao; Long 2008/ There are two main types of dish concentrator,
the facetted paraboloids and full-surface paraboloids.
mmmm
Receiver and Stirling motor
Concentrator

CSP Technology State of the Art 26
2.2.4.2 Receiver
The receiver transfers the solar energy into technically useful heat. Therefore, the highest
temperature of the dish-Stirling system is at the receiver. For the direct-heating systems the
common operational temperature currently varies between 600 and 800°C and the pressure
between 40 and 200bar. The tube receiver and the heat pipe receiver are the two main re-
ceiver types of the dish-Stirling system.
2.3 Solar Power Conversion Systems
Apart from the solar power collection systems, another major component of the concentrating
solar power plant is the power conversion systems that convert the heat into electricity.
Nowadays, different technologies are mainly used in the CSP plants such as the:
• Rankine Cycle system
• Integrated Solar Combined Cycle System (ISCCS) and other hybrid systems
• Stirling motor
The Rankine Cycle is a mature solar only technology that provides a high solar contribution.
Meanwhile the ISCCS with a gas-fired hybrid facility offers a low cost alternative for the
solar powered electricity generation. The Stirling motor is only implemented in the solar
dish-Stirling system.
2.3.1 Rankine Cycle Systems
In a Rankine-cycle plant a steam-based power plant with solar energy which is implemented
as the source of heat. The system is a typical Rankine cycle. The hot collector heat transfer
fluid transfers its heat in the heat exchanger to the water/steam. The steam drives the turbine
to produce electricity. The spent steam is condensed into water in the condenser. The water is
then reheated in the heat exchanger and the cycle repeats.
Due to the seasonal and daily change in solar radiation, a Rankine-cycle without thermal
storage system can only operate at full load with 25% capacity factor for about 2400 hours
annually. In the majority of cases, it is meaningful to integrate a fossil-fuel heater to ensure
the system can operate at full load for longer time. Back-up fuels such as coal, oil, naphtha
and natural gas may be used.
Rankine-cycle systems whether powered by solar energy or fossil fuel offer relatively low
efficiencies. The conversion efficiency of heat to electricity amounts to approximately 40%.
If the conversion from solar energy or fossil fuel to heat is considered, the plant efficiency
drops to approximately 35%. /EEL&MRCL 1999/ The following figure illustrates a typical
Rankine Cycle System.

27 CSP Technology State of the Art
Figure 2-18: Rankine Cycle system /EEL&MRCL 1999/
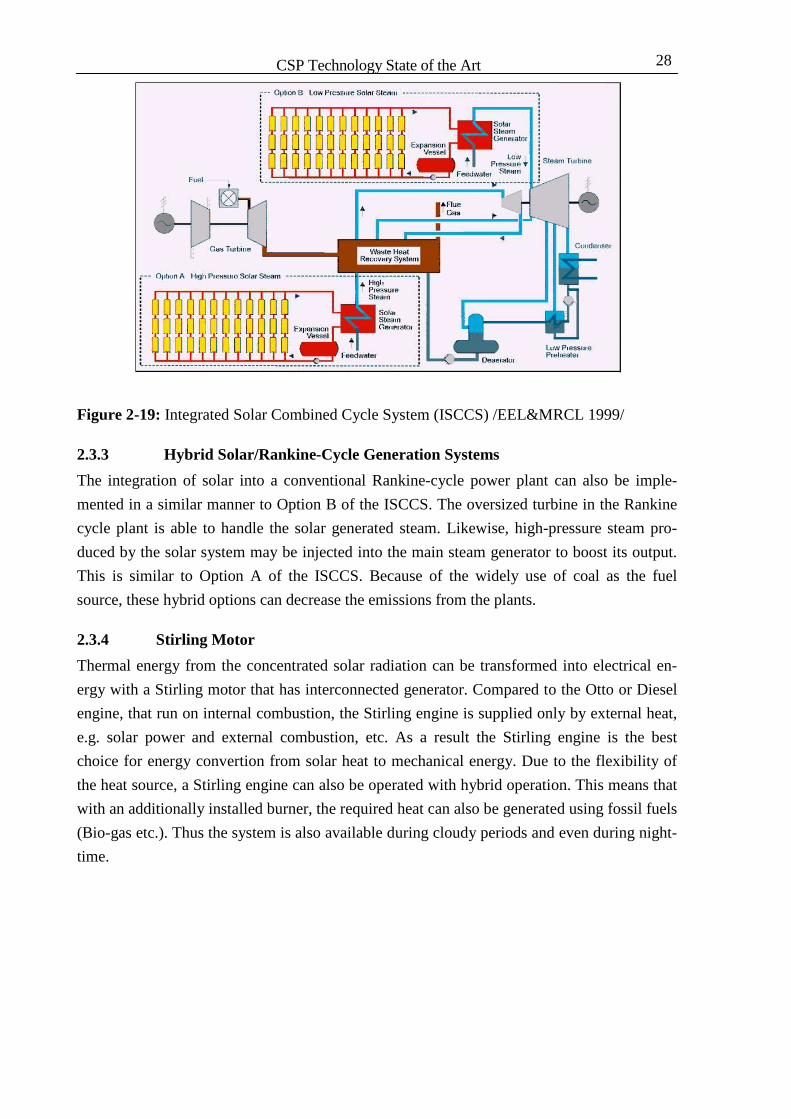
2.3.2 Integrated Solar Combined Cycle System (ISCCS)
An Integrated Solar Combined Cycle System (ISCCS) differs from the Rankine-cycle system
in that the solar components are an add-on to a conventional power plant, sometimes referred
to as a solar boost. Solar heat can either produce additional steam in the Heat Recovery
Steam Generator (option A) or can generate low-pressure steam that is fed directly into the
steam turbine (option B). In both cases, the capacity of the steam turbine is greater than in a
conventional combined cycle and can handle the additional steam generated by solar energy.
When the system at the peak output, the solar system has approximately 20 to 30% of com-
bined cycle output, for example, the additional solar systems can increase the output of a
100MW combined cycle plant to 130MW. Annually, the contribution from the solar system
falls to approximately 10%. The solar system cannot generate electricity on its own; it must
operate as a power boost when the gas turbine is operated. Additionally, the entire system
should be designed efficiently so that the operation of the combined cycle does not get worse
without solar energy. /EEL&MRCL 1999/
The two main advantages of ISCCS compared to other power plants are firstly, a solar system
integrated with a combined cycle can increase its power output when required; secondly,
ISCCS can increase its peak capacity with a lower capital cost compared with other power
plants.
At high outdoor temperature, the output of conventional combined cycle is reduced, because
the lower air density means the less mass flow through the gas turbine. Generally, the solar
system has its peak output in the early afternoon when the outdoor temperature is at its high-
est. The figure below illustrates an ISCCS.
CSP Technology State of the Art 28
Figure 2-19: Integrated Solar Combined Cycle System (ISCCS) /EEL&MRCL 1999/
2.3.3 Hybrid Solar/Rankine-Cycle Generation Systems
The integration of solar into a conventional Rankine-cycle power plant can also be imple-
mented in a similar manner to Option B of the ISCCS. The oversized turbine in the Rankine
cycle plant is able to handle the solar generated steam. Likewise, high-pressure steam pro-
duced by the solar system may be injected into the main steam generator to boost its output.
This is similar to Option A of the ISCCS. Because of the widely use of coal as the fuel
source, these hybrid options can decrease the emissions from the plants.
2.3.4 Stirling Motor
Thermal energy from the concentrated solar radiation can be transformed into electrical en-
ergy with a Stirling motor that has interconnected generator. Compared to the Otto or Diesel
engine, that run on internal combustion, the Stirling engine is supplied only by external heat,
e.g. solar power and external combustion, etc. As a result the Stirling engine is the best
choice for energy convertion from solar heat to mechanical energy. Due to the flexibility of
the heat source, a Stirling engine can also be operated with hybrid operation. This means that
with an additionally installed burner, the required heat can also be generated using fossil fuels
(Bio-gas etc.). Thus the system is also available during cloudy periods and even during night-
time.

29 CSP Technology State of the Art
Figure 2-20: Function process of the Stirling motor /Bergermann 2001/
A simple Stirling engine is made up of a sealed system with two cylinders; these are the ex-
pansion and the compression cylinder, respectively. And the pistons of these are attached
with a crankshaft. The working gas of this Stirling engine is helium. In function process 1-2
shown in figure above, the working gas is heated by the solar radiation and because of the
increasing temperature expand in the expansion cylinder. This pushes the piston down and
creates power. In process 2-3, the hot working gas in the expansion cylinder is pushed by the
power into the compression cylinder. Between the two cylinders the hot working gas goes
through a regenerator. Most of the energy is stored in the generator and then the hot gas is
cooled by a gas cooler. In process 3-4, the piston will return because of the inertia of the
crankshaft and at a low temperature the working gas is then compressed. In the last process,
the gas is moved back into the expansion cylinder through reabsorbing of the heat in the re-
generator.
The engines of the dish/Stirling power plants use helium or hydrogen at a working gas tem-
peratures between 600 and 800°C. And the working gas mean pressure controlls the power
output of the motor. /Doerte et al. 2002/

CSP Technology State of the Art 30
2.4 Thermal Storage Devices
Compared to other renewable energy technology, the CSP possess an advantage in that the
collected energy is easy to store in the form of heat. The thermal storage can increase the
availability and capacity factor of the power plant and thus improve the system flexibility. To
store heat energy in CSP system, a choice can be made from several different systems: solid
salt, two-tank molten salt, thermocline, solid materials (concrete), pressurized saturated wa-
ter, etc. Currently the most proven thermal storage technology is two-tank molten salt system.
The two-tank molten salt system implemented in the parabolic trough power plant Andsol 1
includes the following components: an oil-to-salt heat exchanger; a cold storage tank operat-
ing at 290°C; a hot storage tank operating at 385°C, and two circulation pumps. The storage
medium used in this system is a mixture of 60% sodium nitrate (NaNO3) and 40% potassium
nitrate (KNO3), which has been proved as a favorable combination. On sunny days, the heat
energy is transported by synthetic oil from the solar field to the oil-to-salt heat exchanger and
then this heats the salt in the cold tank to 384°C, which will then be stored in the hot tank. In
the evening or on the cloudy days, the salt mixture is pumped to the exchanger and heats the
oil to provide thermal energy for electricity generation.
The mass storage system with heat storage medium such as concrete and ceramic has also
been implemented in the demonstrate projects e.g. the LS-3 (HTF) test loop. In this project
the storage system consists of four 5m³, 10-15-ton, two concrete and two ceramic storage
modules. Each module presents a 175kWh storage capacity. The advantages of this storage
system include the lower cost of the storage medium and simple structure. However, it has
also obvious drawback: the great heat loss during charging and discharging of the storage
material.
2.5 Technology Comparison of CSP
In this section the technical information of the four major CSP systems is summarized and
compared to analyze their advantages and disadvantages. The technical data shown in the
following table is based on a DLR report.
31 CSP Technology State of the Art
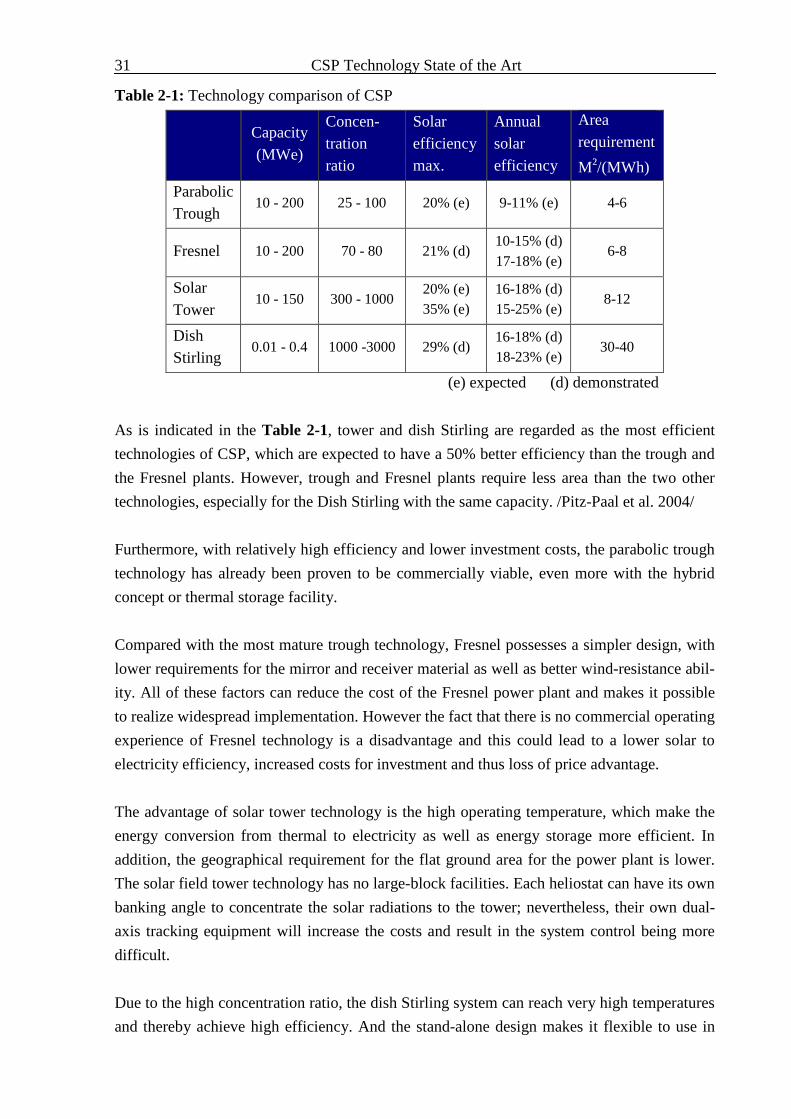
Table 2-1: Technology comparison of CSP
Capacity (MWe)
Concen-tration ratio
Solar efficiency max.
Annual solar efficiency
Area requirement
M²/(MWh)
Parabolic Trough
10 - 200 25 - 100 20% (e) 9-11% (e) 4-6
Fresnel 10 - 200 70 - 80 21% (d) 10-15% (d) 17-18% (e)
6-8
Solar Tower
10 - 150 300 - 1000 20% (e) 35% (e)
16-18% (d) 15-25% (e)
8-12
Dish Stirling
0.01 - 0.4 1000 -3000 29% (d) 16-18% (d) 18-23% (e)
30-40
(e) expected (d) demonstrated
As is indicated in the Table 2-1, tower and dish Stirling are regarded as the most efficient
technologies of CSP, which are expected to have a 50% better efficiency than the trough and
the Fresnel plants. However, trough and Fresnel plants require less area than the two other
technologies, especially for the Dish Stirling with the same capacity. /Pitz-Paal et al. 2004/
Furthermore, with relatively high efficiency and lower investment costs, the parabolic trough
technology has already been proven to be commercially viable, even more with the hybrid
concept or thermal storage facility.
Compared with the most mature trough technology, Fresnel possesses a simpler design, with
lower requirements for the mirror and receiver material as well as better wind-resistance abil-
ity. All of these factors can reduce the cost of the Fresnel power plant and makes it possible
to realize widespread implementation. However the fact that there is no commercial operating
experience of Fresnel technology is a disadvantage and this could lead to a lower solar to
electricity efficiency, increased costs for investment and thus loss of price advantage.
The advantage of solar tower technology is the high operating temperature, which make the
energy conversion from thermal to electricity as well as energy storage more efficient. In
addition, the geographical requirement for the flat ground area for the power plant is lower.
The solar field tower technology has no large-block facilities. Each heliostat can have its own
banking angle to concentrate the solar radiations to the tower; nevertheless, their own dual-
axis tracking equipment will increase the costs and result in the system control being more
difficult.
Due to the high concentration ratio, the dish Stirling system can reach very high temperatures
and thereby achieve high efficiency. And the stand-alone design makes it flexible to use in

CSP Technology State of the Art 32
many different external conditions. However, the disadvantages of the dish system are also
significant. The Decentralized design of the energy conversion from solar to electricity
through the dish equipment is not as efficient as a centralized approach. Moreover, the Stir-
ling engine makes the moving structure cumbersome while the frame and the tracking system
must strong enough. The huge moving parts require frequent maintenance.

33 Global CSP Projects – A Review
3 Global CSP Projects – A Review
Since the first large CSP plant was built in 1912 in Meadi, 25km south of Cairo, CSP tech-
nology has a history of around 97 years. The first commercial CSP facility began to operate
1984, which was also the first plant of the 354 megawatts SEGS power plant group. From
1980 until the end of 2008, the total capacity of the cumulative installed concentrating solar
power worldwide comes to around 603 megawatts. By 2012 this figure will reach 6,400
megawatts, about 10 times the current capacity. Among this over 90 percent of the planed
new capacity will be in the United States and Spain, with a combined total of over 5,600
megawatts expected to come online by 2012. /EPI 2009/
The figure below shows the development of concentrating solar power in the period 1985 to
2014.
Figure 3-1: World cumulative installed CSP capacity 1985 – 2014 /REW 2009/
Owing to previous developments in the US with around 350MW operating CSP plants since
1980, the parabolic trough system is regarded as the most mature large scale technology. The
first commercial CSP plant in Europe, 50MW Andasol 1 project with 7.5 hours of storage,
utilized also the parabolic trough technology. This project has been in operation in Granada
in Spain since 2008. Two additional plants of 50MW each, Andasol 2 and 3, are scheduled to
be built on the same site. The second main CSP technology is solar tower system. Since
March 2007, an 11MW saturated steam solar tower project, named PS10, has been operating

Global CSP Projects – A Review 34
in Andalusia in Spain. This was the first commercial scale solar tower project in Europe. So-
lar Tres is another project under development in Spain based on a molten salt central receiver
system. In November 2008, the Spanish engineering company group SENER announced the
start of its construction. /PS 2008/ Dish/Stirling technology with proposing modular systems
of relatively small size (between 5 to 50 kW) is still in the development phase. This technol-
ogy will be implemented primarily for a decentralized power supply. The 5MW Kimberlina
Solar Thermal Energy Plant will be built in Bakersfield, California. This project uses Ausra's
linear Fresnel reflector technology. Another linear Fresnel solar power plant named Liddell
Power Station is currently operating in the Hunter Valley, New South Wales, Australia.
The average annual load factor of a solar only CSP plant without thermal storage is approxi-
mately 1800 to 2500 full-load hours. In additional, CSP technologies can operate with ther-
mal storage and hybridized or combined cycle systems in order to increase and secure the
power dispatch. For example, the 15 hours of molten salt storage in the Solar Tres project
increase the capacity factor by 64% without fossil fuel hybrid operation. A number of Inte-
grated Solar Combined Cycle (ISCC) projects that use solar and natural gas as energy source
are currently under development, for example, in Algeria, Egypt, India, Italy and Morocco.
/CEC 2007/ The following figure illustrates the countries, which have already built or have
announced large-scale CSP plants. /EPI 2009/
Figure 3-2: Current large-scale CSP projects global
In the following sections the projects of major CSP technologies will be described in detail.
• 50 MW China• 3405 MW USA
• 210 MW Australia
• 100 MW UAE
•100 MW South Africa
• 25 MW Mexico • 1 • 2
• 3
• 5
• 4
• 20 MW Iran • 7 • 6
FranceItaly
Germany
Current CSP Project Development
150MW Jordan7
250 MW Israel6
30 MW Egypt5
52 MW Greece4
1740 MW Spain3
20 MW Morocco2
20 MW Algeria1
150MW Jordan7
250 MW Israel6
30 MW Egypt5
52 MW Greece4
1740 MW Spain3
20 MW Morocco2
20 MW Algeria1
* Countries with Published CSP Feed-in Tariff

35 Global CSP Projects – A Review
3.1 Parabolic Trough Projects
Parabolic trough plants are considered to be the most economical and the most mature CSP
technology available today. The cumulative installed capacity of parabolic trough power
plant accounts for over 97 percent worldwide /SullivanM 2009/. This chapter will provide a
review of all operated commercial projects using trough technology. In particular, the 50MW
Andasol 1 plant in Spain will be described in detail.
3.1.1 Commercial Activities
The table below lists the current commercial parabolic trough plants operated globally.
Table 3-1 : Commercial parabolic trough plants worldwide (status Juli 2009)
Name Location Capacity Technology Developer
Operational
SEGS
Nevada Solar One
Andasol 1
California, USA
Nevada, USA
Spain
354 MW
64 MW
50 MW
Trough
Trough
Trough + storage
FPL Energy
Acciona Solar Power
Solar
Millenium
Under Construction
Andasol 2, 3 Spain each 50 MW Trough
Solar
Millenium
Announced
Mojave Solar Park
Beacon Solar Pro-ject
Shams 1
Solana Station
Barstow
Yazd
Victorville 2
Kuraymat Plant
Ben Mathar Plant
Hassi R’mel
California, USA
California, USA
Abu Dhabi
Arizona, USA
California, USA
Iran
California, USA
Egypt
Morocco
Algeria
553 MW
250 MW
100 MW
280 MW
59 MW
67 MW
50 MW
40 MW
30 MW
25 MW
Trough
Trough
Trough
Trough + storage
Trough + storage
Trough ISCCS*
Trough + storage
Trough ISCCS
Trough ISCCS
Trough ISCCS
Solel
FPL Energy
ADFEC
Abengoa Solar
Solar MW Energy
Unknown
City of Victor-ville
Iberdrola
Abengoa
Abener
SEGS Power Plants
Since 1984 SEGS parabolic trough power plants with a total capacity of 354MW have been
connected to the Southern California grid. The facilities have a total collector area of over 2
km² and cover altogether more than 6.5km² with a long term availability of over 99%. The
annual electricity output of the SEGS power plants group can reach up to 800 million kWh.
The data of the 9 SEGS power plants are shown in Table 3-2. /NREL 2009/

Global CSP Projects – A Review 36
Table 3-2 : Key data of SEGS power plants
Plant Name
Location Year of Operation
Net Output
(MW e)
Solar Field Out-
let (°C)
Solar Field Area
(m2)
Solar Turbine
Effic. (%)
Power Cycle
Dispatch-ability
Provided By
SEGS I Daggett, CA
1985 13.8 307 82,960 31.5 40 bar, steam
3-hrs TES
SEGS II 1986 30 316 190,338 29.4 40 bar, steam
Gas boiler
SEGS III
Kramer Junction, CA
1987 30 349 230,300 30.6 40 bar, steam
Gas boiler
SEGS VI 1989 30 390 188,000 37.5 100 bar, reheat
Gas boiler
SEGS V 1988 30 349 250,500 30.6 40 bar, steam
Gas boiler
SEGS VI 1989 30 390 188,000 37.5 100 bar, reheat
Gas boiler
SEGS VII 1989 30 390 194,280 37.5 100 bar, reheat
Gas boiler
SEGS VIII Harper Lake, CA
1990 80 390 464,340 37.6 100 bar, reheat
HTF heater
SEGS IX 1991 80 390 483,960 37.6 100 bar, reheat
HTF heater
Until recently SEGS were still the largest solar energy generation facilities in the world.
There are several special incentives for SEGS power plants to promote the utilization and
widespread use of the new CSP technology:
• Federal and state investment tax credits
• Solar property tax exclusion
• Accelerated depreciation
The SEGS power plants were built by Luz Industries and commissioned between 1984 and
1991. After a lapse of over 15 years since the Southern California systems were commer-
cially deployed, there are now a number of parabolic trough pre-commercial and fully-
commercial deployments underway.
Nevada Solar One
The Nevada Solar One project is a 64MW parabolic trough system developed and owned by
a subsidiary of global Acciona Energía group: Acciona Solar Power. On February 11, 2006 it
began its 16 months’ construction and began operating in mid July, 2007. With an investment
of over 250 million US Dollars, it supplies up to 134 million KWh of electricity per year.

37 Global CSP Projects – A Review
/REW 2007/ Table 3-3 provides the technical data of the Nevada Solar One power plant.
/NREL 2009/
Table 3-3: Major data of Nevada Solar One power plant
Plant Name
Location Year of Operation
Net Output
(MW e)
Solar Field Out-
let (°C)
Solar Field Area
(m2)
Solar Turbine
Effic. (%)
Power Cycle
Dispatch-ability
Provided By
Nevada Solar One
Boulder City, NV
2007 64 390 357,200 37.6 100 bar, reheat None
Mojave Solar Park
In July, 2007 Solel Solar Systems announced the development of a 553MW parabolic trough
power plant system situated in the Mojave Desert in California that will be completed and
fully operational in 2011. Solel has signed a long-term power purchase agreement with the
California utility PG&E that will bring renewable energy to 18% of the company's total
power supply in the coming years, and will bring compliance closer to the California re-
quirement of 20% by 2010. The complete power plant will cover up to 24 km² of land in the
Mojave Desert and use 1.2 million mirrors and 317 miles of vacuum tubing to capture the
desert sun’s heat. /YNN 2007/
Beacon Solar Project
In March 2008 Beacon Solar, a subsidiary of Florida Power & Light Energy, filed an applica-
tion for certification with the California Energy Commission with the intention of construct-
ing, owning and operating a 250MW solar power plant in the Mojave Desert which is called
the Beacon Solar Energy Project. The Beacon Solar Project will use the parabolic trough so-
lar thermal technology which has an approximate 5km² mirror area and 8.1km² plant site.
This project costing approximately 1 billion Dollars is scheduled to begin construction in late
2009 with commercial operation commencing approximately two years later. /FS 2008/
Andasol Projects
Spain is leading the way in Europe with new deployments of CSP technologies due to its fa-
vorable feed-in tariff for solar power. Andasol-1 is a 50MW parabolic trough system being
developed by the Spanish ACS Cobra Company who is the majority shareholder, and the
German Solar Millennium Group being the minority shareholder. The Andasol project is the
first application of parabolic trough power plant using the molten salt thermal storage tech-
nology.
Shams 1
The Abu Dhabi Future Energy Company (ADFEC) of the United Arab Emirates has an-
nounced that it will invest US$400-500 million to build a parabolic trough CSP plant with a

Global CSP Projects – A Review 38
capacity of 100MW that is expected to be operational by the end of 2010. The plant called
Shams 1 will be constructed in the town of Madinat Zayad in the western of Abu Dhabi, and
is reported to be the first of many CSP plants to be set up in the UAE to feed electric power
to the national grid. ADFEC has been authorized to develop and execute the Masdar Initiative
of future energy in Abu Dhabi in order to promote the commercialization of renewable en-
ergy technologies.
3.1.2 Andasol 1-3: Parabolic Trough Plant with Thermal Storage
The Andasol power plants were constructed in the southern Spanish province of Granada.
Andasol 1 was the first parabolic trough power plant in Europe and is currently the largest in
Europe, when considering its collector area of over 0.51 square kilometers. Three power
plants that each with 50MW capacity will be constructed in a similar way are planned for this
site. After the entire project is completed, Andasol is eble to supply up to 600,000 people
with environmentally-friendly solar electricity and achieve a emission reduction of CO2 by
450,000 tons annually.The following table shows the general technical data of the Andasol
power plant.
Table 3-4: Technical data of Andasol project /SM 2008/
3.1.2.1 Site Selection
Location
hh

39 Global CSP Projects – A Review
The site for Andasol projects are selected near the Spanish city of Aldeire in the province of
Granada on the Guadix plateau. The location of the power plants has an average elevation of
over 1,090 meters above mean sea level. The land of the whole area has been leveled and all
plants and stones those provide shade has been removed. The power plants are sited directly
on the A92 highway and remote from the residential district. The figure below shows the site
of Andasol project.
Figure 3-3: Location of the Andasol project /Andasol 2008/
Solar Resource
The evaluation of the solar resource for the site of Andasol projects is due to the measure-
ments on site and the satellite data of the long-term information of the site. A Rotating
Shadow band Pyranometer (RSP) Sensor was implemented for the on site measuring, which
is a professional instrument used to measure the global solar radiation and the direct solar
radiation. The sensors are monitored regularly by the German Aerospace Center (DLR) to
insure their accuracy. The local measurement provides also the data of ambient temperature,
humidity, wind direction as well as the wind speed at meteorological stations, which started
operation in March 2000.

Global CSP Projects – A Review 40
Figure 3-4: Monthly total direct radiation at the site of Andasol project /SM 2008/
The graph above illustrates the solar radiation values at the site of Andasol project. Besides
the on site measuring, satellite data contributes to provide a long-term value of the solar ra-
diation for the project site. Based on the data measured on site and from the satellite the direct
solar radiation at the site of Andasol power plants, an average value of 2,144 kWh/ (m²•a)
was estimated.
Water Availability
Spain is possessed of an above average water availability. The selected site of the power
plants is surrounded by the Sierra Nevada mountain range and owns extensive underground
water resources. The water consumption of Andasol power plants is estimated to be approxi-
mately 870,000 m3 per year, among them water used for cooling in the cooling towers ac-
count for the largest part. And the water requirements can be met through the use of ground
water extracted from wells at the power plant’s site.
3.1.2.2 Power Plant Components
Each of the three Andasol power plants has an area of 195 hectares, which approaches to
2km2 and is in a north-south orientation. The 312 parabolic trough collector rows in the solar
field of each power plant are possessed to an area of around 0.51km2. The absorber tubes
used as the receiver in each power plants account for approximately 90 kilometers. /SM
2008/
The figure below shows a whole view of power plant Andasol 1 with solar field, power cy-
cles, storage tanks and other supporting infrastructure.

41 Global CSP Projects – A Review
Figure 3-5: Parabolic through power plant Andaosl 1 /SM 2008/
Collectors
The 150m collector used in the Andasol parabolic trough power plants consist of mirrors,
absorber tubes and the steel support structures. The supporting structure is attached to the
ground with a steel pylon. The sun- tracking mirrors reflect the solar radiation onto the ab-
sorber tubes. This solar tracking system adjust the collector through the use of the hydraulic
drives along a north-south single axis. The precision of the tracking system can achieve
0.1mm and is controlled by computers in the control room. Those computers gather the in-
formation from each collector individually and direct the orientation of collectors automati-
cally. The collectors were designed to tolerate extreme weather conditions. For instance, the
wind load that the solar field can withstand attains to 13.6 m/s (about 49 km/h).
The 4mm thick, white parabolic glass is implemented in the mirrors of the collector and out-
side this back-silvered glass there is a protective layer. According to the Flabeg Group, the
mirror supplier of Andalsol power plants 1 and 2, the used RP-3 mirrors have two typical
sizes of 2.79 and 2.55m2 and have a reflectivity of about 93%. Each power plant utilizes a
total of nearly 201,000 mirrors in their solar field. For Andasol 3, Rioglass Solar S.A. will
supply the parabolic mirrors. /SM 2008/
Receivers
Absorber tubes were specially designed for the application in parabolic trough power plants
as receiver. The receivers used in the Andasol power plants are provided by Solel Solar Sys-
tems Ltd. of Israel and Schott Solar AG, Germany. Solel has years of experience in the
manufacture of absorber tubes and has already provided the absorber tubes for the parabolic
trough power plants established in the late 1980s, in California. Schott has developed in re-

Global CSP Projects – A Review 42
cent years new material for absorber tubes of parabolic trough power plants, which allows the
absorber tube to tolerate much greater temperature differences, increases the solar absorption
and reduces the reflection from the metal pipe.
The Schott absorber tubes are made of 4m long stainless-steel pipes with multi-coating. At
the operating temperature of around 400oC it can achieve an absorption ratio of 95% and
maintains a thermal radiation of 14%. Approximately 22,500 absorber tubes are implemented
in each of the Andasol power plants.
Power Cycles
Similar to the conventional fossil fuel fired power plants, the power cycles of parabolic
trough power plants are composed of turbines, generators and other auxiliary facilities. An
advantage of the 50MW turbine for Andasol power plant is characterized by its specifically
design, which ensures the daily smooth start-up and shut down of the turbine. For Andasol 1
and 2 Siemens produced the turbines and for Andasol 3 MAN Turbo will be the turbine sup-
plier.
Storage System
To allow the power plants providing scheduled power, the Andasol power plants utilize the
thermal storage system that the plants can work even in bad weather or at night with ap-
proximately 28,500 tons of molten salt for maximum 7.5 hours. The molten salt thermal stor-
age system operates at atmospheric pressure and is made of two tanks each power plant. The
storage tank has a height of 14m and a diameter of 36m. During the function process, the
temperature of molten salt mixture in the cold tank amounts to about 290oC of and is raised
to 390oC in the hot tank. Figure below shows the two-tank molten salt thermal storage sys-
tem used by Andasol 1.

43 Global CSP Projects – A Review
Figure 3-6: Two-tank molten salt thermal storage system /SM 2008/
3.1.2.3 Operation
In the Andasol power plants, the collectors in the solar field follow the sun course in the day
and they are controlled by the high-precision solar tracking system. The sun light is reflected
on the receiver and heat the HTF (synthetic oil) flowing through the absorber tubes. The
thermal energy within this HTF can directly drive the turbine and generator or it can be stored
in the thermal storage system. The following figure illustrates a basic operation shame of
Andasol plant.
Figure 3-7: Basic operation shame of Andasol 1 /New 2009/
At midday during maximum sunlight, electricity is generated and simultaneously the storage
system is charged. The heat within the HTF is sent to the molten-salt fluid as the thermal
storage medium. During the process that the molten salt is pumped from a cold tank to a hot
tank, thermal energy will be collected until the hot tank is completely filled.
When the intensity of the solar radiation is not strong enough, heat is only used to produce
electricity but no longer transferred to the storage system. When there is no sunshine or in the
evening, the solar field stops working and the thermal storage system begins to discharge to
run the power cycle continuously, so that the Andasol power plants can dispatch the power
demand at any time. To maintain the liquid state of the HTF in the receiver and storage salt in
the tanks, gas fired heaters are auxiliary installed.

Global CSP Projects – A Review 44
3.2 Solar Power Tower Projects
To date, most solar power tower plants were built and are operating as demonstration plants
except for the 11MW solar tower plant PS10 in Spain. In this chapter, the major projects of
demonstration plants as well as the commercial PS10 are discussed.
3.2.1 Projects Overview
In the past, several solar tower power plants have been realized within R&D projects spon-
sored by public money and industry. In the following sections descriptions of some of these
research plants are presented.
Solar One
Solar One is a 10MW solar tower power plant that was operated in the period from 1982 to
1988 in the Californian Mojave Desert. It successfully proved the possibility of the large
scale power generation contributed by solar tower plants. At the receiver, Water was imple-
mented as heat transfer medium. The major difficulty revealed by the Solar One was the con-
tinuous operation during cloudy days. Beyond that, the efficiency of electricity generation
depends to a high degree on the water/steam tube receiver technology, which can be opti-
mized through the molten salt volumetric receivers.
Solar Two
With the aim of solving the problems shown by the Solar One plant, the Solar Two plant em-
ployed molten salt (40% of KNO3 and 60% of NaNO3) as the HTF and heat storage medium.
As a result of the implementation of thermal storage system, it is more independent from the
availability of solar radiation. The functional scheme of the Solar Two tower power plant is:
The cold salt is pumped into the receiver, which is mounted on the top of the tower and is
heated by the concentrated solar energy. Then, it is moved to the hot tank, from where the hot
salt is transferred to a steam generator to produce electricity. Following this, the cooled salt
returns to the cold tank. Solar Two has an electricity capacity of 10MW and can operate for
up to three hours without solar radiation due to the thermal storage system.
Phoebus/TSA/Solair
Phoebus/TSA/Solair is a solar tower power plant employed the open volumetric air receiver
technology. This plant was operated from 1993 to 1997 with a thermal capacity of 3MW.
At the power plant, the hot air generated by the receiver is transferred to the steam generator
and provides the superheated steam that can drive the turbine/generator unit and produce
electricity. In order to generate power at times without sunlight, an additional natural-gas-
fired turbine is implemented. The Phoebus solar tower plant is characterized by its low ther-
mal inertia of the system that can ensure the fast start-up of the power plant. In the further

45 Global CSP Projects – A Review
approach this concept will simplify the plant structure and optimize the heat transfer of fluid
air.
PS10
Due to the positive experiences using the Phoebus/TSA/Solair System, a 10MW solar tower
power plant PS10 began to design and constructe in the Southwest of Spain in 2004 and has
been operational since 2007. Different from Phoebus system PS10 employs a tube saturated
steam receiver which consists of four tube panels with the size of 5.36 x 12.0m and heats
steam at 40bar to 250oC. The receiver is situated on a tower of approximately 110m high.
The heliostat field of PS10 consists of 624 faceted glass/metal heliostats with the type of
Sanlúcar 120. Each heliostat has a mirror surface of 121m². The thermal storage system of
PS10 solar tower power plant allows the plant 30min operation at 70% of its load without
solar radiation. /FTPR 2005/
Solar Tres
The 15 MW Solar Tres solar tower power plant is designed and constructed based on the op-
erational experience of the plant Solar Two (using salt as heat transfer and heat storage me-
dium). As a result of that this power plant was named Solar Tres, the Spanish of Solar Three.
A molten salt tube receiver is equipped in the Solar Tres plant using salt as HTF and heat
storage medium. The designed thermal capacity of the receiver is 120MW. The heliostat field
of Solar Tres consists of 2,494 faceted glass/metal heliostats with simplified design. Each
heliostat uses highly reflecting mirrors with a surface size of 96m². In additional, the thermal
storage system of the power plant can maintain a normal operation for 16hours on cloudy
days and at night. /Kaltschmitt et al. 2007/
3.2.2 PS 10: An 11MW Solar Tower Power Plant in Southern Spain
The PS10 solar tower power plant has an electricity capacity of 11MW and is located at
Sanlúcar la Mayor, southern Spain. This power plant is the first commercial concentrating
solar thermal power plant using solar tower technology of the world. In Europe, it is also one
of the largest solar power plants.
The PS10 power plant started its construction in June 2004. The heliostats using mobile mir-
rors controlled by dual-axis solar tracking system concentrate the sunlight onto the top of a
tower with the height of 115m. The receiver mounted on top of the tower creates saturated
steam and transfers it to a conventional steam turbine-generator unit that produces the elec-
tricity. PS10 solar tower plant can produce electricity of around 23GWh annually and deliver
it to the grid.

Global CSP Projects – A Review 46
3.2.2.1 Location
The PS10 plant is constructed in the town of Sanlúcar la Mayor, which is located 25km west
of the Spanish city of Seville. PS10 is the first plant of a plants set to be constructed in the
same area developed by the company Abengoa Solar. All the plants belong to a large solar
project called Plataforma Solar de Sanlúcar la Mayor, PSSM. The figure below shows the
planned location of PSSM.
Figure 3-8: Location of solar tower plant PS10 /FTPR 2005/
The location of PSSM is selected in one of areas that has low cost of solar electricity genera-
tion in Spain due to the high solar radiation as well as the availability of suitable land.
3.2.2.2 Power Plant Components
The technical data presented in this section is mainly in accordance with the final technical
report of PS10. /FTPR 2005/
Heliostats Field
PS10 heliostat field is composed of 624 heliostats for a total reflective surface of 75.216m². It
is arranged in 35 circular rows around the tower. Each heliostat, of the Sanlúcar 120 type, is a
mobile 121m² curved reflective surface mirror that concentrates the solar radiation onto a
receiver placed on top of a 100m tower. For this purpose, every heliostat is spherically curved
so that its focal point is at a distance equal to the slant range to the receiver. The figure below
shows the frontal view for a Sanlúcar 120 heliostat. /PSA 2004/
The Sanlúcar 120 heliostat consists of 28 curved mirrors with high reflectivity. With the aims
of minimizing the losses caused by cosine effect, shadowing, blocking, etc, the heliostat field
is designed with the use of computational procedures and simulation tools. This is the reason
why the losses due to, for example, shadows and blocks are lower than 4.5% every year.
The angle of heliostats is adjusted with the dual-axis solar tracking system that inclusive the
mechanical drives on each heliostat and the local control system. This control system has two

47 Global CSP Projects – A Review
major tasks. First, it gathers information of sun position, for example the azimuth and eleva-
tion angle of the sun, with high accuracy. Second, the current information of heliostat posi-
tion is detected and compared with the required position. Based on the calculation result of
the control system, the heliostats are tilted to an appropriate angle by the mechanical drives,
thus the sun light is efficiently reflected onto receiver.
Tower
The tower design has been undertaken with the aim of obtaining a great visual effect for the
big tower of 115m high. For this reason, the tower has a thin body of 8m and for supporting
the 14m receiver, it is 18m wide. In the middle part, about half height of the tower has been
hollowed out so as to obtain a lighter body. An observation platform has been planned to
construct at a height of 30m in order to have a good sight of its heliostat field in the north of
the tower and the 1.2MW Sevilla photo voltaic power plant in the south. The tower has been
constructed in the period of August to November 2005. The figure below shows the designed
view and final view of the PS10 tower.
Figure 3-9: Tower of PS10 /FTPR 2005/
Receiver
The tube saturated steam receiver of PS10 plant is mounted on the top of the tower with a
cavity concept that can reduce the radiation and convection losses. The receiver is exposed by
4 vertical panels with each one 5.40m wide and 12.00m high, which has a total heat exchange
area of approximately 260m2. The 4 panels are arrayed in a semi-cylinder with the radius of
7.00m. At the full load operation of the PS10 receiver, the solar radiation can be received
with the peak power of 650kW/m² and at the same time, over 100.000kg/h saturated steam
can be produced at 40bar, 250ºC.

Global CSP Projects – A Review 48
For the purpose of ensuring the operation at possible high temperature, special steel alloys
have been implemented in the receiver. With the aims of providing the energetic calculation,
performance information as well as the temperature alarm, calorimeters and thermocouples
are employed for the flow and temperature measurements of the receiver.
Power Block
The turbine of PS10 plant works at 250ºC, 40bar and with saturated steam as operating me-
dium. After the turbine-generator unit, steam is cooled by a water-cooled condenser at low
pressure. Out of the condenser steam is preheated with the turbine extractions. Afterwards,
the steam from the first preheater is moved to a deaerator and is heated with steam from a
different turbine extraction. Then, the third and final preheater with steam from the receiver
preheated the steam once more. As a result, the water temperature is raised to about 245ºC
and is sent to the receiver again.
Thermal Storage Tank
For briefly cloudy periods during the day, the PS10 plant is operated with a 20MWh saturated
steam thermal storage system. At 50% turbine load, the thermal storage system can provide
the plant operation for 50 minutes. This thermal storage system consists of 4 tanks and is
loaded during the full load operation in abundant solar radiation sequentially. When there is
no sufficient sunlight, energy from the thermal storage system will cover it at a pressure from
the designed minimum pressure to 40bar and the turbine will be driven at 50% workload. The
figure below illustrates the thermal storage system of PS 10 plant.
Figure 3-10: Thermal storage tanks of PS 10 /FTPR 2005/

49 Global CSP Projects – A Review
3.2.2.3 Operation
The figure below illustrates the system design of the PS10 power plant. /EC 2007/
Figure 3-11: Basic system design of solar tower plant PS 10 /FTPR 2005/
With the clean heliostats and wind speed lower than approximately 36km/ h, PS10 can be
operated smoothly. During full load operation, the receiver on the top of the tower can accept
and transferred the concentrated solar radiation with a thermal capacity of about 55MW. Dur-
ing cloudy periods, the thermal storage system of the plant provides the energy to the turbine
and run it at 50% workload. In additional, natural gas-fired backup plant can also supply 12%
to 15% of its capacity. The 11MW PS10 solar tower power plant has an annual capacity of
24.3GWh and achieves a total solar to electricity efficiency of around 17%. /AS 2009/

Cost Status of CSP 50
4 Cost Status of CSP
For the widespread use of CSP as a large scale electricity generation technology, costs will
play an important role. In the current CSP projects, the cost of electricity generation through
CSP is much higher compared with the cost of electricity generation through conventional
technologies. However, with large scale implementation and technological advancements, the
cost of electricity generation from CSP is expected to decrease continuously.
According to a study of renewable energy made by the IEA, the current CSP technology sys-
tems are implemented in the cost range of 0.19$/kWh to 0.25$/kWh. In the conventional
power market, CSP competes with mid-load power in the range of 0.037$/kWh to
0.05$/kWh. As different scenarios have predicted, the costs of CSP can be reduced to com-
petitive levels in the next 10 to 15 years. Competitiveness is affected not only by the cost of
the technology itself, but also by potential price increases of fossil energy and by the inter-
nalization of associated social costs, such as carbon emissions. Therefore, it is assumed that
in the medium to long term, competitiveness will be achieved at a level of 0.05$/kWh to
0.075$/kWh for dispatchable mid-load power. /IEA 2006/
According to another report prepared by Electric Power Research Institute, when the global
cumulative capacity of CSP implementation reaches 4GW, the cost of electricity generation
from new plants in 2015 could be as low as 0.08$/kWh (nominal 2015 dollars) or nearly
0.05$/kWh (real 2005 dollars). /EPRI 2006/
To analyze and compare the cost of different CSP technologies an explanation of the meth-
odology for levelized energy cost calculation and an overview of CSP cost will be given in
this chapter.
4.1 Methodology for Calculation of Levelized Energy Cost
4.1.1 Definition of Levelized Energy Cost
Levelized Energy Cost (LEC) is defined as the total cost of a system over its lifetime divided
by the expected energy output over its useful lifetime. LEC includes all costs through the
lifetime of a plant including the initial investment, operations and maintenance, cost of fuel,
and cost of capital. It is a measurement of the cost of producing energy from a technology
and is an important parameter to gauge the commercial viability of any electricity generation
technology. The LEC is the minimum price at which energy must be sold for an energy
project to break even.
4.1.2 Methodology
The methodology employed in the calculation of the LEC is based on a simplified IEA me-
thod /IEA 1991/. The goal of this thesis is the comparison of different CSP technologies,
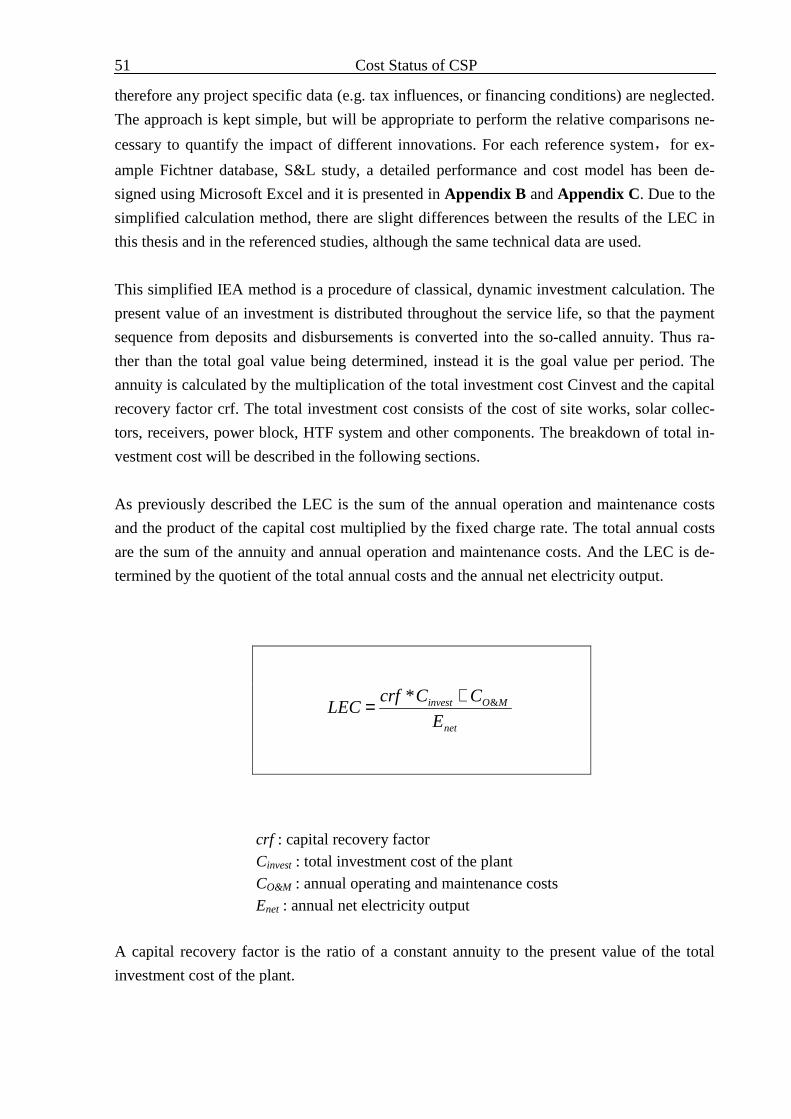
51 Cost Status of CSP
therefore any project specific data (e.g. tax influences, or financing conditions) are neglected.
The approach is kept simple, but will be appropriate to perform the relative comparisons ne-
cessary to quantify the impact of different innovations. For each reference system,for ex-
ample Fichtner database, S&L study, a detailed performance and cost model has been de-
signed using Microsoft Excel and it is presented in Appendix B and Appendix C. Due to the
simplified calculation method, there are slight differences between the results of the LEC in
this thesis and in the referenced studies, although the same technical data are used.
This simplified IEA method is a procedure of classical, dynamic investment calculation. The
present value of an investment is distributed throughout the service life, so that the payment
sequence from deposits and disbursements is converted into the so-called annuity. Thus ra-
ther than the total goal value being determined, instead it is the goal value per period. The
annuity is calculated by the multiplication of the total investment cost Cinvest and the capital
recovery factor crf. The total investment cost consists of the cost of site works, solar collec-
tors, receivers, power block, HTF system and other components. The breakdown of total in-
vestment cost will be described in the following sections.
As previously described the LEC is the sum of the annual operation and maintenance costs
and the product of the capital cost multiplied by the fixed charge rate. The total annual costs
are the sum of the annuity and annual operation and maintenance costs. And the LEC is de-
termined by the quotient of the total annual costs and the annual net electricity output.
net
MOinvest
E
CCcrfLEC &* +=
crf : capital recovery factor Cinvest : total investment cost of the plant CO&M : annual operating and maintenance costs Enet : annual net electricity output
A capital recovery factor is the ratio of a constant annuity to the present value of the total
investment cost of the plant.
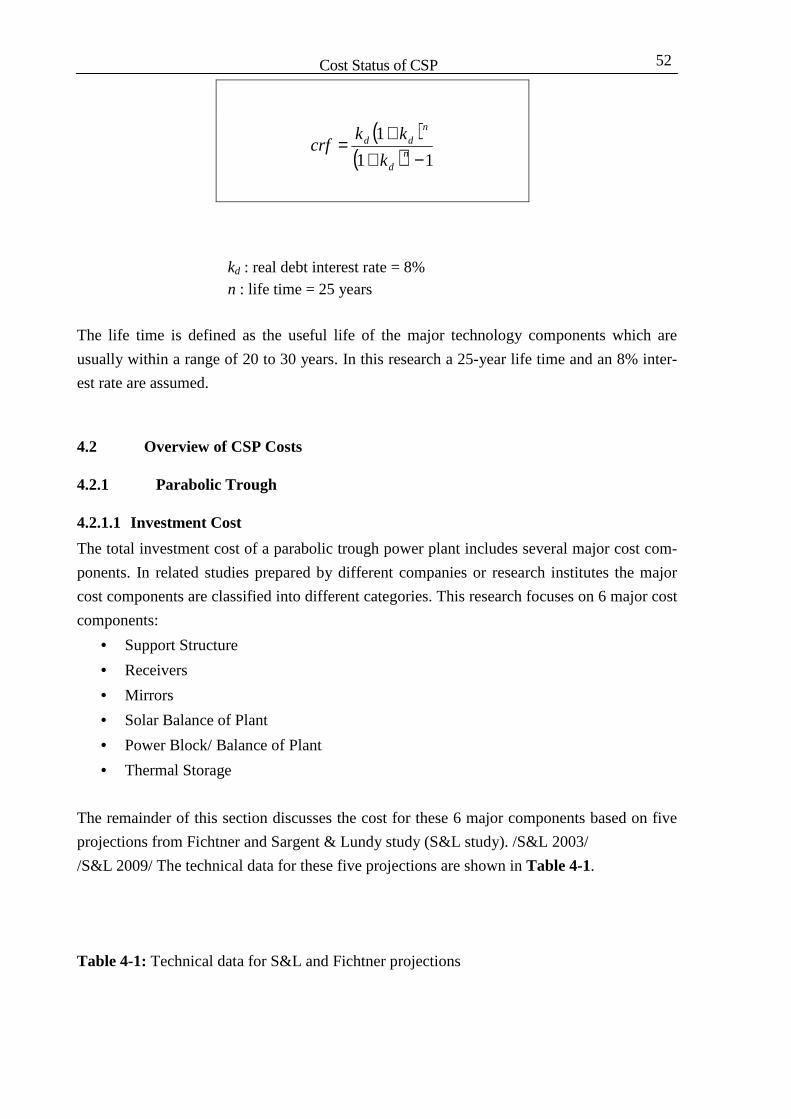
Cost Status of CSP 52
( )( ) 11
1
−++
=n
d
ndd
k
kkcrf
kd : real debt interest rate = 8% n : life time = 25 years
The life time is defined as the useful life of the major technology components which are
usually within a range of 20 to 30 years. In this research a 25-year life time and an 8% inter-
est rate are assumed.
4.2 Overview of CSP Costs
4.2.1 Parabolic Trough
4.2.1.1 Investment Cost
The total investment cost of a parabolic trough power plant includes several major cost com-
ponents. In related studies prepared by different companies or research institutes the major
cost components are classified into different categories. This research focuses on 6 major cost
components:
• Support Structure
• Receivers
• Mirrors
• Solar Balance of Plant
• Power Block/ Balance of Plant
• Thermal Storage
The remainder of this section discusses the cost for these 6 major components based on five
projections from Fichtner and Sargent & Lundy study (S&L study). /S&L 2003/
/S&L 2009/ The technical data for these five projections are shown in Table 4-1.
Table 4-1: Technical data for S&L and Fichtner projections
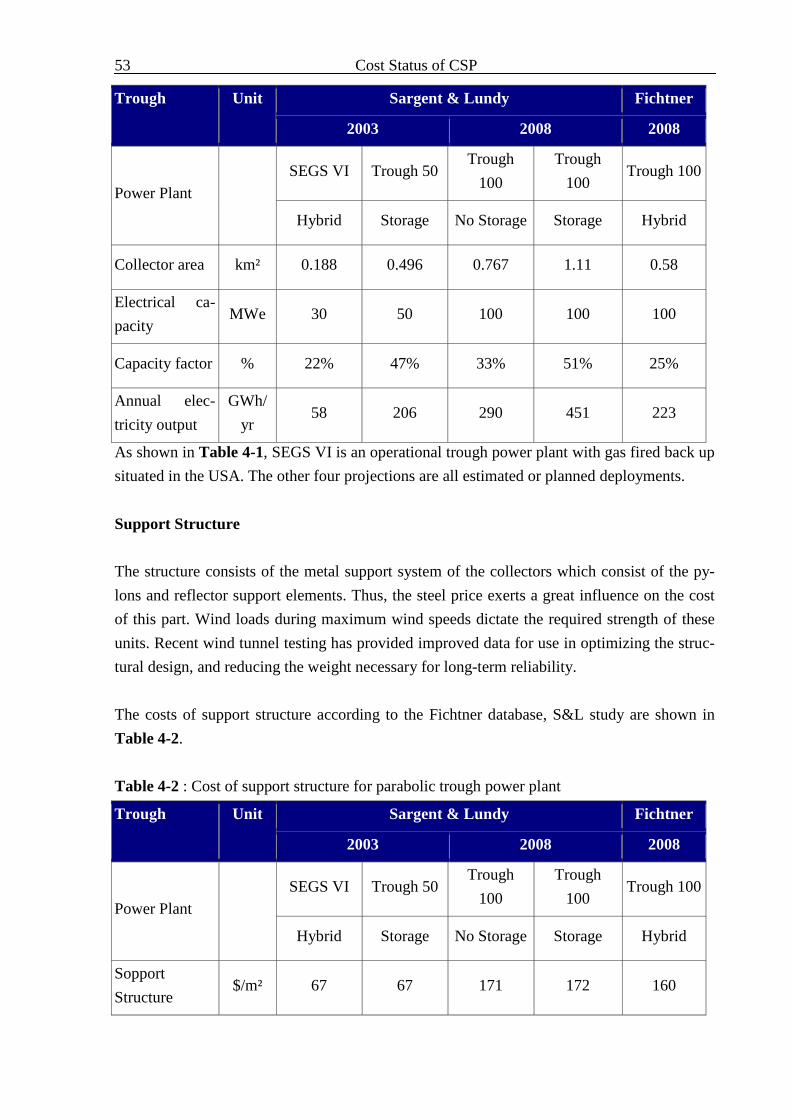
53 Cost Status of CSP
As shown in Table 4-1, SEGS VI is an operational trough power plant with gas fired back up
situated in the USA. The other four projections are all estimated or planned deployments.
Support Structure
The structure consists of the metal support system of the collectors which consist of the py-
lons and reflector support elements. Thus, the steel price exerts a great influence on the cost
of this part. Wind loads during maximum wind speeds dictate the required strength of these
units. Recent wind tunnel testing has provided improved data for use in optimizing the struc-
tural design, and reducing the weight necessary for long-term reliability.
The costs of support structure according to the Fichtner database, S&L study are shown in
Table 4-2.
Table 4-2 : Cost of support structure for parabolic trough power plant
Trough Unit Sargent & Lundy Fichtner
2003 2008 2008
Power Plant SEGS VI Trough 50
Trough
100
Trough
100 Trough 100
Hybrid Storage No Storage Storage Hybrid
Sopport
Structure $/m² 67 67 171 172 160
Trough Unit Sargent & Lundy Fichtner
2003 2008 2008
Power Plant SEGS VI Trough 50
Trough
100
Trough
100 Trough 100
Hybrid Storage No Storage Storage Hybrid
Collector area km² 0.188 0.496 0.767 1.11 0.58
Electrical ca-
pacity MWe 30 50 100 100 100
Capacity factor % 22% 47% 33% 51% 25%
Annual elec-
tricity output
GWh/
yr 58 206 290 451 223

Cost Status of CSP 54
As a result of the significant rise in the price of steel from the year 2003 to 2008, the cost of a
support structure for the parabolic trough power plant has increased approximately 2.5 fold
during this period.
Receivers
The receivers are a major contributor to trough solar field performance. As a result of the
utilization of different receivers from varied manufacturers and various models, there is a
discrepancy in the costs between projects.
The Table 4-3 shows the costs of receivers used in different projects.
Table 4-3 : Cost of receivers for parabolic trough power plant
Trough Unit Sargent & Lundy Fichtner
2003 2008 2008
Power Plant SEGS VI Trough 50
Trough
100
Trough
100 Trough 100
Hybrid Storage No Storage Storage Hybrid
Receivers $/m² 43 43 53 53 60
There are only two suppliers of receivers for the parabolic trough power plant: Solel and
Schott. The scale of production of receivers has enlarged although not very much in the last
five years. Furthermore, a lack of competition and high demand will maintain the high price
of the receivers in the short term. As shown in Table 4-3, the price of receivers was raised to
60 $/m², one-half of the price in 2003.
Mirrors
Currently there are only three suppliers of mirrors for parabolic trough solar power plants
worldwide: Flabeg GmbH & Co. (Flabeg), RioGlass, and Saint Gobain. With many activities
related to CSP projects in Spain, there is high demand for the supply of mirrors, and so the
cost of mirrors will remain high in the short term. The data from the Fichtner and S&L study
are shown in the following Table.
Table 4-4 : Cost of mirrors for parabolic trough power plant
Trough Unit Sargent & Lundy Fichtner
2003 2008 2008

55 Cost Status of CSP
Power Plant SEGS VI Trough 50
Trough
100
Trough
100 Trough 100
Hybrid Storage No Storage Storage Hybrid
Mirrors $/m² 43 40 63 63 60
From 2003 to 2005 there was little improvement in mass production and competition between
manufacturers. Due to the continuous high demand the cost of mirrors for a parabolic trough
power plant did not drop but instead increased from 40$/m² to 63$/m². With more projects
starting in the near future, new additional mirror manufacturing facilities and glass manufac-
turers are expected to enter the market.
Solar Balance of a Plant
The solar balance of a plant (Solar BOP) consists of the remaining systems, components and
structures that comprise of a complete solar field system that are not included amongst the
steel support structure, receivers and mirrors. For instance:
• Solar tracking system
• Heat Transfer Fluid (HTF) system
• Interconnection piping
• Electronics and others
The costs of a solar balance of a plant are shown in the following table.
Table 4-5 : Cost of solar balance of a plant for parabolic trough power plant
Trough Unit Sargent & Lundy Fichtner
2003 2008 2008
Power Plant SEGS VI Trough 50
Trough
100
Trough
100 Trough 100
Hybrid Storage No Storage Storage Hybrid
Solar BOP $/m² 234 250 141 141 150
The cost of parts has sharply decreased in the last five years thanks to the Research & Devel-
opment (R&D) of the solar tracking system, the HTF system (new medium of HTF, higher
temperature of HTF) and other components. Based on continuous R&D the cost of the solar

Cost Status of CSP 56
balance of a plant for a parabolic trough power plant is expected to steadily decrease over
time.
Power Block/ Balance of Plant
The power block is the combination of the steam turbine and generator, the steam turbine and
generator auxiliaries, and feedwater and condensate systems. The balance of plant (BOP)
costs include the cost for the general balance of the plant equipment, the condenser and cool-
ing tower system, the water treatment system, fire protection, piping, compressed air systems,
closed cooling water system, plant control system, electrical equipment, and cranes and
hoists. The costs of the power block and balance of plant are shown in Table 4-6.
Table 4-6: Cost of power block and balance of plant for parabolic trough power plant
Trough Unit Sargent & Lundy Fichtner
2003 2008 2008
Power Plant
SEGS VI Trough 50 Trough
100
Trough
100 Trough 100
Hybrid Storage No Storage Storage Hybrid
Power Block
/BOP $/kWe 527 306 1183 1183 2500
In the last five years and in the near future some advanced but cost intensive technologies
have been used or are planned to be used in CSP projects. For instance, instead of a water
cooling system, air cooling facilities are employed in water-deficient areas such as deserts.
Moreover, because of the price increase of conventional energy generating and the balance of
plant equipment the capital costs have shown a massive growth. As a result of the current
state of the power block mentioned above, its cost figure from Fichtner has increased signifi-
cantly compared to 2003 prices.
Thermal Storage
The capacity and type of thermal storage have significant impact on the total investment re-
quired for the CSP power plant and are key consideration in cost reduction. Based on infor-
mation from the S&L study the detailed costs of the currently used two-tank thermal storage
system are illustrated in Table 4-7. /S&L 2009/
Table 4-7: Break up of two-tank thermal storage cost

57 Cost Status of CSP
Components $/kWeh $/kWth 6 hours storage
$/kWe $/kWt
Tanks 16.30 5.70 97.80 34.20
Pumps 19.18 6.71 115.08 40.26
Heat Exchanger 17.07 5.98 102.42 35.88
Instrumentation 1.25 0.44 7.50 2.64
Piping 6.15 2.15 36.90 12.90
Structural Steel 2.17 0.76 13.02 4.56
Insulation 11.71 4.1 70.26 24.60
Electrical 6.49 2.27 38.94 13.62
Concrete 3.2 1.12 19.20 6.72
Storage Media 43.95 15.38 23.70 92.28
Total 127.47 44.61 764.82 267.66
For 6 hours the two-tank indirect thermal storage total cost is 764.82 $/kWe (267.66 $/kWt).
An overview of the thermal storage costs from the S&L reports is shown in the following
Table.
Table 4-8: Cost of thermal storage for parabolic trough power plant
Trough Unit Sargent & Lundy Fichtner
2003 2008 2008
Power Plant SEGS VI Trough 50
Trough
100
Trough
100 Trough 100
Hybrid Storage No Storage Storage Hybrid
Thermal Sto-
rage $/kWe - 958 - 765 -
Until now thermal storage systems have not been widely used in CSP projects due to its
higher costs and solar collector area. To reduce the thermal storage system capital costs the
HTF and storage material will be optimized for maximum steam cycle efficiency and storage
compatibility. As an example the HTF temperature is expected to increase from the current
400C° to 500C° to improve the power cycle efficiency and reduce the further the costs of
thermal storage.

Cost Status of CSP 58
Total Investment Cost
To summarize the information in this section the total investment costs based on S&L and
Fichtner project are illustrated in Table 4-9.
Table 4-9: Comparison of total investment cost for parabolic trough power plant
Trough Unit Sargent & Lundy Fichtner
2003 2008 2008
Power Plant SEGS VI Trough 50
Trough
100
Trough
100 Trough 100
Hybrid Storage No Storage Storage Hybrid
Total invest-
ment cost
M $ 92 254 447 671 559
$/kWe 3052 5073 4471 6708 5594
From this table the total investment costs for a parabolic trough power plant are currently
between 4500 – 6700 $/kW. The costs for the additional hybrid and storage facilities are still
relatively high but will decrease into the future.
4.2.1.2 Operating & Maintenance Cost
The operating and maintenance (O&M) costs are those costs associated with operating the
CSP power plant and include the costs for the:
• Solar field
• Power block and balance of plant
• Water and process
• Staffing
• Capital equipment and other miscellaneous equipment
• Spare parts
This section provides a simplified introduction for each of the O&M costs and an O&M costs
overview of different projects.
Solar Field
The solar field maintenance cost is mainly based on the replacement rate of mirrors, receiv-
ers, HTF pump seals and other solar field component.
Power Block and Balance of Plant
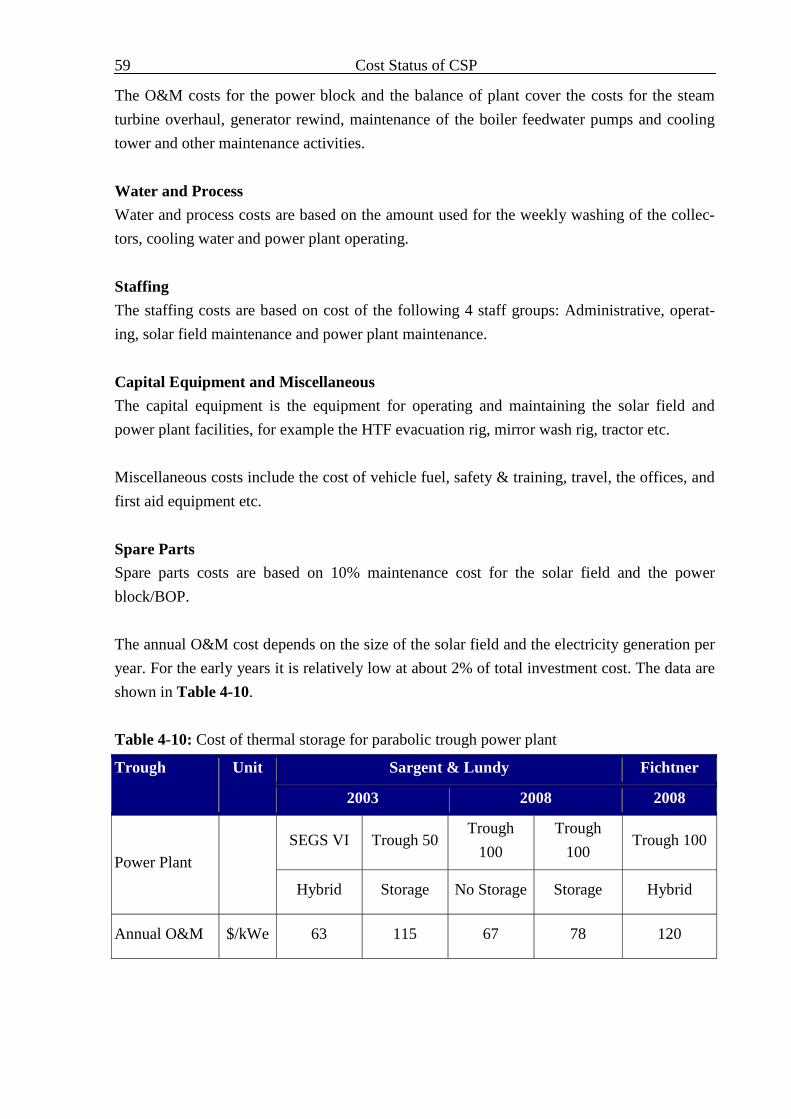
59 Cost Status of CSP
The O&M costs for the power block and the balance of plant cover the costs for the steam
turbine overhaul, generator rewind, maintenance of the boiler feedwater pumps and cooling
tower and other maintenance activities.
Water and Process
Water and process costs are based on the amount used for the weekly washing of the collec-
tors, cooling water and power plant operating.
Staffing
The staffing costs are based on cost of the following 4 staff groups: Administrative, operat-
ing, solar field maintenance and power plant maintenance.
Capital Equipment and Miscellaneous
The capital equipment is the equipment for operating and maintaining the solar field and
power plant facilities, for example the HTF evacuation rig, mirror wash rig, tractor etc.
Miscellaneous costs include the cost of vehicle fuel, safety & training, travel, the offices, and
first aid equipment etc.
Spare Parts
Spare parts costs are based on 10% maintenance cost for the solar field and the power
block/BOP.
The annual O&M cost depends on the size of the solar field and the electricity generation per
year. For the early years it is relatively low at about 2% of total investment cost. The data are
shown in Table 4-10.
Table 4-10: Cost of thermal storage for parabolic trough power plant
Trough Unit Sargent & Lundy Fichtner
2003 2008 2008
Power Plant SEGS VI Trough 50
Trough
100
Trough
100 Trough 100
Hybrid Storage No Storage Storage Hybrid
Annual O&M $/kWe 63 115 67 78 120
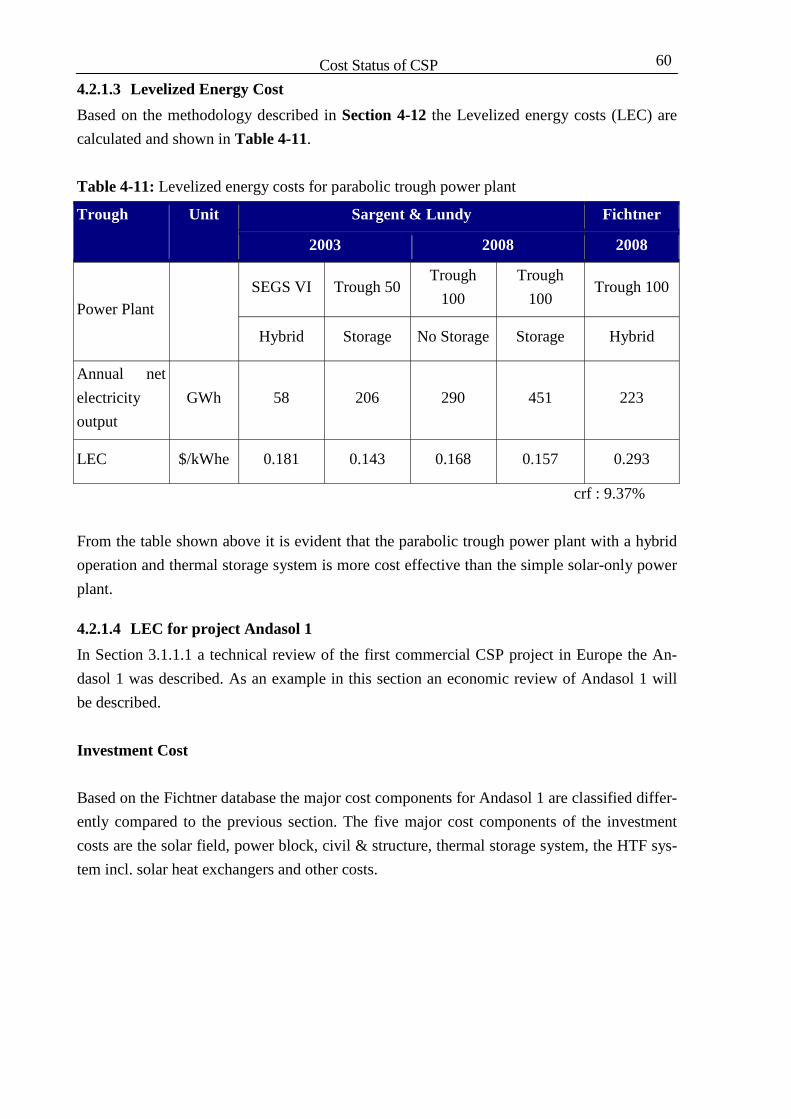
Cost Status of CSP 60
4.2.1.3 Levelized Energy Cost
Based on the methodology described in Section 4-12 the Levelized energy costs (LEC) are
calculated and shown in Table 4-11.
Table 4-11: Levelized energy costs for parabolic trough power plant
Trough Unit Sargent & Lundy Fichtner
2003 2008 2008
Power Plant SEGS VI Trough 50
Trough
100
Trough
100 Trough 100
Hybrid Storage No Storage Storage Hybrid
Annual net
electricity
output
GWh 58 206 290 451 223
LEC $/kWhe 0.181 0.143 0.168 0.157 0.293
crf : 9.37%
From the table shown above it is evident that the parabolic trough power plant with a hybrid
operation and thermal storage system is more cost effective than the simple solar-only power
plant.
4.2.1.4 LEC for project Andasol 1
In Section 3.1.1.1 a technical review of the first commercial CSP project in Europe the An-
dasol 1 was described. As an example in this section an economic review of Andasol 1 will
be described.
Investment Cost
Based on the Fichtner database the major cost components for Andasol 1 are classified differ-
ently compared to the previous section. The five major cost components of the investment
costs are the solar field, power block, civil & structure, thermal storage system, the HTF sys-
tem incl. solar heat exchangers and other costs.
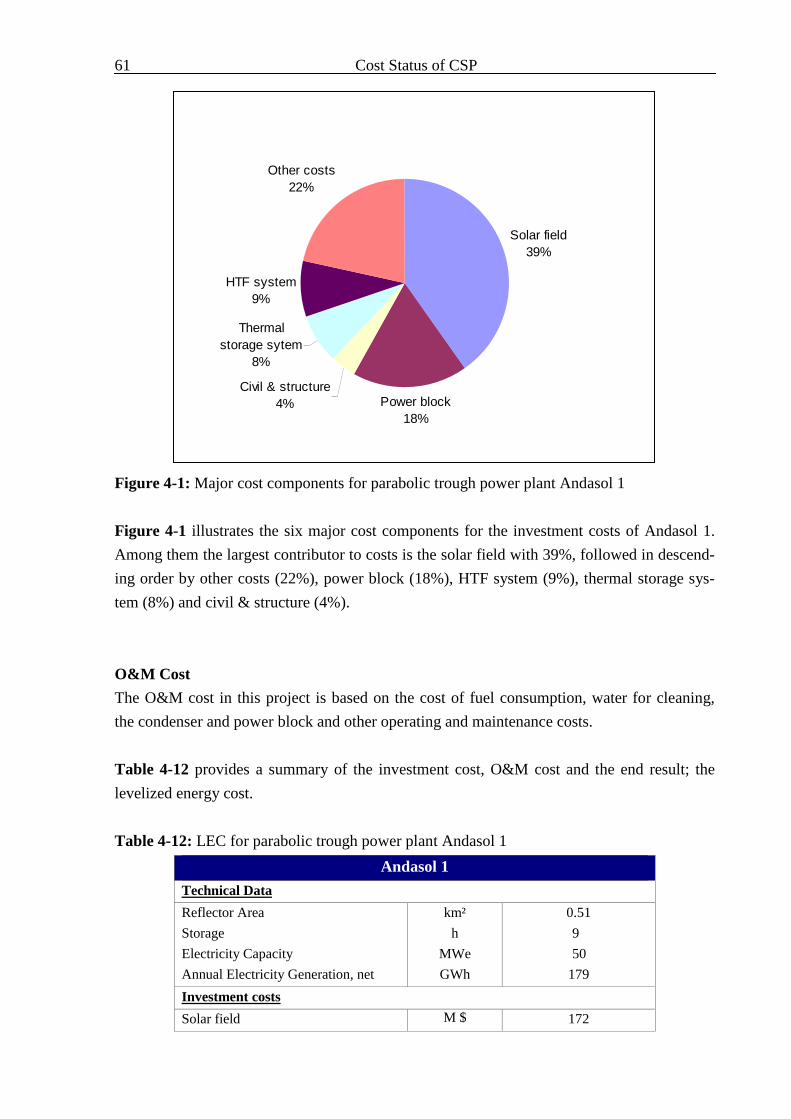
61 Cost Status of CSP
Figure 4-1: Major cost components for parabolic trough power plant Andasol 1
Figure 4-1 illustrates the six major cost components for the investment costs of Andasol 1.
Among them the largest contributor to costs is the solar field with 39%, followed in descend-
ing order by other costs (22%), power block (18%), HTF system (9%), thermal storage sys-
tem (8%) and civil & structure (4%).
O&M Cost
The O&M cost in this project is based on the cost of fuel consumption, water for cleaning,
the condenser and power block and other operating and maintenance costs.
Table 4-12 provides a summary of the investment cost, O&M cost and the end result; the
levelized energy cost.
Table 4-12: LEC for parabolic trough power plant Andasol 1
Andasol 1
Technical Data
Reflector Area
Storage
Electricity Capacity
Annual Electricity Generation, net
km²
h
MWe
GWh
0.51
9
50
179
Investment costs
Solar field M $ 172
Solar field39%
Power block18%
Civil & structure4%
Thermalstorage sytem
8%
HTF system9%
Other costs22%

Cost Status of CSP 62
Power block
Civil and structure
Thermal storage system
HTF system incl. solar heat exchanger
Other costs
Total
Specific
M $ M $ M $ M $ M $ M $
M $ $/kWe
76
18
33
37
92
428
8551
O&M Cost
Total
Specific
M $ $/kWe
12.8
0.072
Electricity Generation Cost
LEC $/kWh 0.296
crf : 9.37%
The LEC for Andasol 1 is approximately 0.296 $/kWh. As the project began to operate last
year this result is more reliable.
4.2.1.5 Cost Reduction Prospects
With a comparison of energy costs generated by conventional fuels the LEC of parabolic
trough power plant is still quite high. Due to advanced technology, mass production, con-
struction efficiency improvements and scaling up of current capacities the costs are expected
to decrease. The components and cost of repairs will also become more cost effective thanks
to technological advancements and competitive intensity among spares suppliers.
Technological Advancements
The technological advancements are expected to be realized by enhancing the efficiency of
the solar field components, optimizing the thermal storage technology and improving the
compatibility of the conventional power block for the CSP plant operation.
• To improve the efficiency of the solar field the reflectivity of mirror and the absorber
absorption of receiver will be increased
• Advanced structural design with lower weight and costs.
• Through application of advanced HTF (for example HitecXL) this will raise the HTF
outlet temperature and the storage efficiency.
• The turbines for the CSP power plant are designed to adapt to the night-time shut-
down of the plant through the handling of the rapid start and stop times. Otherwise the
reheat solution improves efficiency and reduces problems with erosion/corrosion and
moisture in the LP turbine. The surplus heat can also be put into thermal storage to
extend the production time for the plant.
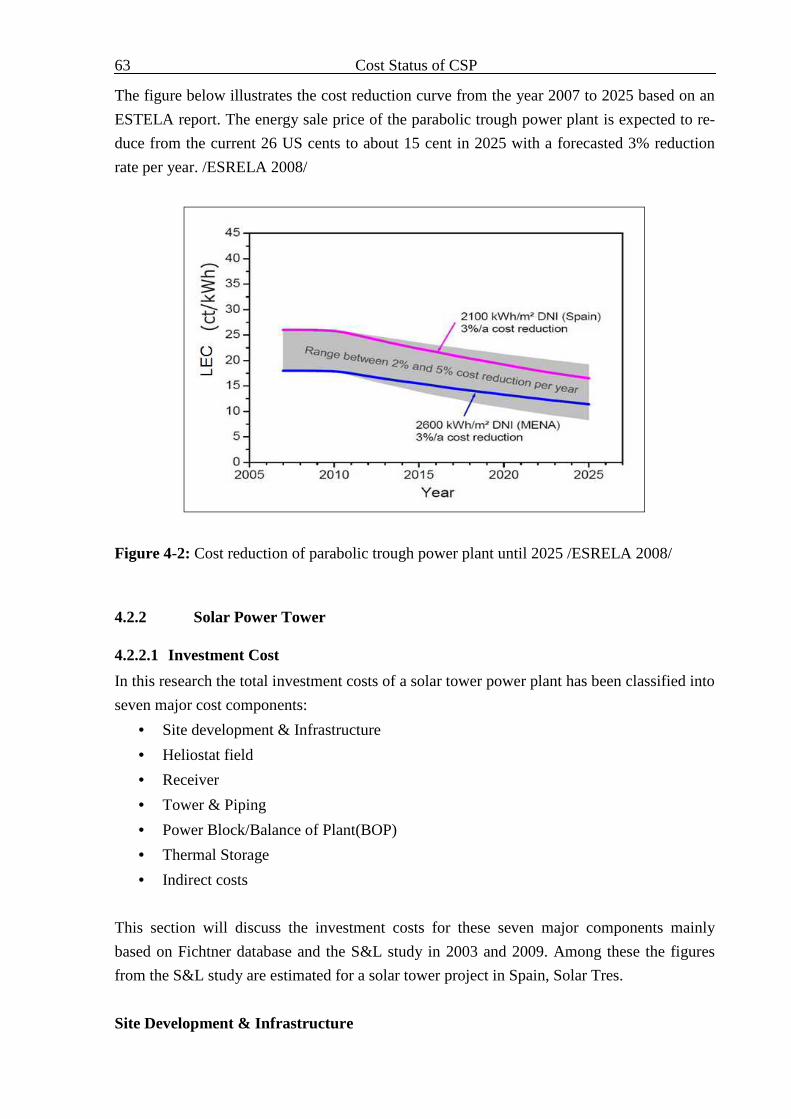
63 Cost Status of CSP
The figure below illustrates the cost reduction curve from the year 2007 to 2025 based on an
ESTELA report. The energy sale price of the parabolic trough power plant is expected to re-
duce from the current 26 US cents to about 15 cent in 2025 with a forecasted 3% reduction
rate per year. /ESRELA 2008/
Figure 4-2: Cost reduction of parabolic trough power plant until 2025 /ESRELA 2008/
4.2.2 Solar Power Tower
4.2.2.1 Investment Cost
In this research the total investment costs of a solar tower power plant has been classified into
seven major cost components:
• Site development & Infrastructure
• Heliostat field
• Receiver
• Tower & Piping
• Power Block/Balance of Plant(BOP)
• Thermal Storage
• Indirect costs
This section will discuss the investment costs for these seven major components mainly
based on Fichtner database and the S&L study in 2003 and 2009. Among these the figures
from the S&L study are estimated for a solar tower project in Spain, Solar Tres.
Site Development & Infrastructure

Cost Status of CSP 64
Site development is the first step in the construction of a CSP power plant. It is the site prepa-
ration for the heliostat field and also for the area of the tower, power block & BOP, thermal
storage system and buildings. The activity typically involves site selection & planning as well
as land-disturbing tasks such as clearing, excavating and grading.
These costs also include the land cost and construction costs for buildings (power house,
storage depot and administration building) and roads inside the power plant and those con-
necting to the main roads. The required land area for the heliostat field is calculated accord-
ing to the dissertation of Mr. Weinrebe from the University of Stuttgart using the following
formula:
Required land area of heliostat field = collector area * 1.3 + 0.18 km²
The costs of site development & infrastructure according to Fichtner database, Sargent &
Lundy Study are shown in Table 4-13.
Table 4-13 : Cost of Site development and Infrastructure for solar tower power plant
Tower Unit Sargent & Lundy Fichtner
2003 2008 2008
Power Plant
Solar Tres
13.65 MW
Solar Tres
13.65 MW
Tower
47.25 MW
Storage Storage Solar-only
Site
development
/Infrastructure
$/m² 11.6 - 25.3
In the Sargent & Lundy study of 2009 there are no data for site development & infrastructure.
The topographic conditions and the price of the land and construction materials are the main
influential factors that impact on the cost of site development & infrastructure.
Heliostat Field
The investment cost for the heliostat is composed of the costs for heliostats (including drive
and foundation), the wiring, process control and assembly. The solar field for the project So-
lar Tres plans to utilize 2493 glass-metal heliostats. Each heliostat is 96m², which means the
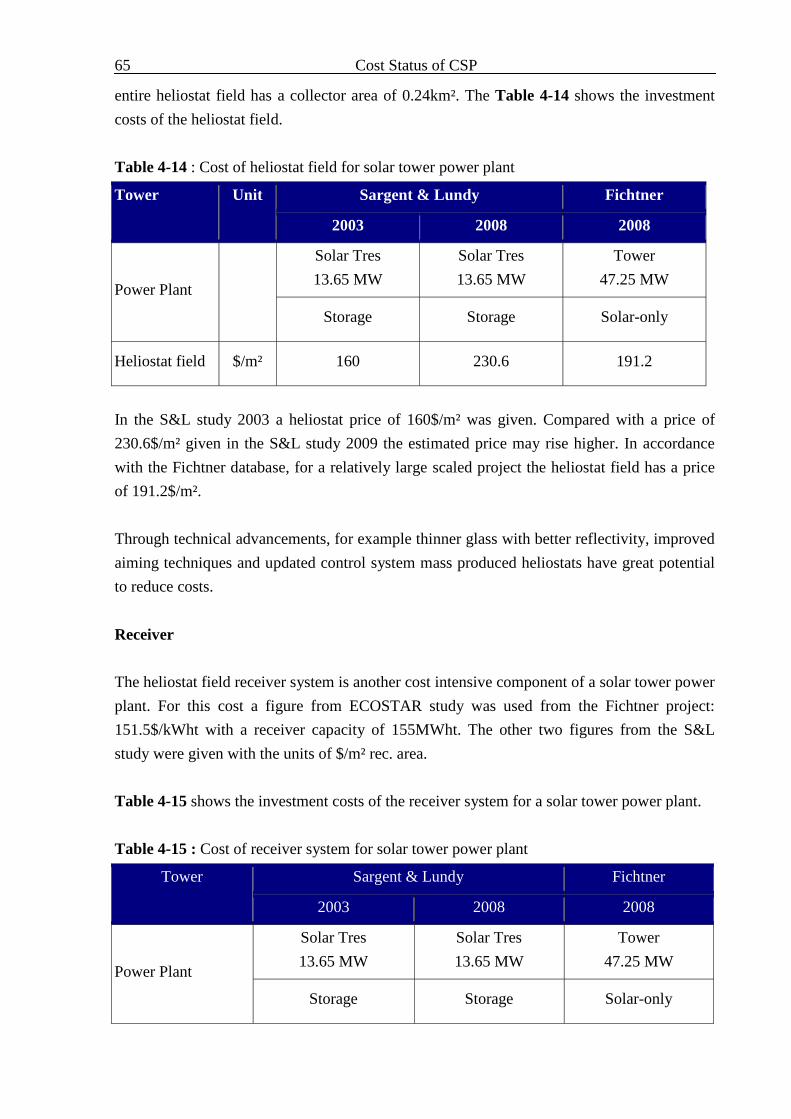
65 Cost Status of CSP
entire heliostat field has a collector area of 0.24km². The Table 4-14 shows the investment
costs of the heliostat field.
Table 4-14 : Cost of heliostat field for solar tower power plant
Tower Unit Sargent & Lundy Fichtner
2003 2008 2008
Power Plant
Solar Tres
13.65 MW
Solar Tres
13.65 MW
Tower
47.25 MW
Storage Storage Solar-only
Heliostat field $/m² 160 230.6 191.2
In the S&L study 2003 a heliostat price of 160$/m² was given. Compared with a price of
230.6$/m² given in the S&L study 2009 the estimated price may rise higher. In accordance
with the Fichtner database, for a relatively large scaled project the heliostat field has a price
of 191.2$/m².
Through technical advancements, for example thinner glass with better reflectivity, improved
aiming techniques and updated control system mass produced heliostats have great potential
to reduce costs.
Receiver
The heliostat field receiver system is another cost intensive component of a solar tower power
plant. For this cost a figure from ECOSTAR study was used from the Fichtner project:
151.5$/kWht with a receiver capacity of 155MWht. The other two figures from the S&L
study were given with the units of $/m² rec. area.
Table 4-15 shows the investment costs of the receiver system for a solar tower power plant.
Table 4-15 : Cost of receiver system for solar tower power plant
Tower Sargent & Lundy Fichtner
2003 2008 2008
Power Plant
Solar Tres
13.65 MW
Solar Tres
13.65 MW
Tower
47.25 MW
Storage Storage Solar-only

Cost Status of CSP 66
Receiver 280 m² 280 m² 155 MWth
57143 $/m² 121680 $/m² 151.5 $/kWth
The S&L study 2009 provides a price that is over twice as high for a receiver than the price
given in Solar Tres, which is considered a more reasonable price. Through the reduction of
heat losses at the receiver, an increase of the receiver absorbance and the scaling up, the cost
of the receiver system is expected to drop in the future.
Tower & Piping
To support an even larger heliostat field and to collect more solar energy the tower in the
solar tower power system is designed to be higher than before:
• Solar Two (10MWe), 90m
• PS 10 11 (MWe), 115m
• Solar Tres (13.65MWe), 130m
The investment cost of tower is related to its height and the figure given by Fichtner is calcu-
lated using the following formula:
[ ]
= 100*552000mHeight
Tower eC
The tower height in this projection is 150m. The costs of the tower and piping are shown in
the following table:
Table 4-16 : Cost of Tower & Piping for solar tower power plant
Tower Unit Sargent & Lundy Fichtner
2003 2008 2008
Power Plant
Solar Tres
13.65 MW
Solar Tres
13.65 MW
Tower
47.25 MW
Storage Storage Solar-only
Tower &
Piping $/m² 11.6 21.99 18.9

67 Cost Status of CSP
The investment cost of the tower is influenced by the price of the construction materials, and
therefore cost will be different every year. The piping efficiency will increase due to larger
piping and shorter lengths per kWe in the large scaled project, ultimately resulting in lower
costs.
Power Block & Balance of Plant
The power block and balance of the plant costs include: the steam turbine and generator,
steam turbine and generator auxiliaries, steam generator, feedwater and condensate systems,
condenser and cooling tower system, water treatment system, fire protection, piping, com-
pressed air systems, closed cooling water system, instrumentation, electrical equipment, etc.
The costs of the power block and the balance of the plant are shown in Table 4-17.
Table 4-17: Cost of power block and balance of plant for solar tower power plant
Tower Unit Sargent & Lundy Fichtner
2003 2008 2008
Power Plant
Solar Tres
13.65 MW
Solar Tres
13.65 MW
Tower
47.25 MW
Storage Storage Solar-only
Power Block &
Balance of
Plant
$/kWe 1397.7 4719.6 1556.6
The cost reduction for the power block and the balance of the plant can be realized due to the
efficiency increase of the turbine, for example the reheat turbine with higher operation tem-
peratures, and through scaling up.
Thermal Storage
The Solar Tres solar tower power plant will make use of a large thermal storage system with
16 hours, 593MWth thermal storage capacity. The Fichtner project discussed in this research
has no thermal storage design.
Following table illustrates the investment costs of the thermal storage system.
Table 4-18: Cost of thermal storage for solar tower power plant
Tower Unit Sargent & Lundy Fichtner
2003 2008 2008

Cost Status of CSP 68
Power Plant
Solar Tres
13.65 MW
Solar Tres
13.65 MW
Tower
47.25 MW
Storage Storage Solar-only
Thermal sto-
rage $/kWt 49 24.9 -
The main components for the current two-tank thermal storage system are the hot storage
tank, cold storage tank and piping. The advanced thermal storage concept, for instance the
direct thermocline molten-slat storage system can reduce the thermal storage cost signifi-
cantly.
Total Investment Cost
A summary of the information in this section including the total investment costs based on
the S&L and Fichtner project are illustrated in Table 4-19.
Table 4-19: Comparison of total investment cost for solar tower power plant
Tower Unit Sargent & Lundy Fichtner
2003 2008 2008
Power Plant
Solar Tres
13.65 MW
Solar Tres
13.65 MW
Tower
47.25 MW
Storage Storage Solar-only
Total invest-
ment cost
M $ 119 219 214
$/kWe 8753 16905 4534
According to this table the total investment cost for solar tower plant is currently from 4500
to 16900$/kW. These costs are much higher than for the parabolic trough power plant of
3000 to 6700$/kW, which was shown in Section 4.2.1.1.
4.2.2.2 Operating & Maintenance Costs
Operating and maintenance (O&M) costs are those costs associated with operating the CSP
power plant. This includes the costs for the:
• Solar field
• Power block and balance of the plant
• Water and process

69 Cost Status of CSP
• Staffing
• Capital equipment and miscellaneous
• Spare parts
These O&M cost components have been described in Section 4.2.1.2 and will not be repeated
here.
The annual O&M cost depends on the size of the solar field and the electricity generated per
year. The data are shown in Table 4-20.
Table 4-20: Cost of thermal storage for parabolic trough power plant
Tower Unit Sargent & Lundy Fichtner
2003 2008 2008
Power Plant
Solar Tres
13.65 MW
Solar Tres
13.65 MW
Tower
47.25 MW
Storage Storage Solar-only
O&M $/kWh 0.03 0.01 0.05
The power plant with thermal storage can obtain a high capacity factor and a large annual
electricity generation capacity, thus the annual O&M cost will be decreased.
4.2.2.3 Levelized Energy Cost
Based on the methodology described in Section 4.12 the Levelized energy costs (LEC) are
calculated and shown in Table 4-21.
Table 4-21 : Levelized energy costs for solar tower power plant
Tower Unit Sargent & Lundy Fichtner
2003 2008 2008
Power Plant
Solar Tres
13.65 MW
Solar Tres
13.65 MW
Tower
47.25 MW
Storage Storage Solar-only
Annual net
electricity out-GWh 93 93 116

Cost Status of CSP 70
put
LEC $/kWhe 0.15 0.22 0.22
crf : 9.37%
From the figure shown above it is evident that, the current levelized energy cost for the solar
tower system is around 22 US cent/ kWh. The S&L study prepared in 2003 anticipated a
higher scaling factor and a rapid cost reduction for the solar tower system. Therefore the price
estimated in that study is much lower than the current price.
4.2.2.4 LEC for Project PS 10
In Section 3.1.2.2 a technical review of the first commercial solar power tower project in
Europe PS10 was given. As an example, an economical review of PS10 will be described in
this section.
Investment Cost
According to /TEB 2007/ the investment cost for the solar tower power plant PS10 amounted
to € 35 million (US$ 47 million), with a contribution of €5 million (US$6.7 million) from the
EU's Fifth Framework Program for research, awarded for the project's innovative approach.
O&M Cost
The O&M cost in this project is calculated based on the average O&M cost rate of Fichtner
database and the S&L study at 2.5%/yr of total investment cost. Table 4-22 provides a sum-
mary of the investment cost, O&M cost and the end result; the levelized energy cost.
Table 4-22: LEC for solar tower power plant PS10
PS10
Technical Data
Reflector Area
Electricity Capacity
Annual Electricity Generation, net
km²
MWe
GWh
0.075
11
24
Investment costs
Total
Specific
M $ $/kWe
47
4273
O&M Cost
Total
Specific
M $
$/kWe 1.175
0.05
Electricity Generation Cost
LEC $/kWh 0.23
crf : 9.37%

71 Cost Status of CSP
The LEC for PS10 is approximately 0.23$/kWh. This is even lower than the LEC of for the
parabolic trough power plant Andasol 1.
4.2.2.5 Cost Reduction Prospect
Due to advanced technology, mass production, construction efficiency improvements and
scaling up of the current capacities the energy generation cost for the solar tower system is
expected to gradually decrease.
The figure below illustrates the cost reduction curve from the year 2012 to 2025 based on the
S&L study 2009. The levelized energy cost of the solar tower power plant is expected to re-
duce from 0.205$/kWh to 0.076$/kWh with a reduction rate at 63%.
Figure 4-3: Cost reduction of solar tower power plant until 2025 /S&L 2009/
4.2.3 Cost Comparison of Different CSP Systems
In the previous sections the detailed energy generation costs of the parabolic trough power
plant and the solar tower power plant have been analyzed. Based on the technical and cost-
component data from the S&L study 2009, the electricity generation cost of the parabolic
trough plant with storage is about 28.6% lower than solar tower plant with storage. Based on
Fichtner internal data, the operational commercial plant Andasol 1 has a higher cost than the
solar tower PS10. This is mainly due to the lower cost input for the solar tower in the Ficht-
ner database than for the real data.
Due to the high potential for technology advancement and the efficiency increase of solar
tower technology, it is expected that the costs will decrease more than for the parabolic
trough technology. Until 2025, the forecast cost of the solar tower plant is expected to be over
30% lower than for the parabolic trough plant.

Cost Status of CSP 72
At present, the technology of the linear Fresnel and dish-Stirling are relatively immature and
are still not used in commercial projects. There are only some demonstration plants with
small capacity using this technology. As a result, the simple and lower- cost design for linear
Fresnel has not met its intended goal. According to data from the Novatec Biosol AG for
1.4MW project Puerto Errado 1 (PE1), the LEC is approximately 0.386$/kWh, which is 30%
higher than for the parabolic trough system. The project site is located near Calasparra in the
region of Murcia, Southern Spain.
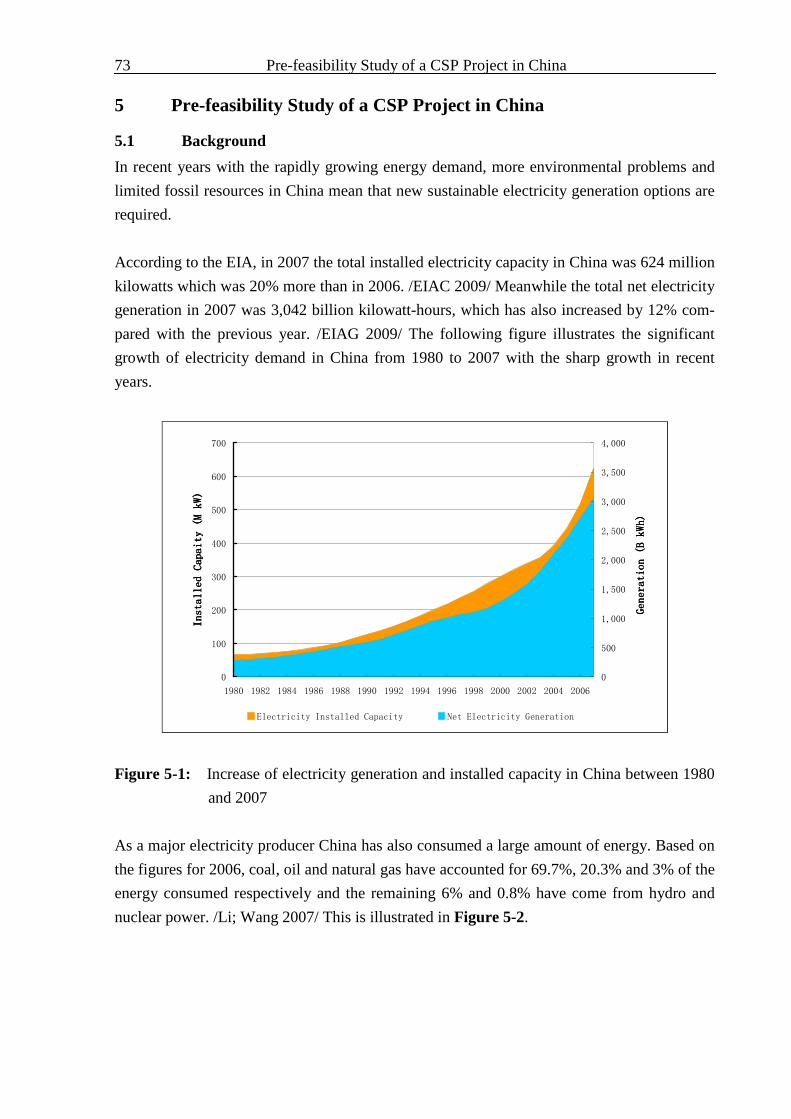
73 Pre-feasibility Study of a CSP Project in China
5 Pre-feasibility Study of a CSP Project in China
5.1 Background
In recent years with the rapidly growing energy demand, more environmental problems and
limited fossil resources in China mean that new sustainable electricity generation options are
required.
According to the EIA, in 2007 the total installed electricity capacity in China was 624 million
kilowatts which was 20% more than in 2006. /EIAC 2009/ Meanwhile the total net electricity
generation in 2007 was 3,042 billion kilowatt-hours, which has also increased by 12% com-
pared with the previous year. /EIAG 2009/ The following figure illustrates the significant
growth of electricity demand in China from 1980 to 2007 with the sharp growth in recent
years.
Figure 5-1: Increase of electricity generation and installed capacity in China between 1980
and 2007
As a major electricity producer China has also consumed a large amount of energy. Based on
the figures for 2006, coal, oil and natural gas have accounted for 69.7%, 20.3% and 3% of the
energy consumed respectively and the remaining 6% and 0.8% have come from hydro and
nuclear power. /Li; Wang 2007/ This is illustrated in Figure 5-2.
0
100
200
300
400
500
600
700
1980 1982 1984 1986 1988 1990 1992 1994 1996 1998 2000 2002 2004 2006
Installed Capaity (M kW)
Installed Capaity (M kW)
Installed Capaity (M kW)
Installed Capaity (M kW)
0
500
1,000
1,500
2,000
2,500
3,000
3,500
4,000
Generation (B kWh)
Generation (B kWh)
Generation (B kWh)
Generation (B kWh)
Electricity Installed Capacity Net Electricity Generation
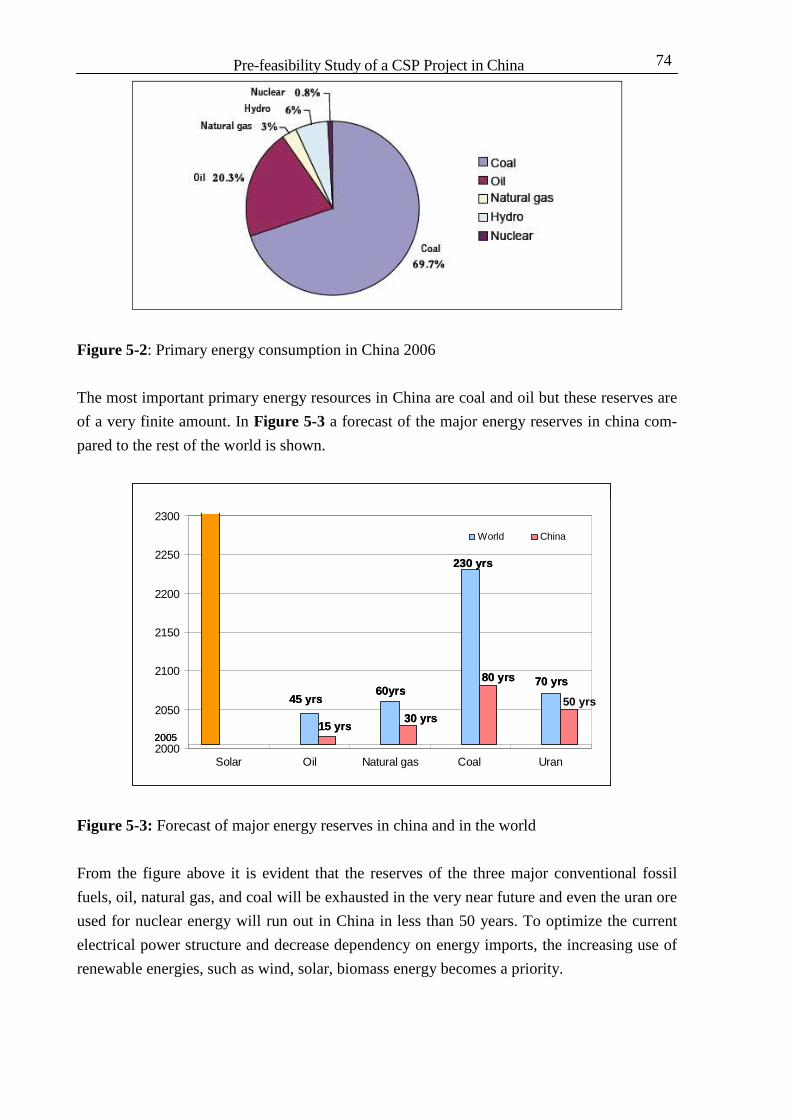
Pre-feasibility Study of a CSP Project in China 74
Figure 5-2: Primary energy consumption in China 2006
The most important primary energy resources in China are coal and oil but these reserves are
of a very finite amount. In Figure 5-3 a forecast of the major energy reserves in china com-
pared to the rest of the world is shown.
Figure 5-3: Forecast of major energy reserves in china and in the world
From the figure above it is evident that the reserves of the three major conventional fossil
fuels, oil, natural gas, and coal will be exhausted in the very near future and even the uran ore
used for nuclear energy will run out in China in less than 50 years. To optimize the current
electrical power structure and decrease dependency on energy imports, the increasing use of
renewable energies, such as wind, solar, biomass energy becomes a priority.
2000
2050
2100
2150
2200
2250
2300
Solar Oil Natural gas Coal Uran
Reihe1 World China
50 yrs
2005
45 yrs
15 yrs
60yrs
30 yrs
230 yrs
80 yrs 70 yrs
1
2000
2050
2100
2150
2200
2250
2300
Solar Oil Natural gas Coal Uran
Reihe1 World China
50 yrs
2005
45 yrs
15 yrs
60yrs
30 yrs
230 yrs
80 yrs 70 yrs
1
2005
45 yrs
15 yrs
60yrs
30 yrs
230 yrs
80 yrs 70 yrs
1

75 Pre-feasibility Study of a CSP Project in China
In order to improve the development of renewable energy technologies and create markets for
renewable energy, the first renewable energy law (REL) in China was been approved in Feb-
ruary 2005 and begun to take effect in 2006. Aiming to implement this REL a target of 10%
renewable energy of the total primary energy consumption by 2010 and 15% by 2020 has
been established.
As a renewable and clean energy source, solar power has great development potential in
China. A long term target of 1000MW energy generation capacity for concentrating solar
power plants will be reached by 2020. Presently, there is still no large scale commercial CSP
plant operated in China. The only operational demonstration plant is a 75kW solar tower
plant in Nanjing, Jingsu Province which was built in 2005. This year (2009) China will build
a new experimental solar tower plant with a 1.5MW capacity near Beijing and this will start
to operate next year. /Zara 2009/
In this chapter a prefeasibility study for a 100MW parabolic trough power plant and a further
1000MW CSP project will be described.
5.2 Site Selection
To select a suitable site for CSP plants many factors such as technical, environmental and
economical perspectives must be considered. The main siting factors are listed in Table 5-1
and will be examined in this section. /Cohen et al. 2005/
Table 5-1: Main siting factors of concentrating solar power plant
Siting Factor Requirement
Solar resource Direct incidence radiation > 1,800kWh/ (m²•a) for economical
operation
Land requirement
Area
Site topography
Land cover
20,000 - 40,000m² per megawatt of electricity generation
Flat, slope < 3% (slope < 1% most economical)
Limited agriculture value
Infrastructure Proximity to transmission-line corridor, natural gas pipeline and
rail transportation
Water availability Adequate supply, otherwise dry cooling
5.2.1 Solar Resource
The solar resource is the most important siting factor for a cost effective CSP power plant,
and it is related directly to the energy generation price. According to Table 5-1, a CSP power
plant is only economical for locations with more than 1,800kWh/ (m²•a) direct radiation

Pre-feasibility Study of a CSP Project in China 76
(equivalent to approximately 5kWh/(m²•day). China belongs to the so-called sun-belt coun-
tries with parts of western and northern China complying with this requirement, see Figure
5-4. Compared with countries at the same latitude, the solar resource in China is similar to
those in the US and better than in Europe and Japan.
Figure 5-4: Solar resource of China (DNI data with unit: kWh/ (m²•day)) /GENI 2008/
The green and grey lines circled areas in Figure 5-3 are the two biggest deserts in China: the
Taklamakan in northwest China with 337,600km² area and the Gobi desert with 455,000 km².
Both of them have an average DNI of 5.0kWh/(m²•day). That is to say, the solar power in ca.
23,960 km² of the desert area would be able to satisfy all Chinese electricity consumption
requirements in 2008 (3,450 billion kWh /NBSC 2009/. Besides, Tibet and parts of Qinghai
and Gansu province also have extremely high DNI and long sunlight durations. The solar
resource data from China are described in Table 5-2. /EEUSE 2008/

77 Pre-feasibility Study of a CSP Project in China
Table 5-2: Distribution of solar energy resource in China
Annual sunshine
duration (h)
Annual solar radiation
kWh/ (m²d) Area
Equivalent foreign areas
3200 - 3400 5.0 - 6.5 North Ningxia/ North Gansu/ Southeast Xinjiang/ West Qinghai/ West Tibet
India, North Pakistan
3000 - 3200 4.5 - 5.0
North Hebei/ North Shanxi/ South Ningxia and Inner Mongolia/ Middle Gansu/ East Qinghai/ Southeast Tibet and South Xinjiang
Jakarta, Indonesia area
2200 - 3000 4.0 - 4.5
Shandong/ Henan/Southeast Hebei/South Shanxi/ North Xinjiang/ Jilin/ Liaoning/ Yunnan/ North Shaanxi/ Southeast Gansu/ Guangdong and South Fujian/ Jiangsu and North Anhui/Beijing
Washington DC area in USA
1400 - 2200 3.5 - 4.0
Hubei/ Hunan/ Jiangxi/ Zhejiang/ Guangxi/ North Guangdong/ South Shaanxi/ Jiangsu and South Anhui/ Heilongjiang
Milan region in Italy
1000 - 1400 2.5 - 3.0 Sichuan and Guizhou Paris and Moscow
5.2.2 Land Requirement
Compared with a conventional power plant a CSP project requires more area because of the
large collector area and area for storage. As shown in Table 5-1 about 20,000 – 40,000m² of
land is required by a typical CSP plant per MW of electricity generation. This also depends if
heat storage facilities are used. A CSP plant without thermal storage system requires ap-
proximately 20,200 (5 acres) of land per MW of installed capacity, which will increase to ca.
32,000 m² per MW for a CSP plant with 6 hour thermal storage.
In addition to area requirements, a CSP project also has strict demands on the land slope. A
land slope of less than 1% is the most cost effective and most efficient. However a land slope
of between 1% and 3% would still be acceptable, but would cause costs to increase.
Land cover is also an important characteristic for siting of a CSP project. Land used for agri-culture, commerce and residence should not be considered as a CSP location. And this crite-rion is more important for China, which is the most populous country on earth. China is the third largest country in total area behind Russia and Canada. However, its arable land area

Pre-feasibility Study of a CSP Project in China 78
accounts for only 10% of the total and China's average per capita amount of arable land is only 40% of the world's average. Therefore, the location for the CSP project must be chosen in wasteland or semi-wasteland. China has wasteland of an area of 1.79 million km² (18.6% of China’s total land area), among which, 13.3% is desert, 4.8% is uncovered rock and 0.5% is glacier and permanent snow. /MLR 2009/ Most of this wasteland is located in the western and northern part for example in Tibet, Inner Mongolia and Qinghai, which also has the best solar resources in China. These areas would be suitable locations for large scale CSP projects.
5.2.3 Infrastructure
The large scale implementation of CSP technology requires a sufficient grid infrastructure.
For CSP plants built in distant places from the load center dedicated high-voltage (HV)
transmission lines would be required.
According to the development plan of the national wide grid interconnection in China made
by Electric Power Research Institute of China, the nation’s total installed capacity of long
distant HVDC transmission will reach 500GW in the year 2010. The first 10-15 years of the
21st century will be a key period to form a nationwide interconnected grid. By the year 2010-
2020, a nationwide interconnected grid will be basically established, which will cover all
major regional and provincial power grids with a total installed capacity of about 750GW by
the year 2020. /NI 2007/ The following figures show the planned nationwide grid intercon-
nection for china in the year of 2010 and 2015-2020. Additionally, all existing and expected
HVDC transmission projects until 2020 in China will be listed in Appendix D.
Figure 5-5: HVDC/AC transmission net in 2010 /NI 2007/

79 Pre-feasibility Study of a CSP Project in China
Figure 5-6: HVDC/AC transmission net in 2015-2020 /NI 2007/
It is worth noting that in this development program there are no HVDC transmission lines
built inside West China or between West and Mid China, which have the best solar resources
in China. When large scale CSP projects are built in these high solar radiation regions, new
dedicated HVDC transmission lines should also be planned and built.
5.2.4 Water Availability
Another critical siting issue is the availability of water. For CSP plants water is required con-
tinually for steam generation, mirror washing and mostly cooling. If water cannot be supplied
in sufficient quantities, for example in desert regions, a dry cooling system can also be used.
However, in this case the electricity cost for the plant will be raised by some 10%. According
to research by the University of Arizona, for a 280MW capacity CSP power plant this would
be expected to consume approximately 2.3 – 2.6 million m³ of water per year. /Avery et al.
2007/
Water resources in China are distributed unevenly, in northern China the provinces face se-
vere water shortage but in the south the water resource are relatively affluent. Rivers and
lakes are the major fresh water resources in China while in western China over 59,000 km² is
covered by glaciers which are another important water resource. Figure 5-5 illustrates the
current distribution of water resources in China.

Pre-feasibility Study of a CSP Project in China 80
Figure 5-7: Water resource distribution of China /See 2008/
5.2.5 Location
Based on the siting factors discussed in the previous sections three suitable locations for the
CSP plants are considered (See Figure 5-8).
Figure 5-8: Selected locations of distribution channels
- Point A in Inner Mongolia: This is located at 42°N and 111° E between Baotou and Erlian-
haote city, in Gobi desert, 200km away from the HVAC trunk lines and 400km away from
the load center of the North China power grid and 38km away from the Aibugai River. Ac-
Hami
Badanjilin desert
Gobi desert
Lanzhou
A
B
C

81 Pre-feasibility Study of a CSP Project in China
cording to the solar radiation map shown in Figure 5-4 this point has an average direct solar
radiation of between 5 and 6kWh/(m²•day).
- Point B in Inner Mongolia: This is located at 40°N and 101° E in Badanjilin desert 100 km
to the north of Zhangyi city of Gansu province, 150 km to the east of Jiuquan city of Gansu
Province. In this area the solar resource has an average of 5 to 5.5kWh/(m²•day).
- Point C of Xinjiang province: This is located at 42°N and 93°E near to Hami city and is the
nearest to a grid facility, the distance is about 25km. The solar factor in this area is around 5.5
kWh/(m²•day).
The more accurate solar resources for the three selected locations are acquired from the
RETScreen International Clean Energy Project Analysis Software. This data is summarised in
Figure 5-9 and Figure 5-10 with the details presented in Appendix E. /RETS 2009/
Figure 5-9: Monthly solar radiation in selected locations
0.0
1.0
2.0
3.0
4.0
5.0
6.0
7.0
8.0
Jan Feb Mar Apr May Jun Jul Aug Sep Oct Nov Dec
Solar Radiation
Solar Radiation
Solar Radiation
Solar Radiation
kWh/(m²•day)
A B C

Pre-feasibility Study of a CSP Project in China 82
Figure 5-10: Air temperature and wind speed of selected locations
In any of these proposed locations it is geologically feasible to build a CSP facility. However,
by considering a comparison of the wind speed at the three locations, B and C would be more
appropriate for the CSP plant. Location B and C both possess similar air temperatures, but B
has the advantage in that it is sited near the load center. As a result, it is suggested that point
B is the most suitable place for the large scale CSP facilities.
5.3 System Design
Through consideration of the technology maturity, investment and O&M costs and the local
conditions, in the first phase a 41MW parabolic trough solar power plant with 6 hours ther-
mal storage will be built at the selected locations. Following this, more plants will be set up
in the same region and the total design-capacity of this project will be 1000MW. The follow-
ing table shows the technical data of the 41MW parabolic trough solar power plant.
-20
-15
-10
-5
0
5
10
15
20
25
30
Jan Feb Mar Apr May Jun Jul Aug Sep Oct Nov Dec
Air temperature (°
C)
Air temperature (°
C)
Air temperature (°
C)
Air temperature (°
C)
0
1
2
3
4
5
6
Wind Speed (m/s)
Wind Speed (m/s)
Wind Speed (m/s)
Wind Speed (m/s)
Air Temperature A Air Temperature B Air Temperature C
Wind speed A Wind speed B Wind speed C

83 Pre-feasibility Study of a CSP Project in China
Table 5-3: Technical data of the planned parabolic trough solar power plant
Technical data
Electrical capacity 41 MW
Collector area 580,000 m²
Total power plant area ca. 2 km²
Thermal storage 6 hours
Annual operating hours ca. 4000 hours
Forecast electricity generation about 165 GW per year
Figure 5-11: Process diagram of the planned parabolic trough solar power plant
As shown in Figure 5-11 the solar energy collected by the parabolic reflectors and receiver
will be transferred by synthetic oil. The heat energy will be transmitted to the heat exchangers
and will then be converted to superheated steam. The steam drives a conventional turbine and
then electricity will be produced by the connected generator.
During the daytime with intensive solar radiation, the thermal energy will be stored by mol-
ten salt in large tanks. In the evening and on cloudy days, the stored heat can be returned to
the steam generator and thus driving the turbine and generating electric power.
Due to the water shortage in the selected location dry cooling facilities will be used in the
CSP power plant.
For the first CSP plant a 6 hour molten salt thermal storage system is utilized and in the fol-
lowing plants that are built a hybrid operation could also be an alternative. To realize the 24h
energy supply all year round a gas or biogas fired turbine will run additionally when suffi-

Pre-feasibility Study of a CSP Project in China 84
cient solar energy is not available. The thermal storage system and hybrid operation give the
CSP power plant the ability to produce not just peak load, but also a base load of electricity.
5.4 Cost Status of CSP Project in China
If the solar thermal power plant is erected in China there are several components or services
that can be obtained directly from the Chinese market and these will lead to great cost-
reduction-potential (CRP) for the CSP project in China. On the other hand there are parts
which need to be imported from countries with technology leadership this being due to patent
regulations or a lack of technology in China.
In the following sections the estimated values of the cost-reduction-potential for the invest-
ment cost and O&M costs are considered.
5.4.1 Investment Cost
In general the cost-reduction-potential (CRP) of the CSP project in China lies in the lower
costs of steam turbine and the generator set, the steel construction works and civil works. The
method to determinate the CRP is that the prices of comparable products or services in China
are set into a relation to the typical price in Europe/North America. The next table shows the
product or service and the resulting cost reduction factors.
Table 5-4: Comparison of costs of relevant products / services and CRP
Product / service Price Europe
/ N. America Price China CRP
100 MW STG set 200 $/kW 1) 68 $/kW 2) ~ 1/3
Steel construction works _ _ ~ 0.3 3)
Civil works _ _ ~ 0.4 4)
Source: 1) /FISE 2008/ 2) /CPC 2009/ 3) /BCIS 2007/ 4) /Baulinks 2006/
Based on various sources listed under Table 5-5 the price of a 100MW steam turbine and
generator set (STG set) in China is approximately one third of the price in Europe/North
America. The cost reduction potential of steel construction works and civil works between
China and Europe/North America can reach 30% and 40% respectively.
After the application of these CRP, the specific investment costs for the parabolic trough
power plant could decrease by 39%. The detailed data is shown in the following table and
figure

85 Pre-feasibility Study of a CSP Project in China
Table 5-5: Comparison of major cost components for parabolic trough plant in China and in
Europe/North America
Components Price Europe /
N. America Price China CRP
Solar BOP ($/m²) 150 150
Steel support structure ($/m²) 160 48 ~ 0.3
Receiver ($/m²) 60 60
Mirrors ($/m²) 60 60
Power block ($/kWe) 2900 957 ~ 1/3
Thermal storage ($/kWe) 765 765
Site development ($/m²) 30 12 ~ 0.4
Specific investment cost
($/kWe) 11140 6810 39%
Figure 5-12: Comparison of cost reduction potential for investment cost
The cost reduction factor of 0.4 for the civil works must be treated carefully, as the selected
location for the CSP power plant is usually remote and desolate. Therefore the savings due to
lower wages etc. in China may be compensated for by the requirement to build new roads or
a complete new infrastructure in the desert.
The distribution of the investment costs of parabolic trough project as an example (41MWe),
are illustrated in Figure 5-13.
0
2000
4000
6000
8000
10000
12000
EU China
$/kW
e
Steel supportstructurePower Block
Site development
Heat CollectionElementsMirrors
Thermal storage
Solar BoP
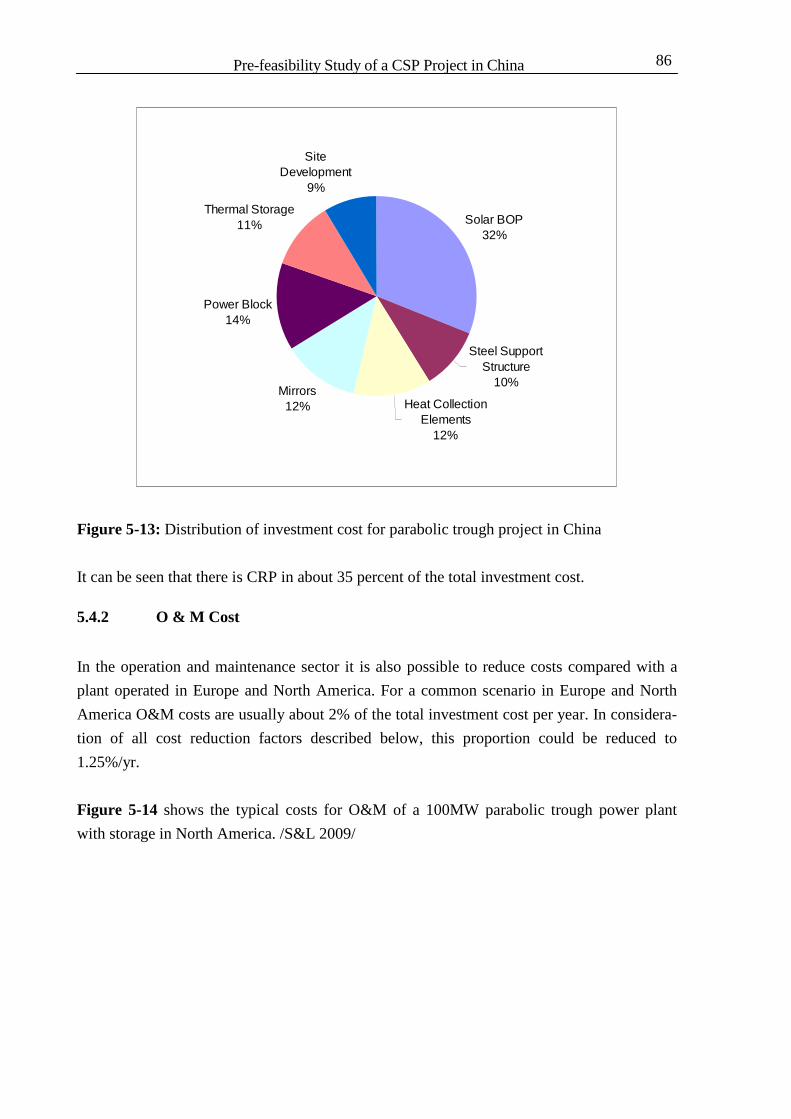
Pre-feasibility Study of a CSP Project in China 86
Figure 5-13: Distribution of investment cost for parabolic trough project in China
It can be seen that there is CRP in about 35 percent of the total investment cost.
5.4.2 O & M Cost
In the operation and maintenance sector it is also possible to reduce costs compared with a
plant operated in Europe and North America. For a common scenario in Europe and North
America O&M costs are usually about 2% of the total investment cost per year. In considera-
tion of all cost reduction factors described below, this proportion could be reduced to
1.25%/yr.
Figure 5-14 shows the typical costs for O&M of a 100MW parabolic trough power plant
with storage in North America. /S&L 2009/
Solar BOP32%
Steel SupportStructure
10%
Heat CollectionElements
12%
Mirrors12%
Power Block14%
Thermal Storage11%
SiteDevelopment
9%

87 Pre-feasibility Study of a CSP Project in China
Figure 5-14: Costs distribution of O&M
Based on Figure 5-14, it is evident that the largest component of the O&M costs is the staff-
ing costs. The following table shows a comparison of the staffing costs for China and Germa-
ny.
Table 5-6: Comparison of staffing costs between China and Germany
Staff Germany
$/h
China
$/h
CRP
%
Industrial workers 24.5 1.6 94%
Seller 15.5 2.5 84%
Chief secretary 23.3 4.1 82%
Engineer 35.8 6.3 72%
Head of department 47.3 9.8 79%
Product manager 41.6 19.1 54%
For the operation and maintenance costs only the staffing cost reduction will be considered.
For the calculation of the O&M costs a 72% CRP for an engineer will be used. Due to rela-
tively low productivity in China, a CRP of 0.3 for staffing costs has been chosen.
Based on the O&M costs from the Sargent & Lundy Study in 2009 and the proportion of
staffing costs, a rough 2.5 $M/a cost reduction is estimated. Figure 5-15 illustrates the cost
42%
34%
6%
8%
1%
3% 2% 4%
Staffing
Solar field
Power block and BOP
Water & process
Capital equipment
Misc.
Service & contracts
Spares & consumables

Pre-feasibility Study of a CSP Project in China 88
distribution for O&M in China, it can be seen that the cost for the solar field is the largest
component.
Figure 5-15: Cost distribution O&M in China
5.4.3 Levelized Energy Cost
As summarised from the figures shown in the previous sections and based on methodology
described in Section 4.1.2, the levelized energy cost of parabolic trough project in China is
calculated. (See Table 5-7)
Table 5-7: Comparison of LEC of parabolic trough plant in Europe/North America with in
China
Trough Unit Fichtner China
2008 2009
Power Plant Trough 41 Trough 41
Storage Storage
Annual net electrici-
ty output GWh 196 194
LEC $/kWhe 0.369 0.208
Cost Reduction % 44%
With the utilization of the lower cost of local products and staffing, the electricity cost of a
41MW parabolic trough power plant in China is 44 percent lower than that in Europe/North
America.
17%
47%
9%
11%
2%
5%
3%6%
Staffing
Solar field
Power block and BOP
Water & process
Capital equipment
Misc.
Service & contracts
Spares & consumables
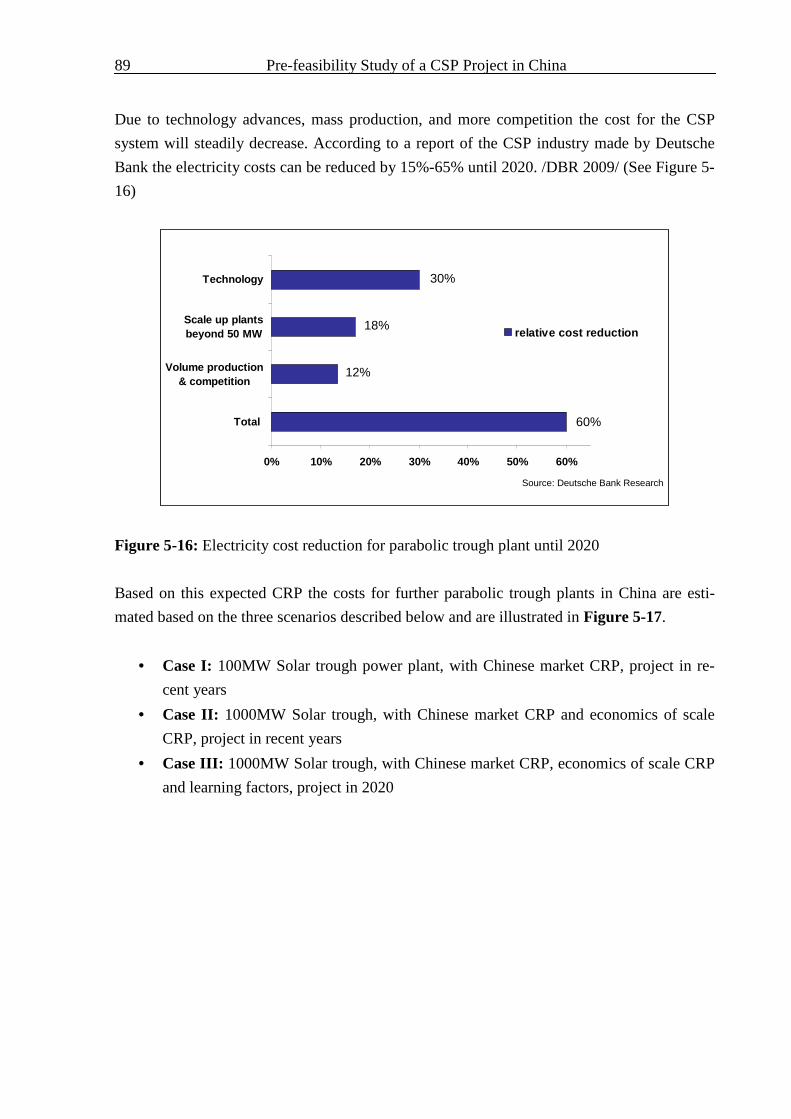
89 Pre-feasibility Study of a CSP Project in China
Due to technology advances, mass production, and more competition the cost for the CSP
system will steadily decrease. According to a report of the CSP industry made by Deutsche
Bank the electricity costs can be reduced by 15%-65% until 2020. /DBR 2009/ (See Figure 5-
16)
Figure 5-16: Electricity cost reduction for parabolic trough plant until 2020
Based on this expected CRP the costs for further parabolic trough plants in China are esti-
mated based on the three scenarios described below and are illustrated in Figure 5-17.
• Case I: 100MW Solar trough power plant, with Chinese market CRP, project in re-
cent years
• Case II: 1000MW Solar trough, with Chinese market CRP and economics of scale
CRP, project in recent years
• Case III: 1000MW Solar trough, with Chinese market CRP, economics of scale CRP
and learning factors, project in 2020
0% 10% 20% 30% 40% 50% 60%
Total
Volume production& competition
Scale up plantsbeyond 50 MW
Technology
relative cost reduction
Source: Deutsche Bank Research
30%
18%
12%
60%
0% 10% 20% 30% 40% 50% 60%
Total
Volume production& competition
Scale up plantsbeyond 50 MW
Technology
relative cost reduction
Source: Deutsche Bank Research
30%
18%
12%
60%

Pre-feasibility Study of a CSP Project in China 90
Figure 5-17: Electricity cost for three scenarios in China
In 2020 the electricity cost of 1000 MW parabolic trough project in China is expected to be
reduced at 0.12 $/kWhe, which takes only 75% of the cost for current 100 MW plant.
All of the costs shown above are electricity costs at the power plant. However, most gener-
ated electricity must be transported and used in the load centers, for example, from Xinjiang
or Gansu provinces to South China or East China and from Inner Mongolia to Beijing. These
transmission distances are normally a distance of 200km to 2000km. To obtain the electricity
costs at the load center the electricity losses of 0.5GWh/(km•a) (Fichtner data), the invest-
ment cost for 1000kV HVAC transmission line of approximately 3,980$/km /TDW 2007/ and
the investment cost for 500kV HVDC transmission lines of approximately 383,000$/km
/TDW 2005/ must be considered. The result is illustrated in the following figure and detailed
figures are presented in Appendix F.
0.12
0.16
0.14
0.00 0.05 0.10 0.15
Case III
Case II
Case I
$/kWhe

91 Pre-feasibility Study of a CSP Project in China
Figure 5-18: Electricity cost at the load center
For short distance transmission (200km) AC is preferred and DC is used for a long distance
transmission of 2000km.
5.4.4 Comparison with PV in China
As another choice for large scale solar energy applications, photovoltaic technology (PV) has
the world’s fastest growth and is expected to maintain a high speed of development. Accord-
ing to a recent status report of global renewable energy use, since 2002 the PV production has
been doubling every 2 years and increasing on average by 48% each year. At the end of 2008,
the cumulative installed PV capacity reached 15GW worldwide and 90% of the capacity is
grid-connected solar PV.
Due to the large demand, the manufacture of solar cells and PV arrays has expanded dramati-
cally in recent years. By the end of 2007, there are over 50PV manufacturers in China and the
annual production capacity has reached 2900MW. In the year 2007, Chinese manufacturers
have produced almost 1200MW solar cells and PV modules and become one of the biggest
PV producers in the world. Despite the large production capacity, the cumulative installed PV
capacity by 2007 was only 100MW, less than 1% of the world cumulative installed capacity.
Roughly 98% of the PV production of China has been exported.
In March 2009 the Ministry of Finance and Ministry of Housing (Urban-Rural) in China has
promulgated the "Implementing the Opinion Concerning the Speeding up the Promotion of
the Use of Solar Energy/PV Power in Buildings" and decided to subsidize a maximum 20
RMB/W for the building of integrated photovoltaic solar energy. /MFMHURC 2009/ This
policy will promote the widespread utilization of PV technology in China. The following
0.16
0.14
0.17
0.12
0.14
0.19
0.00
0.02
0.04
0.06
0.08
0.10
0.12
0.14
0.16
0.18
0.20
Case I Case I Case II Case II Case III Case III
200 2,000 200 2,000 200 2,000
$/kW
he
Present Future
km kmkmkmkm km
0.16
0.14
0.17
0.12
0.14
0.19
0.00
0.02
0.04
0.06
0.08
0.10
0.12
0.14
0.16
0.18
0.20
Case I Case I Case II Case II Case III Case III
200 2,000 200 2,000 200 2,000
$/kW
he
Present Future
0.16
0.14
0.17
0.12
0.14
0.19
0.00
0.02
0.04
0.06
0.08
0.10
0.12
0.14
0.16
0.18
0.20
Case I Case I Case II Case II Case III Case III
200 2,000 200 2,000 200 2,000
$/kW
he
Present Future
km kmkmkmkm km

Pre-feasibility Study of a CSP Project in China 92
table and figure demonstrate the development forecast of the PV electricity generation in
China. /Lu et al. 2009/
Table 5-8: Forecast of PV market in China by 2010 and 2020
Market segment
2010 2020
Capacity
MW
Share
%
Capacity
MW
Share
%
Rural electrification 80 32% 200 12.5%
Communication & In-dustry
40 16% 100 6.25%
Photovoltaic product 30 12% 100 6.25%
On-grid PV building 50 20% 1000 62.5%
On-grid PV power plant 50 20% 200 12.5%
Total 250 100% 1600 100%
* The figures for 2010 2020 are estimated
Figure 5-19: China PV market development 2004-2020
The new technology of PV to improve the efficiency and reduce the costs has also been de-
veloped very quickly. From standard crystalline silicon modules newer alternatives include
casting wafers instead of sawing, thin film, concentrator modules, 'Sliver' cells etc. Due to
competition, and the economics of scale and technology advancement, the capital cost of PV
65 70 75 100 120250
1600
0
200
400
600
800
1000
1200
1400
1600
2004 2005 206 2007 2008 2010* 2020*
PV Market Development (MW)

93 Pre-feasibility Study of a CSP Project in China
has decreased. The PV cost of development in California and China is shown in Figure 5-20.
/Shah 2008/
Figure 5-20: PV cost development in California and China
The sharp reduction of the PV cost from 0.55$/kWh in 2006 to 0.30$/kWh currently in China
is mainly the result of competition by manufacturers and mass production.
Figure 5-21: Comparison of current electricity cost
PV Cost Development in $/kWh
0.22 0.20
0.30
0.55
0.00
0.10
0.20
0.30
0.40
0.50
0.60
2006 2009
California
China
Gas/CoalPV in
EuropeUSA
PV inChina
CSP inEurope
USA
CSP inChina
0.00
0.05
0.10
0.15
0.20
0.25
0.30
0.35
0.40
Ele
ctri
city
Co
st (
$/kW
h)
0.6
0.21
0.37
0.3
0.2
Gas/CoalPV in
EuropeUSA
PV inChina
CSP inEurope
USA
CSP inChina
0.00
0.05
0.10
0.15
0.20
0.25
0.30
0.35
0.40
Ele
ctri
city
Co
st (
$/kW
h)
0.6
0.21
0.37
0.3
0.2

Pre-feasibility Study of a CSP Project in China 94
The Figure 5-21 indicates that compared with conventional energy, for example natural gas
and coal, the cost of electricity generated by PV and CSP technologies is still high. At pre-
sent, CSP has the cost advantage over PV technology in China for large-scale power plants in
terms of their energy storability. However, for small-sized energy generation in the residen-
tial, commercial and industrial sector or in countries with low solar radiation PV technology
plays a dominant role. Due to the price increase of conventional fuels and continuously de-
clining costs for solar energy, CSP and PV will become more competitive and become the
sources of energy provision.

95 References
References
/AS 2009/
Abengoa Solar
Solutions to Global Climate Change - Power Tower Plants
http://www.abengoasolar.com/sites/solar/resources/pdf/en/PS10.pdf
(Date of access: 01.12.2009)
/Andasol 2008/
Location Map of Andasol 1 http://www.solarmillennium.de/upload/pdf/Lage_u_Anfahrt_Andasol_dt.pdf (Date of access: 02.12.2009)
/Avery et al. 2007/
Avery, Christopher,Consoli, Carla, Glennon, Robert and Megdal, Sharon B.
Good Intentions, Unintended Consequences: The Central Arizona Groundwater Replen-
ishment District. Arizona Law Review
http://ssrn.com/abstract=965047
(Date of access: 01.12.2009)
/Baulinks 2006/
Internationaler Baukostenvergleich 2005
http://www.baulinks.de/webplugin/2005/1824.php4?url1=http://www.baulinks.de/webplug
in/z_starta.txt&url2=http://www.baulinks.de/webplugin/z_ende.txt
(Date of access: 01.12.2009)
/BCIS 2007/
Building Cost Information Service (BCIS)
Cost of Building in China 45% of Cost in Hong Kong http://www.bcis.co.uk/site/scripts/press_article.aspx?pressreleaseID=24 (Date of access: 02.12.2009)
/Bergermann 1996/
Schlaich Bergermann und Partner GbR Presentation 1996
/Bergermann 2001/
Schlaich Bergermann und Partner GbR
EuroDish – Stirling, System Description /Broesamle et al. 2001/

References 96
Broesamle H., Mannstein H., Schillings C., Trieb F.
Assessment of solar electricity potentials in North Africa based on satellite data and a geo-
graphic information system.
/CEC 2007/
Commission of the European Communities
A Technology Map for the European Strategic Energy Technology Plan (SET-Plan)
http://ec.europa.eu/energy/technology/set_plan/doc/2007_technology_map_description.pdf
(Date of access: 01.12.2009)
/Cohen et al. 2005/
G, Skowronski M, Cable R., Los Angeles, CA,
Solar thermal parabolic trough electric power plants for electric utilities in California; So-
largenix Energy
/CPC 2009/
China Power Contractor
http://www.china-power-contractor.cn/Sample-quotation-50MW-condensing-steam-
turbine-genset.html
(Date of access: 12.07.2009)
/DBR 2009/
Deutsche Bank Research
The CSP Industry
/Doerte et al. 2002/
Doerte Laing, Wolfgang Schiel, Peter Heller
Dish-Stirling-Systeme- Eine Technologie zur dezentralen solaren Stromerzeugung
/EC 2007/
European Commission
Concentrating Solar Power - From Research to Implementation
/EEL&MRCL 1999/
Enermodal Engineering Limited & Marbek Resource Consultants Ltd.
Cost Reduction Study for Solar Thermal Power Plants Final Report,
/EEUSE 2008/
EEUSE
Globally solar resource distribution

97 References
http://www.eeccn.com/Energy/9048.html
(Date of access: 01.12.2009)
/EIA 2009/
Energy Information Administration (EIA)
International Energy Outlook 2009
http://www.eia.doe.gov/oiaf/ieo/world.html
(Date of access: 01.12.2009)
/EIAC 2009/
EIA Cap, World Total Electricity Installed Capacity
http://www.eia.doe.gov/international/RecentTotalInstalledCapacity.xls
(Date of access: 01.12.2009)
/EIAG 2009/
EIA Gen, World Total Net Electricity Generation
http://www.eia.doe.gov/emeu/international/RecentTotalElectricGeneration.xls
(Date of access: 01.12.2009)
/EPI 2009/
Earth Policy Institute
http://www.earthpolicy.org/Updates/2008/Update73_data.htm#table1
(Date of access: 01.08.2009)
/EPRI 2006/
EPRI; Solar Thermal Electric Technology.
www.epriweb.com/public/000000000001012731.pdf
(Date of access: 01.12.2009)
/ESRELA 2008/
European Solar Thermal Electricity Association (ESRELA)
CSP Potential for Europa until 2030
/FDE 1994/
FDE, Phoebus-Consortium, Germany
PHOEBUS – A Solar Tower Plant with Volumetric Air Receiver: Post-Feasibilty Study
/FISE 2008/
Fraunhofer ISE Freiburg 2008
Marktübersicht Wärmekraftmaschinen
References 98
/Flagsol 2008/
Flagsol Skal-ET collector
Brief Technical Description of the SKAL-ET Collector
http://www.flagsol.com/skal_tech.htm
(Date of access: 01.12.2009)
/FS 2008/
Fact Sheet
Beacon Solar Energy Project (08-AFC-2)
http://www.energy.ca.gov/sitingcases/beacon/DESCRIPTION.PDF
(Date of access: 01.12.2009)
/FTPR 2005/
Final Technical Progress Report of PS10
10 MW Solar Thermal Power Plant for Southern Spain
/GENI 2008/
GENI Global Energy Network Institut
http://www.geni.org/globalenergy/library/renewable-energy-resources/world/asia/solar-
asia/solar-china.shtml
(Date of access: 01.12.2009)
/Greenpacks 2008/
California’s First Solar Thermal Plant in 20 Years http://www.greenpacks.org/2008/10/31/california’s-first-solar-thermal-plant-in-20-years/ (Date of access: 01.12.2009)
/Haeger 1994/
Haeger M.; DLR
PHOEBUS Technology Program Solar Air Receiver (TSA): “Operational Experience with
the Experimental Set-Up of a 2.5 MWth Volumetric Air Receiver (TSA) at the Plataforma
Solar de Almeria”
/Heliotrack 2009/
http://www.heliotrack.com/TheHeliostat.html (Date of access: 01.08.2009)
/IEA 1991/
International Energy Agency (IEA)
Guidelines for the economic analysis of renewable energy technology applications
/IEA 2006/

99 References
Iternational Energy Agency (IEA)
Renewable Energy: RD&D Priorities Insights from IEA Technology Programmes
/IEA 2008/
Internationale Energie Argentur (IEA):
Energy Technology Perspective 2008: Szenarien & Strategien bis 2050
/Kaltschmitt et al. 2007/
Martin Kaltschmitt, Wolfgang Streicher, Andreas Wiese
Renewable Energy - Technology, Economics and Environment
/Kelly; Kearney 2006/
B. Kelly, D. Kearney
Thermal Storage Commercial Plant Design Study for a 2-Tank Indirect Molten Salt System
http://www.nrel.gov/docs/fy06osti/40166.pdf
(Date of access: 01.12.2009)
/Li; Wang 2007/
Li Junfeng, Wang, Sicheng
China Solar PV Report
/Liao; Long 2008/
LIAO Kui,LONG Xin-feng
Research Progress on Power Generation Technology of Disk Type Solar and Thermal
Power Energy Based on Small Size Generator
/Lu et al. 2009/
Lu Xiaonan, Huang Lipei, Yang Zhongqing
China PV industry status and development trend
/Lutz et al. 2005/
Lutz Kaufmann, Dirk Panhans, Boney Poovan, Benedikt Sobotka
China Champions: How Can German Companies Successfully Use Of Location China for
Their Global Strategy
(China Champions: Wie Deutsche Unternehmen Den Standort China Erfolgreich Fur Ihre
Globale Strategie Nutzen)
/Meyer 2009/
Riaan Meyer, Centre for Renewable and Sustainable Energy Studies, Stellenbosch Univer-sity

References 100
Concentrated Solar Power – An Overview
/MFMHURC 2009/
Ministry of Finance and Ministry of Housing and Urban-Rural of China
Implementing Opinion Concerning Speeding up the Promotion of the Use of Solar En-
ergy/PV Power in Buildings
http://hn.mof.gov.cn/jinjijianshesi/zhengwuxinxi/zhengcefagui/200903/t20090326_126456
.html
(Date of access: 01.12.2009)
/Mierlo 2007/
Frank van Mierlo, Breakdown of the incoming solar energy.jpg http://en.wikipedia.org/wiki/File:Breakdown_of_the_incoming_solar_energy.jpg (Date of access: 01.12.09)
/MLR 2009/
The Minister of Land and Resource
Land and Resources bulletin 0f 2008 P.R.C
http://news.sinodz.com/html/28/n-1628.html
(Date of access: 01.12.09) /NASA 2009/
National Aeronautics and Space Administration (NASA)
Earth’s Energy Budget
http://education.gsfc.nasa.gov/experimental/all98invProject.Site/Pages/trl/inv2-
1.abstract.html
(Date of access: 01.12.09)
/New 2009/
Concentrated Solar Thermal Power http://newenergydirection.com/blog/2008/12/concentrated-solar-thermal-power/ (Date of access: 02.12.09)
/NBSC 2009/
National Bureau of Statistics of China
2008 Statistical Bulletin of National Economic and Social Development
http://www.gychaotian.gov.cn/zwgk/ShowArticle.asp?ArticleID=23495
(Date of access: 01.12.09) /NI 2007/
Nautilus Institute

101 References
Power System development and nationwide grid interconnection in China
http://www.nautilus.org/archives/energy/grid/papers/zhou.PDF
(Date of access: 01.12.09) /NREL 2009/
National Renewable Energy Laboratory
Power plant Data
http://www.nrel.gov/csp/troughnet/power_plant_data.html
(Date of access: 01.12.09) /Pitz-Paal et al. 2004/
Robert Pitz-Paal, Jürgen Dersch, Barbara Milow,
German Aerospace Center
European Concentrated Solar Thermal Road-Mapping
/Prognos 2007/
Prognos AG,Fraunhofer ISE, IE, IWR, WindGuard
Evaluation of the 4th Energy Renewable Energy Program H - Solar Power
(Evaluierung des 4. Energieforschungsprogramms Erneuerbare Energien H – Solare
Kraftwerke)
http://www.erneuerbare-energien.de/files/pdfs/allgemein/application/pdf/eval_h_kl.pdf
(Date of access: 01.12.09)
/PS 2008/
Pumps & Systems
World's Largest Solar Tower Power Plant Begins Operation in Spain
http://www.pump-zone.com/global-news/global-news/worlds-largest-solar-tower-power-
plant-begins-operation-in-spain.html
(Date of access: 01.12.09) /PSA 2004/
Plataforma Solar de Almería
Annual Report 2004
http://www.psa.es/webeng/techrep/2004/ATR2004_ing.pdf
(Date of access: 01.12.09) /Pye 2008/
John D Pye, Faculty of Engineering, University of New South Wales System Modelling of the Compact Linear Fresnel Reflector
/Pye 2009/

References 102
John Pye, Solar-Thermal Group, Australian National University Compact Linear Fresnel Reflector http://pye.dyndns.org/ (Date of access: 01.12.09)
/RETS 2009/
RETScreen International Clean Energy Project Analysis Software
Available at: www.retscreen.net
/Renewables 2009/
The German Solar Thermal Power Plant Industry http://www.renewables-made-in-germany.com/index.php?id=229&L=1
(Date of access: 01.12.09)
/REW 2007/
Renewable Energy World
Acciona Connects 64 MW Solar Thermal Plant to Nevada Grid
http://www.renewableenergyworld.com/rea/news/article/2007/06/acciona-connects-64-
mw-solar-thermal-plant-to-nevada-grid-48848
(Date of access: 01.12.09)
/REW 2009/
Renewable Energy World
Global Concentrated Solar Power Industry to Reach 25 GW by 2020
http://www.renewableenergyworld.com/rea/news/article/2009/05/global-concentrated-
solar-power-industry-to-reach-25-gw-by-2020?cmpid=WNL-Friday-May8-2009
(Date of access: 01.12.09)
/See 2008/
Forget Oil, Water Is China’s Biggest Shortage http://seekingalpha.com/article/93900-forget-oil-water-is-chinas-biggest-shortage
(Date of access: 02.12.09) /Shah 2008/
Vishal Shah; Barclays Capital Inc. (BCI, New York)
Solar Energy Industry Overview
/S&L 2003/
Sargent & Lundy LLC Consulting Group
Assessment of Parabolic Trough and Power Tower Solar
Technology Cost and Performance Forecasts

103 References
/S&L 2009/
Sargent & Lundy LLC Consulting Group
Assessment of Parabolic Trough, Power Tower, and Dish Solar Technology
Cost and Performance Forecasts - 2008
/SM 2008/
Solar Millennium AG
The parabolic trough power plants Andasol 1 to 3
The largest solar power plants in the world–Technology premiere in Europe
http://www.solarmillennium.de/upload/Download/Technologie/eng/Andasol1-3engl.pdf
(Date of access: 01.12.09) /SS 2006/
Schott Solar
Schott Memorandum on Solar Thermal Power Plant Technology
http://www.schott.com/solar/english/download/schott_memorandum_e.pdf
(Date of access: 01.12.09)
/SullivanM 2009/
Marlene O’Sullivan; DLR
CSP Project Review
http://www.dlr.de/tt/Portaldata/41/Resources/dokumente/institut/system/projects/Current_
CSP_Project_Development-March_2009.pdf
(Date of access: 01.12.2009)
/SullivanS 2009/
Sean Sullivan
Can Concentrating Solar Power Outshine Fossil Fuels?
http://cleantechnica.com/2009/04/01/can-concentrating-solar-power-outshine-fossil-fuels/
(Date of access: 01.12.09) /TDW 2005/
Transmission and Distribution World
HVDC Converter Stations Connect 3000-MW Line
http://tdworld.com/substations/HVDC-converter-stations/index.html
(Date of access: 01.12.09) /TDW 2007/

References 104
Transmission and Distribution World
ABB to Supply Products for China’s Highest-Voltage AC Power Line
http://tdworld.com/projects_in_progress/business_in_tech/abb-china-high-voltage-power-
line/index.html
(Date of access: 01.12.09) /TEB 2007/
The Energy Blog
11 MW Solar Tower Plant Dedicated in Spain
/Thomas 2000/
Thomas R. Mancini
IEA-Solar Power and Chemical Energy Systems
Task III: Solar Technology and Applications
Catalog of Solar Heliostats
http://www.fika.org/jb/resources/Heliostat%20Catalog.pdf (Date of access: 01.12.09)
/Weinrebe 2000/
Weinrebe, G. Dissertation University Stuttgart
Technische, ökologische und ökonomische Analyse von solarthermischen
Turmkraftwerken
(Technical, environmental and economic analysis of solar tower power plants)
/YNN 2007/
Y Net News
Israeli company to build largest solar park in world in US
http://www.ynetnews.com/articles/0,7340,L-3430085,00.html
(Date of access: 01.12.09) /Zara 2009/
Zara Maung
China gears up for solar thermal plant
http://social.csptoday.com/content/china-gears-solar-thermal-plant
(Date of access: 01.12.09)

CSP Projects Overview
105
Appendix A: CSP Projects Overviw
(Status: March 2009)
(Unit: MW; Source /DBR 2009/)

Cost Calculation for Trough 106
Appendix B. Cost Calculation for Trough
Trough Trough Trough Trough Trough Trough Trough TroughNo Storage storage No Storage No Storage Storage No Storage storage
Source S&L03 S&L03 Fichtner Fichtner Data base S&L08 S&L08SEGS VI Trouph 50 UAE 100 UAE 75 for ChinaHybrid TES Spain Hybrid Solar only project
TECHNICAL DESIGN DATASolar fieldCollector area km² 0.188 0.496 0.58 0.58 0.58 0.767 1.11area total 2 2 2Power plantThermal capacity, power plant MWt 103.6 154.3 260.0Power plant efficiency % 28.9% 32.4% 38.5%Electrical capacity, net MWe 30 50 100 75 41 100 100StorageThermal capacity GWht 1.4full-load hours h 9 6
OPERATIONAL DATA Utilization Capacity factor % 22% 47% 25% 25% 46% 33% 51%- actual plant h/yr 1927 4117 2230 2230 4000Annual electricity generation, net GWhe/yr 58 206 223 167 166 290 451Fuel consumption GWh/yr 160Gas electricity generation, net GWhe/yr 56Solar electricity generation, net GWhe/yr 167Fuel price $/kWh 6
FINANCIAL CONSTRAINTSLifetime yr 25 25 25 25 25 25 25Interest rate, inflation adjusted %/yr 8% 8% 8% 8% 8% 8% 8%Annuity %/yr 9.37% 9.37% 9.37% 9.37% 9.37% 9.37% 9.37%O&M %/yr 2.1% 2.3% 2.1% 2.1% 2.1%
CAPITAL EXPENDITURESSolar BoF $/m² 250 234 150 150 150 141 141Steel support structure $/m² 67 67 160 160 160 172 172Heat Collection Elements $/m² 43 43 60 60 60 53 53Mirrors $/m² 43 40 60 60 60 63 63Power Block $/kWe 527 306 2500 2500 2900 1183 1183Thermal storage $/kWe 0 958 0 0 762 0 762Site development $/m² 30 30 30 0 0
Solar BoF M $ 47 116 87 87 87 108 157Steel support structure M $ 13 33 93 93 93 132 191Heat Collection Elements M $ 8 21 35 35 35 41 59Mirrors M $ 8 20 35 35 35 48 70Power Block M $ 16 15 250 188 120 118 118Thermal storage M $ 0 48 0 0 32 0 76Site development M $ 60 60 60Indirects
Total capital expenditures Mln $ 92 254 559 524 461 447 671Specific capital expenditures $/kWe 3052 5073 5594 6992 11136 4471 6708
ELECTRICITY GENERATING COSTSO&M M $/yr 2 6 12 11.2 9.9 6.7 7.8- Avg. burdened labor rate M $/yr- Staff cost M $/yr- Ann. material& services cost M $/yrAnnuity M $/yr 9 24 52 49 43 42 63InsuranceO&M $/kWe 64 115 120 150 0.060 67 78O&M $/kWhe 0.033 0.028 0.054 0.067 0.023 0.017Fuel costs M $/yr 1.008Total electricity generating costs M $/yr 11 30 64 60 53 49 71Specific electricity generating costs$/kWhe- LEC $/kWhe 0.182 0.143 0.293 0.362 0.321 0.168 0.157- figure in report $/kWhe 0.1037 0.33 0.1275 0.1198

Cost Calculation for Tower
107
Appendix C: Cost Calculation for Tower TowerSource S&L03 S&L08 Fichtner
Solar Tres Solar Tres DT-2aS&L
storage storage no storgae
TECHNICAL DESIGN DATASolar fieldHeliostat field area km² 0.234 0.228 0.609Heliostat area km² 0.330Receiver area m² 280 280Receiver leistung MWht 155Power plantThermal capacity, power plant MWt 105.0 120.0 360.9Efficiency % 13.0% 13.5% 13.1%Electrical capacity, net MWe 13.65 13.65 47.25StorageThermal capacity GWht 1.7 1.9full-load hours h 16 16
OPERATIONAL DATA Average insolation kWh/(m²*d) 6 6 6
MWh/(m²*yr) 2.19 2.19 2.19Availability % 92% 92% 92%Utilization Capacity factor % 78% 78% 28%- actual plant h/yr 6833 6833 2448Annual electricity generation, net GWhe/yr 93 93 116
FINANCIAL CONSTRAINTSLifetime yr 25 25 25Interest rate, inflation adjusted %/yr 8% 8% 8%Annuity %/yr 9.37% 9.37% 9.37%O&M %/yr 2.34% 0.11% 2.69%
CAPITAL EXPENDITURESSite development & Infrastructure $/m² 11.6 25.3Heliostat field $/m² 160 230.6 191.2Receiver $/m² rec 57143 121680 151.5Tower and piping $/m² 11.6 21.99 18.9Thermal storage $/kWt 49 24.9 0.0Power block/BOP $/kWe 1397.7 4719.6 1556.6Indirect Costs $/kWe 2666 4382 653.8
Site development & Infrastructure M $ 2.7 15.4Heliostat field M $ 37.4 52.6 63.1Receiver M $ 16.0 34.1 23.5Tower and piping M $ 2.7 5.0 7.8Thermal storage M $ 5.1 3.0 0.0Power block/BOP M $ 19.1 64.4 73.5Indirect costs M $ 36.4 59.8 30.9
Total capital expenditures Mln $ 119 219 214Specific capital expenditures $/kWe 8753 16905 4534
ELECTRICITY GENERATING COSTSO&M M $/yr 2.794 0.238 5.766- Avg. burdened labor rate M $/yr 0.062- Staff cost M $/yr 2.046- Ann. material& services cost M $/yr 0.686Annuity M $/yr 11 21 20
O&M $/kWhe 0.0300 0.0026 0.0499Total electricity generating costs M $/yr 14 21 26- LEC $/kWhe 0.1500 0.2224 0.2234- figure in report $/kWhe 0.1431 0.2052

Climate of Three Selected Locations 108
Appendix D: HVAC/DC Transmission Projects until 2020 in China
System/Project Year Capacity
[MW]
Voltage
[kv]
Distance
[km] Location
Ge- Nan 1989 600 500 1000 Gezhouba-
Nanqiao
GeSha 1990 1200 500 1046 Gezhouba-
Shanghai
Tian-Guang 2001 1800 500 960 Tianshengqiao-
Guangzhou
Three Gorges-
Changzhou 2003 3000 500 860
Longquan-
Zhengping
Zhou Shan Project 1982 50 100 42 Zhoushan
Three Gorges-
Guangdong 2004 3000 500 940
Jinzhou-
Huizhou
Gui-Guang 2004 3000 500 936 Guizhou-
Guangdong
Three Gorges-
Shanghai
Under
construction
2007
3000 500 900 Three Gorges –
Shanghai
Northeast-
North(Goaling)
Planned
2008 1500 B-B
Yunnan-
Guangdong
Planned
2009 5000 800
Yunnan-
Guangzhou
Lingbao
Expansion
Planned
2009 750 168 B-B Henan-Shaanxi
Hulunbeir(Inner
Mongolia)-
Shenyang
Planned
2010 3000 500 920
Hulunbeir –
Shenyang
Ningxia-Tianjing Planned
2010 3000
Ninaxia-
Tianjin
NW-Sichuang Planned
2011 3000 Baoji-Deyang
North Shaanxi-
Shandong
Planned
2011 3000
Shaanxi-
Shandong
Shandong-East 2011 1200 B-B
Gezhouba-
Shanghai 2011 3000
Gezhouba-
Shanghai

HVAC/DC Transmission
109
Expansion
Xianjiaba-
Shanghai 2011 6400 800
Xinjiaba-
Shanghai
Jingping-East 2012 6400 800
North-Central 2012 1000
Xiluodu-Hunan 2014 6400 800 Xiluodu-
Hunan
Xiluodu-Hanzhou 2015 6400 800 Xiluodu-
Hanzhou
Nuozhadu-
Guangdong 2015 6400 800
Nuozhadu-
Guangdong
Humeng-
Shandong 2015 6400 800
Humeng-
Shandong
Jinsha River-East
China 2016 6400 800
Humeng-Tianjing 2016 6400 800 Humeng-
Tianjing
Goupitan-
Guangdong 2016 3000
Goupitan-
Guangdong
Humeng-Liaoning 2018 6400 800 Humeng-
Liaoning
Jinsha River-
Fujian 2018 6400 800
Hami-C.China 2018 6400 800
Jinsha River-East
China 2019 6400 800

Climate of Three Selected Locations 110
Appendix E: Climate of Three Selected Locations
A Daily solar Air Relative Atmospheric Wind Earth
radiation Temperature humidity pressure speed temperaturekWh/(m²•day) °C % kpa m/s °C
Jan 2.53 -13.1 52.0% 88.4 4.6 -19.9Feb 3.57 -9 42.4% 88.2 4.2 -14.9Mar 4.83 -2 30.7% 87.9 4.7 -2.7Apr 6.05 7.2 23.1% 87.6 5.3 9May 6.66 15 27.6% 87.4 5 18Jun 6.73 20.3 35.5% 87.1 4.5 23.8Jul 6.16 22.9 45.3% 87.1 3.9 25.5Aug 5.42 20.7 50.9% 87.4 3.7 21.8Sep 4.81 14.6 42.4% 87.9 4 15.2Oct 3.66 6.4 38.8% 88.2 4.4 5.7Nov 2.61 -3.8 43.8% 88.3 5.1 -5.5Dec 2.16 -10.5 51.3% 88.5 5.2 -15.6
B Daily solar Air Relative Atmospheric Wind Earth radiation Temperature humidity pressure speed temperature
kWh/(m²•day) °C % kpa m/s °CJan 2.73 -10.1 41.6% 89.7 2.3 -15.8Feb 3.71 -5 28.2% 89.5 2.5 -10Mar 4.82 2.6 22.5% 89.1 3 2.2Apr 6.03 11.5 19.1% 88.8 3.8 12.9May 6.67 19.3 20.4% 88.5 3.6 22Jun 6.69 24.7 24.5% 88.1 3.4 28.3Jul 6.34 27 31.4% 88 3.1 31.1Aug 5.62 24.7 33.7% 88.3 2.9 28.1Sep 4.87 18.2 29.7% 88.9 2.8 20.1Oct 3.7 9.1 30.5% 89.4 2.7 9.3Nov 2.82 -1.1 34.5% 89.7 2.6 -2Dec 2.27 -8.4 44.3% 89.8 2.4 -11.5
C Daily solar Air Relative Atmospheric Wind Earth radiation Temperature humidity pressure speed temperature
kWh/(m²•day) °C % kpa m/s °CJan 2.22 -9.4 55.60% 88.6 1.1 -15.6Feb 3.08 -3.1 38.60% 88.3 1.5 -10.5Mar 4.16 5 28.00% 88 2 1.6Apr 5.38 13.6 25.00% 87.7 2.2 13May 5.95 20.3 31.50% 87.5 1.9 22.2Jun 6.28 24.6 38.10% 87.2 1.6 28.2Jul 6.52 26.5 42.40% 87 1.5 30.7Aug 5.98 24.5 43.40% 87.3 1.3 28.1Sep 4.91 18.3 43.70% 87.8 1.2 20.2Oct 3.82 9.8 47.40% 88.3 1.1 9.5Nov 2.67 0.5 48.90% 88.5 1.2 -1.5Dec 1.81 -7.5 58.70% 88.7 1 -11.1
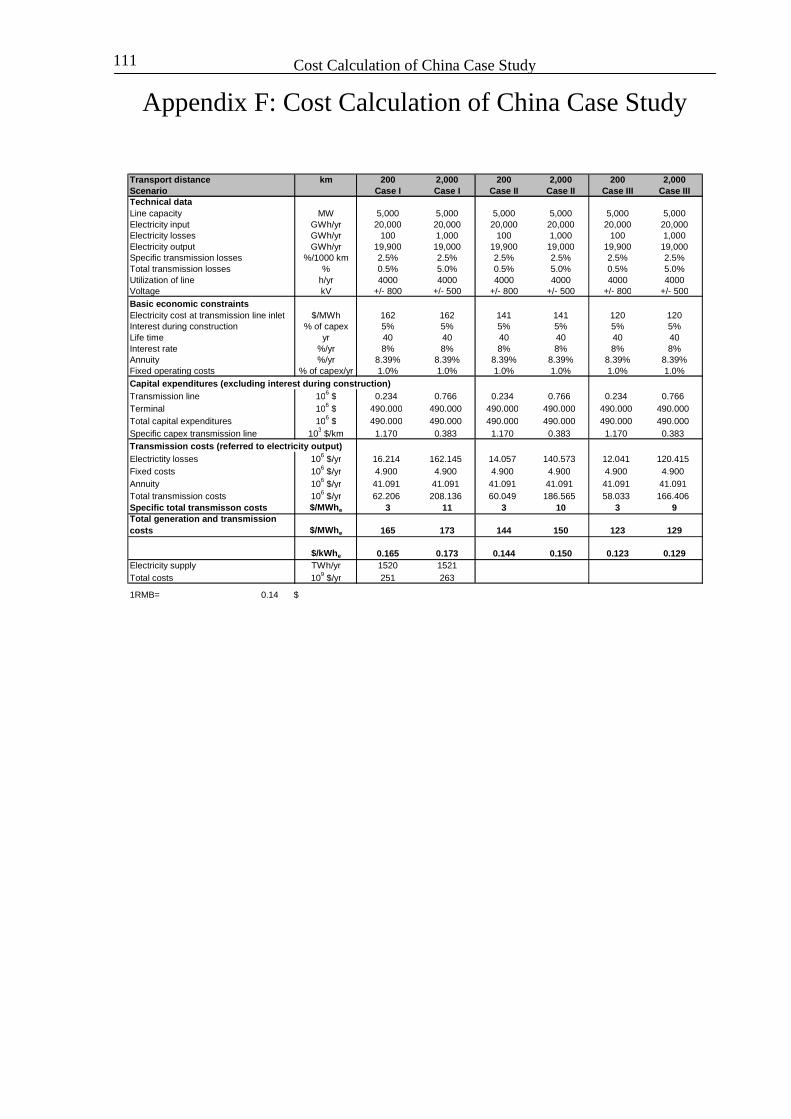
Cost Calculation of China Case Study
111
Appendix F: Cost Calculation of China Case Study
Transport distance km 200 2,000 200 2,000 200 2,000Scenario Case I Case I Case II Case II Case III Case IIITechnical dataLine capacity MW 5,000 5,000 5,000 5,000 5,000 5,000Electricity input GWh/yr 20,000 20,000 20,000 20,000 20,000 20,000Electricity losses GWh/yr 100 1,000 100 1,000 100 1,000Electricity output GWh/yr 19,900 19,000 19,900 19,000 19,900 19,000Specific transmission losses %/1000 km 2.5% 2.5% 2.5% 2.5% 2.5% 2.5%Total transmission losses % 0.5% 5.0% 0.5% 5.0% 0.5% 5.0%Utilization of line h/yr 4000 4000 4000 4000 4000 4000Voltage kV +/- 800 +/- 500 +/- 800 +/- 500 +/- 800 +/- 500
Electricity cost at transmission line inlet $/MWh 162 162 141 141 120 120Interest during construction % of capex 5% 5% 5% 5% 5% 5%Life time yr 40 40 40 40 40 40Interest rate %/yr 8% 8% 8% 8% 8% 8%Annuity %/yr 8.39% 8.39% 8.39% 8.39% 8.39% 8.39%Fixed operating costs % of capex/yr 1.0% 1.0% 1.0% 1.0% 1.0% 1.0%Capital expenditures (excluding interest during construction)Transmission line 106 $ 0.234 0.766 0.234 0.766 0.234 0.766Terminal 106 $ 490.000 490.000 490.000 490.000 490.000 490.000Total capital expenditures 106 $ 490.000 490.000 490.000 490.000 490.000 490.000Specific capex transmission line 103 $/km 1.170 0.383 1.170 0.383 1.170 0.383Transmission costs (referred to electricity output)Electrictity losses 106 $/yr 16.214 162.145 14.057 140.573 12.041 120.415Fixed costs 106 $/yr 4.900 4.900 4.900 4.900 4.900 4.900Annuity 106 $/yr 41.091 41.091 41.091 41.091 41.091 41.091Total transmission costs 106 $/yr 62.206 208.136 60.049 186.565 58.033 166.406
$/MWhe 3 11 3 10 3 9
$/MWhe 165 173 144 150 123 129
$/kWhe 0.165 0.173 0.144 0.150 0.123 0.129Electricity supply TWh/yr 1520 1521Total costs 109 $/yr 251 263
1RMB= 0.14 $
Total generation and transmissioncosts
Basic economic constraints
Specific total transmisson costs