dip. ed, (dsm), b.a. (econ.)(hons.) dsm
TRANSCRIPT
"THE RELATIONSHIP OF MOSHI'S INDUSTRIAL SECTOR WITH ITS IMMEDIATE HINTERLAND"
FRATRES STONEHOUSE KUTOLIE
DIP. ED, (DSM), B .A. (ECON.)(HONS.) DSM.
^ of ;*iMROB1
A THESIS PROJECT SUBMITTED IN "PART" FULFILMENT OF THE REQUIREMENT FOR THE DEGREE OF MASTER OF ARTS IN PLANNING IN THE UNIVERSITY OF NAIROBI.
JUNE, 1984.
(i)
THE RELATIONSHIP OF MOSHI'S INDUSTRIAL SECTOR WITH ITS IMMEDIATE HINTERLAND"
By
FRATRES STONEHOUSE KUTOLIE
DIP. ED. (DSM), B .A. (ECON.)(HONS.) DSM.
A THESIS PROJECT SUBMITTED IN "PART" FULFILMENT OF THE REQUIREMENT FOR THE DEGREE OF MASTER OF ARTS IN PLANNING IN THE UNIVERSITY OF NAIROBI.
JUNE, 1980.

(ii)
D E C L A R A T I O N
This Thesis is my original work and has not
been presented for a degree in any other
University.
KUTOLIE, F.S. (Candidate)
This Thesis has been submitted for examination
with my approval as University Supervisor.
Subir K. Saha (Supervisor).

(iii)
A C K N O W L E D G E M E N T
I am greatly indepted to the United Republic of
Tanzania, especially the Ministry of Lands, Housing and
Urban Development for sponsoring my studies at the Universit-
of Nairobi, 1979/81.
Special thanks and gratitude are directed to my
supervisor, Mr. Subir Saha, for his wise guidance, construc
tive criticisms and continuous encouragement. I am extremely
grateful to Prof. A. Subbakrishniah for having helped me in
conceptualizing the topic in the initial stages.
Many thanks also go to various officers who assisted
me in various ways especially Mr. Mwakanki and Mr. Peter
Mushi of T.C.C.C, Ltd., Moshi, Mr. Baruti, Regional Town
Planner, Moshi and Mr. Alute of Coffee Authority of Tanzania,
Moshi.
I gratefully acknowledge Mr. Joseph Masao of
Uru Secondary School and his students who assisted me in
the field work.
Lastly,but not least,I express special gratitude to
my wife, Balbina for her encouragment and prayers who gave
me inspiration to accomplish this work. I congratulate her
for her courage and determination in running our house on
her own while I was away in Nairobi for postgraduate studies.
Also special thanks go to her sister - Angela typing the work.

(iv)\
D E D I C A T I O N
This Thesis is dedicated first and foremost to
my parents Morris Mushi and Aurelia Mchomba. It is
also dedicated to my young children who persevered
my long absence. Let them inherit the spirit of
academic struggle as they grow up.
( V )
A B S T R A C T
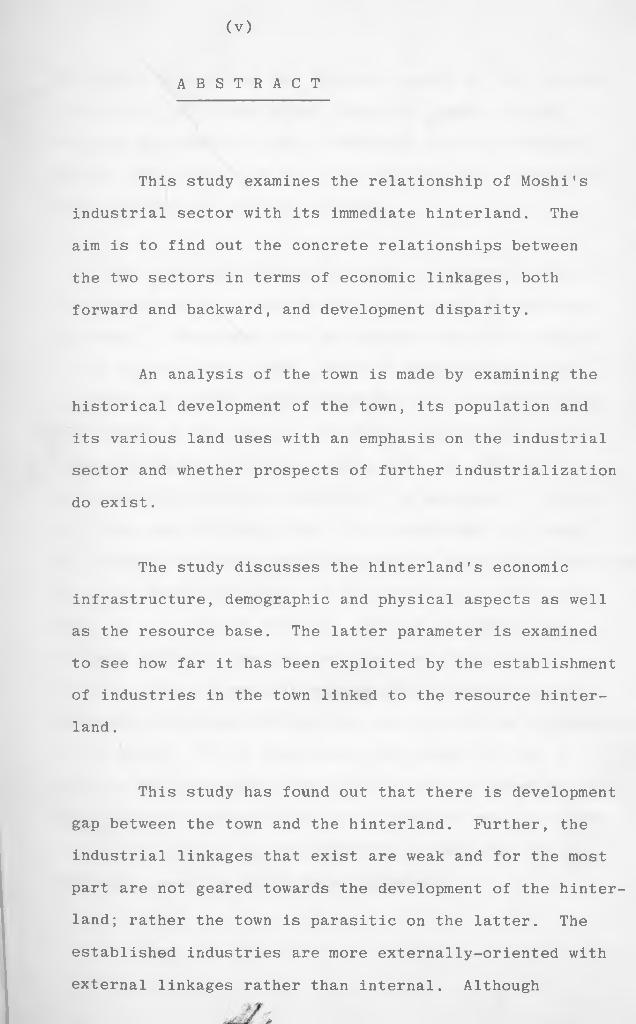
This study examines the relationship of Moshi's
industrial sector with its immediate hinterland. The
aim is to find out the concrete relationships between
the two sectors in terms of economic linkages, both
forward and backward, and development disparity.
An analysis of the town is made by examining the
historical development of the town, its population and
its various land uses with an emphasis on the industrial
sector and whether prospects of further industrialization
do exist.
The study discusses the hinterland's economic
infrastructure, demographic and physical aspects as well
as the resource base. The latter parameter is examined
to see how far it has been exploited by the establishment
of industries in the town linked to the resource hinter
land .
This study has found out that there is development
gap between the town and the hinterland. Further, the
industrial linkages that exist are weak and for the most
part are not geared towards the development of the hinter
land; rather the town is parasitic on the latter. The
established industries are more externally-oriented with
external linkages rather than internal. Although
(Vi)
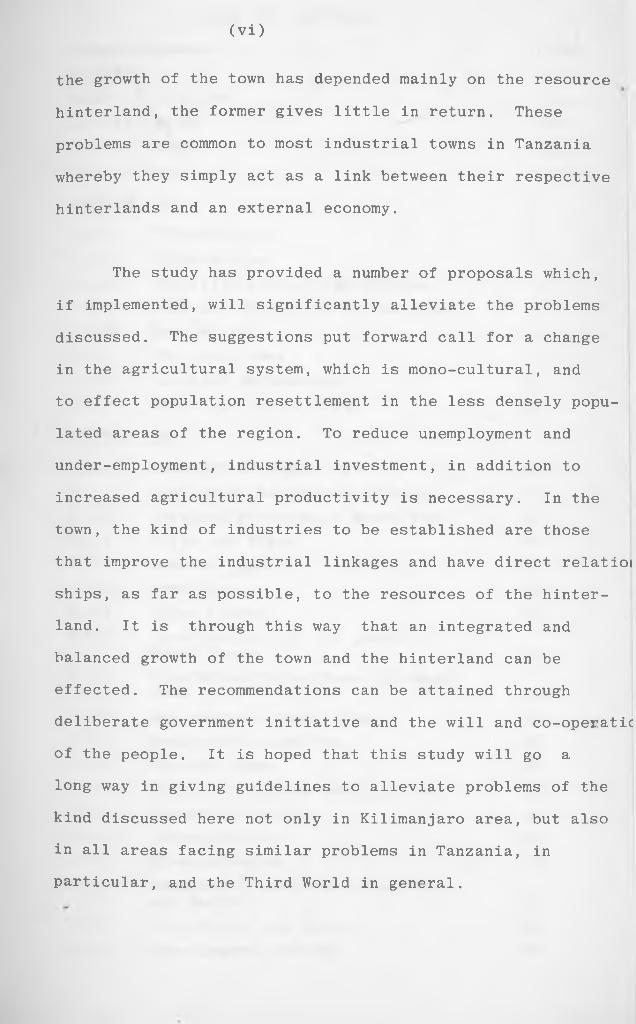
the growth of the town has depended mainly on the resource
hinterland, the former gives little in return. These
problems are common to most industrial towns in Tanzania
whereby they simply act as a link between their respective
hinterlands and an external economy.
The study has provided a number of proposals which,
if implemented, will significantly alleviate the problems
discussed. The suggestions put forward call for a change
in the agricultural system, which is mono-cultural, and
to effect population resettlement in the less densely popu
lated areas of the region. To reduce unemployment and
under-employment, industrial investment, in addition to
increased agricultural productivity is necessary. In the
town, the kind of industries to be established are those
that improve the industrial linkages and have direct relatioi
ships, as far as possible, to the resources of the hinter
land. It is through this way that an integrated and
balanced growth of the town and the hinterland can be
effected. The recommendations can be attained through
deliberate government initiative and the will and co-operatic
of the people. It is hoped that this study will go a
long way in giving guidelines to alleviate problems of the
kind discussed here not only in Kilimanjaro area, but also
in all areas facing similar problems in Tanzania, in
particular, and the Third World in general.
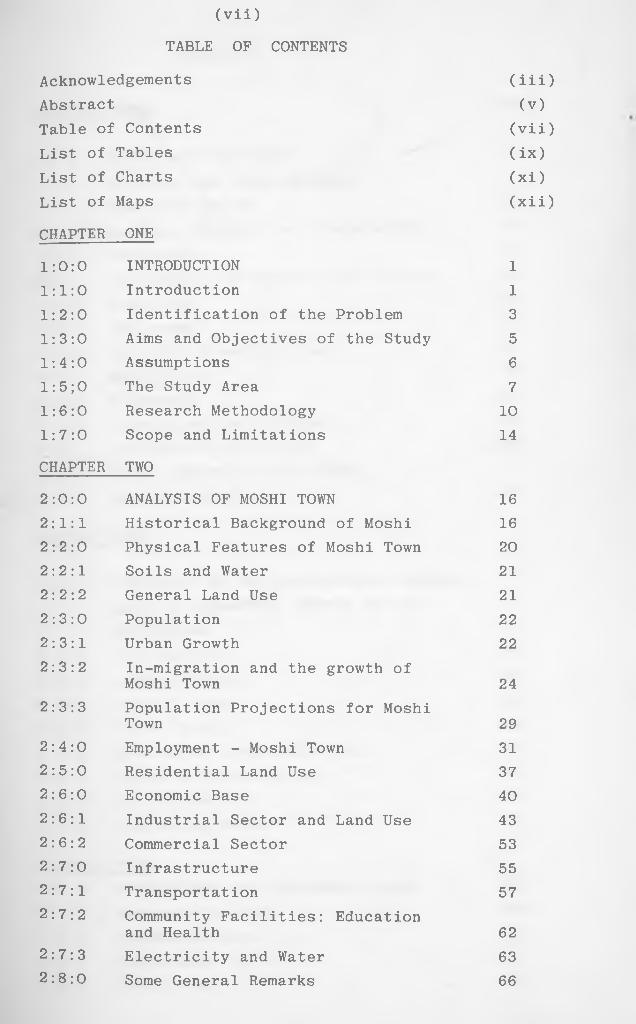
(vii)
TABLE OF CONTENTS
Acknowledgements (iii)Abstract (v)Table of Contents (vii)List of Tables (ix)List of Charts (xi)List of Maps (xii)
CHAPTER ONE
1:0:0 INTRODUCTION 11:1:0 Introduction 11:2:0 Identification of the Problem 31:3:0 Aims and Objectives of the Study 51:4:0 Assumptions 61:5;0 The Study Area 71:6:0 Research Methodology 101:7:0 Scope and Limitations 14
CHAPTER TWO
2:0:0 ANALYSIS OF MOSHI TOWN 162:1:1 Historical Background of Moshi 162:2:0 Physical Features of Moshi Town 202:2:1 Soils and Water 212:2:2 General Land Use 212:3:0 Population 222:3:1 Urban Growth 222:3:2 In-migration and the growth of
Moshi Town 242:3:3 Population Projections for Moshi
Town 292:4:0 Employment - Moshi Town 312:5:0 Residential Land Use 372:6:0 Economic Base 402:6:1 Industrial Sector and Land Use 432:6:2 Commercial Sector 532:7:0 Infrastructure 552:7:1 Transportation 572:7:2 Community Facilities: Education
and Health 622:7:3 Electricity and Water 632:8:0 Some General Remarks 66
(viii)
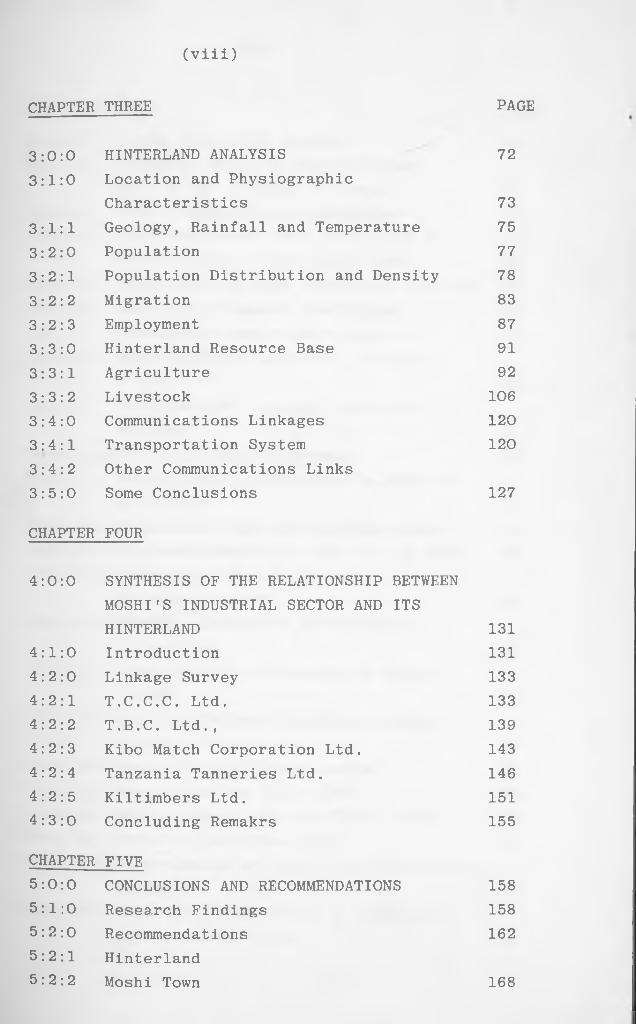
CHAPTER THREE PAGE
3:0:0 HINTERLAND ANALYSIS 723:1:0 Location and Physiographic
Characteristics 733:1:1 Geology, Rainfall and Temperature 753:2:0 Population 773:2:1 Population Distribution and Density 783:2:2 Migration 833:2:3 Employment 873:3:0 Hinterland Resource Base 913:3:1 Agriculture 923:3:2 Livestock 1063:4:0 Communications Linkages 1203:4:1 Transportation System 1203:4:2 Other Communications Links3:5:0 Some Conclusions 127
CHAPTER FOUR
4:0:0 SYNTHESIS OF THE RELATIONSHIP BETWEEN MOSHI'S INDUSTRIAL SECTOR AND ITSHINTERLAND 131
4:1:0 Introduction 1314:2:0 Linkage Survey 1334:2:1 T.C.C.C. Ltd. 1334:2:2 T.B.C. Ltd., 1394:2:3 Kibo Match Corporation Ltd. 1434:2:4 Tanzania Tanneries Ltd. 1464:2:5 Kiltimbers Ltd. 1514:3:0 Concluding Remakrs 155
CHAPTER FIVE5:0:0 CONCLUSIONS AND RECOMMENDATIONS 1585:1:0 Research Findings 1585:2:0 Recommendations 1625:2:1 Hinterland5:2:2 Moshi Town 168
(ix)
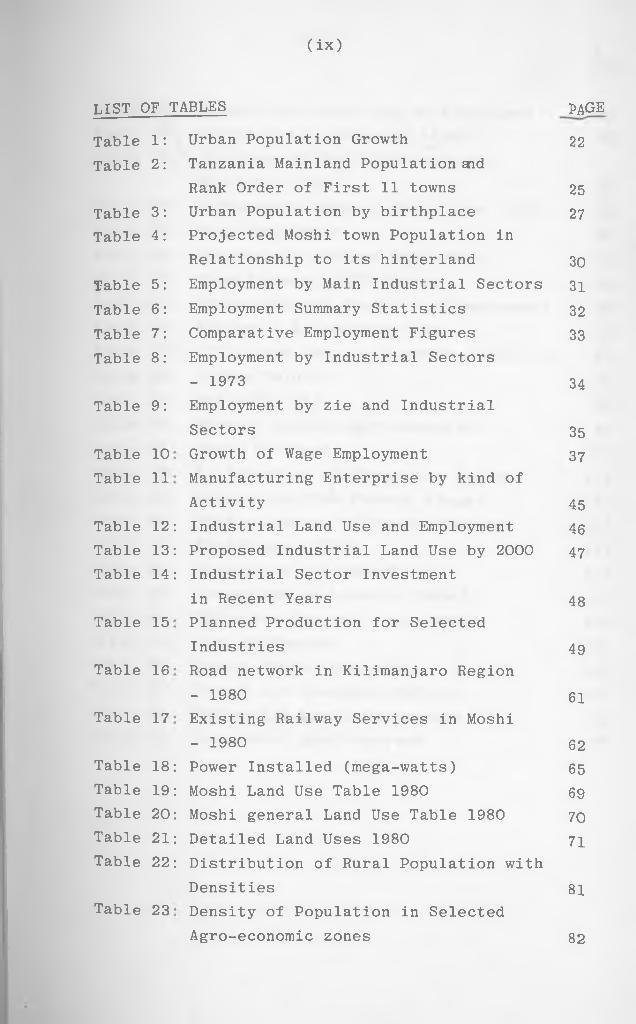
l is t o f t a b l e s page
Table 1: Urban Population Growth 22Table 2: Tanzania Mainland Population aid
Rank Order of First 11 towns 25Table 3: Urban Population by birthplace 27Table 4: Projected Moshi town Population in
Relationship to its hinterland 30Table 5: Employment by Main Industrial Sectors 31Table 6: Employment Summary Statistics 32Table 7: Comparative Employment Figures 33Table 8: Employment by Industrial Sectors
- 1973 34Table 9: Employment by zie and Industrial
Sectors 35Table 10 Growth of Wage Employment 37Table 11 Manufacturing Enterprise by kind of
Activity 45Table 12 Industrial Land Use and Employment 46Table 13 Proposed Industrial Land Use by 2000 47Table 14 Industrial Sector Investment
in Recent Years 48Table 15 Planned Production for Selected
Industries 49Table 16 Road network in Kilimanjaro Region
- 1980 61Table 17 Existing Railway Services in Moshi
- 1980 62Table 18 Power Installed (mega-watts) 65Table 19 Moshi Land Use Table 1980 69Table 20 Moshi general Land Use Table 1980 70Table 21 Detailed Land Uses 1980 71Table 22 Distribution of Rural Population with
Densities 81Table 23 Density of Population in Selected
Agro-economic zones 82
PAGE
8283
8686
878889909394959899
103111112113114114117118119124127175175
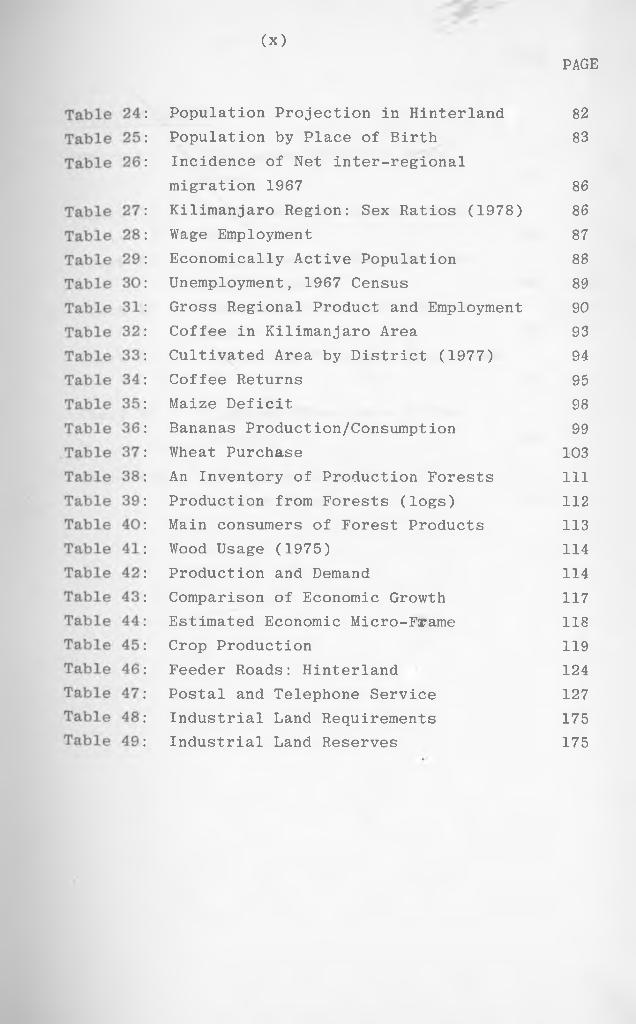
(x)
Population Projection in Hinterland Population by Place of Birth Incidence of Net inter-regional migration 1967Kilimanjaro Region: Sex Ratios (1978) Wage EmploymentEconomically Active Population Unemployment, 1967 Census Gross Regional Product and Employment Coffee in Kilimanjaro Area Cultivated Area by District (1977) Coffee Returns Maize DeficitBananas Production/Consumption Wheat PurchaseAn Inventory of Production Forests Production from Forests (logs)Main consumers of Forest Products Wood Usage (1975)Production and Demand Comparison of Economic Growth Estimated Economic Micro-Frame Crop Production Feeder Roads: Hinterland Postal and Telephone Service Industrial Land Requirements Industrial Land Reserves
(Xi)PAGE
LIST OF CHARTS
Chart I Population Pyramid - Moshi Town 27
Chart II Projected Population - Moshi Town 29
Chart III Diagrammatic Picture of Moshi Bus Transport 58
Chart IV Populations Pyramid - Hinterland 78
Chart V Hinterland Projected Population82
Chart VI Linkage Structure - CoffeeIndustry 138
Chart VII Linkage Structure - Leather Industry 150
1^ v.
PAGE(xii)
LIST OF MAPS
Map No. 1 Moshi: National Context 16Map No. 2 Moshi: Regional Context 16Map No. 3 Town Growth 18Map No. 4 Town Land Use, 1980 21Map . No . 5 Industrial Areas and Transport-
ation 46Map No. 6 Hinterland Physical
Features and Transportation 74Map No. 7 Annual Rainfall 75Map No. 8 General Agro-economic Zones 77Map No. 9 Hinterland Resources 116Map No. 10 Feeder Roads 124Map No. 11 (a) Hinterland Proposals 168Map No. 11 (b) Hinterland Proposals 168Map No. 12 Proposed Industrial Land Use -
174.2000
CHAPTER ONE
1:0:0 INTRODUCTION:
1:1:0 Introduction:
Mothi town is one of the designated growth
centres in Tanzania. The declared policy is that it
is supposed to act as a focal point of development
with associated spread effects to the immediate
hinterland, Kilimanjaro Region, a basically rural
area.Under this policy industries established in the
growth centres must have positive economic effects
upon the surrounding rural- areas by promoting rural
growth, reduce rural-urban inequality generate
employment and in general improve overall standard
of living. Furthermore this policy was also geared
towards the reduction of the gravitational force
that Tanzania's principal urban centre, Dar-es-Salaam,
had as well as helping in dispersing investment
opportunities throughout the country and thereby
creating a more equitable development throughout
the country.1
This study focuses on the relationship
of Moshi's industrial sector with the immediate
Government of Tanzania, Third Five Year Plan 1976/81, p. 43.
2
hinterland in terms of economic linkages. As far as
rural-urban differentials are concerned as well as
the nature of investments in colonial and neo-colonial
type of economies such as Tanzania most industrial
investments are located in urban centres. The
production of raw materials however is carried out
in rural areas (HINTERLAND) while investments are
done in towns (GROWTH CENTRES). In economic terms
there should be growth zones, growth centres, with
powerful agglomerated industries having effective
linkages to the rural areas thereby taking advantage
of agglomeration economies, including backward and2forward linkages.
Moshi’s main industries will be examined:
Moshi Coffee Curing Works, Kibo Match Factory,
Timber Utilization Factory, Tanneries Factory
(hides and skins), Tanzania Bag Manufacturing Factory,
all of these are located within the urban area
mostly in the industrial area. Another agro-based
factory is the sugar factory that is located 20
kilometres away from the town. The linkages that
2. Hansen, N.M., Challenge of Urban Growth, 1975, p. 1.
3
these industries have with the rural hinterland will
be ascertained in terms of raw materials utilization,
employment and incomes, transportation links, resource
exploitation etc.
1:2:0 Identification of the Problem:
In accordance with the policy of Tanzania’s
Ujamaa (Tanzania's socialism) industrial establishments
in growth centres (i.e. urban areas) are supposed to
promote rural development through the trickling down 3effects thereby reducing rural-urban inequality
and divergence. In developed countries (i.e. D.C.’s)
such a policy has been pursued with very encouraging
results; however in developing countries (i.e. L.D.C.’s)
such as Tanzania the establishment of industries in
urban areas (growth centres) has led to the under
development of the hinterland (or development of
underdevelopment) - in other words the urban centres
acting as core areas siphon off more resources than
they can repatriate to the rural areas. This has
caused rural-urban inequalities leading to a gap in
development between the rural areas (HINTERLAND)
Keeble, D., Industrial Location and Planning in U.K. 1976, p. 5.
4
and urban centres (GROWTH CENTRES) in favour of the
latter. This is particularly true of towns/cities
that have developed out of external contradictions
and characterized by an external imposition of an
external economy that affects both the hinterland
and the location of the town. Moshi town and its
immediate hinterland is no exception to this principle.
Moshi town was established to exploit the
potential resources of its rich hinterland not for
the benefit of the latter but for the benefit of
an external economy, the colonial power. Thus Moshi
simply served as a centre in the export enclave,
an area mainly specializing in the growing of coffee
for export. The problem has further been aggravated
because of the fact that the market for coffee is
foreign and not local which is again, a basic feature
of ex-colonial countries. Despite the fact that
Moshi has been a designated growth centre for a
long time^ it has not been, to a significant extent,
able to reduce the rural-urban differentials neither
has the policy led, to an effective industrial
4. Government of Tanzania, op. cit., p. 73.
5
5 ^linkage. Furthermore problems of unemployment,
migration, underdevelopment, inadequate infrastructural
facilities and low incomes have tended to proliferate
rather than being alleviated.
1:3:0 Aims and Objectives of the Study:
Having identified the problems, the study
is therefore aimed at determining the existing
economic linkages in spatial space between Moshi*s
industrial sector and its immediate hinterland. In
general the objective is to appraise the extent in
which Moshi town has effectively served as a growth
centre. The main objective can be summarized as
follows:-
1. To determine the existing linkages between
Moshi*s industrial sector and the
hinterland.
2. To find out the divergences between
the urban centre and the rural areas.
3. To find out what methods and policies that
can be used to reduce the gap in
development in the area under study.
Hirshman, A.O., The Strategy of Economic Development 1958.
6
4. Applicability of the determined methods
in a case study of Moshi Coffee Curing
Works. This is the implementation
phase.
With these objectives at hand it is hoped
that proper and appropriate suggestions and proposals
will be made in trying to promote a balance between
the hinterland’s resource base and the town's
industrial base. This will lead to a stable and a more
balanced growth of the town in relationship to its
hinterland. Implied in these objectives is the
fact that emphasis will be made on the examination
of the functions and growth of Moshi town both as
a growth and service centre; similarly the functions-,
and the resource patentialities of the hinterland
will be analysed.
1:4:0 Assumptions:
In carrying out the study several assumptions
have been taken into consideration as far as the
identified problem is concerned. These are:-
1. It is assumed that there is a gap between
Moshi town and the hinterland in terms
of development.
7
2. It is assumed that, Moshi’s growth and
expansion has been primarily associated
with the resource hinterland.
3. It is assumed that if rural-urban
development gap is to be reduced then
there should be integrated development
of the urban industrial sector and the
resource base of the hinterland.
It is hoped that this study will bring
forth guidelines and proposals to help the government
and other authorities interested in the development
of the people to arrest or to reduce the rural-urban
differentials on the bases of physical, demographic,
economic and particularly industrial location
considerations.
1:5:0 The Study Area:
The study area centres on the industrial
activities of Moshi town and the related various
land uses within the urban growth centre. Furthermore
the economic and social infrastructure of the town
will be considered. This has become significant
because of the necessity to establish a balanced
8
growth of the urban centre through which spread
effects should accrue and reach the surrounding areas
for which it is supposed to serve.
The study discusses, interalia, the
hingerland's economic infrastructure, demographic and
physical aspects. In this view, therefore, the area
under consideration will be Moshi town and its immediate
hinterland which, for the purposes of this work, will
be the areas on the slopes of Mr. Kilimanjaro and the
Pare Hills. Together these areas form one administrative
region known as Kilimanjaro. The Regional Headquarters
is at Moshi town.
The hinterland region produces coffee, sugar,
bananas, maize, wheat, timber, fingermillet, beans,
sisal, hides and skins and cotton. However the
main commercial crop in terms of monetary returns is
by far coffee. Some of these products are used as
inputs raw material inputs for the industries in Moshi town.
The region is polarized around Moshi
urban centre. The area constitutes a suitable
regional entity whose delimitation is based on
several parameters such as population density,
9
distribution pattern and migration characteristics;
physical and ecological factors; ethnic homogeneity
and even cultural values.
That Moshi*s hinterland is more or less,
equivalent to the Kilimanjaro administrative region
is strengthened by the definition of hinterland
itself. The hinterland may be defined as the area of0effective influence of the town. In this particular
assertion Moshi town already constitutes a dominant
core for the whole of Kilimanjaro Region with
commercial connections reaching every part of the
region. A comparatively well-developed road-network
radiating from the town to the various parts of the
region further strengthens the view that the town
is a core area. Hierarchical position of Moshi
as a service centre is about seven times higher
than one of the next biggest service centre in
Kilimanjaro Region.
The region encompasses the areas whose
economic activities such as banks, insurance, storage
6. Bendavid, A., Regional Economic Analyis for Practitioners.

10
depots and wholesale trade among others are directed
towards Moshi rather than towards other central places
of the same order such as Arusha and Tanga. However
the importance of Moshi as the core area from which
development is to spread is a great question mark
and this work hopes to show through the nature and
strength of the identified relationships between the
core and the periphery.
Therefore for the reasons given above the
study area covers the Moshi urban centre and its
hinterland which, in this particular case, is the
Kilimanjaro Region, Moshi town as the core area and the
hinterland as the periphery. Moshi Coffee Curing
Factory was selected as a special case for deep study.
1:6:0 Research Methodology:
In the collection of data necessary for the
study various data gathering tools were employed.
These were the questionnaire, interviews and
secondary sources of data utilising published and
unpublished documents.
The purpose of administering the questionnaire
is to determine income levels of both urban and rural
11
areas, employment characteristics and economic
linkages between Moshi town and the hinterland. The
questionnaire was administered to the workers of
Moshi Coffee Curing Factory and to the farmers
of two divisions namely Kibosho and Uru within
the hinterland using statistical sampling techniques.
government and parastatal institutions to get current
information as.regards production, employment, income,
capacity utilization of the factories, ownership of
establishments as well as industrial inputs. In this
case the following were consulted:-
(a) Regional Agricultural Officer
(b) Regional and District Trade Officers
(c) Regional Town Planner
(d) Office of the Prime Minister
(i) Regional Development Director's
Office.
(ii) Officer in charge of Nationalised
Interviews were carried out with various
Coffee Estates in Kilimanjaro
Region.
12
(e) Bureau of Statistics
(f) Kilimanjaro Uremi Ltd. (successors to
the dissolved Kilimanjaro Co-operative
Union).
(g) Tanzania Coffee Authority Headquarters
at Moshi.
(h) Moshi Town Council
(i) Offices of the following factories:-
Moshi Coffee Curing Works, Tanzania
Tanneries Ltd., Kibo Match Corporation,
Bag Corporation Ltd., Tanganyika
Planting Company (sugar refinery) and
Brewery Battling Plant.
These factories were selected because they are the
biggest in Moshi in terms of employment and output.
The interviews were carried out extensively in the
urban area. However it was not possible to visit
every division in the hinterland due to its large
size; therefore only two divisions were selected for
personal interviews, while the coffee estates
located in these divisions were visited for the purpose
°f finding out production level, employment, income
and transportion links to the town.
13
For other information published and unpublished
documents were consulted to provide background knowledge
on the role of an industrial town, growth centre
concept, the idea of core and periphery as well as
relevant information that could not be found from the
field research.
The analysis of Moshi town will be centred
upon the population in terms of composition, sex ratio,
growth rates, population projections for 1980, 1990
and 2000, employment projections for similar periods
and number of households. In relation to this
industrial location will be considered and other
aspects of the economic base such commercial activities,
infrastructural facilities and the various land uses.
The analysis of an urban area is never complete unless
the physical characteristics are given due emphasis.
Examination of the existing space standards will be
made with a view of giving recommendations for the
projected land uses. Finally the relationships that
the industrial sector has with the immediate
hinterland will be identified.
As far as the hinterland is concerned the
following important aspects will be considered:
The physiographic characteristics such as topography,
orography, soils and hydrology will be analysed- other
14
factors include the resource base, population
characteristics, employment trends, infrastructure
and the main economic linkages that the hinterland
has with the town. Such linkages are: forward and backward
production linkages, distribution linkages. Commercial
and service linkages data analysis techniques particularly
location quotient (L.Q.) and correlation coefficient
will be employed.
The following maps are essential for the
study: location maps, existing and potential land
use maps for both the urban and the interland areas;
and a map showing industrial activities and their
relationships to the hinterland.
The digested findings of this works will be
applied in a case study of Moshi Coffee Curing Factory
which is one of the largest factories in Moshi.
The aim here is to see how far the recommendations are
applicable in a real situation exercise.
1:?:0 Scope and Limitation:
As discussed earlier the main focus of
my study is to relate Moshi's industrial sector to the
immediate hinterland. The idea is to analyse Moshi's
industrial sector with respect to industrial production,
1Ze and number of industrial establishements as well as
15
the town's population trends and other iran-d- related
land uses. Definitely industrial land use will be
given prominence. Furthermore, the emphasis will
be directed towards the analysis of the hinterland
in terms of resources, population and employment and
infrastructure.
In the urban area of Moshi only the main
industries will be considered since field survey for
every industrial establishment could not be carried
out due to time and financial constraints. In the
rural area (hinterland) only several divisions
(Uru and Kibosho) were visited. Another serious
limitation for the study was the fact that some
officials consulted simply refused to co-operate;
or where they marginally co-operated the data given
was not reliable.
CHAPTER TWO
2.O.O. ANALYSIS OF MOSHI TOWN
2.1.0 Historical Background of Moshi
The tribe that is within the vicinity of
Moshi town area is the Chagga who have inhabited
the western, southern and eastern Kilimanjaro
mountain region for more than five hundred years.
By 19th century, this area was ruled by many sovereign
and independent Chagga Chiefs. One of the chiefdoms
was known as Moshi which was founded by the then
famous Chief Mandara’s grandfather.
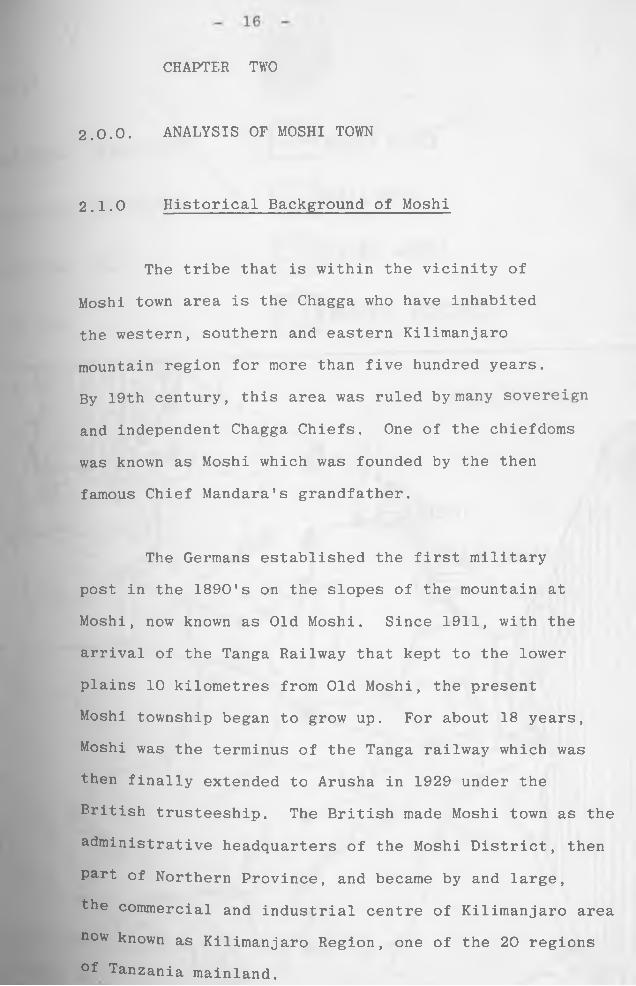
The Germans established the first military
post in the 1890's on the slopes of the mountain at
Moshi, now known as Old Moshi. Since 1911, with the
arrival of the Tanga Railway that kept to the lower
plains 10 kilometres from Old Moshi, the present
Moshi township began to grow up. For about 18 years,
Moshi was the terminus of the Tanga railway which was
then finally extended to Arusha in 1929 under the
British trusteeship. The British made Moshi town as the
administrative headquarters of the Moshi District, then
part of Northern Province, and became by and large,
the commercial and industrial centre of Kilimanjaro area
now known as Kilimanjaro Region, one of the 20 regions °f Tanzania mainland.
NATIONAL SETTING
£GE n d
^ national boundary
H regional boundary
regional hqts
<§ CAPITAL
MAIN road
. +++- RAI LWAY
STUDY AREA
WATER BODIES
17
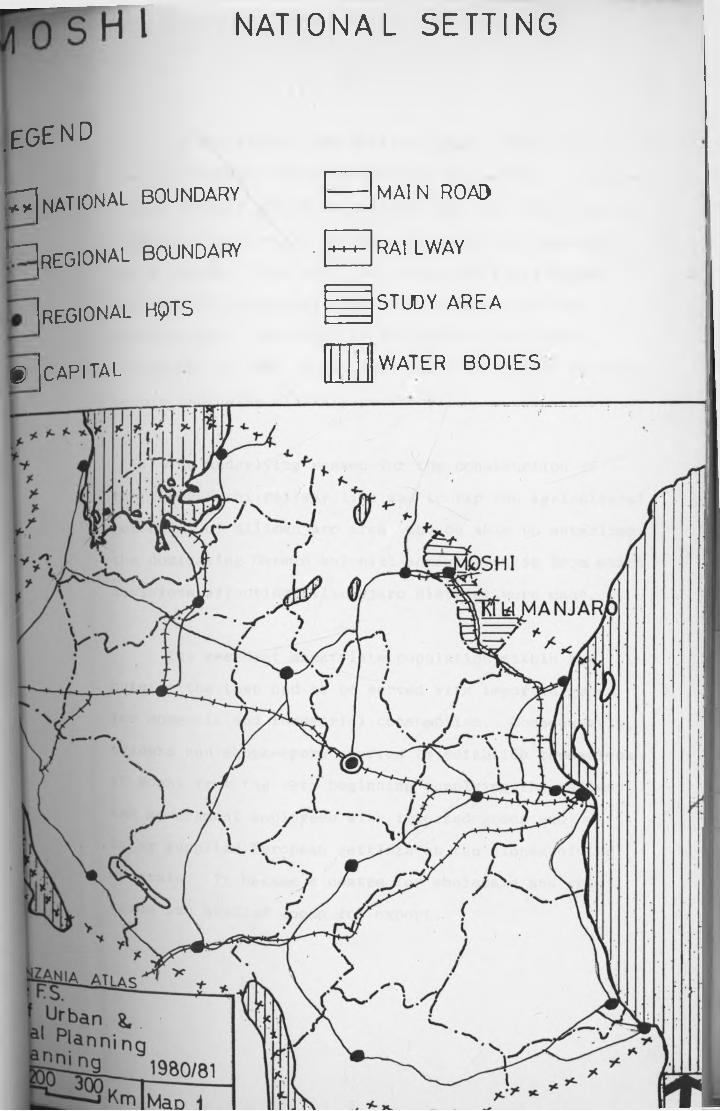
In the 1930's, the British layout plans outlined the
to-day’s landuse charateristics of Moshi town. There was
a high density grid-iron pattern area for native people,
a commercial area for Asians, (particularly Indians)
and a dominant boma area, with military barracks,and
low density residential area for Europeans in its
surroundings. Estimated on the basis of an aerial
photograph in 1937, Moshi town had a population of 1000
people excluding military personnel.
The underlying reason for the construction of
the Tanga-Moshi railway line was to tap the agricultural
potential of Kilimanjaro area and be able to establish
the dominating German colonial administration from which
decisions affecting Kilimanjaro district were made.
The resident expatriate population within and
outside the town had to be served with imported goods
for domestic and industrial consumption. Consequently,
traders and shopkeepers started to establish themselves
at Moshi from the very beginning supplying the railway
and government employees with imported goods and
later supplied European settlers on the slopes of the
mountain. It became a centre for wholesale and retail
trade and handled goods for export.
18
Later, numerous small-scale industries sprang
up within the township. These were repair workshops^
garages, bakeries, flour milling, laundries and
beverage bottling to serve the resident population
and the people living in the hinterland. Most of these
small industrial establishments were located in the
town centre and owned by Asians.
After independence, Kilimanjaro Region was
carved out of the giant Northern Province and the
headquarters of the new region became Moshi, streng
thening further its importance as an administrative,
commercial,industrial and social centre for the region.
In pursuance of this view several national industries
were established in the late 1960's and early 1970's
- backed by strong public investment policy. With
increased provision of infrastructure facilities and
services over the years, the town has become an
attractive centre to which people from all parts of
the region converge for a variety of reasons, such as
recreation, business, education and health.
In summary, since the early part of this century,
Moshi town has progressively grown from a German military
and administrative post and a railway station to a
modern commercial, industrial and administrative centre for Kilimanjaro Region.
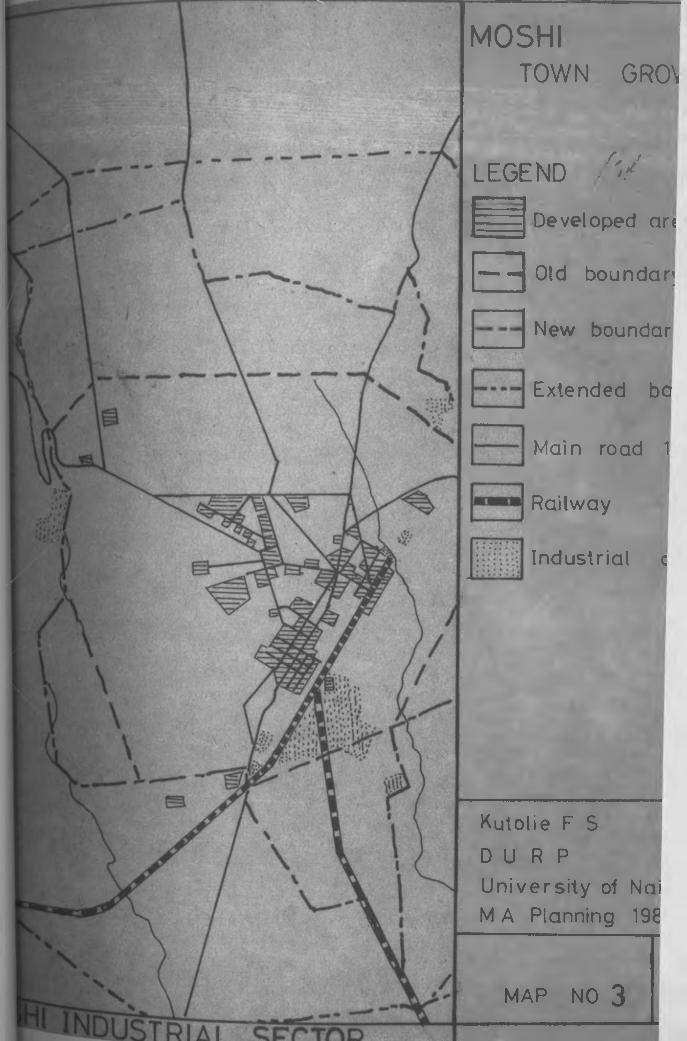
MOSHITO W N GRO\
LE G EN D -'VDeveloped ar<
— —i Old boundar;
New boundar
Extended
Main road
Railway
Industrial
bo
1
c
Kutolie F S D U R PU n ive rs ity ot Nai M A Planning 198
MAP NO 3
19
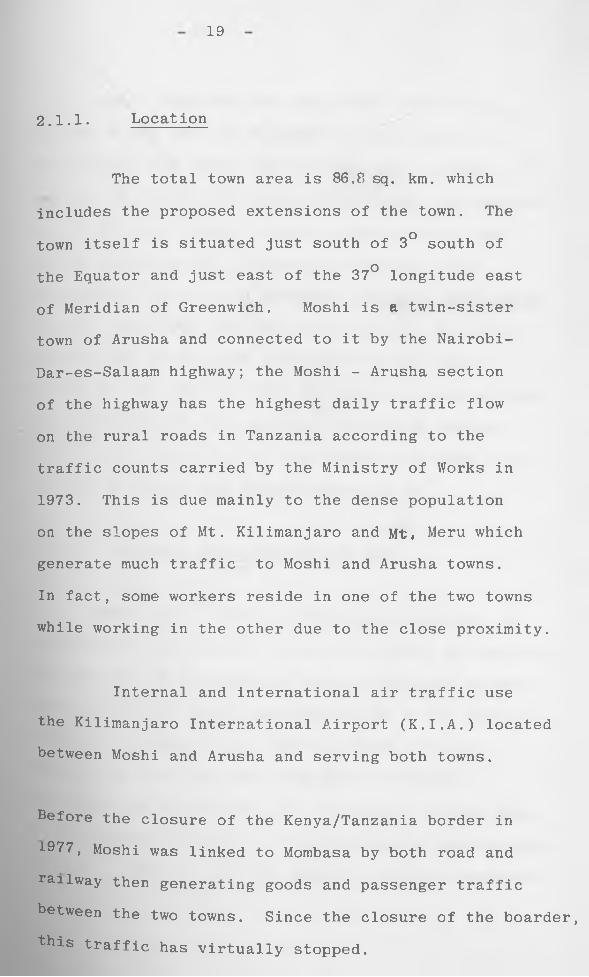
2.1.1. Location
The total town area is 86,8 sq. km. which
includes the proposed extensions of the town. The
town itself is situated just south of 3° south of
the Equator and just east of the 37° longitude east
of Meridian of Greenwich. Moshi is a twin-sister
town of Arusha and connected to it by the Nairobi-
Dar-es-Salaam highway; the Moshi - Arusha section
of the highway has the highest daily traffic flow
on the rural roads in Tanzania according to the
traffic counts carried by the Ministry of Works in
1973. This is due mainly to the dense population
on the slopes of Mt. Kilimanjaro and Mt, Meru which
generate much traffic to Moshi and Arusha towns.
In fact, some workers reside in one of the two towns
while working in the other due to the close proximity.
Internal and international air traffic use
the Kilimanjaro International Airport (K.I.A.) located
between Moshi and Arusha and serving both towns.
Before the closure of the Kenya/Tanzania border in
1977, Moshi was linked to Mombasa by both road and
railway then generating goods and passenger traffic
between the two towns. Since the closure of the boarder,
this traffic has virtually stopped.
2 0
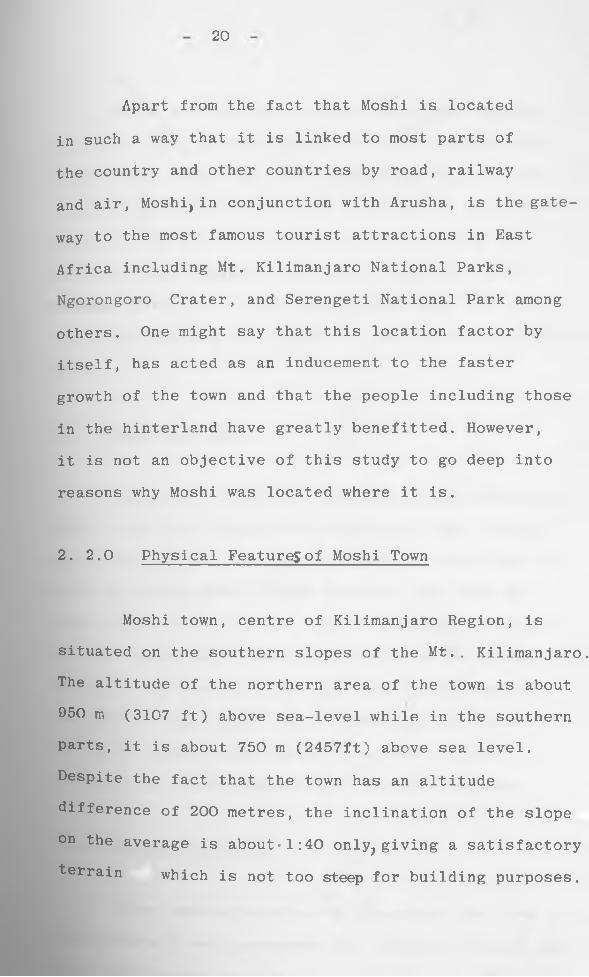
Apart from the fact that Moshi is located
in such a way that it is linked to most parts of
the country and other countries by road, railway
and air, Moshi) in conjunction with Arusha, is the gate
way to the most famous tourist attractions in East
Africa including Mt. Kilimanjaro National Parks,
Ngorongoro Crater, and Serengeti National Park among
others. One might say that this location factor by
itself, has acted as an inducement to the faster
growth of the town and that the people including those
in the hinterland have greatly benefitted. However,
it is not an objective of this study to go deep into
reasons why Moshi was located where it is.
2. 2.0 Physical Features of Moshi Town
Moshi town, centre of Kilimanjaro Region, is
situated on the southern slopes of the Mt.. Kilimanjaro.
The altitude of the northern area of the town is about
950 m (3107 ft) above sea-level while in the southern
parts, it is about 750 m (2457ft) above sea level.
Despite the fact that the town has an altitude
difference of 200 metres, the inclination of the slope
on the average is about-1:40 only?giving a satisfactory
terrain which is not too steep for building purposes.
2 1
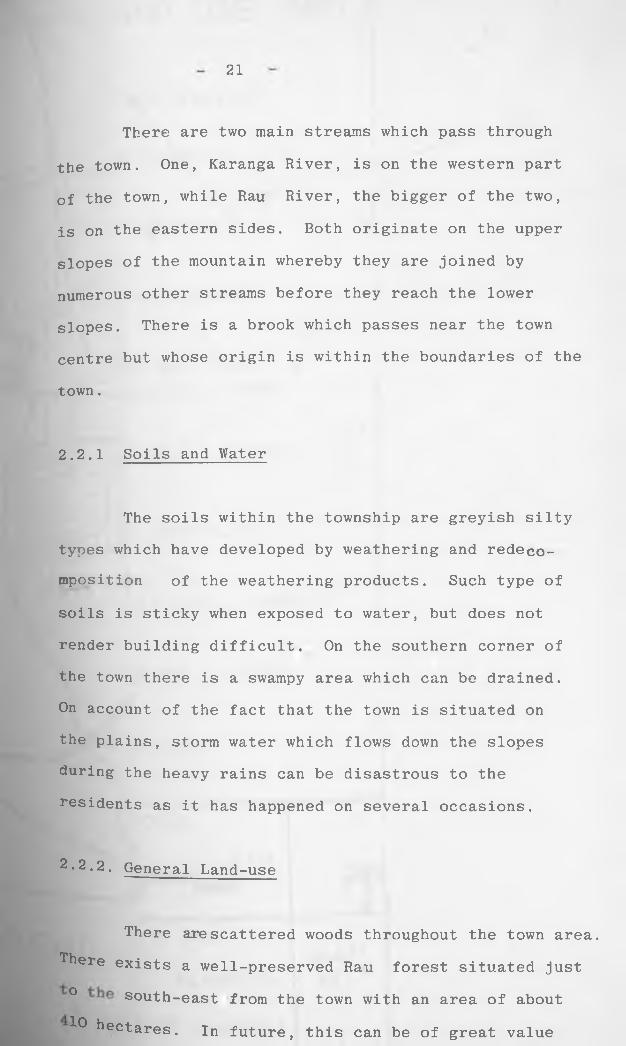
There are two main streams which pass through
the town. One, Karanga River, is on the western part
of the town, while Rau River, the bigger of the two,
is on the eastern sides. Both originate on the upper
slopes of the mountain whereby they are joined by
numerous other streams before they reach the lower
slopes. There is a brook which passes near the town
centre but whose origin is within the boundaries of the
town.
2.2.1 Soils and Water
The soils within the township are greyish silty
types which have developed by weathering and redecomposition of the weathering products. Such type of
soils is sticky when exposed to water, but does not
render building difficult. On the southern corner of
the town there is a swampy area which can be drained.
On account of the fact that the town is situated on
the plains, storm water which flows down the slopes
during the heavy rains can be disastrous to the
residents as it has happened on several occasions.
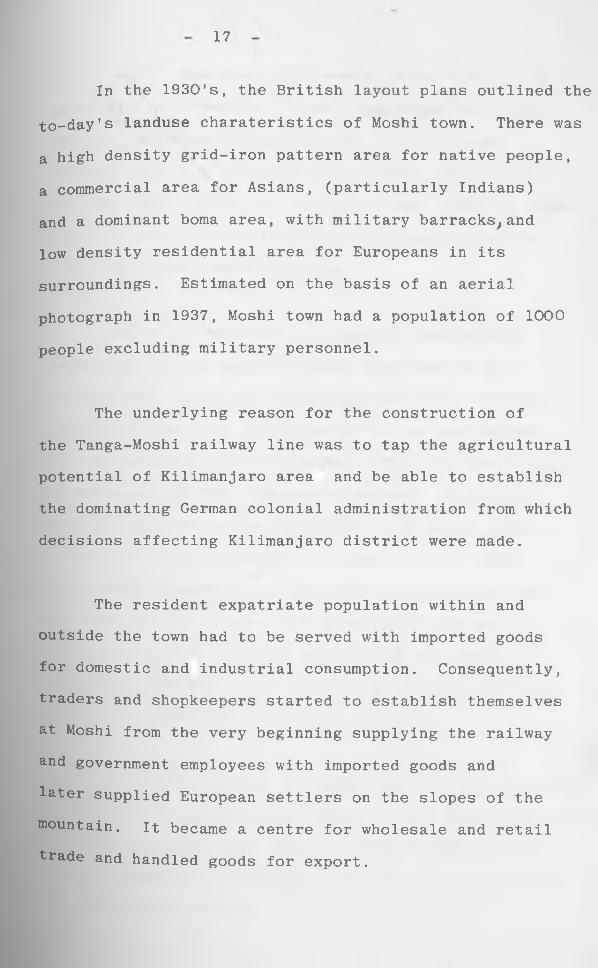
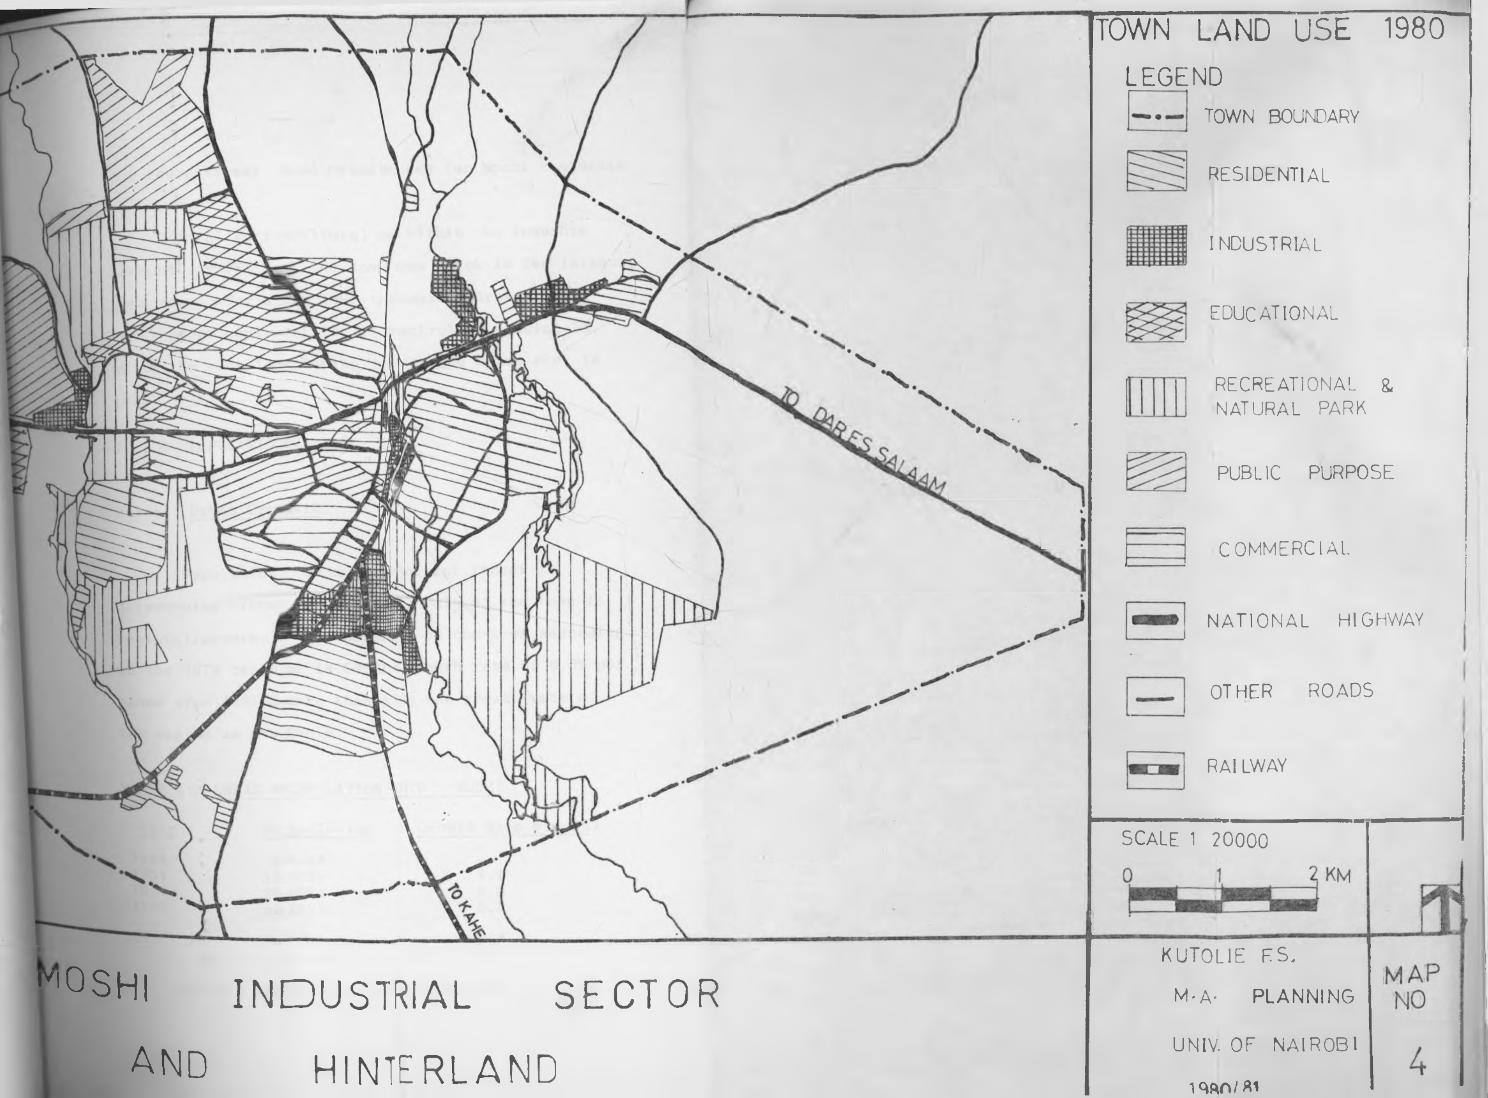
2*2.2. General Land-use
There are scattered woods throughout the town area.
There exists a well-preserved Rau forest situated just
° south-east from the town with an area of about
TO hectares. In future, this can be of great value
r°SHl INDUSTRIAL SECTORand HINTERLAND
TOWN LAND USE 1980L E G E N D
TOWN BOUNDARY
RESIDENTIAL
INDUSTRIAL
EDUCATIONAL
RECREATIONAL & NATURAL PARK
PUBLIC PURPOSE
COMMERCIAL
NATIONAL HIGHWAY
OTHER ROADS
RAI LWAY
SCALE 1 20000
KUTOL1E FS,
M-A- PLANNING
UNIV. OF NAIROBI
1 w»/ai
2 2
for recreational and other purposes for Moshi residents.
Total agricultural areas within the township
account for 68% of the town's area which is the largest
proportion for any town in Tanzania. Area under/
development control is 17%, uncontrolled housing 1%,
while the rest including forests, open space etc. is
14%.
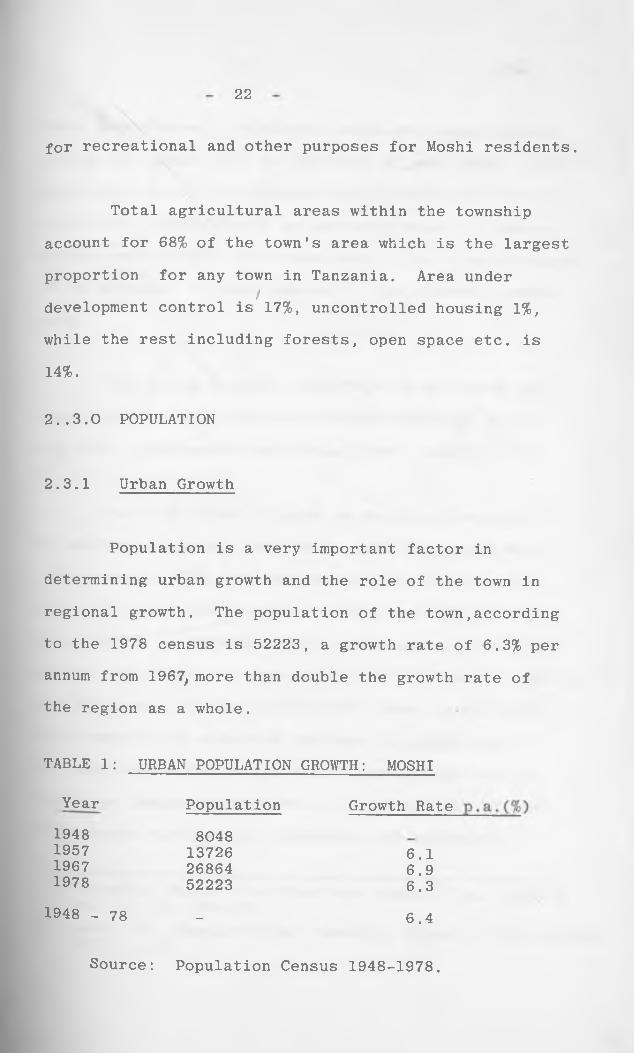
2..3.0 POPULATION
2.3.1 Urban Growth
Population is a very important factor in
determining urban growth and the role of the town in
regional growth. The population of the town,according
to the 1978 census is 52223, a growth rate of 6.3% per
annum from 1967, more than double the growth rate of
the region as a whole.
TABLE 1: URBAN POPULATION GROWTH: MOSHI
Year Population Growth Rate1948 80481957 13726 6.11967 26864 6.91978 52223 6.3
1948 - 78 _ 6.4
Source: Population Census 1948-1978.
23
Moshi experiences a relatively rapid population growth
during the period 1957 to 1967 at 6.9% per annum. This
was mainly due to the greater concentration of economic
activities, particularly in the early years of indepe
ndence and the fact that there were no more restrictions
as to movement to towns imposed by the colonial govern
ment .
The growth rate for 1967/78,6.3% per annum was
less than that experienced in 1957/67 although Moshi1 2was then a designated industrial growth centre. *
The rank order of towns in Mainland Tanzania
is another parameter that can be used to measure Moshi
urban growth. The town has changed its position in
terms of population from 8th in 1948 and 1957, 5th in
1967 and 9th in 1978 while Dar es Salaam has always re
mained the first. At the national level, Moshi's position
has declined. Looking at the 1978 census, most towns
have experienced a massive increase in population.
The main reason for such a rapid increase was due to
the large immigrants to towns as a consequence of the
nation-wide ruralisation programme that affected
Tanzania, Second Five Year Development Plan, 1969/74 Vo1- I, pp. 180-181.Egero, B., Population of Tanzania, Bureau of Statistics 1973, p. 81
2
most of the rural population; however, Moshi's
hinterland was only slightly affected in the sense
that there was no significant movement of people
from the traditional villages to the Ujamaa villages.
Rank order of the first 11 Tanzanian towns can be
seen in Table 2 for comparative purposes.
Although the rank of the towns depends on
the size of the town and the rate of growth,in most
cases, the increase in the population of the towns
has been more due to the rate of growth than the3extension of town boundaries. Furthermore, the
rate of growth is due to the natural increase and
an influx of immigrants.
2.3.2 Inmigration and the growth of Moshi Town
On the basis of 1967 population data, the
growth of the population of Moshi town has largely
been due to inmigration.3 4 Of the total urban
population, approximately one third are born in Moshi
3 - Egero, B., Ibid, p. 814 - Tanzania, 1967 Population Census Vol. 2, Bureau of
Statistics, p. 28
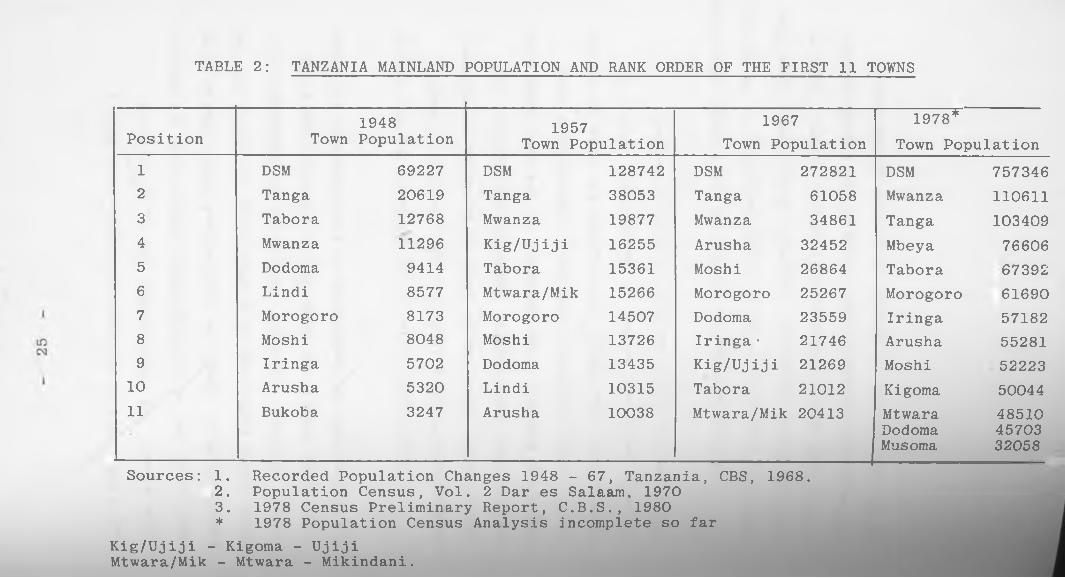
TABLE 2: TANZANIA MAINLAND POPULATION AND RANK ORDER OF THE FIRST 11 TOWNS
Position Town1948Population 1957
Town Population1967
Town Population1978*
Town Population1 DSM 69227 DSM 128742 DSM 272821 DSM 7573462 Tanga 20619 Tanga 38053 Tanga 61058 Mwanza 1106113 Tabora 12768 Mwanza 19877 Mwanza 34861 Tanga 1034094 Mwanza 11296 Kig/Ujiji 16255 Arusha 32452 Mbeya 766065 Dodoma 9414 Tabora 15361 Moshi 26864 Tabora 673926 Lindi 8577 Mtwara/Mik 15266 Morogoro 25267 Morogoro 616907 Morogoro 8173 Morogoro 14507 Dodoma 23559 Iringa 571828 Moshi 8048 Moshi 13726 Iringa • 21746 Arusha 552819 Iringa 5702 Dodoma 13435 Kig/Ujiji 21269 Moshi 52223
10 Arusha 5320 Lindi 10315 Tabora 21012 Kigoma 5004411 Bukoba 3247 Arusha 10038 Mtwara/Mik 20413 Mtwara
DodomaMusoma
485104570332058
Sources: 1. Recorded Population Changes 1948 - 67, Tanzania, CBS, 1968.2. Population Census, Vol. 2 Dar es Salaam, 19703. 1978 Census Preliminary Report, C.B.S., 1980* 1978 Population Census Analysis incomplete so far
Kig/Ujiji - Kigoma - Ujiji Mtwara/Mik - Mtwara - Mikindani.
26
town (30%), 31% in Kilimanjaro Region and 39% in
other areas. In other words, two main types of
immigrants can be distinguished: those from Kilimanjaro
Region in which Moshi is located and those coming from
other areas resulting in a proportion in favour of the
former category. However, the ratio of immigrants to
those born within the town is 7:3 (70:30) signifying
the importance of immigrants to the growth of the town.
Significant role of the distance factor can be
highlighted when we look into the sources of migrant
recruitment. This can be done by grouping recruitment
regions into same Region, Neighbouring Regions and
Remaining Regions. The movement to the town from each
of the above categories declines respectively thus
showing that the region surrounding the town is by far
the most important source of immigrants. Table 3
shows how the above analysis has been derived.
Kilimanjaro Region is one of the regions identified
with many migrants to urban areas amounting to 7% of the
national urban migrants. However, Moshi town, according
to the 1967 data, retained only 30% of these! Most of
Kilimanjaro’s migrants went outside the region mainly
to Arusha and Dar es Salaam in search of employment
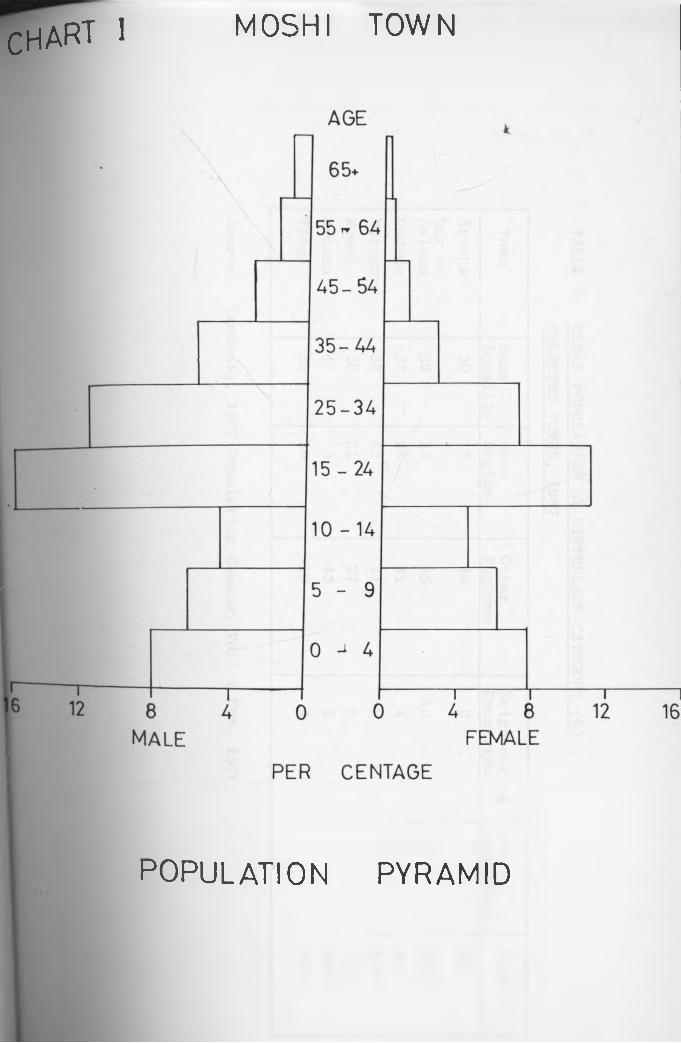
chart 1 MOSHI TOWN
POPULATION PYRAMID
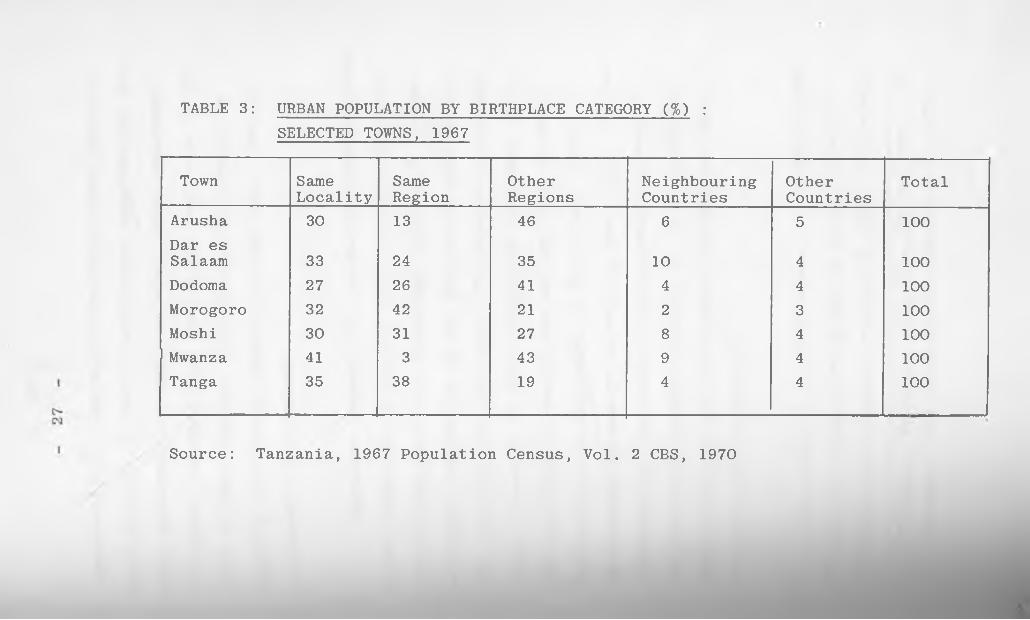
TABLE 3: URBAN POPULATION BY BIRTHPLACE CATEGORY (%) :SELECTED TOWNS, 1967
Town SameLocality
SameRegion
OtherRegions
NeighbouringCountries
OtherCountries
Total
Arusha 30 13 46 6 5 100Dar es Salaam 33 24 35 10 4 100Dodoma 27 26 41 4 4 100Morogoro 32 42 21 2 3 100Moshi 30 31 27 8 4 100Mwanza 41 3 43 9 4 100Tanga 35 38 19 4 4 100
Source: Tanzania, 1967 Population Census, Vol. 2 CBS, 1970
28
opportunities . One major conclusion arises from the
above analysis in that in areas where opportunities for
rural employment are small and where urban employment
is limited, migrants from that region tend to go to the
towns of other regions. This brings out clearly the
negative relationship existing between Moshi town and
its immediate hinterland.
Migration, essentially, is spatial redistribution
of the population in a given area. In connection with
this process,there is a consequent structural change
as regards sex and age in the residential population of
the receiving area, the town. The population movement
largely consists of labour migration and tends to be
very selective as regards sex and age which is well
evidenced in the population of Moshi town. Here, it
is dominated by men in the working age. Also, of equal
importance, is the excess of young adults as seen in
the Population Pyramid Chart No. 3. This is further
amplified by the fact that Moshi's present sex ratio is
128 males per 100 females .
According to the 1978 census, there were 13,336
households in Moshi town giving an average size of a
household as 3.9 people whereas in 1967, the average 5
5 ~ Tanzania, Third Five Year Plan,1976/81,1976 p. 40 Tanzania, 1978, Preliminary Census Report, 1980.
29
was 3.8 showing that there has been some change as
regards the household size. However, the signifi
cance of household size factor can be seen when we
correlate the urban household size to the rural house
hold size. This will be done in the section
attributed to hinterland analysis.
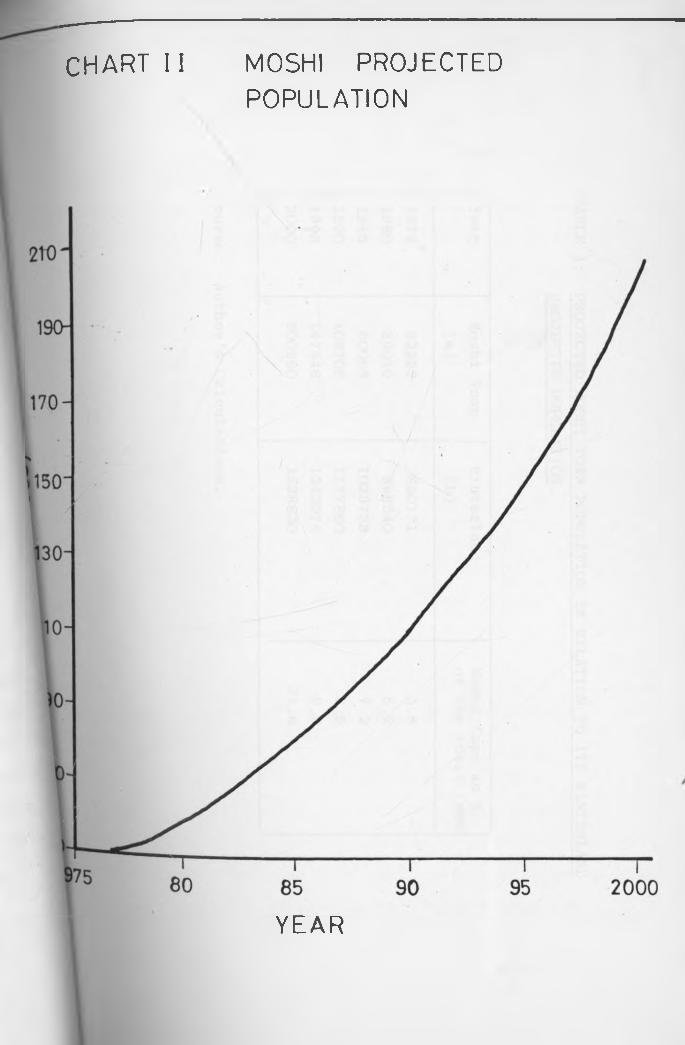
2.3.3 Population Projections for Moshi Town;
Population projection is a very important
indicator for future planning purposes. Projected
population gives us the size of population at a predetermined
time period; on the basis of this estimated population we are able to predict within reasonable accuracy the essential require
ments of that population in terms of employment, and
the various land requirements for housing, commerce,
public utilities,recreation, industry, transportation
and community facilities. In projecting the population
growth, I have assumed that the future growth of Moshi
town is closely related to its past growth and as such I have used the growth rate of 6.3% per annum to
project Moshi*s population up to the year 2000.Table V (Chart II) shows that at the turn of the century the town’s population will exceed 200,000 people.
C H A R T I I M O S H I P R O JE C T E D
P O P U L A T IO N
Y E A R
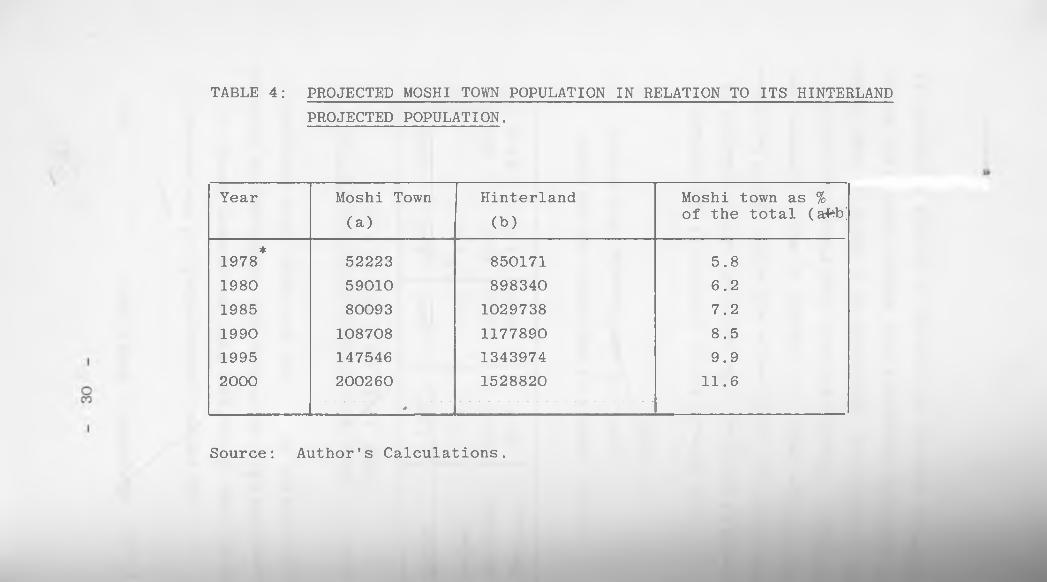
TABLE 4: PROJECTED MOSHI TOWN POPULATION IN RELATION TO ITS HINTERLANDPROJECTED POPULATION.
Year Moshi Town (a)
Hinterland(b)
Moshi town as % of the total (afeb]
1978* 52223 850171 5.81980 59010 898340 6.21985 80093 1029738 7.21990 108708 1177890 8.51995 147546 1343974 9.92000 200260 1528820 11.6
-
Source: Author's Calculations.
31
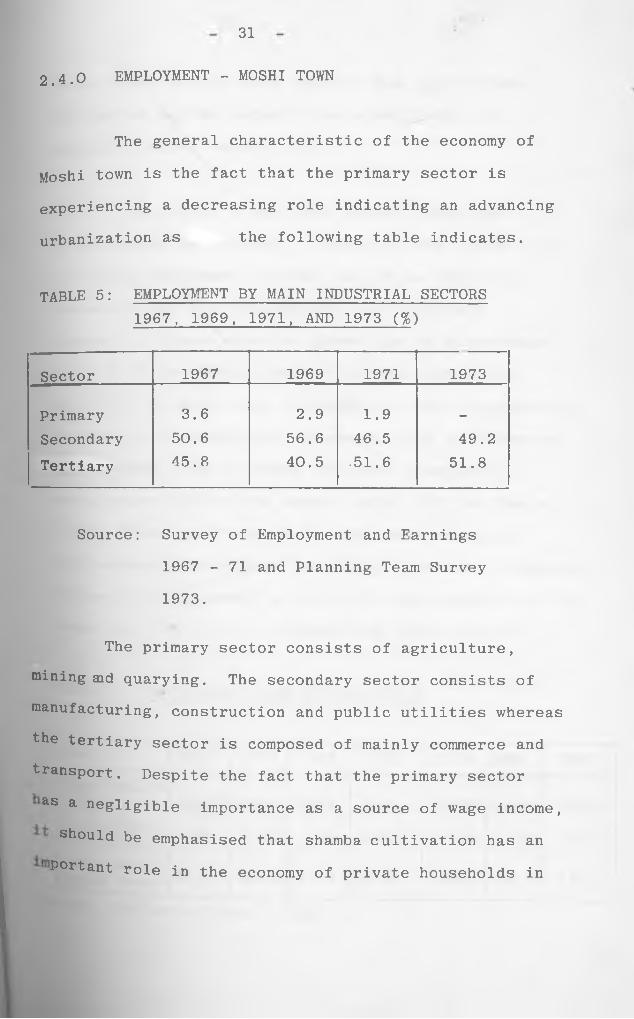
2.4.0 EMPLOYMENT - MOSHI TOWN
The general characteristic of the economy of
Moshi town is the fact that the primary sector is
experiencing a decreasing role indicating an advancing
urbanization as the following table indicates.
TABLE 5: EMPLOYMENT BY MAIN INDUSTRIAL SECTORS1967, 1969, 1971, AND 1973 (%)
Sector 1967 1969 1971 1973
Primary 3.6 2.9 1.9 —
Secondary 50.6 56.6 46.5 49.2Tertiary 45.8 40.5 .51.6 51.8
Source: Survey of Employment and Earnings
1967 - 71 and Planning Team Survey
1973.
The primary sector consists of agriculture,
mining aid quarying. The secondary sector consists of
manufacturing, construction and public utilities whereas
the tertiary sector is composed of mainly commerce and
transport. Despite the fact that the primary sector
as a negligible importance as a source of wage income,
should be emphasised that shamba cultivation has an
Portant role in the economy of private households in
32
Moshi urban and is under smallholding agriculture.
The latter may be looked at as a useful way of
employing urban reserve land.
According to the 1967 census, there were
7730 households in Moshi. Comparing this figure with
the total employment of 7454, we get an employee/
household ratio of one employee per household.
However, a closer scrutiny gives rise to observation
that 20.6% (or 1750 males) of the male population
aged 15 - 44 years were classified as "not economically
active", i.e. unemployed, students, sick or otherwise
not working! Out of those, 800 were unemployed,
which means 9.3% of the labour force. Of the female
labour force aged between 15 - 44 years were also
“not economically active" and 340 cf them were unemployed.
Altogether, the number of employed aged between 15 - 44
years was 7.8% of the corresponding labour force.
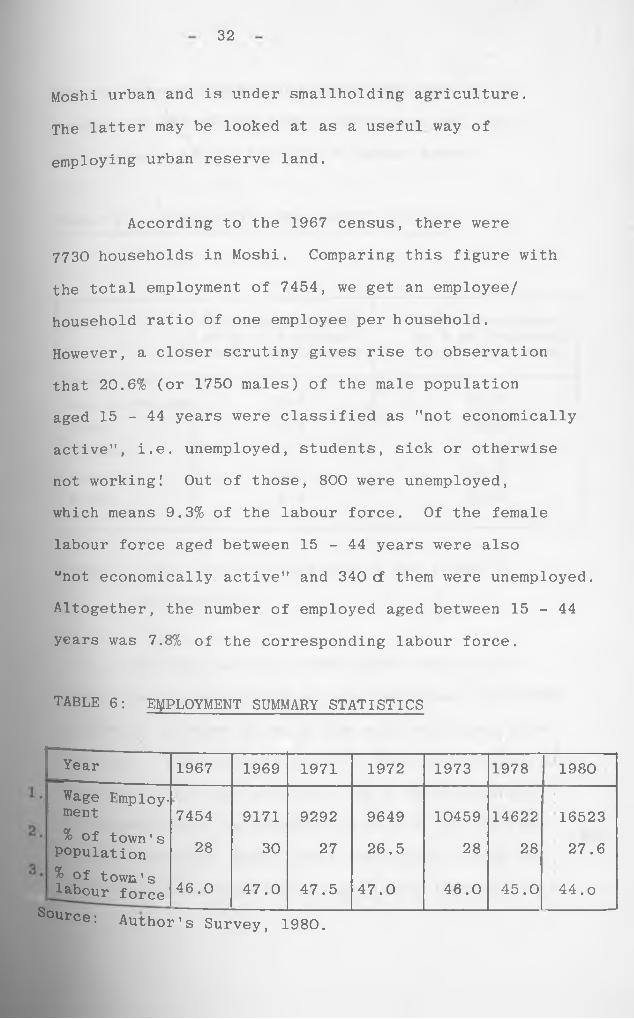
TABLE 6: EMPLOYMENT SUMMARY STATISTICS
Year 1967 1969 1971 1972 1973 1978 1980Wage Employment 7454 9171 9292 9649 10459 14622
t
16523% of town's Population 28 30 27 26.5 28 28 27.6% °f town's labour force 46.0 47.0 47.5 47.0 46.0 45.0 44. o
Source: Author’s Survey, 1980.
33
The employment figures for Moshi town give an
average of 28% of the town’s population and, on
the average, 46% of the town's labour force.
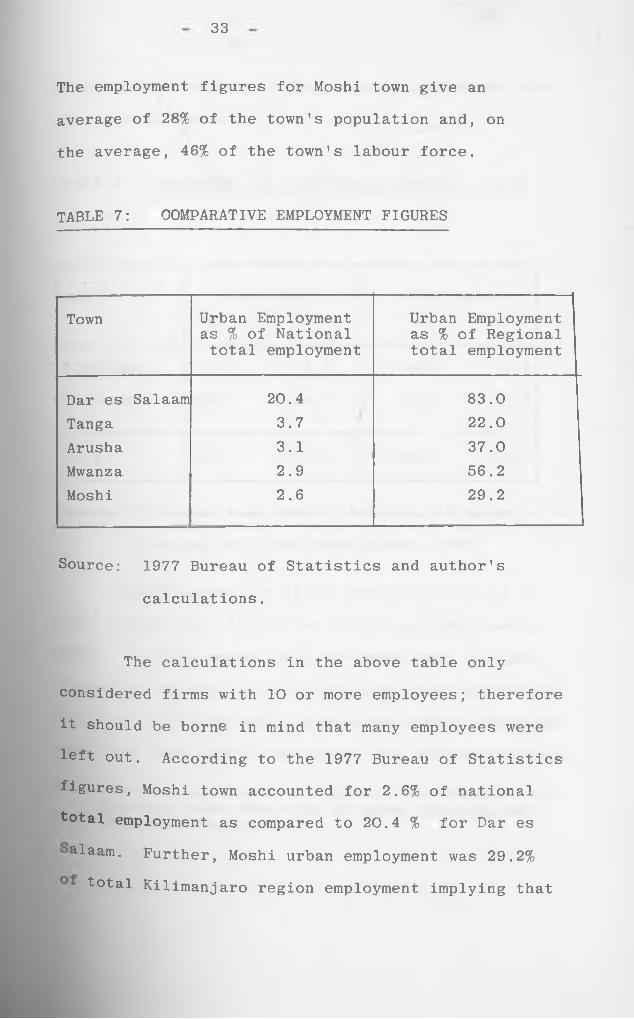
TABLE 7: COMPARATIVE EMPLOYMENT FIGURES
Town Urban Employment as % of National total employment
Urban Employment as % of Regional total employment
Dar es Salaam 20.4 83.0Tanga 3.7 22.0Arusha 3.1 37.0Mwanza 2.9 56.2Moshi 2.6 29.2
Source: 1977 Bureau of Statistics and author’s
calculations.
The calculations in the above table only
considered firms with 10 or more employees; therefore
it should be borne in mind that many employees were
left out. According to the 1977 Bureau of Statistics
figures, Moshi town accounted for 2.6% of national
total employment as compared to 20.4 % for Bar es
alaam. Further, Moshi urban employment was 29.2%
total Kilimanjaro region employment implying that
34
more than two thirds of the region's employment were
in the rural areas.
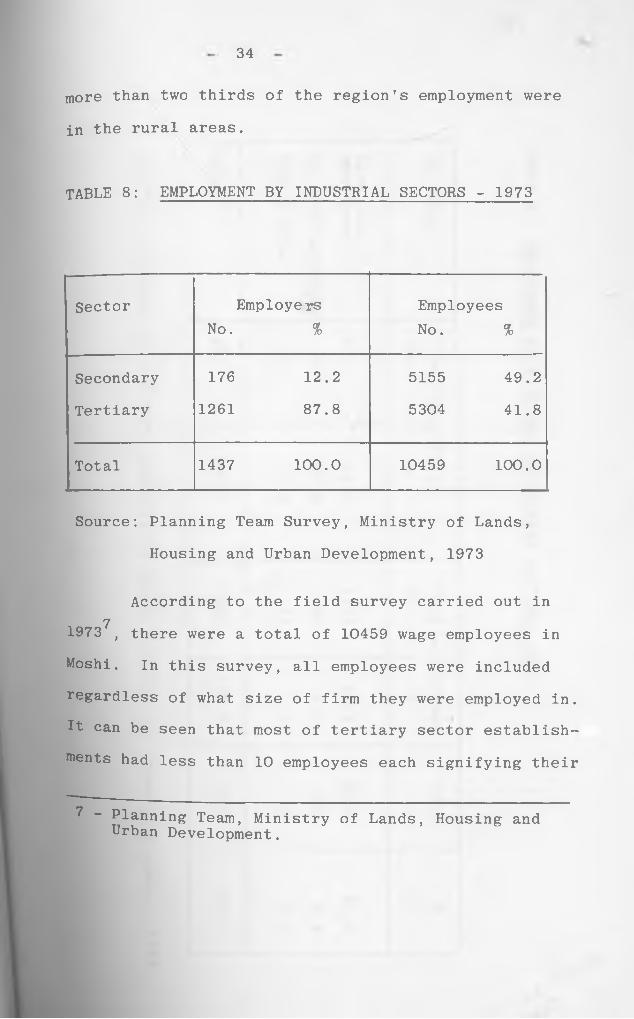
TABLE 8: EMPLOYMENT BY INDUSTRIAL SECTORS - 1973
SectorNo.
Employers%
Employees No. %
Secondary 176 12.2 5155 49.2
Tertiary 1261 87.8 5304 41.8
Total 1437 100.0 10459 100.0
Source: Planning Team Survey, Ministry of Lands,
Housing and Urban Development, 1973
According to the field survey carried out in7
1973 , there were a total of 10459 wage employees in
Moshi. In this survey, all employees were included
regardless of what size of firm they were employed in.
It can be seen that most of tertiary sector establish
ments had less than 10 employees each signifying their 7
7 - Planning Team, Ministry of Lands, Housing and Urban Development.
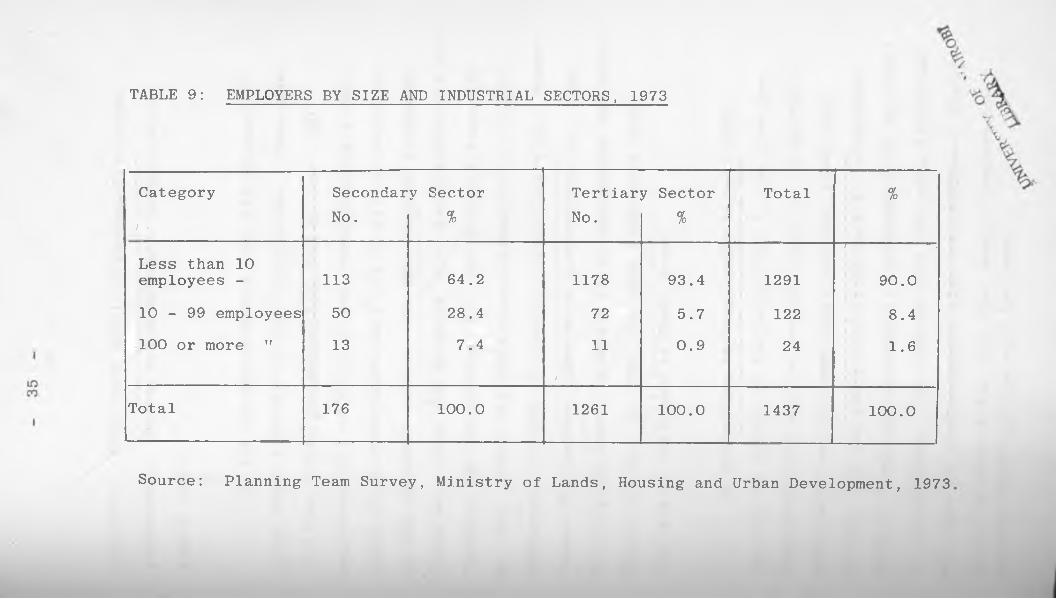
TABLE 9: EMPLOYERS BY SIZE AND INDUSTRIAL SECTORS, 1973
Category Secondary Sector Tertiary Sector Total %/ •
No. % No. %
Less than 10 employees - 113 64.2 1178 93.4 1291
-i--------------------------- 3
90.0
10 - 99 employees 50 28.4 72 5.7 122 8.4100 or more " 13 7.4 11
/
0.9 24 1.6
Total 176 100.0 1261 100.0 1437 100.0
Source: Planning Team Survey, Ministry of Lands, Housing and Urban Development, 1973
36
smallness. There were small businesses like shops,
restaurants, lodging and handicrafts largely on a
family basis.
In the secondary sector, the significance of
large establishments is more conspicuous. There were
13 firms within the sector that had at least 100
employees, out of which 10 were manufacturing firms;
these firms contributed to 75.2% of all the employees
in the secondary sector. The main capital investment
plans were three NDC projects: E.A. Kenaf Industries Ltd
Tanzania Bag Corporation Ltd., and Tanzania Tanneries
Co. Ltd. Other big public establishments and large
employers included Tanganyika Coffee Curing Co., Forest
Timber Utilization, Kibo Match Corporation Ltd., Beer
Bottling and Depot, Mosquito Coils Manufacture and Moshi
Textile Mills. By 1980, the same firms were still
the largest employers in Moshi town.
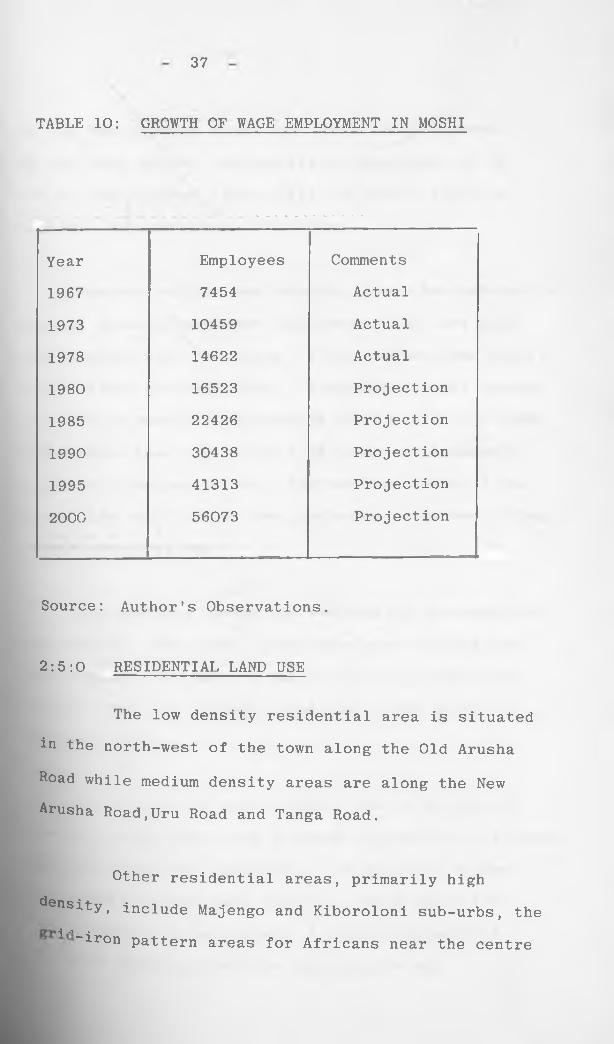
In projecting the employment to year 2000,
the rate of growth of the population in the town has
een considered and the general trend of the growth of
^ployment over the past years has been taken into
pccount. in the absence of large capital investments
■ ^ o s h i town, the increase in employment will be normal i f ° retarded. Job seekers from the rural hinterlandwi i i
Ve to look somewhere else for employment opportu-n*tles in •view of the fact that Moshi's employment Ration opportunities will be lower.
37
TABLE 10: GROWTH OF WAGE EMPLOYMENT IN MOSHI
Year Employees Comments
1967 7454 Actual
1973 10459 Actual
1978 14622 Actual
1980 16523 Projection
1985 22426 Projection
1990 30438 Projection
1995 41313 Projection
2000 56073 Projection
Source: Author's Observations.
2:5:0 RESIDENTIAL LAND USE
The low density residential area is situated
in the north-west of the town along the Old Arusha Road while medium density areas are along the New Arusha Road,Uru Road and Tanga Road.
Other residential areas, primarily high
iensity, include Majengo and Kiboroloni sub-urbs, the-j j •“iron pattern areas for Africans near the centre
38
of the town such as Kiusa and Arusha Chini streets.
In the town centre, residential accommodation is in
two or three storey flats while the ground floor is
reserved for commercial activities.
However, within the township, there are substantial
housing areas of squatter development that have grown
and expanded over the years. These include Boma Mbuzi,
Pasua, Njoro and Kiboroloni. According to 1967 census
data, there were 7730 households living in 13,000 rooms
which means that there were 1.68 rooms per household
and 0.49 rooms per person. Furthermore, 66.3% of the
households and 51.0% of the population were then living
in one room dwelling.
The problems facing the residential accommodation
are several. One, most of the people are living too
overcrowded. Two, many of the buildings particularly
those in the high density areas are in bad condition and over-aged.
In comparative terms, Moshi town is better-off
P an the rural hinterland in terms of provision of water
and electricity per household. The majority of the
I * an dwellers have easy access to these facilities.Th is8 diversity in development is more pronounced if
■ rural housing conditions are considered.
39
Since 1972 when the government nationalised
private buildings, worth TShs.100,000 or more, private
house construction has been slowed down to a minimum/
The public institutions charged with the construction
of residential housing have not been able to fill the
gaps; consequently, there is a serious housing shortage
in Moshi. An additional problem is the shortage of
surveyed building plots. In 1980, residential area
occupied about 380 hectares with about 6,000 plots.
The other problem that has befallen Moshi
as well as other towns in Tanzania is the fact that
there has been a negative attitude towards the towns
which is reflected in the absence of the declarationg
of any towns since independence . In 1972, when
the decentralisation programme was effected and the
subsequent abolition of all town councils, Moshif
urban area was designated a district governed on the
same principles like any other rural district. This
negative attitude adversely affected Moshi as a town
and urban conditions, particularly residential
suffered massive deterioration. It should be noted
that urban problems are quite different from rural
problems and approaches to their solutions are also different.
Egero, B. et al, op. cit. p. 76.8
40
2.6.0 ECONOMIC BASE
Market factors in industrial location
dominated the economy up to 1967, the time of Arusha9Declaration . Investors mostly foreigners, could
locate industries wherever they thought it was better
and optimum for them. This type of laissez-faire
industrial strategy meant that industries were located
in a few areas where infrastructural facilities and services existed, where the market was likely to be
found and in some cases, where the raw materials could be found. Out of this strategy, Tanga and Dar
es Salaam benefited the most, although to a lesser
extent, Moshi, Arusha and Mwanza had some industries located there too. Moshi is situated in area of
export - enclave9 10 whose hinterland specialises
among other things, in the growing of coffee for export.
Initially, there was a large European settler community
within the vicinity of Moshi town as well as Asian dukawallas in the town. These provided the market
for the industrial products. Secondly, Moshi town
Was linked to both Tanga and Mombasa ports on the coast
9 - Nyerere, J.K.: Arusha Declaration, 1967.pe^83an’ *: 0omPara^ave Development Stategies in E.A.
41
by the railway. In addition, other infrastructural
facilities had already been developed, and therefore,
it was relatively easy and profitable to locate
industries at Moshi.
After 1967, the Second Five Year Plan was
drawn that emphasised state control of the comanding
heights of the economy and to decentralise industries
away from Dar es Salaam‘d. Nine towns were selected
as growth centres within which industrial development
was to be concentrated. These were Tanga, Mtwara,
Mbeya, Morogoro, Dodoma, Tabora, Mwanza, Arusha, and
Moshi. In this policy, it was envisaged that all
new industries should be located in these nine urban
areas such that rural development may be speeded up.
In other words, this policy was geared towards the
reduction of urban - rural inequality.
The reasoning behind this plan was both logical
and very ideal in the sense that the authorities
had realised the inadequacy of rural development.
However, the practicability of the policy was a big problem in the sense that decentralisation of industries to regions did not materialise. Dar es Salaam continued
° attract a disproportionate share of new large . dustries, population and social utilities. Some
~ Tanzania, Second Five Year Plan, op. cit.
42.1
reasons were advanced for the failure of the nine
growth centre policy, the main one being inadequate12infrastructural facilities. However, the authority
that was supposed to provide these infrastructural
services, that formulated the growth centre policy
and that was the main industrial investor was one and
the same thing: the government. Inherent in this
contradition is the fact that the rural areas have
continued to experience lagging development.
The third development plan has designated
industrial zones strategy into which industrial
investment would be concentrated in the years 1976 -
1981. In selecting the zones, two criteria have been
considered, that is, income distribution and existing
transportation network. However, the trend has not
been as stated on paper and in fact, most of the
industrial investments in the third plan have gone
to the Eastern Zone; in contrast Moshi has had only13one, an on-going machine tools project. This
factory, when completed, will be the only one large public
industrial investment for the last 10 years'!'4
~ Tanzania, Third Five Year Development Plan, op. cit. p. 44
- Author's Observations.The last large-scale public industrial investment was carried out in the early years of Second Plan, 1969/74.
43
2.6.1 Industrial Sector and Land Use
There are various methods used to classify
industries. Some criteria in the classification
of industries are size, employment, performance,
function, capital and output. In the location of
industries, capital/output and labour/capital ratios
are invariably used so as to designate areas for
heavy industry and light industry as well as which
industries are labour intensive and capital intensive.
In the case of Moshi, the existing industries can be
divided into two main categories: firstly, service
industries, mostly engaged in repairs, and services
like garages, laundries, bakeries, among others and
they serve the daily needs of the urban population;
secondly, there are manufacturing industries which
include storage and depots.
The numerous small establishments in service
industries are mainly located in the town centre. These
include bakeries, laundries and small garages. On the
ay the Moshi Airport, a small scale industrial estate
as been established to manufacture furniture, foundry i ron > leather goods, nails, crockery and other similar
poods. The industrial estate has of late received
44
a large financial injection by both the government
and foreign grants. In general, the service industries
can be allocated relatively close to the residential
areas for the convenience of workers and consumers
but more so due to the fact that they have a low level
of pollution and other environmental health hazards.
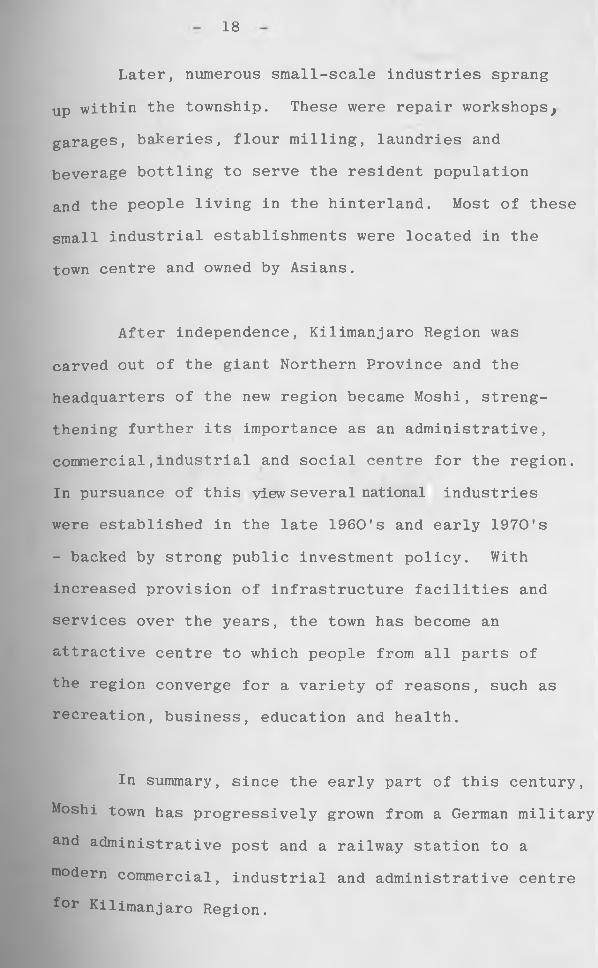
Most of the manufacturing firms, depots and
storages are located in the area adjacent to the railway
station, the industrial area. This area is accessible
by rail, and road and most of the industries have
a railway siding.The manufacturing industries include
the following 7 biggest: Coffee Curing Factory,
Tanzania Bag Company Ltd., Timber Utilization Factory,
E.A. Kenaf Industries, Breweries Depot and Bottling
Plant, Moshi Leather Tannery Works and Kibo Match
Factory. These 7 factories have more than 80% of
the total employees in the industrial sector. Other
industries include the Moshi Textile Mill and the
Machine Tools Factory under construction. Several
industries are located in Majengo ,near Karanga Sisal
state and near Karanga Prison. All of these industries
ave been located away from residential areas due to
e high incidence of air and water pollution and
ealth hazards. Other factors that have been taken into
ccount are factory extension possibilities on their own
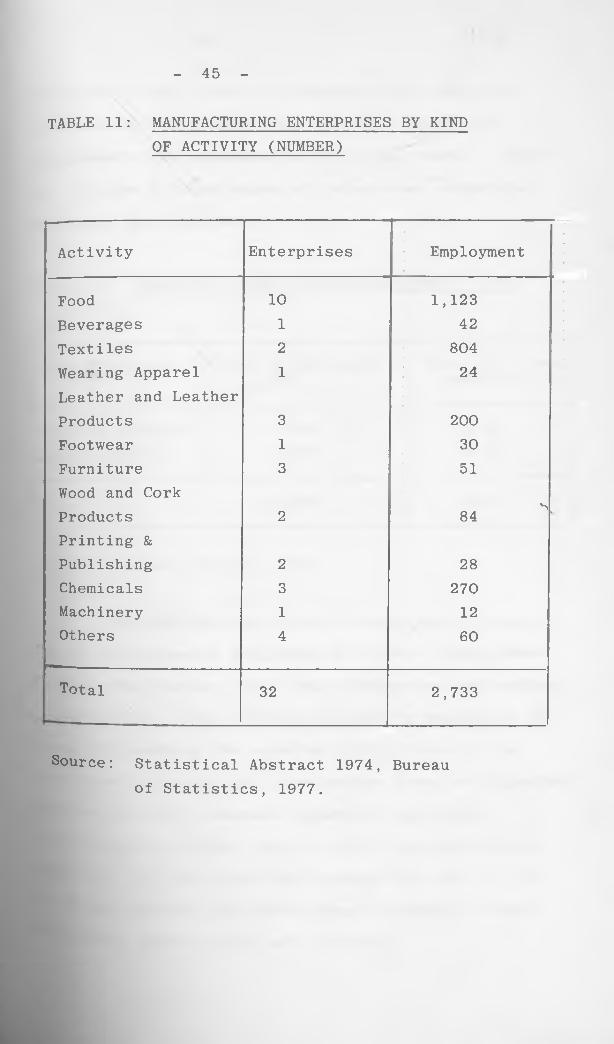
TABLE 11: MANUFACTURING ENTERPRISES BY KINDOF ACTIVITY (NUMBER)
- 45 -
Activity Enterprises Employment
Food 10 1,123Beverages 1 42Textiles 2 804Wearing Apparel 1 24Leather and LeatherProducts 3 200Footwear 1 30Furniture 3 51Wood and CorkProducts 2 84 ^k
Printing &Publishing 2 28Chemicals 3 270Machinery 1 12Others 4 60
1' 1
Total 32 2,733
Source: Statistical Abstract 1974, Bureauof Statistics, 1977.
plot areas, easy access to transportation facilities,
avoidance of heavy industrial traffic and special
requirements for treatment of industrial waste. Tables
11 - 12 give a broad survey of industries, industrial
employment and land use.
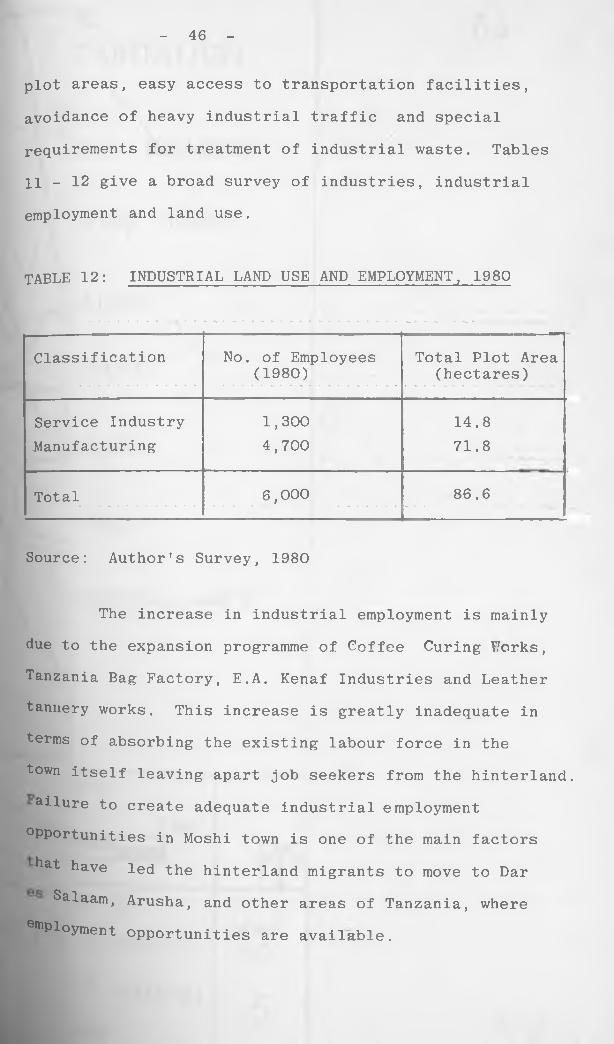
TABLE 12: INDUSTRIAL LAND USE AND EMPLOYMENT, 1980
- 46 -
Classification No. of Employees (1980)
Total Plot Area (hectares)
Service Industry 1,300 14.8Manufacturing 4,700 71.8
Total 6,000 86.6
Source: Author’s Survey, 1980
The increase in industrial employment is mainly
due to the expansion programme of Coffee Curing Works,
Tanzania Bag Factory, E.A. Kenaf Industries and Leather
tannery works. This increase is greatly inadequate in
terms of absorbing the existing labour force in the
town itself leaving apart job seekers from the hinterland.ailure to create adequate industrial employment
opportunities in Moshi town is one of the main factors bat have led the hinterland migrants to move to Dar
Salaam, Arusha, and other areas of Tanzania, where
HPPloyment opportunities are available.
M A PNO
5
SCALE 1: 2QOOO
.1 2 KM
KUTOL1E F.S.
M.A. PLANNING
univ. of Nairobi
1980/81
INDUSTRIAL . SECTOR
HINTERLAND
^INDUSTRIAL AREAS8.
TRANSPORTATIONL E G E N D
town boundary
major roads
railway
i/I » n » » » ! , • I
I”!'!"
r i v e r s
b r i d g e
FOREST
INDUSTRIAL AREA
47
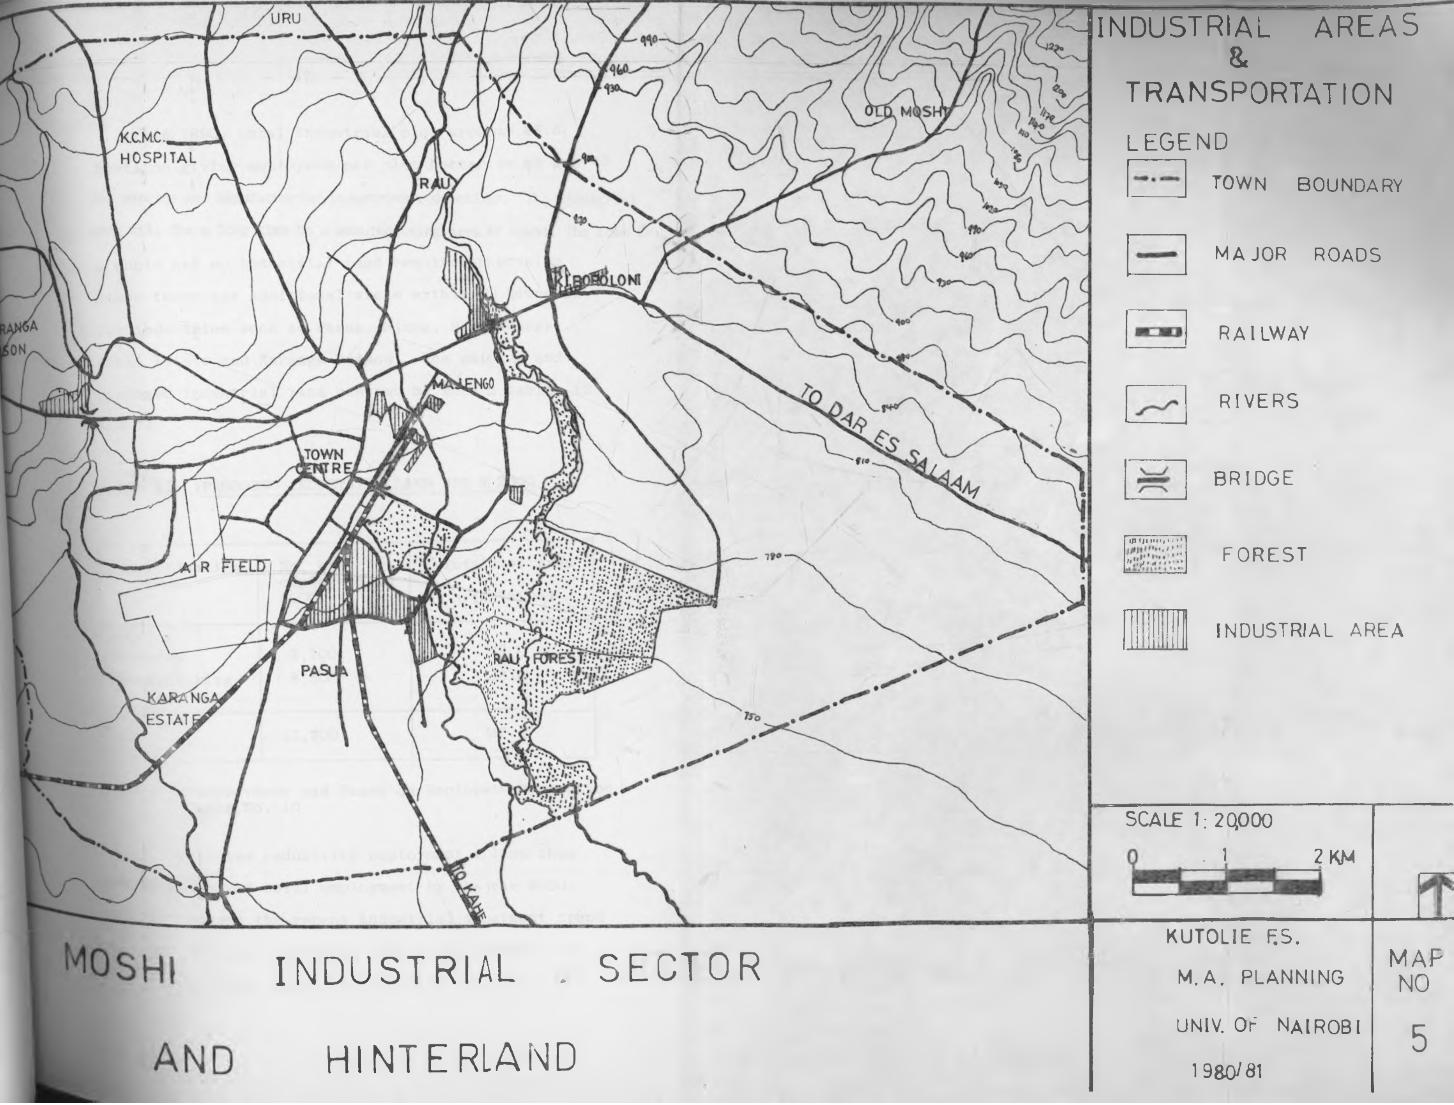
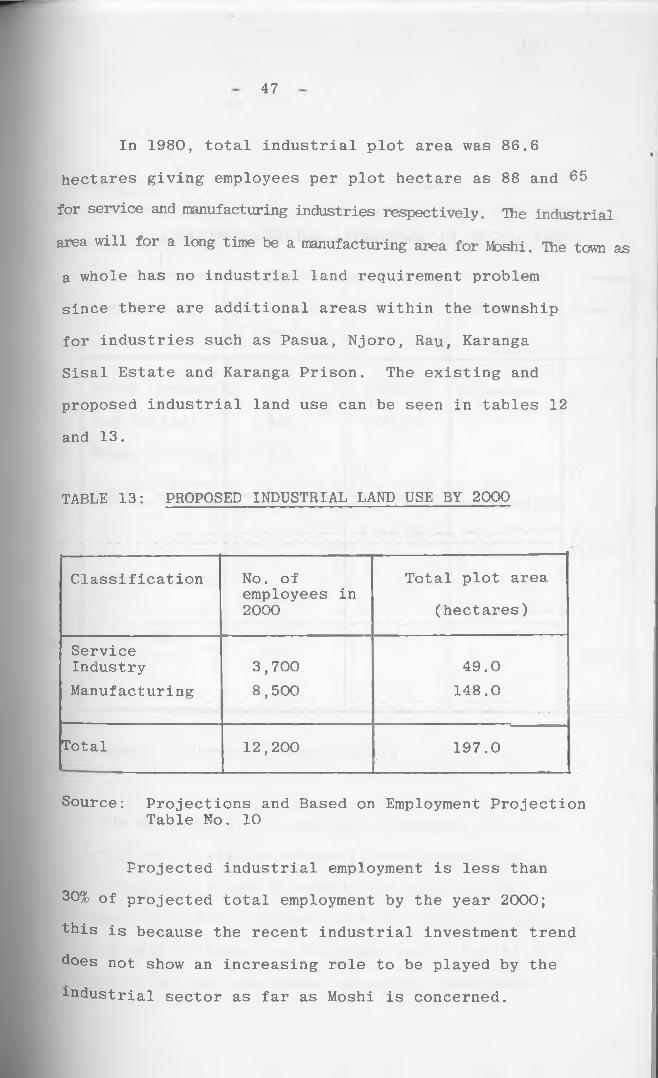
In 1980, total industrial plot area was 86.6
hectares giving employees per plot hectare as 88 and 65
for service and manufacturing industries respectively. Ihe industrial
area will for a long time be a manufacturing area for Moshi. The town as
a whole has no industrial land requirement problem
since there are additional areas within the township
for industries such as Pasua, Njoro, Rau, Karanga
Sisal Estate and Karanga Prison. The existing and
proposed industrial land use can be seen in tables 12
and 13.
TABLE 13: PROPOSED INDUSTRIAL LAND USE BY 2000
Classification No. ofemployees in 2000
Total plot area
(hectares)
ServiceIndustryManufacturing
3,7008,500
49.0148.0
Total 12,200 197.0
Source: Projections and Based on Employment ProjectionTable No. 10
Projected industrial employment is less than
30% of projected total employment by the year 2000;
this is because the recent industrial investment trend
does not show an increasing role to be played by the
industrial sector as far as Moshi is concerned.
48
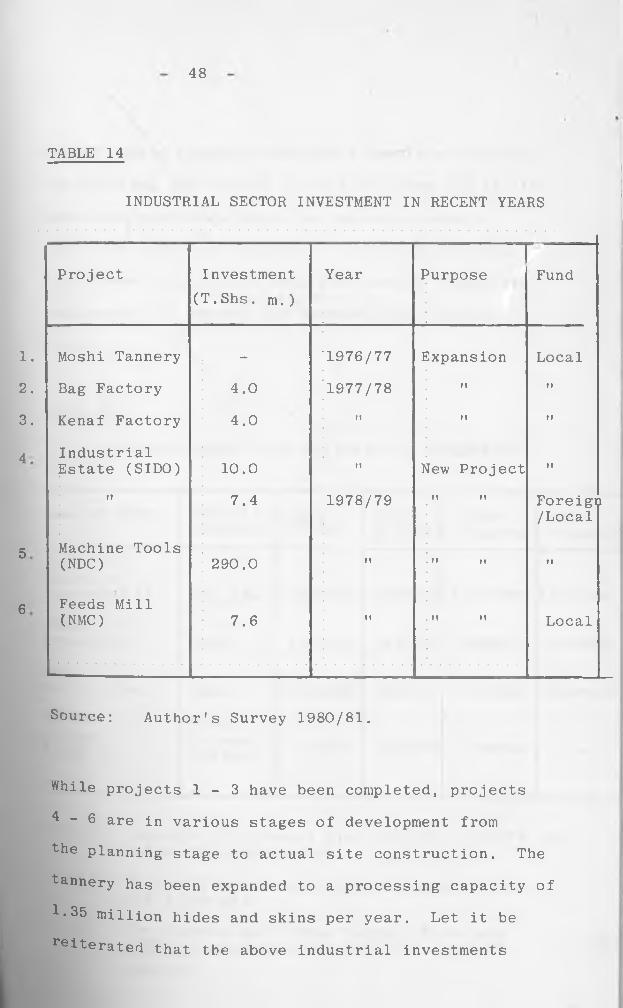
TABLE 14
INDUSTRIAL SECTOR INVESTMENT IN RECENT YEARS
Project Investment (T.Shs. m.)
Year I>urpose Fund
1. Moshi Tannery - 1976/77 I]xpansion Local2. Bag Factory 4.0 1977/78 It it
3. Kenaf Factory 4.0 m 11 it
4 IndustrialEstate (SIDO) 10.0 m New Project M
m 7.4 1978/79 M M Foreign/Local
5 Machine Tools(NDC) 290.0 M M II ii
6 Feeds Mill(NMC) 7.6 11 It It Local
Source: Author’s Survey 1980/81.
While projects 1 - 3 have been completed, projects
- 6 are in various stages of development from
"the planning stage to actual site construction. The
tannery has been expanded to a processing capacity of 1.35 million hides and skins per year. Let it be
reiterated that the above industrial investments
cannot create adequate employment opportunities for
the existing job seekers in both the town and in its
immediate hinterland which is the most densely
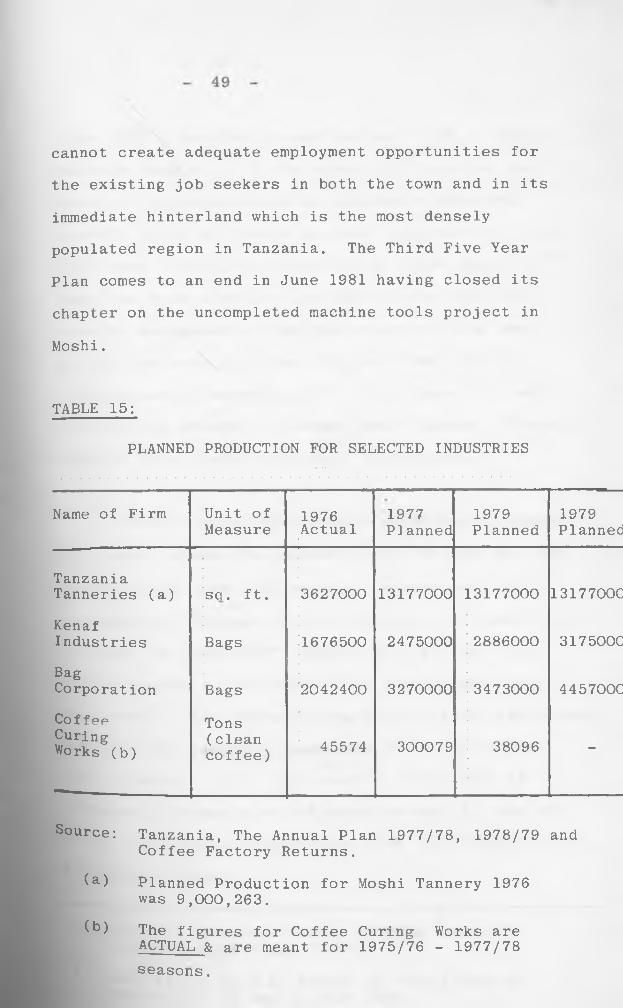
populated region in Tanzania. The Third Five Year
Plan comes to an end in June 1981 having closed its
chapter on the uncompleted machine tools project in
Moshi.
TABLE 15:
PLANNED PRODUCTION FOR SELECTED INDUSTRIES
Name of Firm Unit of Measure
1976Actual
1977Planned
1979Planned
1979Planned
Tanzania Tanneries (a) so. ft. 3627000 13177000 13177000 1317700C
KenafIndustries Bags 1676500 2475000 2886000 317500C
BagCorporation Bags 2042400 3270000 3473000 445700CCoffee Curing Works (b)
Tons(cleancoffee) 45574 300079 38096 -
Source: Tanzania, The Annual Plan 1977/78, 1978/79 andCoffee Factory Returns.
(a) Planned Production for Moshi Tannery 1976 was 9,000,263.
(b) The f igures for Coffee Curing Works are ACTUAL & are meant for 1975/76 - 1977/78seasons.
50
Since 1975 industrial production has faced a foreign
exchange constraint in the sense that imported raw
material inputs could not be adequately obtained;
secondly there has been a decline in productivity and15efficiency leading to production at below capacity.
There has been a serious problem of obtaining data
from the management of the factories and data used
in this analysis is either obtained from official
publications or where possible, from those that were
co-operative enough to release their figures. Therefore
table 11,12 and 15 fall victim of this malady.
However there are a number of economic linkages
that occur between the industries in the town and the
hinterland in terms of material inputs and output
consumption. Linkage of this kind may be classified as
"forward" or "backward", depending on whether flows
are of outputs to customers or of inputs from other
suppliers , The Coffee Curing Factory is an agro-based
industry that processes parchment coffee for export.
This industry cures all arabica coffee that is
Produced in Tanzania out of which between 1/3 and 2/3
°f the total coffee input comes from the hinterland i.e. Kilimanjaro Region.
5* Tanzania, Economic Survey 1977/78 Bureau of Statistics, 1979 pp. 75-76.
See Article by O.E. Keeble in Town Planning Review Vol. 40 no. 2, July 1969.
16.
51
The Kibo match factory produces match boxes.
Its local inputs include wood for the splints and
boxes which is readily available from the hinterland.
The Tanzania tanneries factory processes hides and
skins into leather. Hides and skins are available
from the region itself and the neighbouring regions
of Arusha/Tanga. The leather produced is used
by other industries into the production of leather
products such as shoes, bags and belts. There are
a number of small scale industries in both the town
and the hinterland that engage in shoe production. ,
Prominent among them is the small Karanga Prison
Shoe Factory that produces shoes for the prison
personnel and other members of the security forces.
The Shah Industries Ltd. located in the industrial area
produces various leather goods such as bags, jackets
and belts. Thus the tanneries industry has both
forward and backward linkages.
The Tanzania Bag Factory (TBC Ltd.)
manufactures bags, mainly for local consumption.
The main local material
nPut is sisal readily obtainable from the sisal
adustry. The bags are used by the coffee industry,
52
among others, at various stages of coffee production.
They are used for packing ripe coffee berries to
the palperies, for packing dry parchment coffee
for curing and finally for packing cured clean
coffee for export. The E.A. Kenaf Industries
manufacturies kenaf bags from kenaf. A project
was started to grow kenaf locally in the lower
plains of Moshi but it has not been successful so
far. Thus the kenaf factory relies mostly on
imported kenaf at the moment. The bags are used
in the agricultural industry.
It can be seen that Moshi industries to some
extent utilizes locally produced material inputs to
manufacture various products that are consumed not
only by the region but also for the country as a
whole if the product is not meant for export such
as coffee. However the hinterland produces a
number of products that are yet to be processed
industrially. in other words the region has a
great potential capacity for industrialization which
can generate effective economic linkages in the way
production, employment and incomes. The government which ic iLne main investment authority inclusive of
decision and location has to take thesefactors serious consideration.
53
2:6:2 Commercial Sector:
The commercial services include retail
services such as shops, restaurants, cafes, liquior
and coffee bars, hotels, lodging, handicrafts, etc.;
wholesale, banking and insurance. This sector is
very important in the sense that it provides
essential services for the other economic sectors such
as agriculture and industry.
In 1980 there were 4 well-developed market
places with more than 400 market vendors within the
township. One of the market specialises in new and
second hand cloth selling. Two of these are located
in the town centre, one in Majengo and the last
one in Kiboroloni. These markets are accessible to
the rural hinterland population to sell their
agricultural produce. The products sold include
bananas, fruits and vegetables, maize,eggs, cassava,
and beans among others. Bananas are available in
different forms. The green form is used for
cooking food, the ripe form eaten as a fruit and
a so used as an ingredient in the preparation of the
B ® Cal ^rew known as "mbege."^ The selling of this local
17. Mbege", Chagga word for local brew.
54
I \ ibrew is big business in the town.
There are 3 tourist class hotels with 250
beds, altogether, and 3 smaller with 70 beds. All of
them, with two exceptions, are located in the town
centre (CBD - Central Business District). There
are also small numerous lodging establishments with
5 - 1 0 beds each that have sprung up throughout the
high density residential areas.
The retail shops are mainly concentrated in
the Central Business District along Kibo, Mawenzi and
Kiusa Roads, the first two radiating from the Clock
Tower and running parallel to each other. The other
retail shops are in Kiboroloni, Majengo, Pasua Mjiy
Mpya and other high density residential areas.
Total plot area under commercial services
was 22.6 and 40 hectares for 1973 and 1980 respectively.
Employees working in the commercial sector were 2,200
and 3,500 for 1973 and 1980 respectively. The figure
for 1980 is 21% of the town's total employment.
All banking and insurance activities are in the
own centre within walking distance from the Clock Tower* The National Bank of Commerce has 3 branches
55
in the town while there is an existing Post Office Bank.
In general commercial activities occupy aboU*
50 - 75% of the floor area of each block which is
within acceptable standard in Tanzania. The
rest can be used for other services suchresidential.
The 1972 nationalisation of buildings a.ffec*ed
commercial ownership greatly-prior to 1972 most of
the commercial premises particularly in the Town
Centre were owned by Asians. After nationalisation
they became rent-payers on their own property and
many of them left commercial business altogether
either moved to other sectors or left the country fc>
good. Consequently one finds that the local
indigenous population is now in complete control of retail business in the Town Centre. .
2:7:0 Infrastructure:
In the discipline of physical planning,
analysis of existing infrastructural services and
facilities is an important area of study which
essentially determines the adequacy and inadequacy
of such facilities to the community Comparatively 18
18. Tanzania towns have no universal and accepted s ^ ^ t up space and planning standards.
56
if two areas are rigorously subjected to such an
analysis similarities and divergences can be exposed;
ways can be sought, subsequently, to reduce the
development gap if any. These facilities include,
among many, schools, water supply, sewerage, health
facilities, electricity and transportation. The
provision of such facilities is important particularly
for industrial development. Industries require raw
material inputs and these must be hauled from a
distance and in some cases from very far. In this
case there is need to have a sound transportation
network for the procurement of the raw materials.
Industries require power for their operations and as
such provision of electricity is a precondition
for the establishment of such industries. Without
workers factories cannot operate or produce. Therefore
any factory will need a number of workers in various
categories skilled, semi-skilled and so on. Before
the workers are employed they must have a certain
level of training and have had acquired certain
industrial skills. This necessitates the provision
°f educational facilities. The welfare of the workers
ls an important factor in production and therefore
the need for health facilities. Let it be reiterated
hat the provision of economic and social infrastructure
s essential if any industrial strategy is to succeed.
57
19If the industrial growth zones policy goes
anywhere towards achieving the objective of
decentralisation of industries in Tanzania then
the provision of infrastructural facilities in those
zones is necessary.
These facilities cannot be provided in
isolation of the people. Thus as the population grows
in the town, this necessitates industrial and
commercial development while simultaneously it
prompts the need for the welfare of the community.
This is when schools, hospitals, houses, roads, water,
electricity and other facilities are provided by the
town authorities.
2:7:1 Transportation:
As the principal centre of the region Moshi
town attracts much traffic from neighbouring rural areas The main traffic spine is the Dar-es-salaam - Arusha-
Nairobi Highway. The traffic flows on this highway
between Moshi and Arusha have in recent years been
°ne of the highest in the country due to the dense Population on the slopes of Mount Kilimanjaro and 19
19. Tanzania, Third Five Year Plan, op. cit.P. 73.
57
If the industrial growth zones policy goes
anywhere towards achieving the objective of
decentralisation of industries in Tanzania then
the provision of infrastructural facilities in those
zones is necessary.
These facilities cannot be provided in
isolation of the people. Thus as the population grows
in the town, this necessitates industrial and
commercial development while simultaneously it
prompts the need for the welfare of the community.
This is when schools, hospitals, houses, roads, water,
electricity and other facilities are provided by the
town authorities.
2:7:1 Transportation:
As the principal centre of the region Moshi
town attracts much traffic from neighbouring rural areas
The main traffic spine is the Dar-es-salaam - Arusha-
Nairobi Highway. The traffic flows on this highway
between Moshi and Arusha have in recent years been
°ne of the highest in the country due to the dense
Population on the slopes of Mount Kilimanjaro and 19
19
19. Tanzania, Third Five Year Plan, op. cit.P. 73.
58
Mt. Meru which generate much traffic to Moshi and
Arusha towns. The Ministry of Works Traffic Survey
carried out in 1973 recorded 1600 automobiles a day
between Moshi and Arusha and 940 a day between Moshi 20and Himo . From there are good road connections
to Singida, Dodoma, Tobora and Mwanza via Arusha, to
Mombasa via Himo and to Tanga via Korogwe.
The national highway known as Taifa Road
(Barabara ya Taifa), runs through the town by-passing
the town centre. In the southern part of the town
Kibo, Mawenzi and Arusha Roads are the main arterial
roads with connection to the highway. Mawenzi Road
is the busiest street in the centre. Arusha Road
carries the traffic from Arusha side to the centre.
In the northern part of the town Kibosho - Kilimajaro
and Uru Roads are connected to the highway. The by
passing traffic from Arusha Chini (sugar Factory)
and Kahe (railway junction) as well as from the
industrial area to the highway goes through the town centre.
Most streets in the centre are bitumenized so
re the main streets in the residential areas. However
n some residential areas like Pasua some streets are satisfactorily constructed.
20 Tanzania Ministry of Works Traffic Survey 1973
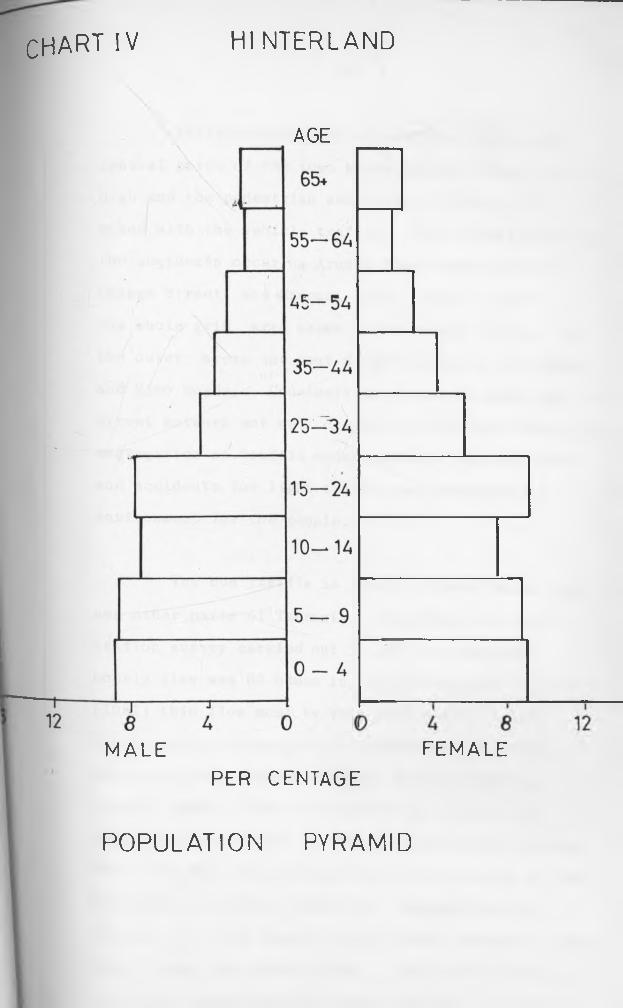
C H A R T 1 V h i n t e r l a n d
AGE
MALE FEMALEPER CENTAGE
P O P U L A T I O N P Y R A M ID
59,
Traffic safety is not satisfactory in the
central parts of the town where traffic flows are
high and the pedestrian and bicycle traffic are
mixed with the vehicle traffic. Consequently most of
the accidents occur on Arusha Road, Market Street,
Chagga Street, and Mawenzi Road. In the centre
the whole grid area seems to be evenly unsafe. In
the outer areas the most dangerous roads are Sukari
and Himo Roads. Conclusively it can be said that the
street network not well classified and with inadequate
segregation of traffic modes affects safety risks
and accidents for light traffic and unpleasant
environment for the people.
The bus traffic is lively between Moshi town
and other parts of Tanzania. According to a bus -
station survey carried out in 1973 the maximum
hourly flow was 63 buses in and 71 buses out. By now
(1981) this flow must be very much higher. Long
distance bus routes provide connections to Tanga,
Dar-es-salaam, Dodoma, Singida, Tabora, Mwanza,
Bukoba, Musoma, Mbeya and,before the closure of
Kenya/Tanzania border in 1977^ to Mombasa and Nairobi.
There are daily bus connections to most parts of the
hinterland: to Siha, Sanya Juu, Masama, Machame,
Kibosho, Uru, Old Moshi, Kirua, Kilema, Marangu, Hdmo
Rombo, Same, and Arusha Chini. The bus station is
centrally located having access straight to Mawenzi* ,
60
However the capacity of this station is now fully
utilized. The extension possibilities can be done
southwards, towards the Polic Station and east of
Mawenzi Road on the site occupied by Kibo
Secondary School. Moshi has a public transport
system the third of its kinds in Tanzania.
The emphasis in railway traffic is on goods
transport, though passenger traffic is growing fast
due to the higher fares by bus and also due to the
increasing population. When the proposed plan to
construct a new railway line from Arusha to Musoma with
ferry connections to Mwanza and Bukoba is realized
it will considerably increase the railway traffic
through Moshi. Moshi has passenger traffic connections
to Tanga and Dar-es-salaam and goods transport
connections to Arusha, Dar-es-salaam and Tanga.
There are plans to construct a Railway Workshop at
Moshi Railway Station. The railway station is
centrally located and is mid-way between Clock Tower
and Majengo and is near the industrial area. The
latter is well served by the railway.
Moshi airfield is located in the
south-west area of the town serving the small plane
traffic including the "Flying Doctor Service". It does
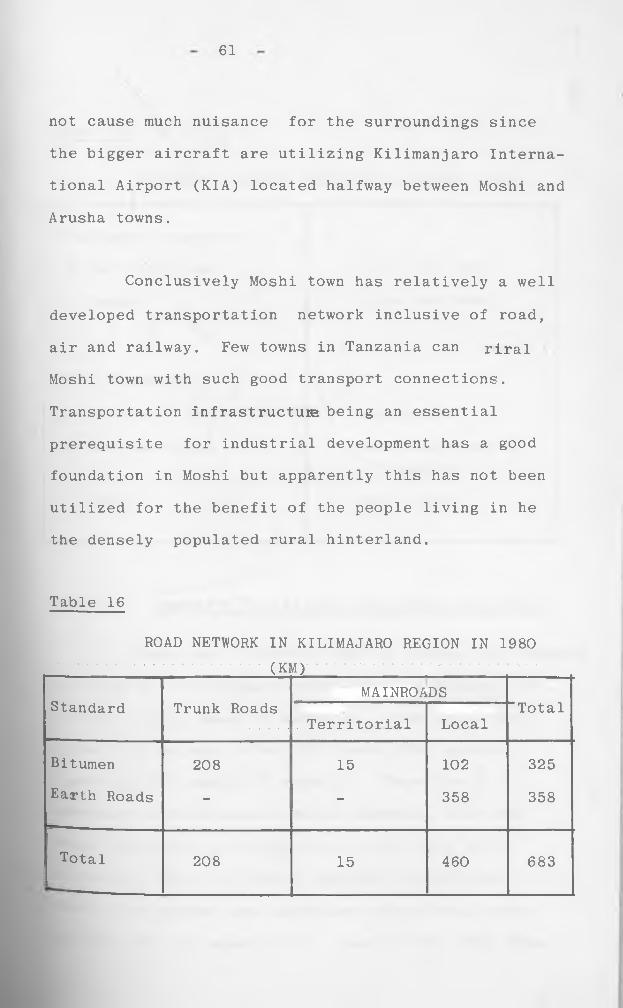
61
not cause much nuisance for the surroundings since
the bigger aircraft are utilizing Kilimanjaro Interna
tional Airport (KIA) located halfway between Moshi and
Arusha towns.
Conclusively Moshi town has relatively a well
developed transportation network inclusive of road,
air and railway. Few towns in Tanzania can riral
Moshi town with such good transport connections.
Transportation infrastructure being an essential
prerequisite for industrial development has a good
foundation in Moshi but apparently this has not been
utilized for the benefit of the people living in he
the densely populated rural hinterland.
Table 16
ROAD NETWORK IN KILIMAJARO REGION IN 1980(KM)
MAINROADSStandard Trunk Roads Total
Territorial Local
Bitumen 208 15 102 325
Earth Roads - - 358 358
Total 208 15 460 683
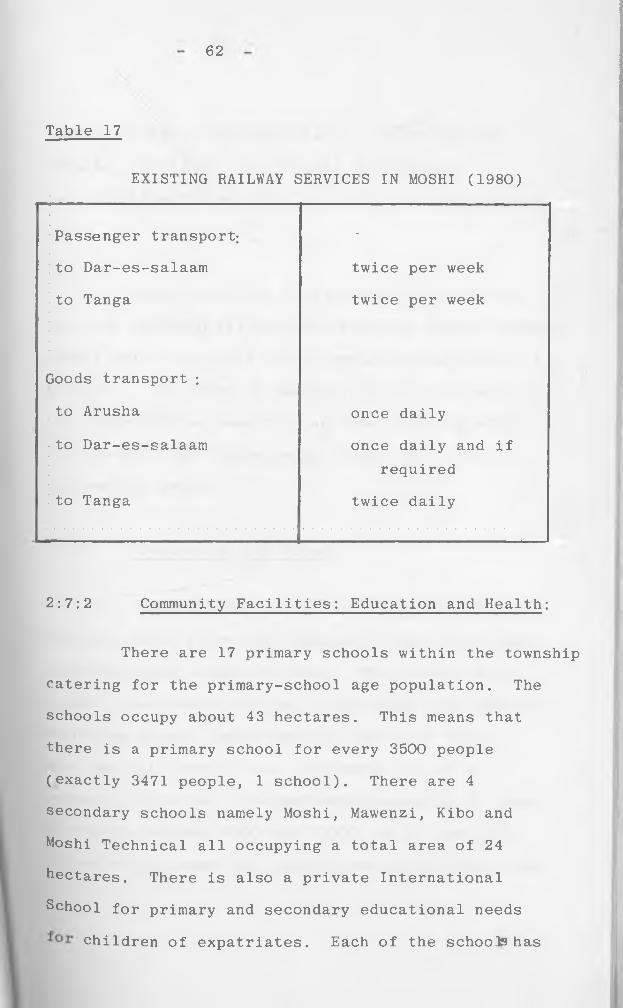
62
Table 17
EXISTING RAILWAY SERVICES IN MOSHI (1980)
Passenger transport; -
to Dar-es-salaam twice per week
to Tanga twice per week
Goods transport :
to Arusha once daily
to Dar-es-salaam once daily and if required
to Tanga twice daily
2:7:2 Community Facilities: Education and Health:
There are 17 primary schools within the township
catering for the primary-school age population. The
schools occupy about 43 hectares. This means that
there is a primary school for every 3500 people
(exactly 3471 people, 1 school). There are 4
secondary schools namely Moshi, Mawenzi, Kibo and
Moshi Technical all occupying a total area of 24
hectares. There is also a private International
School for primary and secondary educational needs
children of expatriates. Each of the schools has
63
ample extension possibilities. There are also
several, vocational educational institutions
including the Police Training Centre and Co-operative College.
Moshi town has 2 big hospitals*, there is
the well-equipped Kilimanjaro Christian Medical Centre
(KCMC) which is one of the 3 consultant hospitals in
Tanzania. The other is Mawenzi Hospital situated in
the centre of the tomThere is also a bedded clinic
and several other dispensaries scattered around in
the central areas.
2:7:3 Electricity and Water:
Moshi is one of the few urban centres in
Tanzania which enjoy both adequate fresh water supply
and satisfying sewage disposal. The present water
intake lies about 14.5 km. to the west from the town
where two ground water springs Nsere and Shiri
have been utilized to meet the water demand of
present population. The estimated capacity of these
springs is between 8000 and 10000 cu.m. per day.
The water is pumped and stored into two storage tanks
64
(reservoirs) one located near Karanga Prison with a3capacity of 1,350 m while the other one is near
3the Police Training Centre with a capacity of 2,250 m .
There are two gravity feeder pipes from the water
intake to the tanks and distribution pipe network
which covers the central areas of the town, the area
between Town Centre and K.C.M.C. Hopsital as well as
Pasua and Majengo areas. Daily consumption is about37,200 m in 1973 or about 160 litres per person
including industrial water supply. In 1980 it was
estimated that daily consumption had risen to312,000 m . A separated piped water supply system
exist in some rather rural parts of the town. The
possibilities for extension of the future water supply
are rather good because Kilimanjaro’s slope area to
the north of the town has rich ground water resources
which can be utilized at relatively low cost due to
the advantageous topography. In fact by utilizing
some other spring in the area the total output can
be raised easily to 25-30,000 m3 per day.21
There is need for construction of an
additional water drainage system for the town centre
where during heavy rains problems occur with flowing
storm water. This can easily be done on account of
21. Ministry of Water Development and Power Report 1975.
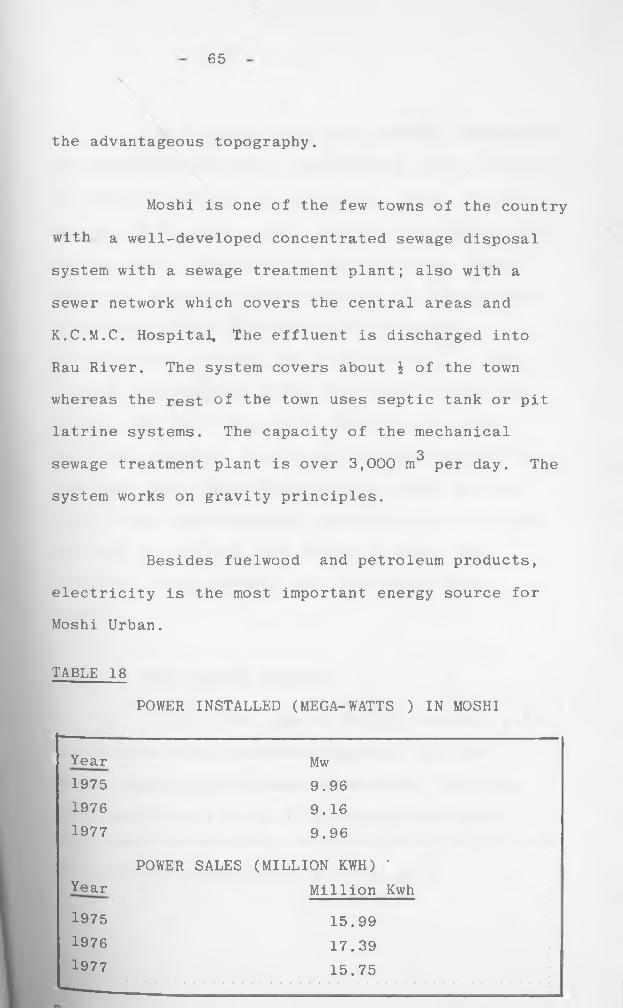
65\
the advantageous topography.
Moshi is one of the few towns of the country
with a well-developed concentrated sewage disposal
system with a sewage treatment plant; also with a
sewer network which covers the central areas and
K.C.M.C. Hospital, The effluent is discharged into
Rau River. The system covers about \ of the town
whereas the rest of the town uses septic tank or pit
latrine systems. The capacity of the mechanical3sewage treatment plant is over 3,000 m per day. The
system works on gravity principles.
electricity is the most important energy source for
Moshi Urban.
TABLE 18
Besides fuelwood and petroleum products,
POWER INSTALLED (MEGA-WATTS ) IN MOSHI
Year197519761977
Mw9.96 9.169.96
YearPOWER SALES (MILLION KWH) *
Million Kwh197519761977
15.9917.3915.75
6 6
The figures show there is high consumption
of electricity in Moshi. Electricity sales of Moshi
are only exceeded by Dar-es-salaam, Tanga, Arusha,
Mwanza and Morogoro towns. Further, the Coastal and
Northern grid consisting of Dar-es-salaam, Tanga,
Morogoro, Arusha and Moshi account for 86% of total
electricity sales in Tanzania but of which22Dar-es-salaam consumed 50% of the total. Also
transmission lines to Moshi and Arusha joined the
coastal and Northern grid systems into one grid
such that now Moshi and Arusha can use electricity
from Hale and Kidatu hydro electric power sources.
Apart from these sources, electricity for the town
can also be utilized from Nyumba ya Mungu Dam,
Kikuletwa Power Station and the Thermal Power
Station.
2:8:0 SOME GENENAL REMARKS
Moshi town, one of the two northern poles,
is situated on the southern foothills of the
densely populated Kilimanjaro mountain. The town
is linked to most parts of the country by road,
22 . Third Five Year Plan op. cit. p. 50.
67
railway and air. There are no major physical
constraints as to its growth in all directions.
Since the early 1940s the town has been
growing at an average annual growth rate of 6.4%. In-
migration has been largely responsible for the growth
of the town. According to the 1967 census data, Moshi
town retained only 30% of the migrants from the Region.
This is an indication of the fact that urban employment
opportunities are limited. As regards the town’s
population, numbering 52223 in 1978 census, it is
dominated by men in the working ages. The sex ratio
is 128 to 100 in favour of males. At the turn of
the century Moshi's population will exceed 200,000
using a conservative growth rate of 6.3% p.a. The
predominance of the unemployed in the town is alarming:
it is estimated that about 9% of the labour force is
unemployed and this does not include the underemployed.
The services sector dominates the economy
of the town. There are numerous small-scale
establishments which employ less than 10 employees
each. Large scale employers are few and these are
in the manufacturing sector.
6 8 ?
Examination of the various land uses (see
Table 20) reveals a number of factors. The
agricultrual areas in the town occupies about 68%.
Second, residential housing is too overcrowded.
However there are ample land reserves for all other
land uses particularly industrial. Water and
electricity are adequately supplied and facilities
exist for future increased use and expansion. The
well developed transportation system, the existence
of community facilities in plenty and a sizable
portion of educated population are aspects that
contribute to the development of an industrial
sector. On the contrary the industrial potential
is largely unexploited and the existing one has
limited contribution in income and employment
generation due to significant flaws in its linkages.
Yet the growth of the town, whether as regards
population, commercial and industrial development, has
largely dependent on the resource hinterland.
The developed urban land and the various
land uses are presented in the following tables.
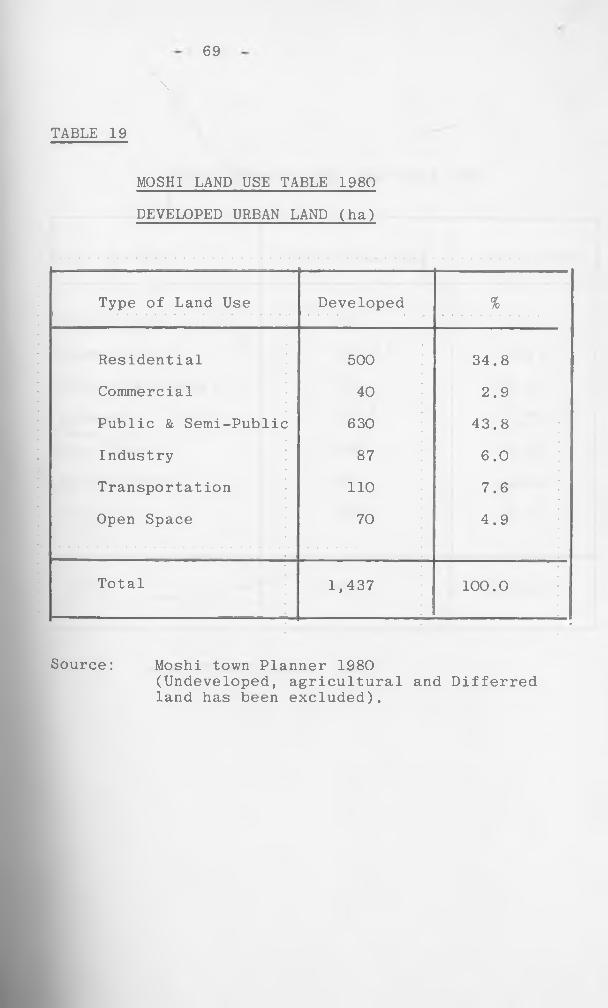
69
\
MOSHI LAND USE TABLE 1980
DEVELOPED URBAN LAND (ha)
TABLE 19
Type of Land Use Developed %
Residential
Commercial
Public & Semi-Public
Industry
Transportation
Open Space
500
40
630
87
110
70
34.8
2.9
43.8
6.0
7.6
4.9
Total 1,437 100.0
•
Source: Moshi town Planner 1980(Undeveloped, agricultural and Differred land has been excluded).
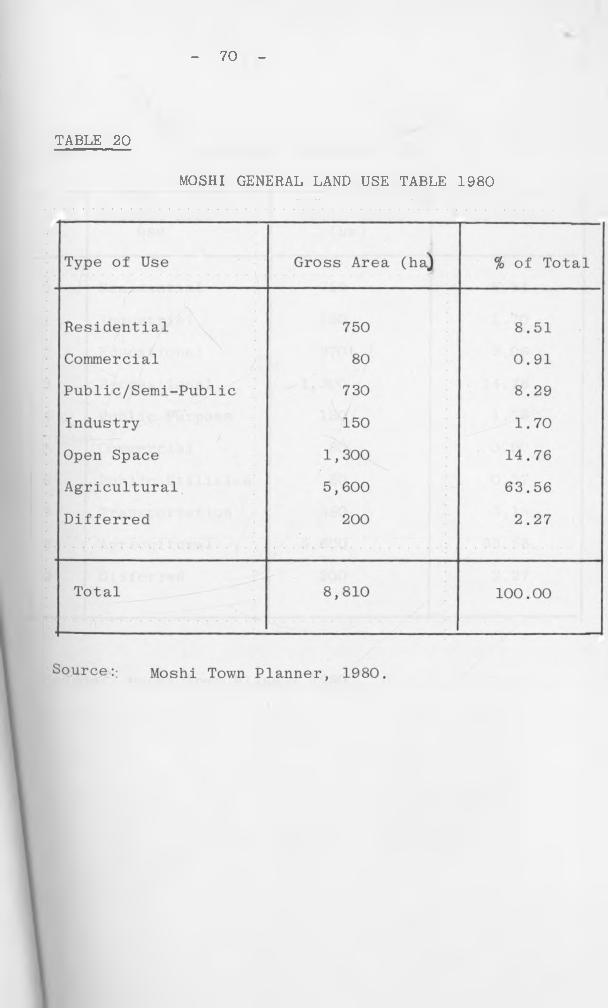
- 70 -
TABLE 20
MOSHI GENERAL LAND USE TABLE 1980
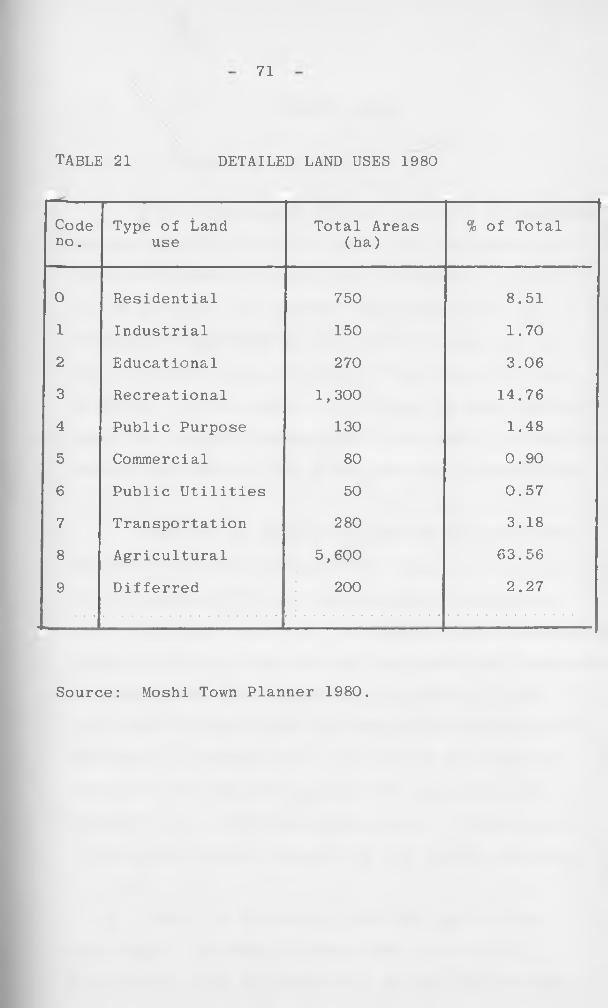
71
TABLE 21 DETAILED LAND USES 1980
Code no.
Type of Land use
Total Areas (ha)
% of Total
0 Residential 750 8.51
1 Industrial 150 1.70
2 Educational 270 3.06
3 Recreational 1,300 14.76
4 Public Purpose 130 1.48
5 Commercial 80 0.90
6 Public Utilities 50 0.57
7 Transportation 280 3.18
8 Agricultural 5,6Q0 63.56
9 Differred 200 2.27
Source: Moshi Town Planner 1980.
CHAPTER THREE
3:0:0 HINTERLAND ANALYSIS
The relationship, whether positive or negative,
between Moshi's industrial sector and its immediate
hinterland cannot be established without an analysis
of the physical and resource base, population and
linkages (transportation and communications) as far
as the hinterland is concerned. Therefore it is the
objective of this chapter to analyse the above factors
such that economic linkages and development differentials
between the town and the hinterland can be identified.
Most of the population derives its livelihood
from the hinterland and therefore existing resources
as well as resource base potential have to be given
their due weight; similarly population characteristics in
terms of density, migration and employment are important
considerations since resources are useless if not
exploited for the benefit of the people; the physical
parameter is significant in telling us the kind and
nature of the resources and how the population has
adopted to it. Efficient exploitation and utilization
of resources is made possible by the use of linkages.
There are two main tribes who live in the
hinterland. The Chagga live on the slopes of Mt.
Kilimanjaro while the Pare dwell in the Pare Mountain
- 72 -
73
3:1:0 Location and Physiographic Characteristics:
Moshi*s hinterland is located in North-East
Tanzania between 3 and 4 degrees south latitude, 37
and 38 degrees east longitude. At its northern
end is situated Mt. Kilimanjaro with an altitude of
5895 metres at Kibo Peak, the highest in Africa and
snow-capped all the year round. Along the lower
reaches of the Pangani River, which is the boundary
of the hinterland with the Masai Steppe to the West,
there are also lands with altitudes as low as 549
metres above sea-level. The hinterland is bordered
by Kenya in North and East, Tanga Region in South
and Arusha Region in West.
Kilimanjaro Region is the smallest region
in Tanzania Mainland (part from Dar-es-Salaam) with2an area of 13250 km . Excluding Moshi town which is
considered a separate urban district, the region has
the following administrative districts: Rombo, Moshi
Rural and Hai all on the slopes of Mt. Kilimanjaro
and constituting the former Kilimanjaro district;
finally Mwanga and Same districts both constituting
\ 74
the former Pare district. The subdivision of
more populous areas into smaller viable districts
is in accordance with Tanzania's policy of decentra
lisation .1
Mt. Kilimanjaro and Pare Mountains
(200-2500 metres) form the backbone of the region,
running through the middle of it in a lengthwise
,direction. Although the region's area is only
1.4% its population is 6% of national total. Most
of this population is concentrated on the slopes
of Mt. Kilimanjaro and the Pare Mountains at
altitudes between 800 and 2000 metres. Thus
hinterland studies are incomplete if physical
factors such as topography, soils and climate are
not analysed.
1. Nyerere, J.K., Decentralisation, Government Printer, Dar-es-Salaam, 1972, p. 3.
75
3:1:1 Geology, rainfall and Temperature:
The area is covered by the volcanic formation
on a precambrian basement floor which forms the Masai
Steppe to the South and the Amboseli plains to the
North. The major type of rocks of precambrian origin
include gneiss, quartzite and mica chist. The
major types of volcanic rocks are basalt, tuff, ash
and trachyte. Except for the bare rock found at
higher levels or where exposed by soil erosion, the
top soils are mostly clay deposits developed by
weathering and redeposition of the resultant products.
Of great interest is the complete absence of sand
deposits and the small sand content in all soils
except for the fine sand which originates from ash
deposition.
In general the dominant soils are firstly the
clayey, leached, red or red-brown clays at high levels
around Kilimanjaro; secondly brown clayey soils at
moderate heights. Finally greyish, silty soils at
the plains south of Kilimanjaro . With other reasons
these soil types and their inherent conditions
determine the type and amount of agricultural production
while they also affect road construction.c
4
The mean annual rainfall varies between
400 - 500 mm. on the plains to 2,500 mm. on the
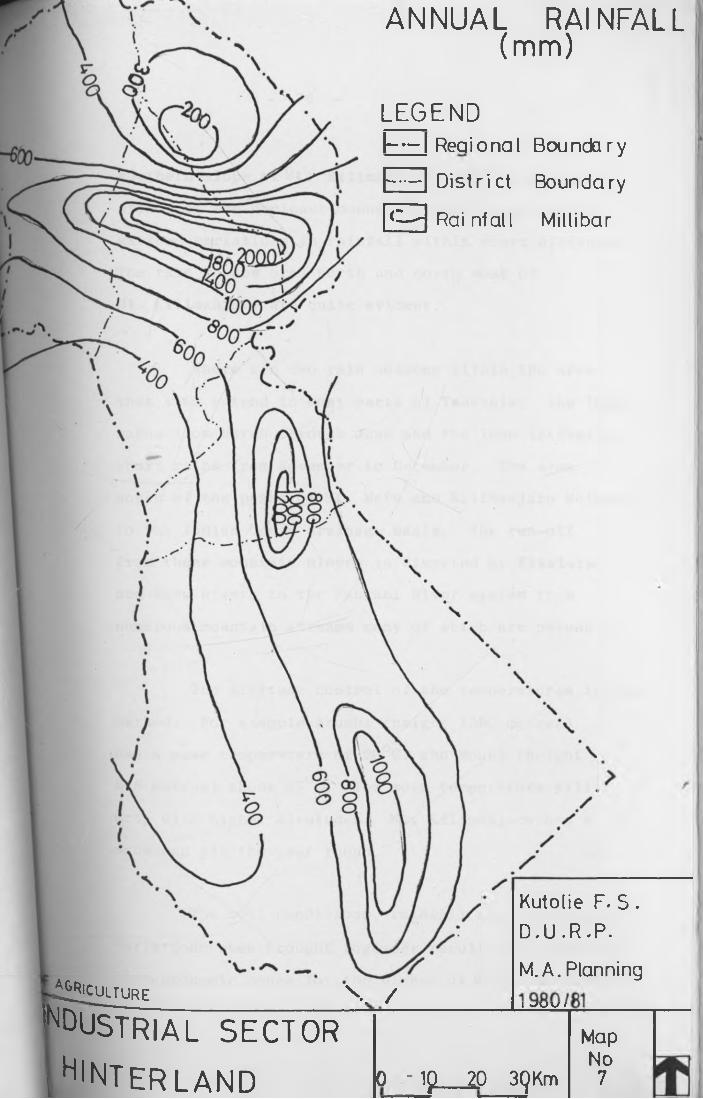
ANNUAL RAINFALL (mm)
L E G E N DI------1 Regional Boundary
E 3 District Boundary
0 3 Rainfall Millibar
Kutolie F. S . D .U.R.P.
^ 'C U L TU R EM. A. Planning
Industrial s ec to r
i HiNTERLAND
s . /____________ « 'SW •MapNo
O - l p 20 3(JKm7
76
southern slope ofMt*' Kilimanjaro. The orographic
effect of the dominant mountain range causes quite
extreme variations in rainfall within short distances.
The rain shadow area north and north west of
Mt# Kilimanjaro are quite evident.
There are two rain seasons within the area
that also extend to most parts of Tanzania: the long-
rains from March through June and the less intensive
short rains from November to December. The area
south of the peaks of M t . Meru and Kilimanjaro belongs
to the Indian Ocean drainage basin. The run-off
from these mountain slopes is diverted by Kikuletwa
and Ruvu Rivers to the Pangani River system from
numerous mountain streams many of which are perennial.
The altitude control of the temperatures is very
marked. For example Arusha (height 1580 metres)
has a mean temperature of 20°C. and Moshi (height
848 metres) about 25°C. The mean temperature will
drop with higher altutudes. Mt. Kilimanjaro has a
snow cap all the year round.
The soil conditions, rainfall and temperature
variations when brought together result into about 8
agro-economic zones for the slopes of Mt.. Kilimanjaro.
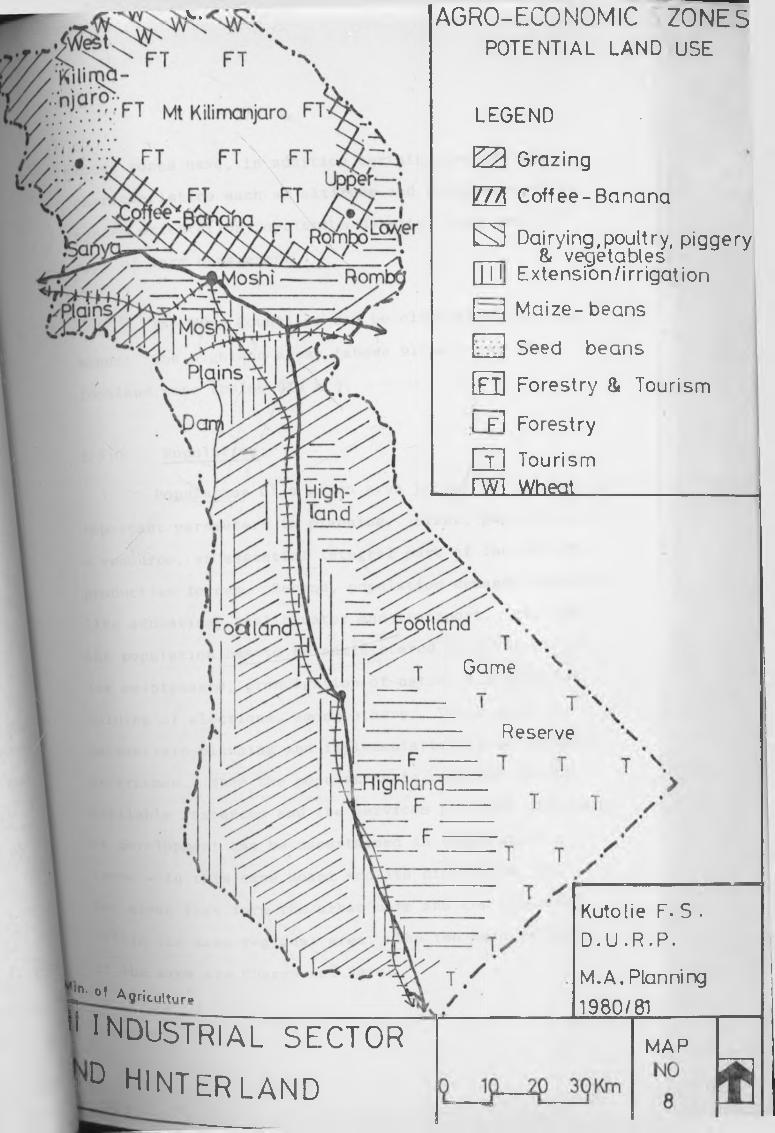
Mosh
Plains
( Fo6lldni Hand
A».
FT FT.....................
H a ^ Mt Kilimanjaro F T o \r/ . : .V. • ^ A a
FT FT \ FT
A G R O -E C O N O M IC Z O N E SPOTENTIAL LAND USE
LEGEND • '
FTTi Grazing
1/7/1 Coffee-Banana
S Dai rying,poultry, piggery & vegetables
Extension/irrigation[— ] Maize-beans
Seed beans
[FT] Forestry 8. Tourism
I fI Forestry p f l Tourism>3rWI WheatHigh
land
Game
Reserve
■V I.Highland t|------- F
Kutolie F. S . D.U.R.P.M. A. Planning 1980/81
MAP
y n- cl Aqric.ult.ir.
V ^DUSTRIAL SECTORvD h in te r la n d
77
These zones have, in addition certain identifiable
characteristics such as altitude and topography, road
system orientation population density, land use and
type of farm management.
The Pare Mountains can be classified into two
zones: the highland areas (above 914 m.) and the
footland zone (below 914 m.).
3:2:0 Population:
Population of a given area is one of the most
important parameters in planning. First, population is
a resource, an essential integral part of the nation's
productive forces. Second, population demands services
like education, healthy water and transport. Finally
the population has to be administered in terms of
law maintenance, promulgation of national principles,
holding of elections, among others. These aspectsO
necessitate planning and implementation of development
programmes. When the population is compared to the
available resources and the services provided the level
of development can be ascertained in comparative
terms - in this case Moshi and its hinterland, the
two areas that form the urban core and the periphery
within the same regional area. The two main tribes
°f the area are Chagga and Pare.
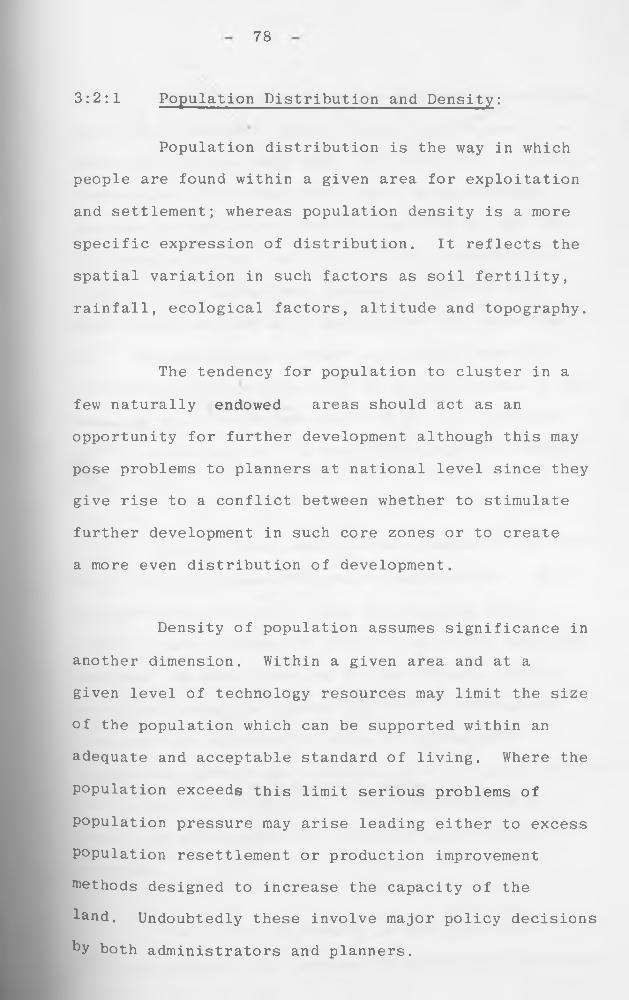
78
3:2:1 Population Distribution and Density:
Population distribution is the way in which
people are found within a given area for exploitation
and settlement; whereas population density is a more
specific expression of distribution. It reflects the
spatial variation in such factors as soil fertility,
rainfall, ecological factors, altitude and topography.
The tendency for population to cluster in a
few naturally endowed areas should act as an
opportunity for further development although this may
pose problems to planners at national level since they
give rise to a conflict between whether to stimulate
further development in such core zones or to create
a more even distribution of development.
Density of population assumes significance in
another dimension. Within a given area and at a
given level of technology resources may limit the size
of the population which can be supported within an
adequate and acceptable standard of living. Where the
population exceeds this limit serious problems of
population pressure may arise leading either to excess
population resettlement or production improvement
methods designed to increase the capacity of the land. Undoubtedly these involve major policy decisions
by both administrators and planners.
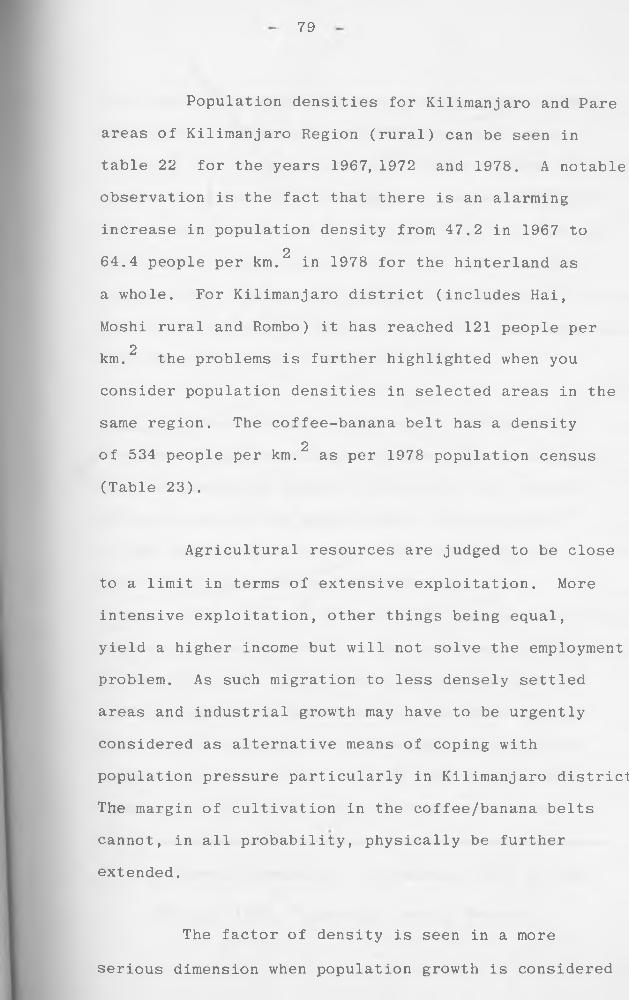
79
Population densities for Kilimanjaro and Pare
areas of Kilimanjaro Region (rural) can be seen in
table 22 for the years 1967, 1972 and 1978. A notable
observation is the fact that there is an alarming
increase in population density from 47.2 in 1967 to264.4 people per km. in 1978 for the hinterland as
a whole. For Kilimanjaro district (includes Hai,
Moshi rural and Rombo) it has reached 121 people per 2km. the problems is further highlighted when you
consider population densities in selected areas in the
same region. The coffee-banana belt has a density2of 534 people per km. as per 1978 population census
(Table 23).
Agricultural resources are judged to be close
to a limit in terms of extensive exploitation. More
intensive exploitation, other things being equal,
yield a higher income but will not solve the employment
problem. As such migration to less densely settled
areas and industrial growth may have to be urgently
considered as alternative means of coping with
population pressure particularly in Kilimanjaro district
The margin of cultivation in the coffee/banana belts
cannot, in all probability, physically be further
extended.
The factor of density is seen in a more
serious dimension when population growth is considered
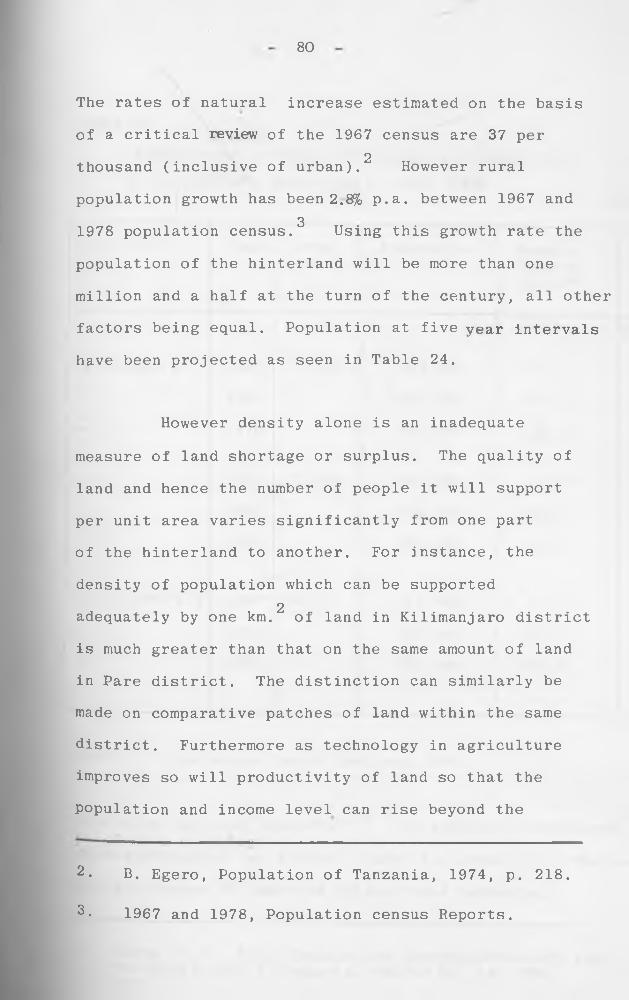
8 0
The rates of natural increase estimated on the basis
of a critical review of the 1967 census are 37 per2thousand (inclusive of urban). However rural
population growth has been 2.8% p.a. between 1967 and31978 population census. Using this growth rate the
population of the hinterland will be more than one
million and a half at the turn of the century, all other
factors being equal. Population at five year intervals
have been projected as seen in Table 24.
However density alone is an inadequate
measure of land shortage or surplus. The quality of
land and hence the number of people it will support
per unit area varies significantly from one part
of the hinterland to another. For instance, the
density of population which can be supported2adequately by one km.~ of land in Kilimanjaro district
is much greater than that on the same amount of land
in Pare district. The distinction can similarly be
made on comparative patches of land within the same
district. Furthermore as technology in agriculture
improves so will productivity of land so that the
population and income level can rise beyond the * 2
2. B. Egero, Population of Tanzania, 1974, p. 218.
2. 1967 and 1978, Population census Reports.
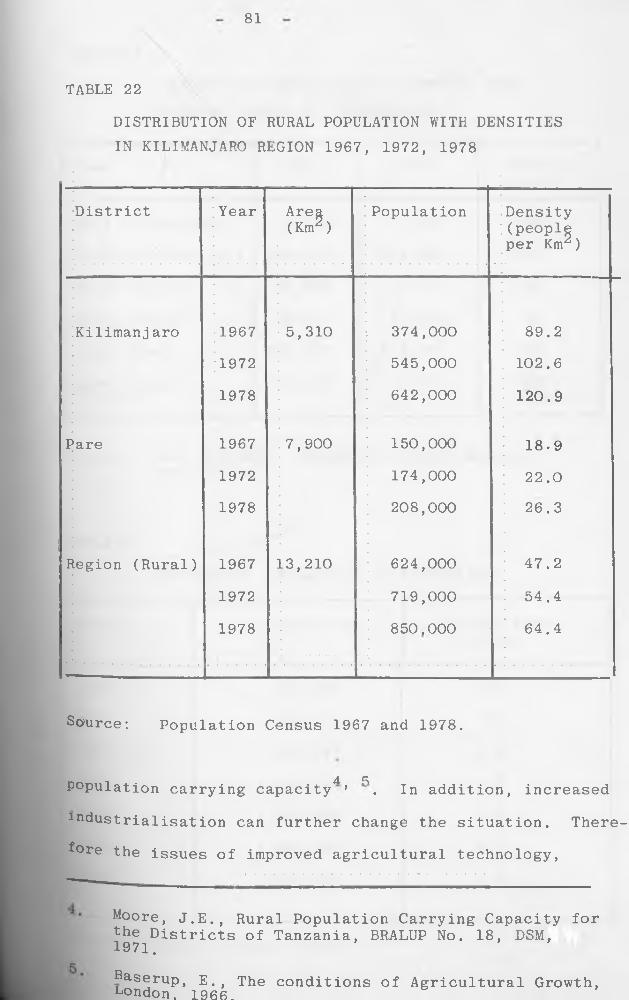
81
TABLE 22
DISTRIBUTION OF RURAL POPULATION WITH DENSITIES IN KILIMANJARO REGION 1967, 1972, 1978
District Year Area(Km2 )
Population Density (people per Km2)
Kilimanj aro
Pare
Region (Rural)
1967
1972
1978
1967
1972
1978
1967
1972
1978
5,310
7,900
13,210
374.000
545.000
642.000
150.000
174.000
208.000
624.000
719.000
850.000
89.2
102.6
120,9
18.9
22. 0
26.3
47.2
54.4
64.4
Source: Population Census 1967 and 1978.
A Rpopulation carrying capacity * . In addition, increased
industrialisation can further change the situation. There
fore the issues of improved agricultural technology,
Moore, J.E., Rural Population Carrying Capacity for the Districts of Tanzania, BRALUP No. 18, DSM,1971.
Baserup, E., The conditions of Agricultural Growth, London. 1966.
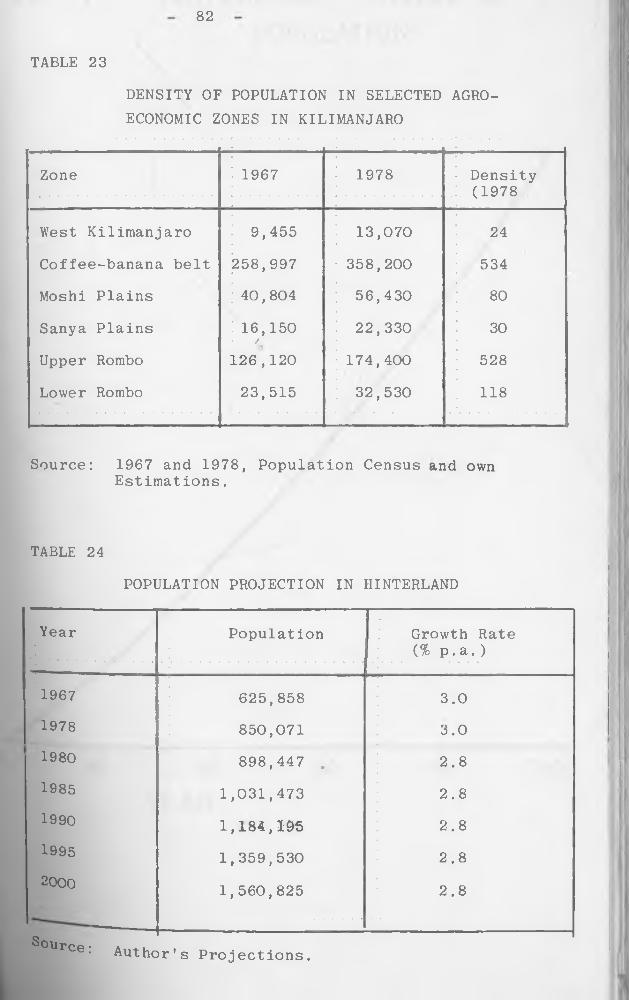
82
DENSITY OF POPULATION IN SELECTED AGRO- ECONOMIC ZONES IN KILIMANJARO
TABLE 23
Zone 1967 1978 Density(1978
West Kilimanjaro 9,455 13,070 24
Coffee-banana belt 258,997 358,200 534
Moshi Plains 40,804 56,430 80
Sanya Plains 16,150/ 22,330 30
Upper Rombo 126,120 174,400 528
Lower Rombo 23,515 32,530 118
Source: 1967 and 1978, Population Census and ownEstimations.
TABLE 24
POPULATION PROJECTION IN HINTERLAND
Year Population Growth Rate (% p .a. )
1967
1978
1980
1985
1990
1995
2000
625,858
850,071
898,447 .
1,031,473
1,184,195
1,359,530
1,560,825
3.0
3.0
2.8
2.8
2.8
2.8
2.8
i
t
i
Source: Author's Projections.
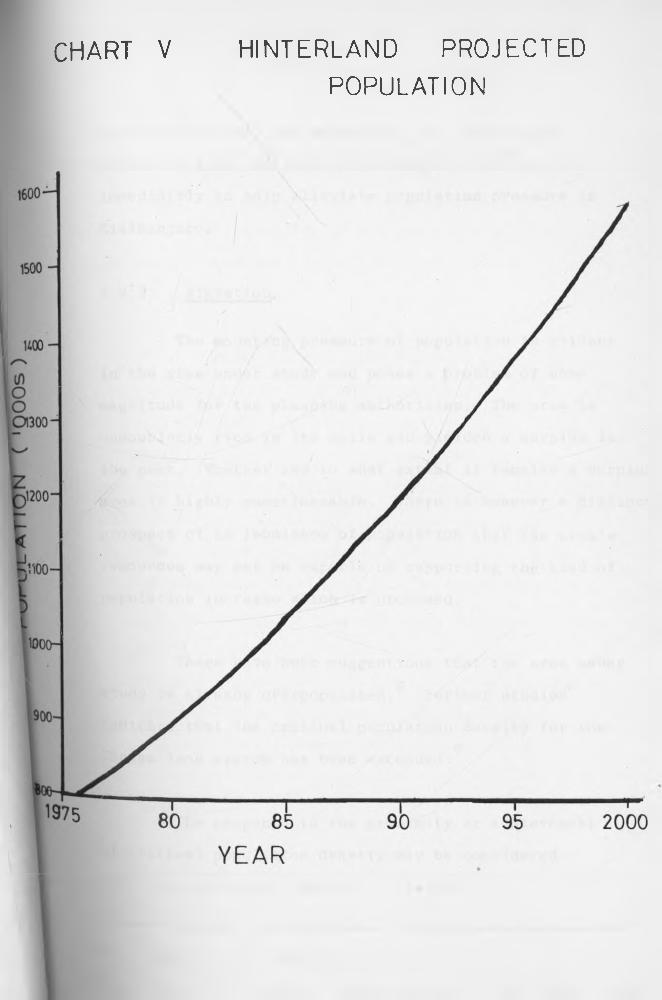
C H A R T V H IN T E R L A N D P R O JE C T E D
P O P U L A T IO N
83
industrialisation and emigration to less densely
populated areas must be given serious consideration
immediately to help alleviate population pressure in
Kilimanj aro.
3:2:2 Migration:
The mounting pressure of population is evident
in the area under study and poses a problem of some
magnitude for the planning authorities. The area is
undoubtedly rich in its soils and yielded a surplus in
the past. Whether and to what extent it remains a surplus
area is highly questionnable. There is however a distinct
prospect of an imbalance of population that the area's
resources may not be capable of supporting the kind of
population increase which is promised.
There have been suggestions that the area underg
study is already overpopulated. Further studies
indicate that the critical population density for them
Chagga land system has been exceeded.
The response to the proximity or achievement
°f critical population density may be considered
under the following factors: Firstly
6 .
7.Moore, J.E. BRALUP, op. cit.
Allan, W., African Husbandman Edniburg, 1967.
84
migration voluntary or otherwise, to areas where
cultivable land is available or to towns in search
of industrial employment. Secondly, the stepping up
of agricultural inputs in the area; and thirdly,
promotion of other forms of economic activity notably
manufacturing industry.
Looking at 1967 and 1978 population census it
is evident that Kilimanjaro is an area of net emigration.
Viewing the table of distribution of the population
of Kilimanjaro region by place of birth the following
aspects can be ascertained. Kilimanjaro Region was
an area of net emigration. Net loss was 1.7% of
region’s recorded population. Secondly, of total
apparent movement within the region and from outside
its borders something over 60% was accounted for by
Kilimanjaro district. Thirdly, urban growth in
Kilimanjaro Region played a relatively small part in
the total movement of population; in Kilimanjaro
district 20% of total apparent movement (total numbers
born elsewhere than in district) is accounted for by
the town of Moshi.
The sources and destinations can be calculated,.
2% of Kilimanjaro Regions total loss is credited to
Arusha and accounts for 27% of that region's total
Sain. Much of the balance of net emigration from 1/ • « t
imanjaro is to Coast Region, mainly Dar-es-Salaam City
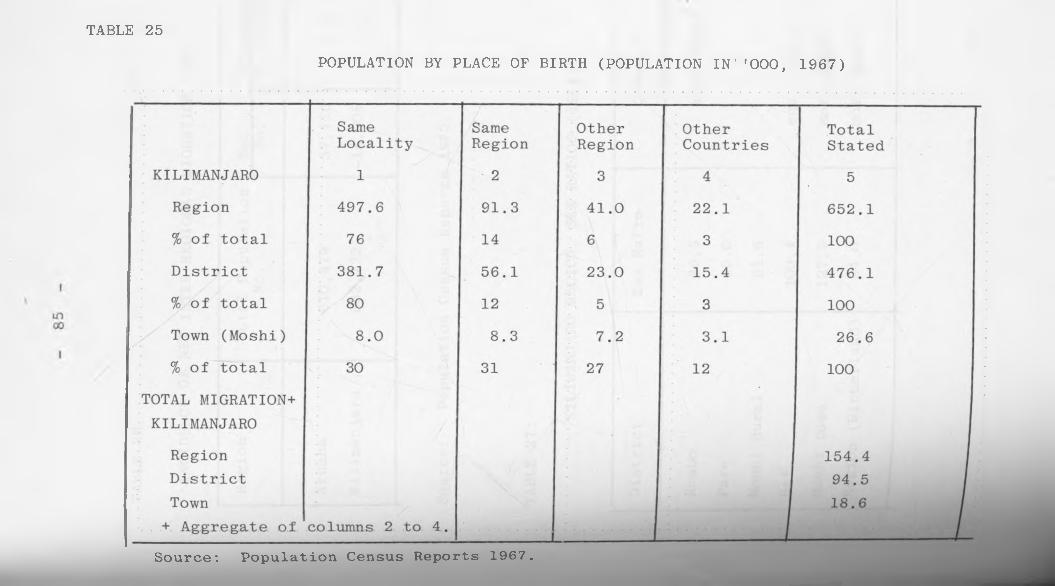
TABLE 25
POPULATION BY PLACE OF BIRTH (POPULATION IN’'000, 1967)
Source: Population Census Reports 1967.
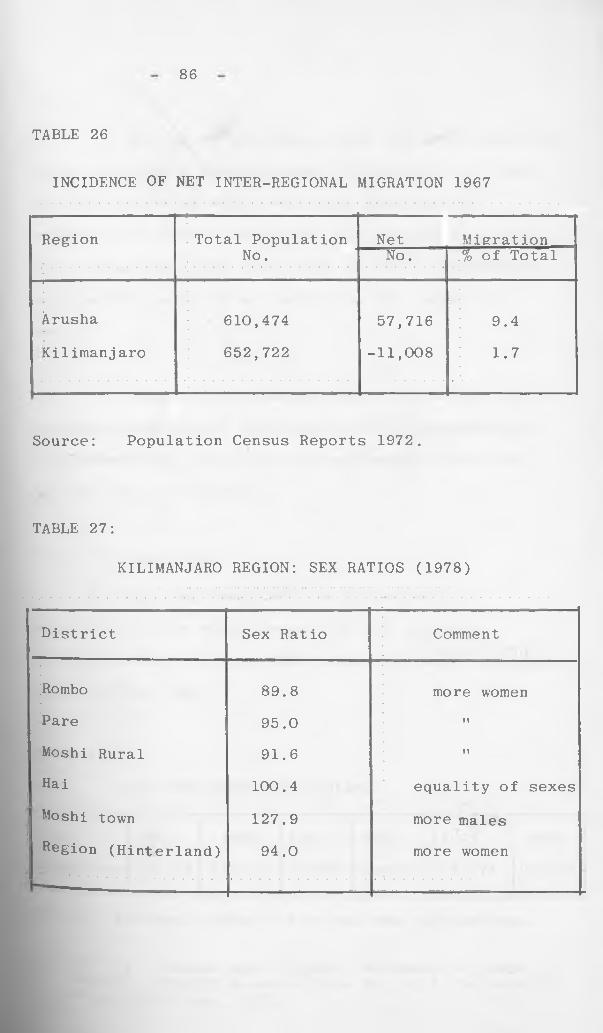
8 6
INCIDENCE OF NET INTER-REGIONAL MIGRATION 1967
TABLE 26
Region Total Population Net MigrationNo. No. % of Total
Arusha
Kilimanj aro
610,474
652,722
57,716
-11,008
9.4
1.7
Source: Population Census Reports 1972.
TABLE 27:
KILIMANJARO REGION: SEX RATIOS (1978)
District Sex Ratio Comment
Rombo 89.8 more womenPare 95.0 tt
Moshi Rural 91.6 M
Hai 100.4 equality of sexesMoshi town 127.9 more malesRegion (Hinterland) 94.0 more women
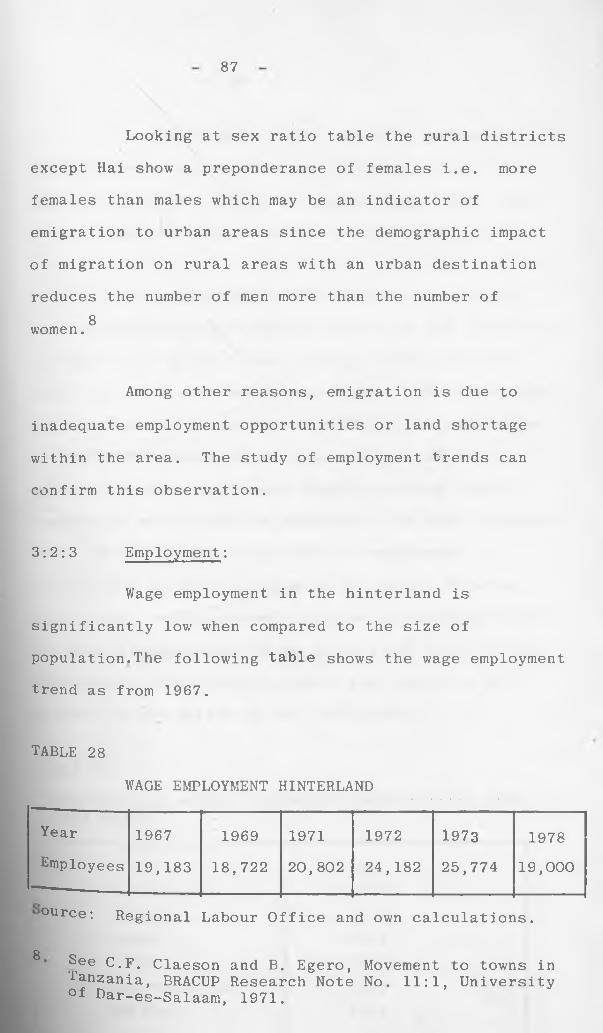
87
Looking at sex ratio table the rural districts
except Hai show a preponderance of females i.e. more
females than males which may be an indicator of
emigration to urban areas since the demographic impact
of migration on rural areas with an urban destination
reduces the number of men more than the number of 8women.
Among other reasons, emigration is due to
inadequate employment opportunities or land shortage
within the area. The study of employment trends can
confirm this observation.
3:2:3 Employment:
Wage employment in the hinterland is
significantly low when compared to the size of
population.The following table shows the wage employment
trend as from 1967.
TABLE 28
WAGE EMPLOYMENT HINTERLAND
Year 1967 1969 1971 1972 1973 1978Employees 19,183 18,722 20,802 24,182 25,774 19,000
ource: Regional Labour Office and own calculations.
gSee C.F. Claeson and B. Egero, Movement to towns in Tanzania, BRACUP Research Note No. 11:1, University of Dar-es-Salaam, 1971.
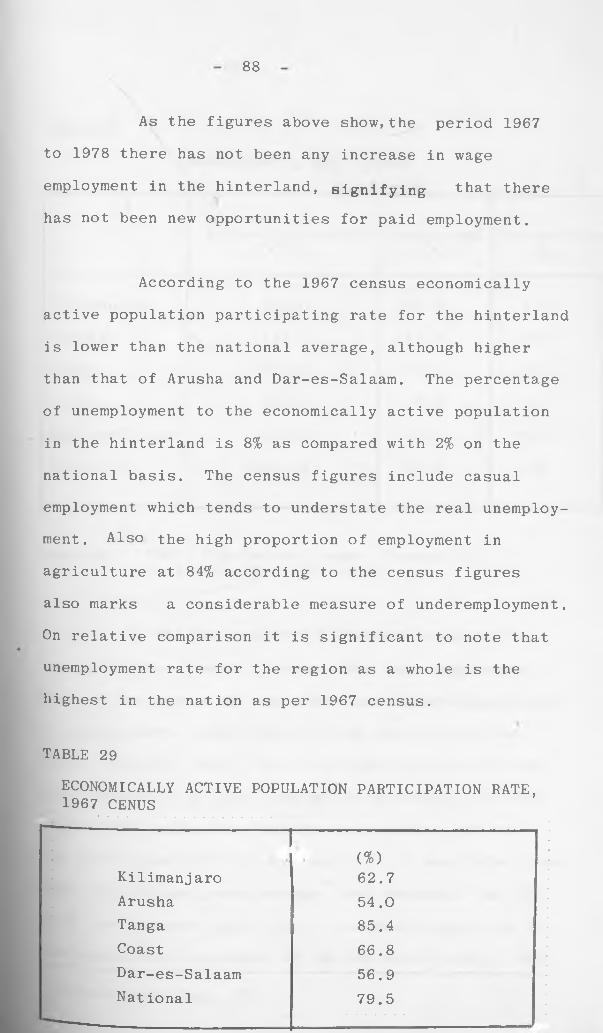
8 8
As the figures above show,the period 1967
to 1978 there has not been any increase in wage
employment in the hinterland, signifying that there
has not been new opportunities for paid employment.
According to the 1967 census economically
active population participating rate for the hinterland
is lower than the national average, although higher
than that of Arusha and Dar-es-Salaam. The percentage
of unemployment to the economically active population
in the hinterland is 8% as compared with 2% on the
national basis. The census figures include casual
employment which tends to understate the real unemploy
ment. Also the high proportion of employment in
agriculture at 84% according to the census figures
also marks a considerable measure of underemployment.
On relative comparison it is significant to note that
unemployment rate for the region as a whole is the
highest in the nation as per 1967 census.
TABLE 29
e c o n o m i c a l l y a c t i v e p o p u l a t i o n p a r t i c i p a t i o n r a t e ,1967 CENUS
- 1(%)
Kilimanjaro 62.7Arusha 54.0Tanga 85.4Coast 66.8Dar-es-Salaam 56.9National 79.5
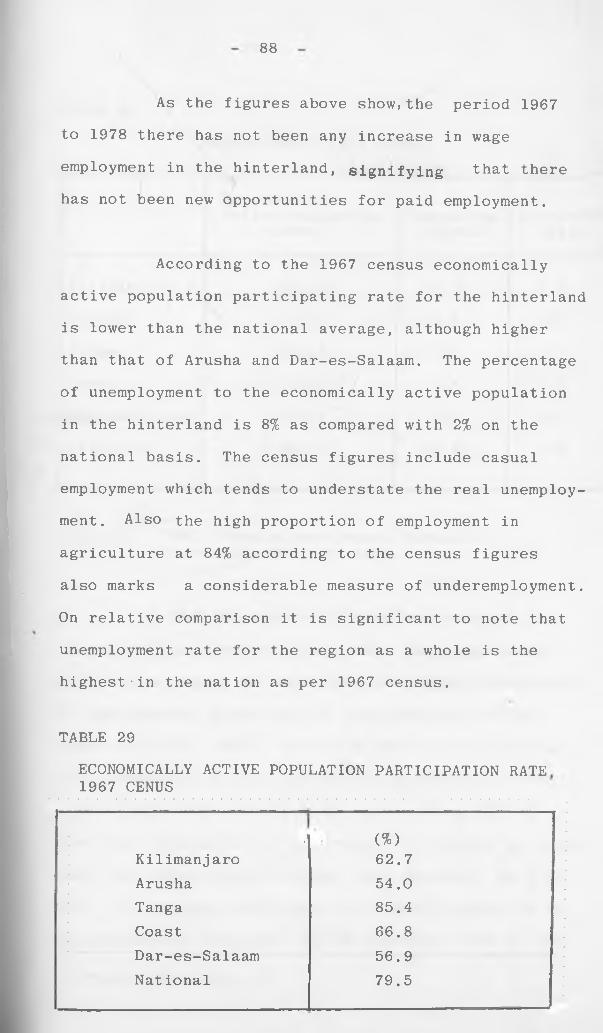
8 8
As the figures above show,the period 1967
to 1978 there has not been any increase in wage
employment in the hinterland, signifying that there
has not been new opportunities for paid employment.
According to the 1967 census economically
active population participating rate for the hinterland
is lower than the national average, although higher
than that of Arusha and Dar-es-Salaam. The percentage
of unemployment to the economically active population
in the hinterland is 8% as compared with 2% on the
national basis. The census figures include casual
employment which tends to understate the real unemploy
ment. Also the high proportion of employment in
agriculture at 84% according to the census figures
also marks a considerable measure of underemployment.
On relative comparison it is significant to note that
unemployment rate for the region as a whole is the
highest•in the nation as per 1967 census.
TABLE 29
ECONOMICALLY ACTIVE POPULATION PARTICIPATION RATE 1967 CENUS
• (%)Kilimanjaro 62.7Arusha 54.0Tanga 85.4Coast 66.8Dar-es-Salaam 56.9Nat ional 79.5
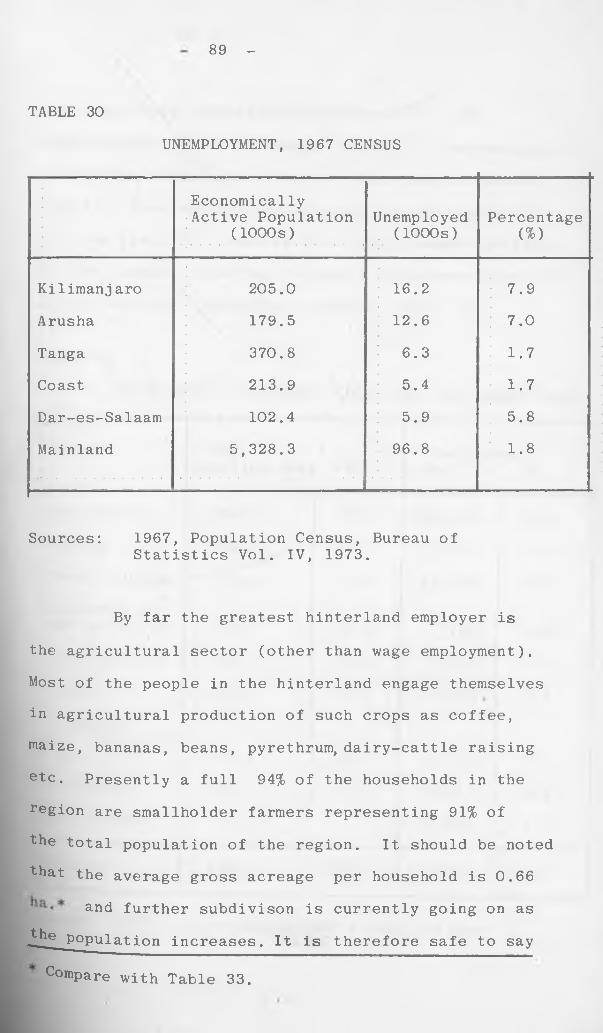
89 -
UNEMPLOYMENT, 1967 CENSUS
TABLE 30
Economically Active Population
(1000s)lJnemployed
(1000s)Percentage
(%)
Kilimanj aro 205.0 16.2 7.9
Arusha 179.5 12.6 7.0
Tanga 370.8 6.3 1.7
Coast 213.9 5.4 1.7
Dar-es-Salaam 102.4 5.9 5.8
Mainland 5,328.3 96.8 1.8
Sources: 1967, Population Census, Bureau ofStatistics Vol. IV, 1973.
By far the greatest hinterland employer is
the agricultural sector (other than wage employment).
Most of the people in the hinterland engage themselves
in agricultural production of such crops as coffee,
maize, bananas, beans, pyrethrum, dairy-cattle raising
etc. Presently a full 94% of the households in the
region are smallholder farmers representing 91% of
"the total population of the region. It should be noted
that the average gross acreage per household is 0.66
and further subdivison is currently going on as
^he population increases. It is therefore safe to say
Compare with Table 33.
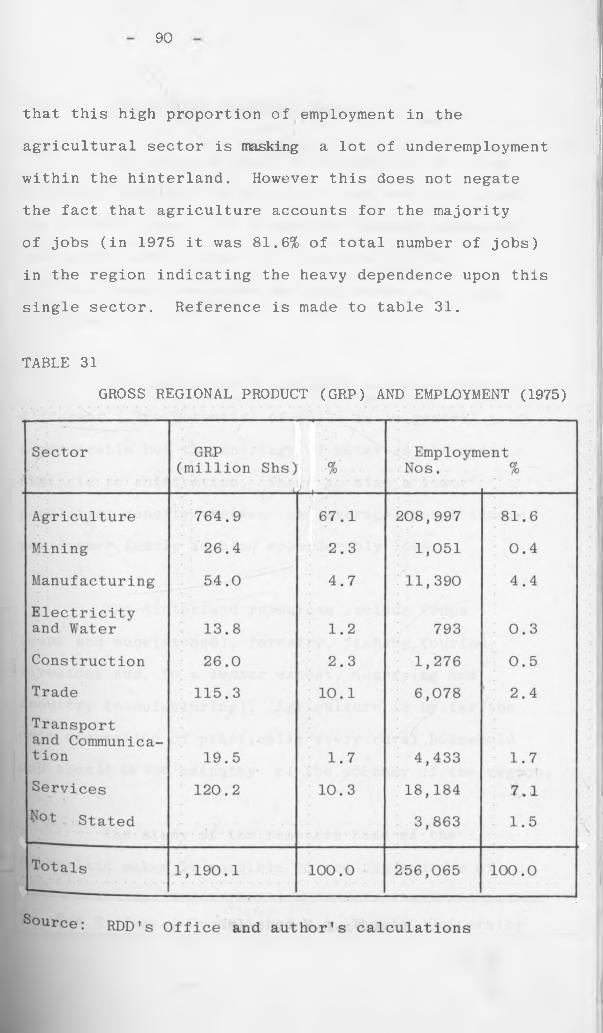
90
that this high proportion of employment in the
agricultural sector is masking a lot of underemployment
within the hinterland. However this does not negate
the fact that agriculture accounts for the majority
of jobs (in 1975 it was 81.6% of total number of jobs)
in the region indicating the heavy dependence upon this
single sector. Reference is made to table 31.
TABLE 31
GROSS REGIONAL PRODUCT (GRP) AND EMPLOYMENT (1975)
91
3:3:0 Hinterland Resource Base
The mountain chain of Kilimanjaro and Pare
Mountains comprise the highland areas and the plains,
the lowland areas. The former are densely populated
and mainly agricultural with adequate rainfall,
excellent water resources and good soils with high
potential.^
The conditions in the vast lowland areas are
different. The potential of soils is in general
considerable but the shortage of water is the main
obstacle to cultivation. There is also a lower
population density whereas net average annual income
per farmer family is also considerably lower.
The hinterland resources include crops
(cash and subsistence), forestry, fishing, tourism,
livestock and, to a lesser extent, quarrying and
industry (manufacturing). Agriculture is by far the
main occupation of practically every rural household
and thus it is the mainstay of the economy of the region.
The study of the resource base of the
hinterland makes it possible to see the sources of 9
9* See V. James, Unpublished M.A. Thesis, University of Nairobi, 1979, p. 52.
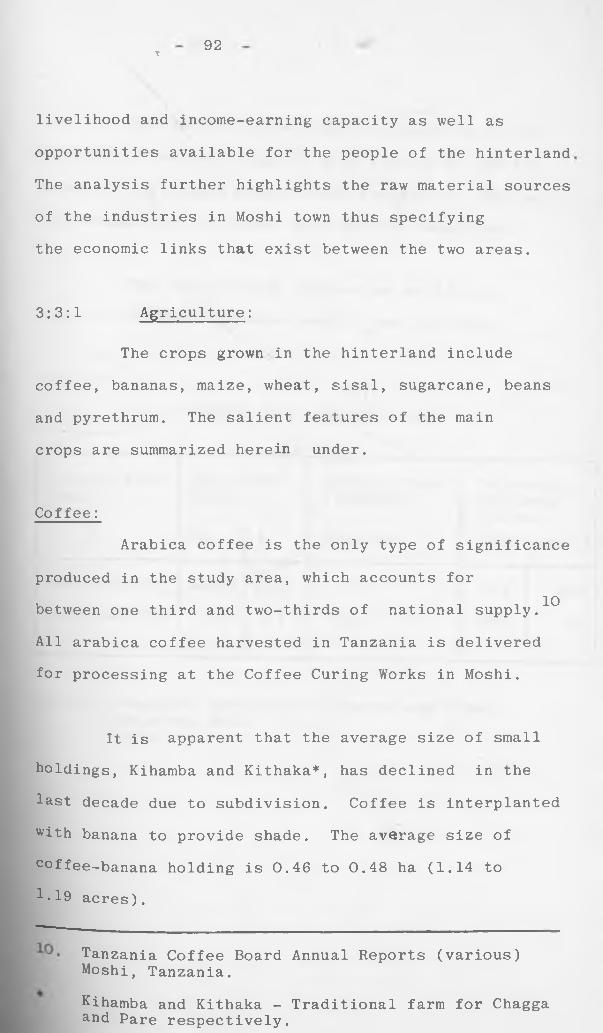
r 92
livelihood and income-earning capacity as well as
opportunities available for the people of the hinterland
The analysis further highlights the raw material sources
of the industries in Moshi town thus specifying
the economic links that exist between the two areas.
3:3:1 Agriculture:
The crops grown in the hinterland include
coffee, bananas, maize, wheat, sisal, sugarcane, beans
and pyrethrum. The salient features of the main
crops are summarized herein under.
Coffee:
Arabica coffee is the only type of significance
produced in the study area, which accounts for
between one third and two-thirds of national supply.1
All arabica coffee harvested in Tanzania is delivered
for processing at the Coffee Curing Works in Moshi.
It is apparent that the average size of small
holdings, Kihamba and Kithaka*, has declined in the
last decade due to subdivision. Coffee is interplanted
with banana to provide shade. The average size of
coffee-banana holding is 0.46 to 0.48 ha (1.14 to 1*19 acres).
Tanzania Coffee Board Annual Reports (various)Moshi, Tanzania.
Kihamba and Kithaka - Traditional farm for Chagga and Pare respectively.
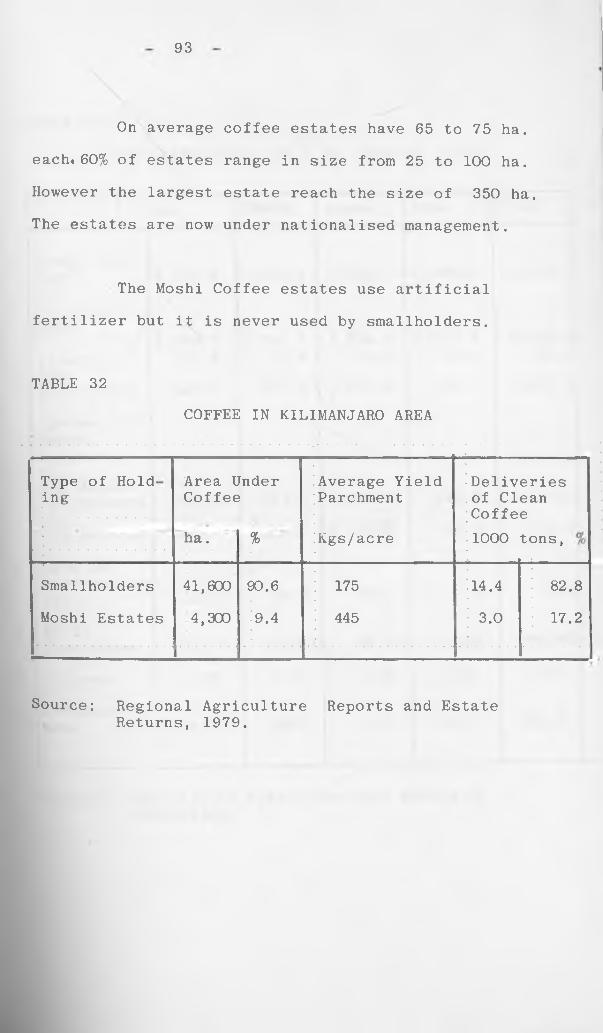
93
On average coffee estates have 65 to 75 ha.
each*60% of estates range in size from 25 to 100 ha.
However the largest estate reach the size of 350 ha.
The estates are now under nationalised management.
The Moshi Coffee estates use artificial
fertilizer but it is never used by smallholders.
TABLE 32
COFFEE IN KILIMANJARO AREA
Type of Holding
Area Under Coffee
ha. %
Average Yield Parchment
Kgs/acre
Deliveries of Clean Coffee1000 tons,
Smallholders
Moshi Estates
41,600
4,300
90.6
9.4
175
445
14.4
3.0
82.8
17.2
Source: Regional Agriculture Reports and EstateReturns, 1979.
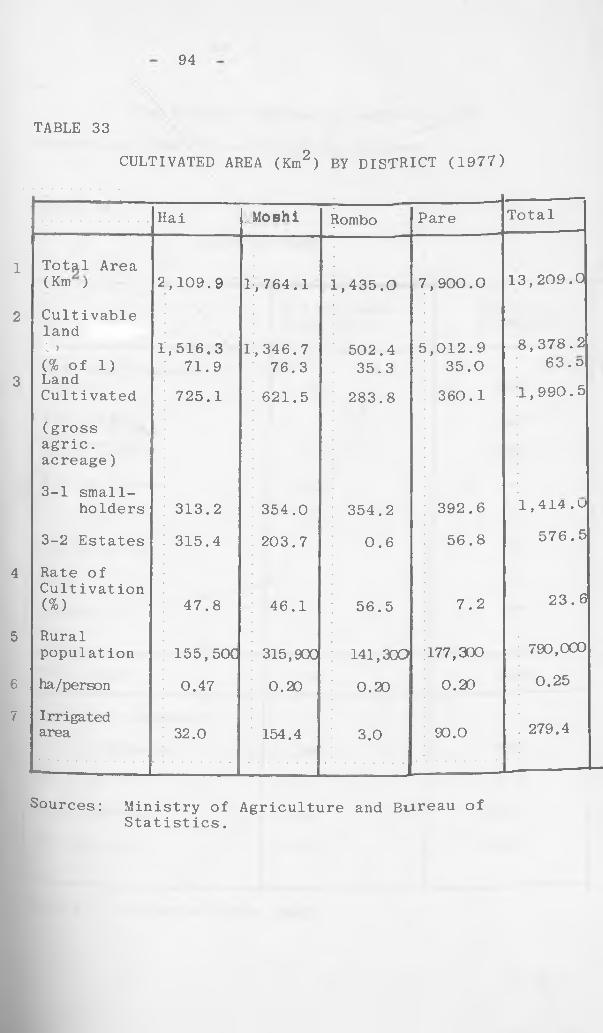
94
CULTIVATED AREA (Km2) BY DISTRICT (1977)
TABLE 33
Hai .Moshi Rombo Pare Total
1 Total Area(Km ; 2,109.9 1,764.1 1,435.0 7r,900.0 13,209.0
2 CultivablelandL i 1,516 o 3 1,346.7 502.4 5,012.9 8,378.2(% of 1) 71.9 76.3 35.3 35.0 63.o
3 LandCultivated 725.1 621.5 283.8 360.1 1,990.5
(grossagric.acreage)
3-1 small-holders 313.2 354.0 354.2 392.6 l,414.u
3-2 Estates 315.4 203.7 0.6 56.8 576.5
4 Rate ofCultivation(%) 47.8 46.1 56.5 7.2 23.6
5 Ruralpopulation 155,50C 315,900 141,300 177,300 790,000
6 ha/person 0.47 0.20 0.20 0.20 0.25
7 Irrigatedarea 32.0 154.4 3.0 90.0 279.4
Sources: Ministry of Agriculture and Bureau of Statistics.
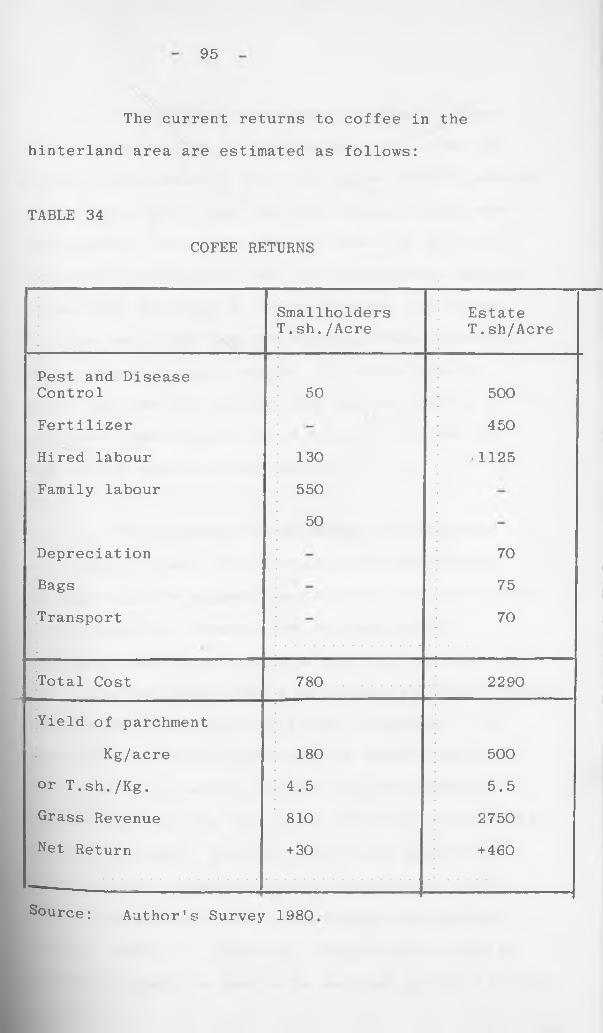
95
The current returns to coffee in the
hinterland area are estimated as follows:
TABLE 34
COFEE RETURNS
Smallholders T .sh./Acre
Estate T .sh/Acre
Pest and Disease Control
Fertilizer
Hired labour
Family labour
Depreciation
Bags
Transport
50
130
550
50
500
450
,1125
70
75
70
Total Cost 780 2290
Yield of parchment
Kg/acre or T.sh./Kg.
Grass Revenue
Net Return
180
4.5
810
+ 30
500
5.5
2750
+ 460
Source: Author's Survey 1980
96
The margins shown above fluctuate from
season to season due to fluctuations in yields and
prices; for example in the last season 1980/81 average
prices were T.Sh. 9 per kg. but average yields were
considerably lower than what is stated in the table.
But these fluctuations some how balanced one another.
Actual cash receipts by the smallholder are higher
than the net margin implies because family labour is
not an immediate cost centre. It should also be
noted that the cost of pest and disease control is the
estimated cash cost to the farmer; it excludes the
cost to the state of the subsidy.
A •
The interest in reviving the programme
of central pulpery construction as the best means
of improving the overall quality level of smallholder
coffee should be treated with extreme caution.
Presently most of the existing pulperies are improperly
run, under utilised, poorly maintained and unprofitable.
The problem lies mainly with poor management. The
potential technical improvement in coffee quality to
be derived from central pulpery provides strong
argument in the long run, along the lines successfully
pursued in Kenya. However, a cautious approach to
the expansion programme can be recommended, in the
short term by first overcoming managerial problems
through more effective supervision; existing
Pulperies should be seen to be working economically and
97
efficiently before a programme of building 47* pulperies
is embarked upon by Kilimanjaro Region.
The long term outlook for coffee cannot be
said to be a very bright one. Firstly, the long term
external market constraints are likely to limit volume
growth to 3% p.a. for the long time to come.
Secondly, export prices are volatile. The best prospect
for improved foreign exchange earnings lies in raising
the average quality of coffee offered to buyers; there
is need also to look into further processing of coffee
into the final product for both local and external
consumption.
The raising of the quality of coffee requires
for its achievement a progressive and permanent
improvement in husbandy, and more in the way of inputs.
However the trend of cost and prices has been such as
to squeeze farm income quite sharply in recent years.
The effect is likely to be disincentive to effort and
investment. In addition the placing of estate
management from private to public sector largely
dependent on the narrow base of local skills raises a
serious question of whether the quantity and quality
°f estate production can be maintained in the near
future. Already most of the nationalised coffee
estates are having very low production returns as a
result of gross mismanagement.*
Kilimanjaro Region intends to construct 47Pulperies in the near future (RDD’s office).
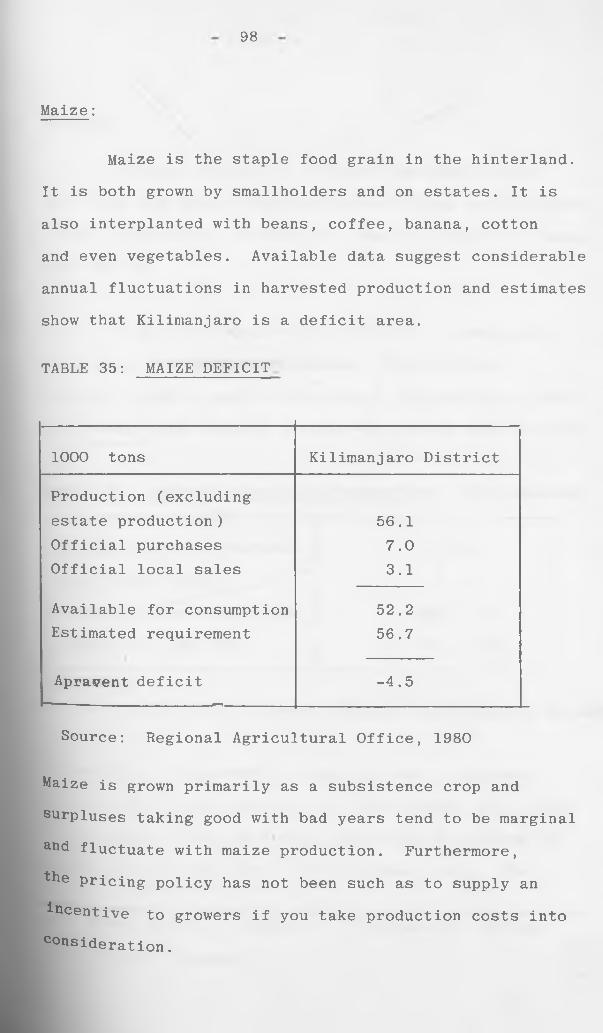
98
Maize:
Maize is the staple food grain in the hinterland.
It is both grown by smallholders and on estates. It is
also interplanted with beans, coffee, banana, cotton
and even vegetables. Available data suggest considerable
annual fluctuations in harvested production and estimates
show that Kilimanjaro is a deficit area.
TABLE 35: MAIZE DEFICIT
1000 tons Kilimanjaro District
Production (excludingestate production) 56.1Official purchases 7.0Official local sales 3.1
Available for consumption 52.2Estimated requirement 56.7
Apravent deficit -4.5
Source: Regional Agricultural Office, 1980
Maize is grown primarily as a subsistence crop and
surpluses taking good with bad years tend to be marginal
aud fluctuate with maize production. Furthermore,
the pricing policy has not been such as to supply an
incentive to growers if you take production costs into
consideration.
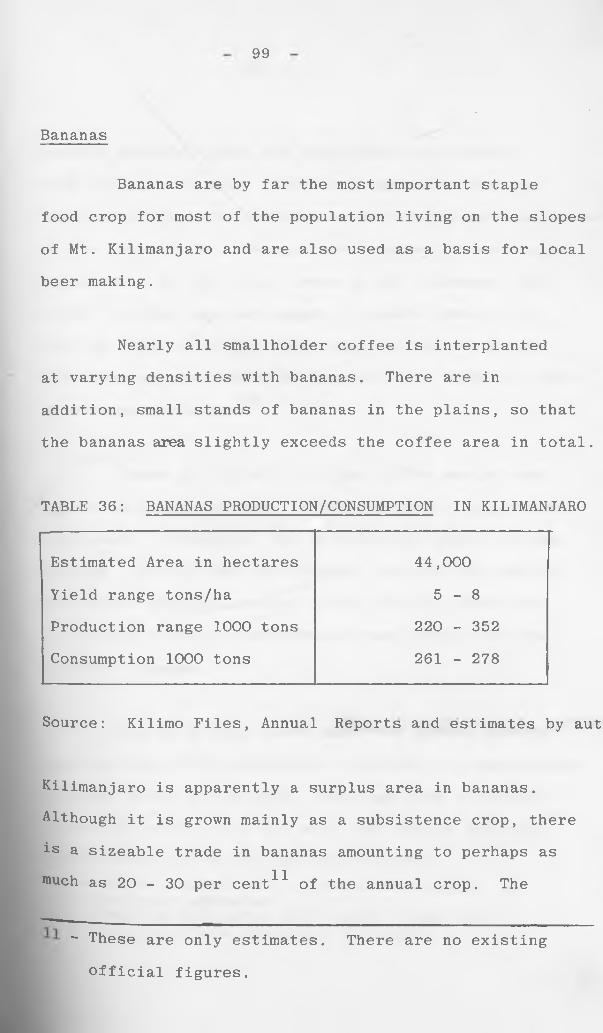
99
, •Bananas
Bananas are by far the most important staple
food crop for most of the population living on the slopes
of Mt. Kilimanjaro and are also used as a basis for local
beer making.
Nearly all smallholder coffee is interplanted
at varying densities with bananas. There are in
addition, small stands of bananas in the plains, so that
the bananas area slightly exceeds the coffee area in total.
TABLE 36: BANANAS PRODUCTION/CONSUMPTION IN KILIMANJARO
Estimated Area in hectares 44,000
Yield range tons/ha 5 - 8
Production range 1000 tons 220 - 352
Consumption 1000 tons 261 - 278
Source: Kilimo Files, Annual Reports and estimates by aut
Kilimanjaro is apparently a surplus area in bananas. Although it is grown mainly as a subsistence crop, there is a sizeable trade in bananas amounting to perhaps as rouch as 20 - 30 per cent11 of the annual crop. The
- These are only estimates. There are no existing official figures.
100
periodic markets within the hinterland are flooded
with bananas for sale. They are headloaded from the
smallholder farms to the nearest markets as part and parce
of the local trade. Bananas are also sent - over large
distances - to the plains areas at the estimated rate
of 35 - 40,000 tons per annum, to Moshi town at the
rate of 1,500 - 10,000 tons a year, to Dar es Salaam,
and other points outside Kilimanjaro at a rate of 2,000 -123,000 tons per annum.
There is virtually nothing in the way of cash
inputs in banana farming. Claims on family labour are
also small. Therefore, net returns are close to gross
returns. Prices vary with season, variety and quality.
The annual average is about T.Shs.0,69/kg. which for
a yield of 5 tons, represents a gross return of T.Shs.
3,350 per annuam.
Let it be made clear here that banana farming
has had very little attention of planners or agricultural
advisory staff in the past. This has been a colonial
-Legacy for which crops not meant for export have had
little attention of the central goverment.
13 "* '*'so onlY estimates.~ This is contrasted with export crops, all
virtually have extension officers.
101
However, the scope for improvement is considerable,
average yields of pure stand in East Africa can be
15 - 20 tons/ha while yields of 38 to 50 have been 14achieved. The 7 tons of bananas now harvested from
a hectare in Kilimanjaro is equivalent to 2 tons of maize
in calorific terms. Two tons of maize a hectare could
only, however, be achieved after a long period of years
of more intensive extension effort than is now the norm in
Tanzania. A programme directed to the improvement of
banana yields, therefore, makes good sense and essential.
Banana production will have to expand by 40% to 50% in
the next 10 years merely to maintain the dietary
standards of a rising population.
Sugar
The sugar industry in Kilimanjaro is dominated
by the operation of the Tanganyika Planting Company Ltd.
(TPC) which is. both the sole producer of refined sugar
in the area and also has a crucial national importance
in producing half the country’s domestic sugar supplies.
The TPC factory is located about 20 km. from
Moshi town and is connected to the latter by an all
14 - Lyamungu Coffee Research Station Reports.
102
weather road. The gross area of the TPC estate is
20,000 acres (8095 ha.) of which some 13,000 acres
are under sugarcane. There are plans to extend
cultivation by taking over 1480 acres of the neigh
bouring Kahe Sisal Estate and 4,000 - 5000 acres of
the East African Kenaf Farm.
Yields on the T.P.C. estate are high: 45 - 50
tons of sugarcane an acre per annum, equivalent to
4 - 4i tons of refined sugar at an extraction rate of
9%. Sugar production is currently at a rate of 55,000
tons a year having risen fairly steadily over a period
of 10 years by 60%. Cane is grown entirely under
irrigation. Half the present acreage and all future
expansion is dependent on water from boreholes.
Cutting is by hand throughout the year with the
exception of a 2 or 3 weed period for plant maintenance.
For this reason, TPC employs 3,5000 people and is
the largest single employer in the whole region.
Since there are no outgrowers, any future expansion
implies more employment for the factory.
Apart from sugar, the factory has other products
too. For every 10 tons of sugar produced, there are
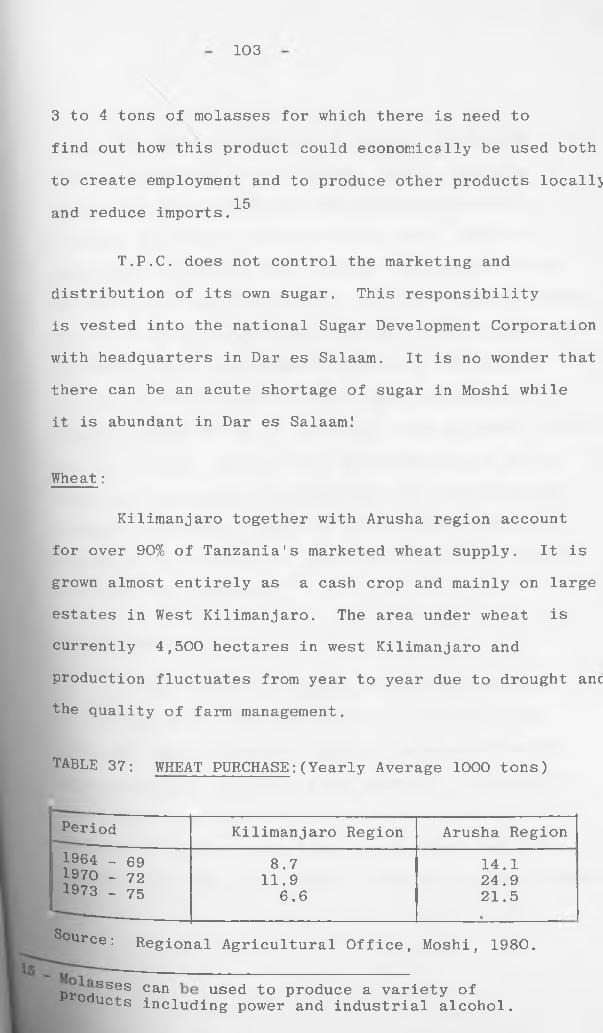
103
3 to 4 tons of molasses for which there is need to
find out how this product could economically be used both
to create employment and to produce other products locally
and reduce imports.^
T.P.C. does not control the marketing and
distribution of its own sugar. This responsibility
is vested into the national Sugar Development Corporation
with headquarters in Dar es Salaam. It is no wonder that
there can be an acute shortage of sugar in Moshi while
it is abundant in Dar es Salaam!
Wheat:
Kilimanjaro together with Arusha region account
for over 90% of Tanzania's marketed wheat supply. It is
grown almost entirely as a cash crop and mainly on large
estates in West Kilimanjaro. The area under wheat is
currently 4,500 hectares in west Kilimanjaro and
production fluctuates from year to year due to drought anc
the quality of farm management.
TABLE 37: WHEAT PURCHASE:(Yearly Average 1000 tons)
Period Kilimanjaro Region Arusha Region1964 - 69 8.7 14.11970 - 72 11.9 24.91973 - 75 6.6 21.5
•®°urce: Regional Agricultural Office, Moshi, 1980.
ProdSSeS ?an used to produce a variety ofUcts including power and industrial alcohol.
104
All wheat cultivation is heavily mechanised in the
form of mechanical seed drilling, tractor spraying of
herbicides and insecticides and combine harvesting.
Although fertilizer input is rarely used, costs of
production have risen more rapidly than market prices
due mainly to fast increase in fuel costs. Most of wheat
harvested is milled in Arusha and the flour surplus over
and above local requirements is sold in the nearby
regions of Tanga, Singida, Shinyanga, and Mwanza.
National wheat demand is alarmingly high at about 90,000
tons per annum. Most of this demand has to be met by
imports, once again, constraining the little foreign
currency available. There is ample capacity for
expansion to increase the area under wheat and improve
the yield per unit area.
Other Crops:
A wide variety of pulses are grown primarily
for subsistence. They are important for local diet,
although their importance tends to be underestimated
by authorities. The pulses are generally interplanted
with maize with notoriously low yields. Most of the
exchange in pulses takes place in the local periodic
markets which are found almost everywhere in the hinterland.
105
Export beans are grown in West Kilimanjaro and in
some of the coffee estates , They are mainly grown for th purposes of supplying seed and for canning.
Pyrethrum is grown to a smaller extent, in West Kilimanjaro
and Rombo, but there has been a decline in production
attributable to level and terms of payment and to the
fact that the crop makes a heavy demand on labour. The
dried pyrethrum flowers have to be sent to Tanganyika
Eztract Company's plant at Arusha burdening the farmer
on extra cost of transportation. Kilimanjaro farmers
produce only about 30 tons of the crop, 1% of national
production. The neighbouring Arusha region produces
about 8% .
Another cash crop produced in the area on a minor
scale is cotton , grown mainly in the lower areas of
Moshi and in the Pare footland areas. Production in
recent years has been declining due to low prices and
bad crop husbandry. The area under cotton is currently
over 3,500 hectares and cotton growing is confined to
smallholdings, generally of 1 - 2 hectares. There are
two cotton ginneries in the area, one at Moshi and the
other in Pare. The ginneries are currently experiencing
106
underutilisation of capacity. The lint is sent by
rail to Dar es Salaam while the cotton seed is sent
to Morogoro for crushing.
Sisal is also produced in the hinterland in
areas where rainfall is low particularly in lower
Moshi and in Pare footland areas along the Tanga
railwayline. It is essentially an estate crop by
which each estate has a factory (DECORTICATOR) for
removing the pulp. The poor price record of the
1960's has been the main factor in the decline of sisal
production in Kilimanjaro and Tanzania as a whole.
However, in recent years, its world price has been very
favourable and currently, there is a rehabilitation
programme in raising sisal production. Sisal lint is
a raw material for the manufacture of rope (sisal twine
and cordage), sisal mattresses, floor mat/carpets and
sisal bags.
3:3:2: LIVESTOCK
The hinterland area has large herds of cattle,
sheep, goats,chicken and pigs. The meat from such
animals is highly important to provide the necessary
protein intake in the people's diet.
107
The estimated cattle population in the area is
about 200,000 or slightly more than 1 cattle per house
hold. Most of the cattle is the local zebu type which
is lean and disease resistant. However, there is a
substantial number of grade cattle mainly kept in the
coffee/banana belt.
In the heavily populated coffee/banana zone,
cattle are kept to provide some milk for subsistence;and
farmyard manure, blit grazing resources are almost non
existence and all cattle are kept and fed in doors.
In Kilimanjaro region, the regional livestock *development officer estimates that there is an annual
intake of 100,000 heads of which only half is inspected
at slaughter. Therefore, in the final analysis, the
region is a large net importer of cattle from neighbouring
regions such as Arusha, Dodoma, Sangida and Sinyanga
particularly to supply urban demand.
Milk production is divided between a traditional
roainly subsistence sector and a commercial sector
pasteurising milk for the urban areas. The large scaleL 'dairy farms in West Kilimanjaro supply milk to the
Processing plant in Arusha. Commercial smallholders are
*R.D.D.’s Office, Moshi, 1980.
1 0 8
concentrated in the coffee/banana belt with local
sales of milk to supplement their income. There is a
large unsatisfied demand for milk in both the urban
area of Moshi and the rural areas.
So far, the government provides assistance to
the large-scale nationalised farms in West Kilimanjaro
but little or no asistance is intended for small-holders
sector. Definitely, if more help is given to the latter
sector in the form of qualified advisory staff, stock
improvement, the economies of milk production and
improved fodder grasses, then this sector could become
a very important source of income for a population which
solely relies on coffee cash sales.
Stocks of goats and sheep are kept entirely
for subsistence milk and meat production. However,
there is a significant local trade in sheep and goats
and about 20,000 heads a year are brought into the
hinterland for slaughter. The skins are sold to the
Hides and Skins Company for delivery to the tanneries factory.
A commercial poultry industry has laid some
basis in the hinterland to provide meat and eggs.
109
However, the bulk of poultry production is confined
to the smallholders who get almost no financial help
from the regional authorities. The poultry industry
is another area for diversification from sole dependence
on coffee as a source of eash income since poultry
keeping could provide a valuable source of income for
smallholders and also especially for Ujamaa villages
located in poor agricultural areas where crop production
is unreliable. There are no problems in demand because
national growth rates of 7% and 9% for poultry meat and
eggs^ respectively are very promising. Improvement
is particularly needed in the areas of availability of
day-old chicks and quality of poultry feed; also
processing capacity and marketing.
3:3:3 Other Resources
Mining and quarrying is directed almost exclusi
vely to the production for local building and
construction. Such materials include clay, sand, gravel
and stone. The output of the industry is mainly bought and
used within a short radius of its source. There is one
limestone concession that is mined in the Pare district
and produces about 400 tons per annuam and is sent by rai1 to Dar es Salaam for use in cement production. Other-
1Se> there are no valuable mineral deposits in the area.
' -------------------------------------------f - Growthrates estimates by Marketing Development
Bureau, Ministry of Agriculture, Dar es Salaam,
110
The forest resources of the hinterland comprise
primarily the indigenous forest which is concentrated
around the peak of Mt. Kilimanjaro and softwood
plantations which have been raised in the forest resource.
The forest resources are geared towards the satisfaction
of local and national demand. For efficient exploitation
and utilisation of forest products, there is a large
complex at Moshi comprising a sawmill, timber treatment,
plywood, housing components, transmission poles and
furniture, all of which use the forest products as raw
materials; the Kibo Match factory uses wood for the
manufacture of match sticks; the various furniture firms
in Moshi town use sawn wood from the hinterland. In
fact, forest timber is one of the resources that have
excellent backward and forward linkages - the forest
products are used as inputs in many of the industries
in Moshi; the output in turn, is bought by the people
in the form of various furniture products such as beds,
chairs, tables, crates, etc. The industry can generate
a lot of employment opportunities if properly managed,
exploited and control is effected. Smallscale industries
can be embarked upon using forest products, not only
the town, but more so in the hinterland generating
income and imparting skills.
It is estimated that as much as half the removals
| e currently unrecorded suggesting that this escapes
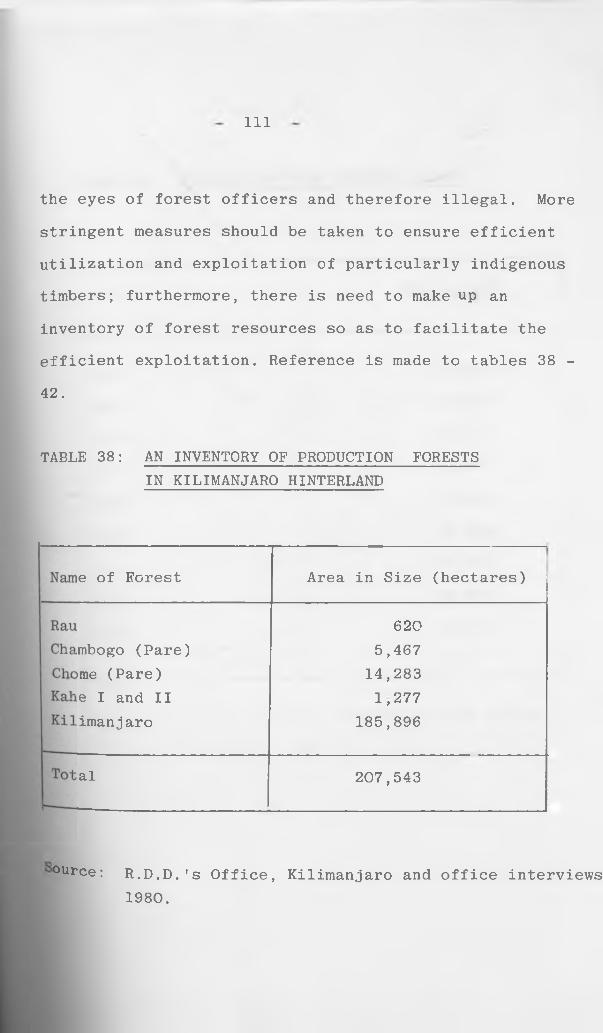
Ill
the eyes of forest officers and therefore illegal. More
stringent measures should be taken to ensure efficient
utilization and exploitation of particularly indigenous
timbers; furthermore, there is need to make up an
inventory of forest resources so as to facilitate the
efficient exploitation. Reference is made to tables 38 -
42.
TABLE 38: AN INVENTORY OF PRODUCTION FORESTSIN KILIMANJARO HINTERLAND
Name of Forest
RauChambogo (Pare) Chome (Pare) Kahe I and II Kilimanjaro
Total
Area in Size (hectares)
207,543
185,896
5,46714,2831,277
620
ource: R.D.D.’s Office, Kilimanjaro and office interviews1980.
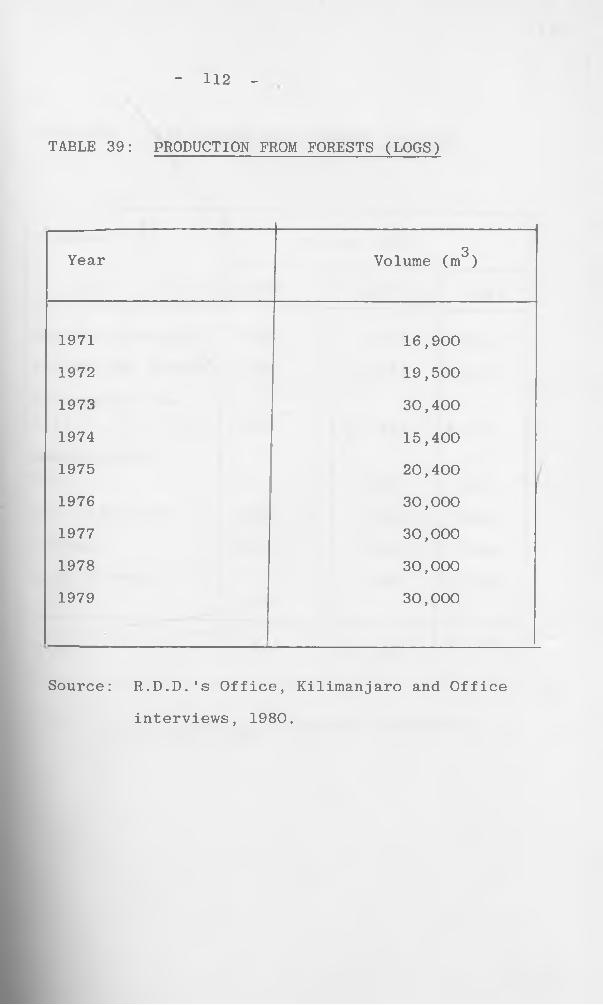
TABLE 39: PRODUCTION FROM FORESTS (LOGS)
- 112 -
Year Volume (m^)
1971 16,900
1972 19,500
1973 30,400
1974 15,400
1975 20,400
1976 30,000
1977 30,000
1978 30,000
1979 30,000
Source: R.D.D.'s Office, Kilimanjaro and Office
interviews, 1980.
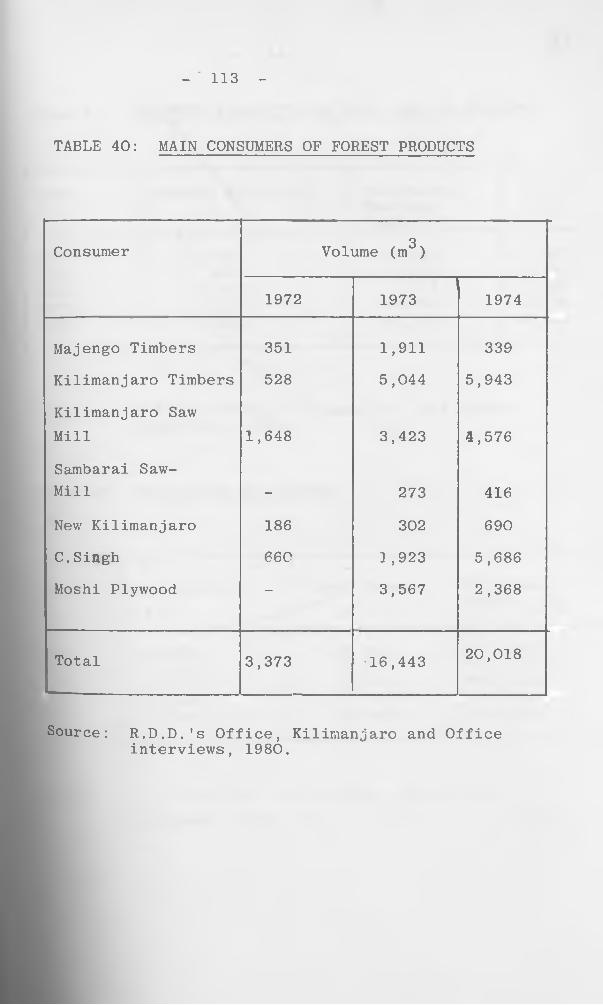
- ' 113 -
TABLE 40: MAIN CONSUMERS OF FOREST PRODUCTS
Consumer Volume (m^)
1972 1973 1974
Majengo Timbers 351 1,911 339
Kilimanjaro Timbers 528 5,044 5,943
Kilimanjaro SawMill 1,648 3,423 4,576
Sambarai Saw-Mill - 273 416
New Kilimanjaro 186 302 690
C.Singh 660 1,923 5,686
Moshi Plywood — 3,567 2,368
Total 3,373 •16,443 20,018
— __________________
Source: R.D.D.’s Office, Kilimanjaro and Officeinterviews, 1980.
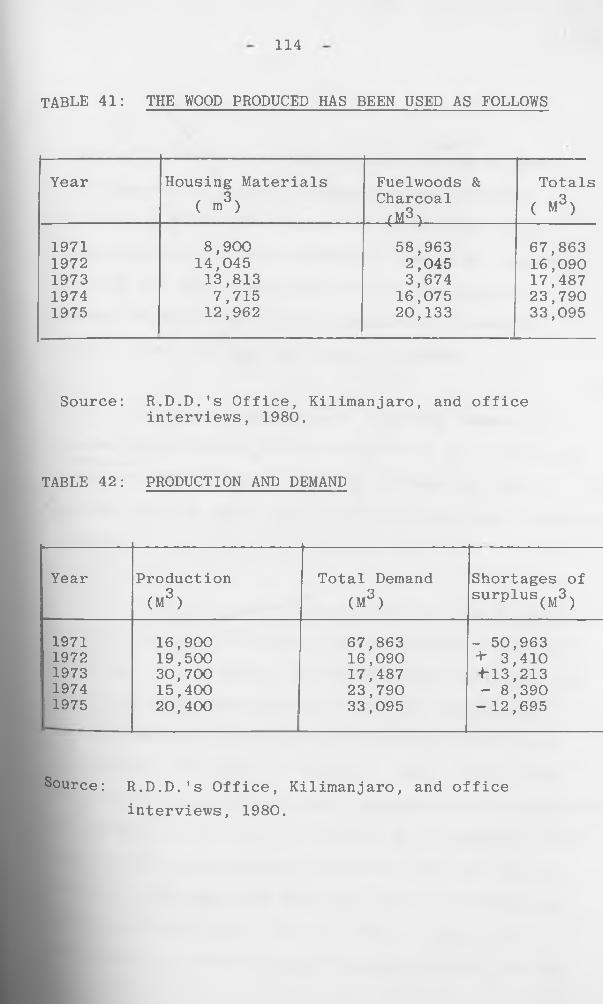
114
TABLE 41: THE WOOD PRODUCED HAS BEEN USED AS FOLLOWS
Year Housing Materials ( m3)
Fuelwoods & Charcoal (M3)
Totals ( M3)
1971 8,90014,045
58,963 67,8631972 2,045 16,0901973 13,813 3,674 17,4871974 7,715 16,075 23,7901975 12,962 20,133 33,095
Source: R.D.D.'s Office, Kilimanjaro, and officeinterviews, 1980.
TABLE 42: PRODUCTION AND DEMAND
Year Production(M3)
Total Demand (M3 )
Shortages of surplus(M3)
1971 16,900 67,863 - 50,9631972 19,500 16,090 + 3,4101973 30,700 17,487 +-13,2131974 15,400 23,790 - 8,3901975 20,400 33,095 - 12,695
Source: R.D.D.’s Office, Kilimanjaro, and officeinterviews, 1980.
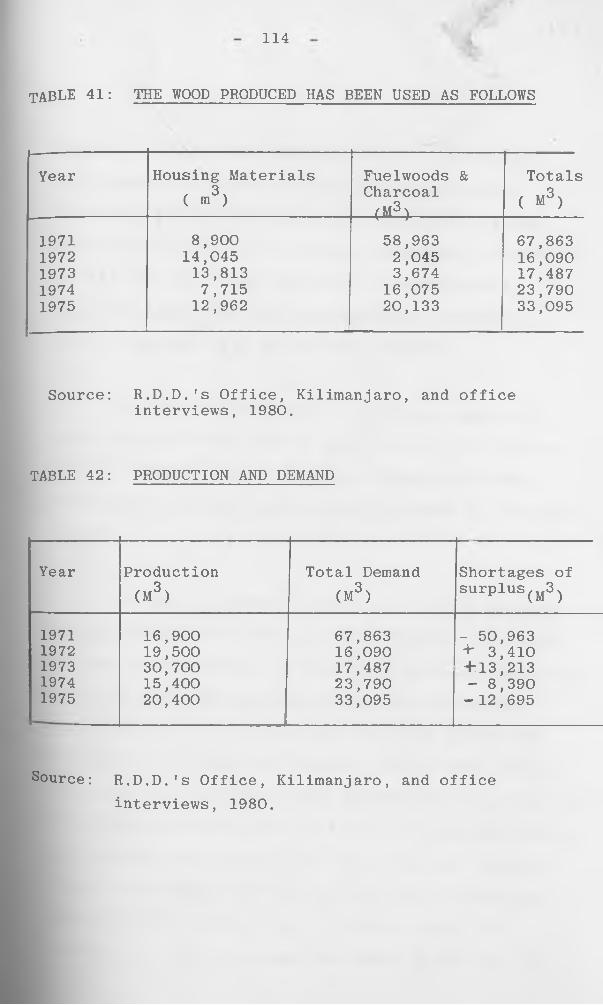
114
TABLE 41: THE WOOD PRODUCED HAS BEEN USED AS FOLLOWS
Year Housing Materials( <n3)
Fuelwoods & Charcoal(M3)
Totals ( M3)
1971 8,900 58,963 67,8631972 14,045 2,045 16,0901973 13,813 3,674 17,4871974 7,715 16,075 23,7901975 12,962 20,133 33,095
Source: R.D.D.'s Office, Kilimanjaro, and officeinterviews, 1980.
TABLE 42: PRODUCTION AND DEMAND
Year Production(M3)
Total Demand (M3)
Shortages of surplus^3^
1971 16,900 67,863 - 50,9631972 19,500 16,090 + 3,4101973 30,700 17,487 + 13,2131974 15,400 23,790 - 8,3901975 20,400 33,095 - 12,695
Source: R.D.D.'s Office, Kilimanjaro, and officeinterviews, 1980.
Looking at the various tables above, it can be seen
that demand for forest products has been steadily
increasing within the region and since 1974, it has
been necessary to import products from other regions
to fill the gap. There should be a considerable
change in demand for wood as population increases,
living standards rise and income increases.
The annual production of existing commercial
exploitation forests will be maintained at the present3
level of 30,000m since they are for the most part
rather small in scale and production cannot be increased
rapidly.
Kilimanjaro is an integral part of the Northern
Tourist Circuit of Tanzania. The Kilimanjaro National
Park was created mainly to facilitate mountain climbing;
the other game viewing areas within the hinterland
include Mkomazi in Pare district aid Sanya Plains near
Kilimanjaro International Airport. Apart from making
Kilimanjaro as a national park, nothing much has been done
by the authorities to fully integrate Kilimanjaro region
as a tourist attraction in the sense that the bulk of
tourist investments has been made in the neighbouring
region of Arusha and in fact in recent years, the
^Importance of the hinterland and Moshi as part of the
- 115 -
116
northern tourist circuit has sharply declined at the
expense of Arusha. The latter presently has mo|e than
its share of tourist facilities in the form of first class17tourist hotels, publicity offices and personnel . In
fact, the Kilimanjaro International Airport was
constructed half-way between Moshi and Arusha to facilitate
tourist development for both regions; however, subsequent
tourist investment trend has been otherwise - the
Kilimanjaro side has received little or nothing in the
way of tourist development as of late.
In fact, a new northern tourist route is possible
considering the promising future of the whole northern
area including Mt. Kilimanjaro and Mkomazi Game
Reserve. This exploitation of tourism resources will
bring in more foreign currency, increase the employment
opportunities of local inhabitants and accordingly
raise their income. At the same time, it is necessary
to conserve the important tourist resources, natural
environment and wildlife together with this exploitation.
17 - See Msuya, Unpublished M.A. Thesis,University of Nairobi, 1979.
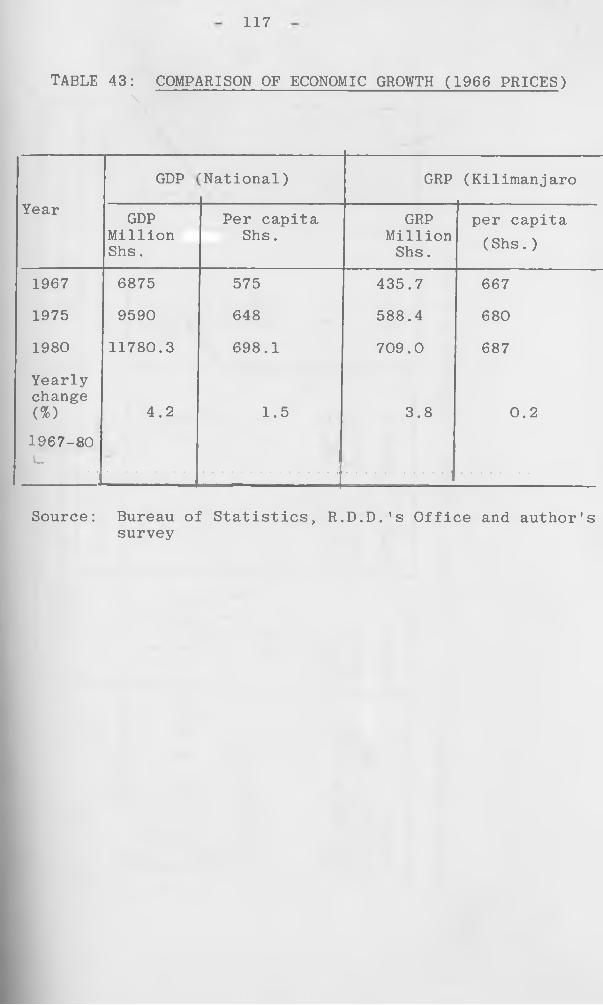
117
TABLE 43: COMPARISON OF ECONOMIC GROWTH (1966 PRICES)\ • | '
Year
GDP 'National) GRP (Kilimanjaro
GDPMillion Shs.
Per capita Shs.
GRPMillionShs.
per capita (Shs.)
1967 6875 575 435.7 6671975 9590 648 588.4 680
1980 11780.3 698.1 709.0 687
Yearlychange(%)1967-80L-
4.2 1.5 3.8 0.2
--------------------------1Source: Bureau of Statistics, R.D.D.’s Office and author's
survey
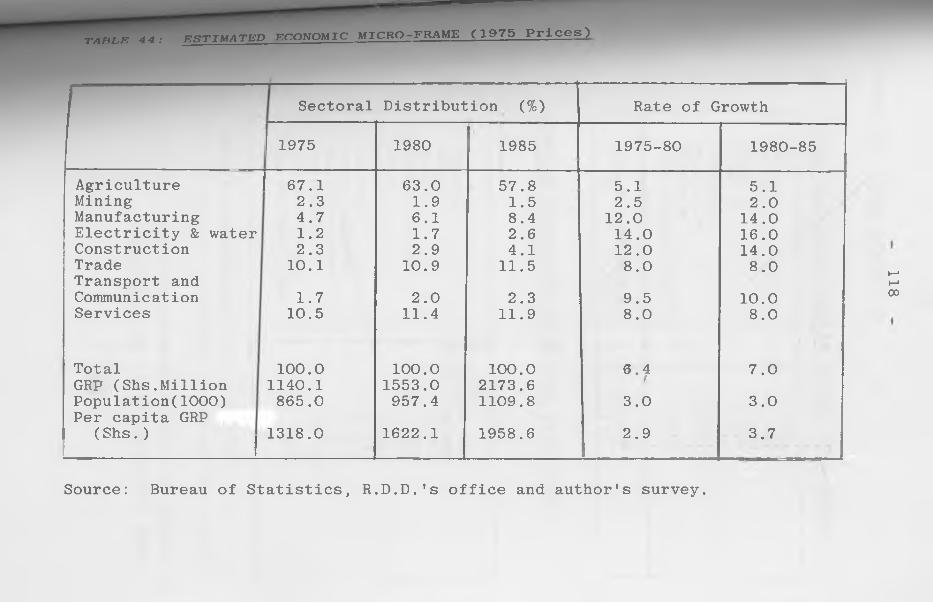
TARL.E 44: ESTIMATED EnONOMIC MICRO-FRAME ( 1 9 7 5 P r i c e s )
1 Sectoral Distribution (%) Rate of Growth
| 1975 1980 1985 1975-80 1980-85
Agriculture 1 67.1 63.0 57.8 5.1 5.1Mining 2.3 1.9 1.5 2.5 2.0Manufacturing 4.7 6.1 8.4 12.0 14.0Electricity & water 1.2 1.7 2.6 14.0 16.0Construction 2.3 2.9 4.1 12.0 14.0Trade 10.1 10.9 11.5 8.0 8.0Transport and Communication 1.7 2.0 2.3 9.5 10.0Services 10.5 11.4 11.9 8.0 8.0
Total 100.0 100.0 100.0 6.4 7.0GRP (Shs.Million Population(1000)
1140.1865.0
1553.0957.4
2173.61109.8
/3.0 3.0
Per capita GRP (Shs.) 1318.0 1622.1 1958.6 2.9 3.7
I 1
Source: Bureau of Statistics, R.D.D.'s office and author’s survey.
118
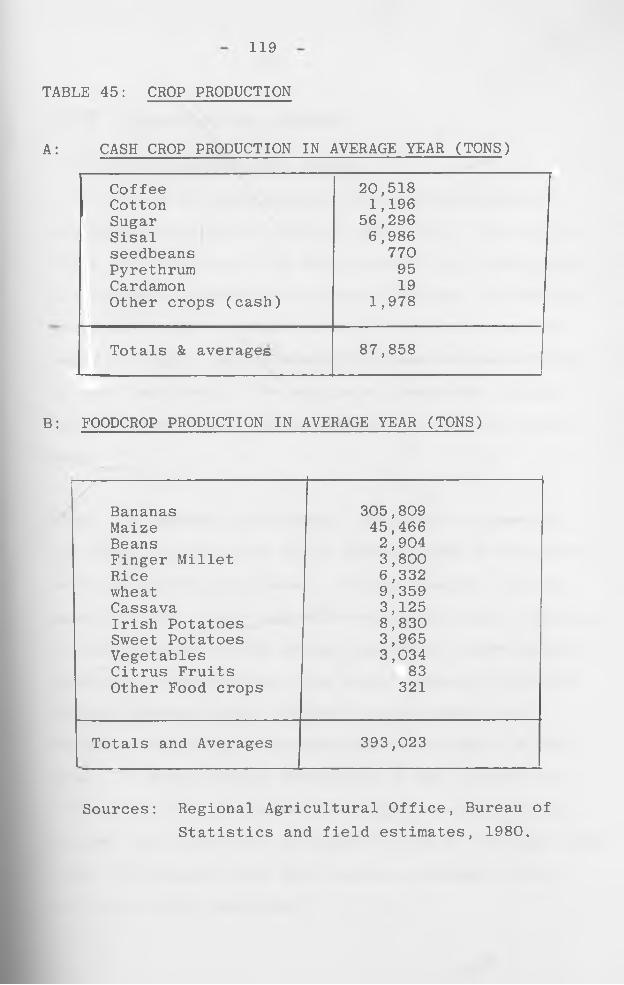
119
TABLE 45: CROP PRODUCTION
A: CASH CROP PRODUCTION IN AVERAGE YEAR (TONS)
Coffee 20,518Cotton 1,196Sugar 56,296Sisal 6,986seedbeans 770Pyrethrum 95Cardamon 19Other crops (cash) 1,978
Totals & averages 87,858
B: FOODCROP PRODUCTION IN AVERAGE YEAR (TONS)
Bananas 305,809Maize 45,466Beans 2,904Finger Millet 3,800Rice 6,332wheat 9,359Cassava 3,125Irish Potatoes 8,830Sweet Potatoes 3,965Vegetables 3,034Citrus Fruits 83Other Food crops 321
Totals and Averages 393,023
Sources: Regional Agricultural Office, Bureau ofStatistics and field estimates, 1980.
120
3:4:0 Communications Linkages
3:4:1 The transportation system:
It is an important part of the infrastructure
and includes railways, airports and roads. This system
links the hinterland with Moshi town in the first place
and secondly provides the essential service of hauling
goods and people to other parts of the country and the
world at large. Ey all means the transportation system
is very important in the analysis of economic linkages
and development gap between Moshi town and its hinter
land .
As regards the railways, the area is served by
the Tanga Railway which gives direct access to the ports
of Tanga and Dar es Salaam. Inbound freight consists
mostly of oil, cement and assorted manufactures. Outbound
freight consists mainly of the hinterland's agricultural
products including those from Arusha region. At Arusha
station average annual inbound tonnage amounts to
60,000 - 70,000 tons, outbound between 30,000 - 40,000
tons. At Moshi station where most of the products are
either offloaded or loaded, the annual average inbound
freight is 80,000 tons, outbound between 50,000 and 80,000
tons. The railway line also handles passenger traffic
to Tanga and Dar es Salaam.
O&
.-<4 kS>
121
The area is well served by the new Kilimanjaro
International Airport (K.I.A.) and by general aviation
airports in Moshi and Same. There are also a few landing
airstrips in West Kilimanjaro.
K.I.A. is built to a very good standard capable
of handling the largest jet aircrafts. The terminal
can handle 700 passengers per hour, while its present
number of passengers is less than 200 per day. Therefore,
it is greatly underutilised and there is ample capacity,
even if a large number of tourists are attracted to the
area. Also, K.I.A. handles a relatively small volume
of air cargo (744 tons in 1974). There is scope for
considerable expansion of air export for such items as
vegetables, meat and flowers.
Moshi airport is operated for general aviation
only. The bulk of the operations are for business
flights and charter flights to the game areas. Its
present capacity is adequate.
The airports in West Kilimanjaro are infrequently
used while some are abandoned.
The road system is highly developed, if not by its
quality then by its extent when compared to other regions
in the country. The density of trunk, territorial main
122
local main and regional roads is 0.12 km/km in the
Kilimanjaro region. On comparative basis, road2 2density in Arusha Region is O.o3 km/km , 0.08 km/km
for Mwanga and Tanga while the national average is2less than 0.05 km/km .
From the main roads, which are usually
bituminized or with gravel surface, minor roads extend
into the areas they feed (thus feeder roads) thereby
connecting at least one village to the main road.
The primary road net work consists of the
Northern Trunk Road that enters the hinterland in Same
District and proceeds to Moshi. From here, it
continues in a western direction to Arusha. From Moshi,
there is an eastern branch to Taveta on the border with
Kenya. The northern trunk road is bituminized with
18 - 20 feet carriageway. Some sections of this important
road are very bad due to poor maintenance.
The quality of the feeder roads varies from
place to place,but generally poor and in some cases
very poor. They range from engineered gravel roads
(e.g. Kibosho, Rombo etc.) or even bitumen roads
(Sanya Juu, Machame, and Marangu) to mere earthen tracks
(e.g. Uru, Kirua, Ugweno etc.) The former, however,
have quite often deteriorated due to acute insufficient
maintenance to a state where they can now be termed
as "improved earthroads" only. Some of these feeder roads
2
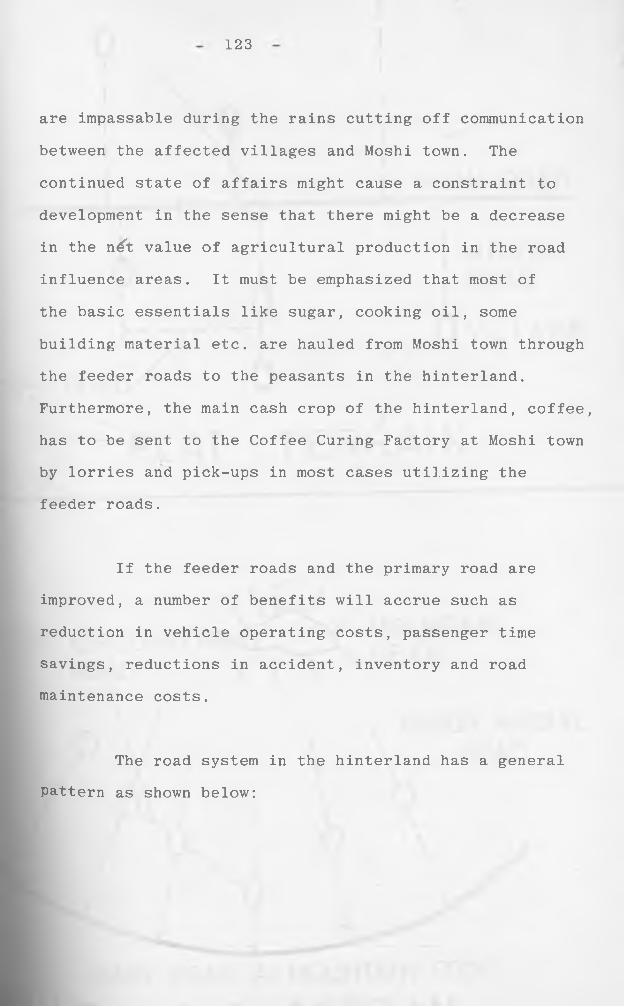
123
are impassable during the rains cutting off communication
between the affected villages and Moshi town. The
continued state of affairs might cause a constraint to
development in the sense that there might be a decrease
in the nd't value of agricultural production in the road
influence areas. It must be emphasized that most of
the basic essentials like sugar, cooking oil, some
building material etc. are hauled from Moshi town through
the feeder roads to the peasants in the hinterland.
Furthermore, the main cash crop of the hinterland, coffee,
has to be sent to the Coffee Curing Factory at Moshi town
by lorries and pick-ups in most cases utilizing the
feeder roads.
If the feeder roads and the primary road are
improved, a number of benefits will accrue such as
reduction in vehicle operating costs, passenger time
savings, reductions in accident, inventory and road
maintenance costs.
The road system in the hinterland has a general
pattern as shown below:
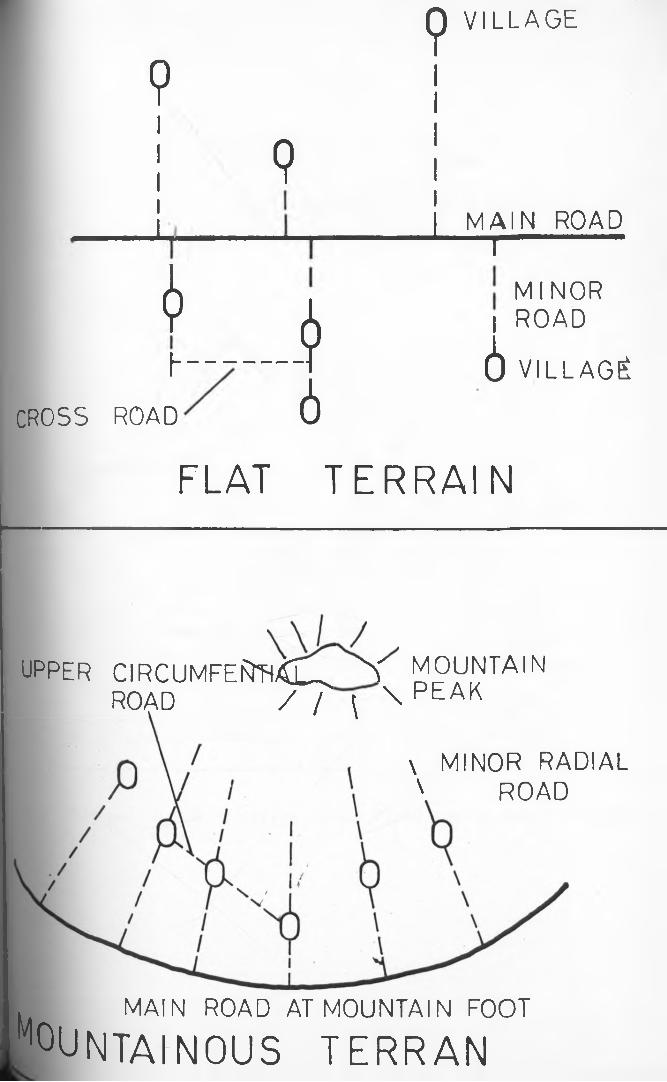
??
V I L L A G E
9M A I N R O A D
*
T
h h
M I N O R I R O A D
CROSS ROAD 6 6 V I L L A G E
FLAT T E R R A I N
UPPER C I R C U M F E i ^ H ^ L - X F O U N T A I N
ROAD / ? \ X P E A K
\ M IN O R R A D IA L \ R O A D
M A IN RO AD AT M O U N T A IN F O O T
%UNTAI NOUS T E R R A N
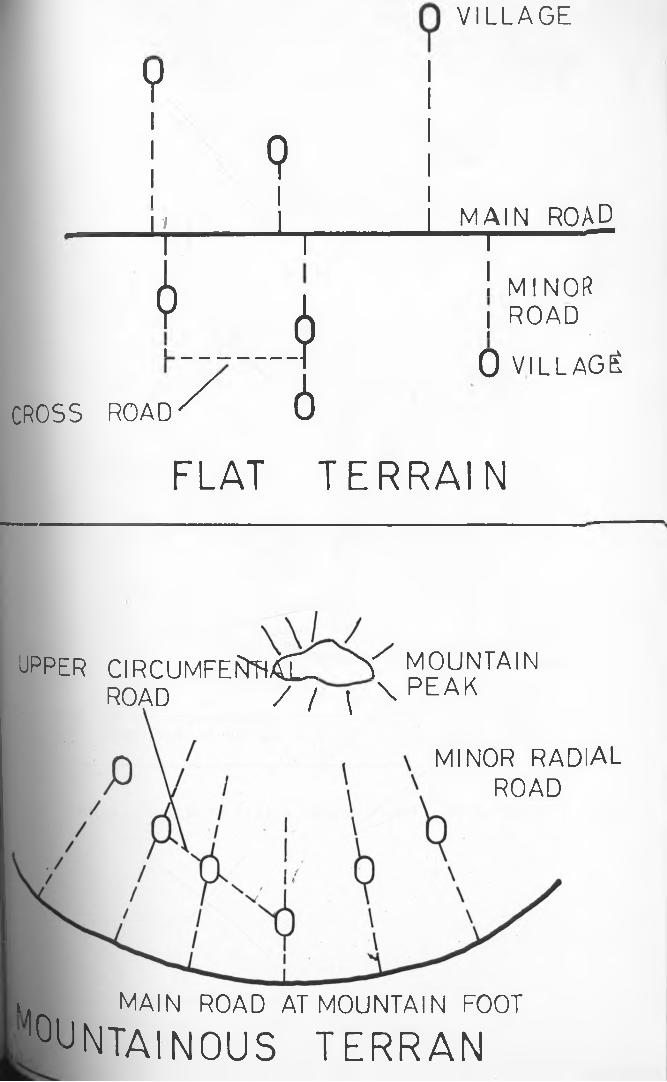
VILLAGE
9! x ? u 1 ,
11111| MAIN ROAD
i 1 1
! MINOR 1 ROADl • • •i 4
, — V
CROSS ROAD/ / / / 6
0 VILLAGE
FLAT T E R R A I N
UPPER C I R C U M F E i ^ L - X MOUNTAIN ROAD /7 \ \ PEAK
MINOR RADIAL ROAD
« MAIN ROAD AT MOUNTAIN FOOT
L^ JNTA INOUS t e r r a n
124
TABLE, 46: FEEDER ROADS: HINTERLAND
R . Estimated Average oa Daily Traffic,
1975 (vehicles per day)
Road condition Existing 1981
1 . Mwika-Mkuu 200 Earth2 . Mkuu-Tarakea 30 Earth3. Tarakea - Keni
- Taveta Road 20 Earth4. Mwika-Himo 130 Earth5. Middle Rombo 50 Earth6 . Kilema-Marangu-Mwika 165 Earth7. Kirua -Kilema 60 Earth8 . Himo-Makuyuni-Kileo 20 Earth9. Himo-Marangu 300 Bitumen
10. Moshi-Kahe 80 Earth11. Moshi-Old Moshi 80 Earth12. Moshi-Mkokomu 50 Earth13. Moshi-Uru East 150 Bitumen14. Moshi-Uru West 200 Earth15. Moshi-Kibosho Mission 150 Gravel16. Old Arusha Rd.-Umbwe 250 Gravel17. " " Lyamungu 150 Earth18. Mango-Kombo-Machame
Hospital 40 Earth19. Moshi-Arusha Chini 600 Gravel20. Kikafu-Machame Central 350 Bitumen21. Boma Ng'ombe-Rundugai 15 Earth22. " Sanya Juu 300 Bitumen23. Olmolog-W.Kilimanj aro
- Sanya Juu 150 Earth24. Same-Gonja-Mkomazi - Earth25. Same-Ugveno-Mwang a Earth
Source: R.D.D.'s Office, Moshi, 1980. and Author's Survey1981.
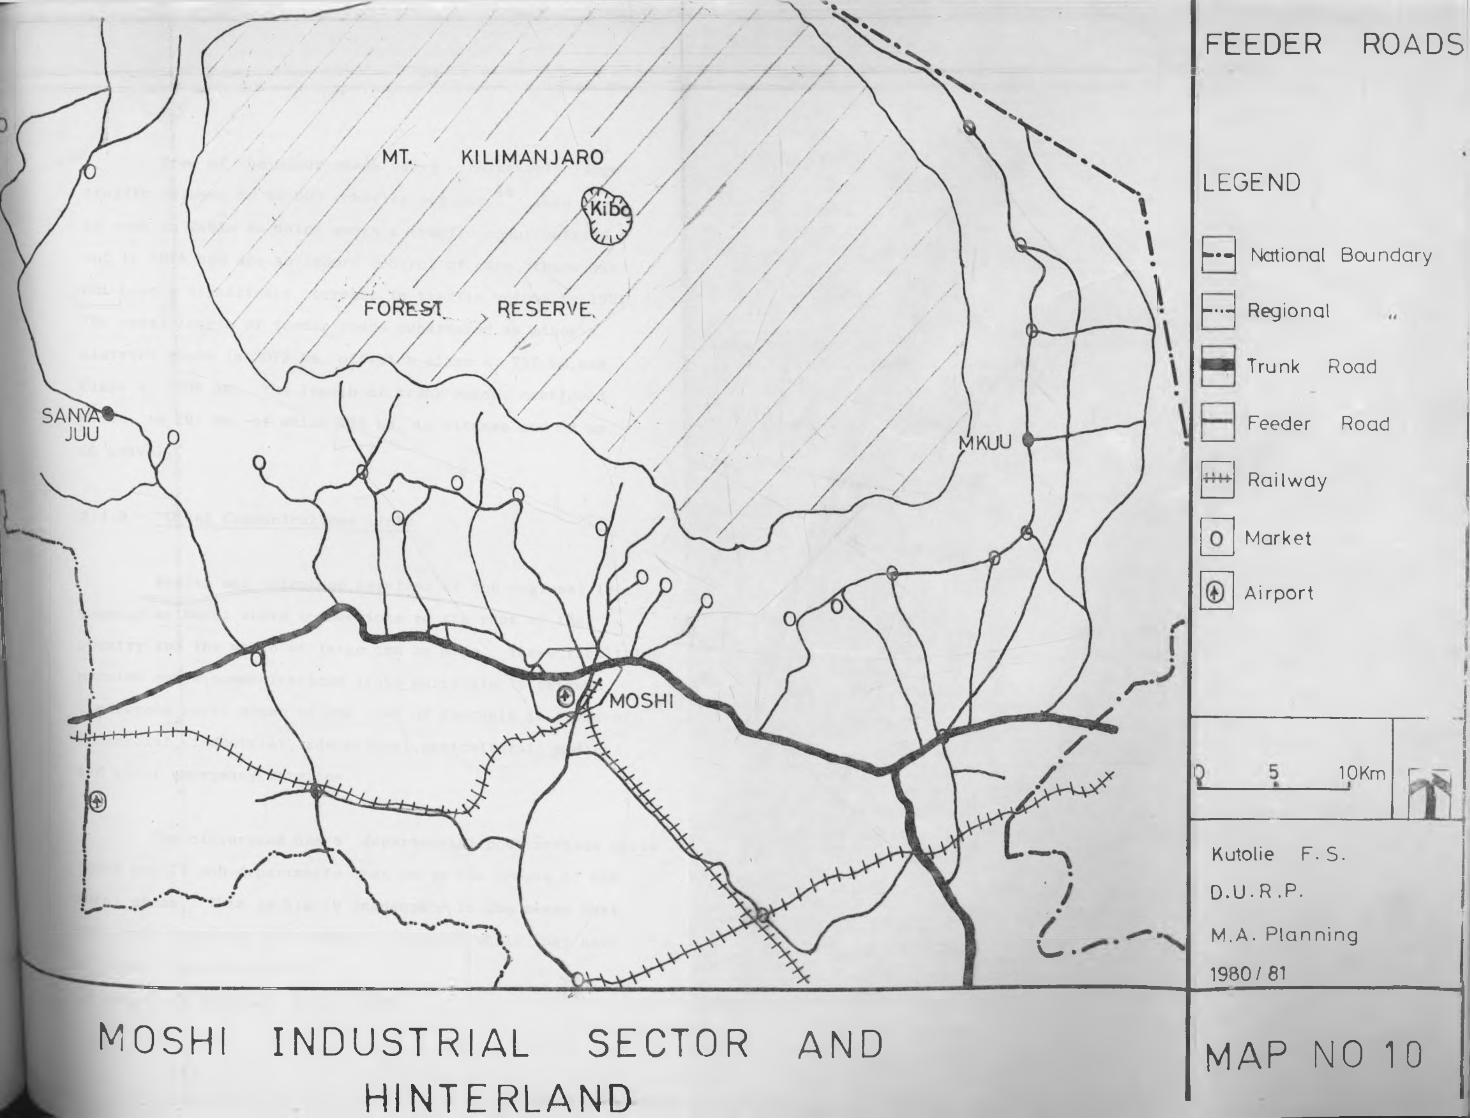
. V
I N D U S T R I A L SECTOR H I N T E R L A N D
A N DMOSHI
u -
FEEDER R0AD5!
L E G E N D
|— -| National Boundary
[—•—| Regional
Trunk Road
Feeder Road
Railway
Market
Airport
lOKm
Kutolie F. S.
D.U.R.P.
M,A. Planning
1980/81
MAP NO 10
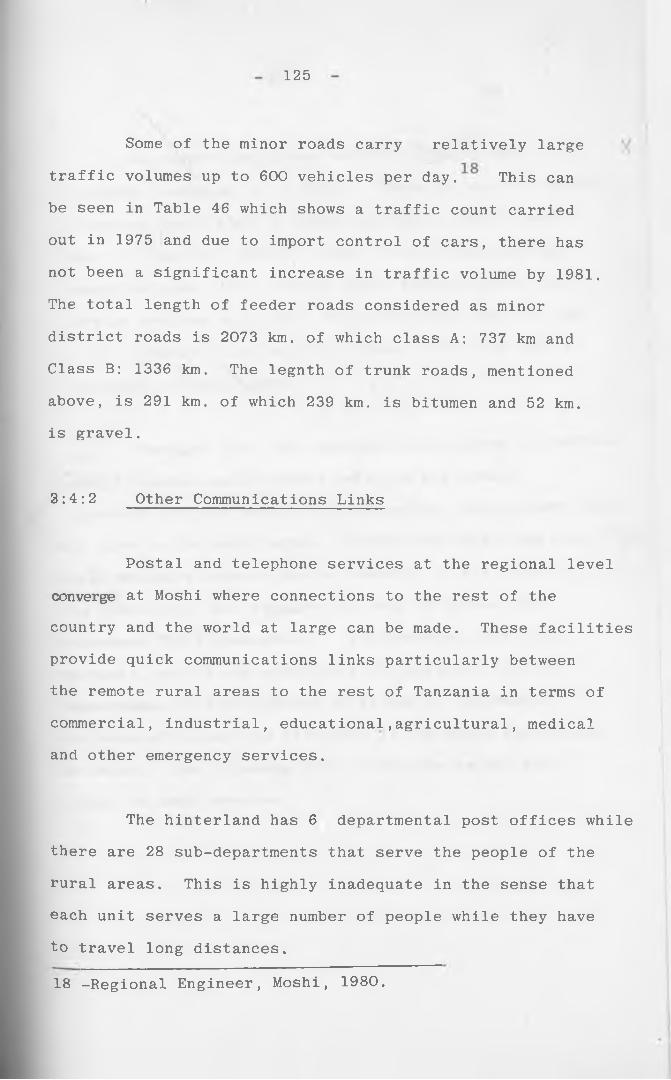
125
Some of the minor roads carry relatively large
traffic volumes up to 600 vehicles per day. This can
be seen in Table 46 which shows a traffic count carried
out in 1975 and due to import control of cars, there has
not been a significant increase in traffic volume by 1981.
The total length of feeder roads considered as minor
district roads is 2073 km. of which class A: 737 km and
Class B: 1336 km. The legnth of trunk roads, mentioned
above, is 291 km. of which 239 km. is bitumen and 52 km.
is gravel.
2:4:2 Other Communications Links
Postal and telephone services at the regional level
converge at Moshi where connections to the rest of the
country and the world at large can be made. These facilities
provide quick communications links particularly between
the remote rural areas to the rest of Tanzania in terms of
commercial, industrial, educational,agricultural, medical
and other emergency services.
The hinterland has 6 departmental post offices while
there are 28 sub-departments that serve the people of the
rural areas. This is highly inadequate in the sense that
each unit serves a large number of people while they have
to travel long distances.
18 -Regional Engineer, Moshi, 1980.
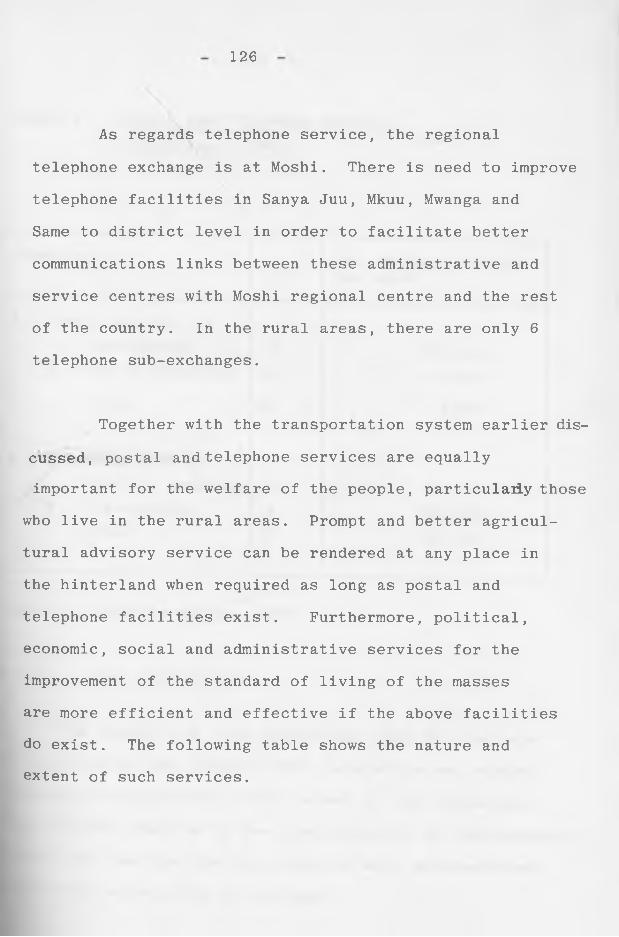
126
As regards telephone service, the regional
telephone exchange is at Moshi. There is need to improve
telephone facilities in Sanya Juu, Mkuu, Mwanga and
Same to district level in order to facilitate better
communications links between these administrative and
service centres with Moshi regional centre and the rest
of the country. In the rural areas, there are only 6
telephone sub-exchanges.
Together with the transportation system earlier dis
cussed, postal and telephone services are equally
important for the welfare of the people, particularly those
who live in the rural areas. Prompt and better agricul
tural advisory service can be rendered at any place in
the hinterland when required as long as postal and
telephone facilities exist. Furthermore, political,
economic, social and administrative services for the
improvement of the standard of living of the masses
are more efficient and effective if the above facilities
do exist. The following table shows the nature and
extent of such services.
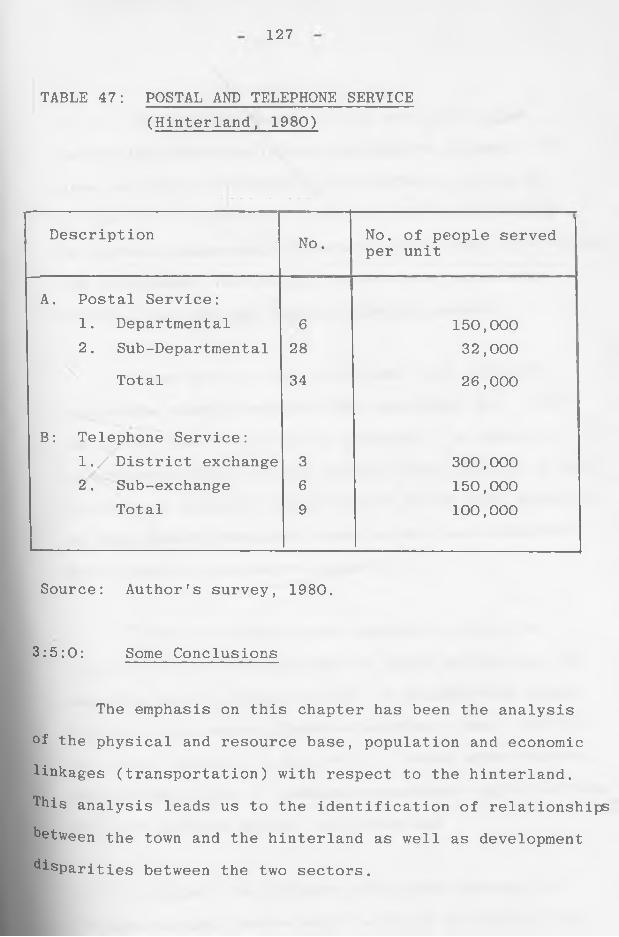
127
TABLE 47: POSTAL AND TELEPHONE SERVICE(Hinterland, 1980)
Description No. No. of people served per unit
A. Postal Service:1. Departmental 6 150,0002. Sub-Departmental 28 32,000
Total 34 26,000
B: Telephone Service:1./ District exchange 3 300,0002. Sub-exchange 6 150,000
Total 9 100,000
Source: Author's survey, 1980.
3:5:0: Some Conclusions
The emphasis on this chapter has been the analysis
of the physical and resource base, population and economic
linkages (transportation) with respect to the hinterland.
This analysis leads us to the identification of relationships
between the town and the hinterland as well as development
disparities between the two sectors.
128
Kilimanjaro Region is the smallest region
in Mainland Tanzania (apart from Dar es Salaam). Its
area is 1.4% of Tanzania's land surface, but has 6%
of the total population. The physical features lead
to certain identifiable characteristics such as altitude
and topography, road system orientation, population
density, land use and type of farm management.
Some areas of the hinterland have very high2population density reaching 600 people per km . This
has given rise to population pressure. In addition,
agricultural resources are judged to be close to a limit
in terms of extensive exploitation and as such migration
to less densely populated areas as well as industrial
growth must be considered urgently.
There is considerable emigration from the
hinterland. Of the hinterland's total emigration, the
majority went to Arusha and Dar es Salaam while urban
growth in the region played a relatively small part in
the total movement of population# Among other reasons,
emigration is due to inadequate employment opportunities
and land shortage within the hinterland.
By far, the greatest hinterland employer is
the agricultural sector which accounts for 82% of the
region's total employment. However, wage employment
129
has not been growing satisfactorily in recent times
signifying that there has not been new opportunities
in paid employment. The main problem is unemployment
and under-employment. This problem is further aggravated
by more subdivision of the already small holdings of
"vihamba and vithaka". There are also signs that per
capita income is stagnating in the hinterland while
at the same time, it is lagging far behind that of the
urban sector.
The main resources of the hinterland include
crops (cash and subsistence), forestry, fishing, tourism
and livestock. Agriculture is the mainstay of the
economy accounting for over 67% of the G.R.P. Coffee
is the main cash crop whereas bananas is the staple food.
Raw materials for industry, in addition to coffee are
sisal, sugarcane, cotton, pyrethrum, and forest
products. Rural industrialization is very low and
tourism resources are so far marginally tapped.
Subsistence agriculture is no longer sufficient
to feed the population. Maize, rice and beans have
to be imported from other regions to supplement local
production. However, self-sufficiency in these crops
is possible if the plains are harnessed for agricultural
production by investment in irrigation. There is need
130
for crop diversification rather than solely relying
on coffee. Emphasis on dairy cattle, poultry and
piggery will help to increase incomes and help in
reducing malnutrition.
The feeder roads that open up the hinterland
areas are poor in quality in most cases. However,
their significance in the prvision of linkages to the
town cannot be underrated. They are used in the haulage
of forest products, cash crop and food crops while
small-scale industrial and commercial activities would be
impossible to operate without the feeder roads. They
need to be upgraded while regular maintenance is
essential so that transportation linkages are strengthened.
Other problems facing the hinterland comparatively
include poor housing, unsterilised water,inconvenient
location of periodic markets and in general less incomes
per capita. All these problems contribute to the
economic disparity between the hinterland and the urban
sector of Moshi.
However, these problems can be overcome, if not
completely wiped out, by increased utilization and exploi
tation of the available resources. The exploitation of the
existing resources must go hand in hand with the establish
ment of industries that have direct linkages with the hinter-
^and. it is mainly through integrated approach to development that will definitely alleviate the identified problems
seriouslv facing the hinterland.
131
CHAPTER FOUR
4:0:0 SYNTHESIS OF THE RELATIONSHIP BETWEEN MOSHI'SINDUSTRIAL SECTOR AND ITS HINTERLAND:
4:1:0 Introduction:
The findings of Chapter Two show that there are
several large-scale industries located in Moshi town
either primarily processing for exports or for local
consumption. Most of these establishments are agro-
based industries utilizing to some extent the resource
base of the immediate hinterland. The resource base
of Moshi's hinterland is analysed in Chapter Three
determining existing and potential resources. The
main aim of this chapter then is to find industrial
linkages through which Moshi town interact with its
hinterland.
Since linkage studies are concerned with
the identification of potential flows i.e. flows
of goods and services, then an investigation of the
following linkages'^ is necessary and useful for the
study:
Linkages defined in Chapter Two for further reference see Bendavid, H., Regional Economic Analysis, 1974, pp. 59-67.
132
(a) Backward production linkages
(b) Forward production linkages
(c) Distribution linkages
(d) Commercial and service linkages
In this particular case I conducted a linkage survey
of 5 firms/industries in Moshi town and their
relationships to the immediate hinterland. The
information obtained related to outputs and inputs
of the production processes. For the outputs of each
production process I determined how and where they
are delivered, what they are used for, marketing
of the output; where the inputs are obtained, delivery
method, etc. The information obtained in some cases
is incomplete due to the fact that I did not receive
much co-operation from the management of the firms.
However the survey conducted is significant as far
as the study is concerned.
The firms surveyed were T.C.C.C. Ltd.
(Coffee Curing), Tanzania Tanneries Ltd. (Leather),
T.C.B. Ltd. (sisal sacks), Kibo Match Corporation Ltd.
(Safety Matches), Tantimbers Ltd. (timber). The
coffee factory has been given more weight because
of two main reasons: its operations affect more
people in the hinterland than any other and secondly
I received more co-operation from its management.
133
4:2:0 Linkage Survey
4:3:1 T.C.C.C. Ltd.
This firm: owns and manages the coffee
curing factory which is located near the Moshi Railway
Station. The factory is considered to be the biggest
of its kind in the country in terms of capital outlay
and employment. It processes parchment coffee into
clean coffee ready for export. Furthermore, all
arabica coffee (milds) produced in Tanzania is milled
-at the factory.
Moshi's hinterland produces between 1/3 oand 2/3, in different years, of Tanzania's total
arabica coffee signifying the importance of the
hinterland to the location of the factory itself. However
before the parchment coffee reaches the factory a
number of processes have to be carried out from the
farm-level to the buying post.
At the farm level coffee is grown either
in estates or in smallholder farms where crop
husbandry methods are applied. Initially ripe cherry
is picked by hand and then sent for pulping and
subsequent drying. The stages, from picking to
2. See Chapter Three.
134
drying, are very critical because they determine the
quality of coffee. Later the dry parchment is packed
into sisal sacks ready for delivery at a buying post
managed by C.A.T. Most of the smallholders carry
their coffee on head to the buying post while estates
deliver their parchment directly at Coffee Curing
Factory. From the buying posts the coffee is sent
to the factory by lorries. Road network between the
coffee zone and the town is essential for the
transportation of coffee. What we have uncovered so
far is the production linkage that links the peasant
farmer to the factory and every step is significant
in the sense that it plays an essential part in the
quantity and quality of production and subsequent
generation of income and employment.
At the factory parchment coffee is milled
or cured by removing the husks and reduces the moisture
content to a minimum. The beans are then subjected
to numerous grading operations.
The subsequent marked grades are then
sampled and samples sent to the Authority’s (CAT)
liquoring department for classification and quality
assessment. The classification report forms the basis
for distributing the sale proceeds to the grower,
135
for making up bulks of similar coffees and arranging
reserve prices at auctions. Auction sales of coffee
are held in Moshi during the coffee season at the
Coffee Curing Company’s godown which has a storage
capacity for over one million bags (60 kg. each).
The Curing Company also arranges for railing and,
where required, bulking of coffees sought at auction.3The leading importers are F.R.G., U.S.A., Italy,
Holland, Sweden, Japan, U.K., Canada, France, and
Australia in that order. Therefore the Curing Works
provides a vital link between the local coffee producer
and the world market which controls the price he gets.4Local sales of roasted arabica is less than 1% of
total arabica production which means that more than
99% is exported in its raw state.
The Coffee Curing Works employs about 650
workers in its various departments whose salaries
and wages are paid out of curing charges. During
my survey out of those interviewed 60% were born in
the region while the rest were born in the neighbouring
regions. Of those born in the region, 80% were born
in the hinterland and the rest in the town. 83% of
those born in the region repatriate part of their
income to the hinterland to support their families
°r relatives. The survey also revealed that apart
from wages, 52% of the workers have other sources of * 4
^• C.A.T. Report 19804* Author's Survey based on figures supplied by T.C.C.C .LTD
136
income mainly through the ownership of a farm from
which considerable income is generated. The average
wage of a factory operative was T.shs. 9515 p.a.
The study of Coffee Curing Works cannot
be complete unless we study the functions of Coffee
Authority of Tanzania (C.A.T.). Since the basic
unit of administration in rural Tanzania is the 5village, the marketing of parchment coffee is
organised through it. C.A.T. is reponsible for
organising coffee collection from producers,
sells coffee on the international and domestic markets
and returns the sale proceeds to the grower. It
finances coffee research, improvement and eradication
of diseases. It acts as liaison between the grower,
the buyer and the government while all these operations
are financed by charges on all coffee sold. As seen
from above functions C.A.T. is directly related to
T.C.C.C. Ltd. The authority has a top heavy bureau
cracy all dependent on the coffee peasants.
Along the various stages until coffee is
ready for export, production linkages play a
significant role in generating incomes which can
5. Government of Tanzania, Villages Act, 1975.
be used to stimulate other sectors of the economy
particularly in the hinterland. The spread
effects of increased incomes include raising the
living standards of the people. However the production
linkages are faced with a serious problem of quality.
The numerous smallholders process their coffee
individually without due regard to the manner and
timing of fermentation, use of inefficient machines
in the removal of the pulp, bad washing and drying
all leading to poor quality of the coffee and subsequent
low prices and incomes. Secondly there is the problem
of quantity. For the time being poor coffee husbandry,
proliferation of coffee diseases particularly C.B.D.
(coffee berry disease) and non-use of fertilizers
are some of the factors that have limited increased
production. Thirdly the Curing Factory simply
semi-processes the coffee for export in its raw state
while processing to final demand is done abroad.
This places coffee solely dependent on the mechanism
of supply and demand of the world market. It is very
possible that the processing of export coffee can also
contribute to increasing its use as input for further
local production i.e. coffee can be further processed
for final consumption in both domestic and export
markets widening the scope of increased incomes and
subsequent stimulation of increased production. The
production linkages of the factory as exposed above
138
are weak both in the hinterland context as well as at
interregional level. There linkages need to be
strengthened if increased benefits are to accrue to
the people of the hinterland and to the national
economy as a whole.
The activities of the factory have significant
implications for the development of the rural areas.
In the first place, part of the employees, income,
albeit small, is repatriated to the rural areas. As
indicated earlier this repatriated income is inadequate
in the sense that their monthly earnings and number
of employees are small. Also most of the employees
have a dual character working as employees while at
the same time they own agricultural plots in the
rural areas which generate income. Secondly the
factory draws the most able and active section of
the population from the rural areas to the town whose
contribution to the rural economy, but still
dependent on it, is now denied. In the final analysis
this leads to the underdevelopment of the hinterland.
The transportation system is crucial to
coffee production Parchment coffee from the various
buying points have to be transported to the Curing
Works frequently, at least once a week* during the
coffee season. The feeder roads are mainly earth
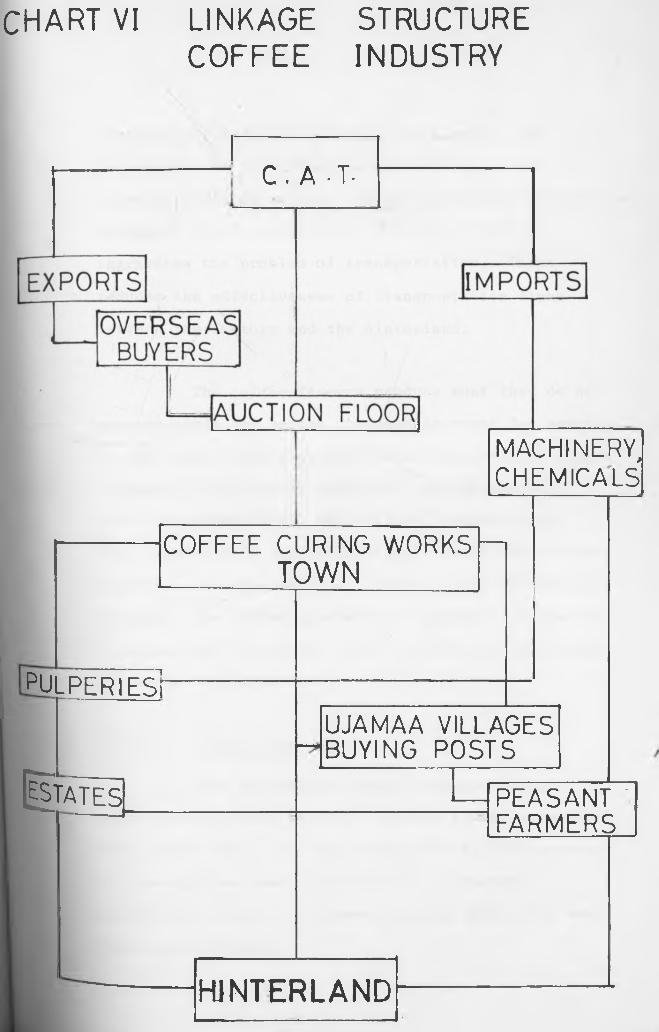
CHART VI LINKAGE STRUCTURECOFFEE INDUSTRY
- C . A • T
C O F F E E C U R IN G W O R K STOWN
M A C H IN ER Y ,C H E M IC A L S— — ■ --------------------------------- ----------mm*
PULP E R IE S l
U JA M A A V IL L A G E S B U Y IN G P O S T S
H f ifATES P E A S A N T ' F A R M E R S
HINTERLAND
139
trucks badly affected by heavy truck usage, and
in general are poorly maintained causing delays in
transportation of coffee. Quantity deterioration is not
uncommon. Inavailability of vehicles further
aggravates the problem of transportation. These
reduces the effectiveness of transportation links
between the factory and the hinterland.
The coffee farmers produce what they do not
consume since the coffee produced is meant for export.
In this case local distributive and marketing linkages/
channels are virtually absent at the post— factory
level and promotional activities in encouraging
local consumption are rudimentary. Existence of local
marketing and distribution effects could have widened
urdened the income generating capacity of coffee by
creating more employment at all levels and increasing
the scope of production.
4:2:2 T.B.C. Ltd.
This parastatal company manages a bag
manufacturing plant which is located in the industrial
area, Moshi town. It was established in 1969 during
the second five year plan under the industrial
growth pole policy for decentralising industries away
from Dar-es-Salaam.
140
The raw material inputs into the manufacture
of sisal bags include sisal fibre readily obtainable
locally from Tanzania Sisal Authority (TSA) that owns
the nationalised sisal estates; and chemicals imported
from abroad. In the estates the sisal leaves are cut
by workmen, transported to the estate factory, the
Decorticator, that removes the pulp and leaves the
lint or fibre. Since the sisal leaves are heavy and
bulky and the fact that sisal estates are extensive,
they are hauled through railroads to the factory. After
the' process of decortication, the fibre is intensively
washed, sundried and baled. The cutting of the
leaves is labour-intensive and requires a permanent
labour force stationed at the estate. We can
easily see that sisal production requires a considerable
amount of investment and that is why it is grown in
estates to benefit from economies of scale. Therefore
at the estate level infrastructural facilities are
necessary such as estate roads, railroads, electricity
and water all important for the first stage processing
of sisal. Secondly the estates employ a large number
of sisal cutters, weeders and management staff
who have to be housed within the estates.
6 . Tanzania Second Five Year Plan Vol. I.
141
The bales of sisal fibre from the estates
within the hinterland are either railed to Tanga
port for export or retained to be used as an input
into the bag factory. The factory has an installed
capacity of producing more than 4.5 million bags annually
as at 1980; however the factory is at the moment
working under-capacity due to inadequate skilled
personnel, unavailability of the necessary imported
material inputs due to foreign exchange constraint and7low productivity. The bag factory employs 425
workers who mainly get their livelihood by working
at the plant.
The foregoing are the identified production,
employment and transportation linkages that the Bag
Factory has with the hinterland. These linkages
although significant display some important weaknesses
particularly at the estate level. The volume of sisal
production has been declining since the late 1960 Ts
partly due to low world market prices and partly due to
incompetence of the T.S.A. that inherited the nationali
sed estates. Most of the sisal estates are in very
bad condition requiring immediate rehabilitation if
production is to be increased significantly. Secondly
quality of fibre is low due to poor handling techniques
7. Tanzania Economic Survey, 1980.
142
particularly at the estate level and this requires
improvement for higher sale prices. Thirdly, increased
utilization of sisal fibre by the Bag Factory would in
turn boost up production in the estates since this
entails less dependence on the world market prices,
increase value-added and subsequently improving
foreign exchange earnings. However more sisal fibre
input at the Bag plant implies either greater utilization
of existing capacity and/or expansion of the factory.
This is recommended in the next chapter.
The sacks produced are used pan-territorial
mainly in the packing of agricultural products such
as maize, wheat, beans etc. Institutionalise the
main consumers of sisal sacks are Coffee Curing Works
and National Milling Corporation. Over 50% of the
output of the factory is used by the Coffee Curing
Factory th.e largest single consumer. This is the
main reason why the Bag factory was located in Moshi.
Both factories benefit from agglomeration economies
whereby the coffee factory secures the 1.5 million-
plus sacks at no or very little transportation costs
while the bag firm has no marketing problem. Further,
the sacks are used at all stages in the coffee
production from the farm level to the export stage
signifying that the hinterland is a great market for
the factory's output. However frequent shortages of
143
these sacks is a common problem due the fact that
demand has never been met by the factory.
One reason that accounts for the factory's
low output is the fact that it utilizes imported
chemicals, machinery and spare parts for which little
or no foreign exchange is allocated to buy them.
This is a problem that is facing all industries in
Tanzania which were established, ironically, under the
import substitution programme. Thus it appears the
import contentcharacteristic of industries established
in Moshi,has the impact of lowering the effectivenessg
of linkages. As regards the employment linkages, the same weaknesses attributed to Coffee Curing Works
discussed in section 4;2;1 also apply.
4:2:3 Kibo Match Corporation Ltd.
This is a match manufacturing firm with a
plant located along Moshi-Arusha Road adjacent to
the Karanga regional prison. It manufactures safety
matches for both local consumption and exports to
neighbouring countries. This is the only one of its
kind in the country. The raw materials include
paper, chimicals and wood. It is a wood products
industry.
8 . Rweyemamu, J., Underdevelopment and Industrialization in Tanzania, O.U.P. 1973 pp. 150-159.
144
In addition to electricity and water, wood is
obtainable from the hinterland forest reserves. The
wood is used in the manufacture of match boxes and
splints. The wood felled from the forest is transported
to the match factory where the procurred logs are processed - there are two main processes at the factory i.e. matches and match
boxes and both of them are highly capital intensive requiring
very little labour. In fact from the time the wood is
put into the splint-making machine the product is
untouched by human hands till used by the ultimate
consumer. Consequently, employed operatives are only
300 to man both processes of production.
However the utilization of wood at the
factory helps in the generation of employment
opportunities in the wood industry although wood
consumption at the plant is relatively small.
Regarding income repatriation to the hinter
land, what was said about Coffee Curing employees
(section 4:2:1) is also applicable here in that the
employee benefits accruing to the rural areas are
very limited indeed.
The factory consumes a considerable amount
°f chemicals. Each wood splint match has a head
that contains potash (potassium) chlorate while
the side of a match box is coated with a composition
145
of red phosphorus and an abrasive material. Also to
reduce firehazard splints are impregnated with a
weak solution of ammonium sulphate. All these chimicals
are imported further causing a serious drain on the
scarce foreign exchange reserves. The imported
machinery and spare parts have similar effect on the
national economy. Therefore the level of production
at the factory is heavily dependent on the amount of
foreign exchange available to pay for the imports.
Dependence on imported materials weakens the effective
ness of the linkages both at the input and output
levels.
Matches for local consumption in Tanzania
are distributed by the various Regional Trading
Companies (R.T.C.s). The Kilimanjaro R.T.C. is
responsible for the distribution and marketing of
match boxes throughout the town and the hinterland.
The retailer, individual shop owners or co-operatives,
buy their stocks from R.T.C. whose headequarters are
in Moshi town and have to transport them to the
remote rural areas for the ultimate consumer. During
the rainy season transportation is limited particularly
on the feeder roads.
146
4:2:4 Tanzania Tanneries Ltd
The leather factory was established as a
consequence of the second five year plan 1969-74
under the regional growth pole policy for industrial
decentralisation. Since then two other factories
have been constructed at Mwanza and Morogoro respectively
during the third five year plan 1976/81 with an
objective of processing all locally produced hides and9skins in Tanzania. The Moshi tanneries, the largest
among the three, is capable of producing 14.0 million
sq. ft . of processed leather p.a.
/The raw material inputs include locally
available hides and skins from the livestock industry.
The hinterland is a known great consumer of meet and
the slaughtering of cattle, goats and sheep is big
business both in the town and all over the hinterland.
However the latter is not much endowed with livestock
and as such the area is a large net importer of
livestock from neighbouring regions to supplement
local demand.
As earlier indicated in Chapter Three, the
livestock are slaughtered at numerious registered
butcheries or in households for meat purposes mainly.
9. Tanzania Third Five Year Plan 1976/81 pp. 45-47.
147
The hides and skins are washed and dried and then
sold to agents of Tanzania Hides and Skins Ltd. sole
buyers of the product. The latter publicly - owned
firm is responsible for preserving or curing the
product for transport and shipment to overseas buyers,
in case of exports, and delivery to tanneries, in case
of local processing into leather. The factory processes
the hides and skins into various types of leather by
using imported machinery and chemicals, while some
locally produced wattle extract is used in the tanning
process.
All the way from the livestock farmer to the
factory the operations of production transportation
and labour are important; these are linkages that
help in the creation of more incomes to the population
and subsequently raising the standard of living
of the people engaged in those operations. Although
these linkages are significant in the production of
leather there are important weaknesses inherent in
the system. Firstly, some of the hides and skins
delivered at the factory is of poor quality due to
poor handling techniques at the slaughter-house
level. There is room for improvement at this stage
such that the butchers get more income for first grade
hides and skins especially when we consider the fact
that hide or skins is worth up to 10%^ of the value
10. Author's Survey, August 1980.
148
of the animal depending on quality. Secondly, all the
hides and skins have to be transported all the way
from the hinterland to the town. It is especially
difficult during the rains because many of the feeder
roads are in poor condition at this time andftherefore,
a considerable portion of the raw product is destroyed
or deteriorates in quality while still in the hands
of the butchers. Thirdly, as regards employment
the same problem that faces the Coffee Curing Works
is equally true of the Tanneries although it employs
' about 460 operatives. Fourthly the industry is
heavily dependent on imported chemicals, machinery and
spare parts further draining Tanzania's foreign
exchange reserves. This is a nationwide problem and
Moshi Tanneries is no exception. As such I am
advising strongly that the chemical, iron and steel
industries be developed and co-ordinated at national
level'*-'*' to provide intermediate inputs into other
industries. This will drastically cut the import
content of these industries and release the scarce
foreign exchange earnings for other more important
uses.
The products of Tanzania Tanneries Ltd. are
1 splits, plain leather, printed leather, sports suede
and suede splits, upholstery leather and garment leather.
11. Raw materials are available locally for these basicindustries: coal and iron in Chunya, phosphates at Kilwa and Arusha, etc.
149
These products can be used in the manufacture of shoes,
belts, hoses, furniture, travelling bags, and garments
to mention only a few. This means that the leather
is an intermediate input into other industries
particularly the shoe industry. The intermediate
stages between leather processing and those industries
that use leather as inputs is the wholesaling and
retailing of leather. In the case study the wholesaler
is the R.T.C. who market and distributes to retailers
and direct leather consumers. In the region there are
a number of small scale shoe-makers, one medium-scale
shoe manufacturer (Karanga Prison) for the uniformed
forces; various furniture manufacturers also utilize
uphostery leather for cushion covers; m/s Shah
Industries in Moshi manufactures various type of
leather handbags and garments;however all these
manufacturers utilize only a small percentage (5%)
of the tanneries output since they are not large-scale
manufacturing concerns. The largest shoe manufacturing
firm, therefore the largest leather consumer, in
Tanzania is located in Dar-es-Salaam. Thus while the
Moshi tanneries is in Northern Tanzania, the Dar-es-
Salaam shoe Company is in Central-Eastern Coast of
Tanzania significantly raising transport costs of
leather. In this respect the Moshi Tanneries has more
forward linkage effect with Dar-es-Salaam than into
immediate hinterland.
150
In conclusion, although the location of
the Tanneries factory has been largely influenced by
the availability of raw material inputs of hides and
skins the linkages that it has with the hinterland
are weak due to a number of factors. First, transport
ation of hides and skins from the hinterland is
hampered by the poor state of feeder roads particularly
during the rainy season. Secondly the handling
techniques of hides and skins at the butchery
level are poor leading to deterioration of quality.
Thirdly, the factory relies heavily on imported
chemicals and machinery in its production process
which is, invariably, constrainted by the inadequate
foreign exchange earnings. Fourthly there is a
serious under utilization of capacity due to lack
of skilled personnel, low productivity and foreign
exchange constraint, among others. Fifthly much of
the output of the factory is not utilized "locally"
(town and hinterland) due to the absence of large-
scale leather consuming industries despite the
fact that the hinterland is a large potential
market for leather goods.
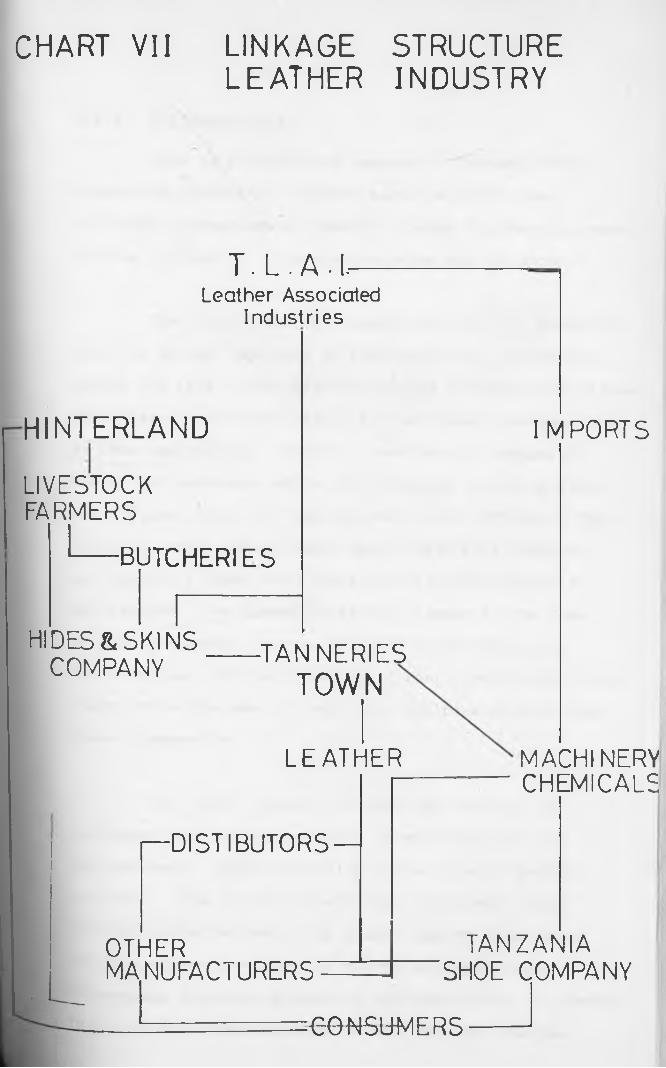
CHART VII LINKAGE STRUCTURELEATHER INDUSTRY
T.L. A . i . -Leather Associated
Industries
HINTERLANDL IV E S T O C KFAR M ER S
B U T C H E R IE S
HIDES & S K IN S CO M PAN Y -T A N N E R IE S
TOWN
L E A T H E R
D IS T IB U T O R S —
O T H E RM A N U FA C TU R E R S
IM P O R T S
M A C H IN ER YC H E M IC A L S
T A N Z A N IA SHOE CO M PAN Y
^-CONSUMERS
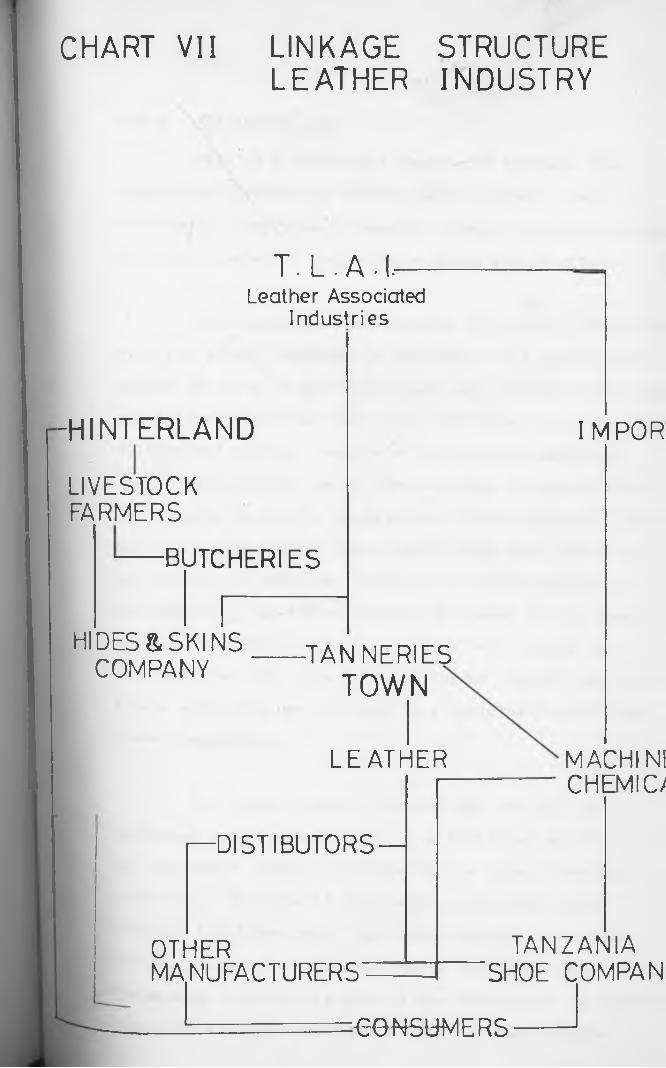
CHART VII LINKAGE STRUCTURELEATHER INDUSTRY
T. L . A • I.—Leather Associated
Industries
-HINTERLANDL IV E S T O C KFAR M ER S
B U T C H E R IE S
H ID E S & S K IN SCO M PAN Y
-T A N N E R IE STOWN
L E A T H E R
■DISTIBUTORS —
O T H E RM A N U F A C TU R E R S
IM P O R
M A C H IN fC H E M ID
T A N Z A N IA SHOE COM PAN
K3GN5UM ERS
151
4:2:5 Kiltimbers Ltd.
This is a subsidiary company of Tanzania Wood
Industries Corporation (TWICO) based in Moshi town.
The complex comprises of sawmill, timber treatment,plywood,
housing components, transmission poles and furniture?
The inputs into the complex are secured primarily
from the forest resources of the hinterland concentrated
around the peak of the Kilimanjaro and softwood plantations
which have been raised mainly in the forest reserve. Tree
felling and hauling require a considerable amount of
labour and machinery while the selection of mature trees
for logging is done by experienced forest officers. The
machinery used include power saws, heavy duty tractors
and lorries to haul the timber to collection points in
the reserve. The transportation of timber to the town
is done by lorries, but this is difficult during the
rains because the roads from the forest reserve are earth
tracks while the use of heavy duty vehicles renders them
almost impassable.
The timber, once it reaches the factory, is
processed into various products as mentioned earlier.
The processes differ according to the type of product
required. The sawmill uses various machinery like
circular breakdown saws, log double edgers, frame saws,
multiple edgers for trimming boards and scantlings
The sawnwood produced is used in the manufacture of plywood,
furniture and other products within the same complex.
152
In the manufacture of plywood glue, pressing and
finishing machineries are used. Various chemicals
are used in timber treatment. Therefore, the various
processes within the complex depend on one another in
some important aspects.
The plywood and part of the sawn wood is sold
to Tanzania Timber Marketing Company Ltd. (Tantimber)
for marketing and distribution to sub-wholesalers and
retailers. Some is exported through the same company.
The rest of the sawn wood is used as an input into the
manufacture of other products within the factory. The
housing components are processed at the complex and these
can be assembled on sites into housing units according
to demand. The transmission poles can be used for
electricity and telephone.
The sawn wood marketed by Tantimber is of great
demand within the area (the town and the hinterland) by
builders and small-scale manufacturers of furniture,
fixtures and other timber products. Small-scale manufac
turing of this type is a vital stage in the linkage
structure of the wood industry, particularly in the hinter
land. The present situation is rather appalling in the
sense that these manufacturers are simply individuals
with one or two assistants with a few tools. Their
businesses are entirely un-economic and unprofitable.
This link could be strengthened by forming furniturefco-operatives which can get access to loans and
technical advice through the responsible public insti
tutions like S.I.D.O. and T.R.D.B.^ These co-operatives
can be conveniently and appropriately located at market
centres where they can display their products. Small-
scale furniture industries can be established without
much capital outlay to provide employment and extra
incomes to the rural unemployed or under-employed as
revealed in Chapter Three.
Another weakness in the linkage structure is the
fact that the existing (and potential) small-scale
markets of wood products located in the hinterland have
to incur extra transportation costs in securing the
sawn wood from Tantimber which is in Moshi town. The
extra cost makes their products more expensive than
those obtainable in the town from equivalent manufacturers.
Therefore, the marketing and distribution of timber
should be spread all over the hinterland at selected
convenient locations.
The employment linkages of the factory and their
subsequent weaknesses need not be restated here since
these are similar to those discussed under Section 4:2:1.
11 -S.I.D.O = Small Industries Development Organization, a public institution mainly based in towns
TRDB = Tanzania Rural Development Bank.
- 153 -
154
The complex had 600 employees in 1980. Further,
there is the problem of under-utilization of capacity.
For example, although the factory has the capacity3
of producing 21,300 m of sawn wood, it only produced34,600 m in 1980. Problems facing the factory include
inadequate technical expertise, low productivity, and
lack of foreign exchange to procure imported machinery,
spare parts and chemicals.
The wood industry is one of the industries with
potential backward and forward linkages if properly
planned, co-ordinated and located. The problems
discussed above as regards the Kiltimber factory, un
cover the weaknesses in the linkage structure such that
maximum benefits do not accrue to the people of the
hinterland from the industry. Increased production at
the factory means increased employment opportunities and
more incomes. The increased output can be utilized as
inputs into other industries, say furniture manufacture,
further generating more employment and income. However,
increased production at Kiltimber factory implies
availability of raw materials such as wood and chemicals
Above all, availability, nature and the extent of the
markets - both domestic and foreign must have been
initially assessed. This means that the backward and
forward linkages must be planned in advance. It is not
155
enough simply to plunk a big industrial project in an
area as was the case of Kiltimbers and other industries
located in Moshi. Furthermore, Kiltimbers is known to
produce large quantities of bye-products such as saw-dust
and wood shavings, but these are not used productively.
4:3:0 Concluding Remakrs
After the commissioning of Tanzania Tanneries and
Bag Factory in the early 1970's, no other significant
manufacturing enterprise has been established in Moshi
since then except the on-going construction of Machine
Tools Plant which is expected to turn out 485 machine
tools per year including universal lathes, bench and column
drilling machines, universal power saws, etc. Although
it will lay a good basis for the engineering industry,
there are a number of shortcomings because the component
parts of the industry will be in locations far removed
from each other. While the Moshi Machine Tools plant
happens to be in northern Tanzania, the technical
training centre will be in Mwanza in the North-West
and the iron and coal deposits still to be developed
are in Southern Tanzania.
Further although the industrial base of Moshi
expanded in the early years of independence, the content
of that industrialisation is far from being comprehensive.
156
It reflects very little forward and backward linkages
between and within various sectors. It has not
succeeded even in its genuine import substitution.
The sustained importation of key industrial inputs is
a clear illustration of this type of industrialization.
Again, the raw material base of the hinterland is yet
to be exploited to strengthen the linkage structure.
For example, the T.P.C. sugar refinery, only 20 kilometres
from the town, produces molasses as a bye-product in the
region of 20,000 tons per annum. From molasses, it is
possible, among other things, to manufacture pharmaceuticals
and alcohol which might provide the basis of chemicals and
plastics industry. Instead of building such complementary
industries, Tanzania exports molasses and then at a much
higher cost imports spirits and pharmaceuticals. The
same can be said of other industries that have been
established at Moshi.
The capital-intensive bias of the Moshi based
industries has several consequences as a result of its
effects on both the nature and volume of employment.
Firstly, it narrows down employment opportunities. Secondly,
because capital-intensive techniques tend to employ a semi
skilled and professional type of labour, which receives
\
relatively higher wages, it tends to accentuate the
disparities in income between the town and the hinter
land. My survey confirms this income disparity - while
the factory operative has an average annual wage of
T.Shs.9515, the agricultural farmer get T.Shs.5565/-
per annuam. Further, Moshi’s industrial sector has
so far failed to solve the problems of unemployment
both in the town and the hinterland. While the latter
provides food for the urban population and raw materials
for the industrial sector, it gets nothing in return -
thus the town has essentially remained parasitic to the
hinterland.
The analysis of economic and social infrastructure
shows that there is a great disparity in development
between the urban area and the hinterland. The roads of
the hinterland, which are very important in the industrial
linkage structure, are earth tracks and poorly maintained;
the people use for domestic purposes disease-prone
untreated water from rivers, streams or furrows. The
hinterland has less social facilities per population as
compared to the town.
- 157 -
158
CHAPTER FIVE
5:0:0 CONCLUSIONS AND RECOMMENDATIONS
5:0:1 Research Findings
This study has basically emphasized the relation
ship of Moshi’s industrial sector with its immediate
hinterland. The industrial sector was examined in terms
of the nature and type of industries, raw material inputs
and production outputs as well as employment and incomes.
The town’s different land uses were analysed with respect
to commerce, residence, transportation, major community
facilities and finally public utilities. These facilities
are important because they are directly or indirectly,
related to the establishment of industries. The emphasis
on the industrial sector was on backward and forward
production linkages - for example, in the case of coffee
industry, different production levels at farm, pulpery,
buying post and the coffee curing factory were analysed
while its processing for export was examined. All these
stages encompassed production, employment, transportation
and commercial linkages. Apart from the coffee curing
factory, four other industries were considered with
respect to the linkages. This led to the identification
of the concrete relationship between these industries
with the rural hinterland. In this way, the effectiveness
of Moshi as an industrial centre, in minimizing the hinter
land's unemployment and other related problems was critica
159
lly examined and whether it has been able to provide
the required goods and services for rural consumption.
The study went further in analysing the hinter
land in terms of population, resource base - existing
and potential, and the hinterland’s contribution like
wise to the growth of Moshi town. Furthermore, the
type and nature of communication linkages both with
the town and other parts of Tanzania were identified.
However, the study has found out that the
inherited colonial spatial structure has continued to
predominate. Moshi town remains an outpost of the
world market system bearing little or no relation to
its hinterland. This is a clear indication that the
various government strategies and policies have not
succeeded in integrating and re-orienting the economy
internally. In addition, although the hinterland
is endowed with fertile agricultural land, good natural
resources like forests and tourist resources, leave
alone educated population, it is still lagging behind
the town. Consequently, Moshi town continues to
attract more human and capital resources from the rural
areas. Thus, the relationship that exists between the
town and its hinterland is one-way: it is parasitic
and the town’s industrial sector has little, if any,
economic spread effect over its hinterland.
160
This analysis has established that the relationshi
of the industrial sector with the hinterland is weak. I
has limited contribution to the development of the latte
because it only siphons off labour and raw materials
from the rural areas and gives back little or nothing in
return.
The town itself has a high unemployment rate
despite the existence of industrial concentration within
the town. The urban industries are not generating adequ
employment opportunities at a rate commensurate with
urban population increase while in the hinterland, unemplc
is the order of the day despite the fact that many peop
have basic education.
The exodus of the most productive age-groups to th
urban areas mostly Arusha and Dar es Salaam has a
depressing effect upon the rural farm economy and its
revenue producing capacity. The reasons for mass out
migration include development disparity between urban
and rural areas, landlessness among young people, and th
education that prepares the students for white-collar
jobs in the modern sector. The greater drift to Arusha
and Dar es Salaam other than Moshi is due mainly to in
adequate employment opportunities at the latter.
161
The regional development policies formulated
so far i.e. the nine growth poles strategy and the
zonal growth poles for industrial location have had
little success to bring about effective regional
development or limiting the outmigration of people from
the region to Dar es Salaam in particular. The third
Five Year Plan of industrial decentralization has
succeeded in centralising industries in Dar es Salaam,
Morogoro and Arusha contrary to the policy itself.
Yet Moshi town has a high industrial potential
which should be exploited. Constraints to industrial
development of the town are non-existent in the way of
land, power, water and economic infrastructural facilities
with transportation links to all parts of the country
by road, railway and air; facilities exist for
connections to other countries too. Unutilized market
exist in the hinterland whose current population is
approaching a million and who do not get industrially
produced basic goods and services. Shortage of
consumption goods is rampant in the hinterland and
the fact that the industrial sector is unable to provide
at least some of these much needed goods is indicative
of low industrialisation and/or poor forward and backward
linkages.
162
5:2:0 Recommendations
In view of the foregoing identified problems
limiting the efficient functioning of Moshi as an
industrial growth centre and the weaknesses presently
inherent in the industrial production linkages, it is
essential that the study recommends some strategies
that will at least alleviate the salient problems
afflicting both the hinterland and the town. In both
cases, the coffee industry is given more emphasis due
to its importance in the area although other aspects
are also considered.
5:2:1 Hinterland
(a) At the farm level, the main issue is not
quantity, but quality as far as coffee is concerned.
The ripe coffee berries from the numerous smallholders
should be delivered to centrally-run pulperies where
quality control can easily be effected. The establish
ment of central pulperies is the key to quality
improvement of coffee if the farmers are to realise more
incomes. However, these coffee factories require trained
and skilled manpower to provide proper management.
It is advised that the establishment of these pulperies
should be the responsibility of C.A.T. who have the
means to do so in terms of manpower and finance. Further
163
initial supervision can be provided by the same
institution before the factories are handed over to
co-operatives. Proper phasing is particularly important
in order to permit the sharing of experiences. With
these objectives in mind, the project can be completed
within a 10 year period.
(b) Since the buying posts are run by C.A.T. with
personnel un-knowledgeable to local conditions while
the populace has no say in the management of C.A.T.
itself, then the defunct Co-operative Union should be
re-introduced. This means that the Ujamaa Villages as
registered Co-operatives should work under the umbrella
of the Co-operative Union,run the buying posts as was
the case before (1976) and be able to share experiences.
The consequence of this policy is the reduction of
C.A.T.'s top-heavy bureaucracy, most of whom have no
coffee production experience. In addition, the Co
operative Union having local grassroot experience can
articulate local initiative and participation under
Ujamaa Socialism for the benefit of the masses. It
is advised that this exercise be started immediately
and can be completed within the next five years.
(c) The Village Co-operatives, under the Co-operative
Union can be granted loans through the Rural Development
164
Bankto buy vehicles for transporting coffee and other
products to Moshi town. This will facilitate increased
efficiency in the delivery of coffee for further
processing. In this way, transportation linkages become
more effective for rural development.
(d) In view of the fact that subsistence production
is inadequate to feed the people of the hinterland JLet
alone the town’s population,due to over-reliance and
over-dependence on coffee, then it is recommended that
partial diversification of crop production be carried out
in the coffee-banana belt. Emphasis should be placed
on food crops such as beans, maize and bananas. The
Ministry of Agriculture in co-operation with regional
authorities can provide extension officers, improved
seed and better methods of crop husbandry to facilitate
increased food production for self-sufficiency. The
banana is the chief food crop of the hinterland. In some
seasons, there is excess supply, but due to lack of
cold storage facilities and other methods of preservation,
the crop is left in the field to rot. Ways should be
found on how to preserve the crop so that it can be used
in drought seasons even if it means reviving the long
abandoned traditional method of preservation.
165
Promotion of protein-yielding foods should be
embarked upon by the regional, district and village
leaders as well as agricultural officers. This is
important in the sense that malnutrition is on the
increase due to less consumption of proteins. It is
advised to establish and encourage ,in addition to
beans, piggery, poultry and dairy farming which can be
carried out in the coffee-banana belt as part of the
integrated rural development programme; beans and maize
do well in the Moshi Plains, and rice under irrigation,
in the Pangani Valley. It is recommended that more
investment in irrigation be made available in the plains
by joint collaboration of Regional authorities and
Ministries of Agriculture and Water Development.
(e) Implementation of the last recommendation is
crucial because it will partially solve the problem
of population pressure.Given the fact that agricultural
resources are close to a limit in terms of extensive
exploitation in the highland areas then emigration
to the plains (Moshi Plains , Pangani Valley and
Mkomazi) has to be considered urgently. There are still
substantial areas of cultivable but unused land in the
peripheral areas of the region suitable for the
accommodation of overspill population from the densely
populated central areas. Such land, however, require
considerable investment in clearing or, as the case of
166
Pangani Valley and Moshi Plains, in the provision
of irrigation facilities. But this investment is
necessary as one of the ways of solving population
pressure and its subsequent unemployment and under
employment in the hinterland. The settled overspill
population will contribute towards the development
of the hinterland in particular and the nation as a
whole by being effectively employed in agriculture.
Regional authorities, Ministries of Agriculture and
Water should be involved right from the beginning. This
has to be a long term project requiring co-ordination
at all levels and has to begin immediately.
(f) Development of small-scale industries in the
hinterland utilizing locally available materials is very
essential. Industrial estates can be established
initially at district headquarters of Sanya Juu, Moshi
Rombo and Same by the Small Industries Development
Organization (S.I.D.O.) The latter, in conjunction
with the district authorities, can then help in
establishing small-scale industries on co-operative
basis in the established Ujamaa Villages. Such industries
include the manufacture of furniture and allied wood
products, jaggery production, flour milling, show
making and repair, brick-making and metal works, among
others. What should be observed in the location of
167
these industries is the availability of raw material
inputs and the existence of power and transportation
links. These factors must be utilized to the benefit
of the industries. The fundamental objective of the
estates is to improve and impart industrial skills
in general. The allotment of land for small-scale
industry should be given top priority along with consi
derations of water, power and transportation links.
The existing market centres offer the first locational
sites for these industries. Map. No. ll(a)shows the small
scale industrial location proposed sites along the lines
discussed here. In conjunction with small-scale
industrialisation, the extent of local and regional
markets must be explored in terms of which products
have to be produced and their respective level of demand.
(g) The haulage of raw materials and other products
from the hinterland to the town requires good transpor
tation links. It is, therefore, proposed that the
existing road network in the resource hinterland be
improved and regular maintenance should be provided.
This is significant because it will greatly strengthen
the trasnportation linkages between the town and the
hinterland hitherto considered as weak. The road improve
ment project can provide bitumen on some roads and
168
engineered gravelling on others according to need
and financial availability. These proposals can be
seen in the map No. H ( a)
(h) Another priority area is rural electrification
the effects of which can be extended to the social,
agricultural and industrial spheres. It is proposed
that rural electrification which has already started
in Western Kilimanjaro can be extended to other rural
areas in the hinterland. Electricity helps to improve
the services of hospitals by making it possible to use
modern equipment and by providing power to rural
small-scale industries. It can also be used in irrigation
work, in processing particularly the proposed central
pulperies and in other manufacturing plants.
5:2:3 Moshi Town
Given the fact that the town's industrial
potential is so far unexploited, then it is essential
that the government, parastatal institutions and private
entrepreneurs channel increased investment in industries,
so that the town can function efficiently and optimally
as an industrial growth centre. The existing supply
of water and electricity can be readily utilised for
169
industrialisation purposes while the good communications
linkages with the rest of the country provides an
additional impetus in the establishment of industries in
the town. Increased and better utilisation of the raw
materials from the hinterland and subsequent processing
of products for local consumption will in the final
analysis, re-orient the economy interally. This implies
that, initially, the existing industries must widen their
scope in the production process such that the present
outputs are used as inputs in the processing for final
demand. The implementation of this strategy will further
enhance and strengthen the production, employment and,
in particular, the commercial and distribution linkages.
The overall objective is to increase the industrial
sector's contribution to the urban and rural economies in
terms of additional incomes and employment opportunities.
However, this does not preclude the establish
ment of new industries. In fact, this strategy should
go hand in hand by establishing the kind of industries
that utilize the local materials and process products for
local consumption.
As regards the coffee industry, the following
factories are recommended:
170
(a) Production of Coffee Charcoal
In the curing of coffee, coffee husks are produced
as a by-product. Presently, they are considered as a
waste and in fact, a cost to the Curing Factory. The
proposed plant will change all these by utilizing the
husks as raw material in the production of synthetic
charcoal or coffee briquettes. The charcoal will be used
as an alternative source of energy for heating and cooking.
In addition to keeping the environment clean, the plant
u'ill also reduce the destruction of forests. It is
recommended that the plant be established near the Coffee
Curing Works where land is available for extension possi
bilities. It is advised that the research and the esta
blishment of the coffee plant be the ultimate responsibility
of T.C.C.C. Ltd. in collaboration with C.A.T. who may have
the requisite capital outlay.
(b) Production of Instant Coffee
Processing of hulled arabica coffee into instant
coffee for final consumption will complete the production
linkages that were earlier identified as missing. Canned
instant coffee can be marketed locally as well as for
export. This will widen the income earning capacity of
the product since it will fetch higher prices than the
171
semi-processed coffee. This, in the final analysis,
expands the role of coffee as a foreign exchange
money spinner. T.C.C.C. Ltd. is the proper institu
tion adequately placed to establish the plant because
instant coffee processing is simply an extension of
coffee curing production process.
(c) Finally, T.C.C. Ltd.9.1ong with C.A.T. and the
proposed Co-operative Union, is advised to examine
the possibility of extracting by-products from coffee
such as liquor. The success in this venture will
definitely enhance the role of the crop as a money earner
rather than simply a beverage.
In conjunction with the recommendations made
regarding the coffee industry in the hinterland, the
coffee related industries proposed in the town will
strengthen and enhance the backward and forward
linkages of the coffee industry. Especially important
are the inter-industry linkages of which the proposals
seek to strengthen. More employment opportunities
will be created at all levels, more incomes will be
earned and the subsequent spread effects will affect
all the sectors of the economy both at the regional
level and the nation as a whole.
172
Other industries linked to the resource hinter
land should also be established. The establishment
of a sugar complex at Moshi may produce various
products. Bagasse from crushed cane can be used in
the production of roofing sheets, packing material and
paper. Molasses can be used in the production of alcohol
which can provide the basis of a small-scale industry
as well as pharmaceuticals. All these raw materials
are available from the large sugar plant at Arusha Chini.
A dairy plant is necessary to process milk from the
hinterland - milk production is going to increase
tremendously as per proposal 5:2:1 (b) above. There
is need to establish cold storage facilities in the
town to cater for poultry meat, eggs, vegetables and
bananas from the hinterland ready for marketing in other
urban areas especially Dar es Salaam. It is also reco
mmended that a large-scale shoe and leather garment
factory be located at Moshi so that it can utilize the
leather produced by Tanzania Tanneries plant as raw
material. The forest products industry can be expanded
to include the manufacture of fabricated timber products
such as blockboard, hardboard, softboard, building
board, pencils and cellulose rayon. All these industries
should be included in the town's industrialization
strategy for the next 20 years up to 2,000 A.D.
173
In the short run it is recommended that
utilization of capacity of existing industries should
be emphasized in order to boost up production. Where
possible factory expansion should be carried out at
the existing sites. This is particularly true of the
Kibo match, bag and the tanneries factories. The
exercise of industrialisation must consider critically
the problem of importation of machinery and chemicals.
The establishment of iron, steel and chemical industries
will have to be incorporated in the national industrial
policy strategy so as to reduce the importation of these
products. This is significant because these are
basic industries that produce intermediate inputs into
all other industries.
To ensure that all these proposals are
actually implemented a regional committee for industria
lisation should be formed under the Chairmanship of
the Regional Commissioner to ensure government
backing. It should have a permanent secretariat
headed by an executive secretary preferably the Chairman
of the proposed Co-operative Union. Representatives of
the Ministries of industry, trade, agriculture,
water and power, regional development director and town
council must be included in the Committee. The latter
must be empowered to carry out feasibility studies,
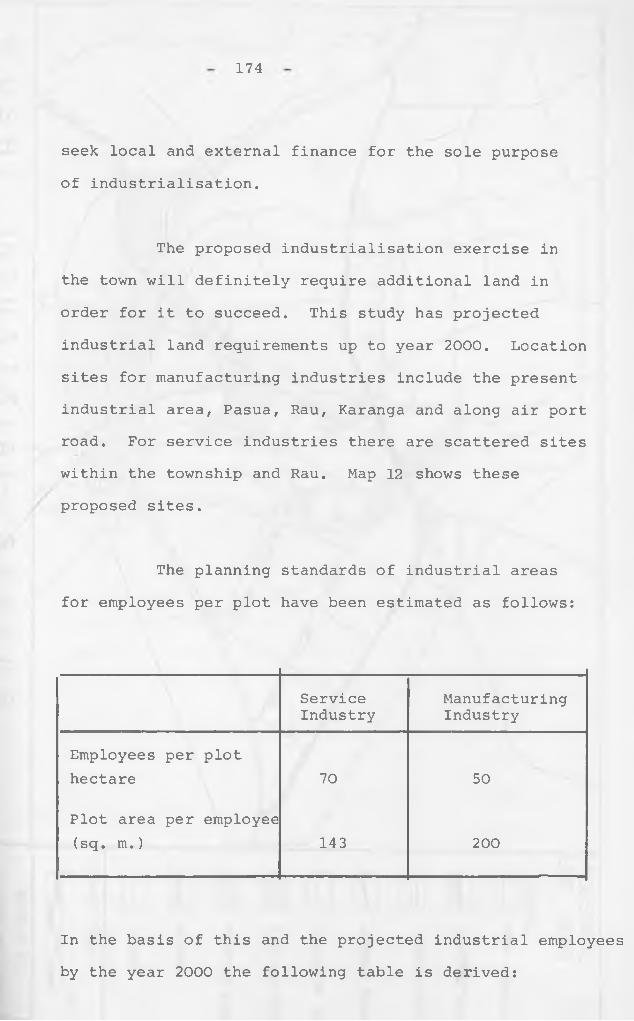
174
seek local and external finance for the sole purpose
of industrialisation.
The proposed industrialisation exercise in
the town will definitely require additional land in
order for it to succeed. This study has projected
industrial land requirements up to year 2000. Location
sites for manufacturing industries include the present
industrial area, Pasua, Rau, Karanga and along air port
road. For service industries there are scattered sites
within the township and Rau. Map 12 shows these
proposed sites.
The planning standards of industrial areas
for employees per plot have been estimated as follows:
ServiceIndustry
ManufacturingIndustry
Employees per plothectare 70 50
Plot area per employee(sq. m.) 143 200
In the basis of this and the projected industrial employees
by the year 2000 the following table is derived:
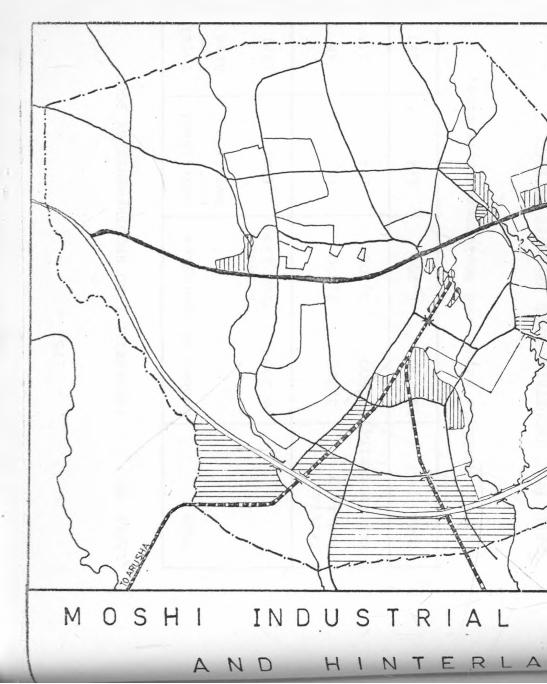
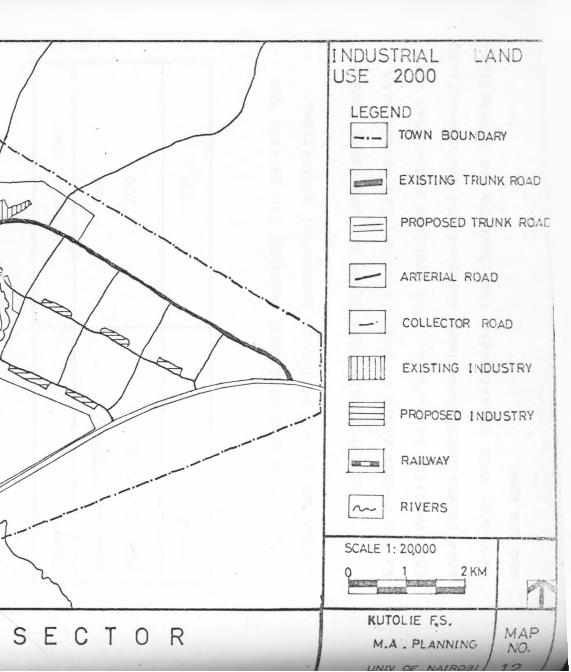
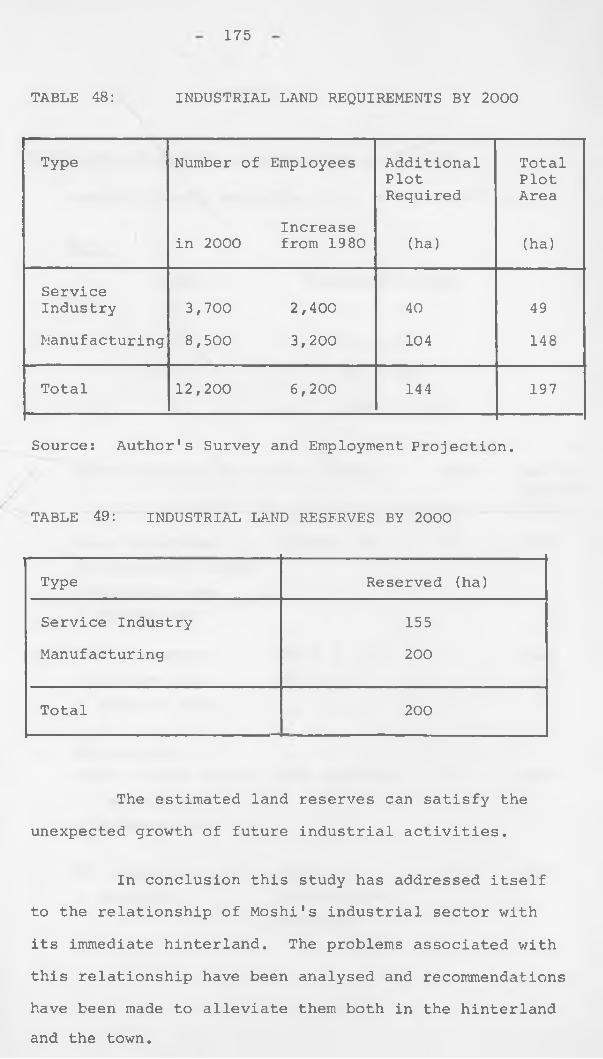
175
TABLE 48: INDUSTRIAL LAND REQUIREMENTS BY 2000
Type Number of Employees AdditionalPlotRequired
TotalPlotArea
in 2000Increase from 1980 (ha) (ha)
ServiceIndustry 3,700 2,400 40 49
Manufacturing 8,500 3,200 104 148
Total 12,200 6,200 144 197
Source: Author's Survey and Employment Projection.
TABLE 49: INDUSTRIAL LAND RESERVES BY 2000
Type Reserved (ha)
Service Industry 155
Manufacturing 200
Total 200
The estimated land reserves can satisfy the
unexpected growth of future industrial activities.
In conclusion this study has addressed itself
to the relationship of Moshi's industrial sector with
its immediate hinterland. The problems associated with
this relationship have been analysed and recommendations
have been made to alleviate them both in the hinterlandand the town.
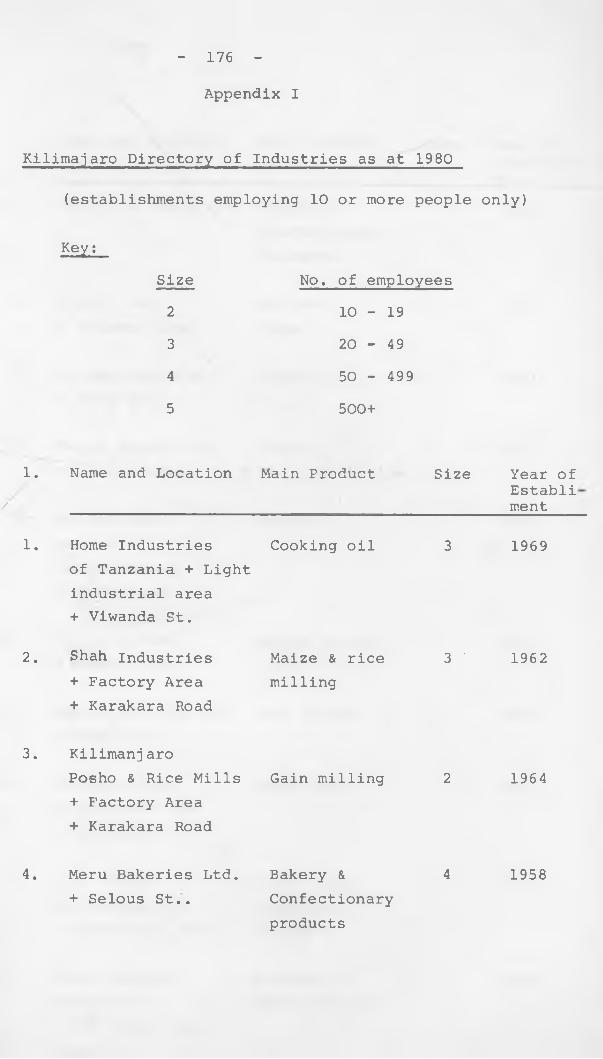
Appendix I
- 176 -
Kilimajaro Directory of Industries as at 1980
(establishments employing 10 or more people only)
Key=Size No. of employees
2 10 - 19
3 20 - 49
4 50 - 499
5 500+
1 .
/
Name and Location Main Product Size Year of Establi' ment
1 . Home Industries Cooking oil 3 1969of Tanzania + Lightindustrial area+ Viwanda St.
2. Shah industries Maize & rice 3 ' 1962+ Factory Area + Karakara Road
milling
3. Kilimanjaro Posho & Rice Mills + Factory Area + Karakara Road
Gain milling 2 1964
4. Meru Bakeries Ltd. Bakery & 4 1958+ Selous St.. Confectionary
products
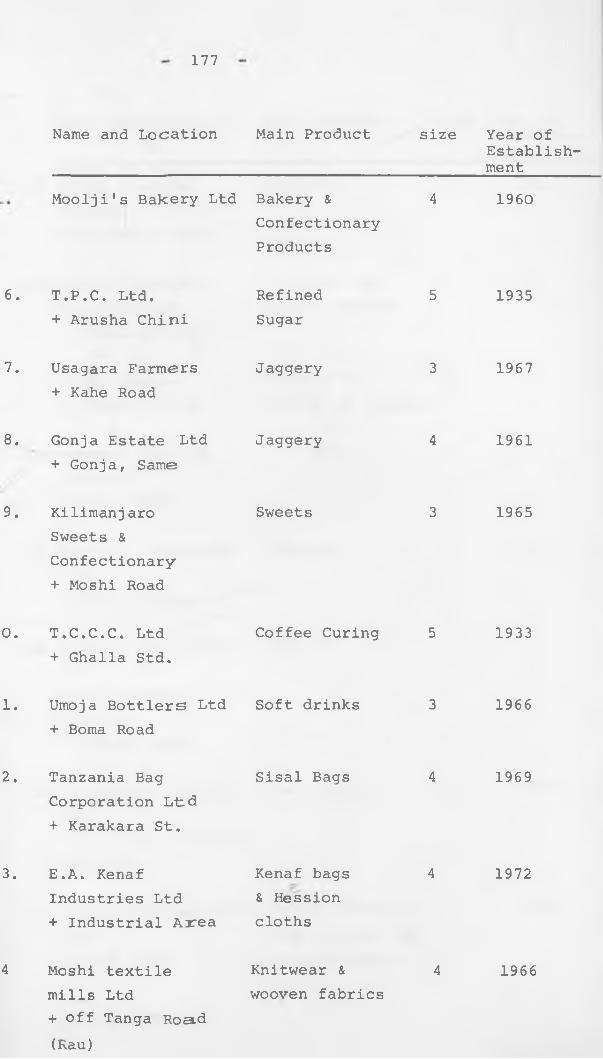
177
Name and Location Main Product size
Moolji's Bakery Ltd Bakery & 4ConfectionaryProducts
6. T.P.C. Ltd.+ Arusha Chini
7. Usagara Farmers + Kahe Road
8. Gonja Estate Ltd + Gonja, Same
9. Kilimanjaro Sweets & Confectionary + Moshi Road
0. T.C.C.C. Ltd + Ghalla Std.
1. Umoja Bottlers Ltd + Boma Road
2. Tanzania Bag Corporation Ltd + Karakara St.
3. E.A. Kenaf Industries Ltd+ Industrial Area
4 Moshi textile mills Ltd + off Tanga Road (Rau)
Refined 5Sugar
Jaggery 3
Jaggery 4
Sweets 3
Coffee Curing 5
Soft drinks 3
Sisal Bags 4
Kenaf bags 4& Hessioncloths
Knitwear & 4wooven fabrics
Year ofEstablishment
1960
1935
1967
1961
1965
1933
1966
1969
1972
1966
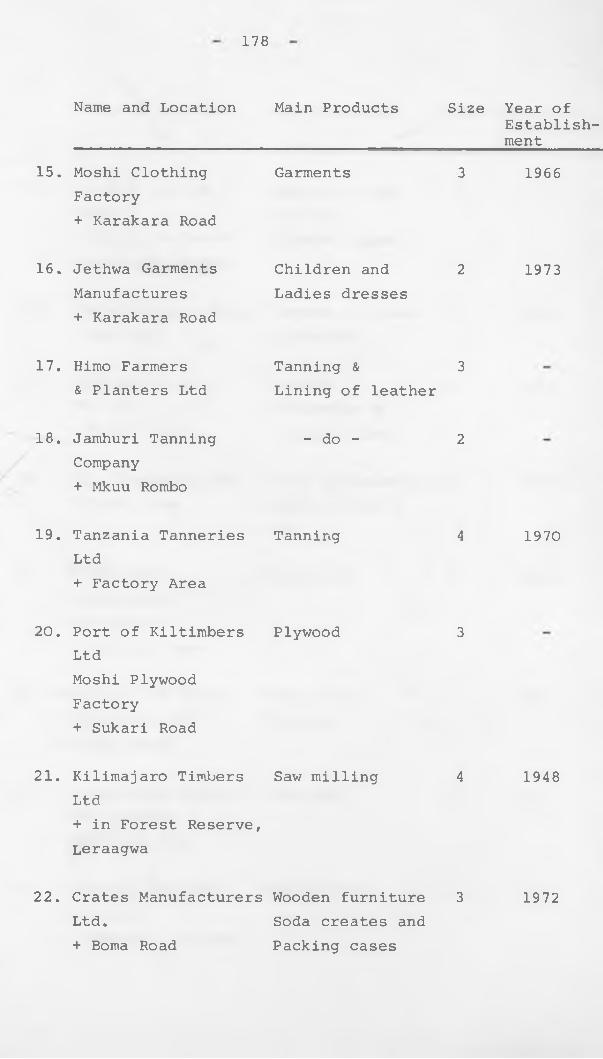
178
Name and Location Main Products Size
15. Moshi Clothing Garments 3Factory+ Karakara Road
16. Jethwa Garments Children and 2Manufactures Ladies dresses+ Karakara Road
17. Himo Farmers & Planters Ltd
Tanning & 3Lining of leather
18. Jamhuri Tanning - do - 2Company + Mkuu Rombo
19. Tanzania Tanneries Tanning 4Ltd+ Factory Area
20. Port of Kiltimbers Plywood 3LtdMoshi Plywood Factory + Sukari Road
21. Kilimajaro Timbers Saw milling 4Ltd+ in Forest Reserve,Leraagwa
22. Crates Manufacturers Wooden furniture 3Ltd. Soda creates and+ Boma Road Packing cases
Year ofEstablishment
1966
1973
1970
1948
1972
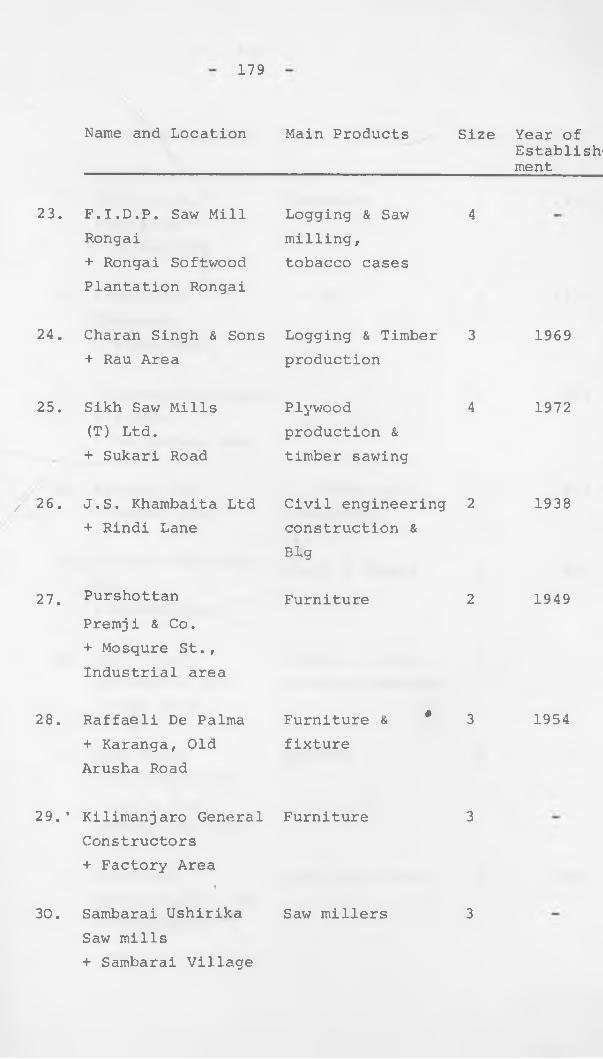
179
Name and Location Main Products Size Year ofEstablishment
23. F.I.D.P. Saw Mill Rongai+ Rongai Softwood Plantation Rongai
24. Charan Singh & Sons + Rau Area
25. Sikh Saw Mills (T) Ltd.+ Sukari Road
/ 26. J.S. Khambaita Ltd+ Rindi Lane
27. Purshottan Premji & Co.+ Mosqure St., Industrial area
28. Raffaeli De Palma + Karanga, Old Arusha Road
29. ’ Kilimanjaro GeneralConstructors+ Factory Area
%
30. Sambarai Ushirika Saw mills+ Sambarai Village
Logging & Saw 4milling, tobacco cases
Logging & Timber 3 1969production
Plywood 4 1972production & timber sawing
Civil engineering 2 1938construction &Big
Furniture 2 1949
Furniture & # 3 1954fixture
Furniture 3
Saw millers 3
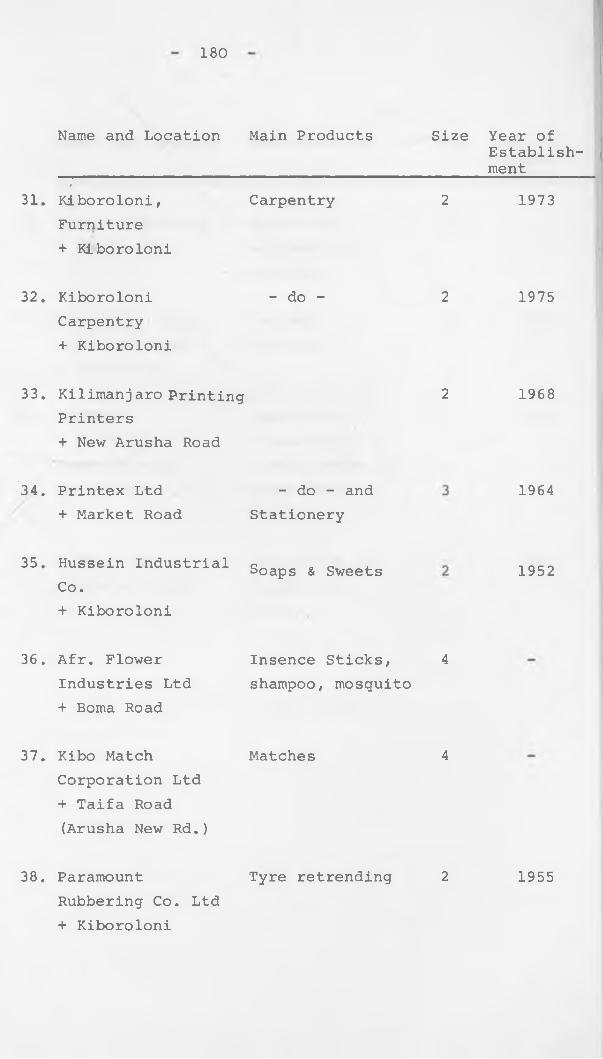
180
Name and Location Main Products Size Year ofEstablish-
________________________________________________ment______f
31. Kiboroloni, Carpentry 2 1973Furniture+ Kiboroloni
32. Kiboroloni - do - 2 1975Carpentry+ Kiboroloni
33. Kilimanjaro Printing 2 1968Printers+ New Arusha Road
34. Printex Ltd + Market Road
- do - and Stationery
1964
35. Hussein Industrial Co.+ Kiboroloni
Soaps & Sweets 1952
36. Afr. FlowerIndustries Ltd + Boma Road
Insence Sticks, 4shampoo, mosquito
37. Kibo Match Matches 4Corporation Ltd + Taifa Road (Arusha New Rd.)
. ParamountRubbering Co. Ltd + Kiboroloni
38 Tyre retrending 2 1955
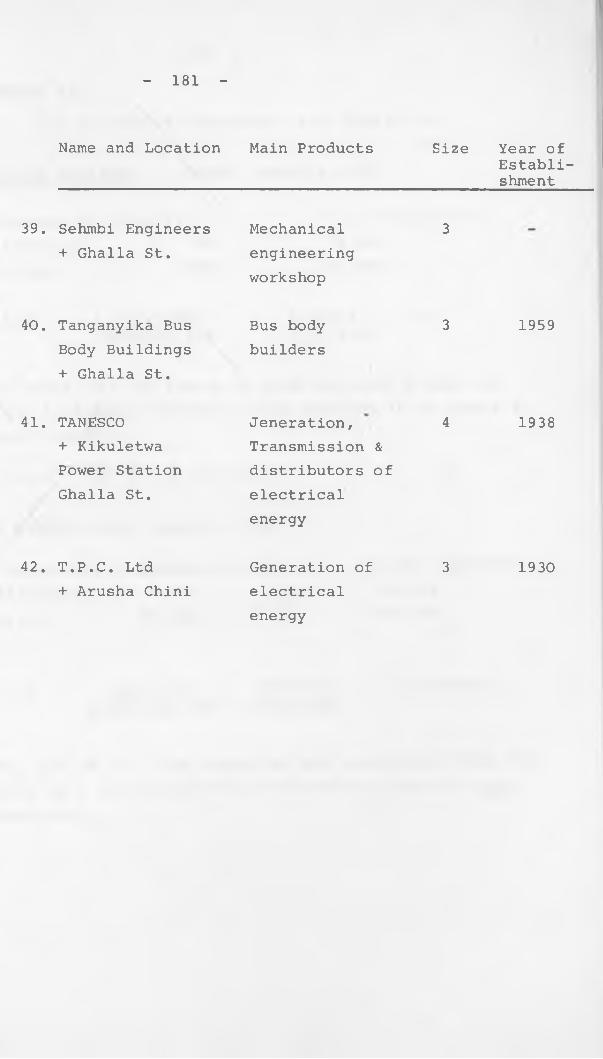
- 181 -
Name and Location Main Products Size
39. Sehmbi Engineers + Ghalla St.
40. Tanganyika Bus Body Buildings + Ghalla St.
41. TANESCO+ Kikuletwa Power Station Ghalla St.
42. T.P.C. Ltd+ Arusha Chini
Mechanical 3engineeringworkshop
Bus body 3builders
Jeneration, 4Transmission & distributors of electrical energy
Generation of 3electricalenergy
Year of Establishment
1959
1938
1930
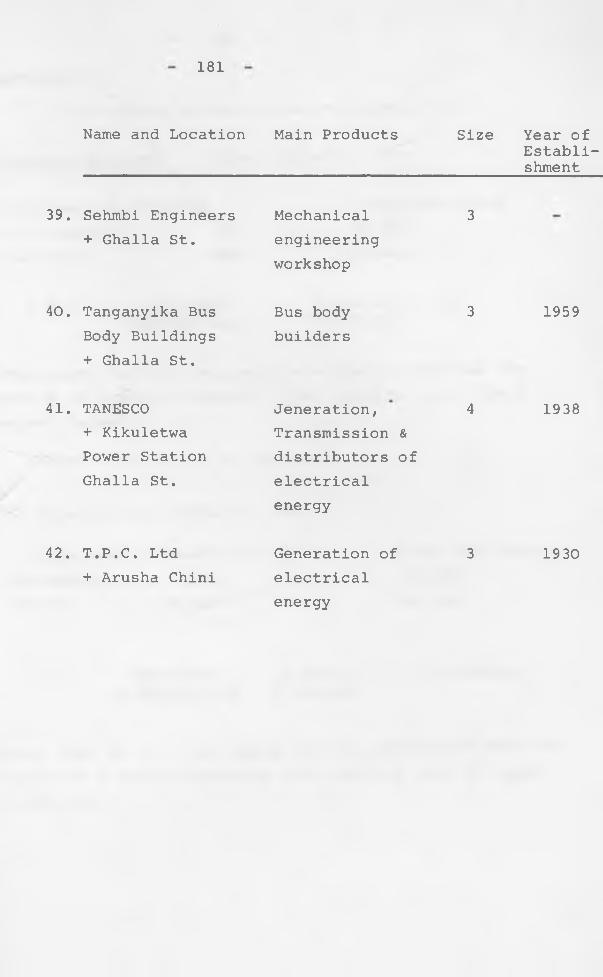
181
Name and Location Main Products Size Year ofEstablishment
39. Sehmbi Engineers + Ghalla St.
Mechanicalengineeringworkshop
3
40. Tanganyika Bus Body Buildings + Ghalla St.
Bus body builders
3 1959
41. TANESCO+ Kikuletwa Power Station Ghalla St.
Jeneration, Transmission & distributors of electrical energy
4 1938
42. T.P.C. Ltd+ Arusha Chini
Generation ofelectricalenergy
3 1930
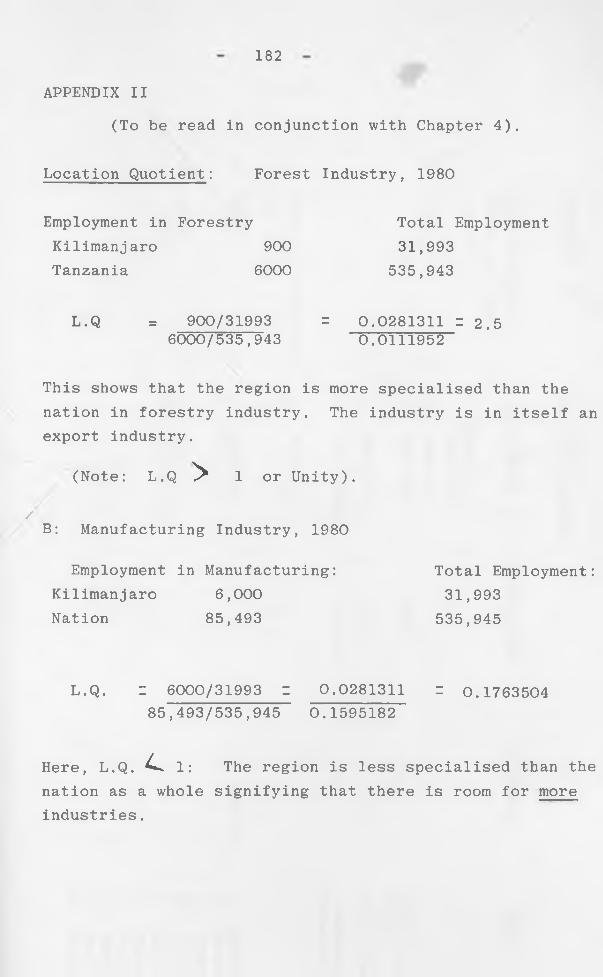
1 8 2
APPENDIX II
(To be read in conjunction with Chapter 4).
Location Quotient: Forest Industry, 1980
Employment in Forestry Kilimanjaro 900Tanzania 6000
Total Employment 31,993
535,943
L.Q = 900/319936000/535,943
= 0.0281311 Z 2.50.0111952
This shows that the region is more specialised than the nation in forestry industry. The industry is in itself an export industry.
(Note: L.Q ^ 1 or Unity).
/ vB: Manufacturing Industry, 1980
Employment in Manufacturing:Kilimanjaro 6,000Nation 85,493
Total Employment: 31,993
535,945
L.Q. I 6000/31993 I 0.0281311 z 0.1763504 85,493/535,945 0.1595182
Here, L.Q. c 1: The region is less specialised than thenation as a whole signifying that there is room for more industries.

183
APPENDIX II LEATHER INDUSTRY.
Raw Materials Processes1. Hides and skins2. Water 1 . Washing
(soaking)3. Lime 2. Liming
3. Hairing
4. Fleshing5. De-liming
4. Chemical extracts 6. Tanning(e.g. Bark)
5. Salt 7. Washing8. Drying
6. Dyes 9. Dyeing10. Finishing
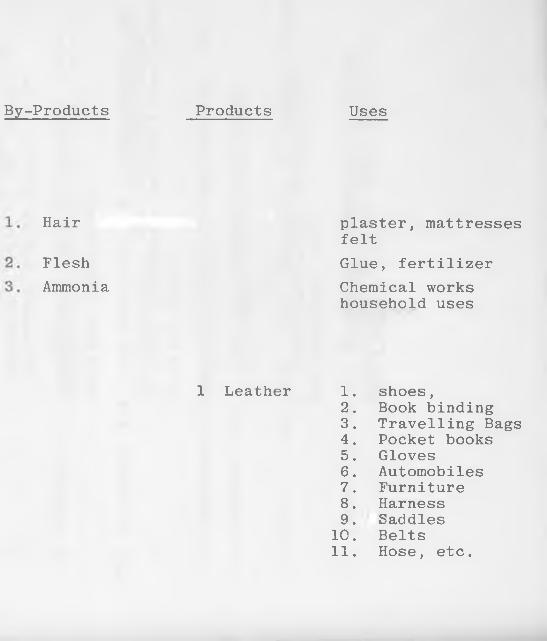
By-Products Products Uses
Hair
FleshAmmonia
plaster, mattresses feltGlue, fertilizerChemical works household uses
1 Leather 1.2 .3.4.5.6 .7.8 .9.
1 0 .11.
shoes,Book bindingTravelling BagsPocket booksGlovesAutomobilesFurnitureHarnessSaddlesBeltsHose, etc.
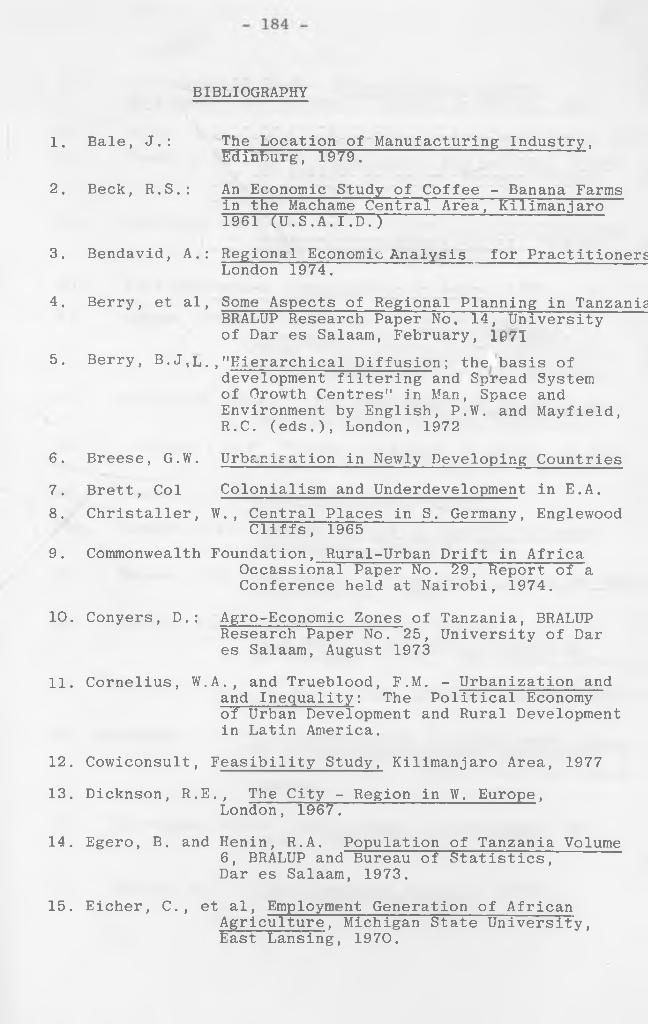
BIBLIOGRAPHY
1. Bale, J.: The Location of Manufacturing Industry,Edinburg, l£)79. ~ S ^
2. Beck, R.S.: An Economic Study of Coffee - Banana Farmsin the Machame Central Area, Kilimanjaro 1961 (U.S.A.I.D.)
3. Bendavid, A.: Regional Economic Analysis for PractitionersLondon 1974. '
4. Berry, et al, Some Aspects of Regional Planning in TanzaniaBRALUP Research Paper No, 14, University of Dar es Salaam, February, 1971
5. Berry, B .J, L .,"Hierarchical Diffusion; the basis ofdevelopment filtering and Spread System of Growth Centres" in Man, Space and Environment by English, P.W. and Mayfield, R.C. (eds.), London, 1972
6. Breese, G.W. Urbanisation in Newly Developing Countries7. Brett, Col Colonialism and Underdevelopment in E.A,8. Christaller, W. , Central Places in S. Germany, Englewood
Cliffs, 19659. Commonwealth Foundation, Rural-Urban Drift in Africa
Occassional Paper No. 29, Report of a Conference held at Nairobi, 1974.
10. Conyers, D.: Agro-Economic Zones of Tanzania, BRALUPResearch Paper No. 25, University of Dar es Salaam, August 1973
11. Cornelius, W.A., and Trueblood, F.M. - Urbanization andand Inequality: The Political Economyof Urban Development and Rural Development in Latin America.
12. Cowiconsult, Feasibility Study, Kilimanjaro Area, 1977
13. Dicknson, R.E., The City - Region in W. Europe,London, 1967.
14. Egero, B. and Henin, R.A. Population of Tanzania Volume6, BRALUP and Bureau of Statistics,Dar es Salaam, 1973.
15. Eicher, C., et al, Employment Generation of AfricanAgriculture, Michigan State University,East Lansing, 1970.
18516. El-Shakhs and Obudho, Urbanization, National
Development and Regional Planning in Africa, 1975
17. Field, A.J.: City and Country in the Third World,197018. Frank, C.R.: nUrban Unemployment and Economic Growth
in Africa" in Oxford Economic Papers, July, 1968.
19. Fu-Chenlo and Kamal Salih, Growth Pole Strategy andRegional Development Policy, Pergamon Press, London, 1978
20. Ford Foundation, Urbanization in Kenya, 1972
21. Gergen, Schubert and Brandt, The Influences ofUrbanization Upon the Development of Rural Areas with Special Reference to Jinja, Uganda, and its Surroundings
22. Goldstern, Sidney, The Measurement of Urbanizationand Projection of Urban Population
23. Gutkind, P.C.W. "Urban Conditions in Africa" in TownPlanning Review 32, pp. 20 - 32, 1961.
24. Haarer, A.- Modern Coffee Production
25. Hansen, N.M., Growth Centres in Regional EconomicDevelopment, New York, 1972
26. Hansen, N.M. Challenge of Urban Growth Lexington BooksMassachusetts, 1975.
27. Hekken, P.M. van and Thodden van Velzen,Land Scarcity and Rural Inequality in Tanzania, H .U.E., The Hague, 1972.
28. Herbert, J.D., et al., Urban Planning in DevelopingCountries.
29. Hermansen, T. "Development Poles and Development Centrein National and Regional Development" in Kuklinski, A.R. Growth Poles and Growth Centres.
30. Hirsshman, A.O.- The Strategy of Development, NewHaven"! 1958.
31. Hutton, J., ^Urban Challenge in E. A ., 1972'-
- 186
32. Isard, W. , Location and Space Economy:A General Theory relating to Industrial Location, Market Areas, Land Use, Trade and Urban Structure, M.I.T., 1956.
33. Jackson, J.N., Surveys for Town and Country PlanningLondon, 1968.
34. Jurgens, H., Contribution to Domestic Migrationin Tanzania.
35. Keeble, D. "Local Industrial Linkages and ManufacturingGrowth in Outer London^in Town Planning Review Vol. 40, 1969.
36. Keeble D., Industrial Location and Planning in U.K.Methuen, London, 1966.
37. Kilimanjaro Region, Department of AgricultureMonthly Reports, Moshi.
38. Kim,An-Jae, Industrialisation aid Growth PoleDevelopment in Korea; A Case Study of Ulsan Industrial Complex in the Context of Regional Development in Southern Coastal Areas, U.N. Centre for Regional Development, Nagoya, Japan, 1975.
39. Kimani and Taylor, The Role of Growth Centres inRural Development, I.D.S. Working Paper No.s 116 and 117, University of Nairobi.
40. Kriesel, et al, Agricultural Marketing in TanzaniaBackground Research and Policy Proposals), 1970.
187
41. Kuklinski, Antoni (ed.), Growth Poles and GrowthCentres in Reqional Planninq, Mouton, Paris, 1 ^ 7 2 . ------------- *
42. Kuklinski, A and Petrella, A. (eds.), Growth Polesand Regional Policies, Mouton, Paris.
43. Zacoste, Yves, "The Problems of Urban networks inthe Underdeveloped Countries," Bulletin Timestrial, October 1972.
44. Zogan, M.T., "The Spatial Systems and Planning Strategies in Developing Countries," Geographical Review, 62, T, T5TTT
45. Losch, A., The Economics of Location, New Haven, 1954.
46. Maro, P.S., Population and Land Resources inNorthern Tanzania: The Dynamics of Change 1920-1970, Ph. ETI Thesis dissertation, University of Minnesota, U.S.A., 1974.
47. Moscarenhas, A.C., Urban Development in Dar-es-Salaam, M.A. Thesis University ol California, Los Angeles, 1966.
48. Mbilinyi, S.M., The Economics of Peasant CoffeeProduction, The Case of Tanzania, Kenya Literature Bureau, 1976.
49. Mbilinyi, S.M., Coffee Diversification, A. Strategyfor Development: The Case of Tanzania,Ph. D. Thesis, University of Dar-es-Salaam, 1974.
50. McDonald, J.H., Coffee growing with specialReference to E .A.
51. Meghji, R.N., Underdevelopment in Rural Areas:The Case ol Moshi and Rombo Districts,M.A. Thesis, University of Dar-es-Salaam.
52. Moore, J.E., Rural Population Carrying Capacitiesof the Districts of Tanzania BRAZUP Research No. 16, University of Dar-es- Salaam 1971.
53. Moseley, M.J., Growth Centres in Spatial Planning 1974.
54. Myrdal, G. , Economic Theory and UnderdevelopedRegions, Methuen, 1957.
55. Nik son, F.I., Economic Integration and IndustrialLocation"]! London, 1973.
56. Obudho and Walter, Periodic Markets, Urbanizationand Regional Planning.
57. Ogendo, B., Industrial geography of Kenya withspecial emphasis on the agricultural processing and fabricating industries, E.A.P.H., Nairobi, 1972.
58. Pathak, C.R., and Prof. Subbakrishniah, A., TheDurgapur Industrial Region, India, 196%"!
59. Roberts, B., Cities of Peasants, London 1978.
60. Roberts, M., An Introduction to Town PlanningTechniques, London, 1975.
61. Robinson, J.B., Tanganyika, Coffee Board, 1964.
62. Safier, M. (ed.), The Role of Urban and RegionalPlanning in National Development E.A.,Milton Obote Foundation, 1970.
6 3. . Seidman, A., Comparative Development Strategies in E.A.~ E .A .P .H ., Nairobi, TTTTI
64. Shaw, J.H., and Emery, J.S., Cities and Industries
65. Smith, Chr., Seminar, on Changes in Tanzania ruralsociety and their relevance for development planning, some reflections on rural diversification (with special reference to to the coffee areas of Mt. Kilimanjaro Tanzania) Leiden, 7-11 December, 1970.
66. Spodek, H., Urban - Rural Integration in Regionaldevelopment: A Case study or saurashtra, India, 1800 - 1960.
67. Stren, R., Urban Development in Kenya and TanzaniaA Comparative Analysis, Working Paper No. 147, I.D.S. University of Nairobi, 1974.
68. Stren, R., "Urban Policy and Performance in Kenyaand Tanzania, Journal of Modern African Studies Vcl. 13, No. 2, 1975.
Swantz, Marja-Liisa, Socio-economic Causes of Malnutrition in Moshi District.
Sykes, A., Coffee-Banana Survey Moshi District, 195T:
Tanzania Coffee Board, Annual Reports (Various), Moshi, Tanzania.
Tanzania Government, Kilimanjaro Development Plan ( in Collaboration with Japan International Co-op. Agency), Tokyo City Planning, 1977.
Tanzania Government, 1978 Population CensusPreliminary Report, Bureau of Statistics Tanzania, 1980.
----- , Five-Year Development Plans1964/69, 1989//4, 1976/81. Dar-es-Salaam Tanzania.
------ , 1967, Population Census Vol.I-IV Dar-es-Salaam, 1970.
------ , Economic Surveys, 1975/76,1977/78, 1978/79, 1979/80, Annual Plans 1969-80, Statistical Abstract 1973 (1977), Central Bureau of Statistics, Dar-es-Salaam.
------ , Uhuru Corridor Regional PhysicalPlan, 5 Volomes, August 1§78.
Tanzania, Central Bank, Economic Bulletin,Vol. IX, No. 3 December 1977.
UNESCO, Regional Seminar on Urban-RuralDifferences and Relationships in South Asia, 1^62.
UNIDO, Interregional Seminar on Industrial Location and Regional Development. Vienna, 1968.