dimitrios kyrkilis persefoni polychronidou editors
TRANSCRIPT

Contributions to Economics
Anastasios KarasavvoglouDimitrios KyrkilisGeorgios MakrisPersefoni Polychronidou Editors
Economic Crisis, Development and Competitiveness in Southeastern EuropeTheoretical Foundations and Policy Issues

Contributions to Economics

More information about this series at http://www.springer.com/series/1262

Anastasios Karasavvoglou • Dimitrios Kyrkilis •Georgios Makris • Persefoni Polychronidou
Editors
Economic Crisis,Development andCompetitiveness inSoutheastern Europe
Theoretical Foundations and Policy Issues

EditorsAnastasios KarasavvoglouEastern Macedonia and ThraceInstitute of Technology
Kavala, Greece
Dimitrios KyrkilisUniversity of MacedoniaThessaloniki, Greece
Georgios MakrisUniversity of MacedoniaThessaloniki, Greece
Persefoni PolychronidouEastern Macedonia and ThraceInstitute of Technology
Kavala, Greece
ISSN 1431-1933 ISSN 2197-7178 (electronic)Contributions to EconomicsISBN 978-3-319-40321-2 ISBN 978-3-319-40322-9 (eBook)DOI 10.1007/978-3-319-40322-9
Library of Congress Control Number: 2016951307
© Springer International Publishing Switzerland 2016This work is subject to copyright. All rights are reserved by the Publisher, whether the whole or part ofthe material is concerned, specifically the rights of translation, reprinting, reuse of illustrations,recitation, broadcasting, reproduction on microfilms or in any other physical way, and transmissionor information storage and retrieval, electronic adaptation, computer software, or by similar ordissimilar methodology now known or hereafter developed.The use of general descriptive names, registered names, trademarks, service marks, etc. in thispublication does not imply, even in the absence of a specific statement, that such names are exemptfrom the relevant protective laws and regulations and therefore free for general use.The publisher, the authors and the editors are safe to assume that the advice and information in thisbook are believed to be true and accurate at the date of publication. Neither the publisher nor theauthors or the editors give a warranty, express or implied, with respect to the material containedherein or for any errors or omissions that may have been made.
Printed on acid-free paper
This Springer imprint is published by Springer NatureThe registered company is Springer International Publishing AG Switzerland

Contents
Part I
Macroeconomic Theory and Macroeconomic Logic: The Case of the
Euro Crisis . . . . . . . . . . . . . . . . . . . . . . . . . . . . . . . . . . . . . . . . . . . . . . . 3
Heiner Flassbeck
Economic Crisis and National Economic Competitiveness: Does Labor
Cost Link the Two? The Case of the South Eurozone States . . . . . . . . . 23
Dimitrios Kyrkilis, Georgios Makris, and Konstantinos Hazakis
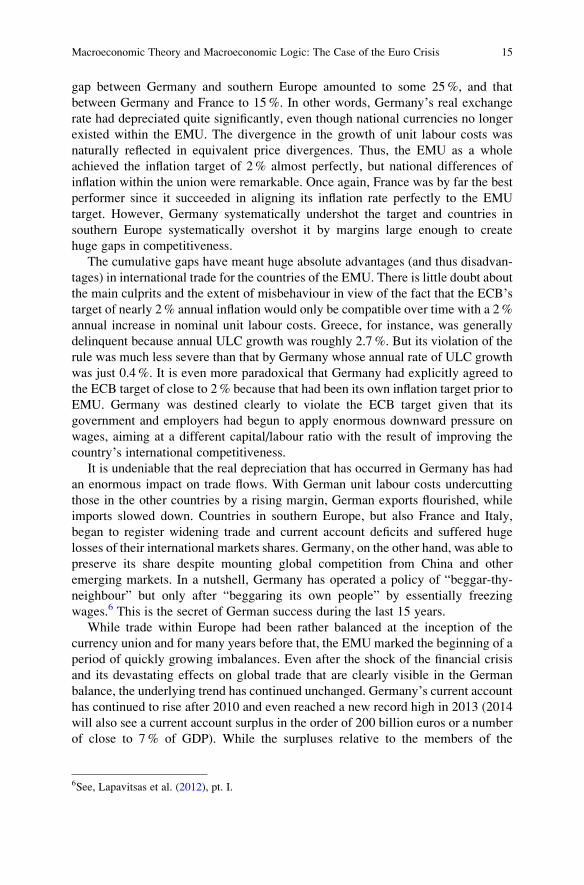
‘Compulsory’ Economic Deflation Turned Political Risk: Effects
of Austere Decision-Making on Greece’s ‘True’ Economy (2008–2015)
and the ‘Eurozone or Default’ Dilemma . . . . . . . . . . . . . . . . . . . . . . . . . 41
Nikitas-Spiros Koutsoukis and Spyros Roukanas
Theory of Optimum Currency Areas and the Balkans . . . . . . . . . . . . . . 57
Edgar Juan Saucedo Acosta and Jesus Diaz Pedroza
The Balance-of-Payments Constrained Growth Model in Transitional
Economy: The Case of Bulgaria . . . . . . . . . . . . . . . . . . . . . . . . . . . . . . . 75
Elena Spasova
The Nexus Between Imports and National Income in Turkey . . . . . . . . 93
Ozcan Karahan and Olcay Colak
Part II
Interaction Between Competitiveness and Innovation: Evidence
from South-Eastern European Countries . . . . . . . . . . . . . . . . . . . . . . . . 107
Jelena Stankovic, Vesna Jankovic-Milic, and Marija Dzunic
v

Testing Uncovered Interest Parity for Structural Breaks: A Developing
Country Perspective . . . . . . . . . . . . . . . . . . . . . . . . . . . . . . . . . . . . . . . . 121
Srđan Marinkovic, Ognjen Radovic, and Zeljko Sevic
Adult Education: A Vehicle for Economic Development . . . . . . . . . . . . 139
Pantelis Sklias and Giota Chatzimichailidou
vi Contents

About the Book
Since the beginning of the current decade, i.e. 2010, the Balkans and the South-
eastern Europe at large have been suffering from the continuation of the 2007–2008
world financial crisis as sovereign debt crisis in Greece and other south eurozone
countries triggered by coexisting fiscal and external imbalances. The crisis turned to
a prolonged fiscal crisis, a bank confidence crisis, and economic recession.
European and national authorities sought ways to resolve the crisis in a context of
non-pre-existing institutional and policymaking arrangements while policy mea-
sures actually taken after tedious deliberations generated internal conflicts both
within the nation states and the eurozone as a whole. The eurozone economic crisis
was and still is complicated by geopolitical tensions in Ukraine, Turkey, and the
Middle East while geopolitical risks around the world are increasing, e.g. North
Korea, while structural transformations and problems in China feed world eco-
nomic instability and risk. At the same time, the dramatic fall in international oil
prices raises stability concerns for neighbouring oil producing countries, casts
sustainability doubts on plans for energy transmission networks in the broader
area, and calls for reconsidering national roles and cross-border arrangements.
The macroeconomic outlook of the broader Southeastern Europe seems uncer-
tain with mixed GDP growth rates and directions, while any positive growth rates
seem anaemic and their sustainability is questionable. Deflation has been
established as a widespread trend, and high unemployment rates persist, although
the European Central Bank (ECB) has been running a quantitative easing monetary
policy that it expects to maintain until September 2016 at least. At the same time, in
some cases foreign debts are increasing, cross-border financial flows including
worker remittances are highly volatile, credit expansion is insufficient to mobilise
the economy, and the non-performing share of loans is growing. Many of these
problems pre-existed the 2007–2008 world financial crisis, but they became more
acute calling for immediate resolutions after the eruption of the eurozone crisis
while policies implemented ever since seem ineffective in easing them.
It is the continuation of the crisis in many aspects, especially in the form of
deflation, unemployment, and low and unstable economic growth that sets the
vii

question: is there any scope of changing the policy mix? The question needs urgent
answers especially in the eurozone where the single currency does not allow any
currency value realignment, a powerful instrument of remedying national compet-
itiveness deficiencies, and it dictates a single monetary policy designed and
implemented by the European Central Bank that lacks flexibility, and thus, it cannot
serve individual member country needs which in many cases are conflicting to each
other due to national asymmetries and structural divergences. Although there are
arguments that the policies of fiscal consolidation and economic thrift implemented
as a general and iron law managed to end the crisis and set the economies on a
growth path, from another point of view these same policies have failed to improve
economic structures and achieve convergence, and instead they contributed to a
spiral of recession and/or low-level stationarity and divergence. Policymakers in
many countries in the area seek policy measures for advancing the economic
competitiveness of their countries as a means to secure economic growth and
improve standards of living for their populations. However, the problem of what
constitutes economic competitiveness and about policies and structures economic,
institutional, and others that improve competitiveness demands both theoretical and
empirical foundations; therefore, further research is needed.
The 7th Economies of Balkan of Eastern Europe Countries (EBEEC) Confer-
ence which was organised jointly by the TEI of Eastern Macedonia and Thrace,
Department of Accounting and Finance, and the University of Macedonia, Depart-
ment of Balkan, Slavic and Oriental Studies in Kavala, Greece, May 8–10, 2015,
aimed to present research papers making propositions from both the theoretical and
empirical point of view about the foundations and means of overcoming the crisis in
the broader area, the concept, determinants, and policies of competitiveness, and
other relevant issues. The current volume contains a number of papers presented at
the conference and chosen according to a peer-review process.
The papers report research related to the themes referred above, making signif-
icant contributions to their investigation.
The volume is organised into two parts. The first part contains papers taking a
rather macroeconomic and more theoretical approach of analysing the issues in
question and establishing relevant propositions. The second part consists of papers
exploring specific policies for improving competitiveness and boosting economic
growth, and they take a rather empirical approach in doing so.
Part one begins with Professor Heiner Flassbeck’s paper titled “Macroeconomic
theory and macroeconomic logic—the case of the Euro crisis”. Heiner Flassbeck
makes a very interesting effort to analyse from a macroeconomic point of view the
roots of the economic crisis in the eurozone and to point out the reasons for the
economic recession persisting across Europe. The issues of wage flexibility
vs. inflexibility and its consequences, those of real wage growth and its relation
to domestic demand, and the question of nominal vs. real convergence are some that
have a key role in pursuing this study. Additionally, the author discusses the case
for monetary cooperation and the core monetary principles of the European Mon-
etary Union (EMU). The author argues that there is a strong and stable positive
relationship between the growth rate of unit labour costs (ULC) and the inflation
viii About the Book

rate, on the one hand, and the growth rate of real wages and domestic demand, on
the other. Under such connections, ECB’s inflation targeting at 2%monetary policy
is ineffective to the extent that at least one country, i.e. Germany, pursues a ULC
below 2%. ECB has to lower its inflation target in line with Germany’s ULC, inwhich case all other countries would have to moderate their ULCs. But any
accruing advantage towards emerging markets, e.g. China, would be lost due to
the adjustment of the exchange rate of the Euro to the lower inflation rate.
Ultimately, that means that across the eurozone policy of cutting ULCs is useless
in terms of improving competitiveness but effective in terms of stagnating or even
lowering domestic demand and increasing unemployment. The paper concludes
that there is a considerably strong connection between the adjustments demanded
by the European institutions at the national level and the economic recession in
peripheral EMU countries. The author notes “In a monetary union, a country with a
low export share and facing a huge current-account deficit and financing problems
due to an implicitly overvalued currency would be trapped. Downward adjustment
of wages, sometimes erroneously called “internal devaluation”, would be no solu-
tion as it would destroy both domestic demand and output before it could bring
some relief through rising exports........ (eurozone) countries with a huge gap of
competitiveness against Germany would have to go through an extended period of
catching-up in terms of price competitiveness......(current account) deficit countries
have to dive below the German UCL path for a long time to regain some of the
losses they have experienced in the first 10 years of EMU.”
Dimitrios Kyrkilis, Georgios Makris, and Konstantinos Hazakis in their paper
“Economic crisis and national economic competitiveness: Does labour cost link
the two? The case of the south eurozone states” reach similar conclusion arguing
that the ULC is not the most significant determinant of national competitiveness.
They base their analysis on, first, the Ricardian theory of comparative advantages
and the neoclassical theory of international trade, pointing out that the first sources
the root of comparative advantages on labour productivity differentials due to
technological differences among nations while the second sources the basis of
comparative advantages on the relative abundance of production factors. They
analyse the concept of competitiveness and its differences between the micro-
and macro-levels, and they argue that ULC is inappropriate for approaching
competitiveness at the macro-level because it fails to capture the connection
between investments, the main determinant of competitiveness through its influ-
ence on labour productivity and profits, the latter being a function of the distribution
of income between labour and capital. Such connections require the introduction of
the real wage instead of its nominal value in the analysis on the one hand, and it
leads to the conclusion that any reduction of the ULC either has to be followed by a
reduction of prices, i.e. deflation not having that way any impact on the investment
activity, or if prices do not follow suit, price competitiveness does not improve. In
any case, the paper concludes similarly to Flassbeck’s paper that the policy of
domestic devaluation, at least as it has been implemented in the south eurozone
countries, has led to GDP depression but not to restoring competitiveness.
About the Book ix

Nikitas-Spiros Koutsoukis and Spyros Roukanas in their paper “Compulsory’economic deflation turned political risk: Effects of austere decision-making on
Greece’s ‘true’ economy (2008–2015) and the ‘Eurozone or default’ dilemma”
analyse the consequences on the Greek society of the economic austerity measures
taken under the internal devaluation strategy adopted by the national authorities.
These policies provoked a socio-humanitarian crisis, political populism, and
polarisation. The authors seek to investigate the key factors of the political and
economic degradation by focusing on high-level shifts of the Greek economy and
its institutions. Elements of political risk and progression are used in order to
demonstrate how the bailout program designed and implemented by the European
institutions influences the ability of Greece to handle the crisis. In conclusion,
authors state that economic adjustment programmes caused a severe hike of
political risk with negative consequences for the valued solidarity not only in
Greece but in all members’ state of the eurozone.Edgar Saucedo and Jesus Diaz in their paper “Theory of optimum currency
area and the Balkans” construct a framework to examining the consequences for
the Balkan countries of introducing regional single currency against those intro-
ducing the Euro. Specific theoretical elements of the theory of optimum currency
have been employed for running simulations for groups of Balkans countries. For
the purpose of the analysis, innovative criteria have been used such as the criterion
of co-movement and the criterion of political proximity. In addition, the criteria of
trade integration and inflation have also been included. The results indicate that
countries introducing the euro would enjoy more benefits against countries intro-
ducing a regional single currency.
Elena Spasova in the paper titled “The balance of payments constrained
model in a transitional economy: The case of Bulgaria” makes an effort to
analyse the growth dynamics of the Bulgarian economy within a time period of
20 years using the balance-of-payments (BOP) constrained growth model
established by Anthony Thirwall and known as Thirlwall’s Law. The paper
attempts to control for the suitability of this framework to explain the growth
rates of the Bulgarian economy in the last 20 years. For the purpose of the study,
an econometric model has been estimated for establishing the Bulgarian economy’sequilibrium growth rate as it would have been achieved according to the BOP
constraint on growth and after that the results have been compared with the real
registered levels of economic growth. According to the author, specific features of
the Bulgarian economy cause inefficiencies of the external trade sector resulting in
constraining the country’s growth and impeding its economic convergence with the
developed countries.
Finally, Ozcan Karahan and Olcay Colak in the paper “The nexus between
imports and national income in Turkey” address the issue of the relationship
between imports and national income in Turkey. The authors present the contra-
dictory approaches of Keynesian Multiplier Theory and Endogenous Growth
Models concerning the connection between import-led economic shrinkage and
import-led economic growth, respectively. Based on this methodological frame-
work, they aim at examining these arguments regarding the effect of imports on
x About the Book

Turkish economy. For testing this relationship, they use a time-series econometric
analysis for the period 2002–2014 based on the Johansen co-integration and
Granger causality tests in addition to Innovation Accounting Techniques. The
results show that the argument of the Endogenous Growth Model is confirmed in
the case of Turkey. Empirical results demonstrate a strong causality linkage
between imports and economic growth in Turkey with the causality running from
imports to economic growth.
The second part starts with the paper “Interaction between competitiveness
and innovation: Evidence from South-Eastern European countries” by Jelena
Stankovic, Vesna Jankovic-Milic, and Marija Dzunic. The paper refers to the
relationship between innovation activities and the improvement of competitiveness
examining the impact of indicators of innovative activities on the competitiveness
of certain Balkan countries through a comparative analysis. An empirical survey
has been conducted on innovation activities of firms in Serbia using the method of
dependency and correlation analysis. According to the authors, there is a limited
innovation activity in Serbian enterprises resulting in their low competitiveness.
The results demonstrate the immediate development of macroeconomic environ-
ment and the enforcement of innovation activities in order to improve the compet-
itiveness of enterprises in the Balkans.
In the second paper of the part titled “Testing uncovered interest parity for
structural breaks: A developing country perspective”, Srdan Marinkovic,
Ognjen Radovic, and Zeljko Sevic construct a single-country model for uncovered
interest parity (UIP). The UIP test is widely applied in international finance. In this
paper, the UIP test is based on high-frequency data. For the purpose of the analysis,
the EGARCH analysis of statistical properties of time series of deviations from UIP
and the Markov Switching model have been used. EGARCH analysis is responsible
for predicting future volatility of the tested variable. According to the authors, the
model was able to demonstrate correctly the ex ante identified structural break
caused by crisis incidents, but was unsuccessful to separate the pre- and post-
liberalisation periods.
In the last paper “Adult education; A vehicle for economic development”,
Pantelis Sklias and the Giota Chatzimichailidou attempt to investigate in depth the
effect of adult education on economic development. The paper shows how educa-
tion programmes concerning political, social, and economic issues motivate citi-
zens to play a vital role in the societal development and consequently in economic
progress. The authors employ the methodological framework of International
Political Economy in a comparative context as opposed to the building of Human
Capital Model in order to examine the correlation between economic development
and adult education in the developed countries. Their findings indicate that the
advancement of adult education programs is considered central for securing the
societal consistency and therefore to the economic development.
About the Book xi

Part I

Macroeconomic Theory and Macroeconomic
Logic: The Case of the Euro Crisis
Heiner Flassbeck
Abstract The last 7 years have been a tumultuous period for Europe and the unrest
is far from over. The global crisis that began in 2007 led to a sharp financial shock
in 2008–9, which ushered in a recession across the world. Europe—including
Germany—was hit hard as credit contracted and international trade shrunk. The
real crisis in Europe, however, commenced in 2009–10 as the recession induced a
worsening of public finances that triggered off a gigantic crisis in the Eurozone.
1 No End to the Crisis
There is little doubt at the beginning of 2015 that the crisis of the European
Economic and Monetary Union (EMU) has not gone away. Unorthodox measures
by the European Central Bank, in particular its promise to do “whatever it takes” to
stabilise the currency system in 2012, have calmed the financial markets and
provided space for economic policy to act in a stabilising way.
However, the majority of the political players, and among them the most
important ones in the large countries of the Eurozone, especially those with
surpluses, are still struggling to find adequate answers to the challenges raised by
the sudden appearance of huge splits and divergences in a formerly homogeneous
currency system. The political discourse is dominated by the attempt to convince
the deficit countries to follow the path laid down by the surplus countries. Neither
the obvious fallacy of composition in policy making (i.e., that all countries taken
together could replicate what a single country might be able to do), nor the threat of
forcing the whole Eurozone into deflation has yet permeated through the thick
H. Flassbeck
Flassbeck-Economics, Wolfersweiler, Germany
e-mail: [email protected]
© Springer International Publishing Switzerland 2016
A. Karasavvoglou et al. (eds.), Economic Crisis, Development and Competitivenessin Southeastern Europe, Contributions to Economics,
DOI 10.1007/978-3-319-40322-9_1
3

layers of political prejudice that have prevented a reasonable and constructive
political debate among member states since the beginning of the crisis.
Nevertheless, at the level of the European institutions awareness appears to be
mounting that radical changes are needed to make the system more resilient. And
even beyond the traditional obsession with fiscal deficits and government debt the
adoption of an early warningmechanism that could deal with the core of the trouble has
proceeded quite quickly. The introduction of theMacroeconomic Imbalance Procedure
(MIP), aimed at dealing with existing and future current account balances and guiding
member states towards more balanced trade, has marked some progress toward
understanding that a currency union requires, above all, coordination of price and
wage evolution.
1.1 The Case for Monetary Cooperation
It has been argued elsewhere that monetary union in Europe was not necessarily a bad
idea from the outset.1 Its likely failure in the future would reflect, first, a lack of sound
economic reasoning behind the politically motivated decision to accelerate European
integration and, second, the emergence of strong economic and social interests within
core countries—primarily Germany—which have hardened the disastrous path of
the EMU.
The launching of EMU could be considered as the final step on the way towards
lasting exchange rate stability after a long period during which the members of the
European Monetary System (EMS) had attempted to operate systems of fixed but
managed exchange rates. After the breakdown of Bretton Woods in 1971–3, many
smaller countries across the world quite sensibly refused to adopt a system of fully
flexible (market determined) exchange rates. For smaller countries in Europe,
monetary cooperation has been an important way of avoiding falling victim to the
vagaries of the financial markets, typically followed by the harsh ‘conditionality’imposed as part of a ‘rescue’ delivered by the international organisations of the
Washington Consensus. Most European countries, in particular the smaller ones,
understood quickly that monetary independence would not necessarily be to their
advantage. They recognised that for small open economies tying one’s hands couldbe an optimal solution in monetary affairs.
In the presence of extremely volatile exchange rates, small open economies do
not have monetary autonomy, because their monetary authorities are obliged to
respond to the pressures of currency markets. The formal autonomy of a central
bank (i.e., no obligation to intervene) lacks a material basis.2 Obviously, countries
1See Flassbeck and Lapavitsas (2013).2Even so, the bulk of the academic literature still relies in one way or another on the OCA-theory,
or on the so-called ‘policy trilemma’ of open economies, i.e., their inability to achieve at once
stability of the exchange rate, freedom of capital flows and monetary autonomy. In a system of
floating rates the trilemma is a dilemma; see, Flassbeck (2001).
4 H. Flassbeck

under this constraint would have to cooperate with other countries to achieve a
degree of exchange-rate stability sufficient to protect their competitiveness and to
allow for balanced trade relations. From the perspective of these countries the
valuation of currencies is too important to be left to the market.
In the absence of cooperation, conflict would be unavoidable, as a change in one
country’s exchange rate would always affect another country. For n countries in theworld as a whole there would be n-1 exchange rates. Consequently, the crucial
question would be not about the need for international monetary cooperation, which
is obvious, but about viable forms of cooperation. European monetary cooperation
evolved in rather small steps over a period of 30 years before culminating in the full
monetary union in 1999.
All traditional forms of international monetary cooperation—other than a full
monetary union—require that one of the member countries would serve as an
anchor for the system. Other countries would adjust their policies in relation to
the anchor country. Successful monetary cooperation aimed at enlarging the room
of manoeuvre for economic policy in a region as a whole would have to include at
least one country that could act as lender of last resort in times of crisis. This need
arises due to the asymmetry in the relations between countries whose currencies are
under threat of depreciation and those whose currencies are under pressure to
appreciate. Countries trying to avoid currency depreciation (or to stop depreciation
at a certain point) have to intervene in the currency market. This means their central
banks have to increase demand for their own money by selling international
reserves. Since such reserves are always limited, countries that are threatened by
depreciation are vulnerable to speculative attacks on their currency. The only way
to fend off such an attack would be cooperation with the ‘other side’, i.e. withcountry that have appreciating currencies.
In Europe, Germany was the obvious candidate to become the anchor in regional
monetary cooperation. Over several decades Germany has been the champion of
price stability, as witnessed, in particular, by the smooth absorption of the infla-
tionary consequences of the two oil price shocks. As a result of low inflation, the
German currency never came under depreciation pressure but always tended to be
on the appreciation side. Hence, Germany assumed the role of the European
monetary anchor for good reasons.
Some smaller countries were able to copy the German inflation performance and
to maintain exchange rate stability without a loss of overall competitiveness.
Austria was the most impressive case in this respect. Most of the larger European
economies, however, time and again had to accept depreciation against the German
currency to compensate for domestic inflationary bouts. This was especially true for
France and Italy, at least up to the mid-1980s. Anchoring proved to be successful in
terms of the effective pressure on domestic inflation as long as exchange rate
adjustments remained an option to restore unsustainable competitive positions
among countries.
During the period of the European Monetary System (EMS) that preceded EMU
and lasted roughly from 1980 to the end of the century, fixed exchange rates in
Europe were seen as a tool to foster the completion of the single European market.
Macroeconomic Theory and Macroeconomic Logic: The Case of the Euro Crisis 5

In addition, Germany, with its stable economic performance and a strongly dog-
matic stance on inflation, was increasingly seen as a role model for other countries.
The political will to adhere to economic policies and a monetary model similar to
that pursued by Germany shaped the European debate on monetary policy and
exchange rates to a very large extent.
For very small and extremely open economies, the anchor approach could work
for quite some time, if the anchor country’s economic policy treated the small
satellites in the system with benign neglect. But for any larger group of countries
and for countries of similar size and economic power, the anchor approach could
only be considered as a transitional stage on the way to a full monetary union. The
only way to ensure a consistent monetary policy for the group as a whole would be
to form a common central bank. It is important to stress, however, that the
transitional phase may last very long. From the first steps toward monetary coop-
eration to creating the EMU, it took Europe 30 years to accomplish that logical and
consequent idea.
From a global perspective, the move towards monetary union supported by a
strong political will to coordinate policies provided Europe with an enormous
degree of independence vis-�a-vis the rest of the world, the international financial
markets and international financial organisations. With an anchor strong and stable
enough to weather even big international storms the group was able to fend off
strong external shocks. No single country of the EMU had to call upon the IMF to
overcome problems of exchange rate misalignment and/or lack of international
liquidity before the 2010 crisis broke out.
One final point to mention is that command over world money is a measure of
international political power, which, in the case of the Euro and due to its creditor
position, means primarily German power. It ought to be stressed that the EMU was
not originally a plan to promote German ascendancy, but rather a formal, treaty-
based alliance establishing rights and obligations for member-states, and relying
strongly on the ideology of Europeanism. Nonetheless, for reasons that are made
clear below, the Euro has rebounded strongly in favour of Germany which- after the
global financial crisis—has emerged as the country able to set economic and social
policy across Europe as it is the main creditor. Yet, in view of the coming clash
between debtors and creditors inside the Euro area, Germany’s pre-eminence
remains extremely fragile.
1.2 The Core Monetary Principles of the EMU
A monetary union is first and foremost a union of countries willing to give up their
own national currency for the purpose of creating a common currency. Giving up a
national currency implies waiving the right of the national authorities to issue coins
and notes and in this way to deploy national money (fiat money). Any decision with
respect to issuing money would be delegated to a supranational institution. The
decision-making organs of that institution would be designed to reflect the
6 H. Flassbeck

composition of the membership, but no single country would have a majority
influence. National central banks still exist within the EMU, but the power to
determine monetary policy and all related decisions has been transferred exclu-
sively to the ECB and its Executive Board.
Entering a monetary union also implies giving up national inflation targets and
agreeing on a common inflation target for the union as a whole. The Deutsche
Bundesbank, the anchor of the EMS and the role model for the ECB, had
established monetarism, or the so-called Quantity Theory of Money, as the leading
monetary doctrine in the years prior to the EMU. For a monetary union, monetarism
would hold that the common central bank would be able to contain inflation across
the entire union by steering the money supply and, moreover, that inflation differ-
entials among the member countries would not occur. On this theoretical basis, the
control exercised by the ECB over the money supply was deemed sufficient to hold
the actual inflation rate of the EMU close to the target set by the ECB.
Even from this questionable theoretical perspective, public budget deficits,
which proved to be the most hotly contested topic in the political debate, are not
supposed to influence the inflation performance of the union, for there is no
systematic relationship between the size of budget deficits and the rate of inflation.
For monetarists, no matter how large was the budget deficit of a country, monetary
policy could always attain its inflation target by strictly adhering to “objective”
rules governing the expansion of the money supply.
Monetarist theory has been based on weak empirical evidence from the very
beginning. Since the 1930s the monetarist dogma has mainly relied on a kind of
post-hoc ergo propter-hoc fallacy. Monetarists have typically insisted that without
more money an inflationary acceleration would not be possible. It is, of course, true
that without an expanding money supply an inflationary acceleration would be
impossible, but it does not at all follow that any monetary expansion would lead to
an inflationary acceleration, i.e., monetary expansion is a necessary but not a
sufficient condition for inflationary acceleration. To put it plainly, while more
money would be necessary to inflate the economy, it would be by no means
sufficient to expand the money supply to inflate the economy.
At the beginning of the 1990s this key issue of monetary policy, i.e., the capacity
of the common central bank to control inflation, was not subject to much critical
analysis within the EMU. Notwithstanding some controversy about the necessary
degree of independence of the central bank, the overwhelming weight of opinion
agreed that control over the monetary supply would be sufficient to control infla-
tion. In this way, price instability could be avoided and the ECB would be able to
replicate what was considered the splendid performance of the Bundesbank during
the preceding 20 years.
With the passage of time, however, the intellectual debate gave the cold shoulder
to monetarism and adopted a fresh approach to central banking, in many ways
influenced by the achievements of the US Federal Reserve System under its
chairman Alan Greenspan. This was not without influence on the ECB, which has
from the start been a much more open and multicultural institution than the
Bundesbank. Given the failure to find convincing evidence of a strong relationship
Macroeconomic Theory and Macroeconomic Logic: The Case of the Euro Crisis 7

between prices and the traditional money supply aggregates, the ECB gradually
deviated from the doctrine of the Bundesbank (the so-called monetary pillar) and
turned towards an approach in which the central bank explicitly acts by setting the
short-term interest rate in light of its judgement about macroeconomic
developments.
Although this approach is more amenable to testing by using methods that go
beyond the traditional money supply channel, its impact was blocked by other
neoliberal doctrines that proved far too strong to be rejected even in the light of
clear evidence. Both the ECB and the European Commission have been dominated
by neoliberal thinking during the period that led to the outbreak of the crisis in
2008. It is mainly for this reason that the ECB, as well as the other institutions
founded to govern and to protect EMU, have essentially failed in the first decade.
The governing institutions of the EMU began to rise from their intellectual slumber
only after the global financial crisis of 2007–9 gave international investors a major
jolt concerning the ability of peripheral Eurozone members to pay back the debt
they had accumulated during the first 10 years of EMU.
1.3 Wage Flexibility and Its Consequences
The clearest evidence regarding the dominant role of neoliberal thinking within the
institutions of the EU has been offered by labour market theory, considered to be
one of the main doctrinal pillars of the functioning of the common market and the
EU as a whole. The so-called Lisbon Process and a plethora of decisions taken by
the European Council demonstrate the adherence to neoliberal thinking at the top of
EMU. “Labour market flexibility” and “improved competitiveness” have been (and
within many circles still are) the mantras guiding the creation of the common
market and the attempt to accelerate growth and job creation.
It ought to be stressed that there is little empirical evidence for the theoretical
belief that flexible labour markets would automatically provide jobs for all those
who are willing to work. The absence of relevant evidence on this issue is as
pronounced as for the other fundamental belief in the importance of controlling
the money supply and guaranteeing the independence of central banks to ensure
price stability. Indeed, had some different but striking evidence been taken into
account, it would have been possible to prevent both the EMU and the EU from
falling victim to the financial markets and from entering the current impasse. The
most important piece of evidence is the high and stable correlation between the
growth rate of unit labour costs (ULC) and the inflation rate.
Unit labour costs appear to be the crucial determinant of overall price move-
ments in national economies as well as for groups of economies. Figure 1 demon-
strates this simple fact, which ought to be at core of all macroeconomic reasoning
but is widely ignored, usually for ideological reasons.
The cost of labour is the most important component of the total cost of produc-
tion for the economy as a whole because—in vertically integrated production
8 H. Flassbeck

processes—labour produces final consumer goods as well as intermediate and
capital goods. Unit labour costs are the perfect instrument to forecast and control
inflation, especially in view of potentially strong political influence that could be
exercised on wage setting and wage policy more generally. Specifically, for infla-
tion to hit its chosen target, it would be necessary for nominal wage growth to be in
line with national productivity growth plus the inflation target. Astonishingly, the
doctrinaire neoliberal approach adopted by the leading institutions of the EU led to
profound indifference regarding the evolution of wages and ULC over time.
If the strong correlation between ULC and inflation was acknowledged and
placed at the heart of macroeconomic analysis, it would become clear that the
main requirement for a successful monetary union would not be control over
monetary affairs but rather the management of incomes and nominal wages. To
be specific, the common inflation target for EMU was defined by the ECB as a rate
close to 2%. This implied that the golden rule for wage growth in each economy
would be the sum of the national growth of productivity plus 2%. By this token,
large inflation discrepancies leading to competitiveness discrepancies across mem-
ber countries would not occur.
There is a huge body of evidence showing that a system of fixed exchange rates
could function properly only if there were wage adjustments sufficient to compen-
sate for the loss of exchange-rate flexibility.3 Equivalently, it has been very widely
observed in systems of fixed but adjustable exchange rates that differences between
domestic and international cost levels have to be corrected by changing the external
value of the domestic currency (depreciation or appreciation). By this token, in a
currency union the necessary adjustment of wages and prices for each member
70
60
50
40
30
20
10
–10
0
5 10 15 20 25 30 35 40
Greece
Spain
Estonia
NetherlandsEurozone
Austria
Germany
FinlandFrance
ItalyPortugal
Ireland
Percentage change of GDP-deflator
Un
it la
bo
ur
cost
s, p
erce
nta
ge
chan
ge
45 50 55 60
R2 = 0,92638
65
Fig. 1 ULC1 growth rates and inflation for EMU (1999–2007)2. Notes: 1. ULC defined as gross
income per capita in ECU/Euro of dependent employees divided by real GDP per total employed
persons. 2. 12 countries: Belgium, Germany, Finland, France, Greece, Ireland, Italy, Luxembourg,
Netherlands, Austria, Portugal, Spain. Source: AMECO database (as per Nov-12); own
calculations
3See Flassbeck (2001).
Macroeconomic Theory and Macroeconomic Logic: The Case of the Euro Crisis 9

country would play an even more important role than in a system of fixed exchange
rates since there would be no option of changing the exchange rate, as in the Bretton
Woods system and the EMS.
1.4 Real Wage Growth Determines Domestic Demand
A wage path determined by the golden rule described above would have the
additional merit of stabilising domestic demand in all EMU member states. Real
wage growth is the most important determinant of domestic consumption growth,
therefore systematic adjustment of nominal wages at a rate equivalent to national
productivity growth plus the inflation target would stabilise domestic demand in
each country, and thus demand across the union as a whole.
To eliminate the impact of unexpected and unforeseeable cyclical changes in
productivity it would preferable to adjust nominal wages to the trend growth of
productivity (say, average growth of productivity over the last 5 years). By taking
into account the inflation target (rather than the actual rate of inflation) it would be
possible to stabilising wage and demand growth. The reason is that short-term and
one-off price shocks (for instance, sharp increases in the price of oil or other
essential primary commodities) would be prevented from having a lasting infla-
tionary impact. If, in contrast, such shocks were actually reflected in the adjustment
of wages—as has been the case in backward-looking indexation mechanisms, such
as the scala mobile in Italy in the 1970s—the rise in nominal wages would cause a
rise in both ULC and the inflation rate, and would eventually command monetary
tightening, i.e. the raising of interest rates, which would discourage real investment.
If wage adjustments systematically followed the golden rule, the national econ-
omies within the EMU—but also the union as a whole—would move along a stable
path, led by generally stable growth of private consumption based on stable
increases in incomes expected by households (at least as long as productivity
growth was on a positive growth trajectory). Under these circumstances external
trade would also be balanced, because the movement of ULC in tandem with the
inflation target in all countries—irrespective of their national productivity paths—
would imply stability of the real exchange rate, which is the most comprehensive
measure of competitiveness.
It is apparent that stable growth of real wages in line with productivity growth
would be in sharp contrast to the proposition that wages should be super-flexible
and readily adjustable, as is envisaged by the neoclassical labour market doctrine.
According to the latter, high and rising unemployment (“idiosyncratic shocks”)
would be impossible to cure unless wages were flexible enough to lag behind
productivity for extended periods of time. Once again, however, this neoliberal
this proposition is based neither on evidence nor on logic: with stable growth of
domestic income (assured by the chosen adjustment path of real wages) and in the
absence of external shocks that would be due to a fall in competitiveness, there
would be no idiosyncratic shocks and no need at all to cut real wages.
10 H. Flassbeck

Indeed, there are severe dangers to overly flexible labour markets. Deflationary
traps are usually created by sharply rising unemployment for reasons that are
unrelated to labour market developments, such as excessive increases in real
wages. High unemployment as the result of a financial crisis, for example, would
lead to downward pressure on wages and aggregate incomes, even if wages and
incomes were depressed already before the occurrence of the crisis. The combina-
tion of high unemployment arising for such reasons together with workers trying to
“price themselves flexibly back into the markets” and thus accepting lower wages
would create a perfect storm for economic policy. And this is exactly what
happened after the global financial crisis in 2008/2009.
With rising unemployment and renewed pressure on wages consumer spending
did not recover in the way seen in former recessions. In the USA and Europe the
restriction of aggregate demand caused by declining income expectations of house-
holds suffering from high levels of unemployment has dramatically prolonged the
recession or stagnation. With monetary policy restricted by the lower bound of zero
for interest rates, fiscal policy is needed to implement a huge stimulation
programme to overcome the decline in aggregate demand in such a precarious
situation. Indeed, a large part of the tendency to deflation in contemporary capital-
ism is the result of a dysfunctional labour market in which unemployment could rise
sharply without wages being “too high”. The lesson is that for a consistent critical
approach to economics it is necessary to discard both the monetarist theory of
inflation and the neoclassical theory of the labour market completely.
The conservative way of getting round the brutal logic of destabilising labour
markets would be to hope for improved competitiveness of the economy as a whole
and thus for more exports (or fewer imports). Indeed, a solution would seem to be
found if a wage cut stimulated foreign demand by more than it depressed domestic
demand. These conditions appear to hold for a paradoxical case such as Ireland.
Given the country’s export share in GDP of more than 100%, the positive effect of
wage cuts on the current account has balanced out the negative effect on domestic
demand. However, Ireland is an exception and hardly relevant to normal econo-
mies, or to large groups of countries.
1.5 Real or Nominal Convergence?
It is frequently argued that countries with very different levels of wealth should not
form a monetary union. Poorer countries are assumed to be incapable of competing
with richer nations, and are advised to abstain from entering into a race for
competitiveness. This argument, however, is not convincing.
The main analytical point in this connection is that, in any country, all groups of
agents have to respect a budget restriction in making claims on the income
produced in that country: no country can consume more than it produces in the
long term. This is why in a normally functioning economy the claims of one group,
including workers, are balanced out against the claims of other groups at a given
Macroeconomic Theory and Macroeconomic Logic: The Case of the Euro Crisis 11

level of total income. In an economy in which this balancing does not work, there
would be a conflict over income distribution that would result in inflationary bouts
and even spirals. If such an outcome was, however, avoided, the level of wages and
profits would reflect exactly the level of wealth in that economy, and the wage level
would reflect national productivity. Thus, low wages in the poorer countries would
reflect low productivity and the opposite for rich countries.
The level of nominal unit labour costs would be the same in a poor and in a rich
country, provided that in both countries a major conflict about income distribution
and inflation could be avoided. Consequently, there would be no risk of large trade
imbalances as a result of different levels of wealth as long as some minimum
requirements regarding the structure of trade and the structure of products available
to both countries would be met, meaning primarily an overlapping structure of
goods produced in both countries. This was clearly the case for European countries,
which had open trade relations long before entering the monetary union.
Overall, there is no reason why it should not be possible for poor as well as for
rich countries to manage the ULC growth in the economy as a whole in such a way
that it would be in line with a commonly agreed inflation target. This can be easily
demonstrated for France and Germany in Fig. 2 below. Both countries had exactly
the same starting point in terms of absolute productivity and nominal wages.
However, over time nominal wages and (in this case nominal productivity) grew
more in France and propelled the country into major difficulties compared to
Germany, although French wages have followed a reasonable growth path never
violating the golden rule for ULC growth in the monetary union:
140
130
120
110
100
90
Germany France Austria ECB 1.9% Inflation Target Italy Southem Europe excl. Italy
1999
2000
2001
2002
2003
2004
2005
2006
2007
2008
2009
2010
2011
2012
2013
Fig. 2 ULC1 divergence Germany and rest of EMU2 (1999¼ 100). Notes: 1. ULC defined as
gross income per capita in ECU/Euro of dependent employees divided by real GDP per total
employed persons. 2. EMU of 12 countries excluding Germany: Belgium, Finland, France,
Greece, Ireland, Italy, Luxembourg, Netherlands, Austria, Portugal, Spain. Source: AMECO
database; own calculations
12 H. Flassbeck

The logic of a monetary union built along the lines of EMU demands that
member countries must strictly accept the joint target for inflation and to preserve
external equilibrium by adjusting wages to national productivity accordingly. For
each country that means strict adjustment to its own productivity path and its owneconomic potential. Countries “living above their means” are as problematic as
countries “living below their means”. The requirement to live “according to its
means” is as pressing as the requirement to commit to free trade for a country that
enters a currency union. For, any measures to protect home-made products by
imposing barriers on imports or by subsidising exports are strictly forbidden in a
common market. In short, if there was no requirement to avoid “devaluation” of the
real exchange rate by undercutting the inflation target through wage “moderation”,
the entire body of rules and regulations surrounding a monetary union would be
totally useless.
1.6 Germany as the Source of the Eurozone Crisis
The preparations for EMU were deeply flawed because, instead of discussing the
implications of a monetary union in detail and creating the institutions necessary to
run such a union successfully, political debate and decision making in the years up
to 1997—by which time the criteria for entry had to be fulfilled—actually focused
on fiscal policy. Particular emphasis was laid on limiting public sector deficits to
3% of GDP, whereas the need to avoid inflation differentials and guaranteeing the
ability of member states to stick to the common inflation target over time were
regarded as much less important issues for the smooth functioning of EMU.
Germany, with its absolute intolerance of inflation exceeding 2% and its dogmatic
monetarist tradition, silenced any other view on inflation.
There is little doubt that the EMU obsession with fiscal targets is the direct result
of the struggle between governments and markets that has dominated much of the
ideological debate in the 30 years following the end of the Bretton Woods regime.
Yet, there is no direct relationship between fiscal budgets and the inflation target
(either empirical or theoretical) and any plausible indirect links would be very weak
indeed. For, neither the current budget deficit nor the size of the public debt, has an
impact on the inflationary performance of an economy. If any link could be thought
of, it would be that (in line with an ancient prejudice) a highly indebted government
could perhaps use inflation as a tool to reduce the real value of its debt. However,
Japan during the last 25 years demonstrates that none of this holds in contemporary
capitalism. With a public debt equivalent to 250% of GDP, Japan has the highest
level of public debt of all industrialised countries. And yet, despite continuous
efforts, the country has not been able to get out of a deflationary trap. Japanese
policymakers might dream of generating a sustainable level of inflation, but their
persistent nightmare is deflation.
In the heated debate that took place in Germany about the dangers of inflationary
acceleration as EMU was approached, wages or nominal unit labour costs were
Macroeconomic Theory and Macroeconomic Logic: The Case of the Euro Crisis 13

hardly ever mentioned. Labour costs were considered to reflect the market price for
labour. The “flexibility doctrine” was the broadly accepted view in politics as well
as in economics.4 Consequently, in view of the monetary union commencing in
1999, Germany, the biggest country in the EU and the bastion of stability for several
decades, decided to try out a new way of combating its high level of unemployment.
In short, the government, together with the employers, started to put political
pressure on labour unions in an attempt to restrict the growth of both nominal and
real wages.
It ought to be stressed that Germany’s vigorous attempt to tackle its persistently
high unemployment rate by making its labour market more flexible was not aimed
at gaining an advantage within the EMU. Rather, it was grounded in the neoliberal
conviction that lower wages would result in more labour-intensive production
processes across the economy. Once work-time reduction schemes had failed to
deliver the expected result of reducing unemployment, labour union leaders agreed
in a tripartite agreement in 1999 to abandon the formula that had hitherto been used
to determine wage growth. The formula had ensured equal participation of workers
in the gains from productivity growth (the golden rule mentioned above); instead,
the unions agreed to “reserve productivity growth for employment”.5
This agreement also implied that there would be a fundamental break with the
German tradition of sticking to a low and stable rate of inflation. Historically,
Germany had been characterised by moderate wage increases, which ensured that
real wages (nominal wages adjusted for inflation) would rise in line with produc-
tivity (GDP divided by the number of hours worked). In other words unit labour
costs (nominal wages divided by GDP) would generally rise in line with an inflation
target of roughly 2%. However, as monetarism became the widely accepted
doctrine to tackle inflation on the approach to EMU, the new arrangement clearly
meant even lower inflation, and its deflationary aspect was not even thought of.
The novel German approach to the labour market coincided with the formal
introduction of the monetary union, and consequently led to huge divergences in
nominal unit labour costs among the members of EMU. The main cause of these
divergences was the simple fact that German nominal unit labour costs, the most
important determinant of prices and competitiveness, have remained essentially flat
since the start of the EMU, as is shown in Fig. 2. In contrast, most countries in
southern Europe had nominal wage growth that exceeded national productivity
growth plus the commonly agreed inflation target of 2% by a small but rather stable
margin. France was the only country exactly to meet the target for nominal wage
growth. French wages rose in line with national productivity performance plus the
ECB’s inflation target of a rate close to 2%:
Even though the annual divergence among the increases in ULC was relatively
small, the dynamics of such a “small” annual divergence are able to yield dramat-
ically large gaps over time. At the end of the first decade of EMU the cost and price
4The “doctrine” was clearly laid out in OECD (1994).5See, Flassbeck (1997), Flassbeck and Spiecker (2005).
14 H. Flassbeck
gap between Germany and southern Europe amounted to some 25%, and that
between Germany and France to 15%. In other words, Germany’s real exchangerate had depreciated quite significantly, even though national currencies no longer
existed within the EMU. The divergence in the growth of unit labour costs was
naturally reflected in equivalent price divergences. Thus, the EMU as a whole
achieved the inflation target of 2% almost perfectly, but national differences of
inflation within the union were remarkable. Once again, France was by far the best
performer since it succeeded in aligning its inflation rate perfectly to the EMU
target. However, Germany systematically undershot the target and countries in
southern Europe systematically overshot it by margins large enough to create
huge gaps in competitiveness.
The cumulative gaps have meant huge absolute advantages (and thus disadvan-
tages) in international trade for the countries of the EMU. There is little doubt about
the main culprits and the extent of misbehaviour in view of the fact that the ECB’starget of nearly 2% annual inflation would only be compatible over time with a 2%
annual increase in nominal unit labour costs. Greece, for instance, was generally
delinquent because annual ULC growth was roughly 2.7%. But its violation of the
rule was much less severe than that by Germany whose annual rate of ULC growth
was just 0.4%. It is even more paradoxical that Germany had explicitly agreed to
the ECB target of close to 2% because that had been its own inflation target prior to
EMU. Germany was destined clearly to violate the ECB target given that its
government and employers had begun to apply enormous downward pressure on
wages, aiming at a different capital/labour ratio with the result of improving the
country’s international competitiveness.
It is undeniable that the real depreciation that has occurred in Germany has had
an enormous impact on trade flows. With German unit labour costs undercutting
those in the other countries by a rising margin, German exports flourished, while
imports slowed down. Countries in southern Europe, but also France and Italy,
began to register widening trade and current account deficits and suffered huge
losses of their international markets shares. Germany, on the other hand, was able to
preserve its share despite mounting global competition from China and other
emerging markets. In a nutshell, Germany has operated a policy of “beggar-thy-
neighbour” but only after “beggaring its own people” by essentially freezing
wages.6 This is the secret of German success during the last 15 years.
While trade within Europe had been rather balanced at the inception of the
currency union and for many years before that, the EMU marked the beginning of a
period of quickly growing imbalances. Even after the shock of the financial crisis
and its devastating effects on global trade that are clearly visible in the German
balance, the underlying trend has continued unchanged. Germany’s current accounthas continued to rise after 2010 and even reached a new record high in 2013 (2014
will also see a current account surplus in the order of 200 billion euros or a number
of close to 7% of GDP). While the surpluses relative to the members of the
6See, Lapavitsas et al. (2012), pt. I.
Macroeconomic Theory and Macroeconomic Logic: The Case of the Euro Crisis 15

Eurozone culminated in 2007 the surplus relative to the rest of the world increased
quickly after the financial crisis.
It is obvious that immediately after the Eurozone crisis had burst out and the
economies of stricken countries had began to falter, German exporters reoriented
their efforts toward the rest of the world and achieved similar surpluses in those
markets—still protected by the euro. With a huge accumulated margin of compet-
itiveness in their favour and protected by the relatively low Euro exchange rate
(with the exception of a few months in 2014) they could easily gain, again at the
expense of other Euro members, market shares in the rest of the world. Chinese
demand for automobiles in particular was the most important reason for the surge in
exports.
Empirical studies sometimes fail to find evidence for an influence of prices or
unit labour costs on trade flows and the current account balance.7 This is typically
due to misspecification of the study or to the uncritical use of country samples and
time periods. If, for example, a study also included very small and highly
specialised countries, such as Ireland or Cyprus, or poor transitional economies,
such as the Baltics, the results are likely to be problematic. The production structure
of these countries could not be reasonably compared to countries such as France
and Germany with their highly diversified industrial base. Strong objections could
also be raised against including in the sample a country such as the Netherlands,
which has engaged in the German kind of “beggar-thy-neighbour” policies long
before German, and was thus able to defend its current account surplus despite its
unit labour cost rising more than in Germany since the beginning of EMU.
Moreover, when choosing the period of empirical analysis, it has to be taken into
account that the deep recession in the deficit countries of the EMU following the
financial crisis of 2008 has naturally tended to reduce the observed deficits through
huge income effects that temporarily overlaid the price effects. But it is unlikely
that recovery would take place in those countries without a fundamental improve-
ment in competitiveness. The eventual revival of domestic demand, moreover,
would probably bring deficits in the current account quickly back to the fore and
thus restrain future growth. Even in Greece that has been devastated by the crisis
and the policies imposed on it by the EU, there are signs that current account
deficits are returning in 2014, i.e., as soon as the economy’s contraction had ceased.Pursuing the issue further, Figure 3 shows that among the core countries and the
biggest traders of the EMU the relationship between ULC and the current account
during the critical period from 1999 to 2007 is both clearly visible and negative.
The relationship would be even stronger if, instead of ULC, the movement of
prices (i.e., the GDP deflator) was compared to the movement of the current
account, as is shown in Fig. 4 below.
The countries included in both of these figures account for close to 80% of
overall EMU trade (internal and external). Furthermore, for Italy and France the
most important competitor inside and outside EMU is Germany. To assume that an
7See, for instance, Gabrisch and Staehr (2014).
16 H. Flassbeck

accumulated price difference of 20–30%, such as taken place since the start of the
EMU, would not influence trade to the benefit of Germany is complete nonsense.
The conclusion that “The developments in unit labour costs are endogenous and
partly determined by capital flows. This may suggest that the Euro Plus Pact may
have limited ability to impact unit labour costs and even if possible, this may have
Current account1) and unit labour costs2) in EMU,1999-2007
4
3
2
1
0
–1–10 –8 –6 –4 –2 0
Southern Europe3)Italy
France Belgium
Austria
Germany
Average current account balance1)Nominal current account balance in relation to GDP as an average over the reference period. 2)Yearly change of hourly unit labourcosts over the reference period in per cent. 3)Southern Europe: Greece, Portugal, SpainSources: OECD, Ameco-Database (November 2013).
Yea
rly
chan
ge
in u
nit
lab
ou
r co
sts
in p
er c
ent
2
R2 = 0,46249
4 6
Fig. 3 Trade imbalances, prices and wages
–10–1
0
0
2
3
4
–8 –6 –4 –2
Average current account balance
Yea
rly
chan
ge
of
the
pri
ce le
vel i
n p
er c
ent
0 2 4 6
Current account1) and inflation2) in EMU, 1999-2007
1)Nominal current account balance in relation to GDP as an average over the reference period. 2)Yearly change of GDP deflator over thereference period in per cent. 3)Southern Europe: Greece, Portugal, SpainSources: OECD, Ameco-Database (November 2013).
Southern Europe3)
Italy
France
Belgium
Austria
Germany
R2 = 0,69289
Fig. 4 Current account and inflation. Note: Negative values represent a current account deficit.
Source: AMECO database (as per Nov-12); own calculations
Macroeconomic Theory and Macroeconomic Logic: The Case of the Euro Crisis 17

little effect on a possible emergence of current account imbalances“, is absolutely
unjustified.8
Finally, the need to avoid imbalances within in a currency union is not mainly
about current account deficits and surpluses per se in a clearly defined period of
time. The point is, rather, that absolute and cumulative advantages of one country or
a group of countries against a similar country or group of countries are definitively
unsustainable over very long time spans. A huge gap in competitiveness and the
resulting losses in market shares would have to be closed at some point, because
otherwise the losing country or region would find it impossible to persuade its
lenders that it would be able to repay its debts at some point in the future. Whether
this point will be reached in 20 years or in 40 years is not important for a nation
depending on the capital market. The fact that it will happen is sufficient to trigger
the reactions of the market that we have seen in all financial crises.
The calculus of the market is simple: Final repayment of any international debt is
payment in kind. If it is not permanently to impoverish the debtor countries, such
repayment requires a gain in market share, that is, the emergence of a current-
account surplus in the debtor country and of a deficit on the creditor’s side. An
indebted country could only service and repay its debt over time if the surplus
country allowed the deficit country to begin to register surpluses at some point. The
change could only occur by means of changes in competitiveness that would occur
through price adjustments resulting from wage adjustments and/or changes in the
exchange rate. Quantity adjustments in international trade cannot be a permanent
solution.
Unlike capitalist enterprises, countries typically neither go bankrupt, nor disap-
pear. They are obliged to find ways of coping with situations where nearly all their
productive agents face absolute disadvantages against their competitors abroad.
The most direct and brutal way to deal with high unit labour costs (in international
currency) would be to reduce wages. If it were possible to reduce nominal wages
only in those parts of the economy that were exposed to international competition,
many negative side effects could be avoided for the rest of the economy. Currency
depreciation would do exactly that. A declining currency would reduce nominal
wages expressed in international currency, but not across the board in all sectors of
the economy. Imports would become more expensive and they would tend to be
replaced by domestically produced products; exports would become cheaper for
international clients and would tend to increase. Even if imports (of commodities)
could be not replaced at all by domestic products, however, the international
adjustment of wages would be unavoidable to allow the country to buy the
necessary imports through its own exports.
8See, Gabrisch and Staehr (2014).
18 H. Flassbeck

1.7 Germany Has to Adjust
It is plausible to argue (even by someone sympathetic to the views expressed in this
book) that, for Germany, the strategy to contain domestic nominal wage growth was
not motivated primarily by competition inside EMU but rather with emerging
economies, in particular the rising industrial power of China. It might even be
added that this strategy was fully in line with the general orientation of the
European Union for several years, urging its members to improve their
competitiveness.
Although these arguments would be intuitively attractive, they would be falla-
cious because they would overlook, once again, the crucial importance of the strong
and stable relationship between the growth rate of unit labour costs and the inflation
rate, on the one hand, and the growth rate of real wages and domestic demand, on
the other. Under no circumstances should a monetary union trying to achieve an
inflation rate of 2% allow one of its member countries (particularly the biggest one)
to go its own way in terms of ULC development and inflation. If Europe felt that
there was a challenge from emerging markets, which had to be addressed at the
macroeconomic level, it could have chosen a lower inflation rate (or even deflation)
as the target of its common monetary policy. However, in that case, the exchange
rate of the Euro against the Chinese Yuan, or the US Dollar, would have reflected
sooner or later the lower inflation in Europe, thus destroying the advantage that
Europe would have tried to obtain by pursuing a lower inflation target.
In a world of floating or adjustable exchange rates no country could gain a
permanent advantage against another country, if the latter had the option of
adjusting its exchange rate in accordance with inflation differentials. This means
that all attempts to improve competitiveness by cutting or moderating wages for the
EMU as a whole would be useless. And yet, this is precisely the approach that
Europe has chosen as a way forward after the crisis. This is deeply misguided also
because in most European debtor countries wage cuts would lead to severe falls in
domestic demand, which is more important than external demand. In economies
with an export share in GDP that was far below 50%, wage restraint strategies
would be counterproductive, since there would not be a realistic prospect of
achieving a huge current account surplus over a lengthy period of time, and nor
would it be possible to raise the export share in GDP beyond the 50% mark without
suffering retaliation from trading partners. Under normal circumstances, it would
therefore be impossible to successfully emulate the strategy followed by Germany
during the first 10 years of EMU.
Even more important than these general objections regarding German strategy,
however, would be the dynamics of the overall economy. In a monetary union, a
country with a low export share and facing a huge current-account deficit and
financing problems due to an implicitly overvalued currency would be trapped.
Downward adjustment of wages, sometimes erroneously called “internal devalua-
tion”, would be no solution as it would destroy both domestic demand and output
before it could bring some relief through rising exports.
Macroeconomic Theory and Macroeconomic Logic: The Case of the Euro Crisis 19

Furthermore, countries with a huge gap of competitiveness against Germany
would have to go through an extended period of catching-up in terms of price
competitiveness. There would be neither rapid gains in international market share,
nor a lasting improvement in the current-account position, since Germany’s absoluteadvantage would remain intact as long as the competitiveness gap was not turned into
the opposite, i.e. an absolute advantage of the deficit countries. Figure 1 has already
shown that deficit countries have to dive below the German UCL path for a long time
to regain some of the losses they have experienced in the first 10 years of EMU.
The Achilles heel of this adjustment process is its duration. A democratic
country could not possibly sustain 5–10 years of falling living standards and rising
unemployment. The economic, social and political costs would be tremendous, as is
made clear for Greece in this book. The process would result in social upheaval,
including desperate attempts by the people to use elections to prevent what would
be in their eyes a frivolous attack on their well-being.
This is why the adjustment process within the EMU would have to symmetric at
the very least. This means that the country that has implicitly undervalued its
exchange rate—Germany—would have to engage in a strong effort of upward
adjustment, i.e. faster wage increases, while other countries would undertake a slowly
downward adjustment. The most reliable yardstick for the success of the adjustment
efforts on both sides would be the inflation target again. If the common inflation target
was not questioned, to restore the deficit countries’ international competitiveness it
would be necessary to raise ULC and inflation in the surplus country up to the point
where external balance on both sides over the entire life of the monetary union (the
first 10 years included) would be achieved. It is enough merely to state this require-
ment to make its extraordinary difficulty absolutely apparent.
1.8 EMU Heads to Disaster
At the beginning of 2014 unemployment in the EU stood at more than 12%. In
Spain and Greece unemployment exceeded 25%, while youth unemployment was
above an extraordinary 55%. More than anything else these figures show the failure
of the EU tackle the problem that has emerged as the “Eurozone crisis”. Indeed,
while the dramatic drop in growth and employment was first caused by the global
crisis of 2007–9, after 2010 the debtor nations of the EMU were deprived of the
means of fighting the recession and were forced to adopt pro-cyclical policies of a
scale that was last seen in the 1930s.
The German mantra of “austerity as the only solution” was applied to all
countries that were forced to ask for help when their access to the global capital
markets ceased, or was blocked de facto by very high interest rates.9 Once again,
obsession with apparent fiscal problems dominated the debate and the conditions
9See, Schauble (2011).
20 H. Flassbeck

that were demanded by the troika and the Eurogroup to open the coffers of the
creditor nations focused on consolidating the public budgets of deficit countries at
any price and as quickly as possible.
With German dominance over export markets persisting and given Germany’srefusal to adjust its own economic model the future looks bleak for the Eurozone.
The lack of policy instruments to tackle the recession, the conditionality attached to
the adjustment programmes imposed on the crisis economies, the dysfunctional
“structural” adjustment itself and the prospect of looming deflation have raised the
costs of remaining within the EMU up to the point where political upheaval on the
right threatens democracy and the EU. Failure to address the rate of unemployment
and rising poverty has paved the way for radical right-wing and populist
anti-European parties in creditor as well as in debtor countries. Against this danger,
the benefits of being a member of the EMU are small and, more importantly, they
are shrinking fast.
The disintegration of the capital markets in the EMU following the financial
crisis has drastically reduced the benefits of belonging to the monetary union and
accepting a common monetary policy. Nearly 5 years after the outbreak of the
Eurozone crisis things have not changed significantly. The return of Ireland, Spain
and Greece to the capital markets came at an incredibly high price, the countries
having had to pay a very high rate of interest on their bonds considering that they
were in recession and deflation. But even worse has been the historically unprece-
dented costs of the adjustment that they have had to accept to reach that point.
Furthermore, the limited ability to raise funds in the capital market has not removed
the constraints on domestic economic policy. For Greece in particular, and as is
shown in detail in the last chapter of this book, neither fiscal policy nor any other
normal economic tool is available to stimulate an economy that has gone through a
great depression. At the same time, monetary conditions (interest rates and real
exchange rates) are clearly worse in the deficit than in the surplus countries. Record
low interest rates on government bonds in the surplus countries have laid the ground
for easy consolidation of their budgets, while benign monetary conditions might
begin to stimulate their economies.
For the EMU as a whole, applying “structural reforms” simultaneously to the
labour markets of several countries has entailed a dramatic drop in domestic
demand, and contributed to a collapse of trade flows. The effect of wage cutting
in countries where domestic demand strongly exceeds foreign demand (in France,
Italy, Portugal and Spain domestic demand amounts to three quarters of total
demand; by contrast, in Ireland the export share of GDP is more than 100%) has
directly reduced aggregate demand. In this way, the imposed wage cuts have
directly increased unemployment rather than, as the troika expected, reducing it.
Consequently, there has been a remarkably strong correlation between the
adjustment demanded by the troika and economic decline in peripheral EMU
countries. The more closely countries have followed the troika prescription, the
more their economies have shrunk and even collapsed. France and Italy have
experienced a strong deceleration of growth even with unchanged wage growth
Macroeconomic Theory and Macroeconomic Logic: The Case of the Euro Crisis 21

(and growth in ULC). But all countries that have actually undergone the troika
“treatment” since 2010 have faced stunning decline.
Paradoxically, those countries that have gone quite a way toward improving
their competitiveness by reducing wages offer the final proof that this exactly the
wrong way to proceed. Indeed it is even worse than that: the brutal logic of the
adjustment imposed on some smaller countries has meant that the others, including
France and Italy, could not apply it without risking major political destabilisation. If
France and Italy went the way of the troika, it is almost certain that the entire
Eurozone would be thrown into depression resulting in a sharp drop of prices and
long-lasting deflation.
It is hard to imagine that the democratic regimes in these countries would
survive such an event. It is even likely that radical parties of the Right would
become dominant by campaigning against Europe and the Euro. On the other hand,
if France and Italy do not adjust, their economies would be destroyed in terms of
competitiveness making it impossible to prosper on the basis of balanced trade.
Their deficits on current account would keep on growing putting their entire
economic edifice in jeopardy. But then, if France and Italy did not apply the troika
adjustment programme and Germany did not change its stance, the end of the Euro
as a common currency would be only a question of time.
In short, the accumulated divergences during the first years of the EMU and the
terrible nature of the adjustment programmes have put the very survival of the EU
in question. And yet, European policy makers appear to be oblivious to this fact.
They are even less willing to engage in a policy effort to turn around the overall
economy and to stop the growing divergences within the EMU. The prospect of
disintegration and eventual collapse of the union can no longer be ignored.
References
Flassbeck H (1997) Und die Spielregeln f€ur die Lohnpolitik in einer Wahrungsunion? Frankfurter
Rundschau (31/10/1997), p 12
Flassbeck H (2001) The exchange rate: economic policy tool or market price? UNCTAD Discus-
sion papers 157
Flassbeck H, Spiecker F (2005) Die deutsche Lohnpolitik sprengt die Europaische
Wahrungsunion. WSI-Mitteilungen 58(12):707–713
Flassbeck H, Lapavitsas C (2013) The systemic crisis of the euro: true causes and effective
therapies. Rosa Luxemburg Stiftung Studien. http://www.Rosalux.de/fileadmin/rls_uploads/
pdfs/Studien/Studien_The_systemic_crisis_web.pdf
Gabrisch H, Staehr K (2014) The Euro plus pact. Cost competitiveness and external capital flows
in the EU Countries. Working Paper series Nr. 1650, European Central Bank
Lapavitsas C, Kaltenbrunner A, Lambrinidis G, Lindo D, Meadway J, Michell J, Painceira JP,
Powell J, Pires E, Stenfors A, Teles N, Vatikiotis L (2012) Crisis in the Eurozone. Verso,
London
OECD (1994) The OECD jobs study. OECD, Paris
Schauble W (2011) Why austerity is the only cure for the Eurozone. Financial Times (05/09/2011)
22 H. Flassbeck

Economic Crisis and National Economic
Competitiveness: Does Labor Cost Link
the Two? The Case of the South Eurozone
States
Dimitrios Kyrkilis, Georgios Makris, and Konstantinos Hazakis
Abstract A widely accepted thesis, especially by international organizations and
economic policy practitioners is that national economic competitiveness is deter-
mined by the unit labor cost, prescribing a policy of wage reductions, i.e. internal
devaluation for improving national economic competitiveness. The current paper
disputes this thesis arguing that it is based on theoretical and methodological
misconceptions and oversimplifications, misinterpreting the Ricardo’s comparative
advantage model, especially the source of comparative advantages. The Kaldor’sparadox supports in empirical terms the arguments put forward in this paper.
Equally important, the paper argues that national economic competitiveness is
related to the functional income distribution. It analyses the relationship between
gross profits and productive investments, and it applies the conclusions of the
analysis to the euro zone southern countries.
1 Introduction
There is a widely spread view among economic theoreticians and policy makers
that the unit labour cost best accounts for national economic competitiveness. It is
argued that decreasing unit labour costs (ULCs) indicates improving national
economic competitiveness. This argument reached momentum soon after the
beginning of the euro area debt crisis as many economists argued that workers in
Greece, Ireland, Italy, Portugal, and Spain are too expensive, compared to wages in
D. Kyrkilis (*) • G. Makris
Department of Balkan, Slavic and Oriental Studies, University of Macedonia, 156 Egnatia Str,
540 06 Thessaloniki, Greece
e-mail: [email protected]; [email protected]
K. Hazakis
Department of Economics, Democritus University of Thrace, University Campus, 691 00
Komotini, Greece
e-mail: [email protected]
© Springer International Publishing Switzerland 2016
A. Karasavvoglou et al. (eds.), Economic Crisis, Development and Competitivenessin Southeastern Europe, Contributions to Economics,
DOI 10.1007/978-3-319-40322-9_2
23

competitor countries leading to losses of export shares, and deteriorating current
account deficits.
The current paper supports the view that the deterioration of current account
imbalances, increasing public budget deficits, and mounting public debts for certain
euro zone member countries are not mere consequences of the national fiscal policy
mismanagement but they reflect low and deteriorating international economic
competitiveness. The latter, however, is founded on a number of structural deter-
minants that are favourable to investment activity and technological change that in
turn boost productivity and, ultimately competitiveness but not simply on labour
cost. Countries of low economic competitiveness suffer from certain structural
deficiencies which, in the context of the euro zone are realised as structural
divergence vis-�a-vis more successful countries. It is these structural divergence
which one implicitly refers to when the euro zone is divided into Core and
Periphery economies acknowledging that the first group is far more competitive
than the second one. Nicholas Kaldor (1978a) was amongst the first to stress the
importance of structural factors in determining the competitiveness of a country’sperformance in international competition highlighting, for example, product qual-
ity, technological innovation as well as the geographical orientation of exports
affecting the income and price elasticities of demand for imports and exports.
The efficient operation of a common currency area presupposes that adjustments
through flexible independent exchange rates are replaced by other adjustment
mechanisms. The theory of optimal currency areas (OCA) underlines such mech-
anisms (a) flexibility in wages so as to align unit labour costs with international
competitiveness, (b) significant cross border labour mobility, (c) federal fiscal
institutions to provide insurance against asymmetric shocks, and (d) operational
fiscal rules to limit negative spillovers of national fiscal policies on other member
states.1
OCA analysis stresses that there should be a high degree of homogeneity among
the states making up a currency area. Since monetary union includes the absence of
national autonomy over monetary policy including exchange rates, the homogene-
ity condition ensures that member states are equally affected by external shocks
(including financial shocks) and that none are unduly destabilized by the imposition
of centralised monetary area policies as far as it concerns the interest rate, exchange
rate and national budgetary balance. Homogeneity requirement is fulfilled by three
conditions: symmetry, flexibility and integration.2 Under the symmetry condition,
economies should be roughly similar and synchronized, so that shocks are sym-
metrical in the sense that if, for example, a negative demand shock takes place, all
the member states are affected in the same way—that is, are equally vulnerable—
and all are equally affected by any central currency area policies. McKinnon (1963)
underlines comparable degrees of “economic openness” (ratio of tradable goods
production to non tradable goods production) insisting that if the states making up a
1See Mundell (1961), McKinnon (1963) and Kenen (1969).2See De Grauwe (2012).
24 D. Kyrkilis et al.

currency union have similar degrees of openness, shocks will be broadly symmet-
ric. Kenen (1969), argues that homogeneity is attained through ‘structural diversity’(diversity of exports) within the states of a single currency area since diversification
limits idiosyncratic shocks. Mundell (1961) argues that optimality relates to the
state of the labor market. Exchange rates can be fixed between states and regions
when labour moves freely between them.
The lack of an automatic fiscal stabilization mechanism as well as limited
geographical mobility of factors enforces the asymmetry of demand and supply
shocks across the regions making up a currency area. Increased asymmetry in
economic shocks across regions means that a common monetary policy is less
able to smooth over the shocks across the entire area and it can greatly deteriorate
conditions in some regions, given that the latter cannot use independent monetary
policies for stabilization. In the absence of OCA fundamental traits (i.e. cross-
border labor mobility and the lack of a federal fiscal transfer mechanism), monetary
union could increase vulnerability of regions to idiosyncratic shocks through
increased regional specialization and agglomeration. According to Krugman
(1993) both theory and US historical experience suggest that the EU regions
would become increasingly specialized as a result of monetary integration, and
that as they became more specialized so they would become more vulnerable to
region-specific shocks.
National competitiveness problems within the euro zone and taking into account
that currency devaluation, one of the most powerful policies for restoring compet-
itiveness is not feasible because of monetary union terms, it is proposed to be solved
through the implementation of an internal devaluation policy. Internal devaluation
includes a substantial fall in domestic ULCs relative to those of trading partners
through a decline in relative wages or/and rises in labor productivity and other
non-price adjustments (i.e. those linked to product quality). More specifically, a
state can ameliorate its price competitiveness by reducing real or nominal wages
with positive effects on its exports and aggregate demand. This makes easier a
reallocation of resources from the production of non-tradable goods to tradable
goods, which is needed to achieve full employment within a tighter external
funding constraint. With no option of nominal exchange rate adjustment within a
currency union, economies need to attain an internal devaluation to fill output gaps
and lower unemployment rates through the reinforcement of their tradable sectors,
including more exports and fewer imports. This guarantees that once financing
constraints are absent, current accounts will not deteriorate again. However, empir-
ical evidence from past policy attempts suggest that attaining internal devaluations
can be a long and difficult process in an economy characterized by wage rigidities.3
The paper questions the efficiency of this policy option underlining the theoret-
ical misconceptions of the unit labour cost perception as the main determinant of
national economic competitiveness. Instead, it argues that the unit labour cost
should be related with investment activity taking into consideration the functional
3See Alesina and Perotti (1997), and Alesina and Ardagna (1998).
Economic Crisis and National Economic Competitiveness: Does Labor Cost Link. . . 25

income distribution of the economy. Empirical evidence from the south euro zone
countries where internal devaluation was implemented as an antidote to the finan-
cial crisis, clearly demonstrate that internal devaluation policies fails to enforce
investment flows but it contributes to economic recession, initially triggered by
fiscal consolidation policies and it is associated with significant unemployment
increases and business shutdown4 contributing further to economic recession.
Overall, such a policy creates a recessionary spiral that leads to deflation and a
serious decline of national income both undermining the business and investment
climate.
Unit labour cost is estimated by the use of an index constructed on the basis of
aggregate data, i.e. the ratio of total in the economy labour remuneration over total
domestic output. Such construction is inefficient since aggregate data is not the
weighted average of individual company and/or sector unit labour costs. The use of
aggregate data conceals structural changes in the economy. Often rising unit labour
cost at the firm and/ or sector level reflects labour productivity advances at the
respective level or it may be due to shortages in the respective labour and/or labour
skill market segment, especially in cases of increasing labour demand as a result of
technological change. There is no reason to believe that the rest of the economy
follows similar trends. The overall ULC may rise if the sectors and /or firms
experiencing such trends weigh overwhelmingly to the total economy or it may
decline or stagnate if the remaining sectors weigh more significantly. In any case,
asymmetric trends between sectors of an economy are not revealed by a uniform
ULC. Besides, a Balassa- Samuelsson effect is a non rarely observed phenomenon.
In this case the distinction between tradable and non-tradable sectors is required
given that wages in the tradable sectors is more possible to rise due to technological
change, therefore they are aligned to the international competitiveness of the
economy than in the case of the non-tradable sectors where wages rise due rather
to increasing domestic demand triggered by higher incomes in the tradable sectors
than to increasing productivity, therefore there are not supposed to adjust according
to the economy’s external competitiveness.
In addition, aggregate unit labour cost mirrors the distribution of national
income between capital and labour. Distribution of income affects aggregate
demand and investment functions. Investment in turn affects competitiveness.
The paper argues that real unit labor cost (RULC) instead is a more accurate
estimator of national income distribution, hence a more relevant indicator of
competitiveness However, RULC does not manage to overcome the methodolog-
ical shortcomings of ULC and it fails to take into account the structure of the
economy and its changes limiting its potential as a guideline for macroeconomic
policy design.
The paper proceeds as following. Section 2 examines the theoretical roots of the
unit labour cost as the competitiveness main determinant and it tries to present the
4To the extent that wages are rigid downwards and the labour market is not perfectly flexible wage
cuts may be achieved through massive unemployment.
26 D. Kyrkilis et al.

theoretical misconceptions related to the argument. Section 3 analyses the concept
of competitiveness and it elaborates methods of measuring it. Section 4 provides a
comparative overview of the internal devaluation programs implemented in the
south euro zone countries and their outcomes, while Sect. 5 concludes and provides
policy implications.
2 Theoretical Roots
A. Marshall (2013) complemented the Ricardian concept of comparative advan-
tages applicable in determining international trade flows with the concept of real
cost. In Marshall’s view, although prices are determined by demand and supply,
labour cost contributes significantly to the supply conditions, therefore it contrib-
utes to the determination of prices. To the extent that prices contribute to deter-
mining both competitiveness and the terms of trade labour cost is a determinant of
them too.
This view suffers from serious misconceptions that exist in two levels. First, in
the determinants of comparative advantages. Second, in the definition of economic
competitiveness.
In David Ricardo’s paradigm the concept of comparative advantages5 is seen on
a bilateral basis. Two commercial partner countries differ in the number of homo-
geneous physical labour units required for the manufacturing of one physical unit of
a product, i.e. labour productivity. Labour productivity differs not only between
countries but also between sectors within the same country. A country, although it
may supply all goods it specialises in the exporting of goods where it enjoys
relatively higher labour productivity compared to the one in the partner country.
Accordingly, «The absolute production costs are insignificant internationally, only
comparative production costs matter» (Schumacher 2013).
Ricardo grounds his concept of comparative advantages on the classical princi-
ple that labour is the only factor that produces value, hence output, labour is an
homogeneous production factor, but the opportunity cost of labour differs across
sectors and countries. Therefore, labour productivity differs both across sectors
within the same country and across countries within the same sector. Different
labour productivity means different production functions, therefore different tech-
nology inputs across sectors and countries. Finally, different technology inputs
means different investment profiles across sectors and countries.
According to Ricardo, production in the two commercial partner countries uses
different ratios of labour per unit of output requirements denoted by different labour
opportunity costs in each country that reflect different labour productivities which
in turn are determined by technological differences in the two countries. Although,
the Ricardian analysis underlines the importance of labor requirements per unit of
5See Ricardo (1911).
Economic Crisis and National Economic Competitiveness: Does Labor Cost Link. . . 27

output, hence of unit labour costs as a critical element of comparative advantages
and consequently of competitiveness, it is equally true that Ricardo sees the real
source of comparative advantages in technological differences which determine
labour productivity differentials across countries. Finally, it is labour productivity
and its international differentials that determine labour requirements per unit of
output, therefore unit labour costs and, ultimately its differences across countries.
Consequently, the critical element of comparative advantages, and thus of compet-
itiveness is not labour cost but technology. The latter determines, through labour
productivity the per unit of output labour requirements, and it forms the ground on
which production capabilities may be build. Furthermore, it is easy to understand
that, to the extent that technological change is not frequent and it requires time, in
the short and medium term labor productivity is the key term for international trade
specialisation and competitiveness; and it imposes the need for labour cost changes
to align with labour productivity and its deviations (Felipe 2005). Evidently, if
labour costs are connected with labour productivity there is no reason to expect that
labor wage reductions would lead to sustainable improvements in the international
competitiveness of a country. An exception may be the case where lower wages at
given unit of output labour requirements lead to higher profits6 and through them to
higher capital intensive investment activity, thus to higher labour productivity.
However, low wages favour ceteris paribus the substitution of capital with labour
leading to a rather opposite effect.
In the neoclassical tradition value is created by the coordination of labour and
capital, and the determination of the production factor prices is considered to be an
integral part of the price system within a general equilibrium framework. The
production factors remuneration tends to become equal to their respective marginal
productivity rates. On the contrary, Ricardo favours the production factors remu-
neration to be subject to a rather institutional arrangement, such an arrangement
could be a system of negotiations between the two factors, but certainly not subject
to the neoclassical principle of marginal productivity. In any case, the demand of
labour is a function of its real price, i.e. nominal wages in relation to the price level.
Therefore, it may be argued that unit labour costs per se do not really matter but it is
their relation with prices, hence the margin from revenues they allow to be allocated
to capital as income, i.e. profits that enters into the function of cost determination
and the choice of technology, i.e. labour vs. capital intensive production, ultimately
of choosing investment profiles and competitiveness. The simple unit labour cost
index is rather inadequate to show any impact the lowering of wages may have on
profits.
The dominant international trade neoclassical paradigm is that of Heckscher–
Ohlin (H–O), which underlines the abundance of factors of production in a country
6Ricardo, perceived profits and labor wages to act complementary to income distribution and
suggested that imports of low cost products which are the main consumption of workers will
definitely lead to income distribution in favor of capital. However, he didn’t link this crucial
element with the theory of comparative advantage (Gomes 2003).
28 D. Kyrkilis et al.

relative to another and thus drops out the criterion of relative cost. While many of
the Ricardo’s statements are used in this approach the fact that two factors of
production, i.e. labour and capital are included in the analysis results to a country’strade specialization according to which factor of production is in abundance.7
Technology used in production is considered to be identical in the countries
involved in international trade. More recent approaches tried to extent the H–O
paradigm.8 The Stolper–Samuelson theorem for example, suggests that there will
be significant implications on the functional distribution of income under condi-
tions of free trade. More specifically, if a country exports capital intensive goods
there will be an income rise for this factor of production relative to prices of goods
while labour income will decline, something which does not take place if the basis
of analysis is the Ricardian paradigm. Moreover, according to the theorem of
factors of production price equalization, in case of small differences between two
countries factors of production (focusing on the same product), there will be a trend
for complete equalization of factors of production returns (under the condition that
free trade takes place with zero transportation cost). As in the Ricardian model, the
H–O paradigm considers trade benefits to be more important the greater the two
countries differences in factors of production are. However, as the Ricardian model
supports, prices are determined in real terms and not in currency units. The main
handicap of all versions of H–O is considered to be the elasticity of factors of
production substitution within the involved countries (Minhas 1962) and the con-
stant economies of scale.
New theories of international trade after Second World War focused mainly on
trade flows between developed countries contradict both the classical and the
neo-classical traditions of international trade. It is evident that in many cases
there is no rising trade specialization (but reduced trade specialization) as well as
that exports are taking place in many sectors often through intra-industry as
opposed to inter-industry trade (Ethier 1982). Empirical verifications of these
trends are well known and include among others seminal papers those of Smith
(1994), Rodriguez and Rodrik (2000) and Rodrik (2001/2).
New trade theory eloquently analyzed by Dixit and Norman (1980), Lancaster
(1980), Krugman (1979, 1980, 1981), Helpman (1981) and Ethier (1982) is not
based on perfect completion or constant economies of scale and suggests that trade
flows take place within an economic environment characterized by economic
protection, imperfect market competition, dynamic economies of scale, and product
differentiation. Technology and technological change in conjunction with demand
patterns return to the analysis as the basis of comparative advantages, trade spe-
cializations, and competitiveness undermining the effectiveness of unit labour costs
7This conclusion was empirically questioned by V. Leontief and led to a significant refutation of
H–O paradigm especially on the hypothesis of identical factors of production intensity between the
two countries and consequently in derived relative price differences. For further analysis see Kwok
and Yu (2005).8For a critical overview of these theories see Chacholiades (1990).
Economic Crisis and National Economic Competitiveness: Does Labor Cost Link. . . 29

and prices as determinants of trade flows. However, the question remains. Are the
new theories really new attempts to interpret contemporary international trade flows
or, as in the H–O paradigm they are an effort to test static theories of perfect
resource distribution under free trade terms ignoring unequal development results
between countries? (Darity and Davis 2005).
3 The Concept of Competitiveness
There are multiple approaches to the issue of competitiveness that may lead to
analytical mistakes and wrong policies (Krugman 1994). A fundamental distinction
not taken into account in many analyses is the one between competitiveness at the
firm level and competitiveness at the national level. At the firm level competitive-
ness may be seen as a function of prices, hence of the production factors
remuneration.
At the national level the issue of competitiveness takes many different readings.
National competitiveness may be analysed under Porter’s diamond of national
competitive advantages approach (Porter 1990). National competitiveness may be
related to national productivity; therefore it may be defined as the aggregation of
institutions, policies, practices, and behaviours that determine productivity (World
Economic Forum 2010).
National competitiveness may be considered as a function of technology and
innovation under the approach of endogenous growth theories.9 This relation is
specified by the notion of “National Systems of Innovation” (NSI) defined as «the
network of institutions in the public and private sectors whose activities and
interactions initiate, import, modify and diffuse new technologies» (Freeman
1995).
National competitiveness may be approached as a function of institutional
arrangements and through the theory of economic convergence, which may be
achieved on the basis of “social capability”, i.e. the ability of a country to absorb
and utilise new technologies that is a function of many structural factors such as
education, technological skills and capabilities, and the business organisation
culture (Abramovitz 1986).
However, the failure to distinguish national economic competitiveness from that
at the firm level has led to the prevalence of the view that national competitiveness
is determined by the price level that in turn is determined by the unit labour cost in
an effort of the economy to achieve a simultaneous internal and external equilib-
rium, i.e. an equilibrium between the non-accelerating inflation rate of unemploy-
ment (NAIRU) and the desired current account balance. This equilibrium may be
mirrored at the real exchange rate of the national currency. International
9See papers of Romer (1986, 1987), Lucas (1988) and Frankel and Rose (1998, 2001). For an
extensive overview of literature see Mongelli (2002).
30 D. Kyrkilis et al.

commercial partners are compared on the basis of price levels therefore on their
relative unit labour cost. That approach fails to take into account that inflation rates
are not solely defined by labour cost but by economic and institutional efficiency,
market structures, demand patterns, etc. It also fails to understand that labour is not
homogeneous, the labour market is highly augmented by labour skills, therefore
wages and hence labour cost should be seen as a structure rather as an aggregate
number.
Contrary to the predictions of this “macroeconomic” approach to the issue of
national economic competitiveness Kaldor (1978b) argued that in the period
1963–1975 countries that have achieved the higher growth rates of both their
international trade shares and their national incomes were the countries with the
higher growth rates of their unit labour cost. Fagerberg (1996) confirmed Kaldor’sparadox for the period 1978–1994.
Felipe (2007) in an effort to see labour cost as a structural variable argues that
the latter “. . . embodies the “social relations” of production that affect the distri-
bution of income between the social classes.” If this argument is accepted the ULC
index may be replaced by the real unit labour cost index (RULC) which as a matter
of fact approaches the income distribution between labour and capital. Indeed,
RULC is constructed as the ratio between “. . .compensation per employee in
current prices and labour productivity, i.e. gross domestic product (GDP) per
employment in current prices . . .(therefore, RULC) shows how the remuneration
of employees is related to the productivity of their labour. It is the relationship
between how much each “worker” is paid and the value he/she produces by their
work. Its growth rate is intended to give an impression of the dynamics of the
participation of the production function labour in output value created. Please note
that the variables used in the numerator (compensation, employees) refer to
employed labour only while those of the denominator (GDP, employment refer to
all labour included self employed” (Eurostat 2015). Although RULC measures the
labour’s GDP share it suffers from the aggregation problems discussed earlier in
reference with the unit labour cost. OECD, for overcoming this handicap of RULC
approaches the latter by calculating the Annual Income Share.10
The adoption of RULC as an indicator of national economic competitiveness
leads back to Ricardo’s paradigm where labour productivity is positively related to
competitiveness, while advances of labour productivity require capital investments.
The latter are realised when the GDP share of capital, i.e. profits rises. Nevertheless,
increasing capital income shares do not guarantee increasing productive invest-
ments for many reasons. In the contemporary economy investments may be
diverted to the financial sphere or abroad in the quest of high returns. Investment
opportunities may be augmented by stagnated demand, institutional inefficiency,
e.g. poorly defined and protected intellectual property rights, high bureaucratic
costs, etc. high systemic risks, and many others.
10See OECD (2015). System of Unit Labour Cost Indicators, StatExtracts, Paris: OECD.
Economic Crisis and National Economic Competitiveness: Does Labor Cost Link. . . 31

4 The Case of the South Euro Zone Countries
The case of the euro zone as an optimal currency area has been strongly disputed
since the beginning of its establishment (Bukowski 2011). Ignoring significant
economic asymmetries within the euro zone, the pendulum of European economic
integration swung from Keynesian cognitive framework to monetarism aiming at
achieving the nominal convergence criteria of the Maastricht treaty. European
policy interests focused on inflation and on natural rate of unemployment (NRU).
Price stabilization became the policy priority putting aside all proposals for sus-
tainable employment levels and economic development (Artis 1991).
However, optimum currency areas cognitive power was limited because of the
precedence of endogenous growth theory according to which member state con-
vergence is not the rule but rather the exemption and thus, considerable economic
divergence will be omnipresent for many years after monetary integration. Empir-
ical evidence support this view demonstrating that absolute convergence is not
feasible in the absence of homogeneous economic, especially technological struc-
tures. Evidently, traditional optimum currency areas perception on convergence is
not applicable in the medium term.11
The subprime loans crisis that erupted in the US market in 2007 acted as ignition
in the euro zone domino effect that followed, bringing to the surface the funda-
mental handicaps of the European monetary integration and revealing the inade-
quacy of monetary criteria for the achievement of smooth macroeconomic
stabilization and real economic convergence in the euro zone as a whole. The
problems of economic asymmetries between euro zone states have been detected by
economists, i.e. Emerson et al. (1992) underlining the negative outcomes on the
potential of the monetary zone. Unfortunately, the prescribed policy solution for
asymmetric shock control focused on prices adjustment and not on critical issues
for an optimal currency area such as labour mobility and competitiveness.12 Instead
of enforcing the fundamentals of symmetric economic development in the euro area
so as to achieve real economic convergence, euro zone decision making opted for a
short sight vision of macroeconomic stabilization based on wage reduction, dereg-
ulation of labour markets and macroeconomic austerity.
However, after 5 years of economic austerity it becomes clear that fiscal primary
surpluses are in place not due to real competitiveness improvements but due to
wage suppression, tax hikes and general austerity measures, especially in Portugal,
Greece and Spain. Export structure differentials between Greece, Portugal, Italy
and Germany remain and unit labor cost differentials also insist after 5 years of
shock macroeconomic therapy.13 There is no significant improvement in the inter-
national terms of trade for countries in economic turmoil and, especially, for Greece
11See Soukiazis and Castro (2005) as well as Christodoulakis (2009).12See also Sachs and Sala-i-Martin (1992), Bini-Smaghi and Vori (1993), Bayoumi and
Eichengreen (1993).13See Abdon et al. (2010).
32 D. Kyrkilis et al.

there is no significant shift of export structure from medium and low value added
products towards high value added export activity. Consequently, current account
balance improvements should be attributed more to the collapse of imports and only
marginally to a sustainable improved export performance of the tradable sector.14
In addition, the historical low euro zone interest rates after 2001 boosted both
euro zone consumption and construction and led to unprecedented levels of private
debt. At the same time, huge amounts of capital inflows enforced the euro’sexchange value, based on the belief of a strong and optimum European monetary
area. The truth was that increased demand and spending was not financed by
improved competitiveness performance and when debt started to increase danger-
ously, external national balances of the fragile states of the south euro zone almost
collapsed.
Table 1 shows the RULC growth rates for selected euro zone countries,
i.e. Greece, Italy, Portugal, Spain and Cyprus in the 2001–2017 period. In annual
average terms for the period 2001–2010, the RULC grew by 1.00% in Greece,
0.65% in Italy, �0.60% in Portugal, and �0.05% and �0.37% in Spain and
Cyprus respectively, while for the whole euro zone (euro zone 18) it shows a
declining trend, i.e. annual average growth rate—0.05%. The implementation of
the internal devaluation policy in the south euro zone countries achieved a reduc-
tion of both wages and their GDP share as it is evident by the diminishing RULC
growth rate in the consecutive crisis period 2011–2014, i.e. �2.30% in Greece,
�0.12% in Italy, �1.70% in Portugal, �1.25% in Spain, �2.67% in Cyprus, and
�0.07% in the euro zone 18. However, this policy had some ambiguous effects. In
terms of the real exchange effective rate, (see Table 2) as it is measured by the ULC
the competitive position of all south euro zone countries with the exception perhaps
of Italy was improved as a result of the internal devaluation policy implementation,
but in terms of export prices, although labour costs were significantly reduced there
is no indication of any improvement but of stability (see Table 3). Therefore, the
pass through effect of wage cuts to prices is neutral. Prices are rigid downwards not
because of rigid wages but of economic inefficiencies, e.g. market power of firms,
willingness to maintain profit rates, and market imperfections in general. In such
cases, labour cost is the less significant determinants of prices, and hence of
competitiveness. Empirical evidence by Zografakis and Kastelli (2015) reach
similar results based on an extensive survey of export performance of euro area
states.
Although, internal devaluation had ambiguous, to say the least results on prices
and competitiveness, it had devastated effects on investment. Table 4 shows clearly
that investment activity recorded negative annual growth rates in all south euro
zone countries with Greece, Portugal, and Cyprus to report rates as high as
�23.5%, �16.6%, and �20.5% respectively for certain years. At the same time,
lower labour income GDP shares and the consequent higher capital income GDP
shares in the south euro zone economies failed to trigger investment activity as it
14See Athanasoglou et al. (2010).
Economic Crisis and National Economic Competitiveness: Does Labor Cost Link. . . 33

Table 1 Real Unit Labor Cost (RULC) (percentage annual change), 2001–2014 (Nominal unit
labor cost divided by GDP price deflator)
Year Greece Italy Portugal Spain Cyprus
Euro area
18
2001–2005 (5 year annual
average)
1.8 0.4 �0.5 �0.8 0.3 �0.5
2006–2010 (5 year annual
average)
0.2 0.9 �0.7 0.7 �1.0 0.4
2011 �2.2 �0.8 �1.7 �0.9 0.7 �0.5
2012 �1.6 0.5 �2.8 �3.0 �4.6 0.7
2013 �5.0 �0.6 �0.5 �0.6 �4.0 �0.1
2014 �0.4 0.4 �1.8 �0.5 �2.8 0.2
Source: European Commission, European Economic Forecast, Autumn (2015), Institutional Paper
11, November 2015, European Economy, Brussels
Table 2 Real Effective Exchange Rate: ULC relative to rest of a groupa of industrialized
countries (USD) (% change on preceding year), 2001–2014
Year Greece Italy Portugal Spain Cyprus EU Euro-area
2001–2005 (5 year average) 4.3 3.4 2.0 2.7 3.0 5.5 3.5
2006–2010 (5 year average) 0.9 0.9 �0.7 1.0 �0.4 �0.3 0.3
2011 �0.9 0.4 �2.1 �1.1 2.5 0.5 0.4
2012 �6.1 �2.3 �5.8 �6.6 �5.6 �4.9 �4.1
2013 �6.2 2.4 2.5 1.0 �2.1 7.8 6.2
2014 �2.2 1.2 �1.3 �1.3 �3.9 3.3 1.9
Source: European Commission, European Economic Forecast, Autumn (2015), Institutional Paper
11, November 2015, European Economy, Brusselsa37 countries: EU, TR, CH, NO, US, CA, JP, AU, MX and NZ
Table 3 Relative price indicators based on export prices deflator, vs. EU 28, 2005–2014, index
2005¼ 100
Year Greece Italy Portugal Spain Cyprus Euro area-18
2005 100.0 100.0 100.0 100.0 100.0 100.0
2006 100.3 99.7 101.7 101.7 100.0 99.1
2007 101.0 100.6 102.2 102.7 101.1 99.4
2008 103.0 101.7 103.1 103.6 102.2 102.6
2009 105.4 104.4 102.0 105.4 106.7 107.8
2010 106.9 102.4 101.4 104.5 103.3 102.3
2011 108.7 102.7 102.6 105.3 100.8 101.4
2012 108.9 102.4 102.1 105.1 99.7 99.2
2013 108.0 103.1 102.5 105.0 101.3 100.8
2014 106.2 103.5 101.5 103.2 99.7 98.4
Source: Price and cost competitiveness, European Commission Directorate—General for Eco-
nomic and Financial Affairs 2015
34 D. Kyrkilis et al.

becomes obvious from the part of operational surplus (gross operating profits plus
mixed income) channeled to investments (see Table 5). In all countries where
internal devaluation was the policy option this percentage fell significantly, more
significantly of all in Portugal and Greece but it remained rather steady in the whole
euro zone (Eurozone 18). At the same time, Table 6 makes obvious that labour
productivity in all south euro zone countries but Spain either fell or remained
constant. That implies that the fall of GDP and the disinvestment process that
was triggered due to the policies of interval devaluation may have reduced eco-
nomic inefficiencies but they failed to restore economic efficiency through invest-
ments related to reforms and activity modernisation.
5 Conclusion
Economic theory on optimum currency areas anticipates that the European Mone-
tary Union would facilitate economic, financial and labor market integration by
converging nominally as a stepping stone towards real economic convergence. In
this way, development, regional, technological, productivity and welfare gaps
would be gradually reduced and eventually extinguished. Based on the data of the
last decade it seems that growth, unemployment, and welfare disparities widened
within the euro area, and the same holds true for the fundamental index of RULC.
Indeed, differences in production structures, in implemented national economic
policies, in consumption patterns, in international trade patterns, and in national
financial robustness, gather momentum and created fundamental concerns over the
unity and efficiency of the euro zone. Thus, focusing only on nominal convergence
criteria for achieving an optimum currency area proved to be a suboptimal both
methodology and policy option which enhanced the asymmetries within euro zone,
deepening the dichotomy between fragile states of the south and the so called
“benevolent” economies of the north. Moreover, deprivation of national monetary
autonomy proved to be problematic for the south euro zone states since it was not
accompanied by a fiscal union. Although the common monetary policy acted as a
straightjacket tool to enforce competitiveness through the real drivers of produc-
tivity and export-led tradable sectors, it was inadequate because of inefficient
Table 4 Gross fixed capital
formation, % change on
preceding year, 1996–2014
Year Greece Italy Portugal Spain Cyprus
% GDP
(2014)
11.6 16.6 14.9 19.6 11.5
1996–2011 1.1 1.1 0.6 2.5 1.7
2012 �23.5 �9.3 �16.6 �7.1 �20.5
2013 �9.4 �6.6 �5.1 �2.5 �15.2
2014 �2.8 �3.5 2.8 3.5 �18.0
Source: European Commission, European Economic Forecast,
Autumn (2015), Institutional Paper 11, November 2015,
European Economy, Brussels
Economic Crisis and National Economic Competitiveness: Does Labor Cost Link. . . 35

structures and adjustments for the south euro zone states. Equally important, fiscal
policy within the Stability and Growth Pact (SGP), Euro plus Pact, Six pack,
Two-Pack and Fiscal Compact do not incorporate sustainable development prior-
ities underling only macroeconomic prudential recipes based on primary surpluses.
However, one cannot deny that the long term problem of the fragile economies is
not the mounting debt but fragile export structures which perpetuate it, feeding the
sustainability of external imbalances, i.e. deficits.
The current paper develops arguments that cast reasonable doubt on the ade-
quacy of the unit labour cost as an estimator of national economic competitiveness.
The improvement of the latter is not possible to be caused by wage reductions and
labor market deregulation in all tradable and non tradable sectors but it should be
linked with labour productivity and investment rates.
Economic policy efforts should turn away from the implementation of internal
devaluation policies, which in no way are the substitutes of an external devaluation
policy towards upgrading the export potential and improving competitiveness
through real structural reforms concerning business environment, entrepreneurial,
and market failures and hurdles. Productivity, in its broadest interpretation may
include various aspects of economic performance and efficiency, such as improve-
ments in product quality, a firms’ capacity to innovate and to adapt to consumer
Table 5 Gross fixed capital formation at current prices, total economy as % of gross operating
profits and mixed income at current prices, 2001–13
2001–8 2009 2010 2011 2012 2013
Greece 46.2 40.1 33.4 28.3 23.6 21.2
Italy 46.3 46.0 43.4 42.7 41.1 39.0
Portugal 63.5 58.3 51.5 47.1 40.2 37.1
Spain 72.2 58.9 53.2 48.6 43.6 39.5
Cyprus 63.5 66.5 60.9 51.7 40.9 34.1
Euro area-18 63.5 66.5 47.8 48.0 47.0 45.0
Source: Eurostat, AMECO and authors’ calculation
Table 6 Labor productivity (real GDP per occupied person) % change on preceding year,
2001–2014
Year Greece Italy Portugal Spain Cyprus
Euro-
area
European
Union
2001–2005 (5 year
annual average)
2.3 0.2 0.9 0.3 0.5 0.8 1.4
2006–2010 (5 year
annual average)
�0.6 0.0 1.3 1.5 1.1 0.6 0.5
2011 �2.4 0.5 0.1 1.6 0.0 1.5 1.7
2012 �1.1 �1.5 0.1 1.9 1.8 �0.2 0.1
2013 0.4 0.7 1.8 1.6 �0.7 0.5 0.6
2014 0.5 �0.7 �0.5 0.2 �0.6 0.3 0.3
Source: European Commission, European Economic Forecast, Autumn (2015), Institutional Paper
11, November 2015, European Economy, Brussels
36 D. Kyrkilis et al.

preferences, but also the functioning of the macroeconomic, institutional and policy
environment, the quality of financial intermediation and the flexibility of factor
markets. While competitive gains are primarily realized at the level of individual
firms producing goods and services, governments have an important role to play to
facilitate this process. In this context international trade regime policies cannot be
isolated of other policy measures, such as labor and product market reforms,
education and innovation policies.
Overall, internal devaluation policies lead rather to recession through investment
reduction with no real labour productivity gains than to improved competitiveness
and ultimately to economic growth as the case of the south euro zone economies
indicates. An efficient policy mix should coordinate between structural reforms and
economic efficiency measures that would eventually lead to improved
competitiveness.
References
Abdon A, Bacate M, Felipe J, Kumar U (2010) Product complexity and economic development.
Working paper, Levy Economics Institute, No. 616. www.econstor.eu/bitstream/10419/57018/
1/635921618.pdf. Accessed 16 May 2014
Abramovitz M (1986) Catching-up, forging ahead, and falling behind. J Econ Hist 46(2):385–406
Alesina A, Perotti R (1997) The welfare state and competitiveness. Am Econ Rev 87(5):921–939
Alesina A, Ardagna S (1998) Tales of fiscal adjustment. Econ Policy 13(27):487–545
Artis M (1991) One market, one money: an evaluation of the potential benefits and costs of
forming an economic and monetary union. Open Econ Rev 2:315–321
Athanasoglou P, Backinezos C, Georgiou E (2010) Export performance, competitiveness and
commodity composition. Working Paper, Bank of Greece, No. 114
Bayoumi T, Eichengreen B (1993) Shocking aspects of European monetary integration. In:
Torres F, Giavazzi F (eds) Adjustment and growth in the European Monetary Union. Cam-
bridge University Press, New York, NY
Bini-Smaghi L, Vori S (1993) Rating the E.C. as an optimal currency area. Banca d’Italia, Roma,
Temi di discussione No. 187
Bukowski S (2011) Economic and Monetary Union—current fiscal disturbances and the future. Int
Adv Econ Res. doi:10.1007/s11294-011-9310-7
Chacholiades N (1990) International economics. McGraw-Hill, New York
Christodoulakis N (2009) Ten years of EMU: convergence, divergence and new policy priorities.
GreeSE Paper No 22, The Hellenic Observatory, The European Institute. The London School
of Economics and Political Science, London. eprints.lse.ac.uk/23192/1/GreeSE_No_22.pdf.
Accessed 14 May 2014
Darity W Jr, Davis L (2005) Growth, trade and uneven development. Camb J Econ 29(1):141–170
De Grauwe P (ed) (2012) Economics of Monetary Union. Oxford University Press, Oxford
Dixit A, Norman V (1980) Theory of international trade. Cambridge University Press, Cambridge
Emerson M, Gros D, Italianer A, Pisani-Ferry J, Reichenbach H (1992) One market, one money:
an evaluation of the potential benefits and costs of forming an economic and monetary union.
Oxford University Press, Oxford
Ethier W (1982) National and international returns to scale in the modern theory of international
trade. Am Econ Rev 72:389–405
European Commission Directorate—General for Economic and Financial Affairs (2015) Price and
cost competitiveness database, ECFIN/E-4. Brussels
Economic Crisis and National Economic Competitiveness: Does Labor Cost Link. . . 37

European Commission, European Economic Forecast (Autumn 2015) Institutional Paper
11, November 2015, European economy. Brussels
Eurostat (2015) Unit labor cost growth database. Brussels European Commission, Eurostat
Fagerberg J (1996) Technology and competitiveness. Oxf Rev Econ Policy 12(3):39–51
Felipe J (2005) A note on competitiveness, unit labor costs and growth: Is “Kaldor’s paradox” afigment or interpretation? CAMA Working paper series, May, 2005, The Australian National
University
Felipe J (2007) A cautionary note on the interpretation of unit labor cost as an indicator of
competitiveness, with reference to the Philippines. Philippine J Dev 63(2):1–23
Frankel J, Rose A (1998) The endogeneity of the optimum currency area criteria. Econ J 108
(449):1009–1025
Frankel J, Rose A (2001) An estimate of the effect of currency unions on trade and income. Q J
Econ 117:437–466
Freeman C (1995) The national system of innovation in historical perspective. Camb J Econ
19:5–24
Gomes L (2003) The economics and ideology of free trade: a historical review. Edward Elgar,
Cheltenham, UK
Helpman E (1981) International trade in the presence of product differentiation, economies of
scale and monopolistic competition. J Int Econ 11:305–340
Kaldor N (1978a) The effects of devaluations on trade in manufactures. In: Kaldor N (ed) Further
essays on applied economics. Duckworth, London, pp 99–118
Kaldor N (1978b) Causes of the slow rate of economic growth in the United Kingdom. In: Kaldor
N (ed) Further essays on economic theory. Holmes & Meyer, New York, NY, pp 100–138
Kenen PB (1969) The theory of optimum currency areas: an eclectic view. In: Mundell RA,
Swoboda AK (eds) Monetary problems of the international economy. Chicago University
Press, Chicago, IL, pp 41–60
Krugman P (1979) Increasing returns, monopolistic competition and international trade. J Int Econ
9:469–479
Krugman P (1980) Scale economies, product differentiation and the pattern of trade. Am Econ Rev
70:950–959
Krugman P (1981) Intra-industry specialization and the gains from trade. J Polit Econ 89:959–973
Krugman P (1993) Lessons of Massachusetts for EMU. In: Torres F, Giavazzi F (eds) Adjustment
and growth in the European Union. Cambridge University Press, Cambridge, pp 241–261
Krugman P (1994) Competitiveness: a dangerous obsession. Foreign Aff 73(2):28–44
Kwok Y, Yu E (2015) Leontief paradox and the role of factor intensity measurement. https://www.
iioa.org/conferences/15th/pdf/Kwok_yu.Pdf. Accessed 21 Nov 2015
Lancaster K (1980) Intra industry trade under perfect monopolistic competition. J Int Econ
10:151–175
Lucas R (1988) On the mechanics of economic development. J Monet Econ 22:3–42
Marshall A (2013) Principles of economics. Palgrave Macmillan, London
Mongelli F (2002) “New” views on the optimum currency area theory: what is EMU telling us?
Working Paper Series 138, European Central Bank. www.ecb.int/pub/pdf/scpwps/ecbwp138.
pdf. Accessed 20 Apr 2014
McKinnon RI (1963) Optimum currency areas. Am Econ Rev 53:717–724
Minhas B (1962) The homo-hypallagic production function, factor-intensity reversals and the
Heckscher–Ohlin theorem. J Polit Econ 50:138–156
Mundell RA (1961) A theory of optimum currency areas. Am Econ Rev 51:657–665
OECD (2015) System of unit labor cost indicators, statextracts. OECD, Paris
Porter M (1990) The competitive advantage of nations. Macmillan, London
Ricardo D (1911) Principles of political economy and taxation, with introduction essay, Notes and
appendices. Gonner, E.C.K. Bell, London
Rodriguez F, Rodrik D (2000) Trade policy and economic growth: a skeptic’s guide to the cross-
national evidence. NBER Macroecon Annu 15:261–338
38 D. Kyrkilis et al.

Rodrik D (2001) Les mirages de l’ouverture exterieure. L’Economie Politique 2(10):44–54
Romer P (1986) Increasing returns and long-run growth. J Polit Econ 94(5):1002–1037
Romer P (1987) Growth based on increasing returns due to specialization. Am Econ Rev 77
(2):56–62
Sachs J, Sala-i-Martin X (1992) Fiscal federalism and optimum currency areas: evidence for
Europe from the United States. CEPR Discussion Paper No 632. www.nber.org/papers/w3855.
pdf. Accessed 14 Apr 2014
Schumacher R (2013) Deconstructing the theory of comparative advantage. World Econ Rev
2:83–105
Smith A (1994) Imperfect competition and international trade. In: Greenaway D, Winters A (eds)
Surveys in international trade. Blackwell, Oxford, UK
Soukiazis E, Castro V (2005) How the Maastricht rules affected the convergence process in the
European Union. A panel data analysis. J Policy Model 27(3):385–399
World Economic Forum (2010) The global competitiveness report 2010-2011. World Economic
Forum, Davos
Zografakis S, Kastelli I (2015) Is it true that the reduction of labor cost suffice to enhance the
competitiveness of Greek economy? (in Greek) Crisis Observatory, ELIAMEP. Crisisobs.gr/
2015/02/stavros-zografakis/. Accessed 25 Feb 2015
Economic Crisis and National Economic Competitiveness: Does Labor Cost Link. . . 39

‘Compulsory’ Economic Deflation Turned
Political Risk: Effects of Austere Decision-
Making on Greece’s ‘True’ Economy (2008–
2015) and the ‘Eurozone or Default’Dilemma
Nikitas-Spiros Koutsoukis and Spyros Roukanas
Abstract The drastic internal deflation approach adopted as a remedy to the Greek
government debt problem, gave rise to an unforeseen socio-humanitarian crisis, and
increased political populism and polarization. While the macroeconomic merits of
this strategy are debatable, politically, Greece seems to have turned into a key
political risk, for itself, as well as for the Eurozone, with potentially significant
impacts on the world economy. Considering the different perspectives between the
current Greek government and EU decision making and stakeholder echelons, we
wonder if the ‘true’ value of ‘curing’ the Greek government debt is really equivalent
to a rip in the Eurozone, or to Greece’s defaulting, which seems to be the only
political dichotomy being considered at present. In this paper, we seek to depict
some of the key arguments behind this political economy standoff, by depicting
high-level shifts brought about in the Greek economy and its institutions, and the
impact of the economic austerity measures on the Greek society.
1 Introduction
The severe economic adjustment of Greece has increased the level of political risk
in Greece, with a direct effect on the country’s ability to exit the dire situation it is
in. In this paper, elements of political risk and the progression, thus far, of the Greek
bailout efforts are used to illustrate how the bailout programme fuels political risk,
which in turn affects the ability of Greece to act its way out of the crisis.
N.-S. Koutsoukis (*)
Department of Political Science & International Relations, University of Peloponnese, 1
Aristotelous Str. & Leof. Athinon, 201 00 Corinth, Greece
e-mail: [email protected]
S. Roukanas
Department of International & European Studies, University of Piraeus, 126 Gr. Lampraki Str.,
185 34 Piraeus, Greece
e-mail: [email protected]
© Springer International Publishing Switzerland 2016
A. Karasavvoglou et al. (eds.), Economic Crisis, Development and Competitivenessin Southeastern Europe, Contributions to Economics,
DOI 10.1007/978-3-319-40322-9_3
41

The rest of this paper is organised in the following way. In Sect. 2 we provide a
succinct review of political risk and consider our previous work that led to this
paper. In Sect. 3 we provide an overview of the economic adjustment programmes
which were adopted as remedies to the problem; in essence, an internal deflation of
the Greek economy. In Sect. 3 we review some of the most prominent macroeco-
nomics outputs that seem to be brought about as a result of, and in the context of the
economic adjustment programmes. Despite any long term expectations, at present
the situation seems to be worsening, putting pressure on an already fragile political
system. In Sect. 4 we look at how the pressure has mounted on the political system
significantly increasing the associated political risk. In Sect. 5 we conclude.
2 A Review of Political Risk
Political risk may refer to the possibility of relatively abrupt discontinuity in
[public] governance due to, and expressed as shifts, interruptions or inconsistency
in the implementation and long term coherency of public policy and assorted
regulatory environment (McKellar 2010: 11–14; Ramady 2013: 55). While the
purist view of political risk tends to relate to expropriation, politically motivated
actions and political process-based activity, and currency policy, the notion tends to
encompass the majority of risk-factors with a business impact that can be associated
with politics, public policy or public governance (Garver 2009; Frei and Ruloff
1988). The reasoning is that such dynamic politically-routed settings affect the
stability of the country’s market and business environments, and therefore the
country’s attractiveness for business and other investors (Harms 2000: 72–74).
From this perspective, it seems rather intuitive that the components of stability in
public governance and the political domain (e.g. cabinet shifts, partisanship, fre-
quency of opposition-to-government shifts, etc.) define political risk. This intuitive
view is also in accordance with Snider’ perspective (2005: 205) who sets the
yardstick for political risk as the rate for “which the ‘rules of the game’ (. . .) willnot change in such a way as to invalidate the original calculation [of risk andreturn] or the decision to invest”, and suggests that an institutional approach to
political risk is more suitable approach for political risk assessment. However, in
his review of empirical work on the relationship between political risk and invest-
ments, Harms (2000: 74–88) finds that the absence of political risk does not imply
higher levels of investment, even though the presence of political risk seems to
dissuade investors. Thus political risk as an investment (dis-)incentive should only
be considered in tandem to other factors.
An illustration of political risk elements, in the contexts reviewed above can be
seen in Fig. 1.
It is noteworthy that ‘political risk’ is typically used as an aggregate of other
factors, that collectively signify the [absence] of politically-motivated dynamic
setting in the country of interest. In this context the term ‘country risk’ is often
used to signify a comprehensive aggregate that combines political, economic and
42 N.-S. Koutsoukis and S. Roukanas

financial perspectives (Ramady 2013; Kosmidou et al. 2008: 1–2; Frei and Ruloff
1988: 3). However, political risk may also include economic policy outlooks (for
instance, Coplin and O’Leary 1983; Stoychev 2013).
The authors have previously approached country risk and, within it, political risk
using a reputation risk framework as a proxy measure (Koutsoukis et al. 2012). In
the context of the reputation risk framework, political risk in particular, was
decomposed along the following reputation risk dimensions:
– Governance and leadership, measured through the following indicators: gov-
ernment term duration, party successions to power, and election system
modifications.
– Regulatory compliance, measured as the number of Greece’ infringement cases
of EU regulations and the level of Transposition of community law within the
Greek regulatory system
– Corporate responsibility,measured the level of Transposition of community law
within the Greek regulatory system in particular for the environment, health and
consumer protection.
– Communication and crisis management, measured by the repeated and deliber-
ate inconsistency of the Greek authorities to accept and report to its partners
regarding the looming economic situation.
– Workplace talent and culture, measured as Greece’s rating corruption percep-
tions index steadily dropping over the course of a decade, signifying that
transparency was neither an asset nor a forthcoming goal of the Greek economic
environment.
Fig. 1 Elements of
political risk
‘Compulsory’ Economic Deflation Turned Political Risk: Effects. . . 43

We note that these are five out of seven [reputation risk] dimensions all of which
are driven by or require the involvement of the political system (executive, legis-
lative and judicial branch). The other two dimensions are only relevant in an
economic/business analysis context (financial performance and long-term invest-
ment value, and delivering customer promise).
Although the study was developed in hindsight during the peak of the Greek
crisis, our findings suggest that reputation risk as an analytical framework may offer
advanced warnings in similar situations.
3 Overview of the Economic Adjustment Programmes
Greece entered a severe sovereign debt crisis in 2010, following suit on the world
economic crisis events of 2007 and 2008, with a debt that was over 129.7% of the
country’s GDP concurrently with a deficit for 2009 that run to 15.7% of its GDP
significantly over the Eurozone limit of 3%, (Eurostat 2015a, b). This fiscal
problem was amplified and thus received world-wide attention because of Greece’sfull-fledged Eurozone membership. Greece’s fiscal problems had an immediate
effect on the Eurozone and therefore the rest of the European Union (Kotios and
Roukanas 2013). Following the general elections in the fall of 2009 Greece’sposition in the financial markets began to worsen rapidly, with consecutive degra-
dations from Rating Agencies, and repetitive negative performance in the stock
markets. The cost of Government lending sky-rocketed as can be seen in Fig. 2 for
the Greek 10-year Government Bond (Tradingeconomics 2014).
The debate was on, as to whether Greece could default, or not, and whether it
should exit the Eurozone, willingly or not, to minimize collaterals. A ‘Grexit’ i.e. anexit of Greece from the Eurozone could prove to be disastrous to the Eurozone and
the world economy (Koutsoukis and Roukanas 2014). The relevant arguments also
took into consideration the fact that Portugal, Ireland, Italy and Spain (at the time
coined as “PIIGS”; Greece being the ‘G’) had equally large sovereign debts and
deficit problems, again severely amplified by the economic events of 2007–2008. If
Greece failed, many assumed, profiteers could use this as a paradigm to bring down
any one of the other countries, most notably those in southern Europe.
At the heart of this debate the dilemma is whether the remedy for sovereign debt
symptoms should be composed of more austerity reforms, or more economic
development push. The dilemma in turn has brought forward the ‘Grexit’ paradox;Recession is worsening Greece’s finances so that Greece may remain in the Euro, at
the same time when Greece’s poor-and getting-worst finances suggest that it is
probably better if Greece left the Euro (Koutsoukis and Roukanas 2014). While we
are waiting for Greece and Europe to figure out the answer(s) in top-down,
institutional style, we think it is equally important to consider the effects that
strategic politics have on the ‘true’ stakeholders, the people, or the ‘true’ economy
as it is variably known. In doing so we aim to outline some of the thresholds
between optimal and satisficing fiscal performance for the decision makers
44 N.-S. Koutsoukis and S. Roukanas

involved in these decisions, in accordance with Herbert Simon’s well-known thesis(1956: 136).
Hence, in this paper, we seek to gauge some of the lesser known the effects of
this fiscal discipline that are frequently overlooked in favor of the larger fiscal, and
admittedly strategic, picture. We start by looking at the ‘big’ picture and using it asa backdrop for looking at the recession picture. In particular, for this macro-
perspective, we contrast Greece’s performance 5 years on its remedy, by comparing
the ‘before’ and ‘after’ snapshots of Greece’s reputation risk, a framework that we
previously used to gauge some of the root causes of the crisis (Koutsoukis
et al. 2012). In this way, we try to establish if the ‘big’ picture of Greece has,
ultimately, shifted, or adjusted, as a result of the bail-out program. We then proceed
to focus on the implication of the observed shifts (or lack thereof). In particular, we
outline the high-level ‘demands’ of the bail-out programs and subsequently snap-
shot the achievement in the fiscal indicators and contrast them to their
corresponding indicators in the ‘true’ economy as it were.
So, the bets were on, whether the prospect of Greece’s default could ‘bringdown’ the Euro, or whether some, until then unknown, deus-ex-machina would be
able to save Greece from default and therefore the Euro currency. To this end,
Greece enter its First economic adjustment programme” in May 2010, a.k.a. the
‘first bailout package’. This was set by a Trilateral Support Mechanism (TSM)
comprising of the European Commission (representing the Eurogroup), the
European Central Bank (ECB) and the International Monetary Fund (IMF). This
first rescue package totalled €107.3 billion in the form of bilateral loans from EU
Fig. 2 10-year Greek government bond yield (Source: Tradingeconomics 2014)
‘Compulsory’ Economic Deflation Turned Political Risk: Effects. . . 45

members (€80 billion) in addition to approx. €30 billion euro from the IMF
(European Commission 2015). In return for this aid, Greece had to consolidate its
debt, basically via an internal economy deflation process thus allowing Greece to
balance its budget and eventually become a competitive economy. Sadly this
approach was not sufficient, and a Second Economic Adjustment Programme was
necessary to amend the situation. This ‘second bailout package’ of €100 billion
followed suit in March 2012, superseding the previous one, under a new mechanism
known as the “European Financial Stability Facility, or EFSF. The recipe for the
second bailout unavoidably required a debt reduction, which was achieved with
private sector involvement (PSI). The so called ‘voluntary’ PSI resulted in a debt
reduction of approximately 50% or the equivalent of €100 billion. Despite this,
Greece’s debt as a % of GDP remained nearly unchanged (Fig. 3).
Slightly more than half of the funds, or 53% of the funding from the TSM was
driven to the management of high public debt, given that the Greek public debt for
2014 (174.50%) was the third highest in the world as a percentage of GDP,
following Japan (227.70%) and Zimbabwe (181.00%) (CIA World Factbook
2015). From the rest of the funds 22% of the funding was tunnelled to support
the Greek banking System, which partially explains the severe effects of the crisis
to the real economy, expressed as lack of capital liquidity resulting in heavily
reduced investment activity (illustrated in Fig. 4).
The TSM appointed a technical executive group to monitor progress, and advise
the Greek government, soon to be referred to as the ‘troika.’ All the same, Greece
had no choice but to enter a period of austere fiscal discipline, in exchange for the
Fig. 3 Greek GDP vs. debt as % of GDP (Sources: International Monetary Fund 2015; World
Bank 2015a)
46 N.-S. Koutsoukis and S. Roukanas
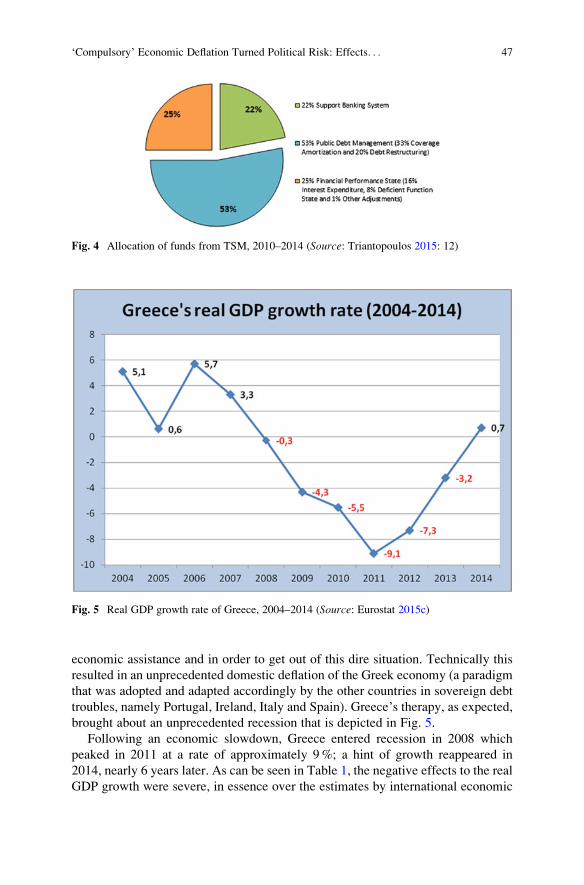
economic assistance and in order to get out of this dire situation. Technically this
resulted in an unprecedented domestic deflation of the Greek economy (a paradigm
that was adopted and adapted accordingly by the other countries in sovereign debt
troubles, namely Portugal, Ireland, Italy and Spain). Greece’s therapy, as expected,brought about an unprecedented recession that is depicted in Fig. 5.
Following an economic slowdown, Greece entered recession in 2008 which
peaked in 2011 at a rate of approximately 9%; a hint of growth reappeared in
2014, nearly 6 years later. As can be seen in Table 1, the negative effects to the real
GDP growth were severe, in essence over the estimates by international economic
Fig. 4 Allocation of funds from TSM, 2010–2014 (Source: Triantopoulos 2015: 12)
Fig. 5 Real GDP growth rate of Greece, 2004–2014 (Source: Eurostat 2015c)
‘Compulsory’ Economic Deflation Turned Political Risk: Effects. . . 47

organizations, including the International Monetary Fund and the Organization for
Economic Cooperation and Development.
In essence this observation suggests that effects of the fiscal consolidation
process to the Greek economy were significantly underestimated. Blanchard and
Leigh (2013) suggest that the root cause is the misuse of fiscal multipliers in the
relevant economic extrapolations.
After a prolonged recession (2008–2014), and two economic adjustment
programmes worth well over €100 billion and a significant debt reduction, Greece
entered a third bailout programme, worth approximately €86 billion, in exchange
for economic reforms.
The main targets of the fiscal adjustment programmes focus on three goals. The
first goal concerns fiscal consolidation, regarding public debt and public deficit. The
second goal concerns the reinforcement of competitiveness. The third goal con-
cerns key reforms to the Greek economy as a whole. The targets of the program
indirectly suggest that Greece as a member state of European Union and Eurozone
had not achieved the goals of political and institutional development and fiscal
consolidation, after 29 years as a -state of European Union and –at the start of the
crisis– n9 years a Eurozone member. It should come as no surprise that Greece has
been unable to adapt to the required changes in such a short time in political and
institutional terms. That is, in addition to the inappropriate assessment of the fiscal
multiplier noted in the previous section the political and institutional aspects were
also underestimated as key factors for the manifestation of the Greek crisis.
Taking the above discussion into consideration, is seems that Greece’s woes arefar from over, and as we discuss below, the situation has a direct impact on the
political environment in Greece, which in turn affects the effectiveness of the
bailout programs, and the negative spiral of the Greek crisis seems never ending.
4 Economic Adjustments Fuelling Political Risk
We focus momentarily on the macroeconomic outputs of economic adjustment
programmes, depicted in Table 2.
Table 1 OECD’s GDP projections and outcomes for Greece
Years
Real GDP Nominal GDP
Official projections Outcomes Official projections Outcomes
2010 �4.0 �4.9 �2.8 �3.9
2011 �3.0 �7.1 �1.5 �6.1
2012 �3.0 �6.4 �2.8 �7.2
2013 �4.2 �3.5a �5.4 �5.9a
Source: OECD (2013: 17)aOECD Projections
48 N.-S. Koutsoukis and S. Roukanas

Succinctly put, the debt is at an all-time high, the deficit has been significantly
reduced trending at 3.5% but is still over the Eurozone required limit. After 6 years
of recession, there I a hint of growth at 0.8% in tandem with a negative inflation,
typically associated with recession, suggesting that the growth needs to analysed
further, whereas the actual GDP is still dropping.
From another perspective, the crisis situation and the fiscal adjustment
programmes further impacted the prospect of economic development: Greece is
unable to resort to international lending, it cannot afford to make public investments
necessary to spark economic development, and domestic private investments are
victims of the overall situation. Hence, the only viable option for Greece is to attract
Foreign Direct Investments (FDI), that may fuel the economy with the necessary
capital to spark economic growth. Sadly, this was not the case (Table 3).
In view of this downturn, the anticipated economic recovery stabled upon
another hurdle. The fear of an exit from the Eurozone resulted in an outflow of
bank deposits and resulted in a liquidity problem (Table 4).
One way to interpret this is to presume that the fiscal adjustment program caused
a crisis to the Greek banking system. Notice that even after the debt reduction of
2012, the deposits’ outflow continued.
Table 2 Macroeconomic outputs of the economic adjustment programmes
Years
General
government gross
debt (% GDP)
General government
deficit/surplus
(% GDP)
Real GDP
growth
rate Inflation
GDP at market
prices (Millions
of euro)
2008 112.9 �9.8 �0.4 4.2 242,096.1
2009 129.7 �15.7 �4.4 1.3 237,431.0
2010 148.3 �10.9 �5.4 4.7 226,209.6
2011 171.3 �10.2 �8.9 3.1 207,751.9
2012 156.9 �8.7 �6.6 1.0 194,203.7
2013 175.0 �12.3 �3.9 �0.9 182,438.3
2014 177.1 �3.5 0.8 �1.4 179,080.6
Sources: Eurostat (2015a, b, c, d, h)
Table 3 Balance of Payments (million euro)
Current account
balance
Trade
balance
Exports of
goods
Imports of
goods
Direct investment
(+) Net inflow
(�) Net outflow
2008 �34.797,6 �44.048,8 19.812,9 63.861,7 1.420,7
2009 �25.818,7 �30.767,3 15.318,0 46.085,3 274,5
2010 �22.975,6 �28.279,6 17.081,5 45.361,0 �927,0
2011 �20.633,5 �27.229,1 20.230,6 47.459,6 �452,6
2012 �4.615,0 �19.619,0 22.020,6 41.639,7 827,1
2013 1.088,5 �17.229,4 22.534,8 39.764,2 2.713,6
2014 1.656,7 �17.976,1 23.647,5 41.623,6 991,8
Source: Bank of Greece (2015a)
‘Compulsory’ Economic Deflation Turned Political Risk: Effects. . . 49

Inadvertently this economic setting got hold of the persons behind the numbers
(Table 5). Private investment came to a halt as the Greek banks strived to protect
capital adequacy.
Drilling down further, this prolonged economic adjustment period we note that
productivity has dropped, unemployment has tripled and the ration of the popula-
tion at risk of poverty has steadily increased (Table 6).
Thus within the 5 years of economic adjustment, the Greek economy steadfastly
progressed to a standstill. The government is unable to spend; the banks are unable
to lend; the people are unable to consume. The social unrest continues and pressure
on the political system is hardening, fuelling political risk and it is very likely that
the economic crisis will soon be in tandem to a political crisis. In support of the last
observation we summarise the political system dynamics in Table 7.
Drilling down into the political dynamics of the period, the data is quite clear: in
a succession of almost exactly 8 years to the day (19 Sept 2007–21 Sept 2015) the
country has seen eight Prime Ministers (PMs), two of which were interim, and one
Table 4 Analysis of deposits
and repos at Greek banking
system of domestic
enterprises and households
(Millions of euros)
Period Deposits
June 2008 218,843
December 2008 235,878
June 2009 245,590
December 2009 245,470
June 2010 228,826
December 2010 222,874
June 2011 197,281
December 2011 182,790
June 2012 158,580
December 2012 173,347
June 2013 175,889
December 2013 177,018
June 2014 177,634
December 2014 173,220
March 2015 149,035
Source: Bank of Greece (2015b)
Table 5 Bank
nonperforming loans to total
gross loans (%)—2008–2014
Years World Greece
2008 3.0 4.7
2009 4.2 7.0
2010 4.0 9.1
2011 3.9 14.4
2012 3.7 23.3
2013 4.3 31.9
2014 – 33.5
Source: World Bank (2015b)
50 N.-S. Koutsoukis and S. Roukanas

was a non-parliamentary person (i.e. not elected), but selected and appointed by the
parties that formed a coalition government at the time. It is easily seen that the
statistical trend is long-lasting and seems to be worsening due to the crisis: Prime
ministers change on average every 1.6 years, significantly lower than the average of
2.2 years of the 40+ years of the “3rd Hellenic Republic” (i.e. the period after the
abolition of monarchy and the fall of the military junta). We inform out reader that
the Greek constitution anticipates a period of no more than 4 years between
successive elections. In addition to the PM changes, we notice that the cabinet
structure also undergoes frequent changes. In Table 7 we consider as cabinet
shuffles the events whenever more than half of the cabinet ministers were changed
(i.e. replaced, shuffled, resigned, or their ministry was cancelled). The rest of the
changes are identified as ‘simple’ minister changes. The trend here is on par with
the longer terms, which in effect implies a minister change on average every
3 months or so. We purposely left out the statistics regarding the cabinet structure
Table 7 Political system dynamics in Greece, 2008-present
Start Finish Prime Minister Years
Cabinet
shuffles
Ministerial
changes Total
19/09/2007 06/10/2009 K. Karamanlis 2.05 1 6 7
06/10/2009 11/11/2011 G. Papandreou 2.10 2 6 8
11/11/2011 16/05/2012 L. Papadimosa 0.51 0 4 4
16/05/2012 21/06/2012 P. Pikrammenosb 0.10 NA NA NA
21/06/2012 26/01/2015 A. Samaras 2.60 2 11 13
26/01/2015 27/08/2015 A. Tsipras 0.59 1 4 5
27/08/2015 21/09/2015 V. Thanoub 0.07 NA NA NA
21/09/2015 present A. Tsipras 0.19 0 2 5
Period average 2009-presentc 1.6 7
Historical average 1974–2009 2.2 10
Historical average 1909–2009 0.9 6aNot elected to parliamentbInterim Prime minister/GovernmentcThe calculation excludes the interims. With the interims the average duration is 1.14 years
Table 6 Outputs of the economic adjustment programmes at the person level
Years
GDP per capita in PPS
(EU-27¼ 100) Unemployment (%)
People at risk of poverty
(% of total population)
2008 93 7.8 28.1
2009 94 9.6 27.6
2010 87 12.7 27.7
2011 77 17.9 31.0
2012 74 24.5 34.6
2013 73 27.5 35.7
2014 – 26.5 –
Sources: Eurostat (Eurostat 2015e, f, g)
‘Compulsory’ Economic Deflation Turned Political Risk: Effects. . . 51

(i.e. hierarchy and ministerial portfolio) which, unfortunately, tends to change in
every cabinet reshuffle (for a discussion, see for instance Koutsoukis 2013).
In parallel to this dynamic situation in the executive branch, parliament entry has
also been more dynamic (Table 8).
During the crisis the crisis has been through six general elections, and one
referendum. The six elections resulted in four coalition governments, and one
interim government. This is important considering that in the previous 35 years
out of there had only coalition governments twice before (in two elections held
during 1989). It is also important to notice that during the crisis the number of
parties entering parliament seems to have been stabilised to seven parties or more.
Contrast this in long trend of four or five parties with the odd exception here and
there (Fig. 6). Admittedly party entry to parliament is often the outcome of the
election law, which is changes every other election or so.
When considering the rather simple political statistics presented above it appears
that Greece seems to be in a period where the executive branch/political system
Table 8 Parliamentary election dynamics 2008-present
National elections of Parliament parties New in parliament Not re-elected Coalition
16/09/2007 4 1 No
04/10/2009 5 0 Yesa
06/05/2012 7 3 1 Interim
17/06/2012 7 0 Yes
25/01/2015 7 1 1 Yes
20/09/2015 8 1 YesaThe majority single-party government resigned mid-term to give place to a coalition government
Fig. 6 Number of parties in parliament 1974-present
52 N.-S. Koutsoukis and S. Roukanas

seems to be rather fluid. An analysis of voter preferences is beyond the scope of this
paper but voter preferences have also changed dramatically during this period in
comparison to the pre-2009 era. The increased fluidity of the executive branch
implies increased political risk. When these trends are viewed in tandem with the
economic adjustment programmes and outcomes, it is easy to identify an interre-
lationship between political risk and the compulsory economic deflation brought
about by the economic adjustment programmes and Greece’s place in the euro, in
support of our thesis.
5 Conclusions
Our study of Greece’s ‘compulsory’ economic deflation in tandem with key char-
acteristics of its political system suggests that the economic adjustment
programmes have increased the level of political risk in Greece. In our previous
work we have argued how political factors, political risk included have in addition
to poor economic and fiscal policy, brought Greece to the difficult situation it is still
facing. Despite the general expectation that the economic adjustment programmes
and an unprecedented financial aid of over €280 billion would allow Greece to
improve on its fiscal and economic practices, it appears that the austerity assorted to
the aid, has also given rise to a severe spiral of political risk that threatens to blow
apart Greece and potentially crack the much valued solidarity of the Eurozone and
perhaps the European Union. We sincerely hope that this will not be the case, for
Greece, but especially Europe.
Acknowledgements This paper has been partly supported by the University of Piraeus Research
Center.
References
Bank of Greece (2015a) Annual report of the Bank of Greece. http://www.bankofgreece.gr/Pages/
el/Publications/GovReport.aspx?Filter_By¼8. Accessed 25 Apr 2015
Bank of Greece (2015b) Deposits of credit institutions. http://www.bankofgreece.gr/Pages/el/
Statistics/monetary/deposits.aspx. Accessed 25 Apr 2015
Blanchard O, Leigh D (2013) Growth forecast errors and fiscal multipliers. IMF Work Pap 13
(1):1–43
CIA The World Factbook (2015) Country comparison public debt. https://www.cia.gov/library/
publications/the-world-factbook/rankorder/2186rank.html#gr. Accessed 30 Apr 2015
Coplin WD, O’Leary MK (1983) Systematic political risk analysis for planners. Plan Rev 11
(1):14–17, 10.1108/eb054010
European Commission (2015) Financial assistance to Greece. http://ec.europa.eu/economy_
finance/assistance_eu_ms/greek_loan_facility/index_en.htm. Accessed 25 Apr 2015
Eurostat (2015a) General government gross debt. http://epp.eurostat.ec.europa.eu/tgm/table.do?
tab¼table&init¼1&plugin¼1&language¼en&pcode¼tsdde410. Accessed 25 Apr 2015
‘Compulsory’ Economic Deflation Turned Political Risk: Effects. . . 53

Eurostat (2015b) General government deficit/surplus. http://epp.eurostat.ec.europa.eu/tgm/table.
do?tab¼table&init¼1&plugin¼1&language¼en&pcode¼tec00127. Accessed 25 Apr 2015
Eurostat (2015c) Real GDP growth rate—volume. http://epp.eurostat.ec.europa.eu/tgm/table.do?
tab¼table&init¼1&plugin¼1&language¼en&pcode¼tec00115. Accessed 25 Apr 2015
Eurostat (2015d) HICP—inflation rate annual average rate of change (%). http://ec.europa.eu/
eurostat/tgm/table.do?tab¼table&init¼1&language¼en&pcode¼tec00118&plugin¼1.
Accessed 25 Apr 2015
Eurostat (2015e) GDP per capita in PPS. http://epp.eurostat.ec.europa.eu/tgm/table.do?
tab¼table&init¼1&plugin¼1&language¼en&pcode¼tec00114. Accessed 25 Apr 2015
Eurostat (2015f) Unemployment rate, by sex. http://epp.eurostat.ec.europa.eu/tgm/table.do?
tab¼table&init¼1&plugin¼1&language¼en&pcode¼tsdec450. Access date. 25 Apr 2015
Eurostat (2015g) People at risk of poverty or social exclusion. http://epp.eurostat.ec.europa.eu/
tgm/table.do?tab¼table&init¼1&plugin¼1&language¼en&pcode¼t2020_50. Accessed
25 Apr 2015
Eurostat (2015h) Gross domestic product at market prices. http://epp.eurostat.ec.europa.eu/tgm/
table.do?tab¼table&init¼1&plugin¼1&language¼en&pcode¼tec00001. Accessed 25 Apr
2015
Frei D, Ruloff D (1988) The methodology of political risk assessment: an overview. World Futures
25(1):1–24. doi:10.1080/02604027.1988.9972072
Garver P (2009) The changing face of political risk. In: Lu KW, Verheyen G, Perera SM (eds)
Investing with confidence: understanding political risk management in the 21st century. World
Bank, Washington, DC
Harms P (2000) International investment, political risk, and growth. Springer, Boston, MA, 10.
1007/978-1-4615-4521-7
International Monetary Fund (2015) General government gross debt for Greece©[GGGDTAGRC188N]. Retrieved from FRED, Federal Reserve Bank of St. Louis https://
research.stlouisfed.org/fred2/series/GGGDTAGRC188N/. Accessed 28 Nov 2015
Kosmidou K, Doumpos M, Zopounidis C (eds) (2008) Country risk evaluation: methods and
applications. Springer, New York, NY
Kotios A, Roukanas S (2013) The Greek crisis and the crisis in Eurozone’s governance. In:
Sklias P, Tzifakis N (eds) Greece’s horizons: reflecting on the country’s assets and capabilities.Springer, London, pp 91–105
Koutsoukis NS (2013) Ekato eti Ellinikis Diakivernises: 1909-2009 (Ekατo ε�τη EλληvιkήςΔιαkυβε�ρvησης: 1909-2009) Working paper, PT-GOVERN-01-102013. Research Group
‘Political Technology,’ Department of Political Science and International Relations, Univer-
sity of Peloponnisos, Korinth, Greece. http://politech.uop.gr/?ddownload¼339. Accessed
1 Mar 2015
Koutsoukis NS, Roukanas S (2014) The GrExit paradox. Procedia Econ Financ 9:24–31
Koutsoukis NS, Roukanas S, Sklias P (2012) A reputation risk perspective on the Greek crisis. Int J
Decis Sci Risk and Manage 4(1–2):38–57
McKellar R (2010) A short guide to political risk. Gower, Burlington, VT
OECD (2013) OECD economic surveys Greece, November 2013. http://www.keepeek.com/Digi
tal-Asset-Management/oecd/economics/oecd-economic-surveys-greece-2013_eco_surveys-
grc-2013-en#page3. Accessed 25 Apr 2015
Ramady MA (2013) Political, economic and financial country risk. Springer, New York, NY
Simon HA (1956) Rational choice and the structure of the environment. Psychol Rev 63
(2):129–138
Snider LW (2005) Political risk: the institutional dimension. Int Interactions 31(3):203–222, 10.
1080/03050620500294176
Stoychev SP (2013) Political risk in Europe: a quantitative index based on measures of corruption,
market distortion, and the shadow economy. J Polit Risk 1(5). Available at https://www.
jpolrisk.com/political-risk-in-europe-a-quantitative-index-based-on-measures-of-corruption-
market-distortion-and-the-shadow-economy/
54 N.-S. Koutsoukis and S. Roukanas

Tradingeconomics (2014) Greece Government Bond 10Y. http://www.tradingeconomics.com/
greece/government-bond-yield. Accessed 30 Apr 2015
Triantopoulos Ch. (2015) It is true that money borrowed by Greece intended solely to repay
previous debts and bank bailouts? (In Greek). Understanding the Greek crisis, March 2015, No
3, ELIAMEP
World Bank (2015a) Bank nonperforming loans to total gross loans (%). http://data.worldbank.
org/indicator/FB.AST.NPER.ZS/countries?page¼1. Accessed 25 Apr 2015
World Bank (2015b) Gross Domestic Product for Greece [MKTGDPGRA646NWDB]. Retrieved
from FRED, Federal Reserve Bank of St. Louis. https://research.stlouisfed.org/fred2/series/
MKTGDPGRA646NWDB/. Accessed 29 Nov 2015
‘Compulsory’ Economic Deflation Turned Political Risk: Effects. . . 55

Theory of Optimum Currency Areas
and the Balkans
Edgar Juan Saucedo Acosta and Jesus Diaz Pedroza
Abstract The theory of optimum currency areas show which are the optimal
conditions for a group of countries sharing the same currency, such theory also
points out the costs and benefits of giving up a national currency. There are costs
and benefits for countries that decide to use the currency of another country or if
they choose to belong to a monetary union. The main cost for a country when it is
part of a monetary union is the loss of monetary policy, however if such country has
credibility problems in monetary policy (high inflation in the past), this cost is
significantly reduced or even it can become a benefit. Countries may choose to use
another currency to import credibility (Dollarization or Euroisation), belonging to a
monetary union or to create central banks with credibility. There are economies
with anchors currencies, that is, economies with credible central banks (with
inflation controlled for several years), while on the other hand there are economies
that have no anchor currencies and therefore can choose to import credibility from
economies with anchor currencies. The aim of this paper is to apply some theoret-
ical elements of the theory of optimum currency areas to Balkans countries. We
start to consider the idea that there are anchor currencies and non-anchor currencies
on the economies of the world. Starting from the above, it is considered that the
anchor currency for the countries of the Balkans is the euro, due to the credibility
that the European Central Bank has acquired since its creation to the present.
Furthermore, we propose to evaluate the relevance for Balkan countries choose
one of the following three options: keep their national currencies, create a new
regional currency or to use the euro (Euroisation or to be part of the euro area). To
assess the relevance of any of the three options above, we estimate the
co-movement of the economies of the Balkans with the eurozone and with them-
selves, besides we analyse the credibility of central banks in the region (the record
E.J. Saucedo Acosta (*)
University of Veracruz, AV. Luis Castelazo s/n, C.P. 91190 Xalapa, Mexico
e-mail: [email protected]
J. Diaz Pedroza
Autonomous Metropolitan University- Iztapalapa, Av. San Rafael Atlixco No. 186, C.P. 09340
Mexico City, Mexico
e-mail: [email protected]
© Springer International Publishing Switzerland 2016
A. Karasavvoglou et al. (eds.), Economic Crisis, Development and Competitivenessin Southeastern Europe, Contributions to Economics,
DOI 10.1007/978-3-319-40322-9_4
57

in the inflation in the countries of the region), trade flows of the countries of the
region with the euro-zone and among themselves, and finally we estimate a political
proximity variable (coincidence of voting in the UN General Assembly).
1 Introduction
The Balkan region is formed by countries that have different types of relationships
with the European Union (EU). Greece, Bulgaria and Croatia are already members
of the EU, while Albania, FYROM, Montenegro and Serbia are official candidates
and Bosnia & Herzegovina is a potential candidate, officially recognized by the
European Commission. On the other hand, from a monetary point of view, the
countries of the region are linked to the euro zone and the euro, because Greece is a
member of such zone, Montenegro uses the euro (Euroisation), Croatia and
Bulgaria will have to use such currency and all other countries of the Balkans
have to do the same once they enter the EU.
In the medium and long term, the Balkans will be linked to the euro zone, so it is
relevant to analyse how convenient it is for these countries to use the euro. We will
use the Optimum Currency Areas (OCA) theory which analyses what are the ideal
conditions for a group of countries sharing a common currency and what are the
costs and benefits of using a single currency.
In the Balkan region is interesting to apply the OCA theory, because in that
region Greece already share the same currency with its partners in the euro area, so
that such country can be used as parameter to analyse the pertinence of the other
countries in the region to enter in the euro zone. Although Greece has its own
characteristics, especially after the European financial crisis, we believe it can serve
as parameter.
There are papers that have studied whether the region is an OCA with the euro
zone. The results are mixed, because some studies show that for the Balkans is
optimal use the euro (Sideris 2009), while other studies show that only some Balkan
countries should use the euro (Gouveia 2014; Broz 2007) and others show that is
not optimal use of the euro to the region (Belke and Zenkic 2007; Gockov and
Jovanovski 2013; Gligorov et al. 2008). The methodology of previous studies uses
some of the following criteria for OCA: trade integration, synchronization of
business cycles, labour mobility and the exchange rate indicator.
The originality of the paper is based on the analysis of the feasibility of the
Balkans use a regional currency or the euro. To do this, we use innovative criteria,
including the criterion of co-movement of the product (which differs from the
synchronization of business cycles), and a criterion of political proximity. On the
other hand, we use the criteria of trade integration and inflation (used in most
previous studies).
58 E.J. Saucedo Acosta and J. Diaz Pedroza

2 Theories of Optimum Currency Areas
There is a wide range of exchange rate regimes (ERR). At one extreme is the ERR
free floating and the other is Monetary Union (MU). Frankel (1999) found nine
ERR that vary according to the degree of monetary flexibility. The ERR of free
floating and MU are known as corner solutions, because they are at the extremes of
the range of the ERR. In recent years several countries have chosen one of the
corner solutions.
In the ERR free floating, governments do not aim its exchange rate, it is the
market that determines it. The free-floating ERR must be supported by an indepen-
dent Central Bank to better results.
MU occurs when two or more countries use the same currency and may be
considered in two ways. In the first case, called Dollarization (or Euroisation), a
country adopts the currency of another country. Montenegro has used the euro
(previously the German mark). The second case, called MU, a group of countries
creates a new currency, as the euro zone when a group of European countries began
to use the euro since 1999.
The OCA theory studies when it is best to have a MU, in other words, the
benefits of using the fixed ERR. The choice of corner solutions will be focused
using the OCA theory.
An OCA can be defined as a geographic area where it is optimal to use a single
currency and one Central Bank. This area may include two or more countries. The
OCA theory studies the disadvantages and advantages of MU’s. According to
Dellas and Tavlas (2001), there are two types of approaches in the literature that
evaluated when it is optimal form a MU. The first considers the conditions that
countries must meet to adopt a common currency, while the second shows the costs
and benefits of forming a MU.
According to the first approach, countries must meet the following conditions to
form an OCA (Table 1).
Mundell (1961) states that if there is free movement of workers between two
countries, it is optimal sharing a single currency. Mckinnon (1963) was the first to
show that when two or more countries trade a lot the benefits of sharing the same
Table 1 Criteria of OCA and authors
Criteria Authors
1 Labour mobility and flexibility of wages and
prices
Mundell (1961)
2 Trade openness Mckinnon (1963)
3 Diversification of consumption and production Kenen (1969)
4 Political integration De Grauwe (2006), Lee and Barro
(2006)
5 Financial integration Mundell (1973a, b)
6 History of high inflation Alesina and Barro (2002)
Source: own elaboration
Theory of Optimum Currency Areas and the Balkans 59

currency are high. Kenen (1969) showed that the diversification of production
becomes more viable monetary integration.
De Grauwe (2006) shows that political integration among countries is a deter-
mining factor for share the same currency. Mundell (1973a, b) indicated the
importance of financial integration in the decision of monetary integration. Alesina
and Barro (2002) showed the role that the inflation record of a country in its
decision to share the same currency.
The main problem with using this method is that there are several conditions that
may result conflicting results. For example, two countries can trade a lot between
them. However, these countries may have low labour mobility. If we consider the
first condition, such countries should share the same currency, while the second
condition it would not be desirable for these countries share the same currency.
The second approach shows the costs and benefits of forming a monetary union
(Table 2 below):
The Table 2 above shows the main costs and benefits of sharing a single
currency. When a currency is shared, the costs of foreign exchange are eliminated
(De Grauwe (2007)); this reduces uncertainty about possible appreciations and
depreciations of the exchange rate (Dellas and Tavlas (2001)). When the new
MU has a credible monetary policy (McCallum (1995)), there is a benefit of having
a commitment to fight inflation (Alesina and Barro (2002)).
Benefits: The main benefit of being part of a MU is the reduction of transaction
costs.
Costs: the main cost being part of a MU is the loss of the exchange rate and
monetary policy (Mundell (1961)) to face an external imbalance.
Another benefit of being part of a MU is based on the “hypothesis of credibility”.
According to such hypothesis, the stronger the commitment to have a fixed exchange
rate, credibility is greater. The “hypothesis of credibility” is based on the notion that a
MU implies a stronger commitment by having a fixed exchange rate. A MU with a
strong commitment to price stabilitywill increase the credibility of themembers of the
MU, so the result is that new entrant imports credibility of the MU.
New trends in the OCA theory include new costs and benefits of forming a
monetary union. For example, Alesina and Barro (2002) showed that the benefits
and costs of forming a monetary union are:
Table 2 Benefits and costs of sharing a currency
Benefits and costs Authors
Benefits
Elimination of transaction costs De Grauwe (2007)
Reducing uncertainty Dellas and Tavlas (2001)
A more credible monetary agreement McCallum (1995)
Commitment to maintain low inflation Alesina and Barro (2002)
Costs
Loss of monetary policy (Traditional consideration) Mundell (1961)
Source: own elaboration
60 E.J. Saucedo Acosta and J. Diaz Pedroza

Benefits of Trade: two countries trade more with a single currency than with two
currencies, therefore, a MU would increase trade.
The benefit of commitment: inflation bias is reduced when a country adopts the
currency of a country with credibility in monetary policy.
Asymmetric shocks: the main cost is the effect of monetary policy in the
presence of asymmetric shocks, because in the MU, monetary policy is
implemented throughout the Union and not just for an individual country, so that
if a country receives a shock that does not affect the Union, there is no way for this
country to react to the shock.
From the new perspective of the costs and benefits of forming a MU, potential
candidates are countries (“clients”) with long periods of high inflation. The “cli-
ents” should choose countries with low inflation (“anchors”), i.e. countries with
high credibility in monetary policy. Additionally, an important element is that the
“clients” and “anchors” have symmetric shocks, to reduce the costs of forming a
monetary union.
Sometimes there are MU’s with several “clients” and only one “anchor”, as in
the case of the euro area. It may happen that a “client” unilaterally adopts the
currency of an “anchor”, as in the case of Montenegro with the euro. In both cases
the “client” (“clients”) gets more credibility, therefore, the “client” import mone-
tary stability from the “anchor”.
In the euro area the “anchor” is Germany, because the Bundesbank has had a
record of low inflation and a high degree of independence. Therefore, inflation bias
has been declining for Germany since the end of World War II.
Before the launch of the euro, there were two monetary systems in Europe,
where Germany was the “anchor”. The first was the snake in the tunnel, where
European countries in the early seventies coordinated their monetary policies to
keep their exchange rates linked to the US dollar. The second occurred in the late
seventies, the European Monetary System (EMS), which was created to import
stability of an “anchor” in this case the Bundesbank.
Capital mobility has increased since the eighties, so it was very difficult to
maintain the credibility of EMS members. One solution to this problem was the
creation of the Economic and Monetary Union (EMU) with only one currency and a
Central Bank for Europe. McCallum (1995) points out that the stronger is the
commitment largest is credibility, so that EMU was the solution to maintain the
credibility of the euro zone.
Theory of Optimum Currency Areas and the Balkans 61

3 Exchange Rate Regimens and Monetary Unions
in the Balkans
3.1 The Balkans and the European Union
We have considered for this text the following countries: Albania, Bosnia and
Herzegovina, Bulgaria, Croatia, Greece, FYROM, Montenegro and Serbia.
The Balkan countries have different types of relationships with the EU, because
they have the following statuses: members, candidates and potential candidates.
Table 3 shows the relationship of the Balkan countries and their status with the
European Union. There are three groups of countries according their status in the
EU:
Group 1: EU Member States
Greece joined 1981 to the EU and the euro area in 2001, Bulgaria is a member of
the EU since 2007 and is not a member of the eurozone and Croatia joined to the
EU in 2013 and is not part of the eurozone.
Group 2: EU candidates
These countries are considered candidates who have acquired this status from
2004 to 2014. In this group are included Albania, FYROM, Montenegro and
Serbia. Montenegro uses the euro since 2002 (before the German mark).
Group 3: EU potential candidates
Bosnia Herzegovina is considered by the European Commission as a potential
candidate for the EU.
Table 3 EU membership and
the BalkansCountry
EU
Member Candidate Potential
Albania 2014
Bosnia and Herzegovina 2003
Bulgaria 2007
Croatia 2013
Greece 1981
FYROM 2004
Montenegro 2010
Serbia 2012
Source: own elaboration
62 E.J. Saucedo Acosta and J. Diaz Pedroza

3.2 Exchange Rate Regimes and O Monetary Policyin the Balkans
The exchange rate regimes and monetary policy differ in the Balkans. Table 4
shows the types of monetary policy and ERR. The region has a wide range of ERR,
from unilateral dollarization to floating.
3.2.1 Greece
Greece has no longer a monetary policy and national currency. Since 2001, such
country is a member of the eurozone and uses the euro and the European Central
Bank determines monetary policy in this area. The European Central Bank manages
monetary policy that is based on two pillars, one economic and the other monetary
(Saucedo 2009), that is why the IMF classifies the Monetary Policy of such Central
Bank as “other” (International Monetary Fund 2013). Exchange rate policy in the
euro area is free floating (International Monetary Fund 2013), i.e. is the supply and
demand for that currency determines its price.
3.2.2 Albania
Albania applies a monetary policy classified as inflation targeting. The Central
Bank of Albania has the aim of achieving price stability, and for such the Central
Bank has set a target of an annual increase in the consumer price index of 3%. The
policy exchange rate in Albania is free floating, although the International Mone-
tary Fund (IMF) considers the regime as floating because sometimes there are
Table 4 Monetary policy framework and exchange rate arrangement in Balkans
Exchange rate
arrangement
Monetary policy framework
Exchange rate anchor Inflation targeting
framework OtherEuro
No separate legal
tender
Montenegro
Currency Board Bosnia and Herzegovina,
Bulgaria
Stabilized
arrangement
FYROM
Crawl-like
arrangement
Croatia
Floating Albania, Serbia
Free floating Greece (in the euro
zone)
Source: International Monetary Fund (2013)
Theory of Optimum Currency Areas and the Balkans 63

interventions by the Central Bank in the foreign exchange market (International
Monetary Fund 2013).
3.2.3 Serbia
Serbia applies an inflation targeting monetary policy. The Central Bank of Serbia
aims price and financial stability, and has set a target by inflation, in the medium
term, of 2–4%. The exchange rate policy is managed float, because it’s Central
Bank intervenes when there is a lot of variability in the exchange rate. The IMF
points out that Serbia has an exchange rate regime classified as floating.
3.2.4 Croatia
The Central Bank of Croatia applies a monetary policy that is anchored to the
exchange rate (International Monetary Fund 2013). The IMF classifies exchange
rate regime in Croatia as crawl-like arrangement, where the Central Bank of that
country intervenes to achieve a controlled depreciation of its national currency
(kuna) with the euro, which is not greater than 2%, otherwise would be considered
as floating (International Monetary Fund 2013).
3.2.5 FYROM
The Central Bank of FYROM applies a Monetary Policy that is anchored to the
exchange rate, because its intermediate target is a certain value of its currency
(Denar) in relation to the euro. The IMF classifies exchange rate regime of FYROM
as Stabilized arrangement (International Monetary Fund 2013), where the Central
Bank intervenes in the foreign exchange market to avoid abrupt depreciation
(appreciation).
3.2.6 Bulgaria
The Central Bank of Bulgaria applies a Monetary Policy that is anchored at the
exchange rate at a fixed level 1.9558: 1 EURO. The exchange rate regime in
Bulgaria is an Currency Board (International Monetary Fund 2013), which consists
of keeping fixed the value of its currency (lev) relative to the euro, and the rule
followed is that the money supply grows (decreases) as international reserves grow
(decrease).
64 E.J. Saucedo Acosta and J. Diaz Pedroza

3.2.7 Bosnia and Herzegovina
The Central Bank of Bosnia and Herzegovina applies a monetary policy that is
anchored at the exchange rate at a fixed level 1.9558: 1 EURO. The rate of
exchange rate of Bosnia and Herzegovina is Currency Board (International Mon-
etary Fund 2013), which is to keep fixed the value of its national currency (mark)
relative to the euro (it was linked to the German mark before), and the rule followed
is that the money supply grows (decreases) as international reserves grow
(decrease).
3.2.8 Montenegro
Montenegro has no own currency, uses the euro (previously used the German
mark). This country uses the euro unilaterally and the main objective of the Central
Bank is to achieve and maintain financial stability. The IMF classifies its exchange
rate policy as “no separate legal tender” (International Monetary Fund 2013).
3.3 Monetary Options for Balkan Region
In the Balkans can be considered three options:
(1) To continue using their national currencies, although Montenegro and Greece
use the euro, and Bulgaria, Croatia will have to use it in the medium and long
term, because they are members of the EU.
(2) Creation of a regional currency, although in the case of Greece and Montenegro
already use the euro, which would complicate this option.
(3) Using the euro as the national currency, and there are two choices: which
countries become members of the euro zone (Greece) or if they decide to do
so unilaterally (Montenegro).
4 Methodology
4.1 Databases, Sources and Indicators
4.1.1 Price Stability
Inflation data come from the World Development Indicators 2014 (World Bank),
and we use the variable Consumer Price Index for the period 1990–2012. Not all
countries have data for the entire period, because several countries acquired their
Theory of Optimum Currency Areas and the Balkans 65

independence recently, for those countries the annual average inflation data of short
periods was taken into account.
Information of inflation in the euro zone come from the IMF, World Economic
Outlook Database, October 2014, and we use the variable Consumer Price Index for
the period 1990–2012.
π ¼ CPIt � CPIt�1
CPIt�1
Where:
CPI Consumer Price Index
4.1.2 Trade Openness
The bilateral trade data come from the Department of Trade Statistics of the IMF.
Imports and exports are in US dollars for the period 1980–2013. For the calculation
of trade opening we needed the Gross Domestic Product (GDP) of each of the
countries, so it used the IMF, World Economic Outlook Database, October 2014.
The GDP used was in billions of US dollars.
To compute the Trade Openness (TO) the following formula is used:
TO ¼ M0sþ X0sGDP
Where:
M’s imports;
X’s exports;
GDP Gross Domestic Product
4.1.3 Co-Movement of GDP
The methodology used in this paper is based on the proposal of Alesina et al. (2003)
in which co-movements are calculated in economies that should form a MU. Based
on the results the convenience of belonging or not to an OCA (if you consider the
Euro as such) is inferred.
The IMF contains all the information needed for this document. Eurostat has
information for all countries in Europe, but there are some missing years for
countries that are candidates to join the euro zone. The OECD database has
66 E.J. Saucedo Acosta and J. Diaz Pedroza

conversions PPP exchange rates. Finally, the database of the World Bank is one of
the sources used. With all these information bases we will be able to integrate a
panel covering a time period of at least fifteen years for each of the countries
analysed.
The model that we propose allows observe how co-movement the variable GDP
per capita of a set of economies in the Balkans. The Yjt/Yit variable measures the
ratio of GDP of the j-th country in terms of the ith country. Eight countries were
used with an annual time period ranging from 2000 to 2014, homogenizing the
series at PPP prices to compare these economies. An autoregressive second order
process was used to estimate model parameters, such as indicated Alesina, Barro
and Tenreyro:
lnyjtyit
¼ C0 þ C1lnyjt�1
yit�1
þ C2lnyjt�2
yit�2
þ uijt ð1Þ
With cuijt which measures the relative product that is not predictable from the
previous two periods. Then a measure of co-movement would be given by the root
mean square of error:
VY�ffiffiffiffiffiffiffiffiffiffiffiffiffiffiffiffiffiffiffiffiffiffiffiffiffiffiffiffiffiffiffi1
T � 3
XT
t¼1u2tij
rð2Þ
The above expression shows that for small values VY indicates a higher
co-movement of products between countries i and j, and that most of the explana-
tion (between products) is given by the expression (1).
The econometric technique for estimating parameters and root mean square
consisted of a 2nd order autoregressive panel was developed by Arellano and
Bond (AB) (1991) and Arellano (2003), due to the dynamic nature of the
autoregressive process. Thus AB estimator is performed by the Generalized of
Method of Moments (GMM) and to estimate a dynamic model is not required to
include external instruments. Cannot be used the usual technique Pooled OLS
estimator by the presence of autocorrelation of unobserved individual effect and
lagged variables. The same problem would be using the methodology of the
estimates of fixed effects and random effects.
Estimation by dynamic methods poses a relationship that is characterized by the
presence of lags of the dependent variable in the regressors. In addition, it is
assumed that the error terms follow a model with a single error component with
the property that are independent and identically distributed (IID).
4.1.4 Political Proximity
The information on the resolutions of the General Assembly of the United Nations
(UN) comes the Official Document System of the UN (http://www.un.org/es/
documents/ag/resga.shtml) for the 2014. The degree of coincidence in the voting
Theory of Optimum Currency Areas and the Balkans 67

at the General Assembly of the UN was compute, and the options are for, against,
abstentions and no vote. The option did not vote was taken as a fourth option, so that
if a country did not vote and the other yes, it was considered that there was no
coincidence in the resolution.
We followed Lee and Barro (2006) on the degree of coincidence of countries in
the General Assembly of the UN. We used the latest available year (2014), for
political proximity to the countries of the Balkans. FYROM does not belong to the
UN, for reason we do not include in this analysis. For each of the Balkan countries
the degree of coincidence was calculated (each resolution 2014) regarding them-
selves and the countries of the euro zone, and then we obtained an average of the
degree of coincidence.
5 Results
5.1 Price Stability
Table 5 shows the average inflation, using the consumer price index, for the
Balkans. We divide the information into two sub-periods, 1990–2000 and
2000–2012. Nevertheless, there are countries for which there were not data for
the first period (Bosnia and Herzegovina and Montenegro) because they became
independent at later dates. In the nineties was a period of low inflation in Europe,
because several countries had to fulfil the Maastricht criteria, in order to enter the
euro zone, but the countries of the Balkans did not have to meet these criteria (with
the exception of Greece).
In the period 1990–2000, the countries of the Balkans had a double-digit
inflation (excluding Greece with high inflation, but with one digit), due to the
instability that occurred in this period in the region. It is noteworthy Bulgaria
with an average annual inflation 117.5%, Croatia (86.2%) and Serbia (50.2%).
On average the Balkan region had an inflation rate of 50.22%, very high when
is compared to the euro area (2.21%).
In the period 2000–2012, the countries of the Balkan region had lower inflation
than the previous period. Inflation in the Balkans was only one digit, except Serbia
having a price increase annual average of 12.9%. Albania, Bosnia and
Herzegovina, Croatia, Greece, FYROM and Montenegro had inflations very close
to 3%. The Balkans region had an average inflation 4.64%, while in this period the
euro zone had an inflation rate of 2.17%.
The euro area seems to be an anchor in the region, because the inflation in that
region is low compared with that of the Balkans. Many Balkan countries have low
inflation due to: they have linked their currencies to the euro (Bulgaria and Bosnia
and Herzegovina have a Currency Board) or they use the euro (Greece and Monte-
negro) and as a result of the process of transitional evolution of their economies. The
euro is now an anchor currency for the region, so it would be very likely for countries
68 E.J. Saucedo Acosta and J. Diaz Pedroza

of the Balkans to use it in the future as a means to import stability. Greece and
Montenegro uses the euro, Bulgaria and Croatia will eventually use that currency
(once they pass a series of tests) because they are part of the EU, while other
countries are candidates (with the exception of Bosnia and Herzegovina), so that
when they become member of the EU will have to use the euro.
5.2 Bilateral Trade
Table 6 shows the bilateral trade (% GDP) of the countries of the Balkans with
respect to the euro zone and among themselves. In general, countries in the Balkans
are more integrated with the euro area (15.88%) than among themselves (7.80%),
so it would be more likely to share a currency with the euro area than among
themselves. Montenegro is the only country in the region with greater regional
integration with the Balkans (15.10%) compared with the euro area (12.36%),
while other countries in the region have greater trade integration with the euro zone.
Croatia, Albania, Bosnia and Herzegovina, Bulgaria and FYROM are more inte-
grated with the euro area than Greece, even that the latter is already using the euro.
Although Montenegro already uses the euro, it is the most integrated, in terms of
trade, with the Balkan region.
Overall, if we use the criterion of trade integration, the countries of the Balkans
would be ideal candidates to use the euro, because their level of trade integration
with the euro area is larger than themselves. The alternative of a regional currency
is not feasible if we use the criterion of trade integration.
Table 5 Mean of annual
inflation rates for Balkans
region (%)
Country 1990–2000 2000–2012
Albania 27.8 2.9
Bosnia and Herzegovina 3
Bulgaria 117.5 5.9
Croatia 86.2 2.9
Greece 9 3.2
FYROM 10.6 2.4
Montenegro 3.9
Serbia 50.2 12.9
Average 50.22 4.64
Euro zone 2.21 2.17
Source: own elaboration with data from The World Bank
Theory of Optimum Currency Areas and the Balkans 69

5.3 Co-Movement of Product
To estimate Eq. (1) a transformation of the variable in logarithm is performed and
the results are presented in Table 7.
However, the interest of our empirical analysis focuses on the residuals of the
regression, because they represent the co-movements or interdependence of all
countries in this panel.
Table 8 shows the co-movement of GDP per capita between the countries of the
Balkans and the euro zone and among the countries of the Balkans (lower values
means higher co-movements). On average, countries in the Balkans have higher
co-movement among themselves (regarding the euro area). Therefore would not be
optimal for those countries using the euro as a whole, while a regional currency
would be more justified if we use the criterion of co-movement of products.
However Greece and Montenegro, which already use the euro, have the lowest
co-movement with the euro zone, which would be a contradiction if we rely on the
criterion of co-movement of products. The above indicates that the decision to use
the euro by Greece, and to a lesser extent Montenegro (by the size of its economy),
was based more on political criteria. The low co-movement of the Greek economy
with the euro zone is not new, there are studies (Lee and Barro 2006; Saucedo 2009)
showing that the synchronization of its economy is low relative to the area euro.
5.4 Political Proximity
The Table 9 shows the political proximity (degree of coincidence in voting of the
resolutions of the General Assembly of the UN) of the countries of the Balkans with
the euro area and among themselves.
The Balkan countries have more political proximity to the members of the euro
area than themselves, because the level of political proximity to the euro area
(0.9013) is higher than among themselves (0.8820), therefore, would be more
Table 6 Bilateral Trade (%
GDP) for Balkans region,
2005–2013Country
Trade partners
Euro zone (%) Balkans (%)
Albania 13.73 4.32
Bosnia and Herzegovina 17.56 13.98
Bulgaria 19.98 4.80
Croatia 20.77 4.41
Greece 13.58 1.85
FYROM 16.70 11.97
Montenegro 12.36 15.10
Serbia 12.38 5.97
Average 15.88 7.80
Source: own elaboration with data from the IMF
70 E.J. Saucedo Acosta and J. Diaz Pedroza

appropriate that the euro will be used in the region regarding a the creation of a new
regional currency. At the country level, Croatia, Greece, Bulgaria, Montenegro and
Albania are more integrated with the euro zone.
We will use Greece as a parameter, in this section, because is already member of
the euro zone and we suppose that such country has a high level of political
proximity with their partners due to negotiations before and during the euro zone
Table 7 Results of
estimation of Eq. (1)Dependent variable Coefficient
ln(yjt/yit)
Independent variables
ln yjt�1=yit�1
� �1.2524
(0.1037)
ln yjt�2=yit�2
� � �0.3619
(0.1040)
c0 �0.7446
(0.1767)
Source: own estimation
Note: The standard error is shown in parentheses below the
coefficient
All coefficients are significant at the 5% statistical significance
Table 8 Co-movement of GDP per capita, 2000–2014
Country VY Euro zone VY Balkans (average)
Albania 0.0202 0.0103
Bosnia and Herzegovina 0.0222 0.0113
Bulgaria 0.0208 0.0119
Croatia 0.0246 0.0127
FYROM 0.0225 0.0121
Greece 0.0272 0.0147
Montenegro 0.0292 0.0163
Serbia 0.0259 0.0138
Average 0.0241 0.0129
Source: own estimation
Table 9 Political proximity
for Balkan countries,
2007–2014
Country Euro zone Balkans (average)
Albania 0.9116 0.8869
Bosnia and Herzegovina 0.8543 0.8523
Montenegro 0.9341 0.9114
Serbia 0.8166 0.8119
Bulgaria 0.9213 0.8939
Croatia 0.9240 0.9013
Greece 0.9472 0.9162
Average 0.9013 0.8820
Source: own estimation with data from UN
Theory of Optimum Currency Areas and the Balkans 71

creation. So, using Greece as a parameter, only Bosnia and Herzegovina and Serbia
would not be politically very close to the euro zone, so it would not be desirable for
these countries to use the euro.
6 Conclusion
The countries of the Balkan region are linked to the euro zone in different ways. In
the future the region will be further linking with countries that share the euro, so it is
relevant to investigate whether it is optimal for that region using the euro, or if a
better scenario to create a new regional currency or to continue using their national
currencies.
The paper shows that for the countries of the region the benefits of using the euro
are large, so that the option of a regional currency would not be a good choice. The
use of the euro is a feasible option once these countries have joined the EU. The
option to continue using their national currencies is not viable in the long term,
because there are countries that already are using the euro in the region (Greece and
Montenegro), while other countries have linked their currencies to the euro. Only
Serbia and Albania have implemented monetary and exchange rate policies that are
not linked to the euro, because these countries have monetary policies of inflation
targeting and a flexible exchange rate.
If we use as a criterion to price stability, although the countries of the Balkan
region have reduced inflation, the price increase in this region is almost double that
in the euro area in the period 2000–2012 while in the previous period (1990–2000),
the average annual inflation Balkan region was 50%, while in the euro area was
only 2%. The euro is an anchor currency that would serve the region to import price
stability.
The criterion of bilateral trade shows that on average the Balkan countries trade
more with the euro area with such region, so that the best option would be to utilize
the euro instead of creating a new regional currency. Most countries in the region
have greater bilateral trade with the eurozone than Greece with its euro zone
partners.
The criteria of co-movement of the product shows that for Balkan countries is
beneficial to use a regional currency, because their economies are more synchro-
nized with themselves than with the euro zone. Nevertheless if we use Greece as a
parameter, for the rest of Balkans countries would be optimal to use the euro,
because those countries have higher co-movement than Greece (regarding
euro zone).
The criterion of proximity policy shows that in general the countries of the
region are more politically closer to the euro area than among themselves, so the
best option is to use the euro instead of a regional currency.
The paper has the advantage that from a set of criteria is possible to determine
whether it is optimal for the Balkan countries to be integrated monetarily with the
euro zone. Thus, it was concluded that the best option for the region is to use the
72 E.J. Saucedo Acosta and J. Diaz Pedroza

euro in relation to launch a new regional currency. However, from the case of
Greece is possible to note that monetary integration responds to political factors
rather than the criteria of OCA, because that country have lower values on several
criteria than other countries of the Balkans. In this sense, one of the limitations of
the text is that political factors that influence share a single currency are not
included, although a political proximity indicator was used. It possible to apply
the same methodology to other regions that are involved in economic integration
processes to analyse the feasibility of monetary integration.
When a country is a member of a monetary union loses control of its monetary
policy to address economic national shocks. In the case of the eurozone, decisions
of the Governing Council of the ECB are based on macroeconomic variables in
such area and not a particular country, however, as a country is larger, such as
Germany, its macroeconomic variables affects more the euro zone, unlike a small
country (Greece). If the business cycle of a small country is synchronized with the
cycle of the eurozone, a single monetary policy is optimal, but if the cycles are not
synchronized a single monetary policy is not optimal. When members of a mone-
tary union have different economic paths, the costs of belonging to a monetary
union increase, because a single monetary policy is not optimal for a group of
countries with different economic cycles.
References
Alesina A, Barro RJ (2002) Currency unions. Q J Econ 117(2):409–436
Alesina A, Barro RJ, Tenreyro S (2003) Optimal currency areas. In: Gertler M, Rogoff K (eds)
NBER Macroeconomics annual 2002. The MIT Press, Cambridge, MA, pp 301–356
Arellano M (2003) Panel data econometrics. Oxford University Press, Oxford
Arellano M, Bond S (1991) Some tests of specification for panel data: Monte Carlo evidence and
an application to employment equations. Rev Econ Stud 58:277–297
Belke A, Zenkic A (2007) Exchange-rate regimes and the transition process in the Western
Balkans. Intereconomics 42(5):267–280
Broz T (2007) The application of optimum currency area criteria to Croatia.
Revistatineriloreconomisti 1(9):7–19
De Grauwe P (2006) What have we learnt about monetary integration since the Maastricht treaty?
J Common Mark Stud 44:711–730
De Grauwe P (2007) The economics of monetary integration. Oxford University Press, New York,
NY
Dellas H, Tavlas GS (2001) Lessons of the euro for dollarization: analytic and political economy
perspectives. J Policy Model 23(3):333–345
Frankel JA (1999) No single currency regime is right for all countries or at all times. NBER
Working papers 7338
Gligorov V, Iara A, Landesmann M, Stehrer R (2008) Western Balkan countries: adjustment
capacity to external shocks, with a focus on labour markets. “Wiener Inst. f€ur Internat.
Wirtschaftsvergleiche” (WIIW)
Gockov G, Jovanovski K (2013) Macroeconomic shocks asymmetry: see as an optimal currency
area. Review-Casopiszaekonomiju-APEIRON 6(2)
Gouveia S (2014) Business cycle correlation between the Euro area and the Balkan countries. Int J
Econ Sci Appl Res 1:33–49
Theory of Optimum Currency Areas and the Balkans 73

International Monetary Fund (2013) Annual report on exchange arrangements and exchange
restrictions 2013. International Monetary Fund, Washington, DC
Kenen PB (1969) The optimum currency area: an eclectic view. In: Mundell RA, Swoboda AK
(eds) Monetary problems of the international economy. University of Chicago Press, Chicago,
IL, pp 41–60
Lee JW, Barro RJ (2006) East Asian currency union. Harvard University Working paper
McCallum BT (1995) Two fallacies concerning Central-Bank independence. Am Econ Rev 85
(2):207–211
McKinnon RI (1963) Optimum currency areas. Am Econ Rev 53(4):717–725
Mundell RA (1961) A theory of optimum currency areas. Am Econ Rev 51(4):657–665
Mundell RA (1973a) A plan for a European currency. In: Johnson HG, Swoboda AK (eds) The
economics of common currencies. Harvard University Press, Cambridge, MA, pp 143–173
Mundell RA (1973b) Uncommon arguments for common currencies. In: Johnson HG, Swoboda
AK (eds) The economics of common currencies. Harvard University Press, Cambridge, MA,
pp 114–132
Saucedo EJ (2009) Essays on the European Central Bank: Ensayos sobre el Banco Central
Europeo. University of Veracruz, Xalapa, Mexico
Sideris D (2009) Do the new EU member states form an optimum currency area with the
eurozone? Evidence from six Central and Eastern European countries (No. 15), National
Bank of Serbia
74 E.J. Saucedo Acosta and J. Diaz Pedroza

The Balance-of-Payments Constrained
Growth Model in Transitional Economy:
The Case of Bulgaria
Elena Spasova
Abstract This paper examines the growth dynamics of the Bulgarian economy in
the last 20 years in the light of the concept of balance-of-payments (BOP)
constrained growth developed by Anthony Thirlwall (Thirlwall’s Law).Thirlwall’s Law aims at evaluating a country’s growth rate consistent with
internal and external economic equilibrium. It states that BOP equilibrium requires
a rate of economic growth not exceeding the ratio of the income elasticity of a
country’s exports to the income elasticity of its imports—giving focus on price and
non-price competitiveness.
The study aims to verify whether the balance-of-payments constrained growth
approach is suitable for explaining the Bulgarian growth performance in the last
two decades.
To this end, an econometric analysis of the equilibrium (sustainable) growth rate
of the Bulgarian economy according to the concept of the BOP constraint on growth
is made and compared to the actual registered levels of growth. The analysis clearly
demonstrates that the characteristics of Bulgarian external trade represent a con-
straint on the country’s growth dynamics and hinder the process of sustainable
economic convergence with the developed world.
1 Introduction
The debate between supply-constrained and demand-constrained growth remains at
the core of the discussion on the factors for economic growth. Anthony Thirlwall
(1979) contributes to the debate in favour of demand-constrained growth through
the model of the balance-of-payments constraint to growth, known as Thirlwall’sLaw. The basic assumption of the law is that no country can grow faster than what is
consistent with the balance-of-payments equilibrium because it would face ever
increasing trade deficits and external debt. As a result, an economy facing such a
situation reduces the national income which leads to unemployment. For that
E. Spasova
New Bulgarian University, 21 Montevideo Str, 1618 Sofia, Bulgaria
e-mail: [email protected]
© Springer International Publishing Switzerland 2016
A. Karasavvoglou et al. (eds.), Economic Crisis, Development and Competitivenessin Southeastern Europe, Contributions to Economics,
DOI 10.1007/978-3-319-40322-9_5
75

reason, Thirlwall reaches the conclusion that the balance-of-payments equilibrium
growth rate equals the ratio between the growth of exports and the income elasticity
of the demand of imports. This perspective focuses on the non-price competitive-
ness of the economy on the external markets and allows further analysis of the tools
and methods for sustainable long-term growth.
The aim of this paper is to analyse whether “Thirlwall’s Law” is suitable for
explaining the actual growth of the Bulgarian economy over the 1994–2013 period.
Although this methodology is not new, it is still widely used in the empirical growth
literature to predict actual growth. The elasticities of demand are estimated via OLS
and 2SLS regressions. The results strongly confirm the validity of the Thirlwall’sLaw for the Bulgarian economy and the estimated coefficients of demand elasticity
of exports and imports show problems with Bulgarian external competitiveness.
This results in relatively lower sustainable levels of economic growth of the country
and lack of capacity for catching-up strategy.
The paper is structured as follows: In Sect. 2 the model and its theoretical
explanation are presented. In Sect. 3, initial descriptive analysis of the data is
made and additional information of the Bulgarian economy is provided. The
estimations results are demonstrated in Sect. 4 together with the analysis of the
main findings of the regression outcomes and the test of the validity of Thirlwall’slaw for the Bulgarian economy. The final section concludes on the relevance of
Thirlwall’s Law as a method of predicting the actual growth rate of the Bulgarian
economy and poses basic recommendations for improving the external com-
petitiveness of the economy.
2 Theoretical Framework and Empirical Background
In traditional growth theories the equilibrium (natural) level of growth has two main
functions. First, the natural growth rate provides a ceiling for the sustainable
development of an economy and determines the cyclical fluctuations—the differ-
ence between the natural level and the actual level, which indicates the presence of
an economic boom or decline. Second, it determines the long-term growth rates
around which the economy gravitates. According to these theories, the natural rate
of growth is presented as strictly exogenous, determined by the growth of employ-
ment and productivity, without considering the dependence or endogeneity of the
two factors on demand. Therefore, different economic schools (mostly the Neo-
classical vs. the Keynesian school) explore ways of bringing the actual level of
growth to its natural level. Whilst the neoclassical theory sees this adjustment
through substitution between capital and labour with the aim to change the resource
productivity per unit, Keynesians argue that the equilibrium level is achieved
through a change in the income distribution. Both schools, however, accept the
natural rate of growth as a constant, not as a subject to change—the adaptation of
the actual growth of the economy to its natural levels is carried out in terms of
constancy of the predetermined equilibrium level (at full employment). The natural
76 E. Spasova

level can be changed only under the influence of exogenous factors—technological
changes or changes in labour productivity.
Anthony Thirlwall develops a model that proves that the abovementioned
growth factors are endogenous to demand, i.e. he makes the assumption that as a
result of a demand change (internal and external demand) the natural level of
national production may also change through accumulation of resources (capital
and labour). His conclusions are empirically proven for a number of countries (see
Dixon and Thirlwall 1975; Thirlwall 1969; Thirlwall 1987) and are based on the
Verdoorn law, which states that “long-term change in production volume by about
10% is related to change in labour productivity by about 4.5%.” Kaldor proves a
factor change of 0.484 and confirms the findings of Verdoorn (1993).
Provided that the natural rate of growth is endogenous to demand or to the actual
level of growth, we could draw two main conclusions. Firstly, theoretically the
presence of such a correlation has an impact on the efficiency and the speed of
convergence between the actual and natural growth rates. Secondly, it has an effect
on the manner in which the growth process should be analysed and gives clarity to
the question why different economies grow at different rates: whether growth is
determined by aggregate supply or is determined by demand restrictions before the
supply capacity is fully reached (Leon-Ledesma and Thirlwall 2002).
The neoclassical growth paradigm focuses on the supply-side of the economy
and explains economic growth as a function of the rate of growth of capital and
labour and, in general, the growth of production factors and their efficiency.
However, it does not explain why growth rates are different for different countries
or why production factors in one economy are more effective than those in another.
An answer to this question can be given, only if demand is taken into consideration;
namely the growth rates are different, because internal and external demand is
different. Therefore, the question that should be answered regards the constraints
facing demand. In this sense, in contemporary open economies a major obstacle to
growth is balance-of-payments constraint on demand. The meaning of this con-
straint is defined by Anthony Thirlwall. He claims that an economy’s growth could
not be indefinite, if it is due to the rising levels of external indebtedness of the
economy.
However, Thirlwall model does not ignore the impact of aggregate supply
(which is a function of technology, the structural characteristics of the economy
and specialization), but rather assumes that the macro-level effects of aggregate
supply on economic growth are reflected in the coefficients of income elasticity of
imports and exports, which characterize the non-price competitiveness of domestic
production.
The model is generated from the initial condition for balanced BOP:
PdX ¼ PfME; ð1Þ
where Pd and Pf are the prices of exports and imports, E is the exchange rate, and M
and X are the imports and exports volumes. Thirlwall describes the import and
export functions as:
The Balance-of-Payments Constrained Growth Model in Transitional Economy:. . . 77

M ¼ b PfE=Pdð ÞψYπ, ψ < 0, π > 0 ð2ÞX ¼ a Pd=PfEð ÞηZε, η < 0, ε > 0 ð3Þ
where Y and Z are respectively domestic and world income, ψ and η are price
elasticities of demand of imports and exports; π and ε are income elasticities of
demand of imports and exports.
After substitution and transformation, we get the formula for the balance-of-
payments equilibrium growth rate (small letters indicate growth rates):
yb ¼ 1þ ηþ ψð Þ� pd � pf � eð Þ þ εz� �
=π ð4Þ
Analysing this formula, we can outline several conclusions about the dynamics
of the equilibrium growth rate. First, it can be concluded what the effect of higher
inflation in the local economy and abroad would be.
If there is a rise in inflation in the local economy, the prices of domestic products
(pd) will rise. Whether this will have a lowering effect on the equilibrium growth
rate depends on the sum of the indices of the price elasticity of demand for exports
(η) and price elasticity of demand for imports (ψ). If this amount is greater than
1, then the equilibrium growth rate will decrease.
If there is a rise in inflation abroad (growth of pf) and the amount of the price
elasticity of demand for imports (ψ) and price elasticity of demand for exports (η) isgreater than 1, it will lead to an increase in the equilibrium rate of growth.
The effect of a possible devaluation (e) also depends on the price elasticity of
domestic demand for imported goods and foreign demand for exported goods. This
pattern is known as the Marshall–Lerner condition. The coefficients of both price
elasticities should be more than 1 in order to have a positive effect on the sustain-
able rate of growth.
Furthermore, growth of world income (z) would increase yb, considering that the
income elasticity of demand of imports is negatively related to the yb—the higher
the elasticity, the lower the sustainable growth rate.
It can be said that the higher growth of an economy must be aligned with the
balance-of-payments constraint in order for this growth to be sustainable and to
pose no threat of future destabilization. If the equilibrium rate of growth in a
balanced balance of payments environment rises as a result of the increase of
attractiveness of exports or reduction of income elasticity of demand for imports,
this growth would not pose a threat of future imbalances. On the other hand, if we
just observe an increase in the economy’s production capacity without any change
in the nature of the demand for these goods, this would be a precondition for
unemployment.
This observation raises the issue of different levels of sustainable growth in the
balance-of-payments constrained growth (BPCG) model. It could be stated that
these differences are due to the characteristics of import and export goods reflected
in their price and income elasticities. For example, countries with low levels of
sustainable growth rates are characterized by low income elasticity of demand for
78 E. Spasova

exports and high income elasticity of imports. This means that goods produced in
this economy are attractive neither to foreign markets, nor to local consumers. In
practice, this model places the export growth and the improvement of its com-
petitiveness as the key strategy for sustainable growth. The nature of exports is of
particular importance, since due to the different characteristics of demand for these
goods abroad and domestically, identical rates of growth of exports would lead to
different levels of steady economic growth. It is important not only to answer the
question “how much is produced and exported”, but also “what is produced and
what is its demand”, i.e. the essential characteristic of exports that could determine
the ability of an economy to develop and implement a successful export-based
growth strategy, is its non-price competitiveness.
Thirlwall (1979) and McCombie (1985) argue that in the long term the rates of
change in the relative prices of imports and exports play a small role in determining
the level of exports and imports. Taking into consideration their observations and
after a simplification of the above mentioned formula, we get the so called weak
version of Thirlwall’s Law:
yb ¼ x=π ð5Þ
The law states that the long-run equilibrium growth rate in the BPCG framework is
determined by the ratio between the long-run export growth and the income
elasticity of import. McCombie adds that differences in growth rates across eco-
nomies are determined by the discrepancies between the values of the income
elasticity of demand for their exports and the income elasticity of demand for the
imports in the economy (respectively, ε and π).It is important to note that the proposed model is valid only in the long term as in
the short term countries can register balance-of-payments deficits covered by
capital inflows. The situation changes in the long term as deficits cannot grow
indefinitely and be covered at the cost of increasing foreign indebtedness, i.e.,
according to Thirlwall, in the long term the role of capital inflows is negligible.
Bertola et al. (2002) reformulates the law of Thirlwall as follows:
yb=z ¼ ε=π; ð6Þ
where yb is the level of sustainable growth in the BPCG model, π and ε are the
coefficients of income elasticity, and z is the level of world income. This equation
shows that an economy can achieve a greater equilibrium growth rate if its
non-price competitiveness (ε / π) is above 1. If yb= z ¼ ε = π ¼ 1, the rate of
growth of an economy to the world rates will be maintained. These observations
confirm the usefulness of the model in explaining the international differences in
economic growth rates.
A number of economists apply the Thirlwall model to individual economies and
to whole regions regardless their level of development. However, it is noteworthy
the amount of literature on the application of the model for developing countries,
primarily in the Latin American region. One of the reasons for the interest is the fact
The Balance-of-Payments Constrained Growth Model in Transitional Economy:. . . 79

that this theory is not entirely new to the region because it shares common grounds
with the work of Raul Prebisch and his center-periphery model, which interprets the
high income elasticity of exports and low income elasticity of imports as factors for
sustainable external imbalances and modest growth.
Although it is relatively unknown (compared with its application in Latin
America), the BPCG model is empirically tested to some European economies.
Two major studies focus on economic growth and balance-of-payments imbalances
of Spain. Leon-Ledesma (1999) examines the validity of the Thirlwall law for
Spain in the period of 1964–1994. In order to estimate the coefficients of demand
elasticity for imports and exports, Leon-Ledesma used functions of exports and
imports. The results confirm the validity of the model for that period—estimated
growth rates are close to the real ones. Bajo-Rubio (2010) also makes long-term
analysis of the balance-of-payments constrained growth of Spain for the period
1850–2000. The analysis is done by dividing the period into several stages,
allowing assessment of BPCG in different historical periods and in different
environments. Other studies focusing on European countries are the works of
Soukiazis et al. (2013a) and Kvedaras (2012) on Portugal; Garcimartın
et al. (2012) on sample of OECD countries.
In recent years, the BPCG model is applied also for some of the transition
economies of Central and Eastern Europe. An interesting example in this regard
is the study of Bek€o (2003) for a small economy in transition—Slovenia. The period
under consideration is short—from 1992 to 2002, which is one of the main
weaknesses of the study. However, the study shows that the Slovenian economy
grows above its equilibrium level which corresponds with the increasing negative
net exports. Cointegration analysis shows a clear long-term relationship between
real GDP and real exports. Beko uses the data to analyze the structural problems of
the Slovenian economy. The author concludes that economic growth consistent
with the long-term equilibrium level requires either a change in the terms of trade
and increased capital inflows, or change in the elasticity of exports and imports. The
later requires a relatively long period and targeted policies. Furthermore, according
to the author, it cannot be expected a substantial decrease in the income elasticity of
imports due to the consumer preferences and the dependency of exports on
imported raw materials. He suggests that it is appropriate to focus on exports.
Exports could be driven in two main ways: (1) exchange rate changes and (2) pol-
icies to stimulate export production. According to Beko, the exchange rate changes
would be ineffective because of the low price elasticity of exports and the risk of
inflation and increased interest rates. The recommendations are for changes in the
structure of export production through investments in new technologies and human
capital.
Hansen and Kvedaras (2004) tested the model for the three Baltic countries—
Estonia, Lithuania and Latvia for the period 1995–2003. They modify the model in
order to come closer to the specifics of the region. The Balassa–Samuelson effect is
included in the import function to allow estimation of the effect of long-term real
appreciation of the national currency. Their results are alarming. Firstly, the
estimated sustainable levels of growth are low and cannot provide catching-up of
80 E. Spasova

Western economies. Furthermore, the authors indicate that economic growth is not
significantly affected by changes in exports due to the relatively high demand
elasticity of import and the dependence of exports on imported raw materials.
One of the latest studies on the subject in the region of Central and Eastern
Europe is the study of Soukiazis et al. (2013b) focusing on Slovakia. The BPCG
model turns out to be valid in explaining the growth dynamics in Slovakia after
1993. The main recommendation for raising the sustainable growth rate of the
country is stimulating the production of higher-quality tradable goods.
The conclusion that may be derived from the theoretical and empirical studies
applying the BPCG model is that it is not appropriate to think of growth only as a
function of production factors after, to some extent, demand can create its own
supply. The growth rates of certain economies, as well as economic divergence
between countries could be explained only if restrictions on demand (internal and
external) are taken into account. This is particularly true for developing countries
where restrictions on demand are present before potential output is reached. This
fact dooms them to modest growth.
3 Economic Growth and International Competitiveness
of Bulgaria: Descriptive Analysis
Before proceeding to the econometric test of Thirlwall’s Law applied to the
Bulgarian economy, it would be useful to take a look at the dynamics and long-
term trends in the export and import flows of Bulgaria, as well as its growth rate.
The period of interest is 1994–2013 which is found to be appropriate in evaluating
the character of transition to market economy and allows long-term estimation of
the appropriateness of the BPCG model in estimating the sustainable growth rate of
the Bulgarian economy.
Table 1 illustrates the main indicators that characterize the external trade
relations of Bulgaria in the period of 1994–2013. As can be observed, both exports
and imports in the analysed period are increasing, which is not surprising consider-
ing the intensive process of trade liberalization. What is more interesting is the
accelerated rate of growth of imports compared to exports. Another important
factor is the higher volatility of exports compared to imports. Both of these
tendencies are worrying and could be a basis for further analysis.
A closer look at the historical dynamics of exports and imports shows that the
negative tendencies develop after year 2000 (Fig. 1). The period of 2002–2008 (the
period of economic boom) is characterized by increasing external deficit. During
the crisis period a certain adjustment takes place, however the imports are con-
stantly exceeding the levels of exports. As can be expected, the mean value of
current account balance and of the external trade balance of Bulgaria are both
negative.
The Balance-of-Payments Constrained Growth Model in Transitional Economy:. . . 81

The GDP statistics also show negative comparative trends. During the 20-year
period the national income grows at 2.68% on average while the group of devel-
oped countries (used as a reference for the rest of the world because the Bulgarian
exports are mainly oriented towards their territories) grows on average by 2.81%. It
turns out that the catching-up growth process did not happen in Bulgaria, what is
more—Bulgaria has lagged even further behind the developed world.
A more detailed overview of the national income growth rates shows that the
negative difference between Bulgaria’s GDP and developed countries’ GDP is due
to the 90s when Bulgaria goes through a severe crisis. The growth rates after year
2000 are visibly higher. However, it became clear that the increased growth was at
the cost of rising external indebtedness (Fig. 2).
Table 1 Summary statistics of main indicators, Bulgaria, 1994–2013
Variable Mean
Standard
deviation Minimum Maximum
Exports, annual %
change, base: previous
year
5.861051 13.77357 �17.72319 30
Imports, annual %
change, base: previous
year
6.681754 12.57156 �21.5083 26.24329
GDP growth, annual
% change, Bulgaria
base: previous year
2.675573 3.610211 �5.646222 6.907381
GDP growth, annual
% change, developed
countries
2.805597 2.215915 �4.593135 4.963135
Final consumption,
annual % change
2.173989 6.736841 �15.34359 10.80616
Gross Capital forma-
tion, annual % change
147.5501 633.7145 �75.1252 2836.958
External balance on
goods and services,
current US$
�2,060,000,000 3,240,000,000 �10,800,000,000 1,440,000,000
Current account bal-
ance, % of GDP
�5.52795 7.830871 �24.323 3.886
Price index, imports of
goods and services
3.194444 7.71038 �12.9 14.9
Price index, exports of
goods and services
4.033333 8.796791 �17.8 21.1
Terms of trade 92.44 18.50 72.67 134.40
Sources: see Appendix
82 E. Spasova

4 Thirlwall’s Law: Methodology and Application
for the Bulgarian Case
Thirlwall’s Law, as has been defined in Eqs. (5) and (6), will be tested empirically
for the Bulgarian economy over the 1994–2013 period. The aim is to test whether
the balance-of-payments constrained growth model is able to explain the perfor-
mance of the Bulgarian economy over this period. In order to conduct that experi-
ment, import and export functions are specified in order to receive estimates of the
Source: World Bank, World Development Indicators, 2015
0.00
5,000,000,000.00
10,000,000,000.00
15,000,000,000.00
20,000,000,000.00
25,000,000,000.00
30,000,000,000.00
Imports of goods and services (constant 2005 US$)Exports of goods and services (constant 2005 US$)
Fig. 1 Exports and imports volumes, constant 2005 US$
Source: World Bank, World Development Indicators, 2015
-8
-6
-4
-2
0
2
4
6
8
199
4
199
5
199
6
199
7
199
8
199
9
200
0
200
1
200
2
200
3
200
4
200
5
200
6
200
7
200
8
200
9
201
0
201
1
201
2
201
3
GDP growth rate, Bulgaria
GDP growth rate, developed countries
Fig. 2 GDP growth, Bulgaria and developed world, % change, 1994–2013
The Balance-of-Payments Constrained Growth Model in Transitional Economy:. . . 83

income and price elasticities of demand of imports and exports which would
provide the necessary data for estimation of the sustainable growth rate provisioned
by the BPCG paradigm. The methodology used is based on the research of
Soukiazis et al. (2013b). The econometric calculations are done via Stata 13.
OLS and 2SLS regressions are used as tools.
4.1 Model Specification and Pre-Estimation Tests
4.1.1 Import Function
The basic equation of import function as specified by Thirlwall (2012) is:
M ¼ b PfE=Pdð ÞψYπ
The ratio of the import prices to export prices is basically the inverse terms of
trade (TOT), so the function is transformed to:
M ¼ b 1=TOTð ÞψYπ ð7Þ
Taking proportional rates of growth of the variables in Eq. (2), Setterfield (2011)
transforms the basic import function equation into:
m ¼ ψ pf þ e � pdð Þ þ πy ð8Þ
Considering Eqs. (7) and (8), we substitute the difference between the import
prices and export prices pf þ e � pdð Þ with the inverse change rates of terms of
trade.
Finally, the import equation used in this estimation is the following:
m ¼ πyt- ψtott ð9Þ
Small letters indicate growth rates of the variables. The expected value of the
income elasticity of demand of imports (π) is positive, while the price elasticity of
imports (ψ) is expected to be negative.
4.1.2 Export Function
The basic equation of the export function as specified by Thirlwall is:
X ¼ a Pd=PfEð ÞηZε
84 E. Spasova

After substituting Pd/PfE with TOT (terms of trade), the function is transformed
to:
X ¼ a TOTð ÞηZε ð10Þ
Taking growth levels of the equation variables results in:
xt ¼ ηtott þ εzt ð11Þ
The expected value of the income elasticity of demand of exports (ε) is positive,while the price elasticity of exports (η) is expected to be negative.
4.1.3 Pre-Estimation Tests
Before proceeding further, all the data to be used in the regression estimations is
taken in levels on annual basis. Annual values of the variables are used due to the
fact that quarterly data for some variables is not available. In order to ensure the
validity of the regression results, the variables are checked for non-stationarity.
Two tests are applied—Augmented Dickey-Fuller test and the test of Elliott
et al. (1996). The optimal lag order (Elliott-Rothenberg-Stock test) is calculated
by the Ng and Perron (1995) sequential t test on the highest order lag coefficient,
stopping when that coefficient’s p-value is less than 0.10.
Both tests show similar results. The tests fail to reject the null hypothesis of unit
roots for the data on final consumption and external balance of goods and services.
However, taking the first differences of the variables provides satisfactory results
(Table 2).
4.2 Regression Results and Conclusions
4.2.1 Empirical Test
The first step is to estimate separately each equation (of imports and of exports)
using OLS. The results of the regression model are shown in Table 3. The results for
the import and export functions reveal positive and statistically significant income
elasticities of demand. The estimated coefficient of the export income elasticity (ε)is 1.95 significant at 1% level, while the import income elasticity (π) is estimated to
1.88 significant at 1% level. Interestingly, the income elasticity of exports is higher
than the income elasticity of imports, which could be interpreted as a sign for a
gradual catching-up process characterizing the Bulgarian economy.
The estimated coefficients of price elasticities are also statistically significant.
Expectedly, the price elasticity of imports is negative. However, the export price
The Balance-of-Payments Constrained Growth Model in Transitional Economy:. . . 85

elasticity has a positive sign. The paradoxical shift in sign of the export price
elasticity deserves more attention.
On one hand, a positive relation between the price index of exports and export
volumes could be an indication of nominal convergence as a result of the trade
liberalization process in Bulgaria and the intensification of international relations.
Another point raised by Benacek et al. (2003) is the trade-off between quality and
price competitiveness. If the coefficient is statistically significant and negative, than
we could expect that decrease in export prices results in more purchases of exported
goods. The price fall would not be explained by decrease in quality, because it
would not result in more intensive exports. So, the export price change could be due
to increased cost competitiveness of the economy. On the other hand, a statistically
significant and positive coefficient of price elasticity would find an explanation in
the supply side—the positive correlation could be due to improvement in quality of
exports resulting in higher prices, but also higher volumes. If we analyse aggregated
data (as in the case of Bulgaria) the surprising positive sign could be explained by a
gradual transformation of the export structure towards higher added value pro-
ductions or by a process of convergence. However, detailed analysis and estimation
of the price elasticities of demand of exports according to sectors is needed to
identify the factors at play.
Table 2 Unit root test
Variable
Augmented Dickey–
Fuller test for unit roots
Elliott-Rothenberg-
Stock test (1996)
GDP growth, annual % change, Bulgaria
base: previous year
�3.486***
(0.0083)
�3.585**
Imports, annual % change, base: previous
year
�4.629***
(0.0001)
�4.513***
Exports, annual % change, base: previous
year
�2.663*
(0.0807)
�3.586**
GDP growth, annual % change, developed
countries
�2.740*
(0.0674)
�3.723***
Gross Capital formation, annual % change �2.212*
(0.0674)
�3.685**
Final consumption, annual % change �2.212
(0.2018)
�2.206
Final consumption, annual % change, first
difference
�4.224***
(0.0006)
�4.479***
External balance on goods and services, %
change, previous year
�1.424
(0.5706)
�1.393
External balance on goods and services, %
change, previous year, first difference
�3.170**
(0.0218)
�3.389***
Terms of trade, annual % change �3.068**
(0.0290)
�3.219*
Note: Listed test statistics and p-values in brackets; *, ** and ***—levels of rejection of the hull
hypothesis of unit root at 10%, 5% and 1% levels of significance, respectively
86 E. Spasova

The estimation of the import demand function gives statistically significant
coefficients of the expected sign. However, the import equation includes the growth
of domestic GDP which raises the question of possible endogeneity of national
income. The problem is addressed by Soukiazis et al. (2013a, b). In the first place, if
the import growth is higher than the export growth, this would create balance of
payments imbalances, which would result in lower economic growth. In this case,
growing imports would impact national income negatively. On the other hand, if
national imports consist of primary or investment goods, initial economic growth
could result in increased imports, but, at a second stage, these imports would
contribute to the further growing of the economy. In order to overcome the potential
threat of endogeneity, which would affect the consistency of the estimates, a second
regression technique is used for the import function. Using 2SLS model allows
inclusion of instrumental variables of national income. As instruments of GDP we
will use the growth rates of national consumption, of gross capital formation and the
second differenced change rates of external balance.
The 2SLS regression outcomes can be seen in Table 3. The estimates remain
significant and the reported p-values are better. Several post-estimation tests are run
Table 3 Estimation results, export and import demand functions, Bulgaria 1994–2013
Variable
OLS 2SLS
Exports Imports Imports
GDP growth, annual % change, developed
countries
1.949584***
(0.009)
Terms of trade, annual % change 0.7514564***
(0.003)
�.4075758*
(0.085)
�.3818717*
(0.074)
GDP growth, annual % change, Bulgaria 1.883809***
(0.003)
2.242322***
(0.000)
Observations 20 20 18
Adjusted R-squared 0.4736 0.3854
F(2,18) 10.00 7.27
Tests for autocorrelation
Durbin’s alternative test for autocorrela-tion (H0:no serial correlation)
Chi2¼ 0.255
(0.6138)
Chi2¼ 2.3471
(0.1255)
Breusch-Godfrey LM test for autocorre-lation, lags(1) (H0:no serial correlation)
Chi2¼ 0.2951
(0.5870)
Chi2¼ 2.427
(0.1193)
Breusch-Pagan/Cook-Weisberg test forheteroscedasticity
chi2(2)¼ 1.65
(0.4374)
Chi2(2)¼0.49
(0.7833)
Tests of overidentifying restrictions
Sargan statistic Chi2¼ 1.83257
(0.40)
Basmann statistic Chi2¼ 1.58689
(0.45)
#Weak instruments F(2,14)¼ 12.4081
Note: Listed estimated coefficients and p-values in brackets; *, ** and ***—levels of statistical
significance: 10%, 5% and 1% levels of significance, respectively
The Balance-of-Payments Constrained Growth Model in Transitional Economy:. . . 87

to check the validity of the instruments. Both Sargan and Basmann statistics
confirm their validity. The Wald F-statistic indicates that the instruments are strong
enough.
4.2.2 Application of Thirlwall’s Law to the Bulgarian Economy
The main results of the regression analysis are presented below in Table 4 together
with the calculation of Thirlwall’s Law according to formulas (5) and (6). Addi-
tionally, several averaged estimations of variables are presented in order to facil-
itate the comparative analysis.
The results clearly demonstrate that the actual growth rate of the Bulgarian
economy in the period of 1994–2013 is very close to the average level predicted by
Thirlwall’s Law regardless of its formulation. The actual rate of growth is 2.68% on
average, while the sustainable level of economic growth predicted by the BPCG
model is, respectively, 2.62% (“weak” Thirlwall’s Law) and 2.44% (Bertola’sformulation).
Considering that yb=z ¼ ε=π, it is interesting to see if the structure of Bulgarianexports and imports allows levels of economic growth consistent with catching-up
and convergence. The ratio between the income elasticities of exports and imports
is 1.95/2.24; a coefficient smaller than unity. It can be concluded that the current
structure of imported and exported goods and services does not allow accelerated
growth rates above the global level. On the contrary, with the present characteristics
of Bulgarian national production, the sustainable growth path of the economy is
further lagging behind the developed world.
These disappointing findings should be further analysed through a more detailed
overview of the structure of Bulgarian imports and exports. Traditionally the
exports of Bulgaria are concentrated in raw materials and primary products.
According to the statistics of the Bulgarian National Bank, in the 1995–2013 period
the raw materials account for nearly 45% of total exports (53.10% in 1995,
43.46% in 2013). The share of consumer goods in total exports is between
Table 4 Evaluation of the validity of Thirlwall’s Law for Bulgaria
Estimation
GDP growth, annual % change, Bulgaria average 1994–2013 2.68
Imports, annual % change, Bulgaria average 1994–2013 6.68
Exports, annual % change, Bulgaria average 1994–2013 5.86
GDP growth, annual % change, developed countries, average 1994–2013 2.81
Income elasticity of imports, Bulgaria, π (2SLS estimation) 2.24
Income elasticity of exports, Bulgaria, ε (OLS estimation) 1.95
Price elasticity of imports, Bulgaria, ψ (2SLS estimation) �0.38
Price elasticity of exports, Bulgaria, η (OLS estimation) 0.75
Thirlwall’s Law (weak): yb ¼ x=π 2.62
Thirlwall’s Law (Bertola formulation): yb ¼ zε=π 2.44
88 E. Spasova

26.11% (in 1995) and 23.40% (in 2013). The average share of consumer goods for
the whole period is 28.27%. The share of exported investment goods and energy
resources is considerably smaller (Fig. 3).
This information can be supplemented with data from the Ministry of Economy
and Energy of Bulgaria, according to which high-tech exports to other countries
represent only 6% of total exports. Only 4% of them are a result of production and
export specialization and have competitive advantage in international markets. The
export of medium- and low-technology products predominates (almost 70%), 64%
of them are a result of production and export specialization and have competitive
advantage on international markets. In short, although there are some trends of
restructuring of Bulgarian exports, these changes are very slow and the overall
profile of Bulgarian exports continues to be oriented towards low added value
products and low-tech industries. Transition from low to medium industries and
high-tech production would result in an increase in the income elasticity of exports
which would create preconditions for a more sustainable catching-up process and
export-led development.
Imports are mainly concentrated in raw materials, investment and energy
resources. This fact is easily explained considering the lack of considerable con-
ventional energy resources and the profile of Bulgarian industry oriented towards
services and the light industry sector. More interestingly, the share of imported
consumer goods constantly increases: in the years before the crisis, the share of
consumer goods ranges between 15% and 16%, while in the years after 2009 the
share increased to levels 20% of total imports, which signals the reluctance to
replace imported consumer goods with local substitutes (Fig. 4).
Except through structural changes affecting the export competitiveness of
Bulgaria, another opportunity for increasing the sustainable growth rate of an
economy is the devaluation of the national currency. The estimates on price
elasticities of imports and exports demonstrate that the Marshal–Lerner condition
is met. However, the sum of the absolute values of the elasticities is 1.13 which is
very close to unity. Possible devaluation of the Bulgarian lev probably won’t affect
Fig. 3 Bulgarian exports, end-use classification, 1995–2013, in million euros
The Balance-of-Payments Constrained Growth Model in Transitional Economy:. . . 89

the external positions of the country considerably and its effect would be limited
and short-lived.
5 Conclusion
The aim of the paper was to estimate the relevance of Thirwall’s Law for the
Bulgarian economy. The results indicate that the estimated average growth rate of
the economy is consistent with the actual registered level. However, several
worrying trends on Bulgarian economic growth were identified. In the first place,
it can be concluded that the negative difference between the average developed
world GDP and the Bulgarian GDP over the period is proof of the lagging behind of
the economy instead of convergence. This conclusion poses serious questions to the
eventual success of the so called transition period to market economy in Bulgaria.
This inference is confirmed via the tests of Thirlwall’s Law.Additionally, the estimates of the income elasticities of imports and exports
indicate structural problems of the national production which are factors for a lower
sustainable level of growth and reduced external competitiveness. Overview of the
historical data on the imports and exports structures shows certain progress in
overcoming the deficiencies, but the problems remain unsolved.
Though the balance-of-payments constraint to growth theory is part of the new
Keynesian paradigm, and, in this sense, it is demand-oriented; in fact this model
demonstrates the importance of the structure and efficiency of production of an
economy. The basic principles of the model clearly state that the productive
efficiency of exported goods ultimately determines the level of sustainable eco-
nomic development. In this sense, Thirlwall’s law reflects the opportunities for
export-oriented growth.
Fig. 4 Bulgarian imports, end-use classification, 1995–2013, in million euros
90 E. Spasova

The opportunities for export promotion facing an economy are as follows:
(1) Devaluation: considering that a currency board system has operated in Bulgaria
since 1997, the question of the level of the real exchange rate of the Bulgarian
lev to foreign currencies is a subject of conjecture. However, if we consider
devaluation as a tool for expenditure-switching policy, the Marshal–Lerner
condition should be implemented. Moreover, a number of economists have
pointed out that this step has a temporary effect and no long-term impact on the
current account. Also, a significant feature of the Bulgarian export is its low
level of technology and added value. This implies serious structural problems,
which would not be solved by devaluation—a step to improve only the price
competitiveness of exports.
(2) More capital flows: attracting foreign investments in the economy. Bulgaria has
experience in this direction and it is clear that the flow of investment may
provide only temporary coverage of current account deficits, if not concentrated
in the generation and development of productive capacity.
(3) Structural changes: Blecker (1998) defines three types of structural changes that
may increase the rate of growth of the economy without causing a deterioration
of the balance of payments: (1) an increase of production; (2) change in the
income elasticity of demand for imports; (3) change in the income elasticity of
demand for exports. Each of these changes requires a change of local produc-
tion towards sectors which are characterized by higher income elasticity;
improved non-price competitiveness of local production; industries oriented
to import-substitution. In short, economic policy must be directed towards a
gradual restructuring of the economy and promotion of sustainable growth
based on increased productivity and competitive exports by stimulating the
development of medium- and high-tech industries with high added value.
Appendix
Data Source of the data
GDP growth, annual % change,
Bulgaria base: previous year
International Monetary Fund, World Economic Outlook
Database, 2015
Imports, annual % change, base:
previous year
World Bank, World Development Indicators, 2015
Exports, annual % change, base:
previous year
World Bank, World Development Indicators, 2015
GDP growth, annual % change,
developed countries
International Monetary Fund, World Economic Outlook
Database, 2015, sample of 37 developed countries
Gross Capital formation, annual %
change
World Bank, World Development Indicators, 2015
Final consumption, annual %
change
World Bank, World Development Indicators, 2015
External balance on goods and
services, % change, previous year
World Bank, World Development Indicators, 2015
Terms of trade, annual % change World Bank, World Development Indicators, 2015, own
calculations
The Balance-of-Payments Constrained Growth Model in Transitional Economy:. . . 91

References
Bajo-Rubio O (2010) The balance-of-payments constraint on economic growth in a long-term
perspective: Spain, 1850-2000. Working papers on International Economics and Finance DEFI
10-10, Diciembre 2010
Bek€o J (2003) The validity of the balance-of-payments—constrained growth model for a
small economy in transition: The case of Slovenia. J Post Keynesian Econ 26(1):69–93
Benacek VL, Prokop L, Vısek JA (2003) Determining factors of the Czech foreign trade balance:
structural issues in trade creation. Working paper series No. 3/2003, Czech National Bank
Bertola L, Higachi H, Porcile G (2002) Balance-of-payments-constrained growth in Brazil: a test of
Thirlwall’s Law, 1890-1973. J Post Keynesian Econ 25(1):123–140
Blecker R (1998) International competitiveness, relative wages and balance of payment constraint.
J Post Keynesian Econ 20(4):495–526
Dixon RJ, Thirlwall AP (1975) A model of regional growth rates differences on Kaldorian lines.
Oxford Econ Pap 27:201–213
Elliott G, Rothenberg TJ, Stock J (1996) Efficient tests for an autoregressive unit root.
Econometrica 64:813–836
Hansen J, Kvedaras V (2004) Balance of payments constrained economic growth in the Baltics.
Ekonomika 65:82–91
Garcimartın C, Alonso JA, Rivas L (2012) Convergence and balance of payments constrained
growth: is there a puzzle? In: Soukiazis E, Cerqueira P (eds) Models of balance of payments
constrained growth: history, theory and empirical evidence. Palgrave Macmillan, Basingstoke,
pp 189–216
Kvedaras V (2012) Empirical testing of export-led and balance of payments constrained growth:
the case of Portugal. In: Soukiazis E, Cerqueira P (eds) Models of balance of payments
constrained growth. History, theory, evidence. Palgrave Macmillan, Basingstoke, pp 168–186
Leon-Ledesma MA (1999) An application of Thirlwall’s law to the Spanish economy. J Post
Keynesian Econ 21(3):431–439, M.E. Sharpe
Leon-Ledesma MA, Thirlwall AP (2002) The endogeneity of the natural rate of growth. Camb J
Econ 26(4):441–459, Oxford University Press
McCombie JSL (1985) Economic growth, the Harrod foreign trade multiplier and the Hicks super-
multiplier. Appl Econ 17(1):55–72
Ng S, Perron P (1995) Unit root tests in ARMA models with data-dependent methods for the
selection of the truncation lag. J Am Stat Assoc 90:268–281
Setterfield M (2011) The remarkable durability of Thirlwall’s law. PSL Q Rev Economia civile
64(259):393–427
Soukiazis E, Cerqueira PA, Antunes M (2013a) Growth rates constrained by internal and external
imbalances and the role of relative prices: empirical evidence from Portugal. J Post Keynesian
Econ 36(2):275–298, M.E. Sharpe
Soukiazis E, Muchova E, Lisy E (2013b) Slovak economic growth and the consistency of the
balance-of-payments constraint approach. J Econ Slovak Acad Sci 61(9):879–896
Thirlwall AP (1969) Okun’s law and the natural rate of growth. South Econ J 36(1):87–89
Thirlwall AP (1979) The balance of payments constraint as an explanation of international growth
rate differences. Banca Nazionale del Lavoro Q Rev 32:45–53
Thirlwall AP (1987)Keynes, economic development and the developing countries. In: Thirlwall AP
(ed) Keynes and economic development. Macmillan, London
Thirlwall AP (2012) Balance of payments constrained growth models: history and overview.
In: Soukiazis E, Cerqueira P (eds) Models of balance of payments constrained growth. History,
theory, evidence. Palgrave Macmillan, Basingstroke, pp 11–50
Verdoorn JP (1993) On the factors determining the growth of labor productivity. In: Pasinetti L
(ed) Italian economic papers, vol II. Oxford University Press, Oxford
92 E. Spasova

The Nexus Between Imports and National
Income in Turkey
€Ozcan Karahan and Olcay Colak
Abstract Nowadays the investigation of the relationship between import and
national income has been the major issue of many empirical studies in literature.
Keynesian Models traditionally argue that a rise in import decrease the net export
and hence aggregate demand as a basic source of economic growth, which implies a
negative causal relationship from import to national income. Contrarily, Endo-
genous Growth Models put forward that imports play a positive and promoting
role in a rise in real national income via technology transfer. Accordingly, imports
transfer new technologies embodied in capital and intermediate goods and thus spur
production productivity especially in developing countries. Consequently, Endo-
genous Growth Models advocate the import-led economic growth while Keynesian
Models assert import-led economic shrinkage. The aim of this paper is to test these
arguments concerning with the impacts of import on Turkish economy. We use
time series techniques based on Johansen co-integration and Granger causality tests
and Innovation Accounting Techniques for the quarterly data from 2002 to 2014.
Empirical findings indicate that there is a strong causality relationship from the
imports towards economic growth, supporting the argument of Endogenous Growth
Models. Thus, sustainable growth rates in Turkey need outward-looking policy
including not only exports but also import and policy covering the measures
supporting steadily financing of imports.
O. Karahan
Bandırma Faculty of Economics and Administrative Sciences, Balıkesir University,
10200 Bandırma, Turkey
e-mail: [email protected]
O. Colak (*)
Faculty of Economics and Administrative Sciences, Department of Economics,
Usak University, Usak, Turkey
e-mail: [email protected]
© Springer International Publishing Switzerland 2016
A. Karasavvoglou et al. (eds.), Economic Crisis, Development and Competitivenessin Southeastern Europe, Contributions to Economics,
DOI 10.1007/978-3-319-40322-9_6
93

1 Introduction
Economic growth is one of the most important economic indicators and the goal of
policy makers in any economy. Therefore, the sources of economic growth have
been a very popular subject in the economics literature at all times. Recently, deep
attention has been given to the link between foreign trade and economic growth.
Accordingly, the positive impact of international trade on economic growth has
been widely investigated empirically in different ways. It seems that most previous
investigation have mostly focused on the effect of the export expansion on eco-
nomic growth while little attention has been paid to identifying the impact of
imports on economic growth. However, some recent studies have shown that
there is a strong causal link between imports and economic growth especially in
developing countries. Thus, most of the studies now indicate that both the export
and import sectors can contribute to economic growth, which are called as “export-
led growth” and “import-led growth”, respectively.
Concerning with the link between foreign trade and economic growth, well-
known Keynesian multiplier model advocates the export-led growth as opposed to
import-led growth. Keynesian macroeconomic theory, paying detailed attention to
the demand side of the economy, suggests that increases in aggregate demand
boosts economic growth towards full employment level of output. Thus, any
increase in the components of aggregate demand like consumption, investment,
government expenditure and net export results in economic growth as much as the
increase in aggregate expenditure multiplied by the related expenditure multiplier.
It is clear from the Keynesian point of view that net exports, which equal exports
minus imports, positively affect the level of national income. An increase in exports
over imports will raise aggregate demand and economic growth while an increase in
imports over exports will reduce aggregate demand and economic growth. Accord-
ingly, there is a negative causal relationship from import to economic growth since
import decreases the total demand that is the basic sources of economic growth. In
other words, imports have a negative multiplier effect on output since imports like
saving represent a leakage from the aggregate demand. Thus, according to Keynes-
ian approach, import is often recognized as a leakage of total demand of which lead
to economic downturn while exports as an injection to total demand lead to
economic growth (Chen 2009, p. 128).
In line with the above thinking, mainstream studies have tended to rely on
econometric analysis focusing particularly on the correlation between exports and
economic growth. Indeed, based on this approach, the researches on relationship
between foreign trade and economic growth mostly focused on export-led growth.
There exist a vast literature on the relationship between foreign trade and economic
growth by focusing especially on export-led growth hypothesis. However, in recent
years, it seems that there has been much attention devoted to the role of import in
analyzing the link between foreign trade and economic growth. Researchers show
that expanded imports have also the potential to play a complementary role in
stimulating overall economic performance. Especially, Endogenous Growth
94 O. Karahan and O. Colak

Models has paid intensive attention to imports as a channel of technological
diffusion (Grossman and Helpman 1991; Coe and Helpman 1995) and hence a
significant source of economic growth. They have emphasized that imports has a
significant role as a channel for transferring of high production technology from
developed to developing countries.
Of course, import has a positive impact on productivity growth in developing
countries since firms can get the much more inputs like capital and intermediate
goods in order to produce much more. Thus, imports work for creating the appro-
priate conditions for growth through providing production requirements and equip-
ment. But, more importantly than this, imports has a vital role as a medium of
technology transfer on economic growth. Developing economies with limited
technological endowment can benefit from access to foreign technology via
imports. Accordingly, technological knowledge can be transmitted to developing
countries by being embodied in imported capital or intermediated goods. To this
respect, imports play crucial role in the process of international technological
spillovers (Keller 2002, 2004). It can be argued that the greater import volume
enhances the accumulation of more new production knowledge in a developing
country. Thus, by enhancing the technology spillovers, imported intermediate and
capital goods generate a trade benefit much more than only having access to more
input. In other words, increased imports have the potential to play a complementary
role in promoting economic development by increasing productive growth via
technology transfer (Lee 1995; Mazumdar 2002). Therefore, consistent with the
endogenous-growth literature, imports can be treated as a medium of technology
transfer which play significant role on long run economic growth.
In summary, Keynesian Theory asserts that imports as leakage of total demand
inversely affect to national income while Endogenous Growth Theory argues that
increased imports have the potential to play a significant role in promoting eco-
nomic growth via transfer of technology. From this point of views, the purpose of
this paper is to provide empirical tests of the hypothesis of Keynesian and Endo-
genous Growth Models concerning with the relationship between import and eco-
nomic growth. The rest of this article is organized as follows. Section 2 provides a
brief overview of literature on the link between import and economic growth.
Section 3 presents the data, methodology and empirical results. Section 4 concludes
and makes some policy implications.
2 Previous Literature
There are so many studies available investigating the relationship between foreign
trade and economic growth in literature. However, most of the previous studies
have focused on the effect of export expansion on economic growth while ignoring
the effect of imports on economic growth. Consequently, export-led growth
hypothesis has been widely documented from both a theoretical and empirical
point of view. Nonetheless, researchers recently start to concern with imports as a
The Nexus Between Imports and National Income in Turkey 95

significant dynamic of economic growth like export in analysing the link between
foreign trade and growth. Thus, while examining the trade-growth nexus, more
recent studies have focused on testing both the export-led and import-led growth
hypothesis jointly. In conclusion, there has been an increase in country-specific
studies focusing on the relationship among exports, imports and economic growth.
Concerning with developing Asian countries, Thangavelu and Rajaguru (2004)
investigated the relationship between foreign trade and productivity growth focus-
ing by using the multivariate co-integration test based on the Johansen-Juselius
method for annual data covering period from 1960 to 1996. They found significant
causal effects from import to productivity growth and hence presence of import-led
productivity growth in India, Indonesia, Malaysia, Philippines, Singapore and
Taiwan.
For the case of Malaysian Economy, Baharumshah and Rashid (1999) explored
the links among export, import and economic growth from 1974 to 1994 in the
Johansen Procedure and vector-error correction (VEC) model. They detected the
presence of a stationary long-run relationship between exports, imports and growth.
Thus they concluded that an important determinant of long-run growth in Malay-
sian Economy is outward-oriented development strategies which result in imports
of foreign technology. With regard to the case of The Republic of Korea, Kim
et al. (2010) investigated the relationship between exports, imports, and economic
growth in the framework of Johansen Cointegration and Granger causality tests and
impulse response functions by using quarterly data from 1980 to 2003. Results
indicated that imports have a significant positive effect on productivity growth
while disproving the export-led growth hypothesis. He argued that the notion of
desirable exports and undesirable imports may be misguided and counterproduc-
tive. He also made significant implications for policymakers that import liberal-
ization will bring about substantial benefits in the form of higher productivity and
economic growth.
In connection with transition economies in Europe, Awokuse (2007) analysed
the relationship between exports, imports and economic growth by employing
Johansen Cointegration Test and Granger Causality Test for different monthly
data set between 1993 and 2004. The results showed that import-led hypothesis is
valid for both Czech Republic and Poland. Furthermore, Awouke concluded that
the singular focus of many past studies on just the role of exports as the engine of
growth may be misleading or at best incomplete. Awokuse (2008) also tested the
import-led growth hypothesis for Latin American Economies in the framework of
Johansen Cointegration and Granger causality tests and impulse response functions
by using different quarterly data set between 1990 and 2002. Empirical results
confirm the significant role of imports in stimulating the economic growth of
Argentina, Colombia and Peru. Moreover, Awouke indicated that the strength of
imports on growth is relatively stronger than the effects of exports.
More recently, besides the studies testing the export-led and import-led growth
hypothesis jointly, researchers have focused on testing import-led growth hypo-
thesis separately and elaborately. Kogid et al. (2011) used the bivariate cointegration
and causality analysis based on the Engle–Granger two steps, Johansen and Toda-
96 O. Karahan and O. Colak

Yomamoto procedures to analyze the economic growth and the imports in Malaysia
from 1970 to 2007. The findings of this study showed that import has a paramount
important role in spurring the growth of the economy. Mishra (2010) attempted to
investigate the dynamics of the relationship between imports and economic growth
in India for the period 1970–2010 by using Johansen co-integration and Granger
causality tests. The study indicated the existence of long-run equilibrium relation-
ship between imports and real economic growth in India. Rahman and Shahbaz
(2013) investigated the impacts of imports on economic growth of Pakistan over the
period 1990 to 2010. They applied the structural break autoregressive distributed
lag (ARDL) bounds testing approach to examine the long-run relationship between
the growth and imports. Empirical results confirmed the import-led growth hypoth-
esis for Pakistan by indicating a strong causality running from imports to economic
growth.
Concerning with the studies specially focusing on Turkey, Ugur (2008) provided
an empirical test of the causal relationship between economic growth and imports
by using the Granger causality test and Impulse Response and Variance Decompo-
sitions Models for the monthly data set between 1994 and 2005. Evidence presented
in this study is clear that economic growth is significantly influenced by import.
Azgun and Servinc (2010) also analyzed effects of export and import on economic
growth in Turkey by using Engle Granger Causality Test for the period between
1998 and 2008. The findings obtained from this research shows that economic
growth in Turkey is more dependent on importing rather than exporting. Conclu-
sively, no findings could be reached as to support the export-led hypothesis while
import-led growth hypothesis is valid for Turkey. Moreover, it is concluded that
exporting itself grows based on importing. Ucak and Arısoy (2011) lastly attempted
to investigate the link between foreign trade and productivity growth for Turkish
Economy in the period of 1980–2007. Accordingly, they examined the relations
among exports, imports and the index of productivity per worker in manufacturing.
The findings suggested that both export and import growth contributes to produc-
tivity growth and thus the expansion of trade is an integral part of productivity
growth. Thus, besides export-led growth, significant causal effects were also found
from imports to productivity growth, suggesting import-led productivity growth.
Finally, they interpreted these results as strongly supportive of the role of endo-
genous growth models in explaining continuous growth in Turkey.
3 Data, Methodology and Empirical Results
In our complete econometric analysis, we try to examine the impact of imports on
Turkish Economy. Firstly, we check whether time series of national income and
imports are stationary or not. Then, long run relationship between imports and
economic growth is analysed by using Johansen Cointegration Test. Later, we
explore the causality from import to economic growth by operating Granger
Causality Test. Finally, Standard Innovation Accounting Techniques including
The Nexus Between Imports and National Income in Turkey 97

Impulse-Response Functions (IRFs) and Variance Decomposition (VDCs) is used
to produce the time path of the variables for presenting the relationship
between them.
Data set used in this paper cover the quarterly series of seasonally and calendar
adjusted imports (M) and Gross Domestic Product (GDP) of Turkey for
2002:1–2014:3 in Turkish Lira. The data set for both variables obtained by main
statistics of the Turkish Statistical Office (TURKSTAT) under National Accounts.
On the other hand each variable logarithmically transformed and summary statistics
for the series displayed in Table 1. According to Jarque-Bera statistics both series
normally distributed as the null hypothesis concerning the normal distribution of
the series could not be rejected. Standard deviations of both series are high as the
difference between their maximum and minimum values get larger.
3.1 Unit Root Test
Before proceed to the main analysis, stationary of the series are checked by the unit
root tests. In this context, Augmented Dickey-Fuller (ADF), and Phillips-Perron
(PP) unit root tests performed. Table 2 exhibits the results of the unit root tests. The
results of unit root tests do indicate that both variables are stationary when their first
differences are taken either with intercept or with intercept and deterministic trend.
Absolute values of ADF-test and PP-test are greater than MacKinnon critical values
at 1% significance level which means that null hypothesis of the non-stationary of
the series are rejected. It means that series are integrated at I (1) which indicates the
existence of long-run relationship or cointegration between the variables in
consideration.
Table 1 Summary statistics
M GDP
Number of observation 51 51
Mean 6839022.31 25008019.15
Median 6954589 25105839
Maximum 9261805 31546290
Minimum 3480947 17582703
Standard deviation 1539199 4089489.76
Skewness �0.4830 �0.1168
Kurtosis 2.3511 1.9957
Jarque-Bera (Prob.) 2.8782 (0.2371) 2.2593 (0.3231)
Source: Authors’ estimations
98 O. Karahan and O. Colak

3.2 Johansen Cointegration Test
In this section, presence of long-run relationship between import and gross domes-
tic product is checked by the methodology proposed by Johansen (1988) and
Johansen and Juselius (1990) that is based on system equation rather than single
equation co integration relationship. This methodology is based on maximum
likelihood estimation in which it allows for testing the long-run relationship
between the variables by using the maximum eigenvalue and trace statistics. Table 3
shows the Johansen cointegration test results by including linear trend. The null
hypothesis examines the cointegrating vector number which is stated by the rank
(r) equals zero of equal less than one. The null hypothesis of no cointegrating
relationship or no long-run relationship between import and gross domestic product
(r¼ 0) is rejected by the trace statistics and maximum eigenvalue statistics. The
critical values of these statistics are significant at 5% significance level which in
turn indicates that at least there is one cointegration or long-run relationship
between economic growth and imports do exist.
Table 2 Results of unit root tests
Variable
ADF (Intercept)
ADF (Trend
+ Intercept) PP (Intercept)
PP (Trend
+ Intercept)
Level 1st Dif. Level 1st Dif. Level 1st Dif. Level 1st Dif.
M �2.3276 �5.6914a �3.0654 �5.9949a �2.2713 �5.6914a �2.2035 �6.0097a
GDP �1.6153 �5.3975a �2.2946 �5.4318a �1.5334 �5.3975a �2.0805 �5.4069a
aindicates the significance level at 1%. Maximum lag length is specified by considering Akaike
Information Criterion (AIC)
Table 3 Johansen cointegration test results
Null
hypothesis Eigenvalue
Trace
statistics
0.05 Critical
value Probability
r ¼ 0 0.2976 17.7350 15.4947 0.0226
r � 1 0.0086 0.4252 3.8414 0.5143
Maximum
Eigenvalue
Statistics
r ¼ 0 0.2976 17.3097 14.2646 0.0160
r � 1 0.0086 0.4252 3.8414 0.5143
Optimum lag length is determined as 1 by using the minimum values of Likelihood Ratio (LR),
Final Prediction Error (FPE), Akaike Information Criterion (AIC), Schwarz Information Criterion
(SIC), and Hannan-Quinn Information Criterion (HQ). r indicates the number of ranks or
cointegrated vectors
The Nexus Between Imports and National Income in Turkey 99

3.3 Granger Causality Test
After indicating the presence of cointegration or long run relationship among the
variables, in this part of study we test the causality link between imports (M) and
growth (GDP). Granger causality test is carried out using block exogeneity Wald
tests (that use Chi-square test, X2) under VAR mechanism since Johansen
cointegration test indicates there is a long run relationship between imports and
economic growth. In estimating the VAR Model, variables of national income and
imports are added with their first differences. Estimation of proper lag length of
each endogenous variable are selected by lag length criterion like Likelihood Ratio
(LR), Final Prediction Error (FPE), Akaike Information Criterion (AIC), Schwarz
Information Criterion (SIC), and Hannan-Quinn Information Criterion (HQ).
Table 4 shows the results of lag length selection of VAR Model.
Since we deal with quarterly data set maximum lag length is chosen as eight.
Subsequently, lag order is selected to be 1 that satisfies the necessary minimum
value conditions by the four of five criterions. Then based on specified VAR model,
the VAR Granger Causality Test/Block Exogeneity Wald Test is operated. The
results of the test are exhibited in Table 5. Accordingly, the null hypothesis arguing
that imports (M) don’t Granger cause of income (GDP) is clearly rejected. On the
other hand, the null hypothesis asserting that income (GDP) doesn’t Granger causeof import (M) is accepted. As a result import (M) is decided to be the exogenous
Table 4 Lag length selection
Lag LR FPE AIC SIC HQ
0 NA 0.00000675 �8.5330 �8.4502a �8.5026
1 13.5228a 0.00000578a �8.6892a �8.4410 �8.5982a
2 1.3603 0.00000675 �8.5355 �8.1218 �8.3839
3 5.7044 0.00000696 �8.5080 �7.9288 �8.2957
4 1.9309 0.00000800 �8.3760 �7.6313 �8.1031
5 2.9022 0.00000892 �8.2792 �7.3690 �7.9456
6 5.9530 0.00000894 �8.2940 �7.2183 �7.8997
7 1.2284 0.0000106 �8.1490 �6.9078 �7.6941
8 2.6678 0.0000119 �8.0653 �6.6586 �7.5496aindicates lag order selected by the criterion
Table 5 Granger causality/Block exogeneity Wald test results
Dependent
variable
Excluded
variable Null hypothesis
χ2
(Prob.) Decision Result
M GDP GDP doesn’tGranger cause of M
0.2223
(0.6373)
Accepted GDP doesn’tGranger cause of M
GDP M M doesn’t Grangercause of GDP
6.6444
(0.0099)aRejected M Granger causes
of GDPaindicates the significance at 1%. Lag order selected to be 1 according to minimum values of LR,
AIC, SIC, FPE, and HQ
100 O. Karahan and O. Colak

part of the estimated VAR Model while income (GDP) is accepted as the endo-
genous part. In conclusion, the hypothesis arguing that of imports does not Granger
Cause economic growth is rejected at 1 per cent level of significance while the
hypothesis asserting that economic growth does not Granger cause imports is
accepted. In short, Granger Causality Test supports the import-led growth in
Turkey.
We also test whether the estimated VAR Model violates serial correlation,
constant variance and normality assumptions. According to LM-Test results
shown in Table 6, there is no serial correlation of the residuals of the VAR
Model up to lag 2 which yields the acceptance of null hypothesis of no serial
correlation among the residuals. The result of Jarque-Bera Normality Test indicates
that the residuals of the VARModel are normally distributed. Heteroskedasticity of
the residuals are checked by the White Test by including cross-terms and without
cross terms. Results show that there is no heteroskedasticity among the residuals of
the VAR Model in terms of cross terms and without cross terms. Finally, stability
condition of the VARModel is checked by autoregressive roots (AR). Accordingly,
there are two real roots; one is positive and the other one is negative with two
modulus. The results indicate that both roots do not lie outside the unit circle which
in turn satisfies the stability condition of the VAR Model.
3.4 Impulse-Response Function and VarianceDecomposition Analysis
In this section, the relationship between import (M) and gross domestic product
(GDP) will also be examined by using the Innovation Accounting Techniques
proposed by Litterman (1979). Accordingly, based on the estimated VAR models,
Impulse-Response Functions (IRFs) and Variance Decompositions (VDCs) ana-
lyses are computed to indicate the causality relationship from import to economic
growth.
The results of Impulse-Response Functions for GDP are displayed in Fig. 1.
Vertical axis of each graph represents the direction of the response function and
Table 6 Residual and stability check
LM-Test
Jarque-Bera normality
test (Prob.)
White test (χ2)VAR Stability
condition
No cross
terms
Cross
terms Root Modulus
LM (1)¼ 4.6741
(0.3224)
χ2(4)¼ 7.7507
(0.1207)
12.8665
(0.1289)
13.7914
(0.1687)
0.2564 0.2564
LM (2)¼ 1.7473
(0.7821)
�0.2192 0.2192
Note: p-values are given in brackets
The Nexus Between Imports and National Income in Turkey 101

magnitude in percentage term while horizontal axis shows the number of periods.
The dashed lines display the confidence interval by� 2 standard deviations. Left
panel of Fig. 1 shows the response of GDP to the one standard deviation shocks that
come from M. This graph indicates that there is significant response by GDP to the
shock comes from M. The positive effect or response of GDP to M remains until
second quarter and after second quarter the effect of shock disappears. Thus, it can
be concluded that import positively affects GDP and hence economic growth rate.
The findings for Variance Decomposition of GDP are given in Table 7. By
performing VDCs variables are ordered according to Cholesky ordering and the
maximum length of the period is taken to be ten. Almost 60% of shocks that come
to M would explain the error variance of GDP by the second period which in turn
indicates that import affects significantly GDP. These results of Variance Decom-
position of GDP are consistent with the causality from import to GDP. Overall, the
findings derived from Innovation Accounting Techniques including both Impulse-
Fig. 1 Impulse-response functions
Table 7 Variance
decompositions resultsVariance Decompositions of GDP
Periods S.E. M GDP
1 0.019114 52.54937 47.45063
2 0.020937 60.12193 39.87807
3 0.020977 60.16422 39.83578
4 0.020984 60.18809 39.81191
5 0.020984 60.18849 39.81151
6 0.020984 60.18858 39.81142
7 0.020984 60.18858 39.81142
8 0.020984 60.18859 39.81141
9 0.020984 60.18859 39.81141
10 0.020984 60.18859 39.81141
Cholesky Ordering: M, GDP
102 O. Karahan and O. Colak

Response Functions and Variance Decompositions analyses suggest that a shock in
import (M) has significant effect on economic growth (GDP), supporting to import-
led growth.
4 Conclusion
It has been long argued in the literature that international trade promotes economic
growth. Relating this link between trade and economic growth, Keynesian Multi-
plier Theory argued that imports as a leakage from total demand lead to economic
shrinkage while exports as an injection to total demand lead to economic growth.
Thus, Keynesian approach has supported to export-led hypothesis while completely
rejecting the import-led hypothesis. On the contrary, Endogenous Growth Theory
has argued that economic growth can be driven by imports since imports have a
significant potential to be a channel for foreign technology to flow into the domestic
economy. Thus increased imports play a complementary role, besides increasing
the amount of input, in promoting economic growth. Accordingly, new techno-
logies embodied in imports of capital and intermediate goods can increase the
productivity growth over time.
In the line with these arguments, we tested the relationship between import and
economic growth in Turkey using Johansen co-integration and Granger causality
tests and Innovation Accounting Techniques for the quarterly data from 2002 to
2014. Empirical results assert that Turkish experience does give support to the
import-led growth hypothesis in both short-run and long-run. In other words, the
findings of this study show that in the case of Turkey, import has a paramount
important role in spurring the growth of the economy. Thus, our findings bear out
the implications of Endogenous Growth Theory with relate to link between import
and economic growth. The results, hence, indicated imports as a medium of
technology transfer which play more significant role on long term economic
growth. Accordingly, this study also shows that import will be able to an important
mean to break the bottleneck of technological development for developing coun-
tries. Therefore, outward-looking policy including not only export but also import
is essential for effective growth policies. Furthermore, the policy adjustments to
promote economic growth should also include the measures supporting permanent
finance of import.
References
Awokuse TO (2007) Causality between exports, imports and economic growth: evidence from
transition economies. Econ Lett 94:389–395
Awokuse TO (2008) Trade openness and economic growth: is growth export-led or import-led?
Appl Econ 40:161–173
The Nexus Between Imports and National Income in Turkey 103

Azgun S, Servinc H (2010) Are imports a reason of growth? Evidence from Turkey. Soc Sci 5(2):
60–69
Baharumshah AZ, Rashid S (1999) Exports, imports and economic growth in Malaysia: empirical
evidence based on multivariate time series. Asian Econ J 13(4):389–406
Chen H (2009) A literature review on the relationship between foreign trade and economic growth.
Int J Econ Financ 1(1):127–130
Coe T, Helpman E (1995) International R&D slipovers. Eur Econ Rev 39:859–887
Grossman G, Helpman E (1991) Innovation and growth in global economy. MIT Press, Cam-
bridge, MA
Johansen S (1988) Statistical analysis of cointegration vectors. J Econ Dyn Control 12:231–254
Johansen S, Juselius K (1990) Maximum likelihood estimation and inferences on cointegration-
with applications to the demand for money. Oxf Bull Econ Stat 52:169–210
Keller W (2002) Trade and the transmission of technology. J Econ Growth 7:5–24
Keller W (2004) International technology diffusion. J Econ Lit XLII:752–782
KimS, LimH, Park D (2010) Could imports be beneficial for economic growth: some evidence from
Republic of Korea? ERDWorking paper series, No. 13
Kogid M, Mulok D, Ching KS, Lily J (2011) Does import affect economic growth in Malaysia.
Empir Econ Lett 10(3):297–307
Lee W-J (1995) Capital goods imports and long-run growth. J Dev Econ 48:91–110
LittermanRB (1979) Techniques of forecasting using vector autoregressions. Federal Reserve Bank
of Minnepolis, Working paper No. 115
Mazumdar J (2002) Imported machinery and growth in LDCs. J Dev Econ 65:209–224
Mishra PK (2010) The dynamics of the relationship between imports and economic growth in
India. South Asian J Macroecon Public Financ 1(1):57–79
Rahman MM, Shahbaz M (2013) Do imports and foreign capital inflows lead economic growth?
Cointegration and causality analysis in Pakistan. South Asia Econ J 14(1):59–81
Thangavelu SM, Rajaguru G (2004) Is there an export or import-led productivity growth in rapidly
developing Asian Countries? A multivariate VAR analysis’. Appl Econ 36:1083–1093
Ucak H, Arısoy I (2011) An analysis of causality among productivity, export and import in
Turkish economy. Ege Acad Rev 11(4):639–651
Ugur A (2008) Import and economic growth in Turkey: evidence from multivariate VAR analysis.
J Econ Bus IX(1–2):54–74
104 O. Karahan and O. Colak

Part II
Interaction Between Competitiveness
and Innovation: Evidence from
South-Eastern European Countries
Jelena Stankovic, Vesna Jankovic-Milic, and Marija Dzunic
Abstract The traditional doctrine of classical economic theory mostly considers
economic growth and competitiveness at the level of the national economy. The
problem of competitiveness within this stream of economic theory is mainly
approached as the need to find the answers why some countries develop faster
and become richer than others, i.e. how an economy gains the ability of sustainable
growth, which makes it more competitive than others. In contrast to this point of
view, the neoclassical economic theory shifts the focus of the research of growth
and competitiveness from the national economy to the field of resource allocation
and enterprise efficiency. The logic is simple—competitive enterprises make com-
petitive economy and vice versa, competitive economy creates an environment that
encourages the competitiveness of enterprises. The research concept of this paper is
based on the synthesis of these two approaches.
The aim of the paper is to evaluate the importance of innovative activity in
improving competitiveness. The paper provides a comparative analysis of the
competitiveness of the Balkan countries, with special attention to determining the
correlation between the indicators of innovative activities and the competitiveness
of the observed countries. For the purpose of this analysis, a method of dependency
analysis has been applied, as well as correlation analysis. Then, the analysis of the
results of empirical survey on innovation activities of enterprises in Serbia is
performed. It is pointed out to the lack of innovation activities in enterprises in
Serbia as one of the main causes of their low competitiveness.
1 Introduction
In terms of globalization and the increasing integration of markets, competitiveness
is a prerequisite of success in the global market. However, the assessment of
competitiveness is a complex process. As it requires a vast amount of
J. Stankovic (*) • V. Jankovic-Milic • M. Dzunic
Faculty of Economics, University of Nis, Nis, Serbia
e-mail: [email protected]; [email protected];
© Springer International Publishing Switzerland 2016
A. Karasavvoglou et al. (eds.), Economic Crisis, Development and Competitivenessin Southeastern Europe, Contributions to Economics,
DOI 10.1007/978-3-319-40322-9_7
107

macroeconomic and microeconomic knowledge, different approaches in defining
the concept of competitiveness have appeared in the literature. Some authors
identify competitiveness with comparative advantages, while others insist on
wider framework for determining the level of competitiveness. Most authors regard
competitiveness as a multidimensional and dynamic concept, considering that the
attributes of competitiveness are subject to change in different periods and condi-
tions (Spence and Hazard 1988). Finally, the concept of competitiveness can be
discussed at the level of products, enterprises, industries, clusters, regions, and
national economies, unions of countries or even continents.
The most common approach to competitiveness assessment is based on tradi-
tional doctrine of classical economic theory and analyses competitiveness and
economic growth at the national economy level. The aim of such analysis is to
explain why some countries gain competitive advantage, develop faster and
become richer compared to others. In other words, the focus is on identifying the
determinants of growth and competitiveness, as well as on their measurability. The
Gross Domestic Product (GDP) is the most commonly used indicator of growth.
The main reason for prevalence and acceptance of GDP as an indicator of growth
and competitiveness is the existence of an operational definition and methodology
for measuring the GDP uniformly accepted all over the world. However, current
literature points out that the GDP is a necessary, but not sufficient indicator in
evaluating successes and failures of the development process. There are opinions
that too much attention is paid to GDP growth rates, while other indicators are
underrepresented: inflation, fiscal balance, the current account, measures of
inequality, etc. For example, some authors analyze the relationship between level
of development and foreign direct investments (Lankauskiene and Tvaronaviciene
2011). There are no widely accepted and regularly observed indicators of measur-
ing the development process through acceleration or slow-down of technical
progress (Kornai 2010). Based on the fact that GDP is not always the most relevant
indicator of the competitiveness of a country, the paper aims to demonstrate that, in
the case of the South-Eastern European countries (SEE), there is no correlation
between GDP and GCI (Global Competitiveness Index), which implies the need to
include additional indicators into the analysis of the competitiveness of these
countries.
Since there is a real need for complementing GDP as a measure of growth with
indicators that reflect other aspects of welfare and development, scientific and
professional efforts of economists and economic statisticians are aimed at
complementing the data on aggregate output with various indicators of health,
education, income distribution, etc. (Kornai 2010). Such example is the invitation
of the President of the French Republic addressed to a group of economists and
statisticians, chaired by Joseph Stiglitz, Amartya Sen and Jean-Paul Fitoussi, to
work on new proposals for improving the measurement of growth and development
(see Stiglitz et al. 2009). It is evident that institutional and structural changes as well
as technological progress and innovation are unambiguously relevant for improving
competitiveness. Special attention in recent literature is paid to analysis of innova-
tive activities and the innovation process, i.e. the problems of diffusion and leaders
108 J. Stankovic et al.

and followers in the innovation process (Davila et al. 2006). Neo-Schumpeterian
approach to international competitiveness focuses on the process of creating tech-
nological competitiveness, which implies a sustainable increase in the share of
world trade for those whose innovative efforts are most successful (Cantwell 2003).
The importance of competitiveness at the macro level stems from the fact that
stable institutional framework and adequate macroeconomic policy creates a solid
foundation for economic progress. However, wealth is created at the micro level,
i.e. the level of enterprises, which produce goods and services that consumers value,
using efficient production methods (Golubovic and Dzunic 2012). In this frame-
work the factors that influence competitiveness may be grouped into several
categories: resources or capabilities, institutions, markets or demand conditions,
and inter-company networks (Mowery and Nelson 1999). Enterprises have to
fortify their competitive strategy, in terms of the transition from competition
based on comparative advantages (low wages and cheap natural resources) to the
competition based on competitive advantages, arising from the uniqueness of the
product and the production process. This competitive advantage is obtained through
continuous improvement of products and processes, which stems from a well-
designed and properly conducted innovation activities.
Through a synthesis of different approaches to the analysis of the competitive-
ness of Serbian economy, as well as the competitiveness of Serbian enterprises, the
paper evaluates the importance of innovative activity in improving competitive-
ness. The paper provides a comparative analysis of the competitiveness of the
Balkan countries, with special attention to determining the correlation between
the indicators of innovative activities and the competitiveness of the observed
countries. It is pointed out to the lack of innovation activities in enterprises in
Serbia as one of the main causes of their low level of competitiveness.
2 Theoretical Background of Competitiveness Assessment
Measuring national competitiveness has been a controversial issue from the very
beginning, ever since the first composite indices have been constructed for this
purpose. As a response to the increasing interest of policy makers, numerous
research institutions, analysts and consultants have taken on to the task of providing
solutions for benchmarking competitive performance of different countries.
The main problem of measuring national competitiveness stems from the fact
there is no widely accepted definition of this concept and no consensus about
whether improving competitiveness is the right strategy. According to Krugman
(1994), not only there is no sense in the meaning of the word competitiveness, whenapplied to national economy, but it is “a dangerous and wrong obsession”. He
explains that leading countries of the world do not compete with each other and that
most economic difficulties do not come from foreign competition, but are home-
made. However, this “growing obsession with competitiveness” could easily be
responsible for trade wars, protectionism and wasting taxpayers’ money for
Interaction Between Competitiveness and Innovation: Evidence from South. . . 109

enhancing competitiveness. Opposing scholars claim that countries do compete
against each other (Dunn 1994) and that country’s economy is the source of
economic means they need to achieve political interests, as well as a source of
attractiveness as a location for international business, the strength of national
currency, and in the end—economic and political power and influence.
This debate is of major importance for measuring competitiveness. Countries are
bound to compare themselves in achieving the mentioned goals. The indicators
used need to correspond to the underlying economic features. It is very difficult to
measure competitiveness using only one indicator, since it cannot be determined by
one isolated factor. Instead, there are many factors that affect macroeconomic
performance—productivity, innovation, political stability, education, etc. This is
the main reason for constructing composite indices, as complex measures that
include several groups of indicators. The main advantage of such indicators is
that they can summarize multi-dimensional process into single number, which
enables comparison between countries and measuring progress over time. How-
ever, summarizing complex and often elusive processes into a single measure used
for benchmarking countries’ performance, if poorly constructed, can be misleading
(OECD 2008). Also, there are many moments in the process of constructing such
indices where subjective judgments are in place, the results may be misused, or
subject to political interpretations.
Beside acknowledged analytical, methodological and quantitative weaknesses,
the most widely used index of competitiveness is the World Economic Forum’s(WEF) Global Competitiveness Index (GCI). Since 2005, WEF constructs the
Global Competitiveness Index (GCI) as a “measure of competitiveness and a tool
for evaluating the microeconomic and macroeconomic foundation of national
competitiveness”. In accordance with the requirements contained in the GCI, the
term competitiveness itself is defined “as the set of institutions, policies, and factors
that determine the level of productivity of a country” (Schwab 2012).
GCI takes into account the large number of different components of competitive-
ness, which are grouped into 12 pillars of competitiveness. These pillars are
grouped into the tree sub-indexes, which are organized as follows (Schwab 2012):
1. Sub-index—Basic requirements that involves the following pillars: (1) Insti-
tutions, (2) Infrastructure, (3) Macroeconomic stability and (4) Health and
primary education;
2. Sub-index—Improving efficiency which includes pillars such as: (5) Higher
education and training, (6) Goods market efficiency, (7) Labour market effi-
ciency, (8) Financial market sophistication, (9) Technological readiness and
(10) Market size;
3. Sub-index—Innovative and sophisticated factors, which include pillars:
(11) Business sophistication and (12) Innovation.
The significance of each sub-index in the GCI is defined by a certain weight,
which varies depending on the stage of development of the economy of the country
observed. The stage of development is determined by the level of the GDP per
capita.
110 J. Stankovic et al.

The Global Competitiveness Report 2012–2013 (World Economic Forum)
includes a total of 144 countries in the analysis. All countries have been categorised
into five groups, according to GDP per capita. The sample used in the paper
includes 12 countries of South-Eastern Europe: Albania, Bosnia and
Herzegovina, Bulgaria, Croatia, Greece, Hungary, FYROM, Montenegro, Roma-
nia, Serbia, Slovenia and Turkey (Table 1).
The data from Table 1 clearly indicate that countries that achieve the highest
GDP pc belong to the group of countries whose key factor in the development is
innovation. Economists specializing in comparative economics draw the attention
to the strong causal relationship between the specific properties of a system, as well
as stage of development and the characteristics of technical progress (Balcerowicz
1995). The countries in the lower stages of development may rely to a greater extent
on increasing productivity through the adoption of modern technologies from the
high-developed countries. On the other hand, in high-income countries, this
approach is not sufficient and can not provide the expected increase in productivity.
Companies in high-income countries need to design and develop cutting-edge
products and processes in order to maintain a competitive advantage and achieve
greater added value. This kind of progress requires an environment that largely
supports innovation activities, which involves continuous investment in research
and development, primarily in the private sector, the existence of high-quality
scientific research institutions that are able to generate the necessary knowledge
to develop new technology, intensive cooperation in research and technological
development between universities and industry, as well as the protection of intel-
lectual property.
Table 1 Income thresholds for stages of development of SEE countries
Stage of development
Stage 1:
Factor-
driven
Transition from
stage 1 to stage
2
Stage 2:
Efficiency-
driven
Transition from
stage 2 to stage
3
Stage 3:
Innovation-
driven
GDP per capita
in US$
<2000 2000–2999 3000–8999 9000–17,000 >17,000
SEE countries
included in
sample
– – Albania
Bosnia and
Herzegovina
Bulgaria
FYROM
Montenegro
Romania
Serbia
Croatia
Hungary
Turkey
Greece
Slovenia
Total in the
sample
(12 countries)
0 (0.00%) 0 (0.00%) 7 (58.33%) 3 (25.00%) 2 (16.67%)
Source: World Economic Forum, The Global Competitiveness Report (2012–2013)
Interaction Between Competitiveness and Innovation: Evidence from South. . . 111

3 Statistical Analysis of the Indicators Within the Global
Competitiveness Index of Serbia and the SEE Countries
Looking at the period after 2006, it can be concluded that most of the SEE countries
increased their competitiveness in terms of increasing the score of the GCI. At the
same time, the SEE region did not achieve exceptional results in improving
competitiveness.
Despite the fact that the scores of GCI of these countries recorded an increase,
these countries are still below the EU average and the world average (Fig. 1).
Statistical analysis of the indicators of the competitiveness of the SEE countries is
aimed at identifying the main areas for improvement. Special attention will be paid
to the analysis of innovative activities.
Table 2 shows the scores of GCI and their sub-indices for observed countries in
2012. It can be seen that Turkey has the highest score of GCI in 2012 (4.45). The
competitiveness of this country is above the EU average for 2012. The least
competitive country in this sample is Greece (3.86).
During the period 2006–2012, Serbia recorded an increase in its score by almost
0.5, from 3.38 to 3.87. However, this increase was not sufficient to improve Serbia’sranking, which shows that other countries were more successful. This faces Serbia
with the task of strengthening the efforts towards improving competitiveness (Savic
2012).
Descriptive statistics of GCI score and his sub-indices is presented in the Table 3.
According to the results presented in this table, it can be concluded that the lowest
average score for SEE countries belongs to the sub-index Innovative and sophisti-cated factors (3.4). This supports the fact that components of this pillar need to be
better managed in order to improve competiveness (Table 4).
Reason for attributing greater importance to the sub-index Innovative andsophisticated factors is a high correlation between this sub-index and GCI in SEE
countries. This statement is confirmed by a value of Pearson correlation coefficient
that is 0.793, which means that there is a high positive, statistically significant
4.22 4.19 4.214.17 4.18 4.20 4.20
4.77 4.74 4.754.69 4.70 4.71 4.74
4.07
3.984.03 4.02
4.10 4.11 4.10
3.80
3.90
4.00
4.10
4.20
4.30
4.40
4.50
4.60
4.70
4.80
2006 2007 2008 2009 2010 2011 2012
World
EU
SEE
Fig. 1 Average score of GCI for period 2006–2012
112 J. Stankovic et al.

Table 2 Scores of GCI and sub indices for Balkan countries in 2012
Country GCI score Sub index I Sub index II Sub index III
Albania 3.91 4.24 3.80 3.11
Bosnia and Herzegovina 3.93 4.33 3.75 3.28
Bulgaria 4.27 4.63 4.18 3.30
Croatia 4.04 4.68 4.01 3.39
Greece 3.86 4.13 4.05 3.37
Hungary 4.30 4.78 4.32 3.68
FYROM 4.04 4.52 3.85 3.13
Montenegro 4.14 4.49 3.39 3.57
Romania 4.07 4.22 4.12 3.20
Serbia 3.87 4.15 3.83 2.96
Slovenia 4.34 5.05 4.25 4.02
Turkey 4.45 4.75 4.42 3.79
Source: World Economic Forum, The Global Competitiveness Report (2012–2013)
Table 3 Descriptive statistics of GCI and sub indices for SEE countries in 2012
Minimum Maximum Mean Standard deviation
GDPpc 3992 27073 11143.67 7658.153
GCI score 2012 3.86 4.45 4.1017 0.19867
Sub-index I 4.13 5.05 4.4975 0.29036
Sub-index II 3.39 4.42 3.9975 0.28867
Sub-index III 2.96 4.02 3.4000 0.31040
Source: World Economic Forum, The Global Competitiveness Report (2012–2013), authors’calculations
Table 4 Correlation matrix between the sub-index and GCI
GCI score Sub index I Sub index II Sub index III
GCI score Pearson Correlation 1
Sig. (2-tailed)
Sub index I Pearson Correlation 0.853a 1
Sig. (2-tailed) 0.000
Sub index II Pearson Correlation 0.618b 0.501 1
Sig. (2-tailed) 0.032 0.097
Sub index III Pearson Correlation 0.793a 0.819a 0.471 1
Sig. (2-tailed) 0.002 0.001 0.122
Source: World Economic Forum, The Global Competitiveness Report (2012–2013), authors’
calculationsaCorrelation is significant at the 0.01 level (2-tailed)bCorrelation is significant at the 0.05 level (2-tailed)
Interaction Between Competitiveness and Innovation: Evidence from South. . . 113

correlation between GCI scores and scores of sub-index Innovative and sophisti-cated factors in these countries.
Bearing in mind the fact that stage of development determines the level of the
GDP per capita, the data presented in Table 5 provide comparative view of the
competitiveness level according to the stage development. Although it was
expected that the countries at a higher development stage are more competitive,
the results shown in Table 5 deny this expectation. The highest average GCI score is
achieved by the countries in transition from the stage 2 to the stage 3.
In order to test the dependence between level of competitiveness and develop-
ment stage Chi-square test has been performed. Results presented in Table 6
(significance 0.389) show that there is no dependence between competitiveness
and development stage in observed countries in 2012.
4 Analysis of Innovative (In)activities of Enterprises
in Serbia
Based on the analysis presented in the previous section, it is clear that one of the
main reasons for low competitiveness scores of Balkan countries is stagnation of
indicators that determine innovation. The indicators of innovation in Serbia are in
significant decline. In comparison to the SEE countries, the scores of Serbia are
below the average level (Fig. 2).
The score of pillar Innovation for Serbia is constantly declining during the
period 2007–2012, except in 2008. This score for Serbia was above the average
Table 5 Average GCI scores
according to development
stage
Development stage N Mean Minimum Maximum
Stage 2 7 4.0329 3.87 4.27
Transition 2–3 3 4.2633 4.04 4.45
Stage 3 2 4.1000 3.86 4.34
Total 12 4.1017 3.86 4.45
Source: World Economic Forum, The Global Competitiveness
Report (2012–2013). Authors’ calculations
Table 6 Chi-Square test results for dependence between competitiveness and development stage
Value Degrees of freedom Asymp. Sig. (2-sided)
Pearson Chi-Square 21.143 20 0.389
Likelihood Ratio 20.258 20 0.442
Linear-by-Linear Association 0.838 1 0.360
N of valid cases 12
Source: World Economic Forum, The Global Competitiveness Report (2012–2013), authors’calculations
114 J. Stankovic et al.

score for SEE countries in 2007 and 2008, while it is 9.94% lower in 2012.
Compared to the EU and world average, the scores are very low (Table 7).
Although the lack of innovative activities causes low competitiveness at the
national level, the causes should be sought through the analysis of innovative
activities of enterprises. Namely, many authors (Baumol et al. 2007; Phelps
2008) put a heavy emphasis on entrepreneurship and private sector in explaining
the virtues of developed and competitive economies. Even though not all entre-
preneurs are innovators (Baumol and Schilling 2008), an extremely important group
are the entrepreneurs engaged in the process of innovation. In economic theory,
since Joseph Schumpeter’s theory of development and the nature of capitalism,
innovative entrepreneurship is seen as one of the driving forces of growth, devel-
opment and improvement of competitiveness (Heertje 2006). Innovative entre-
preneurship is a function, a role, which can be fulfilled by an individual alone or
by teaming up with one or more partners, or with the support of a small firm. As
well, a large enterprise can be treated as an entrepreneur in terms of fulfilling its role
of innovative entrepreneur. The main point is that the entrepreneur is the one who
brings together the necessary financial and personal conditions that the innovation
3.11
3.063.04
3.06 3.06 3.06
3.12
3.083.09
2.98
2.93
2.9
2.81
2.75
2.80
2.85
2.90
2.95
3.00
3.05
3.10
3.15
2006 2007 2008 2009 2010 2011 2012
SEE
Serbia
Fig. 2 Scores of pillar Innovation for Serbia and Balkan countries
Table 7 Scores of pillar innovation—comparative analysis
Serbia SEE EU World Serbia/Balkan Serbia/EU Serbia/World
2006 n/a 3.11 3.99 3.41 n/a n/a n/a
2007 3.08 3.06 4.04 3.43 0.68% �23.76% �10.20%
2008 3.09 3.04 3.99 3.40 1.67% �22.56% �9.12%
2009 2.98 3.06 3.96 3.38 �2.45% �24.75% �11.83%
2010 2.93 3.06 3.96 3.34 �4.35% �26.01% �12.28%
2011 2.90 3.06 4.05 3.36 �5.33% �28.40% �13.69%
2012 2.81 3.12 4.15 3.40 �9.94% �32.29% �17.35%
Source: World Economic Forum, The Global Competitiveness Report (2012–2013), authors’calculations
Interaction Between Competitiveness and Innovation: Evidence from South. . . 115

calls for, in other words, the human resources, the physical instruments and
financial resources essential to the activity (Baumol 2002). Moreover, one must
not disregard the fact that the innovations are the result of decentralized initiatives,
i.e. successful implementation of innovative solutions means that the innovators do
not have to ask for permission from their superiors to work on a special direction of
an innovative action (Acemoglu et al. 2007).
It can be concluded that in order to enhance the innovative activity at the
national level, it is necessary to encourage private sector, entrepreneurs, human
resources in R&D departments and every individual with an initiative.
In order to complete the analysis of the competitiveness of the Serbian economy,
in the next part of the paper attention shall be paid to the research of innovative
activities of enterprises in Serbia.
5 Research Aim and Results
The survey1of Serbian enterprises was conducted in 2012, with the aim to collect
information about their opinion on a range of issues related to the problems and
prospects of their business, but also to the role of institutions in creating a business
friendly environment that would contribute to improving the competitiveness of
enterprises. A part of the questionnaire was related to issues of innovation activities
in enterprises, investments in research and development and human resource
potential of these departments.
The research included 240 enterprises in Serbia with 23,564 employees. Enter-
prises in the sample belong to the following sectors: (1) industry, (2) construction
and (3) service sector (Fig. 3). Most of the enterprises in the sample (71%) belong
to the field of industrial production. The ownership structure of the companies in the
sample includes all forms of ownership that currently exist in Serbia (Fig. 3). The
largest share of enterprises in the sample (66%) is owned by private individuals.
71%
24%
5%
Industry
Services
Construction
7% 1%
66%
13%13%
State ownership
Public ownership
Ownership of private
individuals
Ownership of other legal
entities
Foreign ownership
Fig. 3 The structure of the sample by branch and ownership
1The survey “BAS Poll—Opinion of the Business Community” was conducted in the organization
of Society of Economists of Nis, Serbia and it was a project financed by LEDIB (Danish
Programme for Local Economic Development in the Balkans) and City of Nis. The authors
were the part of the research team and the data used in this paper are still unpublished part of
the results. Project results are available at http://www.kler.ni.rs/index.php?language¼en.
116 J. Stankovic et al.

The key questions which have been analysed in this paper are:
– Do observed enterprises have a research department/department for new product
development?
– Do interviewed managers think that their enterprise is competitive enough in the
market?
– Doobserved enterprises have a need for using services of research centres, in
order to increase productivity and competitiveness?
In the purpose of obtaining representative results it was necessary to:
• Explore the structure of the sample according to questions listed above;
• Test the significance of attitude differences between enterprises.
The methods which are used in order to conduct analyses are descriptive
statistics and chi square test.
The answer to the first question (Do observed enterprises have a research
department/department for new product development?) was provided by
232 respondents, which comprises 96.67% of interviewed managers. Most of
them responded negatively to this question (62.9%), while only 19% has a research
department and 18.1% is considering the creation of such a department. The
structure of the answers according to the companies’ ownership is presented in
Table 8.
As it can be seen from Table 8, structure of the answers according to the
ownership fits to the overall structure, except in case of public ownership where
both enterprises have the research department. The number of these companies in
sample is very small, so it is not possible to draw any relevant conclusions.
The answers given to the second question (Do interviewed managers think that
their enterprise is competitive enough in the market?) support the finding that the
Table 8 Ownership/Research Department—cross tabulation
Ownership
Research Department
TotalYes Considers No
State Count 4 2 10 16
% within Ownership 25.0% 12.5% 62.5% 100.0%
Public Count 2 0 0 2
% within Ownership 100.0% 0.0% 0.0% 100.0%
Private individuals Count 27 29 98 154
% within Ownership 17.5% 18.8% 63.6% 100.0%
Other legal entities Count 4 7 20 31
% within Ownership 12.9% 22.6% 64.5% 100.0%
Foreign Count 7 4 18 29
% within Ownership 24.1% 13.8% 62.1% 100.0%
Total Count 44 42 146 232
% within Ownership 19.0% 18.1% 62.9% 100.0%
Source: BAS Poll—Opinion of the Business Community database, authors’ calculations
Interaction Between Competitiveness and Innovation: Evidence from South. . . 117

issue of competitiveness is not well known to the enterprises in Serbia, or it is not
given adequate importance. The answer to this question was not provided by
38 respondents, which makes 15.8% of all interviewed managers. Among the
managers who answered to this question, 74.25% of them think that their enterprise
is competitive in the market, while 25.75% have the opposite opinion.
Data presented in Table 9 show that 56.9% of the observed enterprises that find
themselves competitive in the market do not have a research department, while only
19.4% have this department. On the other hand, only 3.8% of enterprises that do
not find themselves competitive in the market consider establishing that kind of
department. The dependence between the answers to these two questions is con-
firmed by results of Chi-square test, with significance of 0.017.
The managers from Serbia were also asked if they have a need for using services
of research centres, in order to increase productivity and competitiveness. The
answer to this question wasn’t provided by 21.7% of respondents, only 22.7% of
managers answered positively and even 55.8% answered negatively (Table 10).
Table 9 Competitiveness/Research Department—cross tabulation
Research department
Competitive
TotalNo answer Yes No
Yes Count 4 28 12 44
% within Competitive 11.1% 19.4% 23.1% 19.0%
Considers Count 6 34 2 42
% within Competitive 16.7% 23.6% 3.8% 18.1%
No Count 26 82 38 146
% within Competitive 72.2% 56.9% 73.1% 62.9%
Total Count 36 144 52 232
% within Competitive 100.0% 100.0% 100.0% 100.0%
Source: BAS Poll—Opinion of the Business Community database, authors’ calculations
Table 10 Competitiveness/Services of research centres—Cross tabulation
Need of using services of research centers
Competitive
TotalNo answer Yes No
No answer Count 16 34 2 52
% within Competitive 42.1% 22.7% 3.8% 21.7%
Yes Count 6 40 8 54
% within Competitive 15.8% 26.7% 15.4% 22.5%
No Count 16 76 42 134
% within Competitive 42.1% 50.7% 80.8% 55.8%
Total Count 38 150 52 240
% within Competitive 100.0% 100.0% 100.0% 100.0%
Source: BAS Poll—Opinion of the Business Community database, authors’ calculations.
World Economic Forum, The Global Competitiveness Report (2012–2013), authors’ calculations
118 J. Stankovic et al.

6 Conclusion
Improving competitiveness is a central issue in contemporary economic literature,
particularly in conditions of globalization and the economic crisis. For the Balkan
countries this issue is even more important, given the fact that their score of
competitiveness is far below indicators of EU countries and even below the world
average.
Analysing the sub-indices of CGI, according to the latest Global Competitive-
ness Report 2012–2013, it can be concluded that the sub-index Basic requirementshas the highest impact on the competitiveness of the Balkan countries, which relates
to issues of institutions, infrastructure, macroeconomic stability and health and
primary education (there is statistically significant correlation between GCI and
sub-index Basic requirements of 0.853). Second most powerful influence on GCI
has the sub-index Innovative and sophisticated factors, which includes issues of
business sophistication and innovation (Pearson Correlation coefficient is 0.793).
Key recommendations arising from these results are related primarily to the need of
improvement of macroeconomic environment, including specifically infrastructure
and institutions. As well, the issue of intensifying innovative activities is no less
important. The stagnation in sub-index Innovative and sophisticated factors sug-gests that the Balkan countries invest little in improving the innovation infrastruc-
ture. The score of Innovative and sophisticated factors in 2006 was 3.11, and in
2012 is 3.12, which only a slight increase.
The results of the analysis of the competitiveness of Serbia indicate very low
values, even in relation to the Balkan countries, so Serbia has found itself almost at
the tail-end of Europe. The Global Competitiveness Index 2012–2013 rankings put
Serbia to the 95th place and Greece is the only European country with lower rank. A
special warning is a decline in the score of indicators related to innovation. Serbia
has the score 3.08 for pillar Innovation in 2007 and until 2012 the decrease was
0.27, so the latest score amounts 2.81.
The results of innovative activities of enterprises in Serbia are very low. Only
19% of observed enterprises have a research department and 18.1% is considering
establishment of such a department. It is an interesting fact that 56.9% of observed
enterprises, which find themselves competitive in the market, do not have R&D
department. This is an alarming finding that indicates a lack of awareness about the
need for innovative activities as one of basic mechanisms to improve competitive-
ness. The results indicate an urgent need for intensive work on improving the
innovation infrastructure in enterprises and for promoting innovative entrepreneur-
ship in Serbia.
Interaction Between Competitiveness and Innovation: Evidence from South. . . 119

References
Acemoglu D, Aghion P, Lelarge C, Van Reenen J, Zilibotti F (2007) Technology, information, and
the decentralization of the firm. Q J Econ 122(4):1759–99
Balcerowicz L (1995) Socialism capitalism transformation. CEU Press, Budapest
BaumolWJ (2002)The free-market innovationmachine: analyzing the growthmiracle of capitalism.
Princeton University Press, Princeton, NJ
Baumol W, Schilling M (2008) Entrepreneurship. The New Palgrave Dictionary Economics
(online version 1–9)
Baumol WJ, Litan RE, Schramm CJ (2007) Good capitalism, bad capitalism, and the economics of
growth and prosperity. Yale University Press, New Haven, CT
Cantwell J (2003) Innovation and competitiveness. In: Fagerberg J, Mowery DC, Nelson RR (eds)
Chapter 21: Handbook of innovation. Oxford University Press, Oxford
Davila T, Epstein MJ, Shelton R (2006) Making innovation work. How to manage it, measure it,
and profit from it. Wharton School, Philadelphia, PA
Dunn DMH (1994).Do nations compete economically? A critical comment on Prof. Krugman’sEssay “Competitiveness: A Dangerous Obsession.” Intereconomics Issue Nov-Dec:303–308
Golubovic N, Dzunic M (2012) Social determinants of competitiveness. University of Nis,
Faculty of Economics, Nis
Heertje A (2006) Schumpeter on the economics of innovation and the development of capitalism.
Elgar, Cheltenham
Kornai J (2010) Innovation and dynamism: interaction between systems and technical progress.Working paper No. 2010/33. United Nation University and World Institute for Development
Economics Research, Helsinki, Finland
Krugman P (1994) Competitiveness. A dangerous obsession. Foreign Aff 73(3/4):28–44
Lankauskiene T, Tvaronaviciene M (2011) Interrelation of countries’ developmental level and
foreign direct investments performance. J Bus Econ Manag 12(3):546–565
Mowery DC, Nelson RR (1999) Sources of industrial leadership: studies of seven industries.
Cambridge University Press, Cambridge
OECD (2008) Handbook on constructing composite indicators. Methodology and user guide.
http://www.oecd.org/std/42495745.pdf. Retrieved 17 Apr 2015
Phelps E (2008) Understanding the great changes in the world: gaining ground and losing ground
since World War II. In: Kornai J, Laszlo M, Roland G (eds) Institutional change and
economic behaviour. Palgrave Macmillan, Basingstoke
Porter ME, Schwab K (2008) The Global competitiveness report 2008-2009. World Economic
Forum, Geneva
Savic N (2012) Comparative analysis based on new competitiveness index. Panoeconomicus 1:
105–115
Schwab K (2009) The Global competitiveness report 2009-2010. World Economic Forum, Geneva
Schwab K (2010) The Global competitiveness report 2010-2011. World Economic Forum, Geneva
Schwab K (2011) The Global competitiveness report 2011-2012. World Economic Forum, Geneva
Schwab K (2012) The Global competitiveness report 2012–2013. World Economic Forum,
Geneva
Society of Economists of Nis (2012) BAS Poll—opinion of the Business community. http://www.
kler.ni.rs/index.php?language¼en. In Serbian
Spence AM, Hazard HA (eds) (1988) International competitiveness. Ballinger, Cambridge, MA
Stiglitz JE, Sen A, Fitoussi J-P (2009) Draft summary. Commission on the Measurement of
Economic Performance and Social Progress, Paris
120 J. Stankovic et al.

Testing Uncovered Interest Parity
for Structural Breaks: A Developing Country
Perspective
Srđan Marinković, Ognjen Radović, and Željko Šević
Abstract This article is a single-country empirical study of uncovered interest
parity. Uncovered interest parity (hereafter UIP) is a non-arbitrary condition well-
known and widely tested in international finance. This test of UIP is based on high-
frequency data. The most promising parts of the evidence are the EGARCH
analysis of statistical properties of time series of deviations from UIP, and the
Markov Switching model. EGARCH (1,1) delivers a model able to predict future
volatility of the tested variable. Moreover, the model also describes the time-
varying nature of volatility itself. The changing nature of volatility may arise due
to the process of information arrivals or being liquidity driven, but can also be a
consequence of some structural breaks. Namely, the time series remains homosce-
dastic in the short-term while heteroscedasticity appears in long-term horizons. The
regime switching model is further employed in order to test if the smoothed
probabilities along the sample reflect the main events through which the economy
evolved over time. The model proved to be able to indicate correctly the ex-anteidentified structural break that came from crisis incident, but failed to differ
between pre- and post-liberalisation periods.
1 Introduction
Uncovered interest parity (hereafter UIP) is a non-arbitrage supported equilibrium
condition that links the yields on two comparable assets denominated in different
currencies. The basic issue in testing UIP directly is the necessity to operate with
exchange rate expectations. Sometimes, if there is an active forward currency
market, the forward exchange rate is taken to be a good proxy for expected future
spot rate. Unfortunately, not only forward premium/discount misdirects exchange
S. Marinkovic (*) • O. Radovic
Faculty of Economics, University of Nis, Trg kralja Aleksandra Ujedinitelja 11, 18000 Nis,
Republic of Serbia
e-mail: [email protected]
Z. Sevic
University of Wales Trinity Saint David, Swansea Campus, Swansea SA1 6ED, Wales, UK
© Springer International Publishing Switzerland 2016
A. Karasavvoglou et al. (eds.), Economic Crisis, Development and Competitivenessin Southeastern Europe, Contributions to Economics,
DOI 10.1007/978-3-319-40322-9_8
121

rate movements (Froot and Thaler 1990; Sachsida et al. 2001; Engel 2014), but also
survey data collected from the various sources (Kaminsky 1993). The latter regu-
larity may come because even survey based forecasts appear to be informed or
guided by UIP (Cuestas et al. 2015). The most frequently used approach is to
assume rational expectation, and simply use ex post realised exchange rate changesas rationally predicted. Then we are able to test for UIP, according to the following
equation:
Δstþk ¼ αþ β it,k � i*t,k� �þ εtþk ð1Þ
Where Δstþk is the percentage depreciation of the currency and it,k � i*t,k� �
is the
current k–period interest rate differential between domestic interest rate and rele-
vant foreign interest rate. For rather small changes in the exchange rate, it is
acceptable to transform the dependent variable into a continuously compounded
rate of return, expressing it as the difference in logs of exchange rate over k periods.If the rational expectation hypothesis holds and two financial markets are
perfectly integrated, then the estimate of intercept (α) must be equal to zero, and
the estimate of slope coefficient (β) equal to one. The first condition implies that
interest rate differential is built into exchange rate changes, while the second
implies that there are no other explanatory variables that should be included in
the model. The regression residual term (εtþk) should be stationary and orthogonal
to information available at time t. Although the procedure is widely implemented, it
contains critical flaws. Most variations in spot exchange rates are unanticipated
(Chinn and Dooley 1995), notably where the trading (forecasting) window is short-
term and the exchange rate is noisy.
2 Why Does UIP Frequently Fail
UIP could fail simply because a country does not work with a pure floating
exchange rate regime. It is rarely seen, even in the most developed countries, that
solely market forces, with no interventions, determine a pure floating exchange rate.
It seems also that there is a kind of asymmetry in a way that the authorities react to
correct market forces. If the market drives currency down, the authorities take
contra-trend position (massive selling of reserve currency), if the market drives it
up, they are not keen to do something. Calvo and Reinhart (2002) coined well
known phrase “fear of floating”, to describe a specific authorities’ behavior. Theyfound that countries that claim they allow their exchange rate to float mostly do not.
In the last 10 years, exchange rate policy applied in Serbia passed through
several phases. From the very beginning of the reform, Serbia, de jure has followed
a managed floating regime with explicit exchange rate targeting. However, it started
de facto pegging its currency. Since the year 2003 the policy switched to the one
most responsive to the market forces. The last phase of exchange rate policy starts
122 S. Marinkovic et al.

in August 2006. It was then when NBS de facto shifted from the exchange rate
targeting to the pure inflation targeting monetary strategy. Exchange rate was not
anymore the variable of prime concern, and had to be managed only in order to
prevent excess daily fluctuations (with no transparent threshold). The change of the
policy into an independent floating regime, oriented to prevent excess daily fluctu-
ations, inside the inflation targeting monetary framework was officially announced
in August 2008. The shift in exchange rate policy coincides with the moment of de
jure capital account liberalization. During almost the entire period the National
Bank of Serbia was regularly present on the foreign exchange market. A notable
exception is the third quarter of 2008, and the last three quarters of 2009.
In order to have UIP in place, perfect capital mobility is another necessary
precondition. It means that the more open the economy is, the better the performing
UIP will be, advocating the condition to be a good proxy for capital mobility.
However, it is only one of several approaches proposed by theory to test the
international mobility of capital. Montiel (1994), and more recently Kose
et al. (2009), proposed several measures; capital controls in place, flow of funds
and stock of funds measures, which are alternatives to measures that rely solely on
financial return. The measures of capital mobility which rest on financial return
(UIP) could fail because either effective or prospective capital controls constrain
pricing arbitrage (Dooley and Isard 1980). Moreover, less developed financial
markets are often not sufficiently deep to enable an efficient pricing arbitrage.
The Republic of Serbia de jure introduced a liberalised capital account in 2006,
but it did not abandon some of the old capital control measures. Amongst the
measures that most severely constrain international capital mobility are mandatory
reserves, which in the case of Serbia remain at all times prohibitively costly. Kose
et al. (2009) stress that even such measures as prudential regulation applied to the
banks in terms of limits of currency risk exposure can play a role similar to that of
exchange rate controls, despite being ignored in many analyses. Anyway, empirical
studies have mixed results in terms of the influence of capital account liberalization
to the UIP. For instance, Francis et al. (2002) found the effect regionally specific. In
some countries deviations from UIP decreased after the liberalization, but not for
example in many studied Latin American countries. Interestingly, currency crises
are seen as the events that move exchange rate away from the parity.
Ambiguous results come from testing UIP with data that differs in length of
time. Some researchers found rather strong support of UIP when using overnight
(Chaboud and Wright 2005) or even 1-month data (Lee 2013), contrary to econo-
metric tests that mostly reject UIP conditions in long investment horizons (for a
review see: Pasricha 2006). However, one should be cautious because tests with
overnight trading horizon could include periods with a rather peculiar statistical
nature, for instance currency under attack when the interest rate differential is used
as a policy tool to fight against depreciation. This could plausibly explain why in
some tests (Flood and Rose 2002; Bhatti 2014), UIP worked systematically better
for countries that faced financial crisis. There is also novel research that relates
higher explanatory power of UIP in predicting future exchange rates to the mone-
tary volatility. For instance, Moore and Roche (2012) found that UIP better held
Testing Uncovered Interest Parity for Structural Breaks: A Developing. . . 123

with the countries and within the periods where the monetary growth was more
volatile, even if controlled for inflation.
The fact in favour of short-term is also data availability. The data for the shorter
time spans are readily available, even for emerging economies, while data on the
long-term interest rates are frequently not as “clean” as data used for shorter
horizons (Mehl and Cappiello 2009). Nevertheless, the empirical evidence ques-
tions the theoretical suggestions.
The majority of empirical investigations fail to support UIP, both for developed
and developing countries. Among the most quoted papers is Froot (1990), which
calculated the average value of slope coefficient over 75 published studies. Con-
trary to theory suggestions, he found it to be close to negative figure one (�0.88).
However, some more recent empirical literature found significantly higher support
of the UIP theory. For example, Lee (2013) studied a broad spectrum of currencies
and found slope coefficients in the majority of cases supporting the UIP. According
to the results, in many studied cases violations of the UIP came because of the
various currencies are expressed against the US dollar and the other main curren-
cies, that tend to appreciate even if they have higher interest rates. Moreover, UIP
holds much better if one limits the research only to the cases of higher interest
differential (Craighead et al. 2010). Authors explain that there is a zone of specu-
lative (carry-trade) inactivity that corresponds to smaller interest differentials. On
the contrary, higher differentials used to decay over time as a consequence of carry-
trade, restoring UIP conditions. The same, Lothian and Wu (2011) find large
interest differentials more promising in explaining movements in exchange rates
of most developed economies over the time span of two centuries. The failure of
small differentials to do the same effect is assigned to the noise surrounding small
deviations, i.e. problems that traders face in extracting signals.
Nevertheless, the testing level of integration increasingly turns from testing if
UIP holds to rather testing the statistical properties of deviations from it. Among the
first empirical articles which tested the statistical nature of deviations from uncov-
ered interest parity is Cumby and Obstfeld (1981). The authors rejected the
assumption of randomness of the deviations. If exchange rate changes (i.e. daily
exchange rate return) were random, it would be inconsistent with the uncovered
interest parity. The presence of a nonzero interest rate differential will transform an
otherwise pure random walk into a random walk with drift (Taylor 1995, p. 14).
Since the interest rate differential is supposed to be changing over time, it can
hardly be expected that it be identically equal to a constant.
If the degree of capital mobility varies through time, deviations from parity will
also vary. The volatility of deviations is supposed to be higher in the period with
more capital controls than in the period with a higher degree of integration (Faruqee
1992). From Eq. (1), it follows that any deviation from the parity condition is
restated as:
124 S. Marinkovic et al.

yt,k ¼ stþk � stð Þ � it,k � i*t,k� � ð2Þ
Where yt,k denotes deviations (excess return), while lowercase letter s indicateslogs of exchange rates. In the remainder of the article, we will carry out deviations
to some statistical procedures to investigate their statistical nature.
3 Estimation Models: Statistical Properties of Data Set
The period covered by the analysis is from August 2005 to December 2009. The
data set comprises 1078 daily data on referent foreign (EONIA) and local
(BEONIA) overnight interbank interest rates and exchange rates. The data on the
bilateral exchange rate was supplied by the National bank of Serbia, and were
consequently sampled at the daily frequency. The Serbian dinar (RSD) vis-�a-vis theEuro (EUR) exchange rate is expressed in terms of units of domestic currency per
unit of foreign currency (direct quotation). The choice of overnight interbank rates
is not rare in empirical studies (e.g. Baillie and Osterberg (2000) operated with
overnight Eurocurrency deposit rates), and it may be superior to the choice of long-
term/governmental bonds in many (above mentioned) respects. However, by using
overnight interbank interest rates to test for UIP, a researcher brings the risk of
incomparability of relevant foreign and domestic interest rates. The structure of the
domestic banking industry has also been changed significantly, since the major
reform was undertaken in 2001. Serbia opened the door of its market to the major
regional banks. The data on structure of participants is not available, but it is
reasonable to assume that it does not differ significantly from the structure of the
relevant foreign interbank overnight market, leaving the difference in credit risk
more or less irrelevant. Moreover, in tranquil times, interbank overnight rates are
taken to be non-risky, which is a normally doubtful assumption for crisis-prone
periods.
3.1 Descriptive Statistics of Data Set
Contained in Table 1 are the basic statistics of time series of interest rate differen-
tial, exchange rate changes and excess return. The last variable is also broken down
into four sub-samples: the period before de jure liberalisation, the period after it and
before the crisis, the crisis period itself, and finally the post-crisis period.
Theoretically, the currency that earns a higher rate of return should depreciate
until the end of the holding period, so that statistically significant and persistent
deviation (excess return) could indicate UIP failure. It is worth noting that the
figures representing excess return are by no means actual earnings, since many costs
Testing Uncovered Interest Parity for Structural Breaks: A Developing. . . 125

impact the ultimate success of the speculative arbitrage strategy (rollover overnight
positions).
Negative mean indicates that the daily interest rate differential was not fully
offset by local currency depreciation, so that an arbitrager, by holding a short
foreign and long domestic position, gains profit (allowing for transaction costs).
The period of acute banking and currency disturbance solely has a differing nature
Table 1 Descriptive statistics
Series Mean Min Max SD Skewness Kurtosis J–Ba
it,k � i*t,k 0.0002 0.0001 0.0005 0.0001 0.2243 2.164 40.44
(5.93)
stþk � st 0.0001 �0.036 0.0489 0.0053 0.3385 15.410 6944.90
(5.93)
yt,k2005:09–2009:12 �0.0143 �3.707 4.8805 0.5291 0.3276 15.476 7017.39
(5.93)
2005:09–2006:08 �0.0288 �1.237 0.8695 0.2446 �0.6949 8.438 299.35
(5.71)
2006:08–2008:10 �0.0348 �2.887 4.8804 0.5599 0.9987 16.533 4296.80
(5.87)
2008:10–2009:03 0.1649 �3.707 2.2730 1.0149 �0.8486 4.554 20.96
(5.40)
2009:03–2009:12 �0.0261 �1.011 0.9103 0.2760 0.0789 4.746 26.26
(5.68)
dyt,k �0.0000 �0.072 0.0487 0.0063 �1.2564 26.096 24244.5
(5.93)
Notes: J–B stands for Jarque–Bera test statisticsain parenthesis are critical values for 5% significance
Table 2 Autocorrelation testit,k � i*t,k stþk � st yt,k
Autocorrelation of each series
ρ1,1 0.9250 0.2905 0.2909
ρ1,2 0.8763 �0.0160 �0.0155
ρ1,3 0.8468 �0.1401 �0.1396
ρ1,10 0.7366 �0.0272 �0.0278
ρ1,20 0.7572 �0.0313 �0.0320
Q1(24) 1521.33 (0.00) 144.06 (0.00) 144.08 (0.00)
Autocorrelation of the square of each series
ρ2,1 0.9117 0.2994 0.3028
ρ2,2 0.8536 0.1096 0.1078
ρ2,3 0.8285 0.1196 0.1156
ρ2,10 0.7158 0.0323 0.0327
ρ2,20 0.7381 0.0759 0.0774
Q2(24) 8246.17 (0.00) 446.15 (0.00) 437.90 (0.00)
126 S. Marinkovic et al.

of mean. In this period, the hypothetical arbitrager has lost the money, since the
rollover of daily arbitrage, which starts from the very beginning of the period and
continues until the end of the period, faced a severe drop in local currency value.
The foreign exchange rate dropped more than required to offset all the positive
differences between the domestic and corresponding foreign interest rate, so that
the hypothetical arbitrager finished the period of arbitrage with a loss.
Although the method above is built on basic statistics, it brings a valuable insight
of a time-varying nature of deviation from UIP. However, in order to employ
correctly more sophisticated statistical methodology, time series should follow
certain properties. The stationarity of time series is not only a necessary precondi-
tion if a researcher wants to proceed with more sophisticated methods, but also may
have a specific economic interpretation. Namely, if deviation from the parity
condition (excess return) is not a stationary process it will per se rule out UIP. If
not, we could say that monetary integration between the pair of countries is reached
to the level that excludes unbounded profit from the carry trade/uncovered interest
arbitrage (Jiang et al. 2013).
3.2 The Test of Unit Root
We test for unit root using several statistical procedures. First, we calculated partial
autocorrelations’ coefficients for a different time lag. A statistical process is said to
be stationary stochastic if the autocorrelation function either abruptly drops to zero
at some finite lag or eventually tapers off to zero (Green 2003, p. 614). Instead of
using the autocorrelation function, one can also compare the values of coefficients.
As the lag becomes longer, the value of coefficient must decrease. The results
clearly reject stationarity in the case of interest rate differential, contrary to the
exchange rate and the deviations themselves (excess return), where the stationarity
condition holds rather strong. The value of Q(24) presents Ljung–Box statistics
based on autocorrelation coefficients in the order of up to 24.
Table 3 presents the results from different tests of unit root. Tabulated critical
values (not enclosed) depend upon both the number of observations (sample size)
and the assumed statistical model. The variance ratio test assesses the null hypoth-
esis that a univariate time series y is a random walk. The test delivers the vector of
variance ratios (r ratio), with length equal to the number of tests. Each ratio is the
ratio of the variance of the q-fold overlapping return horizon, where q times the
variance of the return series. For a pure random walk, these ratios are asymptoti-
cally equal to one. For a mean-reverting series, the ratios are less than one, while for
a mean-averting series the ratios are greater than one. The evidence rejects pure
random walk (Table 3).
To continue we apply the Augmented Dickey–Fuller (ADF) as this test is
considered to be more convincing with regard to the statistical property we are
investigating. The Augmented Dickey and Fuller (1981) for unit root tests the null
model:
Testing Uncovered Interest Parity for Structural Breaks: A Developing. . . 127

yt ¼ yt�1 þ b1Δyt�1 þ b2Δyt�2 þ . . . þ bpΔyt�p þ e tð Þ ð3Þ
Against the alternative model:
yt ¼ ayt�1 þ b1Δyt�1 þ b2Δyt�2 þ . . . þ bpΔyt�p þ e tð Þ ð4Þ
The time series of interest rate differential, exchange rate changes and excess
return are estimated as they belong to the random walk with drift (with constant/
intercept). The estimate of AR(1) coefficient must satisfy the condition a< 1. In all
series except the interest differential, it is significantly less than unit. Moreover, the
test statistics for all series except interest differential stays below the tabulated
critical values. Thus, according to the test, all series but the interest rate differential,
clearly exhibit stationarity. Since the interest differential is nonstationary, or con-
tains unit root, denoted I(1), the excess return may also have unit root. It depends on
which series overwhelms the other. If interest differential is predominantly respon-
sible for changes in excess return, the statistical nature of the result series will
contain unit root, otherwise it will share the statistical nature of the series of
exchange rate changes. Since all series have a daily frequency, interest differential
is expected to have a weak effect on excess return.
The last columns contain results given by Dickey–Fuller generalized least
squares test (Ellliott et al. 1996) and Ng and Perron (2001) test based on two
statistics, which are considered more rigorous than either Variance Ratio test or
Augmented Dickey–Fuller. The tests’ results are rather promising since for excess
return (total sample time series) unit root property is rejected with confidence of
more than 99%, although Ng–Perron invariably rejected stationarity of all excess
return series in shorter time spans (subsamples). Further analysis showed that
according to Dickey–Fuller generalized least squares test (DF–GLS) even excess
Table 3 Test of stationarity
Variable Variance ratio ADF DF–GLS Ng–Perron
Stat r Stat a Stat MZα MZt
it,k � i*t,k 22.095a 1.92 �1.738 0.99 �0.631 �0.979 �0.607
stþk � st 4.160a 1.29 �8.330a 0.29 �24.317b �493.328a �982.692a
yt,k2005:09–2009:12 4.167a 1.29 �8.360a 0.29 �24.322a �493.387a �15.705a
2005:09–2006:08 1.909 1.24 �11.846a 0.24 �2.404b �4.386 �1.480
2006:08–2008:10 2.787a 1.25 �6.554a 0.25 �2.292b �0.992 �0.350
2008:10–2009:03 2.251b 1.35 �6.437a 0.35 �0.741 �0.387 �0.226
2009:03–2009:12 3.699a 1.28 �10.083a 0.27 �1.140 �1.170 �0.706
dyt,k �2.887a – �12.709a �0.28 �43.848a �495.566a �15.741a
Notes: ADF test uses the general to specific approach to select the number of lags. DF-GLS and
Ng–Perron tests use modified information criteria (MIC)adenotes rejection of null hypotesis of unit root at 1% statistical significancebdenotes rejection of null hypotesis of unit root at 5% statistical significance
128 S. Marinkovic et al.

return series in third and fourth sub-samples are stationary up to the lag 5, and
21, respectively (albeit with 10% statistical significance). Similar holds even for
interest rate differential.
Since an excess return follows the stationary stochastic process, we will proceed
with modelling its absolute value and volatility. All models were estimated by
MATLAB, EViews or R software, alternatively.
4 Time Series Modelling Using ARMA(1,1)-GARCH(1,1)
and ARMA(1,1)-E–GARCH(1,1)
4.1 ARMA(1,1)
Sometimes in modelling the statistical time series, the autoregressive moving-
average process (hereafter ARMA) has the ability to explain variable dynamics,
as well as complicated econometric models. An ARMA( p,q) process is the com-
bination of AR( p) and MA(q) processes. The process has p autoregressive terms, or
lagged dependent variable, and q lagged moving-average terms. The model has a
most general form:
yt ¼ μþ ϕ1yt�1 þ ϕ2yt�2 þ . . .þ ϕpyt�p þ εt � θ1εt�1 � . . .� θqεt�q ð5Þ
Although it is assumed that the more extensive models have the ability to predict
better, very often the simplest model, with no more than single autoregressive and
moving-average terms, fits reality equally well. In the paper, we applied the most
reduced form of general ARMA( p,q) model, i.e. ARMA(1,1).
yt ¼ μþ ϕ1yt�1 þ εt � θ1εt�1 ð6Þ
The results, containing the value of relevant coefficients and t–statistics, areshown in Table 4. Log likelihoods are given jointly for the model of excess return
and the model of volatility assigned to it. The volatility models are discussed next.
4.2 Volatility Modelling: GARCH Model
Using volatility models to assess the UIP condition has its own research history.
Domowitz and Craig (1985) applied a model of autoregressive conditional
heteroskedasticity (ARCH) and found expected future volatility unrelated to excess
return (forward discount’s bias). Recently, researchers have switched to the more
sophisticated models. Sul (1999) tests the GARCH model and finds that conditional
variance of excess return does not tend to depend on the degree of capital mobility,
Testing Uncovered Interest Parity for Structural Breaks: A Developing. . . 129

contrary to Goh et al. (2006), which finds Switching ARCH model enables diag-
nosing the influence of de facto capital liberalisation on the nature of deviations
from UIP.
The assumption underlying the GARCHmodel is that volatility changes with the
passage of time, what makes it suitable for modelling heteroskedastic processes.
The rationale for using the GARCH model to test UIP is that changes in variable
volatility point out structural breaks, by definition, a change in economy openness,
and the presence of financial disturbances. Since the GARCH (1,1) model works
without ex ante known breaks, it is a way to test whether the theoretically suggested
breaks appear in the data.
The GARCH(1,1) model (see: Bollerslev 1986) assumes that volatility measured
at any point in time, t, is under the influence of a long-run average variance rate, VL,
most recent observation of squared return u2t�1, and most recent estimate of the
variance rate, σ2t�1. The model is still most widely used in forecasting volatility.
By solving the model, we obtain the weights scheme, or what weighting is to be
assigned to any of those determinants: γ, α, and β respectively.
σ2t ¼ γVL þ ασ2t�1 þ βu2t�1 ð7Þ
Setting ω ¼ γVL, the test model becomes:
σ2t ¼ ωþ ασ2t�1 þ βu2t�1 ð8Þ
Unfortunately, the tested ARMA(1,1)–GARCH(1,1) model did not deliver
strictly stationary solution, since for that we require positive value of ω, andαþ β < 1. Namely, the sum of all weights must equal one. Since the sum of αand β is one, and ω is close to zero, the model belongs to the Exponentially
Weighted Moving Average Model (EWMA) as a specific case of the GARCH
(1,1) model, where the weight assigned to long-run average volatility is zero. This
means that the variance rate of the excess return does not tend to be pulled back to a
long-run average level, or it shows no mean reversion. Moreover, by comparing the
weights assigned to the most recent (previous trading day) observations of daily
variance rate (volatility persistence, or volatility clustering effect) and square of
return, we see (Table 4) firstly that previous-day variance rate has strong impact on
contemporaneous variance rate (α equals 76.58%) and secondly, that daily vola-
tility responds relatively fast to new information provided by the daily percentage
change in excess return (β equals 23.41%). The standard GARCH model success-
fully explains the volatility clustering, but it does not capture so called leverage
effect, which is often recognized in various financial return time series. This is why
we will proceed with another GARCH-type model able to capture leverage effect.
130 S. Marinkovic et al.

4.3 Exponential GARCH Model
The Exponential GARCH model (EGARCH) belongs to the same family of vola-
tility models and differs in the way that it allows for asymmetrical impact of good
versus bad news. It is also less susceptible to the above mentioned restriction. The
only restriction is that the absolute value of coefficient β must be less that unit.
In this case, the ARMA(1,1)–EGARCH(1,1) model fits the sample data a bit
better than the ARMA(1,1)–GARCH(1,1) model. The log likelihood function for
this model is slightly higher (Table 4).
The value assigned to λ confirms that positive innovations are more destabilizing
than negative ones. Since positive innovations, or positive excess return, by defi-
nition, mean that currency depreciates more than indicated by interest rate differ-
ential, it essentially declares that bad news for local currency generates more
volatility than good news. However, the magnitude of λ coefficient, which is
close to zero, indicates a not so strong asymmetry or the leverage effect.
Figure 1 presents the time series of conditional variance delivered by the ARMA
(1,1)–EGARCH(1,1) model, which is a combination of the ARMA(1,1) model for
the conditional mean and the GARCH(1,1) model for the conditional variance. We
used here Hodrick-Prescott filter to smooth the trend, although some other pro-
cedures are available if a researcher want to separate permanent from transitory
component of the conditional variance within the GARCH framework
(Li et al. 2012). The graph clearly indicates that the time-varying nature of
conditional variance coincides with ex ante indicated structural break that belongs
to a crisis incident, but not to that of liberalisation.
Table 4 ARMA(1,1)–GARCH(1,1) and ARMA(1,1)–EGARCH(1,1) results
Parameter ARMA(1,1)–GARCH(1,1)–t ARMA(1,1)–EGARCH(1,1)–t
μ �0.0001
(�1.2695)
�0.0001
(�1.1394)
φ1 0.0439
(0.4548)
0.02609
(0.2694)
θ 1 0.2552
(2.6506)
0.2743
(2.8477)
ω 0.0000
(3.5110)
�0.4544
(�3.4501)
α 0.7658
(26.2116)
0.95738
(79.1911)
β 0.2341
(4.9825)
0.4846
(6.2451)
λ – 0.0064956
(0.1742)
df 3.6083
(9.1719)
2.8764
(9.0617)
Log likelihood 4571.13 4462.50
Testing Uncovered Interest Parity for Structural Breaks: A Developing. . . 131

5 Regime Switching Modelling
There is a risk that statistical inference based on time series analysis, which does not
take into account a switch in regime, leads to spurious results. Models which ignore
any change in the ambience usually overestimate volatility persistence. Contrary to
what was previously believed, Engel and Hamilton (1990) claim that the exchange
25.08.2005 24.07.2006 03.10.2008 23.02.2009 14.12.20090
1
2
3
4
5
6Hodrick-Prescott Filter
conditional varianceSmoothed Trend
Fig. 1 Conditional variance
25.08.2005 24.07.2006 03.10.2008 23.02.2009 14.12.20090
0.2
0.4
0.6
0.8
1Pr(S=1)
Time
Smoo
thed
Sta
tes
Prob
abilit
ies
25.08.2005 24.07.2006 03.10.2008 23.02.2009 14.12.2000
0.2
0.4
0.6
0.8
1Pr(S=2)
Time
Smoo
thed
Sta
tes
Prob
abilit
ies
Fig. 2 Smoothed probability for state one (a) and two (b)
132 S. Marinkovic et al.

rate follows the regime switch process, or the model of the exchange rate evolves
over time. The switch of the regime that governs the exchange rate here is taken to
include not only de facto changes in the exchange rate regime, but also changes in
such a way that the exchange rate responds to its fundamental determinants. For
example, in Beyaert et al. (2007) it was assumed that occasional and unpredictable
shifts in monetary policy, currencies attacks and the liberalizations of capital flows
govern shifts between regimes. Put that way, the regime switch framework is able
to use more widely, e.g. for the floating regime.
Therefore, the next logical step is to incorporate an underlying assumption that
some economic forces drive the market between different states. If the entire period
contains sub-periods, which differ in the way the exchange rate responds to its
fundamentals, it will be mirrored in volatility.
We have applied the Markov regime switching model to volatility of excess
return. The model has the ability to portray the time evolving nature of volatility.
We assume two states: low volatility (regime one) and high volatility state (regime
two). According to the transition probability matrix (Table 5), the regimes seem
highly persistent. The probability of regime one to stay in the same regime is close
to one (P11¼ 0.95), which is slightly higher than in the case of regime two.
The plots describe graphically the evolution of volatility. Time is portrayed on
plots’ abscise, with some points marked ex ante identified as significant. The plots
do not show volatility itself but the probability that any period belongs to either of
the two discrete states. If the probability comes close to one or zero, it means we can
be fairly sure about the volatility feature of the period. The graphs are strongly
conclusive about the volatility, since the smoothed probability is, more often than
not, approaching its extremes.
The volatility difference between those two states is statistically significant. The
variance in high volatility states is 17 times the variance in low volatility states.
Unfortunately, the high volatility state switches to low volatility state, and vice
Table 5 Regime switching model (t–distribution)
Low volatility regime (1) High volatility regime (2)
Distribution parameters
Variance 0.000002 0.000035
SE 0.0000 0.0000
df 4.6265 4.6535
SE 1.2712 1.0094
Regressors
Value �0.0003 0.0001
SE ( p–value) 0.0001 (0.00) 0.0003 (0.70)
Probability of transition (SE)
Stay the same (P11; P22) 0.95 (0.03) 0.94 (0.03)
Shift to the other (P12; P21) 0.05 (0.01) 0.06 (0.02)
Expected duration (periods) 22.20 15.66
Log likelihood 4500.11
Testing Uncovered Interest Parity for Structural Breaks: A Developing. . . 133

versa, more frequently than we expected, meaning that the periods are rather short-
lived. The expected duration of regime one (low volatility state) is just 22.20 days,
while the expected duration of regime two is even shorter (15.66 days). TheMarkov
switching model has log likelihood comparable to that of previously applied
models.
Contrary to what was suggested by the theory, as well as some empirical studies
(e.g. Beyaert et al. 2007), opening the capital account exhibits no clear stabilizing
effect on the market. It produces no alignment of the exchange rate according to the
interest rate differential. Excess return on domestic assets remained higher
(expected depreciation of local currency on average did not offset for interest rate
differential). From the very start, the major de jure liberalisation brings the market
to a high volatility state. The excess return volatility increased. It follows several
reversals to low volatility state. These reversals might be explained by the influence
of foreign exchange interventions, which themselves could produce a switch
between regimes. This regularity is clearly confirmed Taylor study (2005), but,
for example, not in the case of bilateral the Bundesbank and the Federal Reserve
System interventions that occurred around early nineties, which appeared to influ-
ence dollar excess returns over UIP but not on conditional variance of excess
returns over UIP (Baillie and Osterberg 2000). During this period, the National
Bank acted 46 times on both sides of the market with an amount that exceeded 10%
of daily interbank turnover. In any case, the National Bank was present in the
market in 281 out of a total of 558 trading days. In less than 10% of cases it was on
the buying side. Bearing in mind the announced motivation for interventions, they
clearly have the potential to explain the rather frequent switch to the low volatility
regime. Some recent studies (Marinkovic 2014; Marinkovic and Radovic 2016)
indicated that direct interventions of National Bank of Serbia did have potential to
decrease volatility of nominal exchange rate RSD/EUR.
Ex ante assumed intense period of crisis clearly and entirely belongs to a high
volatility state. Interestingly, the period is also the sole period with a positive mean
of excess return. This means that the market diverged from an awarding to a
punishing short foreign-long domestic position, meaning that a hypothetical carry
trader accrued loses. In the periods that preceded and followed the crisis, excess
return had negative mean, which garnered speculative profit to actors sharing the
same position. Therefore, the carry trade was profitable. To a very noticeable
degree the findings comply with the findings of some recent studies of UIP that
covered a group of less developed countries (Bhatti 2014).
6 Conclusion
The descriptive statistics indicates that statistical properties of time series of
deviation from UIP evolutes significantly through time. The period that precedes
de jure liberalisation, as well as the period that immediately follows, exhibits
negative mean, which means that an increase in the differential drives the expected
134 S. Marinkovic et al.

future value of the currency up. It is exactly what happened in all but the crisis
periods. A parsimonious explanation for such development could be a shallow
currency market. Import of speculative capital, driven by excess return (interest
differential offset by exchange rate change) will itself drive the value of local
currency up, just as capital reversal will drive it down. Massive capital inflow
from abroad, driven by interest rate differential, ensures speculative arbitrage gain
since it also helps local currency remain overvalued.
A plausible explanation for the apparent change in disparities during turbulent
times could be an asymmetric response of monetary authorities on banking distur-
bances. The ‘policy behaviour’ argumentation is not novel in UIP empirical liter-
ature (McCallum 1994; Christensen 2000). In this case, the foreign authority
decreases the rate whilst the local monetary authority responded in the opposite
way. The combined influence of those undertakings further opened interest rate
differential in favour of domestic rates. Nevertheless, the strike of funds outflow
was one of unprecedented intensity and local currency depreciated much more than
necessary to offset the change in interest rate differential. The change in deviations’mean and volatility, which happened during this period, supports the view that a
failure of policy to fight against a speculative attack on currency by increasing
interest differential, gains support of UIP in this special case.
EGARCH(1,1) model partially supports ex ante distribution of structural breaks.
It indicates the impact of external shocks on the statistical nature of deviation from
UIP. External shock took the form of capital reversals with a strong impact on the
exchange rate, and a less obvious effect on the local interbank market.
What seems peculiar and does clash the theory, but is in line with some other
empirical investigations, is the fact that de jure opening capital accounts in devel-
oping countries actually increased the volatility of deviation from UIP. In those
countries, the capital account liberalisation probably would not trigger the conver-
gence of local and foreign interest rates. On the contrary, it would expose the
shallow foreign exchange market to short swings in the speculative capital flow.
Acknowledgement The authors are grateful to the Republic of Serbia Ministry of Education,
Science and Technological Development for the funds and support that made this research
possible.
References
Baillie R, Osterberg W (2000) Deviations from daily uncovered interest rate parity and the role of
intervention. J Int Financ Mark Inst Money 10(3–4):363–379
Beyaert A, Garcıa-Solanes J, Perez-Castejon JJ (2007) Uncovered interest parity with switching
regimes. Econ Model 24(2):189–202
Bhatti HR (2014) The existence of uncovered interest parity in the CIS countries. Econ Model 40
(C):227–241
Bollerslev T (1986) Generalized autoregressive conditional heteroskedasticity. J Econ 31
(3):307–327
Testing Uncovered Interest Parity for Structural Breaks: A Developing. . . 135

Calvo AG, Reinhart CM (2002) Fear of floating. Q J Econ 117(2):379–408
Chaboud PA, Wright JH (2005) Uncovered interest parity, it works, but not for long. J Int Econ 66
(2):349–362
Chinn M, Dooley M (1995) Asia–Pacific capital markets: integration and implications for eco-
nomic activity. NBER Working paper No. 5280
Christensen M (2000) Uncovered interest parity and policy behavior: new evidence. Econ Lett 69
(1):81–87
Craighead W, Davis G, Miller N (2010) Interest differentials and extreme support for uncovered
interest rate parity. Int Rev Econ Financ 19(4):723–732
Cuestas CJ, Filipozzi F, Staehr K (2015) Do foreign exchange forecasters believe in uncovered
interest parity? Econ Lett 133:92–95
Cumby RE, Obstfeld M (1981) Exchange rate expectations and nominal interest differentials: a
test of the Fischer hypothesis. J Financ 36(3):697–704
Dickey D, Fuller WA (1981) Likelihood ratio statistics for autoregressive time series with unit
root. Econometrica 49(4):1057–1072
Domowitz I, Craig SH (1985) Conditional variance and the risk premium in the foreign exchange
market. J Int Econ 19(1–2):47–66
Dooley PM, Isard P (1980) Capital controls, political risk, and deviations from interest–rate parity.
J Polit Econ 88(2):370–384
Ellliott G, Rothenberg T, Stock J (1996) Efficient tests for an autoregressive unit root.
Econometrica 64(4):813–836
Engel C (2014) Exchange rates and interest parity. In: Gopinath G, Helpman E, Rogoff K (eds)
Handbook of international economics, vol 4. Elsevier, Amsterdam, pp 453–522
Engel C, Hamilton J (1990) Long swings in the exchange rate: are they in the data and do markets
know it? Am Econ Rev 80(4):689–713
Faruqee H (1992) Dynamic capital mobility in Pacific Basin developing countries: estimation and
policy implication. IMF Staff Pap 39(3):706–717
Flood PR, Rose AK (2002) Uncovered interest parity in crisis. IMF Staff Pap 49(2):252–266
Francis B, Hasan I, Hunter DM (2002) Emerging market liberalization and the impact on
uncovered interest rate parity. J Int Money Financ 21(6):931–956
Froot AK (1990) Short rates and expected asset returns. NBER Working paper No. 3247, January
Froot AK, Thaler RH (1990) Anomalies: foreign exchange. J Econ Perspect 4(3):179–192
Goh KS, Lim GC, Olekalns N (2006) Deviations from uncovered interest parity in Malaysia. Appl
Financ Econ 16(10):745–759
Green HW (2003) Econometric analysis, 5th edn. Prentice Hall, Upper Saddle River, NJ
Jiang C, Li X-L, Chang H-L, Su C-W (2013) Uncovered interest parity and risk premium
convergence in Central and Eastern European countries. Econ Model 33(C):204–208
Kaminsky G (1993) Is there a peso problem? Evidence from the dollar/pound exchange rate,
1976–1987. Am Econ Rev 83(3):450–472
Kose MA, Prasad E, Jin Wei KRiS (2009) Finansijska globalizacija: Ponovna procena.
Panoeconomicus 56(2):143–197
Lee B-J (2013) Uncovered interest parity puzzle: asymmetric responses. Int Rev Econ Financ 27
(1):238–249
Li D, Ghoshray A, Morley B (2012) Measuring the risk premium in uncovered interest parity using
the component GARCH-M model. Int Rev Econ Financ 24:167–176
Lothian J, Wu L (2011) Uncovered interest-rate parity over the past two centuries. J Int Money
Financ 30(3):448–473
Marinkovic S (2014) Non-parametric sign test and paired samples test of effectiveness of official
FX intervention. Econ Ann 59(202):107–130
Marinkovic S, Radovic O (2016) Market volatility and foreign exchange intervention. In:
Anastasios K, Aranđelovic Z, Marinkovic S, Polychronidou P (eds) The first decade of living
with the global crisis: economic and social developments in the Balkans and Eastern Europe.
Springer, Switzerland
136 S. Marinkovic et al.

McCallum B (1994) A reconsideration of the uncovered interest parity relationship. J Monet Econ
33(1):105–132
Mehl A, Cappiello L (2009) Uncovered interest parity at long horizons: evidence on emerging
economies. Rev Int Econ 17(5):1019–1037
Montiel JP (1994) Capital mobility in developing countries: some measurement issues and
empirical estimates. World Bank Econ Rev 8(3):311–350
Moore M, Roche MJ (2012) When does uncovered interest parity hold? J Int Money Financ 31
(4):865–879
Ng S, Perron P (2001) Leg length selection and the construction of unit root tests with good size
and power. Econometrica 69(6):1519–1554
Pasricha GK (2006) Survey of literature on covered and uncovered interest parities. MPRA paper
No. 22737
Sachsida A, Ellery R Jr, Teixeira JR (2001) Uncovered interest parity and the peso problem: the
Brazilian case. Appl Econ Lett 8(3):179–181
Sul D (1999) Does ex post uncovered interest differential reflect the degrees of capital mobility?
Appl Econ Lett 6(2):97–102
Taylor PM (1995) The economics of exchange rates. J Econ Lit 33(1):13–47
Taylor PM (2005) Official foreign exchange interventions as a coordinating signal in the dollar-
yen market. Pac Econ Rev 10(1):73–82
Testing Uncovered Interest Parity for Structural Breaks: A Developing. . . 137

Adult Education: A Vehicle for Economic
Development
Pantelis Sklias and Giota Chatzimichailidou
Abstract In the present study, the issue under scrutiny is the contribution of adult
education to economic development. More precisely this paper seeks to develop a
more rigorous understanding of how adult education programs in several aspects of
today’s political, social and economic realms can empower individual actors,
citizens, to involve in the societal evolution towards social cohesion, which conse-
quently implies a transition to economic development. Transformative learning the-
ory is such a tool to explain this empowerment to take action. What emerges from
this paper is an alternative perspective on the benefits of adult education, differen-
tiated from the dominant neoclassical approach framework of the Human Capital
Theory, and relocated it in the methodological framework of International Political
Economy. The latter serves as a tool of perceiving and understanding the existent
complex context of political, economic and socio-cultural realities within European
Union, coupled with the historical evolution of adult education. The upgrading of
adult education standard is seen as central to the delivery of social cohesion and
therefore to economic development.
1 Introduction
In this paper, we consider an analysis framework for interpreting certain aspects of
today’s complex political, social and economic reality, integrating the notion of
adult education in economic development. We consider adult education as a
development factor, not only in weak and developing countries, but also in the
developed ones. In this paper the discussion revolves around European Union. It is
of our strong belief that European Union’s development policies and efforts may be
heavily influenced by a European plan for promoting adult education programs in
certain aspects of today’s political, social and economic realms. Hence, adult
education, especially through the prism of its dominant Transformative learning
P. Sklias • G. Chatzimichailidou (*)
Department of Political Science and International Relations, University of Peloponnese,
Aristotelous 1 and Athinon Ave, Corinth 20100, Greece
e-mail: [email protected]; [email protected]
© Springer International Publishing Switzerland 2016
A. Karasavvoglou et al. (eds.), Economic Crisis, Development and Competitivenessin Southeastern Europe, Contributions to Economics,
DOI 10.1007/978-3-319-40322-9_9
139

theory, might be a useful tool for both eliminating any disparities in the above
realms and simultaneously empowering citizens’ action towards social cohesion.
The latter will successively boost economic development. On these grounds, we
argue that adult education could serve as a vehicle for economic development.
Hence, it is important to seek methodological tools that aim to capture the above
parameters and reinterpret them in the development context. IPE seems to offer that
methodological framework. Indeed, Pantelis Sklias (2001, 29) proposes that IPE
includes a set of characteristics, which reveals that IPE is a singularized intellectual
tool in furtherance of the study of social, economic and political relations.
There is a growing recognition that the transition to the knowledge economy
requires continuous development of human capital, especially in work-related
skills. Therefore, adult education has been intuitively grasped both by the policy
makers around the world and the academic community. Moreover, the last two
decades appeared many studies measuring the returns of education, in an attempt to
analyze if future incomes of individuals are related to their past investments.
Further study in this field has revealed that almost all of these studies lay on the
Human Capital Theory (HCT), a dominant neoclassical theory introduced by
Theodore Schultz (1972). Gareth Rees (2013, 200) comments that HCT provides
a highly influential approach in understanding the role of adult learning in wider
economic development, while, ‘it also provides a means of addressing the deter-
minants of individual behaviour in relation to participation in adult learning, in
terms of individuals’ capacities to make ‘rational’ calculations as to the instrumen-
tal benefits that will accrue to human capital formation’ (Rees 2013, 200). The
above studies that measure the benefits of education are classified in the field of
Economics of Education. According to George Psacharopoulos (1996, 339) in this
field emphasis is put on documenting the unit cost of education at different
schooling levels and curriculum types, along with the learning and earning out-
comes of education. Furthermore, the same research agenda involves efficiency
assessment, i.e. cost-effectiveness analysis and cost-benefit analysis and equity
assessment, i.e. costs incidence and benefits incidence (Psacharopoulos 1996, 340).
Those findings above reveal that almost all of these studies in the field of
Economics of Education investigate the quantitative dimension of the role of
education or schooling to economic growth. In effect, this was a disincentive for
this paper’s authors, whose main concern was to explore the qualitative dimension
of the role of adult education to economic development. Moreover, literature
review reveals that there are a few studies that measure the returns of lifelong
learning, and all of them are based on neoclassical economics. A considerable
attempt to survey the relation between adult education and development, within the
context of IPE, is that of Frank Youngman (2000) in his study ‘The political
economy of adult education and development’, who seeks to clarify the
historical-structural constraints in the choices about adult education policies and
programs in the South. However, to the best of authors’ knowledge, no attempt was
done to explore the potential of the contribution of adult education to economic
development, within the framework of IPE in the developed countries and therefore
in European Union. Hence, this paper was spawned from the lack of such a study.
140 P. Sklias and G. Chatzimichailidou

Literature on economic development has very revealed that the term develop-
ment encompasses a variation of approaches, measures and strategies. However, in
this paper emphasis has very much given to the distinction between economic
development and economic growth, especially in the framework of IPE (Gilpin
2002). Moreover, we should further explore the qualitative dimension of economic
development. Sklias et al. (2013, 138), advocate the necessity to introduce a new
qualitative dimension within the wider notion of economic development. In the
field of adult education, a considerable amount of literature implies that there is a
variety of definitions, not only across several studies, but also across countries.
Many studies show a significant distinction between adult education and
vocationally-oriented education. Further data on the above terms are presented in
this paper.
Lastly, an analysis framework is proposed for the needs of this paper, which
encapsulates the following perspectives:
• The historical reference framework of adult education.
• The basic reference framework of Transformative learning.
• The qualitative dimension of economic development.
• The features of a cohesive society.
• An analysis of the correlation between adult education and economic
development.
Based on these perspectives, we attempt to investigate the contribution of adult
education to economic development, within the methodological framework of IPE.
Section 2 is devoted to the literature review on adult education and economic
development. The methodological framework of IPE is presented in Sect. 3,
whereas in Sect. 4 we present an analysis that explains the correlation between
adult education and economic development.
2 A Literature Review on Adult Education and Economic
Development
This section presents a literature review on adult education and economic devel-
opment. The evolution of adult education within the 19th and 20th Century is
presented in Sect. 2.1, whereas Sects. 2.2 and 2.3 are devoted to defining the
terms adult education and economic development. In Sect. 2.4, the general frame-
work of social cohesion will be discussed.
Adult Education: A Vehicle for Economic Development 141

2.1 The Evolution of Adult Education Within Nineteenthand Twentieth Century
In expounding the economic achievement of the 19th and 20th centuries in several
European countries, the contribution of better and more widespread education
stands out very clearly. During 1880–1914 several European governments
proceeded to the establishment of compulsory and free primary education -a previ-
ous traditional field of church’s sovereignty- as a means of strengthening social
cohesion. The industrialized countries had invested larger volumes of national
resources for this purpose, in contrast to the countries of the South and East Europe.
In 1911, in Germany, the investments for the national education have reached the
level of 12% of the total public spent, whereas in Great Britain 10%, France 8%
and Spain only 1.5% (Gaganakis 1999, 275). According to Berend (2013, 102), the
emerging social and economic system of the 19th century required a certain
minimum standard of general education and training in the masses in order to
satisfy basic technical demands of modern industry. Moreover, modern education
in Europe was not a response to Industrial Revolution, as it actually prepared it or in
a certain sense it was a prerequisite for it. Science and its direct applications,
especially technology achievements, had gained huge reputation after Second
World War. Under those circumstances, Europe experienced a services revolution
which reinforced the creation of a new category by millions of educated workers,
those of the White Collar (Berend 2009, 335). Those rapid changes in the everyday
life have also rised the demand to safeguard citizen’s rights to equal education. By
the same token, Karatzia-Stavlioti and Lambropoulos (2009, 633), note that in the
post-Second World War period the need for world peace and social development
has encouraged international organizations to contribute to the creation of a major
international education discourse, whereas experts from international agencies
were invited by politicians to advise on educational reforms and on how to borrow
and invest money in education in order to achieve social and economic
development.
Federighi (1999, 5) argues that the first state provisions promoting adult educa-
tion in Europe accomplished in Norway, during the first half of the 18th century. At
the end of the first half of the 19th century appeared the first historical studies on
adult education in the United Kingdom, a practice which had already been exported
overseas well before the independence of America, where a legislative transfer
came into effect towards the end of the Elizabethan era (Federighi 1999, 5). Many
scholars as Kokkos (2008, 59), Prokou (2008, 123) and Federighi (1999, 5) recom-
mend that adult education has become a reality with the advent of industrial society.
The necessity of modernization and constant improvement of non-formal (Rogers
2005) and informal systems learning (La Belle 1982, 159–175) emerges as a result
of the globalization of the world economy in both national and European level. In
the meanwhile, strengthening employment opportunities, reinforcing access to
142 P. Sklias and G. Chatzimichailidou

lifelong learning for all and diminishing social exclusion of the vulnerable groups
are also issues of major concern that period (Kokkos 2008, 59).
In the middle of the 20th Century, UNESCO has invested considerable efforts in
promoting adult’s education value. In the 1950s, a unique experiment carried out by
UNESCO in rural France to promote the contribution of the available technology to
the development of popular culture and adult education, the “Tele-Clubs”
(UNESCO Courier 1956, 4–6). The latters represent one of the early formations
of collective television reception and discussion in Europe. The aim was to provide
programs dealing with one of France’s most serious national problems, the mod-
ernization of agriculture and the raising of rural living standard. Another innovation
carried out by UNESCO, in 1950, in many countries around the world, Sweden
among them, offered workshop in public libraries for professional librarians,
especially interested in adult education (UNESCO Courier 1950a, 4). In the same
way was the publication of an international list of selected films of universal interest
in the field of adult education and coupled with the efforts to promote theatre for
educational purposes. Such a practice took place in Western Germany, where the
Ruhr Theatre Festival, under whose auspices by UNESCO and the Federation of
German Trade Unions for Western Germany, presented plays, such as Shakespeare,
that aimed to bring to the workers an understanding of European culture in its
widest sense (UNESCO Courier 1950a, 4). The Co-operative Society or Movement,
in 1950, was a group of men who were working together in order to serve their
needs (UNESCO Courier 1950b, 3). Those men joined together, to produce and sell
their products more efficiently and independently. Moreover, this team work served
the needs of adult education, as through the team work the older men used to train
the younger and through the benefits of education they were able to improve their
living standards. Likewise, another UNESCO’s innovation was the publication of
the ‘Guide Books’, which were textbooks for adults, written in many languages,
especially in Africa and Asia (UNESCO Courier 1950b, 3). Those textbooks aimed
at helping people to improve their lives, through the study of several daily issues as
crafts, hygiene, agriculture, nutrition and vocational subjects.
On 10 December 1948, the Universal Declaration of Human Rights, adopted by
the UN General Assembly, education clearly stated as of right for everyone (The
Universal Declaration of Human Rights 1948). The principles set forth in Article
26 advocate that everyone has the right to education and to participate freely in
cultural, artistic and scientific life. Moreover, it recognizes that education shall be
directed to the full development of the human personality and to the strengthening
of respect for human rights and fundamental freedoms. A similar approach is
supported in the Article 2 of Protocol No. 1 of the European Convention on
Human Rights, signed on 20 March 1952 in Paris (The European Convention on
Human Rights 1952), which declares that ‘No person shall be denied the right to
education’. Along similar lines the International Covenant on Economic, Social and
Cultural Rights, adopted by the United Nations General Assembly, on 16 December
1966 (International Covenant on Economic, Social and Cultural Rights 1966), in
Article 13, in addition to the aforementioned, it pays considerable attention to the
Adult Education: A Vehicle for Economic Development 143

notable education’s ability to reinforce the full development of the human person-
ality and the sense of its dignity, and to strengthen the respect of human rights and
fundamental freedoms. Moreover, education develops human’s opportunity to
participate effectively in a free society, promotes understanding, tolerance and
friendship among all nations and all racial, ethnic or religious groups and for the
maintenance of peace. The Recommendation on the Development of Adult Educa-
tion proceeded by UNESCO, while meeting in Nairobi from 26 October to
30 November 1976, becomes more specific to issues of adult education. It declares
adult education as an integral part of life-long education that can contribute
decisively to economic and cultural development, social progress and world
peace of the entire community (Recommendation on the Development of Adult
Education 1976). Furthermore, the Recommendation illustrates the contribution of
adult education to develop a critical understanding of major contemporary prob-
lems and social changes and therefore this can provide the person with the ability to
play an active role in the progress of society with a view to achieving social justice.
2.2 Defining “Adult Education” and “TransformativeLearning”
The discussion of adult education should begin with the question ‘Who is adult’.Alan Rogers (1998, 60) declares that the term ‘adult’ is usually equated to a specificage. However, there is not a specific age that determines who is adult, because both
legal and social liabilities are activated in different ages (Rogers 1998, 60).
UNESCO’s Glossary (2011) identifies this term with focus on adult’s position in
the society:
Education specifically targeting individuals who are regarded as adults by the society to
which they belong to improve their technical or professional qualifications, further develop
their abilities, enrich their knowledge with the purpose to complete a level of formal
education, or to acquire knowledge, skills and competencies in a new field or to refresh
or update their knowledge in a particular field. This also includes what may be referred to as
‘continuing education’, ‘recurrent education’ or ‘second chance education’.
The literature reveals that many studies use the term ‘lifelong learning’ andothers the term ‘adult education’. There is obviously a variety of definitions, not
only across several studies, but also across countries: Lifelong learning, adult
learning, adult education, continuous education, vocational education and training,
popular education, community education etc. This definition issue raises discus-
sions whether all scholars talk about the same thing. In 1926, Alfred Lawrence
Hall-Quest (1926) explained the difficulty in defining the term adult education ‘Itssharp definition depends in part on accepted meanings of both adult and education’.Along similar lines, Alan Rogers (1998, 53) points out the difficulties in definitions’issue. Moreover, Rogers (1998, 60) puts forward the claim that the term adult
education may refer to a few interpretations, such as: a stage in the human’s life
144 P. Sklias and G. Chatzimichailidou

cycle, his social status, the acceptance by the society that the person has completed
the compulsory education and is fully incorporated into the society or it may refer to
a social subset, as adults as a distinct category from children, or finally it may
include a set of ideals and values: adulthood. Paulo Freire (2005, 33), in his book
‘Education for critical consciousness’, in its first publication in 1973, perceives
education as ‘an act of love, and thus an act of courage’. Moreover, he stresses that
education is not the transference of knowledge but it is the encounter of Subjects in
dialogue in search of the significance of the object of knowing and thinking (Freire
2005, 126). Peter Jarvis (1999, 22), states that in United Kingdom the term lifelong
learning has entered recently the British educational library and ‘is used rather
loosely to cover all forms of post-compulsory education including family educa-
tion, community education, traditional adult education, further and higher educa-
tion and continuing professional development. It is not a technical or legal term
with precisely defined meaning but rather a cultural term denoting a new paradigm’.According to other scholars, such as Sutton and Kogan (Kokkos 2005), the term
lifelong learning denotes the infinite and eternal nature of learning, it covers the
lifespan and incorporates all forms of learning, both those provided by educational
institutions and all forms of informal learning. A vital link between adult education
and culture is provided by Talmadge Guy (1999, 5), who claims that every aspect of
adult life is shaped by culture, which refers to shared values, attitudes, beliefs,
behavior and language use within a social group. Adult education ‘has served as a
vehicle for defining the cultural values that people hold or that they view as central
to being successful in their society’ (Guy 1999, 5). Another issue to consider is
culture’s importance in shaping criteria for success or failure. Thus, a principal
focus of culturally adult education is the reconstruction of learners’ group-basedidentity from one that is negative to one that is positive (Guy 1999, 13).
A large body of literature has investigated the distinction between adult educa-
tion and vocational education and training. In 1956, Jacob Bronowski (1956, 22),
provided an example which identifies this distinction: a historian learns Medieval
Latin in order to read documents and this is an example of education ‘for a very
specific purpose, and since this purpose often helps us to earn our living, I think of it
as vocational education’. Additionally, a school-master who had just retired from
teaching mathematics, who then learned Italian in order to read Dante, it obviously
shows that he learned Italian for a specific purpose, thus this shouldn’t be consid-ered as vocational education. In a matter of fact ‘The learner was fitting himself to
derive from the work of Dante a larger, deeper sense of the many-sidedness of
human life than had reached him in translation. At 65, he was fitting himself not to
make a living but to live’ (Bronowski 1956, 22). As stressed on the 5th Conferenceon adult education in Hamburg in 1997 ‘Adult education must involve people as
actors who decide for themselves in the societal process of change, and give them
the knowledge they require for this purpose, together with the skill to apply this
knowledge responsibly’. According to the Recommendation on the Development of
Adult Education by UNESCO (1976) the term adult education denotes:
Adult Education: A Vehicle for Economic Development 145

[. . .] the entire body of organized educational processes, whatever the content, level and
method, whether formal or otherwise, whether they prolong or replace initial education in
schools, colleges and universities as well as in apprenticeship, whereby persons regarded as
adult by the society to which they belong develop their abilities, enrich their knowledge
improve their technical or professional qualifications or turn them in a new direction and
bring about changes in their attitudes or behavior in twofold perspective of full personal
development and participation in balanced and independent social, economic and cultural
development. Adult education, however, must not be considered as an entity in itself, it is a
sub-division, and an integral part of, a global scheme for life-long education and learning.
In this study the foregoing discussion on the contribution of adult education to
the empowerment of citizens to involve in the societal evolution towards social
cohesion, lays on the dominant theory of Transformative learning. According to
Kitchenham (2012, 1659) Transformational, or Transformative learning is an adult
learning theory introduced by Jack Mezirow in the late 1970s (Mezirow 1978). The
central core of the theory is the argument that adults experience is a catalyst that
causes them to question their worldview, the disorienting dilemma, which leads to a
fundamental change in the way that they view the world. Similarly, Edward Taylor
(2007, 173) explains:
Transformative learning offers a theory of learning that is uniquely adult, abstract and
idealized, grounded in the nature of human communication. It is a theory that is partly
developmental, but even more it is about where learning is understood as the process of
using a prior interpretation to construe a new or revised interpretation of the meaning of
one’s experience in order to guide future action.
According to the Encyclopedia of the Sciences of Learning (Seel 2012, 3341),
transformational learning is the process of deep, constructive, and meaningful
learning that goes beyond simple knowledge acquisition and supports critical
ways in which learners consciously make meaning of their lives. Along similar
lines Dirkx (1998) identifies transformative learning as an ongoing, continuous
process of re-constructing the meaning of our experience. Likewise, he continues
that ‘taken as narrative, this story reveals a sense of transformative learning as a
heroic journey undertaken by a rational ego in pursuit of consciousness and
enlightenment’ (Dirkx 1998). Since the publication of Mezirow’s theory, many
scholars critiqued and elaborated on the theory, leading to theoretical development
in a variety of new lenses (Taylor 2007, 174). Dirkx suggests four different lenses
that have arisen from examining transformative learning theory: Daloz’s develop-mental approach, Freire’s emancipatory approach, Boyd’s extrarational approach,and Mezirow’s rational approach (Kucukaydin and Cranton 2012, 44).
For the needs of this paper, we argue that the term adult refers to a person that is
regarded as adult by the society to which he belongs, and he is in that position to
construe meaning upon his experience and revise interpretations in order to plan
future actions. Moreover, we argue that adult education denotes the entire body of
organized educational processes, within the framework on non-formal education,
whatever the content, level and method. It actually covers the lifespan after the
cessation of formal education and it serves both as a means of personal betterment
and economic development. In essence, adult education, through the impact of
146 P. Sklias and G. Chatzimichailidou

Transformative learning theory, may foster each citizen to develop critical review
and understanding of major contemporary problems of his life, to reassess and
interpret his experiences and therefore to react and communicate with other people
and institutions and after all future action will be planed. Thence it arises that adult
education develops citizens’ ability to participate effectively in social cohesion,
which consequently might contribute to the elimination of a few disparities in the
political, social and economic realms. As a corollary, adult education will provide
citizens with some patterns or help them to construct new patterns, which might be
useful in order to react to future situations.
2.3 Defining “Economic Development”
Current research has indicated that there is no consensus view about what devel-
opment means or what it implies, as highlighted also by Cherry Gertzel (O’Brienand Williams 2011, 394). Frank Youngman (2000, 240) supports that development,
in the sense of ‘the idea that deliberate action can be undertaken to change society inchosen directions considered desirable’ is not an innovative idea, but its origin
derives from 1940s. According to the economic historian Robert Heilbroner
(Goulet 2002, 12) development is ‘the first act of world history’. A closer look at
the literature indicates many efforts to define this term. In 1969, Dudley Seers
(1969, 1) highlighted the broader sense of the word development versus economic
growth, as he argued ‘We have all been aware that development consists of much
else besides economic growth’. According to Seers (1969, 2), development is
inevitably treated as a normative concept, as almost a synonym for improvement.
The purpose of development is to reduce poverty, inequality and unemployment
and if all of these have declined from high levels, then this has been a period of
development for a country, whereas ‘If one or two of these central problems have
been growing worse, especially if all three have, it would be strange to call the
result development, even if per capita income doubled’ as Seers proposes (1969, 5).As highlighted by Sotiropoulos et al. (2005, 28), economic development is different
than economic growth, whereas the purely economic conception of development
implies an equalization of the latter to growth, which refers to the average annual
growth rate, GDP, industrial production, etc. An economy can be enlarged by
borrowing large sums of money or by exporting a single product whose control
has a financial oligarchy. Simultaneously in the same economy, other sectors might
be in deep crisis, whereas at the social level growing poverty, periodic hunger
threat, degradation of the natural environment, ethnic conflicts and illiteracy might
also appeared (Sotiropoulos et al. 2005, 28). Similarly, Goulet (2002, 12) clarifies
that ‘development does not deliver economic wellbeing to all nations and people: in
its distribution of benefits, it is not just’. Similarly, Griffin (Goulet 2002, 19) implies
that ‘there is no best path to development’.O’Brien and Williams (2011), perceive development both as a process and a
state. Whereas Thomas and Reader (O’Brien and Williams 2011) propose that the
Adult Education: A Vehicle for Economic Development 147

term development refers to a multidimensional process that involves the transition
from a less desirable to a more desirable societal situation. For Amartya Sen
(Nafziger 2005, 1) development involves reducing deprivation or broadening
choice. Deprivation represents a multidimensional view of poverty that includes
hunger, illiteracy, illness and poor health, powerlessness, voicelessness, insecurity,
humiliation, and a lack of access to basic infrastructure. Moreover, Sen suggests
that development is ‘a process of expanding the real freedoms that people enjoy’(Todaro and Smith 2012, 1). Development is the process of improving the quality of
all human lives and capabilities by raising people’s levels of living, self-esteem, and
freedom, as also highlighted by Todaro and Smith (2012, 775). Thirlwall (2001,
20), identifies Goulet’s work in broadening the notion of development in order to
include economic and social objectives and values that every society strives for.
Goulet (2002, 22), connotes that development, as pursued by the dominant econ-
omy, means maximum economic growth, whereas what it ought to be pursued is
qualitative human betterment. Moreover, Goulet (Thirlwall 2001, 20) distinguishes
three basic components or values of development:
1. Life-sustenance,
2. Self-esteem,
3. And freedom.
In this paper, we argue that economic development is both a process and a state.
It is a process as it involves the means by which a society can be transformed
towards an improvement of human lives and a state where citizens feel more
satisfied, secure, they enjoy equal opportunities to work and to have access to
basic infrastructure. In a nutshell, this is the state that people wish to stay for
more. Lest the reader be led astray, we do not argue that economic development is
separate from economic growth. Economic development declares a state in terms of
growth, where measures like GDP per capita are also very useful.
2.4 The General Framework of Social Cohesion
According to OECD (2011, 17) a cohesive society works towards the well-being of
all its members, fights exclusion and marginalisation, creates a sense of belonging,
promotes trust, and offers its members the opportunity of upward mobility.
Figure 1 presents the triangle of social cohesion, which consists of three differ-
ent, but equally important lenses: social inclusion, social capital and social mobility
(OECD 2011, 17). According to the Routledge Dictionary of Economics (2002,
539), social capital refers to: (a) Assets collectively owned for the benefit of the
community at large, (b) The benefits resulting from feelings of sympathy and
obligation. These feelings underlie terms of trade, the provision of health and
education, and access to goods and services. Social mobility implies the movement
of individuals, families and groups from one class or status group to another (The
Palgrave Macmillan Dictionary of Political Thought 2007, 644). Social inclusion
148 P. Sklias and G. Chatzimichailidou

can be seen as the process by which societies combat poverty and social exclusion
in order to create a “society for all” (United Nations—Analysing and Measuring
Social Inclusion in a Global Context 2010, 1). According to Eleni Prokou (2011,
220), there is no one single process of inclusion, but there are a number of different
forms of inclusion being promoted and then legitimised by society itself. The need
to build an inclusive society constitutes one of EU’s structural indicators. As
highlighted in the Memorandum on Lifelong Learning (Commission of the
European Communities 2000, 220), a framework of partnership should be achieved
among member states in the field of lifelong learning in order to build an inclusive
society which offers equal opportunities for access to quality learning throughout
life to all people, and in which education and training provision is based first and
foremost on the needs and demands of individuals.
OECD has introduced a few indicators to measure social cohesion, such as Life
Satisfaction (OECD–Social Cohesion Indicators 2014, 134). Data on life satisfac-
tion comes from the Gallup World Poll, which is conducted in more than 150 coun-
tries around the world based on a common questionnaire, translated into the
predominant languages of each country. Life satisfaction is determined not only
by economic development, but also by people’s diverse experiences and living
conditions. One could envisage that this measurement defines both social cohesion
and economic development, because as mentioned in the previous chapter, the
authors of this paper have introduced the framework of economic development
which incorporates the state of self-satisfaction. Figure 2 presents the data from the
survey conducted in 42 counties, which indicates the average points of life satis-
faction in 2012. As can be seen, there are broad regional country groups of life
satisfaction. On the top of the list are five Nordic countries, whereas it is obvious
that continental Western and Eastern European OECDmembers are not particularly
satisfied with their lives, with the notable exceptions of Switzerland, Austria and the
Netherlands. On the other hand, Life satisfaction is deteriorated in European
Mediterranean countries.
Fig. 1 The components of social cohesion
Adult Education: A Vehicle for Economic Development 149

3 The Methodological Framework of International
Political Economy
As highlighted in the preface the majority of the studies that investigate the
contribution of education to economic development lay on neoclassical economics
and particularly on HCT. Emrullah Tan (2014) claims that HCT is a comprehensive
approach to analyze a wide spectrum of human affairs in light of a particular
mindset, however it has serious limitations in its analytic framework by which
the neoclassical model attempts to explain social and economic phenomena. In the
Fig. 2 Average points of life satisfaction on an 11-step ladder from 0 to 10, 2012
150 P. Sklias and G. Chatzimichailidou

meanwhile, as mentioned above, HCT measures the quantitative dimension
between education or schooling and economic growth. In effect, this was a disin-
centive for this paper’s authors, whose main concern was to explore the qualitative
dimension of economic development. Robert Gilpin (2002, 55) admits that neo-
classical economics are being used by the majority of the economists, whereas
several limitations in its framework, especially with regards to matters pertaining to
social reality, are very clear. Sklias et al. (2013, 143) propose that initiating from
the principles of neoclassical economics, then the developmental phenomenon and
the formulation of development conditions are affected by internal factors and
variables as well. On the basis of this point, adult education can be seen as one of
the strongest links of the chain of development together with politics and
economics.
The scientific approach of IPE appeared in mid-1970, as a result of the economic
reality which was formed after the oil crisis of 1974 and the collapse of the financial
system of Bretton Woods (Andrianos 2008, 81; Hancock and Vivoda 2014, 207).
Murphy and Nelson (2001, 393) state that today’s field of IPE can be traced back to
1971, when Susan Strange founded the International Political Economy Group
(IPEG), which in its days focused on how to resuscitate the fixed exchange-rate
system, as according to Fred Hirsch, comfortable middle-class people in the
industrialized world would doubt the utility of further economic growth. The key
to the institutionalization of IPE, by attracting funders, researchers, initiating
graduate programs and creating ubiquitous undergraduate courses, was probably
the 1973 October War in the Middle East with its first deployment of the oil weapon
and the long recession that followed (Murphy and Nelson 2001, 394). Benjamin
Cohen (2007, 10) declares that for some scholars, the moment of IPE’s birth came
with the publication of a seminal article by Strange in 1970, entitled ‘InternationalEconomics and International Relations: A Case of Mutual Neglect’, whereas forothers it came a year later when Strange followed up her own call to action by
forming an organized research network, the International Political Economy Group
(IPEG).
IPE is an interdisciplinary field, which draws on many distinct academic schools,
most notably Political Economy, Political Science and Economics, also Sociology,
History, and cultural studies (Wikipedia 2015). This offers the opportunity to use
tools from other disciplines. According to Hancock and Vivoda (2014, 206), IPE is
a subfield of International Relations (IR) itself, one of the primary fields in Political
Science. This argument actually derives from the agenda of the American school of
IPE (Cohen 2007, 7). On the other hand, IR should be considered as a subdiscipline
of IPE according to the British school of IPE (Cohen 2007, 10). Amanda Dickins
(2006, 479) suggests that IPE emerged as the International Economy developed
apace in the 1960s, sparking interest in the politics of the International Economy
and drew upon diverse sources, including Economics and History as well as
International Relations. The early development of IPE incorporates two types of
IPE scholar, one type predominates in the United States, the rationalist species,
Ratiosaurus rex, and the other in the United Kingdom and Canada, the diverse
critical species, Querimonia (Dickins 2006, 480). Cohen (2007, 1) claims that
Adult Education: A Vehicle for Economic Development 151

beyond an interest in marrying international economics and IR, there is no consen-
sus at all on what, precisely, IPE is about, because once born the field proceeded to
develop along separate paths followed by quite different clusters of scholars.
As highlighted by Murphy and Nelson (2001, 395), there are two schools of IPE
on both sides of the Atlantic: The American school or International Organization
(IO) and the British school. Cohen (2007, 1) advocates that the dominant -the
hegemonic- globally version of IPE is developed by the American school, where
‘Analysis is based on the twin principles of positivism and empiricism, which hold
that knowledge is best accumulated through an appeal to objective observation and
systematic testing’. On the contrary, the British style of IPE is less wedded to
scientific method and more to normative issues, also its supporting scholars are
more receptive to links with other academic disciplines, beyond mainstream eco-
nomics and political science (Cohen 2007, 2). Sklias et al. (2012, 18) claim that IPE
is a renowned intellectual and methodological tool, suitable for the diachronic study
of social, economic and political issues. Despite different views, opinions and
approaches of IPE, researchers converge onto one point: there is an integration of
economy and politics, also of domestic and international within IPE (Sklias
et al. 2012, 18). In other words, it seems that those demarcation lines between
both economy and politics, and ‘internal’ and ‘external’ do not exist anymore
(Sklias et al. 2012, 21). Robert Gilpin (2002, 84), insists that IPE depends on the
theory and the knowledge that arises from neoclassical economics. Nonetheless,
IPE and neoclassical economics impose different questions, as both of them use
different analysis framework. The discussion in this paper is premised on the
analytical framework of the British school of IPE. According to Cohen (2007, 3),
this school offers a broader field of study, concerned with all manner of social and
ethical issues, identifying injustice, promoting social development and its driving
ambition is to make the world a better place. Whereas, in the American school the
core object of study is limited to questions of state behavior and system governance,
its driving ambition is to explore possible solutions to challenges within the existing
system and finally restricts itself mainly to mid-level theorizing-highlighting key
relationships with larger stable structures (Cohen 2007, 3).
4 An Analysis of the Correlation Between Adult Education
and Economic Development
In the current study we have investigated the origins and the role of adult education.
We argue that adult education programs in current aspects of today’s political,
social and economic realms, might eliminate a few disparities in the above realms,
enhance social inclusion, and simultaneously empower citizens’ action towards a
cohesive society. It is of great importance that education should not be seen as a
self-constrained enterprise, but as a parameter in a complex context where educa-
tion coexists and interacts with the political, social and economic realms. John
152 P. Sklias and G. Chatzimichailidou

White (2013, 295) underlines philosophers’ inclination forwards the linkage
between education and some wider, ethical and political philosophical questions
about the kind of life it is good for a human being and coexistence in a political
community. In addition, it is of our belief that adult education very much deter-
mines the identity and quality of social cohesion towards economic development.
Moreover, in this paper we propose the construction of a European plan for adult
education, which might empower every member state to adopt/construct and
promote specific programs for its citizens, concerning their needs, in order to
accomplish the above targets for eliminating disparities and empowering citizens’action. This European plan should be voluntary, whereas a central authority of
distinguished scholars would provide recommendations and any help to the mem-
ber states upon best practices in adult education programs from around Europe.
Moreover, those adult education programs will be put forward Transformative
learning, through which every citizen will be reinforced to develop a critical
understanding of major contemporary problems and social changes, and therefore
his ability to participate effectively in a cohesive society will be developed. In the
meanwhile, social cohesion strengthens the respect for human rights and funda-
mental freedoms, such as security, self-esteem, democracy, well-being and access
to basic infrastructure for all citizens. Notwithstanding, we argue that this position
is unlikely to achieve economic and social prosperity for all, although there are
elements in the proposed program that are desirable.
Those adult education programs could be in branches as: (a) Domestic (Pan)
European and international migration, in order to help people take advantage of the
opportunities and tackle the challenges of increased cross-border mobility,
(b) Enhancing Democratic participation and active citizenship, (c) Empowering
vulnerable people, (d) Tackling political extremism, (e) Dealing with terrorism and
the fear it spreads etc. All the above grounds threaten the fragments of a cohesive
society. Moreover, these programs will reinforce EU’s policies in the field of
lifelong learning and adult education. According to Milana and Holford (2014, 1)
European adult education has emerged within national contexts and only recently
Europe has seen an attempt to build an unprecedented supranational polity.
European Commission has encouraged member-states to share and exchange
knowledge about their national systems in peer-to-peer activities, working groups
and networks and therefore, all member states are now involved in debates—
domestic and international—on the status and development of adult education
(Milana and Holford 2014, 2). One issue to analyze further is whether adult
education is re-positioned away from social policy framework towards vocational
training. Vocational training is less oriented towards old-style social policy making
in favor of organizations, NGOs etc. In 1999, Colin Griffin (1999) gave a compre-
hensive review of the scope and limitations of lifelong learning and the welfare
state reform. In the first place Griffin describes the role and scope of lifelong
learning up to his days, in the light of European Commission’s approach. Then,he underlines that there is a shift away from education towards learning, which also
connotes the abandonment of education as social policy in favour of individual
learning as government strategy (Griffin, 431–432). Nowadays, according to Rees
Adult Education: A Vehicle for Economic Development 153

(2013, 200), ‘governments, especially in the more developed economies, have
prioritized vocational provision, often at the expense of other types of adult
learning’. Adult learning has been defined in terms of its potential contribution to
economic activity, hence, many national governments have shifted priorities for
adult learning towards direct vocational provision (Rees 2013, 201). Further
research will therefore concentrate on this shift towards vocational training, within
European Union in the forthcoming papers.
Within the framework of the British school of IPE, we have the opportunity to
approach the notion of economic development, within a broader qualitative frame-
work. We support the idea, along with other scholars, of reinforcing the qualitative
dimension of economic development which should incorporate citizens’ action andopinion on their opportunities to well-being. Also, in this paper we argue that
economic development is a state and a process that involves the means by which
a society can be transformed towards an improvement of human lives and a state
where citizens feel more satisfied, secure, they enjoy equal opportunities to work
and have access to basic infrastructure. Within the chain of economic development,
adult education may be one of the strongest links. The above assumptions provide
further evidence that there is a correlation between a cohesive society and economic
development. On these grounds we argue that adult education could serve as a
vehicle for economic development in the developed countries.
A summary of these thoughts is included in Fig. 3.
5 Conclusion
The significance of this paper is the attempt to explore the potential of the contri-
bution of adult education in economic development, within the framework of IPE in
EU. Adult education and economic development strengthen one another. In this
framework citizens play a vital role as they are reinforced to form and hold together
with other people and the institutions, the fragments of a cohesive society towards
Transformative learning
Fostering social cohesion
Citizen
participates in adult education
programs
Critical review of major
contemporary
problems and social changes
React and communicate with
other people and
institutions
Plan future actionInvolve in the
societal evolution
Adopt or construct
new patterns
Personal betterment/economic
development
Fig. 3 The correlation between adult education and economic development
154 P. Sklias and G. Chatzimichailidou

economic development. The methodological framework of International Political
Economy is adopted in this study in order to analyze the benefits of both economic
development and adult education, differentiated from the dominant neoclassical
approach framework of the HCT. Adult education may be one of the strongest links
of the chain of economic development and it may very much determine the identity
and quality of economic development. Further findings of this study will be
presented in future papers. Considerably, more work will need to be done to
determine the role of adult education to economic development.
References
Andrianos I (2008) The impact of cultural and social characteristics into economic development of
Western Balkans. Unpublished Doctoral Dissertation. Democritus University of Thrace
Berend I (2009) An economic history of twentieth-century Europe. Gutenberg, Athens (In Greek)
Berend I (2013) An economic history of nineteenth-century Europe. Cambridge University Press,
New York, NY
Bronowski J (1956) The educated man in 1984. http://unesdoc.unesco.org/images/0007/000781/
078152eo.pdf#68667. Accessed 11 July 2015
Cohen B (2007) The transatlantic divide: why are American and British IPE so different? Lecture
presented to the inaugural meeting of the International Political Economy Society, Princeton
University, Princeton, New Jersey, 17 November 2006. https://escholarship.org/uc/item/
28k8z2t4#page-2. Accessed 27 Sept 2015
Commission of the European Communities (2000) Commission staff working paper: a memoran-
dum on lifelong learning, Brussels, 30.10.2000, SEC (2000) 1832
Dickins A (2006) The evolution of international political economy. Int Aff 82(3):479–492
Dirkx JM (1998) Knowing the self through fantasy: toward a mytho-poetic view of transformative
learning. Paper presented at the 39th Annual adult education research conference. http://www.
adulterc.org/Proceedings/1998/98dirkx.htm. Accessed 11 July 2015
Federighi P (1999) Glossary of adult learning in Europe. European Association for the Education
of Adults (EAEA) and UNESCO Institute for Education. http://www.unesco.org/education/
uie/pdf/glossary.pdf. Accessed 11 July 2015
Freire P (2005) Education for critical consciousness. Continuum, London
Gaganakis K (1999) Social and economic history of Europe. Hellenic Open University, Patra
(in Greek)
Gilpin R (2002) Global political economy: understanding the international economic order.
Poiotita Publishers-Princeton University Press, Athens (in Greek)
Goulet D (2002) What is a just economy in a globalized world? Int J Soc Econ 29(1/2):10–25
Griffin C (1999) Lifelong learning and welfare reform. Int J Lifelong Educ 18(6):431–452
Guy TC (1999) Culture as context for adult education: the need for culturally relevant adult
education. New Dir Adult Contin Educ 1999(82):5–18
Hall-Quest LA (1926) The university afield. http://babel.hathitrust.org/cgi/pt?id¼mdp.
39015004281351;view¼1up;seq¼24. Accessed 10 July 2015
Hancock KJ, Vivoda V (2014) International political economy: a field born of the OPEC crisis
returns to its energy roots. Energy Res Soc Sci 1:206–216
Jarvis P (1999) Lifelong learning. In: Federighi P (ed) Glossary of adult learning in Europe.
European Association for the Education of Adults (EAEA) and UNESCO Institute for Educa-
tion. http://www.unesco.org/education/uie/pdf/glossary.pdf. Accessed 11 July 2015
International Covenant on Economic, Social and Cultural Rights (1966) http://www.ohchr.org/
EN/ProfessionalInterest/Pages/CESCR.aspx. Accessed 9 July 2015
Adult Education: A Vehicle for Economic Development 155

Kitchenham A (2012) Jack Mezirow on transformative learning. In: Seel MN (ed) Encyclopedia of
the sciences of learning. Springer, New York, NY
Kokkos A (2005) Adult education methodology. Hellenic Open University, Patra (In Greek)
Kokkos A (2008) Adult education in Greece. Convergence 42(2/3):59–73
Kucukaydin I, Cranton P (2012) Critically questioning the discourse of transformative learning
theory. Adult Educ Q 63(1):43–56
La Belle TJ (1982) Formal, nonformal and informal education: a holistic perspective on lifelong
learning. Int Rev Educ 28(2):159–175
Milana M, Holford J (2014) Adult education policy and the European Union. https://www.
sensepublishers.com/media/1971-adult-education-policy-and-the-european-union.pdf.
Accessed 12 July 2015
Mezirow J (1978) Perspective transformation. Adult Educ Q 28(2):100–110
Murphy CN, Nelson DR (2001) International political economy: a tale of two heterodoxies. Br J
Polit Int Relat 3(3):393–412
Nafziger EW (2005) From seers to Sen: the meaning of economic development. http://www.
rrojasdatabank.info/widerconf/Nafziger.pdf. Accessed 11 July 2015
O’Brien R, Williams M (2011) Global political economy. Papazisis Publishers, Athens (In Greek)
OECD (2011) Perspectives on global development 2012: executive summary. http://www.oecd.org/
site/devpgd2012/49067839.pdf. Accessed 11 July 2015
OECD–Social Cohesion Indicators (2014) http://www.oecd-ilibrary.org/docserver/download/
8113171ec027.pdf?expires¼1435769266&id¼id&accname¼guest&checksum¼6BFE53602
B0ED7FEF10AE13FA5AF8BF6. Accessed 11 July 2015
Prokou E (2008) A comparative approach to lifelong learning policies in Europe: the cases of the
UK, Sweden and Greece. Eur J Educ 43(1):123–140
Prokou E (2011) The aims of employability and social inclusion/active citizenship in lifelong
learning policies in Greece, The Greek Review of Social Research, Special Issue 136 C’,pp 203–223
Psacharopoulos G (1996) Economics of education: a research agenda. Econ Educ Rev 15(4):
339–344
Recommendation on the Development of Adult Education (1976) http://portal.unesco.org/en/ev.php-
URL_ID¼13096&URL_DO¼DO_TOPIC&URL_SECTION¼201.html.Accessed 11 July 2015
Rees G (2013) Comparing adult learning systems: an emerging political economy. Eur J Educ
48(2):200–212
Rogers A (1998) Teaching adults. Metaixmio, Athens (In Greek)
Rogers A (2005) Non-Formal education. Flexible schooling or participatory education? Springer,
New York, NY
Routledge Dictionary of Economics (2002) http://down.cenet.org.cn/upfile/33/2009522115641174.
pdf. Accessed 8 July 2015.
Schultz T (1972) The economic value of education. Papazisis Publishers, Athens
Seel MN (2012) Encyclopedia of the sciences of learning. Springer, New York, NY
Seers D (1969) The meaning of development. https://www.ids.ac.uk/files/dmfile/themeaningof
development.pdf. Accessed 11 July 2015
Sklias P (2001) Global political economy. Papazisis Publishers, Athens (In Greek)
Sklias P, Koutsoukis N-S, Roukanas S (2013) Culture, politics and economics: dynamics, mecha-
nisms and processes for sustainable development. Int J Sustain Soc 5(2):133–145
Sklias P, Roukanas S,Maris G (2012) The politics of International and European economic relations.
Papazisis Publishers, Athens (In Greek)
Sotiropoulos DA, Huliaras A, Roussos S, Sklias P (2005) Third world: politics, society, economy,
international relations. Papazisis Publishers, Athens (In Greek)
Karatzia-Stavlioti E, Lambropoulos H (2009) Education and economic development: evaluations
and ideologies. In: Cowen R, Kazamias AM (eds) International handbook of comparative
education. Springer, New York, NY, pp 633–650
Tan E (2014) Human capital theory: a holistic criticism. Rev Educ Res 84(3):411–445
156 P. Sklias and G. Chatzimichailidou

Taylor E (2007) An update of transformative learning theory: a critical review of the empirical
research (1999–2005). Int J Lifelong Educ 26(2):173–191
The Palgrave Macmillan Dictionary of Political Thought (2007) 3rd edn. http://text-translator.
com/wp-content/filesfa/Dictionary-of-political-thoughts.pdf. Accessed 11 July 2015
The Universal Declaration of Human Rights (1948) http://www.un.org/en/documents/udhr/.
Accessed 11 July 2015
The European Convention on Human Rights (1952) http://conventions.coe.int/Treaty/en/Treaties/
Html/009.htm. Accessed 11 July 2015
Thirlwall AP (2001) Growth and development. Papazisis Publishers, Athens (In Greek)
Todaro MP, Smith SC (2012) Economic development, 11th edn. http://eco.eco.basu.ac.ir/
BasuContentFiles/57/57304a77-1269-4081-bd5b-4c66b84b06a4.pdf. Accessed 11 July 2015
UNESCO Courier (1950a) Libraries—a neglected resource. http://unesdoc.unesco.org/images/
0008/000815/081543eo.pdf#81543. Accessed 11 July 2015
UNESCO Courier (1950b) Struggle against ignorance and inertia. http://unesdoc.unesco.org/
images/0007/000749/074977eo.pdf#74977. Accessed 11 July 2015
UNESCO Courier (1956) What’s wrong on French farms. http://unesdoc.unesco.org/images/0007/
000781/078152eo.pdf#68667. Accessed 11 July 2015
UNESCO Glossary (2011) Adult education. http://glossary.uis.unesco.org/glossary/en/term/1944/
en. Accessed 11 July 2015
UNITED NATIONS—Analysing and Measuring Social Inclusion in a Global Context (2010)
http://www.un.org/esa/socdev/publications/measuring-social-inclusion.pdf. Accessed 11 July
2015
Youngman F (2000) The political economy of adult education and development. Zed Books,
London
White J (2013) Philosophy, philosophy of education and economic realities. Theory Res Educ 11
(3):294–303
Wikipedia (2015) International political economy. https://en.wikipedia.org/wiki/International_
political_economy. Accessed 11 July 2015
Pantelis Sklias is a professor of International Political Economy (IPE) at the Department of
Political Science and International Relations of the University of Peloponnese, Corinth Greece. He
was also a visiting lecturer at the Department of International and European Studies of the
University of Macedonia and visiting lecturer and assistant professor from 2002 to 2007 at the
Department of International Economic Relations and Development of the Dimocritus University
of Thrace. Since 2002, he has taught at the Hellenic Open University. From 1999 to 2002, he was a
visiting research fellow at the Postgraduate Centre for Culture, Development and the Environment
(CDE) of the University of Sussex. His research interests include institutions, international
development, and civil society.
Giota Chatzimichailidou is a PhD Candidate at the Department of Political Science and
International Relations of the University of Peloponnese. She writes a PhD thesis with the title
“The contribution of Adult Education to Economic Development”. Her research interests include
Adult Education, International and European Political Economy, Development and Governance.
Adult Education: A Vehicle for Economic Development 157