diin papr ri - ftp.iza.orgftp.iza.org/dp11455.pdf · diin papr ri iza dp no. 11455 stijn baert...
TRANSCRIPT

DISCUSSION PAPER SERIES
IZA DP No. 11455
Stijn BaertSunčica VujićSimon AmezMatteo ClaeskensThomas DamanArno MaeckelbergheEddy OmeyLieven De Marez
Smartphone Use and Academic Performance: Correlation or Causal Relationship?
APRIL 2018
Any opinions expressed in this paper are those of the author(s) and not those of IZA. Research published in this series may include views on policy, but IZA takes no institutional policy positions. The IZA research network is committed to the IZA Guiding Principles of Research Integrity.The IZA Institute of Labor Economics is an independent economic research institute that conducts research in labor economics and offers evidence-based policy advice on labor market issues. Supported by the Deutsche Post Foundation, IZA runs the world’s largest network of economists, whose research aims to provide answers to the global labor market challenges of our time. Our key objective is to build bridges between academic research, policymakers and society.IZA Discussion Papers often represent preliminary work and are circulated to encourage discussion. Citation of such a paper should account for its provisional character. A revised version may be available directly from the author.
Schaumburg-Lippe-Straße 5–953113 Bonn, Germany
Phone: +49-228-3894-0Email: [email protected] www.iza.org
IZA – Institute of Labor Economics
DISCUSSION PAPER SERIES
IZA DP No. 11455
Smartphone Use and Academic Performance: Correlation or Causal Relationship?
APRIL 2018
Stijn BaertGhent University, Research Foundation-Flanders, University of Antwerp, Université catholique de Louvain, IMISCOE and IZA
Sunčica VujićUniversity of Antwerp and University of Bath
Simon AmezGhent University
Matteo ClaeskensGhent University
Thomas DamanUniversity of Antwerp
Arno MaeckelbergheGhent University
Eddy OmeyGhent University
Lieven De MarezGhent University and Imec
ABSTRACT
IZA DP No. 11455 APRIL 2018
Smartphone Use and Academic Performance: Correlation or Causal Relationship?
After a decade of correlational research, this study is the first to measure the causal impact
of (general) smartphone use on educational performance. To this end, we merge survey
data on general smartphone use, exogenous predictors of this use, and other drivers of
academic success with the exam scores of first-year students at two Belgian universities.
The resulting data are analysed with instrumental variable estimation techniques. A one-
standard-deviation increase in daily smartphone use yields a decrease in average exam
scores of about one point (out of 20). When relying on ordinary least squares estimations,
the magnitude of this effect is substantially underestimated.
JEL Classification: I21, I23, L86
Keywords: smartphone use, academic performance, causality
Corresponding author:Stijn BaertGhent UniversitySint-Pietersplein 6B-9000 GhentBelgium
E-mail: [email protected]

1. Introduction
Across OECD countries, in recent years, the question of whether or not smartphone use (i.e.
the time that an individual is active on her/his smartphone per day or per week) affects
performance and quality of life has occupied an important place in social debate (see, e.g.,
Eliahu, 2014; OECD, 2017; Samuel, 2017). This debate is fuelled by a multidisciplinary
scientific literature that not only relates smartphone use to reduced performance during
driving, walking, and working, but also to poorer study results (Abouk and Adams, 2013;
Andreassen, 2015; Bhargava and Pathania, 2013; Lepp et al., 2013; Levine et al., 2012).
Scholars’ interest in the connection between smartphone use and the latter outcome
(poorer study results) is not surprising. Smartphone use in the OECD region has increased
massively during the past decade (Lepp et al., 2015; Vanhaelewyn and De Marez, 2017),
such that its potential adverse effect on educational performance may have a major societal
impact. In the present study, we contribute to this literature concerning the interplay
between (general) smartphone use and educational performance.
There are several theoretical mechanisms that support a causal effect of smartphone
use on educational performance. On the one hand, the use of a smartphone may improve
the efficiency of students’ study activities by allowing them to continuously search for
(study-related) information and by facilitating teamwork (Chen and Yan, 2016; Hawi and
Samaha, 2016). On the other hand, research has shown that students see their smartphones
primarily as sources of entertainment, rather than as study tools (Barkley and Lepp, 2013;
Lepp et al., 2013). As a result, a trade-off, in terms of time use à la Becker (1965) between
smartphone use and study activities can be expected (Chen and Yan, 2016; Lepp et al.,
2015). Apart from this trade-off in time use, there are two other theoretical reasons why a
negative relationship could be expected. Firstly, the desire to use one’s smartphone in order
to not miss anything that is happening online—nowadays often referred to as ‘FOMO’ (fear
of missing out)—and to continuously interact with the rest of the world may lead to a lack
of the kind of focus necessary to achieve good study performance (Chen and Yan, 2016;
Firat, 2013). Secondly, the constant switching back and forth between study-related and
social activities on the smartphone could result in cognitive overload and inefficiency (Chen
and Yan, 2016; Compernolle, 2014; Oulasvirta et al., 2012).

The recent empirical literature on this phenomenon is in line with the dominance of
mechanisms that predict a negative relationship between smartphone use and educational
performance. We are aware of seven studies that directly investigated their empirical
association: Chen and Ji (2015), Lepp et al. (2014), Lepp et al. (2015), Li et al. (2015), Ng et
al. (2017), Olufadi (2015), and Wentworth and Middleton (2014). More specifically,
analysing survey data from the United States, Lepp et al. (2014, 2015) and Li et al. (2015)
found a negative association between total smartphone use and the actual or self-reported
grade point average (GPA) of college students, while Wentworth and Middleton (2014)
concluded that there was no such association in their data. In addition, Ng et al. (2017) and
Olufadi (2015) determined a negative association between mobile phone use during tertiary
education and GPA in Malaysia and Nigeria, respectively. Finally, Chen and Ji (2015) reported
that university students in Taiwan who used their personal electronic device(s) more for
non-educational pursuits, had a lower first-year GPA. We refer to Amez et al. (2018) for a
thorough review of this literature.1
As several of these studies themselves indicated, however, no causal interpretation can
be given to any of their results. This is due to an endogeneity problem. The studies’ results
were obtained through correlation analyses and/or (multiple) linear or logistic regression
analyses based on cross-sectional data. As a consequence, the measured non-positive
association between smartphone use and academic performance might reflect variation in
unobserved personal characteristics, such as intelligence, general ability, and motivation,
which these studies did not control for, but which could affect both smartphone use and
academic performance. This is an important limitation. As long as there is uncertainty as to
whether the negative association between smartphone use and educational performance
reflects a causal relationship (and not merely a connection via confounding factors), there
1 In addition, a few other articles relate smartphone addiction (instead of general use) to educational
underperformance (Hawi and Samaha, 2016; Samaha and Hawi, 2016). Besides this literature on the association
between general smartphone use (and addiction) and educational performance, a further few articles exist that
examine the association between the use of specific electronic applications (via one’s smartphone and/or other
devices) and study performance. For example, previous research investigated the association between study
performance and the extent to which people call (Jacobsen and Forste, 2011) and check Facebook (Lee, 2014).
However, these studies ignore the fact that the use of electronic devices for a particular application is strongly
correlated with their use for other activities (Chen and Yan, 2016; Lepp et al., 2015), potentially resulting in an
omitted variable bias. Finally, work has been done on the effectiveness of smartphone ban interventions in
classrooms (Beland and Murphy, 2015).

is no solid basis for interventions such as the smartphone ban in French schools (Samuel,
2017).
This study is the first to attempt to measure the causal impact of (overall) smartphone
use on educational performance. To this end, we exploit data from 696 first-year students
at two Belgian universities, who were surveyed in December 2016 using multiple scales on
smartphone use as well as predictors of this smartphone use and a battery of questions
concerning (potential) other drivers of success at university. This information is merged with
the students’ scores on their first exams, taken in January 2017. We analyse the merged
data by means of instrumental variable estimation techniques. More concretely, to be able
to correctly identify the influence of smartphone use on academic achievement, in a first
stage, the respondents’ smartphone use is predicted by diverging sets of variables that are
highly significantly associated with smartphone use, but not directly associated with
educational performance. In a second stage, the exam scores are regressed on this
exogenous prediction of smartphone use and the largest set of control variables used in the
literature to date.
The remainder of this article is structured as follows. In Section 2, we inform the reader
about the data gathered to meet our research goals and about our approach to the making
of causal inferences based on these data. Then, in Section 3, we discuss the findings of our
main analyses and some robustness checks. The final section states our conclusions, with a
preview for potential further research.
2. Methods
2.1 Research Population
The data used to investigate the effect of smartphone use on academic performance comes
from merging unique survey data from first-year university students in Belgium with their
first university exam scores. Our survey took place at the end of their first semester, in
December 2016, i.e. just before the start of the Christmas holidays. These holidays are used
by students to prepare for their first semester exams, which take place immediately after

the Christmas holidays. More concretely, we surveyed all students attending the last lecture
of a first-semester course in all 11 Bachelor programs in three faculties at Ghent University
and University of Antwerp, i.e. the two main universities in the two biggest cities in Flanders,
namely Ghent and Antwerp. These programs were: Business and Economics, Commercial
Sciences, and Public Administration and Management in the faculty of Economics and
Business Administration at Ghent University; Business Economics, Economic Policy, Business
Engineering, and Management Information Systems in the faculty of Applied Economics at
University of Antwerp; and Communication Studies, Political Science, Social and Economic
Sciences, and Sociology in the faculty of Social Sciences at University of Antwerp.
In total, 1117 students attended the classes at the start of which we gathered our survey
data. This was done by means of a paper-and-pencil questionnaire. Among these students,
767 indicated, as a part of the survey, that they were in their first year at university (the
other ones had had to resit the course, or were taking it as an elective course in the context
of another program). We retained only this homogeneous group of first-year students. At
the end of the survey, the attending students were asked whether they consented to their
answers being merged with their first-semester exam scores by a third party, and 747 of the
767 first-year students consented. For 17 of them, no exam scores were observed, as they
had dropped their courses by the end of the exam period. Finally, we had to exclude 18
students who indicated that they did not have smartphones, and 16 students with missing
or inconsistent information. Consequently, our analyses are based on a sample of 696 first-
year students with complete information.
2.2 Data
We surveyed smartphone use by means of three indicators. Firstly, we let the participants
fill in the Smartphone Usage Subscale of Rosen et al. (2013). This scale comprises nine items
in which respondents indicate the frequency with which they use their smartphone for nine
activities (such as ‘making and receiving mobile phone calls’ and ‘checking for text
messages’), rated on a 10-point frequency scale (ranging from ‘never’ to ‘all the time’).
These items were averaged to derive a scale from 1 to 10, with higher scores indicating more
frequent smartphone use. The Cronbach’s alpha on this scale for our sample was 0.746. In
the remainder of the present manuscript, we refer to this scale as ‘overall smartphone use’.

In addition, by analogy with Rosen et al. (2016), we surveyed the participants on their
smartphone use during classes and during study activities by means of the items: ‘During a
typical class period, how often do you check your smartphone for something other than the
time?’ and ‘During a typical hour of studying, how often do you check your smartphone for
something other than the time?’. These had to be scored on a 7-point frequency scale
(ranging from ‘never’ to ‘more than eight times’; Rosen et al., 2016). In the remainder of this
manuscript, we refer to these scores as ‘smartphone use while attending class’ and
‘smartphone use while studying’. Panel A of Table 1 presents the average scores for the
three indicators of smartphone use in our sample. The average score with respect to overall
smartphone use is 5.701, while the average score with respect to smartphone use while
attending class and while studying is 4.499 (i.e. between three and five times per course
period) and 3.198 (i.e. close to two times per hour of study), respectively.
<Table 1 about here>
Next, we gathered information on variables that were important for our statistical
analysis being predictors of smartphone use that were assumed to have no independent
impact on exam scores. These potential instruments—the adequacy of diverging sets of
which are tested in Section 3—are: (i) whether the respondent had 4G technology on their
smartphone (binary variable); (ii) six binary variables capturing the respondents’
smartphone contracts (i.e. whether the monthly download volume included in the contract
was 1GB or more, as well as indicators of having Proximus, Base, Orange, Telenet, or another
player as an operator); (iii) perceived quality of the WiFi network in the respondents’
classrooms (based on the respondents’ answers to the item ‘How do you evaluate the
average quality of your internet access in the classrooms this semester?’, ranging from 1
(very bad) to 5 (very good)); and (iv) whether the respondent had to pay their smartphone
costs themselves (binary variable). Panel B of Table 1 shows the respondents’ average scores
on these instruments, for the full sample as well as for the subsamples of individuals with a
below-average versus above-average score on the overall smartphone use scale. The
indicators of 4G technology and a substantial download volume show the highest
correlations with smartphone use.
With respect to (additional) control variables for our analyses, firstly, we constructed
indicator variables of the programs in which the data were gathered. In addition, we
surveyed the respondents on the socioeconomic determinants of exam scores proposed in
Baert et al. (2015): gender, age, (foreign) origin, language spoken at parental home, paternal
education—we also surveyed maternal education, but this turned out to be heavily
correlated with paternal education, so that we did not retain this construct for our
analyses—household composition, relationship status, general health, living in a student
room (versus at home), distance between home and university, and prior educational
attainment. In addition, we let the respondents fill in the 28 items of the College Version of
the Academic Motivation Scale of Vallerand et al. (1992), yielding a motivation score
between 1 and 7, and the six items of the Webexec scale of Buchanan et al. (2010), yielding
a measure of executive functioning problems between 1 and 5. A final control variable
captured by our survey was whether or not the respondents used their laptop (versus paper
and pencil) to take notes during classes most of the time. As shown in Panel C of Table 1,
the subsample of individuals with a relatively high smartphone use particularly comprises
more students (i) in the Political Science program, (ii) with a migration background, (iii) in
(fairly) bad health, (iv) using their laptop to take notes in class, (v) living close to university,
and (vi) having graduated from secondary education with low marks. As these factors are
also likely to affect academic performance, controlling for them is desirable when identifying
the impact of smartphone use on exam scores.
Finally, Panel D of Table 1 presents statistics on the three academic outcome variables
we constructed based on the respondents’ exam scores for their first semester at university.
Our main outcome variable (‘average score: completed exams’) is the average of the
respondents’ scores (graded between 0 and 20) over all exams sat by them, leaving out
observations for which they were not present at the exam. A first alternative outcome
variable (‘average score: potential exams’) equals our main outcome variable except that
the exam score for when students did not show up is recoded as the minimum score of 0. A
second alternative outcome variable (‘fraction of exams passed’) is calculated by dividing
the number of exams the respondents passed (by obtaining at least 10 out of 20 points) by
their total number of exams taken.2 In line with the correlational literature cited in Section
1, all academic performance indicators are substantially less beneficial in the subsample of
respondents with relatively high smartphone use. However, this comparison does not take
2 Analyses at the individual exam score level (with course fixed effects) yielded very similar research conclusions.
into account selection, neither on the observable respondent characteristics listed in Panel
C of Table 1, nor on the unobservable characteristics that may correlate with both
smartphone use and academic performance. The instrumental variable regression approach
we discuss in the following subsection deals with this double endogeneity problem.
2.3 Empirical Approach
Our main strategy for tackling the endogeneity of smartphone use (as captured by one of
the variables in Panel A of Table 1) and academic performance (as captured by one of the
variables in Panel D of Table 1) is to rely on an instrumental variable regression framework
(Angrist and Pischke, 2008; Baert et al., 2015). In the first stage of this two-stage least
squares (2SLS) approach, the respondents’ smartphone use is predicted by (a selection of)
the instrumental variables included in Panel B of Table 1. As these variables are assumed to
affect educational performance (after controlling for the other drivers of success at
university included in Panel C of Table 1)3 only indirectly through actual smartphone use,
this first stage yields an ‘exogenous prediction’ of the respondents’ smartphone use. In the
second stage, academic performance is regressed on this predicted use (and the control
variables).
Both assumptions on which the causal interpretation of our results is based are tested
empirically. Firstly, with respect to the strength of our instrumental variables (i.e. their
predictive power concerning smartphone use), we conduct F-tests of their joint significance
in the first stage of the 2SLS regressions. Secondly, with respect to the exogeneity of our
instrumental variables, we present overidentification tests (Basmann, 1960). Besides these
empirical tests, we conduct a sensitivity analysis in which alternative combinations of
instrumental variables are used to prove that our identification does not hinge on one or
two particular instruments.
In addition to being the first study in the literature on (general) smartphone use and
educational performance to apply a statistical technique that controls for unobserved
3 In particular, we control for household wealth by means of our controls for paternal education level.
Interestingly, from Panel C of Table 1, it can be seen that smartphone use hardly varies by paternal education
level. The same is true with respect to our instrumental variables, i.e. they do not seem to be substantially
correlated with the household’s socioeconomic status.

determinants of academic success, in our analyses we also control for a set of individual
performance determinants that is larger than those used in the previous research
mentioned in Section 1. Consequently, we minimise the number of factors influencing both
smartphone use and academic performance that are omitted from the regression analysis
and estimate the effect of smartphone use within homogeneous subgroups of individuals.
Thereby, the ordinary least squares (OLS) estimates to which we compare our 2SLS
estimates should already approximate the true effect of smartphone use on educational
performance (for our sample) more closely than the corresponding estimates reported in
previous studies.
3. Results
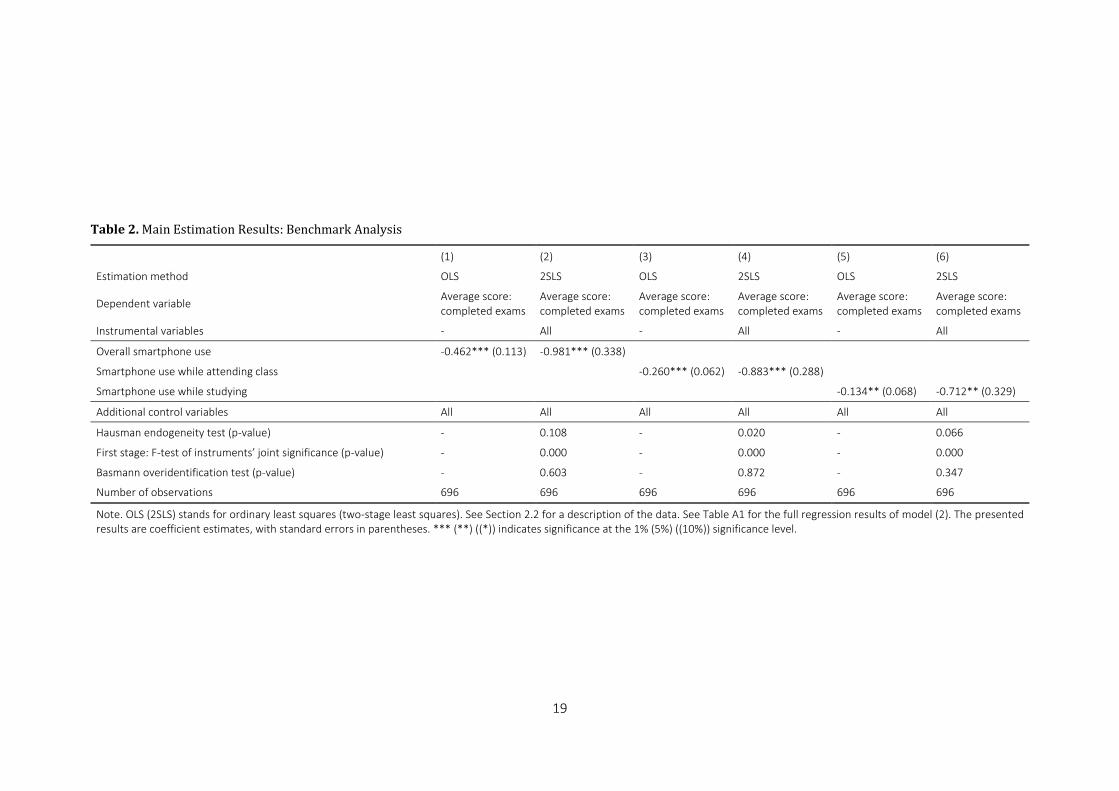
Table 2 presents the main estimation results of our benchmark analysis. This analysis
comprises six regressions in which our main outcome variable, i.e. the respondent’s average
score on her/his completed exams, is explained by diverging independent variables (i.e. the
overall smartphone use scale in models (1) and (2), smartphone use while attending class in
models (3) and (4), and smartphone use while studying in models (5) and (6)) and all control
variables mentioned in Panel C of Table 1. In columns (1), (3), and (5), we present OLS
estimates, while in columns (2), (4), and (6), we present—our preferred—2SLS estimates
exploiting the variation in all instruments listed in Panel B of Table 1. The full estimation
results of model (2) are shown in Table A1 in Appendix A.
<Table 2 about here>
Irrespective of the estimation method used and the indicator of smartphone use chosen,
we find negative coefficients of this indicator, which are significantly different from 0 at least
at the 5% significance level. According to our 2SLS estimates in column (2) of Table 2, a unit
increase on the overall smartphone use scale yields a decrease in exam score by 0.981 points
(p = 0.004), ceteris paribus. In other words, given that the standard deviation (SD) of the
overall smartphone use scale is 0.925, an increase on the overall smartphone use scale with
one standard deviation decreases the average exam score by 1.061 (i.e. 0.981/0.925) points.
In addition, a one-standard-deviation increase on the scales with respect to smartphone use

while attending class (SD = 1.724) and studying (SD = 1.586) yields a decrease in the average
exam score with 0.512 (i.e. 0.883/1.724) and 0.449 (i.e. 0.712/1.586) points, respectively.
Interestingly, the magnitude of these 2SLS estimates is more than twice that of the
corresponding OLS estimates. This suggests that university students with a relatively high
smartphone use are a negatively selected subpopulation—negatively selected with respect
to unobserved success determinants of academic performance—of the overall population
of university students.4 The need to control for unobserved heterogeneity in this context is
also revealed by the p-values of the Hausman endogeneity tests we performed based on
models (2), (4), and (6). Exogeneity of the adopted smartphone use indicators is, even after
controlling for a large set of controls, rejected at the 5% significance level for model (4),
rejected at the 10% significance level for model (6), and close to rejection at the 10%
significance level for model (2). Moreover, Table 2 provides empirical support for the two
crucial assumptions underlying our 2SLS approach mentioned in Section 2.3. Firstly, the used
instruments are significant predictors of our smartphone use indicators—the p-value of the
related F-test is always 0.000. Secondly, the Basmann overidentification test is never (close
to) significant, supporting the exogeneity of the used instruments with respect to exam
scores.
We briefly discuss some secondary results concerning the other determinants of
academic success adopted in our models as controls. Table A1 shows that exam scores are
higher among those students (i) starting at university at a younger age (ergo, with less or no
grade retention during their secondary education), (ii) having Dutch as the main language
spoken at home, (iii) not having divorced parents, (iv) showing a higher academic motivation,
(v) living in a student room, (vi) living closer to the university, and (vii) having graduated from
secondary education with high marks. A structural interpretation of the coefficients for
these control variables is hazardous, however, as they might be endogenous to educational
performance.
In what follows, we report on the results of two analyses performed to check the
robustness of our benchmark analysis. In these sensitivity analyses, we rely on the overall
smartphone use scale as the independent variable, but the conclusions are the same when
4 We provide an alternative explanation when we discuss our research limitations in Section 4.

relying on the other two smartphone use indicators.
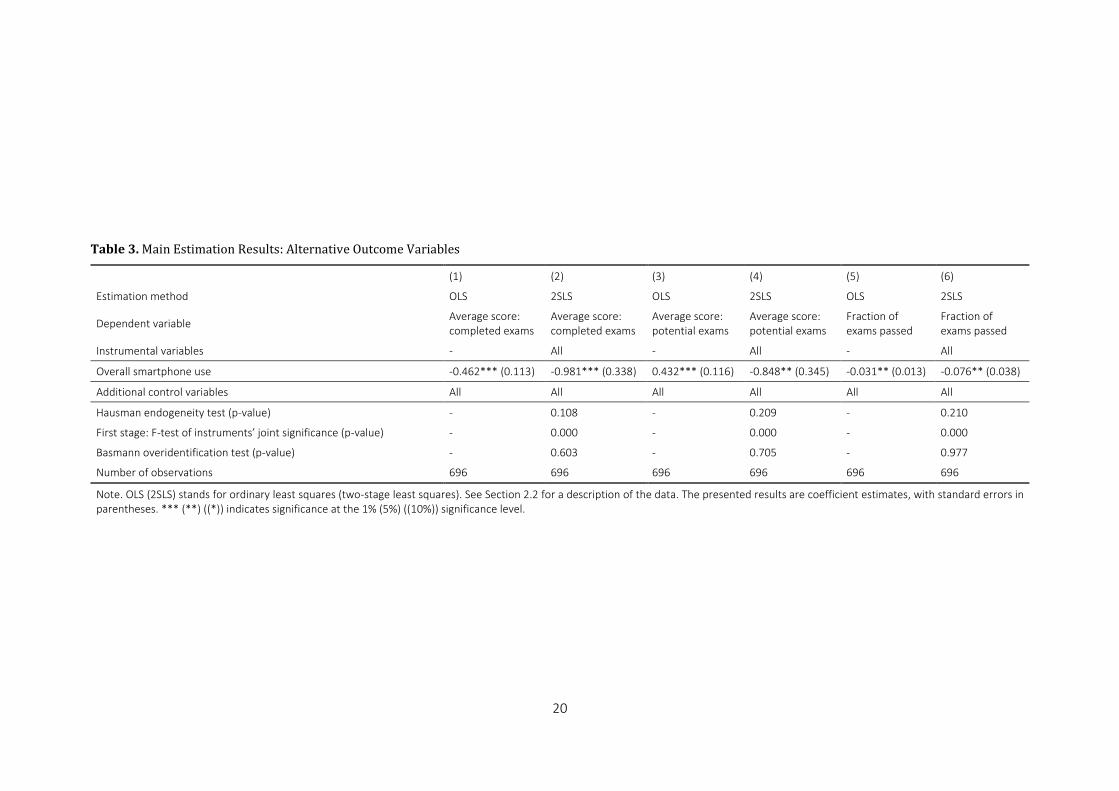
Firstly, we test the robustness of our results for the use of alternative outcome variables,
i.e. the respondents’ average scores on their potential exams (instead of completed exams)
and the fraction of completed exams they pass. The OLS and 2SLS estimates with respect to
the former alternative outcome variable are presented in columns (3) and (4) of Table 3,
respectively, while the corresponding estimates with respect to the latter alternative
outcome variable are presented in columns (5) and (6). To facilitate comparison between
these estimation results and those in our benchmark analysis, we adopt columns (1) and (2)
of Table 2 as columns (1) and (2) of Table 3. The results in column (4) are very close to those
in column (2): a unit increase on the overall smartphone use scale decreases the exam score
averaged over all potential exams with 0.848 points (p = 0.014). In addition, a unit increase
on the overall smartphone use scale yields a decrease in the respondents’ fraction of passed
exams by 7.6 percentage points (p = 0.044), ceteris paribus. So, higher smartphone use does
not only negatively affect exam scores but these lower exam scores also result in a higher
probability of failing courses.
<Table 3 about here>
Secondly, we test the robustness of our results for the use of alternative sets of
instrumental variables to identify our 2SLS estimates of the effect of smartphone use on
exam scores. More concretely, in Table 4, we present the main estimation results of six 2SLS
models, in which, starting from the specification of model (2) in our benchmark analysis, two
out of four (clusters of) instruments are dropped. Stated otherwise, identification of
regressions (2) to (7) of Table 4 is based on two out of the four (clusters of) instruments used
in model (2) of Table 2 only. However, our findings turn out to be fairly independent of which
set of instruments is used.5
<Table 4 about here>
5 The somewhat lower significance of the effect of smartphone use in Column (6) and Column (7) of Table 4 may
be related to a weak instrument problem (as supported by the p-value of the F-test, which is in these cases
slightly higher than 0.000; Angrist and Pischke, 2008).

4. Conclusions
In this study, we contributed to recent literature concerning the association between
smartphone use and educational performance by providing the first causal estimates of the
effect of the former on the latter. To this end, we analysed unique data on 696 first-year
university students in Belgium. We found that a one-standard-deviation increase in their
overall smartphone use yields a decrease in their average exam score of about one point
(out of 20). This negative relationship is robust to the use of alternative indicators of
smartphone use and academic performance. As our results add to the literature evidence
for heavy smartphone use not only being associated with lower exam marks but also causing
lower marks, we believe that policy-makers should at least invest in information and
awareness campaigns to highlight this trade-off.
We end this article by acknowledging its main limitations. Firstly, we measured the
impact of smartphone use on exam scores for first-year university students attending classes
in 11 study programs at three faculties in Belgium. Although we have no a priori reasons to
expect that the relationship between smartphone use and academic performance would be
different for other groups of students and/or other regions, our results cannot be
automatically generalised to these other groups. Therefore, we are in favour of studies
complementing our findings via similar investigations based on data from other kind of
students and other regions.
Secondly, even when instrumental variables are valid—and empirical tests supported
that this was the case in our analyses—2SLS estimations always only isolate a local average
treatment effect (LATE; Angrist and Pischke, 2008). That is, the effect of smartphone use
measured in this study was identified based only on the respondents whose smartphone
use was affected by the included instrumental variables. This is an alternative explanation
for our 2SLS estimates being of a higher magnitude than the corresponding OLS estimates.
In this respect, however, it is important to recall that the higher smartphone use effects
found based on our preferred approach were independent of which particular set of
instruments was adopted. Nevertheless, we look forward to future work measuring the
causal impact of smartphone use on academic performance using other statistical
approaches (e.g. fixed-effects estimations exploiting longitudinal data).

References
Abouk, R., Adams, S. (2013): Texting bans and fatal accidents on roadways: Do they work?
Or do drivers just react to announcements of bans? American Economic Journal: Applied
Economics, 5, 179–199.
Amez, S., De Marez, L., Baert, S. (2018): Smartphone Use and Academic Performance: a
Review. Mimeo.
Andreassen, C. S. (2015): Online social network site addiction: A comprehensive review.
Current Addiction Reports, 2, 175–184.
Angrist, J. D., Pischke, J.-S. (2008). Mostly Harmless Econometrics: An Empiricist's
Companion. Princeton: Princeton University Press.
Baert, S., Verhaest, D., Vermeir, A., Omey, E. (2015): Mister Sandman, bring me good marks!
On the relationship between sleep quality and academic achievement. Social Science &
Medicine, 130, 91–98.
Barkley, J. E., Lepp, A. (2013): Cellular telephone use is associated with greater sedentary
behavior independent of leisure time physical activity. Applied Physiology, Nutrition, and
Metabolism, 38(S1), 1023.
Basmann, R. L. (1960): On finite sample distributions of generalized classical linear
identifiability test statistics. Journal of the American Statistical Association, 55, 650–659.
Becker, G. S. (1965): A theory of the allocation of time. Economic Journal, 75, 493–517.
Beland, L.-P., Murphy, R. (2015): Ill Communication: Technology, distraction & student
performance. CEP Discussion Paper Series, 1350.
Bhargava, S., Pathania, V. (2013): Driving under the (cellular) influence. American Economic
Journal: Economic Policy, 5, 92–125.
Buchanan, T., Heffernan, T. M., Parrott, A. C., Ling, J., Rodgers, J., Scholey, A. B. (2010): A
short self-report measure of problems with executive function suitable for
administration via the Internet. Behavior Research Methods, 42, 709–714.
Chen, Q., Yan, Z. (2016): Does multitasking with mobile phones affect learning? A review.

Computers in Human Behaviour, 54, 34–42.
Chen, R. S., Ji, C. H. (2015): Investigating the relationship between thinking style and personal
electronic device use and its implications for academic performance. Computers in
Human Behavior, 52, 177–183.
Compernolle, T. (2014): Ontketen je brein. Hoe hyperconnectiviteit en multitasking je
hersenen gijzelen en hoe je eraan kunt ontsnappen. Tielt: Lannoo.
Eliahu, J. (2014): 10 ways smartphones have completely ruined our lives. Retrieved on 21
November 2017 from https://thoughtcatalog.com/jim-eliahu/2014/04/10-ways-
smartphones-have-completely-ruined-our-lives/.
Firat, M. (2013): Multitasking or continuous partial attention: A critical bottleneck for digital
natives. Turkish Online Journal of Distance Education, 14, 1302–6488.
Hawi, N. S., Samaha, M. (2016): To excel or not to excel: Strong evidence on the adverse
effect of smartphone addiction on academic performance. Computers & Education, 98,
81–89.
Jacobsen, W. C., Forste, R. (2011): The wired generation: Academic and social outcomes of
electronic media use among university students. Cyberpsychology, Behavior, and Social
Networking, 14, 275–280.
Lee, E. B. (2014): Facebook use and texting among African American and Hispanic teenagers:
An implication for academic performance. Journal of Black Studies, 45, 83–101.
Lepp, A., Barkley, J. E., Karpinski, A. C. (2014): The relationship between cell phone use,
academic performance, anxiety, and satisfaction with life in college students. Computers
in Human Behavior, 31, 343–350.
Lepp, A., Barkley, J. E., Karpinski, A. C. (2015): The relationship between cell phone use and
academic performance in a sample of U.S. college students. SAGE Open, 5, 1–9.
Lepp, A., Barkley, J. E., Sanders, G. J., Rebold, M., Gates, P. (2013): The relationship between
cell phone use, physical and sedentary activity, and cardiorespiratory fitness in a sample
of U.S. college students. International Journal of Behavioral Nutrition and Physical
Activity, 10, 79.
Levine, L. E., Waite, B. M., Bowman, L. L. (2012): Mobile media use, multitasking and

distractibility. International Journal of Cyber Behavior, Psychology and Learning, 2, 15–
29.
Li, J., Lepp, A., Barkley, J. E. (2015): Locus of control and cell phone use: Implications for sleep
quality, academic performance and subjective well-being. Computers in Human
Behavior, 52, 450–457.
OECD (2017): OECD Digital Economy Outlook 2017. Paris: OECD.
Olufadi, Y. (2015): A configurational approach to the investigation of the multiple paths to
success of students through mobile phone use behaviors. Computers & Education, 86,
84–104.
Oulasvirta, A., Rattenbury, T., Ma, L., Raita, E. (2012): Habits make smartphone use more
pervasive. Personal and Ubiquitous Computing, 16, 105–114.
Ng, S. F., Hassan, N. S. I. C. H., Nor, N. H. M., Malek, N. A. A. (2017): The relationship between
smartphone use and academic performance: A case of students in a Malaysian tertiary
institution. Malaysian Online Journal of Educational Technology, 3, 58–70.
Rosen, L., Whaling, K., Carrier, L. M., Cheever, N. A., Rokkum, J. (2013): The Media and
Technology Usage and Attitudes Scale: An empirical investigation. Computers in Human
Behavior, 29, 2501–2511.
Rosen, L., Carrier, L. M., Miller, A., Rokkum, J., Ruiz, A. (2016): Sleeping with technology:
Cognitive, affective, and technology usage predictors of sleep problems among college
students. Sleep Health, 2, 49–56.
Samaha, M., Hawi, N. S. (2016): Relationships among smartphone addiction, stress,
academic performance and satisfaction with life. Computers in Human Behavior, 57,
321–325.
Samuel, H. (2017): France to impose total ban on mobile phones in schools. Retrieved on 21
November 2017 from www.telegraph.co.uk/news/2017/12/11/france-impose-total-
ban-mobile-phones-schools/.
Vallerand, R. J., Pelletier, L. G., Blais, M. R., Briere, N. M., Senecal, C., Vallieres, E. F. (1992):
The Academic Motivation Scale: A measure of intrinsic, extrinsic and amotivation in
education. Educational and Psychological Measurement, 52, 1003–1017.

Vanhaelewyn, B., De Marez, L. (2017): Digimeter 2016: Measuring Digital Media Trends in
Flanders. Ghent: Imec.
Wentworth, D. K., Middleton, J. H. (2014): Technology use and academic performance.
Computers & Education, 78, 306–311.
Appendix A: Additional Tables
<Table A1 about here>

17
Table 1. Data Description
(1) (2) (3) (4)
Average
Difference: (3) – (2)
Full sample
N = 696
Subsample: Overall smartphone use below average
N = 333
Subsample: Overall smartphone use above average
N = 363
A. Smartphone use
Overall smartphone use 5.701 4.970 6.372 1.402*** [30.602]
Smartphone use while attending class 4.499 3.934 5.017 1.083*** [8.709]
Smartphone use while studying 3.198 2.958 3.419 0.461*** [3.866]
B. Predictors of smartphone use
4G technology on smartphone 0.846 0.769 0.917 0.149*** [5.540]
Download volume of 1GB or more 0.451 0.390 0.507 0.116*** [3.102]
Operator: Proximus 0.352 0.378 0.328 -0.051 [1.394]
Operator: Base 0.109 0.099 0.118 0.019 [0.817]
Operator: Orange 0.260 0.237 0.281 0.044 [1.314]
Operator: Telenet 0.220 0.219 0.220 0.001 [0.037]
Operator: other 0.059 0.066 0.052 -0.013 [0.767]
Perceived quality of WiFi in classrooms 3.555 3.491 3.614 0.123* [1.915]
Paying smartphone costs herself/himself 0.168 0.159 0.176 0.017 [0.604]
C. Control variables
Program: University of Antwerp 0.365 0.366 0.364 -0.003 [0.075]
Program: Ghent University, Business and Economics 0.352 0.372 0.333 -0.039 [1.077]
Program: Ghent University, Commercial Sciences 0.214 0.204 0.223 0.019 [0.608]
Program: Ghent University, Public Administration and Management 0.069 0.057 0.080 0.023 [1.187]
Program: University of Antwerp, Business Economics 0.151 0.141 0.160 0.019 [0.686)
Program: University of Antwerp, Economic Policy 0.017 0.024 0.011 -0.013 [1.316]
Program: University of Antwerp, Business Engineering 0.014 0.018 0.011 -0.007 [0.774]
Program: University of Antwerp, Management Information Systems 0.053 0.057 0.050 -0.007 [0.438]
Program: University of Antwerp, Communication Studies 0.042 0.045 0.039 -0.006 [0.427]
Program: University of Antwerp, Political Science 0.016 0.006 0.025 0.019** [1.988]
Program: University of Antwerp, Social and Economic Sciences 0.043 0.036 0.050 0.014 [0.879]
Program: University of Antwerp, Sociology 0.029 0.039 0.019 -0.020 [1.559]
Female 0.510 0.508 0.512 0.005 [0.129]

18
Age 18.057 18.051 18.063 0.012 [0.367]
Foreign origin 0.152 0.123 0.179 0.056** [2.055]
Dutch is not main language at home 0.099 0.081 0.116 0.035 [1.527]
Highest diploma father: no tertiary education 0.358 0.363 0.353 -0.011 [0.295]
Highest diploma father: tertiary education outside college 0.299 0.294 0.303 0.009 [0.251]
Highest diploma father: tertiary education in college 0.343 0.342 0.344 0.002 [0.056]
At least one parent passed away 0.022 0.018 0.025 0.007 [0.614]
Divorced parents 0.208 0.192 0.223 0.031 [1.004]
Number of siblings: none 0.096 0.090 0.102 0.012 [0.528]
Number of siblings: one 0.510 0.514 0.507 -0.007 [0.174]
Number of siblings: two 0.295 0.297 0.292 -0.005 [0.153]
Number of siblings: more than two 0.099 0.099 0.099 0.000 [0.003]
In a relationship 0.355 0.387 0.325 -0.062* [1.717]
General health: (fairly) bad 0.040 0.024 0.055 0.031** [2.088]
General health: fairly good 0.575 0.565 0.584 0.019 [0.518]
General health: very good 0.385 0.411 0.361 -0.051 [1.368]
Academic motivation scale 4.969 4.936 4.999 0.064 [1.400]
Executive functioning problems scale 1.801 1.772 1.828 0.056 [1.587]
Using laptop to take notes in class 0.171 0.123 0.215 0.092*** [3.231]
Living in a student room 0.343 0.378 0.311 -0.067* [1.864]
Distance between home and university (in km) 34.100 36.402 31.988 -4.414** [2.316]
Program in secondary education: Economics - languages/sports 0.283 0.234 0.328 0.094*** [2.749]
Program in secondary education: Economics - maths 0.216 0.246 0.187 -0.059* [1.891]
Program in secondary education: Ancient languages 0.188 0.201 0.176 -0.025 [0.839]
Program in secondary education: Exact sciences - maths 0.147 0.153 0.140 -0.013 [0.471]
Program in secondary education: other 0.167 0.165 0.168 0.003 [0.102]
General end marks in secondary education: less than 70% 0.374 0.339 0.405 0.066* [1.789]
General end marks in secondary education: between 70% and 80% 0.494 0.502 0.488 -0.014 [0.366]
General end marks in secondary education: more than 80% 0.132 0.159 0.107 -0.052** [2.016]
D. Academic performance
Average score: completed exams 10.973 11.550 10.443 -1.107*** [4.620]
Average score: potential exams 10.888 11.442 10.380 -1.062*** [4.355]
Fraction of exams passed 0.646 0.689 0.606 -0.083*** [3.219]
Notes. See Section 2.2 for a description of the data. T-tests are performed to test whether the differences presented in Column (3) are significantly different from 0. *** (**) ((*)) indicates significance at the 1% (5%) ((10%)) significance level. T-statistics are between brackets.
19
Table 2. Main Estimation Results: Benchmark Analysis
(1) (2) (3) (4) (5) (6)
Estimation method OLS 2SLS OLS 2SLS OLS 2SLS
Dependent variable Average score: completed exams
Average score: completed exams
Average score: completed exams
Average score: completed exams
Average score: completed exams
Average score: completed exams
Instrumental variables - All - All - All
Overall smartphone use -0.462*** (0.113) -0.981*** (0.338)
Smartphone use while attending class -0.260*** (0.062) -0.883*** (0.288)
Smartphone use while studying -0.134** (0.068) -0.712** (0.329)
Additional control variables All All All All All All
Hausman endogeneity test (p-value) - 0.108 - 0.020 - 0.066
First stage: F-test of instruments’ joint significance (p-value) - 0.000 - 0.000 - 0.000
Basmann overidentification test (p-value) - 0.603 - 0.872 - 0.347
Number of observations 696 696 696 696 696 696
Note. OLS (2SLS) stands for ordinary least squares (two-stage least squares). See Section 2.2 for a description of the data. See Table A1 for the full regression results of model (2). The presented results are coefficient estimates, with standard errors in parentheses. *** (**) ((*)) indicates significance at the 1% (5%) ((10%)) significance level.
20
Table 3. Main Estimation Results: Alternative Outcome Variables
(1) (2) (3) (4) (5) (6)
Estimation method OLS 2SLS OLS 2SLS OLS 2SLS
Dependent variable Average score: completed exams
Average score: completed exams
Average score: potential exams
Average score: potential exams
Fraction of exams passed
Fraction of exams passed
Instrumental variables - All - All - All
Overall smartphone use -0.462*** (0.113) -0.981*** (0.338) 0.432*** (0.116) -0.848** (0.345) -0.031** (0.013) -0.076** (0.038)
Additional control variables All All All All All All
Hausman endogeneity test (p-value) - 0.108 - 0.209 - 0.210
First stage: F-test of instruments’ joint significance (p-value) - 0.000 - 0.000 - 0.000
Basmann overidentification test (p-value) - 0.603 - 0.705 - 0.977
Number of observations 696 696 696 696 696 696
Note. OLS (2SLS) stands for ordinary least squares (two-stage least squares). See Section 2.2 for a description of the data. The presented results are coefficient estimates, with standard errors in parentheses. *** (**) ((*)) indicates significance at the 1% (5%) ((10%)) significance level.

21
Table 4. Main Estimation Results: Alternative Instrumental Variable Combinations
(1) (2) (3) (4) (5) (6) (7)
Estimation method 2SLS 2SLS 2SLS 2SLS 2SLS 2SLS 2SLS
Dependent variable Average score: completed exams
Average score: completed exams
Average score: completed exams
Average score: completed exams
Average score: completed exams
Average score: completed exams
Average score: completed exams
Instrumental variables All
4G technology on smartphone, Download volume of 1GB or more, Operator: Base, Operator: Orange, Operator: Telenet, and Operator: other
4G technology on smartphone and Perceived quality of WiFi in classrooms
4G technology on smartphone and Paying smartphone costs herself/himself
Download volume of 1GB or more, Operator: Base, Operator: Orange, Operator: Telenet, Operator: other, and Perceived quality of WiFi in classrooms
Download volume of 1GB or more, Operator: Base, Operator: Orange, Operator: Telenet, Operator: other, and Paying smartphone costs herself/himself
Perceived quality of WiFi in classrooms and Paying smartphone costs herself/himself
Overall smartphone use -0.981*** (0.338) -0.885** (0.349) -0.907** (0.375) -0.766** (0.391) -1.407*** (0.526) -1.201* (0.616) -1.844* (0.997)
Additional control variables All All All All All All All
Hausman endogeneity test (p-value)
0.108 0.197 0.222 0.428 0.059 0.221 0.120
First stage: F-test of instruments’ joint significance (p-value)
0.000 0.000 0.000 0.000 0.000 0.001 0.005
Basmann overidentification test (p-value)
0.603 0.567 0.237 0.394 0.635 0.558 0.416
Number of observations 696 696 696 696 696 696 696
Note. OLS (2SLS) stands for ordinary least squares (two-stage least squares). See Section 2.2 for a description of the data. The presented results are coefficient estimates, with standard errors in parentheses. *** (**) ((*)) indicates significance at the 1% (5%) ((10%)) significance level.

22
Table A1. Full Estimation Results: 2SLS Regression of Average Completed Exam Score on Smartphone Use
Stage First Second
Dependent variable Overall smartphone use Average score: completed exams
Instruments All All
Overall smartphone use -0.981*** (0.338)
4G technology on smartphone 0.630*** (0.095)
Download volume of 1GB or more 0.237*** (0.070)
Operator: Proximus
Operator: Base 0.215* (0.128)
Operator: Orange 0.114 (0.087)
Operator: Telenet -0.015 (0.092)
Operator: other 0.035 (0.154)
Perceived quality of WiFi in classrooms 0.103** (0.043)
Paying smartphone costs herself/himself -0.008 (0.095)
Program: University of Antwerp -0.056 (0.116) 0.080 (0.341)
Program: Ghent University, Business and Economics (reference)
Program: Ghent University, Commercial Sciences 0.076 (0.107) 1.829*** (0.321)
Program: Ghent University, Public Administration and Management 0.212 (0.149) 1.001** (0.454)
Program: University of Antwerp, Business Economics (reference)
Program: University of Antwerp, Economic Policy -0.200 (0.268) 0.506 (0.808)
Program: University of Antwerp, Business Engineering 0.289 (0.296) -0.324 (0.880)
Program: University of Antwerp, Management Information Systems -0.006 (0.181) 0.169 (0.537)
Program: University of Antwerp, Communication Studies 0.017 (0.192) -0.467 (0.573)
Program: University of Antwerp, Political Science 0.535* (0.288) 1.589* (0.886)
Program: University of Antwerp, Social and Economic Sciences 0.084 (0.186) 2.159*** (0.560)
Program: University of Antwerp, Sociology -0.258 (0.220) -0.146 (0.662)
Female -0.052 (0.071) -0.333 (0.213)
Age -0.019 (0.081) -0.697*** (0.243)
Foreign origin 0.191 (0.124) -0.624* (0.371)
Dutch is not main language at home 0.045 (0.151) -0.992** (0.445)
Highest diploma father: no tertiary education (reference)
Highest diploma father: tertiary education outside college 0.084 (0.085) 0.326 (0.254)
Highest diploma father: tertiary education in college 0.142* (0.084) 0.259 (0.253)
At least one parent passed away -0.325 (0.239) -0.286 (0.717)
Divorced parents 0.009 (0.086) -0.706*** (0.257)
Number of siblings: none (reference)
Number of siblings: one -0.166 (0.119) -0.253 (0.359)
Number of siblings: two -0.168 (0.127) -0.280 (0.383)
Number of siblings: more than two -0.229 (0.153) -0.331 (0.462)
In a relationship -0.076 (0.071) 0.194 (0.215)
General health: (fairly) bad (reference)
General health: fairly good -0.458** (0.176) 0.357 (0.548)
General health: very good -0.488*** (0.181) 0.566 (0.562)
Academic motivation scale 0.143** (0.058) 0.498*** (0.181)
Executive functioning problems scale 0.005 (0.076) -0.336 (0.228)
Using laptop to take notes in class 0.168* (0.095) 0.197 (0.295)
Living in a student room -0.045 (0.085) 0.686*** (0.253)
Distance between home and university (in km) -0.001 (0.002) -0.015*** (0.005)
Program in secondary education: Economics - languages/sports 0.131 (0.109) -0.404 (0.330)
Program in secondary education: Economics - maths -0.011 (0.120) 1.405*** (0.360)
Program in secondary education: Ancient languages 0.011 (0.122) 1.256*** (0.366)
Program in secondary education: Exact sciences - maths 0.172 (0.137) 1.550*** (0.411)

23
Program in secondary education: other (reference)
General end marks in secondary education: less than 70% (reference)
General end marks in secondary education: between 70% and 80% 0.074 (0.076) 2.029*** (0.226)
General end marks in secondary education: more than 80% -0.112 (0.116) 3.166*** (0.354)
Intercept 4.749*** (1.532) 24.931*** (4.965)
Hausman endogeneity test (p-value) - 0.108
F-test of instruments’ joint significance (p-value) 0.000 -
Basmann overidentification test (p-value) - 0.603
Number of observations 696 696
Note. See Section 2.2 for a description of the data. The presented results are coefficient estimates, with standard errors in parentheses. *** (**) ((*)) indicates significance at the 1% (5%) ((10%)) significance level.