digitization of ecological history in the driftless area
TRANSCRIPT
OpenRiver OpenRiver
Ecological History StoryMaps Ecological History
2021
Digitization of Ecological History in the Driftless Area of Digitization of Ecological History in the Driftless Area of
Minnesota Minnesota
St. Mary's University of Minnesota-GeoSpatial Services
Winona State University-Library Special Collections
Follow this and additional works at: https://openriver.winona.edu/ecologicalhistorystorymaps
Part of the Earth Sciences Commons, Forest Sciences Commons, Geographic Information Sciences
Commons, Physical and Environmental Geography Commons, Plant Sciences Commons, and the Spatial
Science Commons
Recommended Citation Recommended Citation St. Mary's University of Minnesota-GeoSpatial Services and Winona State University-Library Special Collections, "Digitization of Ecological History in the Driftless Area of Minnesota" (2021). Ecological History StoryMaps. 3. https://openriver.winona.edu/ecologicalhistorystorymaps/3
This Report is brought to you for free and open access by the Ecological History at OpenRiver. It has been accepted for inclusion in Ecological History StoryMaps by an authorized administrator of OpenRiver. For more information, please contact [email protected].
Saint Mary’s University of Minnesota GeoSpatial Services
Winona State University
Winona County Historical Society
Digitization of Ecologic History in the Driftless Area of
Minnesota

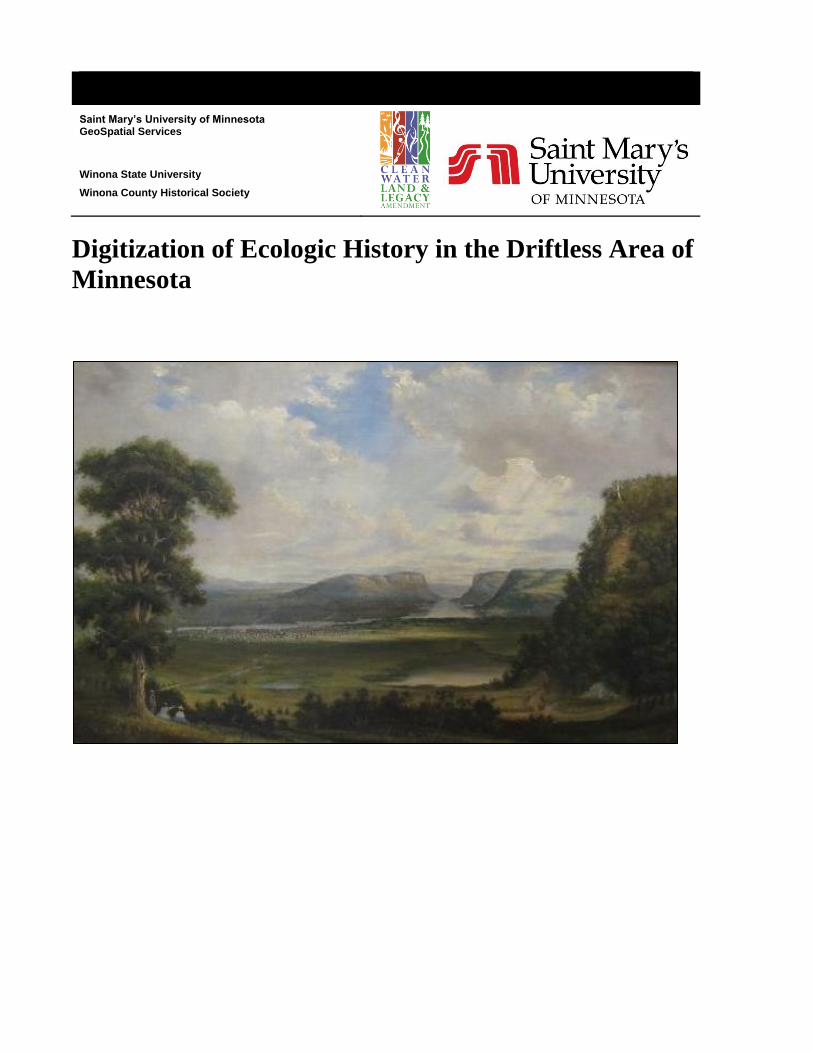
ON THE COVER
Oil painting showing an 1867 view of Winona from Clark's Lane (Winona County Historical Society Collections,
2015.037.0001).
Digitization of Ecologic History in the Driftless Area of
Minnesota
Kathy Allen
Roger Meyer
Andy Robertson
Kevin Stark
GeoSpatial Services
Saint Mary’s University of Minnesota
890 Prairie Island Road
Winona, Minnesota 55987
February 2021


i
Contents
Page
Figures .................................................................................................................................................... ii
Tables .................................................................................................................................................... iv
Appendices ............................................................................................................................................. v
Executive Summary .............................................................................................................................. vi
Acknowledgments (or similar)............................................................................................................. vii
Acronyms and Abbreviations............................................................................................................... vii
1. Introduction ........................................................................................................................................ 1
1.1. Origins of the Public Land Survey System ............................................................................. 2
1.2. 1855 Land Survey of Winona Township ................................................................................. 3
2. Process and Results ............................................................................................................................ 6
2.1. Digitizing PLS Information ..................................................................................................... 6
2.2. Creation of Historic Vegetation Map .................................................................................... 10
2.3. Creation of an Interactive Story Map .................................................................................... 18
2.4. Plant Specimen Books ........................................................................................................... 19
3. Discussion ........................................................................................................................................ 22
3.1. Human Influence ................................................................................................................... 22
3.2. Observations and Lessons Learned ....................................................................................... 26
3.3. Future Research ..................................................................................................................... 28
Literature Cited .................................................................................................................................... 30
ii
Figures
Page
Figure 1. The cover and a description from the 1862 transcription of the 1855 field
survey notes found in the WCHS archives. ........................................................................................... 2
Figure 2. Pages from the original survey notebook completed by Daniel Corbin (1855). ................... 4
Figure 3. The original plat map from the 1855 Land Survey of Winona Township. ............................ 5
Figure 4. Reference points from the 1855 Land Survey, as digitized by a GSS analyst. ..................... 7
Figure 5. Bearing tree locations from the 1855 Land Survey. .............................................................. 8
Figure 6. A close-up showing the locations of two bearing trees (silver maples) relative
to a meander point along open water. .................................................................................................... 9
Figure 7. Features from the original plat map digitized by GSS. ....................................................... 10
Figure 8. The “original vegetation of Minnesota” in Winona Township, as mapped by
F.J. Marschner in 1930 (first published in 1974, adapted by Barbara Coffin of the MN
DNR in 1988). ...................................................................................................................................... 12
Figure 9. Initial historic vegetation map, based on information from the original land
survey (Corbin 1855). .......................................................................................................................... 14
Figure 10. Collateral data used to identify likely bluff prairies: red = slopes 20-90%, blue
= aspects 168°-270°, cross-hatch = excessively and somewhat excessively drained soils. ................. 15
Figure 11. Historic vegetation map for Winona Township, with likely cliff communities
and bluff prairies added. ...................................................................................................................... 16
Figure 12. A closer view of bluff areas, showing cliff communities and bluff prairies.
Note that cliff communities are primarily north and northeast-facing, particularly
overlooking Lake Winona, while bluff prairies are south and west-facing. ........................................ 17
Figure 13. Pie chart showing historic (1855) vegetation cover for Winona Township. ..................... 18
Figure 14. Cover page for the Story Map created using the ArcGIS StoryMaps
application ............................................................................................................................................ 19
Figure 15. Pages from the 1899 (left) and 1912 (right) plant specimen books, owned by
the WCHS and WSU College of Education, respectively. .................................................................. 20
Figure 16. Excerpt from the Excel spreadsheet for the 1899 specimen book. .................................... 21
Figure 17. Page from the Esri Story Map highlighting some of the species found in the
historic specimen books. ...................................................................................................................... 22
Figure 18. A comparison of the historic vegetation map (top) vs. current aerial imagery
(bottom) shows that prairie, savanna, and wet prairie have been lost to town
expansion/development. ....................................................................................................................... 23
Figure 19. The historic natural channel (top) vs. the straightened channel (bottom) of
Shives Creek in eastern Winona. ......................................................................................................... 24

iii
Figures (continued)
Page
Figure 20. The historic plat map (top) shows a river island that was flooded by the
installation of the spillway dam on Prairie Island (bottom). ................................................................ 25
Figure 21. Bearing tree size (DBH) distribution of oak species in the bluff areas
classified as savanna, woodland, or forest. .......................................................................................... 26
Figure 22. Map of original PLS bearing trees identified as hickory in the areas
surrounding Winona. Surveys in the townships immediately west and southeast of
Winona were completed by the same surveyor during the same time period. ..................................... 28

iv
Tables
Page
Table 1. Bearing trees in Winona Township by species, as identified in the original
survey notes. ........................................................................................................................................ 11

v
Appendices
Page
Appendix A. Original Vegetation of Minnesota. ................................................................................. 32
Appendix B. Minnesota native vegetation communities present in southeast Minnesota
(downloaded from https://www.dnr.state.mn.us/npc/classification.html). S. = Southern ................... 33
Appendix C. Historic Vegetation Communities (Pre-European Settlement) of Winona
Township (T 107N, R 7W) .................................................................................................................. 35

vi
Executive Summary
The Winona County Historical Society, Winona State University, and Saint Mary’s University of
Minnesota’s GeoSpatial Services partnered to develop a digital land cover map from an 1855 Public
Land Surveyor’s field notebook for Winona Township. Notes and other records (such as planimetric
maps) from Public Land Surveys provide the earliest systematically recorded information about
vegetation composition and physical features (soils, rivers and streams, wagon roads, etc.) for
surveyed lands across the U.S. The first step in developing the historic land cover or vegetation map
was to digitize (i.e., convert to digital GIS data) the survey reference points (corners, quarter points,
and meander points) and bearing trees based on information in the original survey notes. GSS
analysts reviewed the bearing tree data and other vegetation notes from the original survey to get a
general idea of the vegetation types present at the time. Eight community types were ultimately
selected for inclusion in the historic land cover map: floodplain forest, dry-mesic oak forest, dry-
mesic oak woodland, savanna, prairie, wet prairie, cliff community, and bluff prairie (a subset of dry
prairie). A GSS analyst then categorized each survey reference point into one of these vegetation
communities. With these survey point vegetation assignments and collateral data, the analyst was
able to interpolate and digitize the extent of each vegetation community. The results show that the
most common vegetation community in Winona Township at the time of the original PLS was
prairie, followed by oak woodland and floodplain forest. In addition to this report, GSS created an
Esri Story Map to document the story of this project and provide interested users with access to
resulting data products, images and text in a web-based format that supports inquiry and
investigation.
A comparison of the historic land cover map to current conditions in Winona Township
illustrates several changes due to human influence over time. The town of Winona has expanded
greatly, essentially eliminating the historic prairie as well as much of the savanna. Over time,
naturally winding stream channels were also straightened and construction of flood control structures
on the Mississippi River resulted in the flooding of some river islands. Overall, the 1855 PLS appears
to have captured a moment in ecological succession from more open grassland and savanna
ecosystems (with the exception of floodplain forests) to denser, wooded ecosystems, likely due to
shifts in climate and disturbance regimes.

vii
Acknowledgments
Thank you to the team at Winona State University and the Winona County Historical Society:
Allison Quam, Andy Bloedorn, and Kendall Larson. This project was financed in part with funds
provided by the State of Minnesota from the Arts and Cultural Heritage Fund, a Legacy Amendment
program, through the Minnesota Historical Society. We thank them for their generosity.
Acronyms and Abbreviations
AGOL - ArcGIS online
BLM – Bureau of Land Management
Esri – Environmental Systems Research Institute
GIS – Geographic Information Systems
GLO – General Land Office
MN DNR – Minnesota DNR
PLS – Public Land Survey
SMUMN GSS - Saint Mary’s University of Minnesota, GeoSpatial Services
USDA – U.S. Department of Agriculture
WCHS - Winona County Historical Society
WSU - Winona State University

1
1. Introduction
The Winona County Historical Society (WCHS) and Winona State University (WSU) have formed a
partnership to digitize historic ecological survey data with the goal of producing an accessible and
shared resource that can be used in multidisciplinary areas to educate the community about the local
ecologic history of the Driftless Area. The items of focus for this project are an 1862 transcription of
an 1855 land surveyor's field notebook for Winona Township (107 N, R. 7 West, 5th Mer.) and two
herbarium specimen books of local Winona flora that were compiled in the 1890s and 1910s by
students attending the Winona State Normal School. The surveyor’s field notes provide a record of
vegetation, landmarks, and other natural resources of the Winona area as they appeared in the middle
of the 19th century.
In addition to the digitization of the above items, this project included the development of a digital
vegetation map from the 1855 surveyor’s field notes. This map reconstructed the landscape of mid-
19th century Winona, showing the vegetation, landmarks, and waterways as they were detailed in the
field notes. The spatial data development and digital story map creation activities that fulfill the
objectives of this project were conducted by Saint Mary’s University of Minnesota’s GeoSpatial
Services (SMUMN GSS). The finished project was envisioned as an interactive map and story that
provides a unique educational experience as part of WSU’s institutional repository, OpenRiver, and
as an interactive component of a future WCHS exhibit. The reconstructed map will expand
opportunities for a multidisciplinary approach to ecological research, land restoration and the human
relationship to those ecological communities.
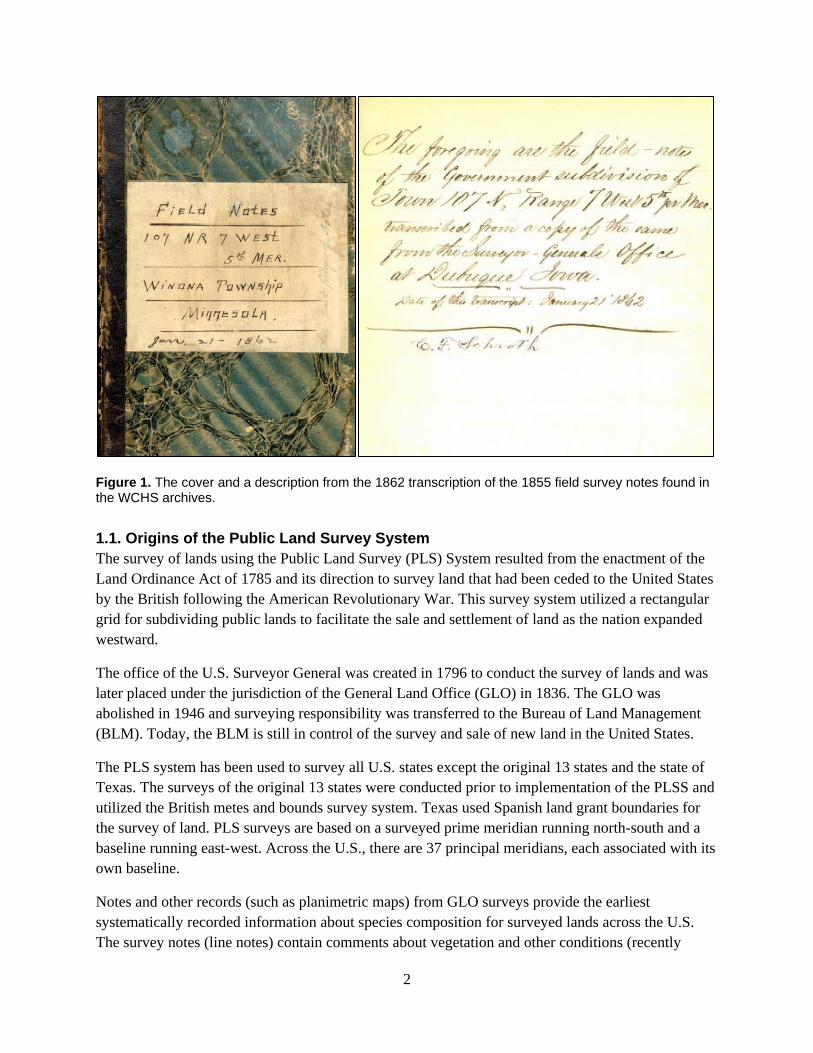
The WCHS discovered the transcribed land survey notebook for Winona Township in its archives in
2017 (Figure 1). This transcription was copied by Charles F. Schroth of Winona during a visit to the
Surveyor General's Office in Dubuque, Iowa, during 1862. Schroth was born in Germany in 1833
and came to Winona in 1856. He worked as a manufacturer and served as an alderman in 1859-1860
and in the Minnesota House of Representatives from 1879-1881. Schroth passed away in 1916 and is
buried at Woodlawn Cemetery. The notebook was donated by his sons, Julian and Alfred, in 1936.
2
Figure 1. The cover and a description from the 1862 transcription of the 1855 field survey notes found in the WCHS archives.
1.1. Origins of the Public Land Survey System
The survey of lands using the Public Land Survey (PLS) System resulted from the enactment of the
Land Ordinance Act of 1785 and its direction to survey land that had been ceded to the United States
by the British following the American Revolutionary War. This survey system utilized a rectangular
grid for subdividing public lands to facilitate the sale and settlement of land as the nation expanded
westward.
The office of the U.S. Surveyor General was created in 1796 to conduct the survey of lands and was
later placed under the jurisdiction of the General Land Office (GLO) in 1836. The GLO was
abolished in 1946 and surveying responsibility was transferred to the Bureau of Land Management
(BLM). Today, the BLM is still in control of the survey and sale of new land in the United States.
The PLS system has been used to survey all U.S. states except the original 13 states and the state of
Texas. The surveys of the original 13 states were conducted prior to implementation of the PLSS and
utilized the British metes and bounds survey system. Texas used Spanish land grant boundaries for
the survey of land. PLS surveys are based on a surveyed prime meridian running north-south and a
baseline running east-west. Across the U.S., there are 37 principal meridians, each associated with its
own baseline.
Notes and other records (such as planimetric maps) from GLO surveys provide the earliest
systematically recorded information about species composition for surveyed lands across the U.S.
The survey notes (line notes) contain comments about vegetation and other conditions (recently

3
burned areas, soils, Native American trails and wagon roads, rivers and streams, etc.) encountered
along each of the survey (section) lines. Tree species and size, along with distance and direction to
the corner, were provided for up to four bearing trees at each section corner. If bearing trees were not
available, the surveyors selected a non-tree reference monument. Notes from the public land surveys
(PLS) provide valuable information for an era pre-dating widespread settlement by Euro-American
emigrants. The fact that the PLS pre-dates settlement is no accident because land surveys were a
prerequisite before public lands could be conveyed into private ownership via homestead acts.
The GLO surveys are organized by section lines. As each line was surveyed, the land surveyor was
instructed to record observational information in addition to the technical measurement details of the
survey. These observations included: identification of up to four bearing trees from each survey
corner; materials encountered along the line (e.g., sands and gravels); trees located on the section
line; intersections with water features (ponds, streams, lakes); description of the land surface; road
and trail crossings; and natural curiosities. Each of these observations was accompanied by a distance
measurement along the section line. As a result, these features can be relatively placed in a digital
spatial framework (GIS) by digitizing the point and the observation. When viewed as a whole across
a survey area, such as a township, these geographically referenced observations can provide the basis
for recreating a continuous surface of historic vegetation and other features within the survey area.
Creating this spatial framework was the first task of this project.
Distances to bearing trees were recorded in chains and links. A chain covered a distance of 66 ft and
consisted of 100 links. Each link was 7.92 inches in length. Bearing trees were notched or blazed for
identification and marked with the township, range and section numbers. In addition to distance and
bearing, the species and diameter of the tree were recorded in the survey.
In previous work, researchers have utilized the land surveyor notes for numerous ecological
applications such as:
Make maps of pre-European settlement vegetation
Reconstruct absolute and relative densities of tree types in former forests
Reconstruct characteristic size and distributions for certain forest types
Evaluate the importance and character of forest disturbance regimes
Understand the co-association of major tree types
Reconstruct the density and distribution of wetlands, lakes, and rivers
Evaluate the effect of physical factors on the distribution of tree types
Locate archaeological sites
1.2. 1855 Land Survey of Winona Township
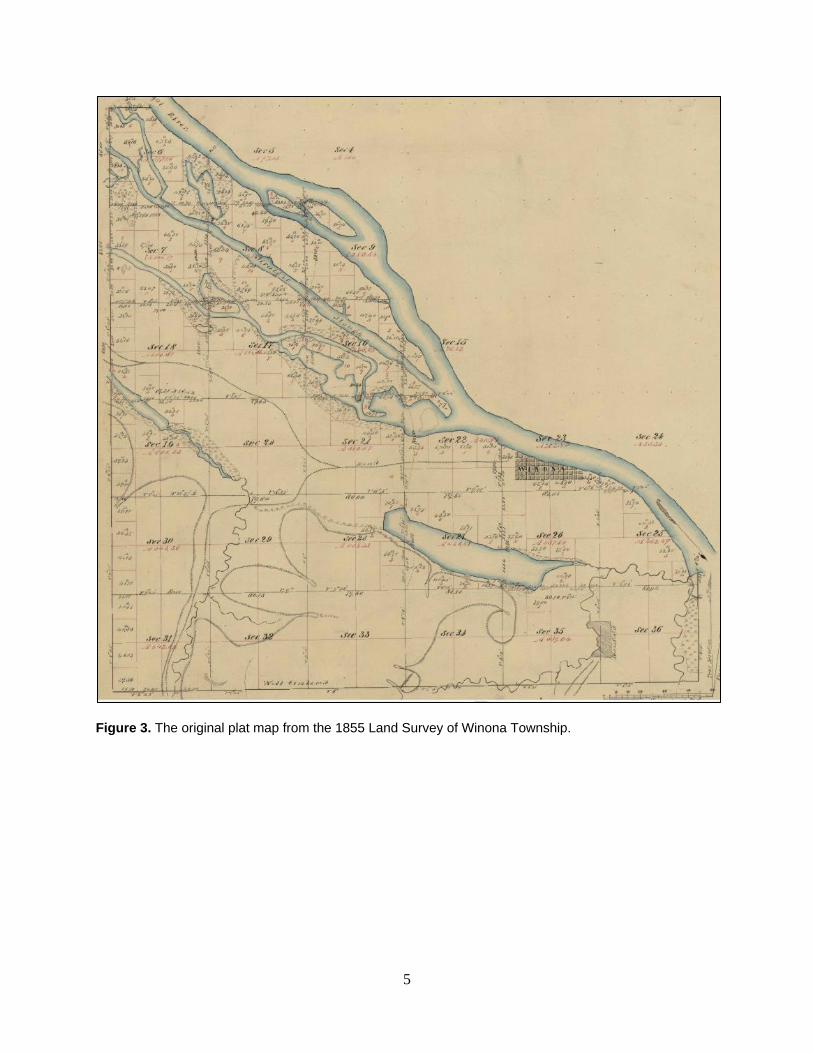
The Winona Township Land Survey was completed by Daniel Corbin from September 1854 to
January 1855 (Figure 2). Winona Township (107N 7W) is located along the Mississippi River in
southeastern Minnesota. The original plat map from this survey is shown in Figure 3.

4
Figure 2. Pages from the original survey notebook completed by Daniel Corbin (1855).
5
Figure 3. The original plat map from the 1855 Land Survey of Winona Township.

6
2. Process and Results
2.1. Digitizing PLS Information
A scan of the original land survey notebook completed by Daniel Corbin (1855) was discovered
online in the GLO Historic Plat Map Retrieval System managed by the Minnesota Geospatial
Commons Information Office. Comparison of the transcribed and original Corbin survey revealed
that the transcribed survey omitted much of the detail contained in the original survey. Consequently,
the original Corbin land survey was used as the primary source for this historical land cover mapping
project.
First, a GSS analyst used these notes to digitize the survey reference points (corners, quarter points,
and meander points). Corner points marked intersections of surveyed section lines while quarter
points marked the intersection of quarter divisions with section lines (Figure 4). Meander points
marked the intersections of survey lines with waterbodies that needed to be crossed. Associated with
each digitized survey reference point in a GIS data table was the vegetation type for that point, as
described in the survey notes. Additional points (not official survey points) were created from notes
in the survey containing information on vegetation and distances from reference points (e.g., “leave
marsh, enter timber”).

7
Figure 4. Reference points from the 1855 Land Survey, as digitized by a GSS analyst.
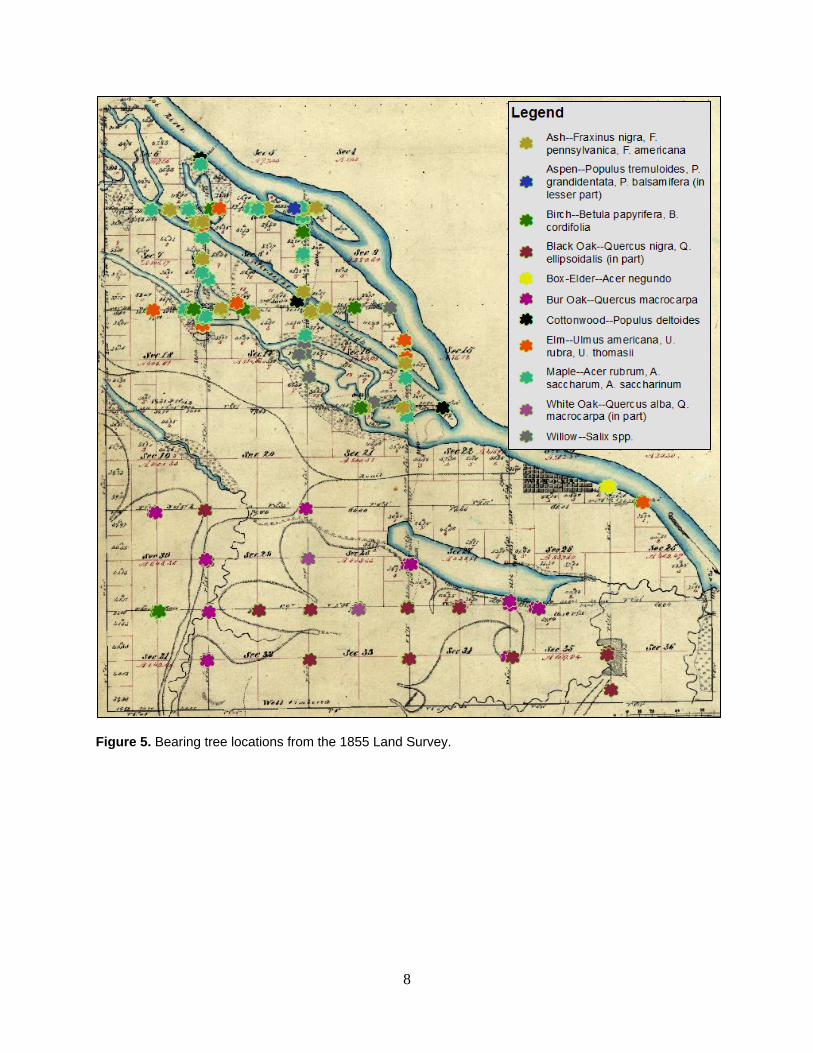
Direction and distance to bearing trees from corner, quarter and meander points were recorded in the
survey and were used to digitize the locations of these bearing trees (Figure 5). Bearing trees were
notably absent in the center of the township which, according to survey notes, was covered by prairie
habitat.
8
Figure 5. Bearing tree locations from the 1855 Land Survey.

9
Figure 6. A close-up showing the locations of two bearing trees (silver maples) relative to a meander point along open water.
In addition, GSS digitized features from an original plat map drawn by the surveyor, including water
bodies, wetland symbols (marsh), open field, and the town’s extent (Figure 7). These polygons were
used as a base or “starting point” for mapping efforts.

10
Figure 7. Features from the original plat map digitized by GSS.
2.2. Creation of Historic Vegetation Map
GSS staff used land survey and collateral data to develop a historic vegetation cover map for Winona
Township. The first step in this process was to identify the vegetation types/communities or
“categories” that were mapped. GSS analysts reviewed bearing tree data and other vegetation notes
from Corbin’s survey notebook to get a general idea of the vegetation types and tree species present
at the time. Broad vegetation types described included “timber”, “prairie”, and “marsh”. Eleven
different types of tree were noted by Corbin (1855) as bearing trees within Winona Township. Some
trees were identified to species (e.g., oaks, cottonwood) while others were grouped by genus (e.g.,
maple, willow, ash). Oaks were most common (23.5%), followed by maples (21.3%), and ashes

11
(20.6%) (Table 1). In some cases, GSS analysts were able to assign a species based on location in
cases where trees were only identified to genus by the original surveyors. For example, trees
identified as maples that were located in the floodplain were almost certainly silver maples (Acer
saccharinum).
Table 1. Bearing trees in Winona Township by species, as identified in the original survey notes.
Species/Genus # of bearing trees Diameter range (in) Mean diameter (in)
Oak 32 - -
Black oak 18 10-20 13.8
Bur oak 9 8-18 11.6
White oak 5 14.4 10-18
Maple 29 6-40 19.2
Ash 28 6-20 11.8
Willow 15 7-20 11.7
Birch 15 6-14 11.3
Elm 10 6-20 12.6
Cottonwood 4 8-20 13.5
Boxelder 2 8-10 9.0
Aspen 1 - 8.0
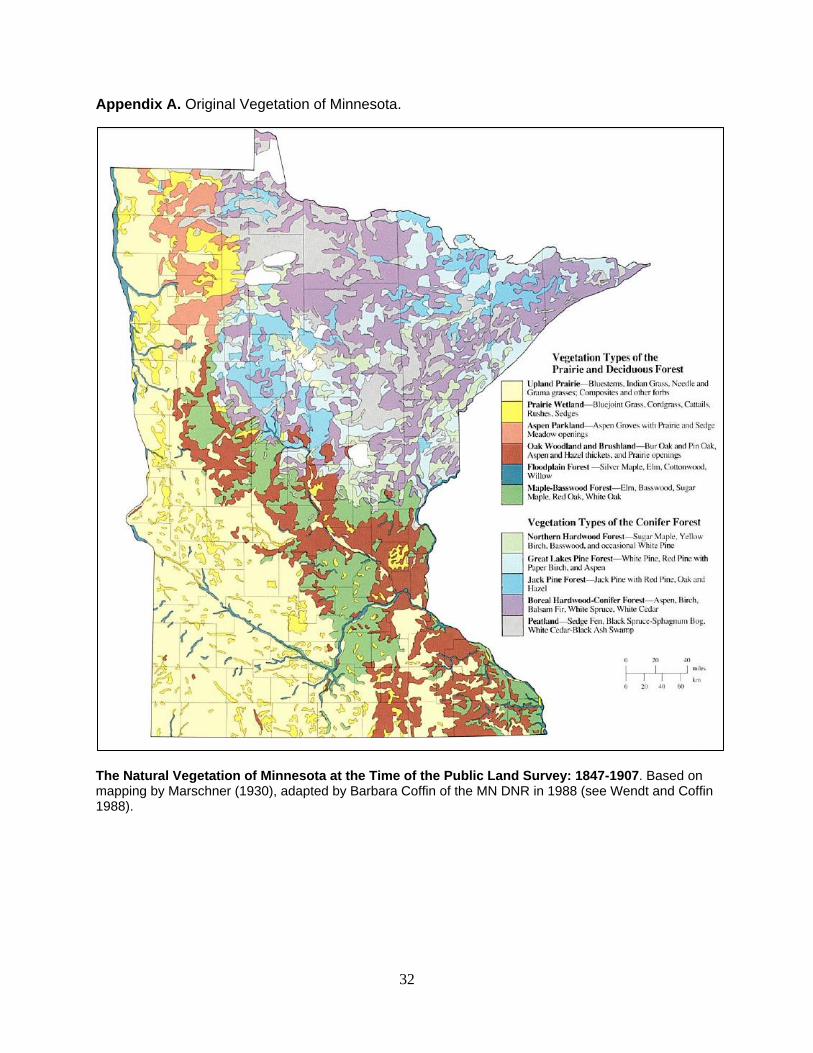
GSS analysts reviewed an earlier effort to map historic vegetation across the state of Minnesota
(Marschner 1930), to see if any of this information could be utilized or adapted. The earliest effort to
map Minnesota’s historic vegetation using original survey notes was conducted by Francis J.
Marschner, a USDA research assistant. This map, first published in 1974, has since been digitized,
and the results for Winona Township are shown in Figure 8 below. An “adapted” state-wide version
was published by the MN DNR in 1988 (Appendix A). Unfortunately, Marschner did not leave
details regarding the methods he used to construct his map or detailed descriptions for the vegetation
communities he identified (Heinselman 1974). While this map is useful on a broad, state-wide scale,
GSS analysts believed a more detailed and finer-scale map could be created by focusing specifically
on Winona Township. For example, the broad-scale map likely “lumped” smaller community patches
with the larger, surrounding habitats. In addition, Marschner’s vegetation categories are somewhat
broad, grouping diverse but similar community types from across the state (e.g., Big Woods-
Hardwoods [oak, maple, basswood, hickory]).

12
Figure 8. The “original vegetation of Minnesota” in Winona Township, as mapped by F.J. Marschner in 1930 (first published in 1974, adapted by Barbara Coffin of the MN DNR in 1988).
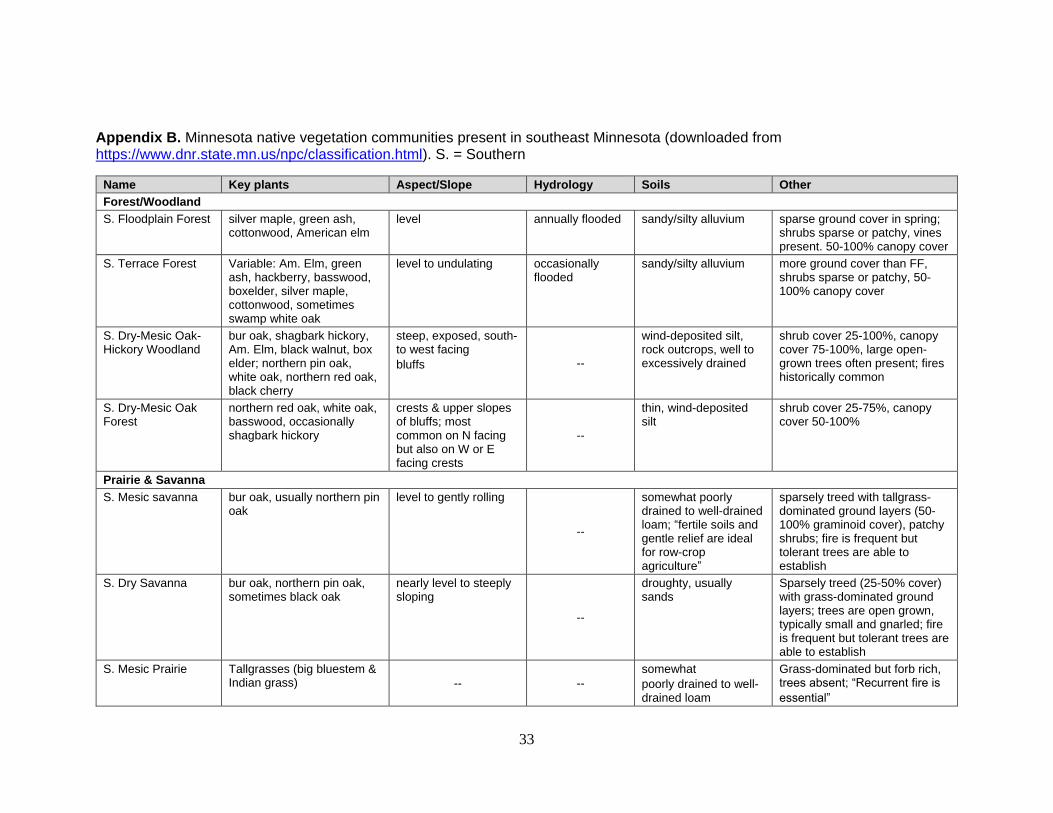
Next, GSS analysts reviewed detailed descriptions of existing southeastern Minnesota vegetation
communities (MN DNR 2003) and identified the communities that were likely present or similar to
communities that were present prior to European settlement. A table summarizing the characteristics
of 13 different communities is included in Appendix B. Descriptions of the communities, adapted by
GSS analysts from information compiled by the DNR, are found in Appendix C. However, there is
not enough information available in the original survey notes to distinguish some of these
communities, particularly floodplain vs. terrace forest, mesic savanna vs. dry savanna, and mesic
prairie vs. dry prairie. Ultimately, eight community types were selected for inclusion in the historic
vegetation map: floodplain forest, dry-mesic oak forest, dry-mesic oak woodland, savanna, prairie,
wet prairie, cliff community, and bluff prairie (a subset of dry prairie).

13
Using the digitized PLS information described above in Section 2.1 (e.g., bearing tree species,
vegetation notes), a GSS analyst preliminarily categorized each reference point into a vegetation
community (floodplain forest, wet prairie, prairie, savanna, dry-mesic oak woodland, or dry-mesic
oak forest). With these survey point vegetation assignments and the original survey plat map
information, the analyst was able to interpolate and digitize the extent of the floodplain forest, wet
prairie, and prairie communities within the township. Differentiating the oak communities (savanna,
woodland, forest) was more challenging. Because oak woodlands and forests are known to occur
more commonly on bluff slopes while savannas occur on nearly level ground, and savannas are
known to be transitional between prairies and woodlands/forests, any level ground extending from
the already-mapped prairie, was mapped as savanna. The survey points in these areas generally
identified the vegetation as “scattering oak, scattering timber” or “oak openings”. Differentiating
between oak woodlands and oak forest on the bluff slopes was the final and most difficult step, as the
species present in these two communities are very similar, and it is largely density and environmental
characteristics that distinguish them. According to MN DNR ecological community summaries, oak
woodland is most commonly found on south- and west-facing slopes, while oak forest more
commonly occurs on north-facing and sometimes on east-facing slopes. Therefore, the GSS analyst
mapped dry-mesic oak forest only on north- and east-facing bluffs. The remainder of the bluffs were
categorized as oak woodland. After this delineation, the analyst reviewed the soils data (drainage
class) and found that excessively and somewhat excessively drained soils on the bluffs fell within the
oak woodland community rather than the oak forest community, which supports the distinction. GSS
analysts had hoped that distances to bearing trees may provide insight into tree density, which could
help distinguish oak woodland from oak forest, but these data were inconclusive. Reference points
within oak forest were more likely to have one tree within 20 ft and a second tree within 35 ft (33%)
than oak woodland (8%), the pattern was not clear enough to be considered a distinguishing
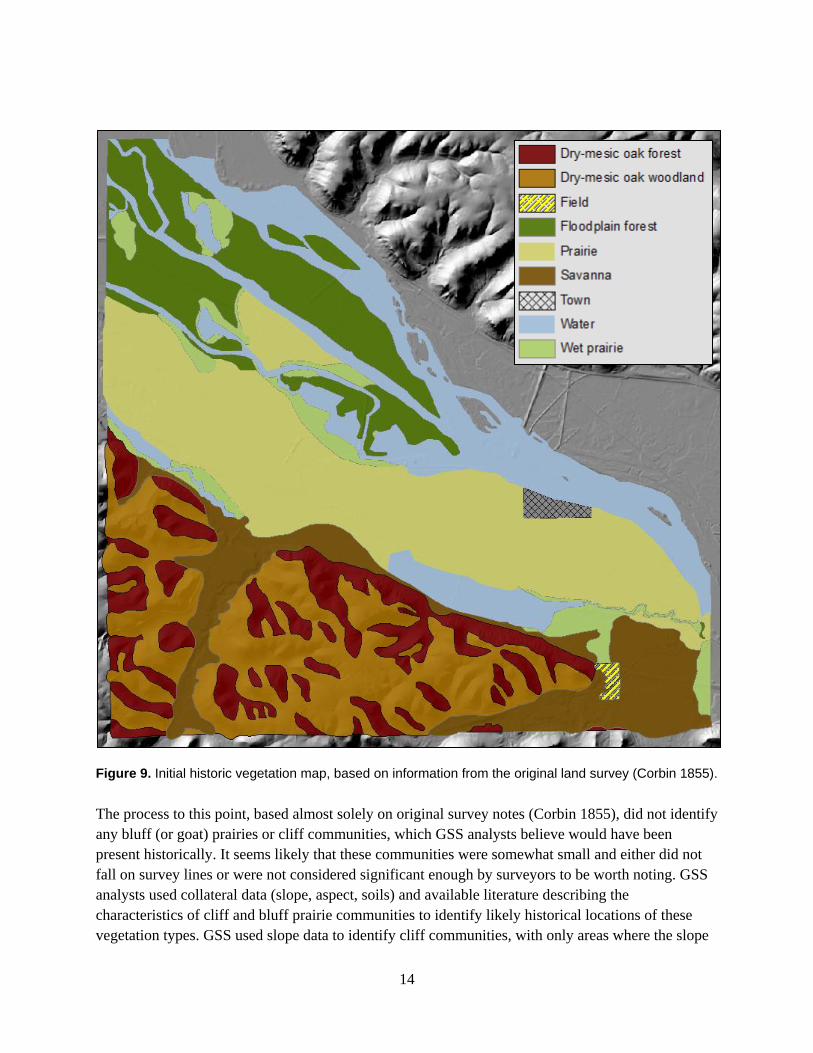
characteristic. The results of the mapping process to this point are shown in Figure 9.
14
Figure 9. Initial historic vegetation map, based on information from the original land survey (Corbin 1855).
The process to this point, based almost solely on original survey notes (Corbin 1855), did not identify
any bluff (or goat) prairies or cliff communities, which GSS analysts believe would have been
present historically. It seems likely that these communities were somewhat small and either did not
fall on survey lines or were not considered significant enough by surveyors to be worth noting. GSS
analysts used collateral data (slope, aspect, soils) and available literature describing the
characteristics of cliff and bluff prairie communities to identify likely historical locations of these
vegetation types. GSS used slope data to identify cliff communities, with only areas where the slope

15
was >45° identified as likely cliff communities. To identify bluff prairies, GSS analysts used site
characteristics described in recent USDA Ecological Site Descriptions for sandstone and limestone
colluvium bluff prairies (Hartman 2014 & 2015). These characteristics were: 1) Aspects between
168° and 270°; 2) Slopes of 20-90%; and 3) soils that are somewhat excessively to excessively
drained. All three of these collateral GIS data layers were symbolized to display only these
characteristics, and only areas where all three characteristics overlapped (Figure 10) were mapped as
likely bluff prairies.
Figure 10. Collateral data used to identify likely bluff prairies: red = slopes 20-90%, blue = aspects 168°-270°, cross-hatch = excessively and somewhat excessively drained soils.
The resulting map, with the addition of cliff communities and bluff prairies, is shown in Figure 11. A
close-up of the bluff areas, to more clearly display the added cliff communities and bluff prairies is
also included as Figure 12.

16
Figure 11. Historic vegetation map for Winona Township, with likely cliff communities and bluff prairies added.
17
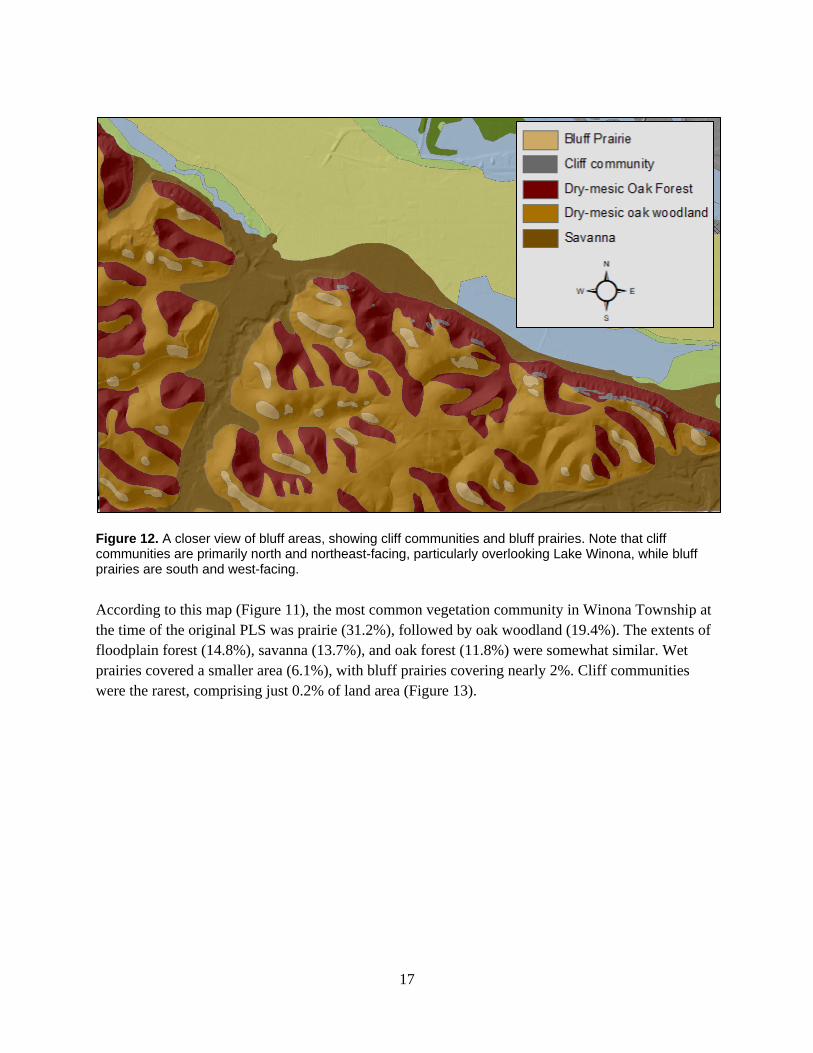
Figure 12. A closer view of bluff areas, showing cliff communities and bluff prairies. Note that cliff communities are primarily north and northeast-facing, particularly overlooking Lake Winona, while bluff prairies are south and west-facing.
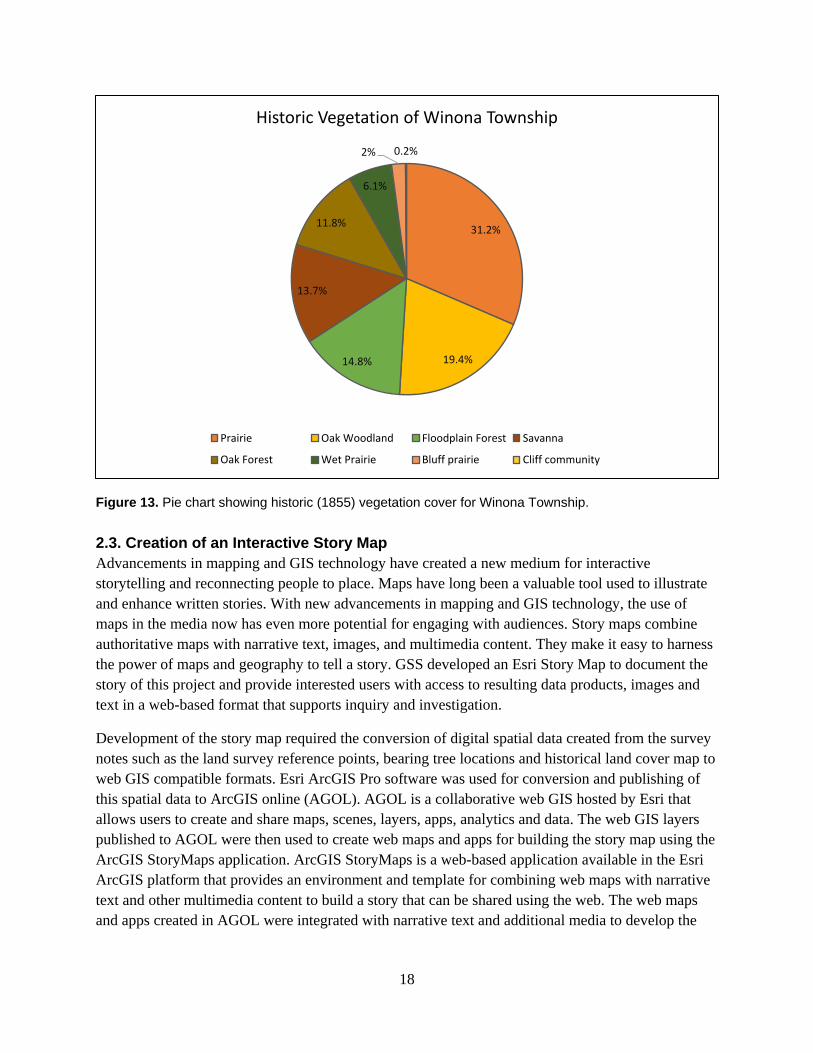
According to this map (Figure 11), the most common vegetation community in Winona Township at
the time of the original PLS was prairie (31.2%), followed by oak woodland (19.4%). The extents of
floodplain forest (14.8%), savanna (13.7%), and oak forest (11.8%) were somewhat similar. Wet
prairies covered a smaller area (6.1%), with bluff prairies covering nearly 2%. Cliff communities
were the rarest, comprising just 0.2% of land area (Figure 13).
18
Figure 13. Pie chart showing historic (1855) vegetation cover for Winona Township.
2.3. Creation of an Interactive Story Map
Advancements in mapping and GIS technology have created a new medium for interactive
storytelling and reconnecting people to place. Maps have long been a valuable tool used to illustrate
and enhance written stories. With new advancements in mapping and GIS technology, the use of
maps in the media now has even more potential for engaging with audiences. Story maps combine
authoritative maps with narrative text, images, and multimedia content. They make it easy to harness
the power of maps and geography to tell a story. GSS developed an Esri Story Map to document the
story of this project and provide interested users with access to resulting data products, images and
text in a web-based format that supports inquiry and investigation.
Development of the story map required the conversion of digital spatial data created from the survey
notes such as the land survey reference points, bearing tree locations and historical land cover map to
web GIS compatible formats. Esri ArcGIS Pro software was used for conversion and publishing of
this spatial data to ArcGIS online (AGOL). AGOL is a collaborative web GIS hosted by Esri that
allows users to create and share maps, scenes, layers, apps, analytics and data. The web GIS layers
published to AGOL were then used to create web maps and apps for building the story map using the
ArcGIS StoryMaps application. ArcGIS StoryMaps is a web-based application available in the Esri
ArcGIS platform that provides an environment and template for combining web maps with narrative
text and other multimedia content to build a story that can be shared using the web. The web maps
and apps created in AGOL were integrated with narrative text and additional media to develop the
31.2%
19.4%14.8%
13.7%
11.8%
6.1%
2% 0.2%
Historic Vegetation of Winona Township
Prairie Oak Woodland Floodplain Forest Savanna
Oak Forest Wet Prairie Bluff prairie Cliff community

19
final story map using the ArcGIS StoryMaps application. To view the Story Map, visit
https://storymaps.arcgis.com/stories/2255b881d88b49b8b667f621e3db2200.
Figure 14. Cover page for the Story Map created using the ArcGIS StoryMaps application
2.4. Plant Specimen Books
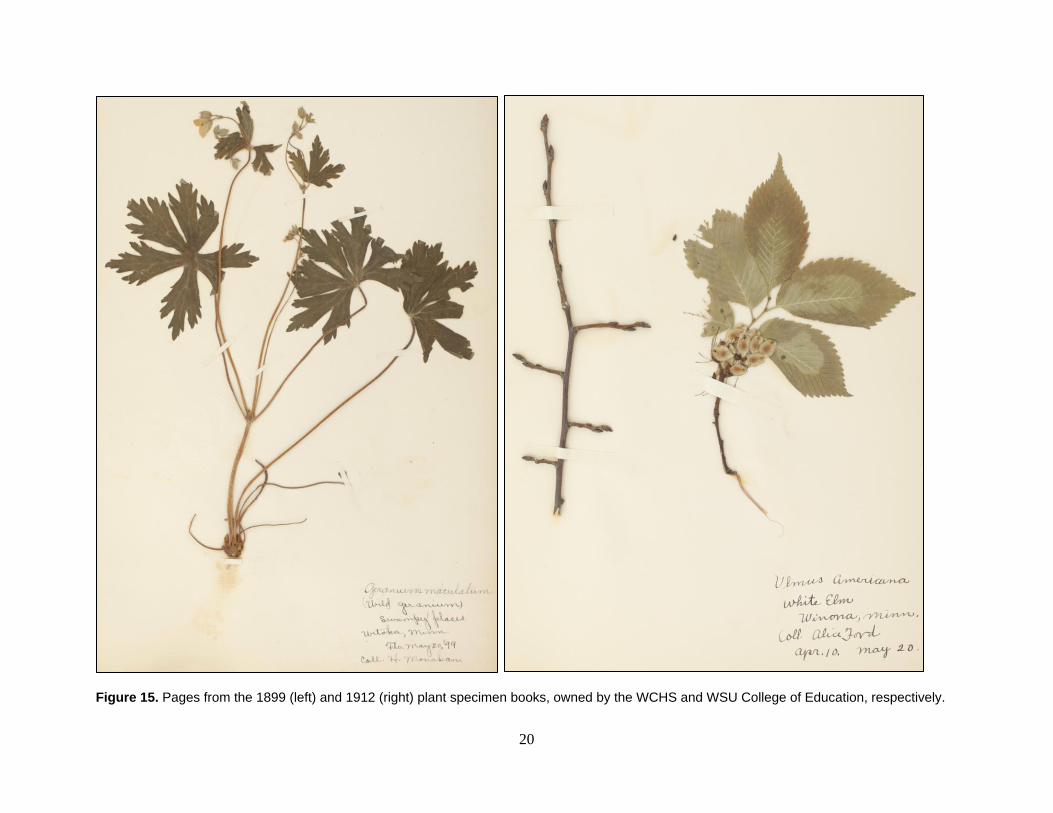
As a requirement to complete Biology courses taught by Dr. John M. Holzinger at the Winona
Normal School, students submitted herbarium specimen books of the local Winona flora as their final
projects. The WSU College of Education owns a 1912 herbarium specimen book compiled by Alice
Ford and the WCHS owns an 1899 herbarium specimen book compiled by Helen Monahan. In these
books, each page contains a collected plant specimen with its name (common and scientific), as well
as the location, date, and habitat where it was found (Figure 15).
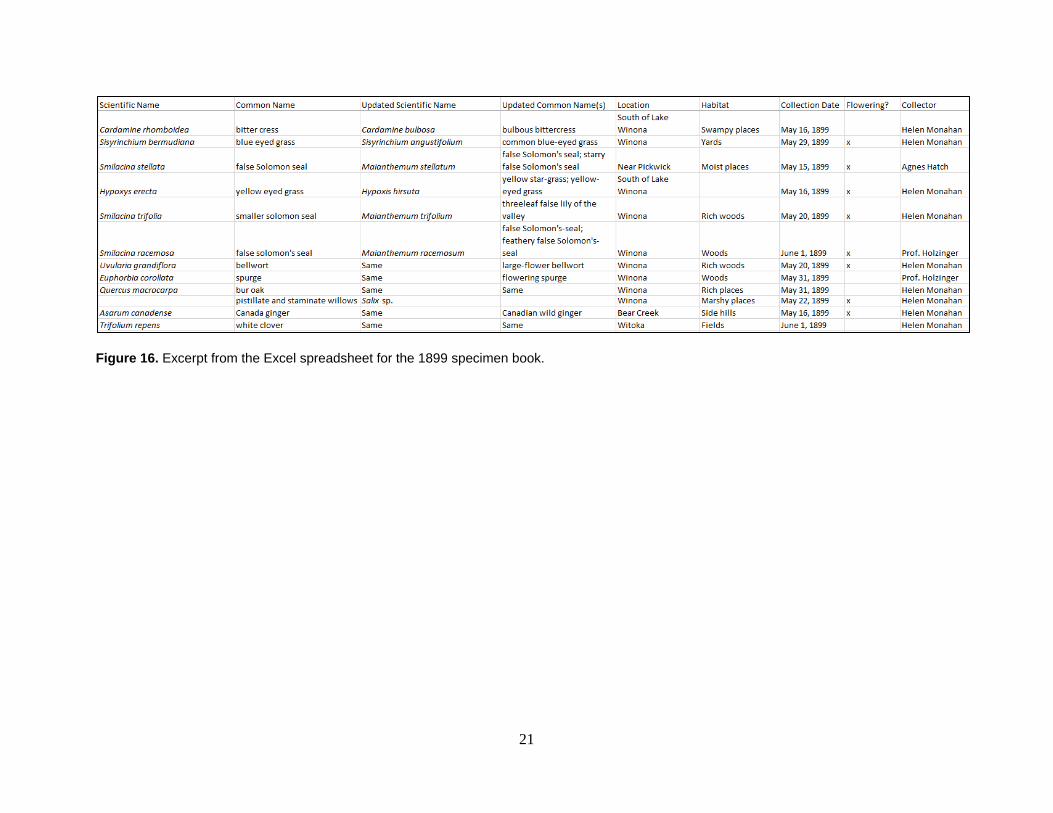
GSS created an Excel spreadsheet for each specimen book that could serve as a searchable index. In
some cases, the common and/or scientific names of plant species have changed over time. GSS
analysts used the U.S. government’s online Integrated Taxonomic Information System
(www.itis.gov) to determine the currently accepted common and scientific names for each plant in
the specimen books. The columns in the spreadsheet were: scientific and common names as listed in
the specimen book, updated scientific and common names, location, habitat, collection date, whether
the specimen was flowering, the name of the collector, and notes (Figure 16).
20
Figure 15. Pages from the 1899 (left) and 1912 (right) plant specimen books, owned by the WCHS and WSU College of Education, respectively.
21
Figure 16. Excerpt from the Excel spreadsheet for the 1899 specimen book.

22
GSS also created an Esri Story Map that explores some of the plant species found in the specimen
books, along with their habitat and general location (Figure 17), which users can connect to from the
project’s larger story map. The habitats included were bluffs and hillsides, shady woods, lakeside,
and rock outcrops (like the cliff communities in the historic vegetation map). General locations
included in the Story Map were Pickwick and Witoka, both south of Winona, and Bear Creek, west
of Winona near Rollingstone.
Figure 17. Page from the Esri Story Map highlighting some of the species found in the historic specimen books.
3. Discussion
3.1. Human Influence
Comparing the historic vegetation map generated through this project to current aerial imagery of
Winona Township clearly illustrates how human settlement and development has changed the
landscape over time. For example, the town of Winona has expanded greatly to fill the valley,
essentially eliminating the dry prairie as well as much of the savanna and some wet prairie (Figure
18). At the time of the original land survey, the town was approximately 84 acres in size. The current
developed area within Winona Township is at least 4,400 acres, or more than 50 times the 1855 town
area.
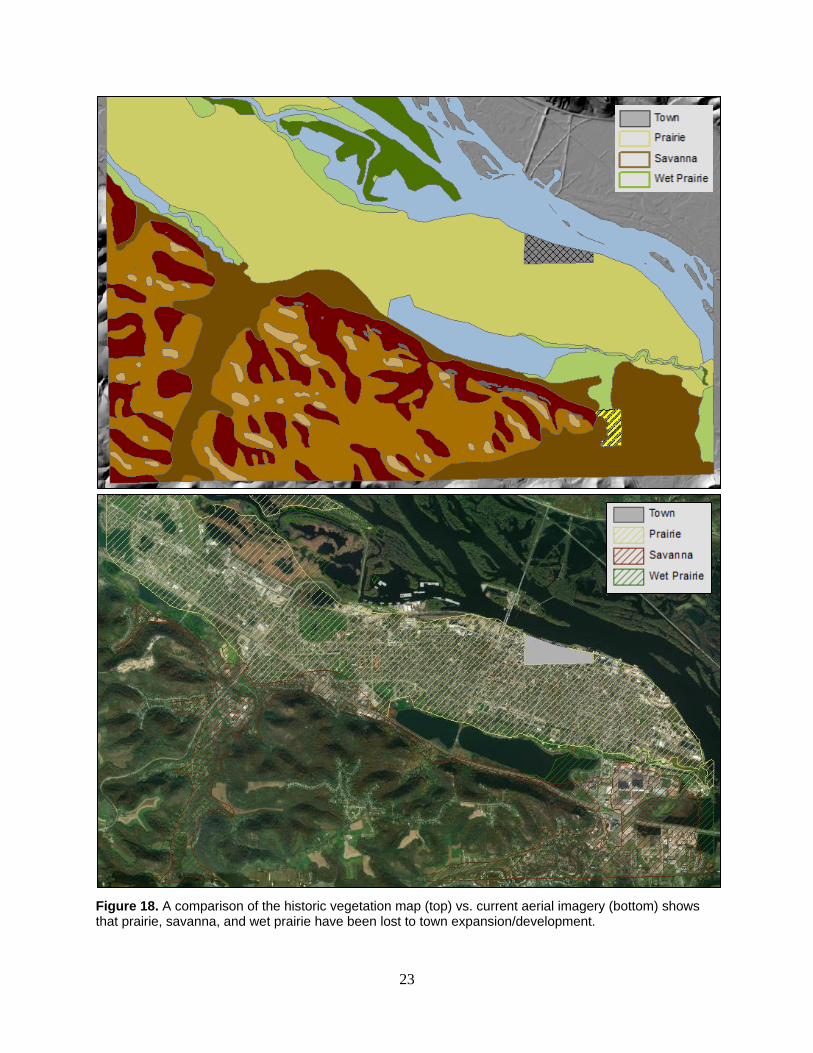
23
Figure 18. A comparison of the historic vegetation map (top) vs. current aerial imagery (bottom) shows that prairie, savanna, and wet prairie have been lost to town expansion/development.
24
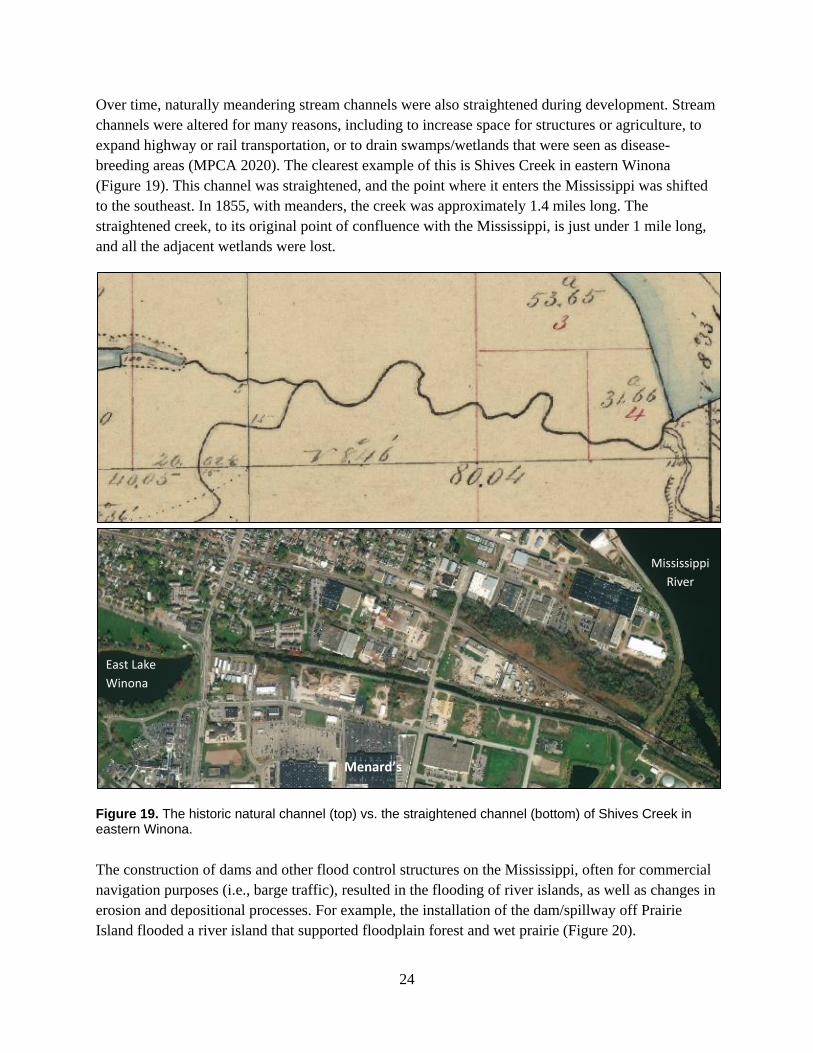
Over time, naturally meandering stream channels were also straightened during development. Stream
channels were altered for many reasons, including to increase space for structures or agriculture, to
expand highway or rail transportation, or to drain swamps/wetlands that were seen as disease-
breeding areas (MPCA 2020). The clearest example of this is Shives Creek in eastern Winona
(Figure 19). This channel was straightened, and the point where it enters the Mississippi was shifted
to the southeast. In 1855, with meanders, the creek was approximately 1.4 miles long. The
straightened creek, to its original point of confluence with the Mississippi, is just under 1 mile long,
and all the adjacent wetlands were lost.
Figure 19. The historic natural channel (top) vs. the straightened channel (bottom) of Shives Creek in eastern Winona.
The construction of dams and other flood control structures on the Mississippi, often for commercial
navigation purposes (i.e., barge traffic), resulted in the flooding of river islands, as well as changes in
erosion and depositional processes. For example, the installation of the dam/spillway off Prairie
Island flooded a river island that supported floodplain forest and wet prairie (Figure 20).
East Lake
Winona
Mississippi
River
Menard’s

25
Figure 20. The historic plat map (top) shows a river island that was flooded by the installation of the spillway dam on Prairie Island (bottom).
Current spillway/ dam location
Dam/Spillway

26
3.2. Observations and Lessons Learned
The 1855 PLS of Winona Township appears to have captured a moment in ecological succession.
Until 1,700-2,000 years ago, research suggests the climate and disturbance regime (e.g., frequent
fires) of the Midwest’s Driftless Region favored grassland and savanna ecosystems over wooded
ecosystems, with the exception of floodplain forests (Bogen and Hotchkiss 2007). However, around
1,700 years ago, climate conditions started shifting in favor of woody species over grasslands (Bogen
and Hotchkiss 2007). Slowly over the centuries, up to the time of early European exploration and
settlement of the upper Midwest, drought- and fire-tolerant trees and shrubs (e.g., oaks) started
colonizing the open prairie and savanna. Openings were maintained in some areas, likely with the
help of intentional burning. Native Americans in the region historically used fire as a tool to manage
habitat (Bunnell 1897, Williams 2005).
At the time of the PLS, Winona Township’s bluffs were likely in the middle stages of transitioning
from a more open landscape to the more densely wooded landscape we see today. Tree diameter data
from the survey notes for the bluff areas suggest that the wooded areas were relatively “young”. The
oaks were generally similar in size, suggesting they are also similar in age; there was not a wide
distribution in tree sizes (Figure 21) or any very large trees, which are more common in long-
established forests.
Figure 21. Bearing tree size (DBH) distribution of oak species in the bluff areas classified as savanna, woodland, or forest.
As climate and disturbance regime continued to favor wooded species after the PLS, less drought-
and fire-tolerant species became established on Winona Township’s bluffs and throughout the
Driftless Region, leading to the maple-basswood forests present on north- and east-facing slopes
today (Knoot et al. 2015).
The process of creating a historic vegetation map was challenging due to several uncertainties about
the Historic Land Survey. For example, modern-day readers cannot know what level of training
0
2
4
6
8
10
12
14
16
18
4 6 8 10 12 14 15 16 18 20
# o
f B
eari
ng
Tree
s
Diameter at Breast Height (inches)
Black oak White oak Burr oak
27
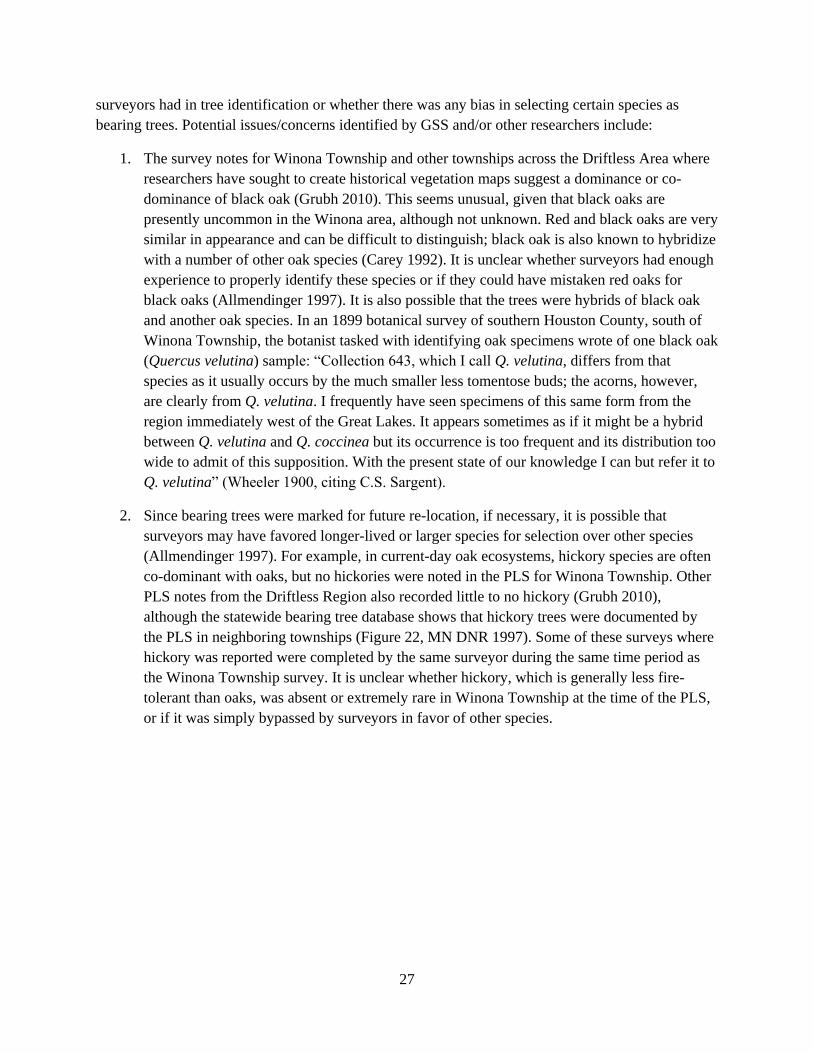
surveyors had in tree identification or whether there was any bias in selecting certain species as
bearing trees. Potential issues/concerns identified by GSS and/or other researchers include:
1. The survey notes for Winona Township and other townships across the Driftless Area where
researchers have sought to create historical vegetation maps suggest a dominance or co-
dominance of black oak (Grubh 2010). This seems unusual, given that black oaks are
presently uncommon in the Winona area, although not unknown. Red and black oaks are very
similar in appearance and can be difficult to distinguish; black oak is also known to hybridize
with a number of other oak species (Carey 1992). It is unclear whether surveyors had enough
experience to properly identify these species or if they could have mistaken red oaks for
black oaks (Allmendinger 1997). It is also possible that the trees were hybrids of black oak
and another oak species. In an 1899 botanical survey of southern Houston County, south of
Winona Township, the botanist tasked with identifying oak specimens wrote of one black oak
(Quercus velutina) sample: “Collection 643, which I call Q. velutina, differs from that
species as it usually occurs by the much smaller less tomentose buds; the acorns, however,
are clearly from Q. velutina. I frequently have seen specimens of this same form from the
region immediately west of the Great Lakes. It appears sometimes as if it might be a hybrid
between Q. velutina and Q. coccinea but its occurrence is too frequent and its distribution too
wide to admit of this supposition. With the present state of our knowledge I can but refer it to
Q. velutina” (Wheeler 1900, citing C.S. Sargent).
2. Since bearing trees were marked for future re-location, if necessary, it is possible that
surveyors may have favored longer-lived or larger species for selection over other species
(Allmendinger 1997). For example, in current-day oak ecosystems, hickory species are often
co-dominant with oaks, but no hickories were noted in the PLS for Winona Township. Other
PLS notes from the Driftless Region also recorded little to no hickory (Grubh 2010),
although the statewide bearing tree database shows that hickory trees were documented by
the PLS in neighboring townships (Figure 22, MN DNR 1997). Some of these surveys where
hickory was reported were completed by the same surveyor during the same time period as
the Winona Township survey. It is unclear whether hickory, which is generally less fire-
tolerant than oaks, was absent or extremely rare in Winona Township at the time of the PLS,
or if it was simply bypassed by surveyors in favor of other species.
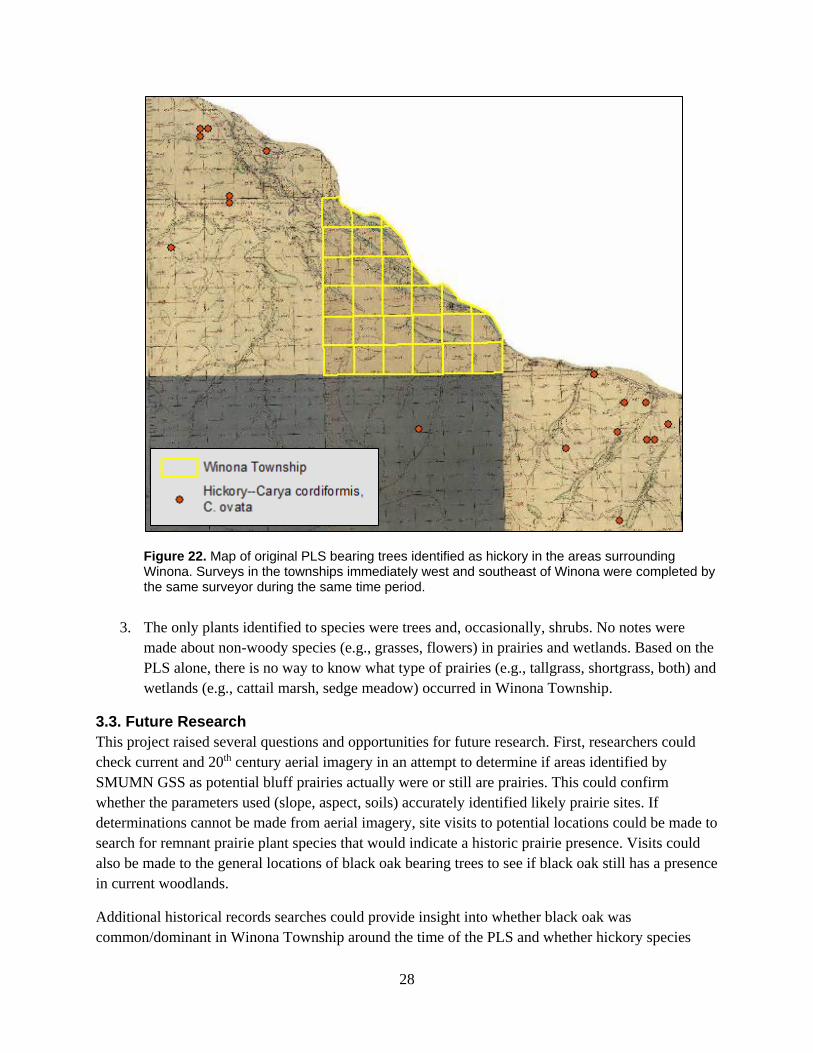
28
Figure 22. Map of original PLS bearing trees identified as hickory in the areas surrounding Winona. Surveys in the townships immediately west and southeast of Winona were completed by the same surveyor during the same time period.
3. The only plants identified to species were trees and, occasionally, shrubs. No notes were
made about non-woody species (e.g., grasses, flowers) in prairies and wetlands. Based on the
PLS alone, there is no way to know what type of prairies (e.g., tallgrass, shortgrass, both) and
wetlands (e.g., cattail marsh, sedge meadow) occurred in Winona Township.
3.3. Future Research
This project raised several questions and opportunities for future research. First, researchers could
check current and 20th century aerial imagery in an attempt to determine if areas identified by
SMUMN GSS as potential bluff prairies actually were or still are prairies. This could confirm
whether the parameters used (slope, aspect, soils) accurately identified likely prairie sites. If
determinations cannot be made from aerial imagery, site visits to potential locations could be made to
search for remnant prairie plant species that would indicate a historic prairie presence. Visits could
also be made to the general locations of black oak bearing trees to see if black oak still has a presence
in current woodlands.
Additional historical records searches could provide insight into whether black oak was
common/dominant in Winona Township around the time of the PLS and whether hickory species

29
were present. Also, if any historical wooden structures from the time still exist, they could be
checked to see if the species could be identified, visually or through DNA testing (Liepelt et al. 2006,
Akhmetzyanov et al. 2020).
Another method to better understand historical vegetation composition is to take lake or pond
sediment cores and study the pollen they contain. If the various sediment layers in the cores can be
reliably dated and scientists can identify the pollen to plant species, researchers can analyze how the
surrounding vegetation changed over time (McAndrews 1988, NCEI 2020). Such analyses have been
conducted at Effigy Mounds National Monument in northeastern Iowa (Bogen and Hotchkiss 2007)
and in parts of Minnesota (Wright et al. 2004) and Wisconsin (Webb 1987).

30
Literature Cited
Aaseng, N. E., J. C. Almendinger, R. P. Dana, B. C. Delaney, H. L. Dunevitz, K. A. Rusterholz,
N. P. Sather, and D. S. Wovcha. 1993. Minnesota's native vegetation: A key to natural
communities. Version 1.5. Minnesota Department of Natural Resources, Natural Heritage
Program, St. Paul, Minnesota.
Akhmetzyanov, L., P. Copini, U. Sass-Klaassen, H. Schroeder, G. A. de Groot, I. Laros, and A. Daly.
2020. DNA of centuries‑old timber can reveal its origin. Scientific Reports 10:20316
Almendinger, J. C. 1996. Minnesota’s bearing tree database. Minnesota Department of Natural
Resources, Ecological Classification System Program, St. Paul, Minnesota.
Bogen, S. M., and S. C. Hotchkiss. 2007. Paleo-environmental investigations of a cultural landscape
at Effigy Mounds National Monument. University of Wisconsin–Madison, Gaylord Nelson
Institute for Environmental Studies, Madison, Wisconsin.
Bunnell, Lafayette H. 1897. Winona and its environs on the Mississippi in ancient and modern days.
Jones & Kroeger Printers and Publishers, Winona, Minnesota.
Carey, J. H. 1992. Quercus velutina. In Fire Effects Information System (online). U.S. Forest
Service, Rocky Mountain Research Station. Available at
https://www.fs.fed.us/database/feis/plants/tree/quevel/all.html (accessed 30 November 2020).
Corbin, Daniel. 1855. Survey notebook: Subdivision of Township 107 North, Range 7 West of the 5th
Principal Meridian, Minnesota Territory. U.S. General Land Office (accessed through
www.mngeo.state.mn.us/glo/index.html, 11 December 2019).
Grubh, Kumudan. 2010. Historical vegetation reconstruction using spatial modeling on pre-Euro-
American data to inform ecosystem restoration in the Driftless Area of the U.S. Midwest. Thesis.
Iowa State University, Ames, Iowa.
Hartman, Peter. 2014. Ecological site description: Sandstone colluvium bluff prairie. U.S.
Department of Agriculture, Washington, D.C.
Hartman, Peter. 2015. Ecological site description: Dolomite colluvium bluff prairie, U.S. Department
of Agriculture, Washington, D.C.
Heinselman, Miron L. 1974. Interpretation of Francis J. Marschner’s map of the original vegetation
of Minnesota. U.S. Forest Service, St. Paul, Minnesota.
Knoot, T. G., M. E. Shea, L. A. Schulte, J. C. Tyndall, M. D. Nelson, C. H. Perry, and B. J. Palik.
2015. Forest change in the Driftless Area of the Midwest: From a preferred to undesirable future.
Forest Ecology and Management 341: 110–120.
31
Liepelt, S., C. Sperisen, M. Deguilloux, R. Petit, R. Kissling, M. Spencer, J, de Beaulieu, P. Taberlet,
L. Gielly, and B. Ziegenhagen. 2006. Authenticated DNA from ancient wood remains. Annals of
Botany 98(5):1107-1111.
Marschner, Francis J. 1930. The original vegetation of Minnesota. Unpublished map.
McAndrews, J. H. 1988. Human disturbance of North American forests and grasslands: The fossil
pollen record. Pages 673-697 in Vegetation history. Springer Publishing, Dordrecht, The
Netherlands.
Minnesota Department of Natural Resources (MN DNR). 1997. Original land survey bearing trees
database. Available for download from https://gisdata.mn.gov/dataset/biota-original-pls-bearing-
trees.
Minnesota Department of Natural Resources (MN DNR). 2003. Native Plant Community Class Fact
Sheets. Available at https://www.dnr.state.mn.us/npc/classification.html (accessed 14 October 2019).
Minnesota Pollution Control Agency (MPCA). 2020. Minnesota statewide altered watercourse project: A
short history of stream channel alterations in Minnesota.
https://www.pca.state.mn.us/water/minnesota-statewide-altered-watercourse-project (accessed 28
October 2020).
National Centers for Environmental Information (NCEI). 2020. Picture climate: How pollen tells us about
climate. https://www.ncdc.noaa.gov/news/picture-climate-how-pollen-tells-us-about-climate
(accessed 23 November 2020).
Webb, Sara L. 1987. Beech range extension and vegetation history: Pollen stratigraphy of two Wisconsin
lakes. Ecology 68(6):1993-2005.
Wendt, Keith M.. and Barbara A. Coffin. 1988. Natural vegetation of Minnesota at the time of the Public
Land Survey, 1847-1907. Biological Report No. 1. Minnesota Department of Natural Resources, St.
Paul, Minnesota.
Wheeler, William A. 1900. A contribution to the knowledge of the flora of southeastern Minnesota. Pages
353-416 in Minnesota botanical studies: Second series, part IV. Geological and Natural History Survey
of Minnesota, Minneapolis, Minnesota.
Williams, Gerald W. 2005. References on the American Indian use of fire in ecosystems. U.S. Forest
Service, Washington, D.C.
Wright, H. E., I. Stefanova, J. Tian, T. A. Brown, F. S, Hu. 2004. A chronological framework for the
Holocene vegetational history of central Minnesota: the Steel Lake pollen record. Quaternary Science
Reviews 23(5-6):611-626.
32
Appendix A. Original Vegetation of Minnesota.
The Natural Vegetation of Minnesota at the Time of the Public Land Survey: 1847-1907. Based on mapping by Marschner (1930), adapted by Barbara Coffin of the MN DNR in 1988 (see Wendt and Coffin 1988).
33
Appendix B. Minnesota native vegetation communities present in southeast Minnesota (downloaded from https://www.dnr.state.mn.us/npc/classification.html). S. = Southern
Name Key plants Aspect/Slope Hydrology Soils Other
Forest/Woodland
S. Floodplain Forest silver maple, green ash, cottonwood, American elm
level annually flooded sandy/silty alluvium sparse ground cover in spring; shrubs sparse or patchy, vines present. 50-100% canopy cover
S. Terrace Forest Variable: Am. Elm, green ash, hackberry, basswood, boxelder, silver maple, cottonwood, sometimes swamp white oak
level to undulating occasionally flooded
sandy/silty alluvium more ground cover than FF, shrubs sparse or patchy, 50-100% canopy cover
S. Dry-Mesic Oak-Hickory Woodland
bur oak, shagbark hickory, Am. Elm, black walnut, box elder; northern pin oak, white oak, northern red oak, black cherry
steep, exposed, south- to west facing
bluffs --
wind-deposited silt, rock outcrops, well to excessively drained
shrub cover 25-100%, canopy cover 75-100%, large open-grown trees often present; fires historically common
S. Dry-Mesic Oak Forest
northern red oak, white oak, basswood, occasionally shagbark hickory
crests & upper slopes of bluffs; most common on N facing but also on W or E facing crests
--
thin, wind-deposited silt
shrub cover 25-75%, canopy cover 50-100%
Prairie & Savanna
S. Mesic savanna bur oak, usually northern pin oak
level to gently rolling
--
somewhat poorly drained to well-drained loam; “fertile soils and gentle relief are ideal for row-crop agriculture”
sparsely treed with tallgrass-dominated ground layers (50-100% graminoid cover), patchy shrubs; fire is frequent but tolerant trees are able to establish
S. Dry Savanna bur oak, northern pin oak, sometimes black oak
nearly level to steeply sloping
--
droughty, usually sands
Sparsely treed (25-50% cover) with grass-dominated ground layers; trees are open grown, typically small and gnarled; fire is frequent but tolerant trees are able to establish
S. Mesic Prairie Tallgrasses (big bluestem & Indian grass) -- --
somewhat
poorly drained to well-drained loam
Grass-dominated but forb rich, trees absent; “Recurrent fire is
essential”

34
Name Key plants Aspect/Slope Hydrology Soils Other
S. Dry Prairie Mid- to short grasses (Little bluestem, sideoats grama), sometimes tall grasses
level to steeply sloping
--
droughty, excessively drained
Grass-dominated, mostly mid –height and short grasses; “fire frequency required to maintain dry prairies is lower than for mesic prairies because the xeric conditions and lower fertility of the sites somewhat inhibit tree and shrub invasion”
Marsh
S. Wet Prairie Tallgrasses dominate (prairie cordgrass, big bluestem)
Typically in slight depressions,
sometimes on very gentle slopes
Flooded for brief periods at most; upper
part of rooting zone is not saturated for most of season, saturation
usually persists in lower zone
poorly drained
to very poorly drained loam, high organic content
Grass-dominated but forb rich; graminoid cover 75-100%, shrubs 0-25% cover; “Recurrent fire is essential”
Cliffs
S. Wet cliff moss-dominated, liverworts, algae; trees rarely important (w. pine, yew)
shaded northwest‑ to
east‑facing, lower slopes, often in valleys
seeping groundwater --
vascular plants largely restricted to crevices and ledges, rugged terrain
S. Maderate Cliff Mosses, liverworts, algae, lichen on exposed rock; trees rarely important
shaded NW to
NE‑facing cliffs, often in deep valleys
some groundwater seepage
minimal soil development
Cool, moist, climate in karst landscapes; supports northern plants uncommon
in southern MN
S. Mesic Cliff Lichen dominant on exposed bedrock, mosses less abundant; sparse ferns & forbs
shaded, northwest‑ to
east‑facing cliffs --
minimal soil development
vascular plants largely restricted to crevices and ledges, rugged terrain; subject to env. extremes
S. Dry Cliff lichen-dominated, moss occasional, possibly short red cedar or junipers
sunny, south to west-facing --
minimal soil development
vascular plants largely restricted to crevices and ledges, rugged terrain

35
Appendix C. Historic Vegetation Communities (Pre-European Settlement) of Winona Township (T 107N, R 7W)
Adapted from the Minnesota DNR’s Key to Natural Vegetation Communities (Aaseng et al. 1993) and Native
Plant Community Class Fact Sheets (see https://www.dnr.state.mn.us/npc/classification.html)
Southern Floodplain Forest – These forests occur on level ground (active river floodplains) that are frequently
(often annually) flooded. Soils are typically sandy/silty alluvium. Common canopy trees are silver maple (Acer
saccharinum), green ash (Fraxinus pennsylvanica), cottonwood (Populus deltoides), American elm (Ulmus
americana). Scattered river birch (Betula nigra), black willow (Salix nigra), swamp white oak (Quercus bicolor),
and vine species may also occur. Due to the regular flooding, the understory and ground cover are usually sparse.
Southern Terrace Forest – These forests occur on lands that are transitional between upland and wetland sites,
where water tables are seasonally high but flooding is only occasional. Soils are poorly drained alluvium, and tree
species present must be tolerant of periodic soil saturation. Common species include American elm, green and
black ash (Fraxinus nigra), cottonwood, boxelder (Acer negundo), silver maple, and sometimes basswood (Tilia
americana) or hackberry (Celtis occidentalis). Ground cover and understory are less sparse than in floodplain
forests but can be patchy.
Southern Dry-Mesic Oak Forest – This oak forest type occurs on the crests and upper slopes of bluffs, most
commonly on north-facing sites but also on west- and east-facing bluffs. Canopy cover is somewhat open,
generally around 70-80%, with at least 30% of tree canopy consisting of oak species. Soils are typically thin,
well-drained, nutrient-poor sand or silt. The dominant oak species are white oak (Quercus alba), bur oak (Q.
macrocarpa), and black oak (Q. velutina), possibly with northern pin oak (Q. ellipsoidalis). Additional tree
species may include shagbark hickory (Carya ovata), paper birch (Betula papyrifera), and quaking aspen
(Populus tremuloides).
Dry-Mesic Oak Woodland – These oak woodlands are considered intermediate between more open savannas
and denser oak forests. Historically, these woodlands were likely one of the most extensive community types in
Minnesota. They are common on steep south- to west-facing slopes with well drained to excessively drained silty
soils and occasional rocky outcrops. Oak woodlands may also occur on outwash terraces of the Mississippi River.
In southeast Minnesota, the dominant tree species are white oak, bur oak, black oak, and northern pin oak.
Shagbark hickory, black walnut (Juglans nigra), American elm, black cherry (Prunus serotina), and quaking
aspen may also be present. Fires were common historically and maintained the more open nature (woodland vs.
forest) of the community.
Southern Dry Savanna – Savannas are “sparsely treed” communities (25-50% canopy cover) with a grass-
dominated ground layer. In dry savannas, trees are often small and gnarled. Soils are typically sandy and well to
excessively drained. The most common tree species are bur oak, northern pin oak, and black oak (especially in
southeast Minnesota). Common understory species include Junegrass (Koeleria macrantha), porcupine grass
(Hesperostipa spartea), goldenrods (Solidago spp.), and puccoons (Lithospermum spp.). While savannas are
considered fire-dependent communities, fires are generally less frequent than in prairies, allowing some fire-
tolerant tree species to become established.
Southern Mesic Savanna – Like dry savanna, mesic savanna is sparsely treed, but has a ground layer dominated
by species typical of the more mesic tallgrass prairie. Sites are level to gently rolling. Soils are somewhat poorly
drained to well drained loam and are often fertile enough to be ideal for agricultural crops. The characteristic tree

36
species is bur oak, occasionally with northern pin oak. Dominant understory grasses are big bluestem
(Andropogon gerardii) and Indian grass (Sorghastrum nutans).
Southern Dry Prairie – Dry prairies occur on level to steeply sloped sites with well-drained to excessively
drained soils that may even be considered “droughty”. Prairies are maintained by frequent fire, which prevents
invasion by shrubs and trees. They are grass-dominated, mostly with mid- to short grasses and sedges, but also
some tallgrasses. Common grasses include big bluestem, little bluestem (Schizachyrium scoparium), side-oats
grama (Bouteloua curtipendula), and Junegrass. Forbs (i.e., wildflowers) include prairie clovers (Dalea spp.),
gray goldenrod (Solidago nemoralis), silky and aromatic asters (Symphyotrichum sericeum and oblongifolius),
pasqueflower (Pulsatilla patens), and blazing stars (Liatris spp.). A subtype of dry prairie – the bluff or goat
prairie – occurs on very steep south- and west-facing slopes along the Mississippi River and its tributaries. These
prairies typically occur as small openings surrounded by woodland or forest.
Southern Mesic Prairie – Mesic prairies are found on level to gently rolling sites with somewhat poorly drained
to well-drained loamy soils. As with dry prairies, these habitats are maintained by recurring fires. They are
dominated by tallgrasses such as big bluestem and Indian grass but are also rich in forbs, including stiff goldenrod
(Solidago rigida), heath and smooth blue aster (Symphyotrichum ericoides and laeve), prairie clovers, and
sunflowers (Helianthus spp.). In southeastern Minnesota, rattlesnake master (Eryngium yuccifolium) and compass
plant (Silphium laciniatum) are also common.
Southern Wet Prairie – These prairies occur in depressions or along drainageways (including river terraces)
where the water table remains within the plant rooting zone for several weeks during the growing season, but
actual flooding is brief and infrequent. Soils are typically poorly or very poorly drained with high organic matter
content. Vegetation is dominated by graminoids (e.g., grasses, sedges, rushes) but can include diverse forbs. In
southern Minnesota, dominant grasses include prairie cordgrass (Spartina pectinata), Canada bluejoint
(Calamagrostis canadensis), and big bluestem.
Cliff Communities (dry, maderate, mesic, wet) - These communities occur on steep bedrock bluffs, typically
composed of limestone, dolomite, or sometimes sandstone. Soil development is limited and mostly confines to
ledges and crevices. Tree, shrub, and herbaceous plant coverage is usually sparse and patchy. However, lichen
and bryophyte (e.g., mosses, liverworts) cover on exposed rock can be high.