digital world forum
TRANSCRIPT
DIGITAL WORLD FORUM - 2165133
D3.1 ANALYSIS OF THE BROADBAND AND INFRASTRUCTURE DOMAIN PAGE 1 OF 45
Digital World Forum
DigitalWorld Forum on Accessible and Inclusive ICT
DELIVERABLE N° D3.1
STATE-OF-THE-ART ANALYSIS OF THE BROADBAND ACCESS AND INFRASTRUCTURE DOMAIN (M6)
JUNE 2008
DIGITAL WORLD FORUM - 2165133
D3.1 ANALYSIS OF THE BROADBAND AND INFRASTRUCTURE DOMAIN PAGE 2 OF 45
PROJECT DELIVERABLE REPORT
PROJECT
GRANT AGREEMENT NUMBER: 2165133
PROJECT ACRONYM: DIGITAL WORLD FORUM
PROJECT TITLE: DIGITAL WORLD FORUM ON ACCESSIBLE & INCLUSIVE ICT
FUNDING SCHEME: COORDINATION & SUPPORT ACTION
DATE OF LATEST VERSION OF ANNEX I AGAINST WHICH THE ASSESSMENT WILL BE MADE:
12 NOVEMBER 2007
DOCUMENT
DELIVERABLE NUMBER: D3.1
DELIVERABLE TITLE STATE-OF-THE-ART ANALYSIS OF THE BROADBAND AND INFRASTRUCTURE DOMAIN
CONTRACTUAL DATE OF DELIVERY: JUNE 2008
ACTUAL DATE OF DELIVERY: 24 JUNE 2008
EDITOR (S): SALAH-EDDINE EL AYOUBI, BRUNO CONQUET
AUTHOR (S): SALAH-EDDINE EL AYOUBI, MAX FRANCISCO,
DAMIEN CHAPON
REVIEWER (S): JEAN MARC PICARD
PARTICIPANT(S): N/A
WORK PACKAGE NO.: WP3
WORK PACKAGE TITLE: LOW-COST BROADBAND ACCESS AND INFRASTRUCTURE
WORK PACKAGE LEADER: BRUNO CONQUET
WORK PACKAGE PARTICIPANTS: NEM, MERAKA (CSIR), CIBER, CC, OVFGH, FT
DISTRIBUTION: PUBLIC
VERSION/REVISION: 2
DRAFT/FINAL: FINAL
TOTAL NUMBER OF PAGES (INCLUDING COVER): 45
KEYWORDS: BROADBAND ACCESS, LINK BUDGET, CAPACITYWIMAX, HSPA, CDMA 2000, VOICE OVER IP,NETWORK ARCHITECTURE
DIGITAL WORLD FORUM - 2165133
D3.1 ANALYSIS OF THE BROADBAND AND INFRASTRUCTURE DOMAIN PAGE 3 OF 45
D I S C L A I M E R
This document contains description of the Digital World Forum project work and findings.
The authors of this document have taken any available measure in order for its content to be accurate, consistent and lawful. However, neither the project consortium as a whole nor the individual partners that implicitly or explicitly participated in the creation and publication of this document hold any responsibility for actions that might occur as a result of using its content.
This publication has been produced with the assistance of the European Union. The content of this publication is the sole responsibility of the Digital World Forum and can in no way be taken to reflect the views of the European Union.
The European Union is established in accordance with the Treaty on European Union (Maastricht). There are currently 27 Member States of the Union. It is based on the European Communities and the member states cooperation in the fields of Common Foreign and Security Policy and Justice and Home Affairs. The five main institutions of the European Union are the European Parliament, the Council of Ministers, the European Commission, the Court of Justice and the Court of Auditors. (http://europa.eu.int/)
Digital World Forum is a project funded in part by the European Union.

DIGITAL WORLD FORUM - 2165133
D3.1 ANALYSIS OF THE BROADBAND AND INFRASTRUCTURE DOMAIN PAGE 4 OF 45
C H A N G E L O G
Reason for change Issue Revision Date Minor adjustments subsequent to 1st project review in Brussels
Mentions to future techno-
economic elements removed
30 Jul 08
DIGITAL WORLD FORUM - 2165133
D3.1 ANALYSIS OF THE BROADBAND AND INFRASTRUCTURE DOMAIN PAGE 5 OF 45
T A B L E O F C O N T E N T S
SUMMARY............................................................................................................................................ 7
1 SCOPE OF THE STUDY.............................................................................................................. 9
2 INTRODUCTION.......................................................................................................................... 9
3 LINK BUDGET COMPARISON............................................................................................... 10 3.1 HSPA ........................................................................................................................................................ 11
3.1.1 Parameters ....................................................................................................................................... 11 3.1.2 Results............................................................................................................................................... 11
3.2 WIMAX ...................................................................................................................................................... 16 3.2.1 Parameters ....................................................................................................................................... 16 3.2.2 Results............................................................................................................................................... 16
3.3 CDMA 2000 1X EVDO............................................................................................................................... 20 3.3.1 Parameters and hypotheses ............................................................................................................. 20 3.3.2 Results............................................................................................................................................... 20
4 CAPACITY EVALUATION....................................................................................................... 23 4.1 CELLULAR SYSTEMS CAPACITY ANALYSIS ....................................................................................................... 23
4.1.1 HSDPA capacity analysis ................................................................................................................ 23 4.1.2 WiMAX capacity analysis methodology .......................................................................................... 23 4.1.3 CDMA 1x EV-DO hypothesis........................................................................................................... 23 4.1.4 Load calculation methodology......................................................................................................... 23
4.2 CASE STUDIES ............................................................................................................................................. 24 4.2.1 Constructing a coverage-limited network ....................................................................................... 24 4.2.2 Reusing GSM sites for deploying the network................................................................................. 26 4.2.3 Dimensioning cells for a given traffic ............................................................................................. 29
5 VOICE SERVICE SUPPORT .................................................................................................... 31 5.1 HSPA/HSPA +........................................................................................................................................... 31
5.1.1 General overview of the UMTS QoS framework............................................................................. 31 5.1.2 VoIP over HSPA............................................................................................................................... 33 5.1.3 VoIP over HSPA+............................................................................................................................ 33
5.2 EDGE/EDGE EVOLVED .............................................................................................................................. 34 5.2.1 VoIP over Edge ................................................................................................................................ 34 5.2.2 VoIP over Evolved Edge .................................................................................................................. 34
5.3 CDMA 2000............................................................................................................................................... 34 5.4 WIMAX ...................................................................................................................................................... 34
5.4.1 General WiMAX QoS concept ......................................................................................................... 34 5.4.2 VoIP over WiMAX............................................................................................................................ 35
5.5 WIFI MESH .................................................................................................................................................. 35 5.6 VOIP SERVICE SUPPORT COMPARISON .......................................................................................................... 35
6 SYSTEM ARCHITECTURE OVERVIEW .............................................................................. 37 6.1 EDGE/EDGE EVOLVED .............................................................................................................................. 37
6.1.1 EDGE architecture........................................................................................................................... 37 6.1.2 EDGE Evolved architecture ............................................................................................................ 38
6.2 HSPA/HSPA +........................................................................................................................................... 38 6.2.1 HSPA architecture ........................................................................................................................... 38 6.2.2 HSPA+.............................................................................................................................................. 39
6.3 CDMA 2000............................................................................................................................................... 39 6.4 WIMAX ...................................................................................................................................................... 40 6.5 WIFI MESH .................................................................................................................................................. 41 6.6 ARCHITECTURE COMPARISON ....................................................................................................................... 42
7 CONCLUSION............................................................................................................................. 44
8 REFERENCES............................................................................................................................. 45

DIGITAL WORLD FORUM - 2165133
D3.1 ANALYSIS OF THE BROADBAND AND INFRASTRUCTURE DOMAIN PAGE 6 OF 45
List of Figures
Figure 1: Link budget methodology [6]................................................................................................ 10 Figure 2: HSDPA900 throughput vs distance to BS for outdoor CPE in urban areas. ......................... 12 Figure 3: HSDPA900 throughput vs distance to BS for indoor CPE in urban areas. ........................... 12 Figure 4: HSDPA900 throughput vs distance toBS for outdoor CPE in rural areas............................. 13 Figure 5: HSDPA900 throughput vs distance to BS for indoor CPE in rural areas. ............................. 13 Figure 6: HSDPA2000 throughput vs distance toBS for outdoor CPE in urban areas. ........................ 14 Figure 7: HSDPA2000 throughput vs distance to BS for indoor CPE in urban areas. ......................... 14 Figure 8: HSDPA2000 throughput vs distance to BS for outdoor CPE in rural areas. ........................ 15 Figure 9: HSDPA2000 throughput vs distance to BS for indoor CPE in rural areas. ........................... 15 Figure 10: WiMAX 2600 throughput for outdoor CPE in urban areas, 5 MHz bandwidth. ................... 17 Figure 11: WiMAX 2600 throughput for outdoor CPE in urban areas, 10 MHz bandwidth. ................. 17 Figure 12: WiMAX 2600 throughput for indoor CPE in urban areas, 5 MHz bandwidth....................... 18 Figure 13: WiMAX 2600 throughput for indoor CPE in urban areas, 10 MHz bandwidth..................... 18 Figure 14: WiMAX 3500 throughput for outdoor CPE in urban areas, 5 MHz bandwidth. ................... 19 Figure 15: WiMAX 3500 throughput for outdoor CPE in urban areas, 7 MHz bandwidth. ................... 19 Figure 16: EVDO throughput for outdoor CPE in urban areas. ........................................................... 20 Figure 17: EVDO throughput for indoor CPE in urban areas............................................................... 21 Figure 18: EVDO throughput for outdoor CPE in rural areas. ............................................................. 21 Figure 19: EVDO throughput for indoor CPE in rural areas................................................................. 22 Figure 20: HSDPA QoS for coverage-limited cells in urban areas. ..................................................... 25 Figure 21: WiMAX QoS for coverage-limited cells in urban areas....................................................... 25 Figure 22: HSDPA QoS for coverage-limited cells in rural areas. ....................................................... 25 Figure 23: WiMAX QoS for coverage-limited cells in rural areas......................................................... 26 Figure 24: EVDO throughput versus distance when reusing GSM sites. ............................................ 27 Figure 25: EVDO QoS when reusing GSM sites................................................................................. 27 Figure 26: HSDPA QoS when reusing GSM sites............................................................................... 28 Figure 27: WiMAX QoS when reusing GSM sites. .............................................................................. 28 Figure 28: Blocking rates for a given traffic for different cell ranges. ................................................... 29 Figure 29: Probability of reaching the target throughput for different cell ranges. ............................... 30 Figure 30: UMTS QoS architecture..................................................................................................... 32 Figure 31: EDGE architecture............................................................................................................. 37 Figure 32: HSPA architecture ............................................................................................................. 38 Figure 33: HSPA+ architecture ........................................................................................................... 39 Figure 34: CDMA2000 architecture overview...................................................................................... 40 Figure 35: WiMAX architecture ........................................................................................................... 41 Figure 36: WiFi mesh architecture overview ....................................................................................... 42

DIGITAL WORLD FORUM - 2165133
D3.1 ANALYSIS OF THE BROADBAND AND INFRASTRUCTURE DOMAIN PAGE 7 OF 45
S U M M A R Y
In this document, we present a first study on the capacity and architecture of the different systems that can be deployed in emerging countries. We namely consider WiMAX, HSDPA, 1x EV-DO, EDGE and WiFi mesh. As several technological implementations are possible (bandwidth size equal to 1.25/5/7/10 MHZ, frequency of 450/900/2000/2600/3500 MHz), and several environments are to be studied (urban/rural) with a possible usage of an outdoor CPE, we perform a study on the coverage and throughput in different configurations and come out with general conclusions concerning the comparative capacity, coverage and architecture of the studied systems. A second version of this document will extend this study to a larger number of systems. In particular, the capacity of the WiFi networks (hotspot WiFi or WiFi mesh) and of EDGE/EDGE evolved will be assessed analytically; the capacity of VoIP over the different networks will also be studied.
The conclusions drawn from this work are as follows:
• Coverage analysis: As expected, the coverage is extremely related to the frequency. The coverage of EV-DO 450 is thus the largest, far ahead of HSDPA 900 that, in turn, has a larger coverage than HSDPA 2000. On the other hand, having an outdoor CPE with a gain of 6 dB will increase significantly the coverage of all systems, but will increase also the costs. Outdoor CPE are thus to be used only when there are some far isolated users or when we have channels on high frequencies (e.g. WiMAX at 3,5Ghz).
• Capacity analysis: When the cells are deployed based only on coverage criteria, systems like EVDO or HSDPA at 2Ghz will have very large cells and will not be able to serve a large number of subscribers. A joint capacity-coverage dimensioning is thus necessary. We consider two case studies. The first is when the telecommunications operator has an already deployed GSM network and wants to reuse the existing sites to offer the internet service. We thus give the capacity of the resulting network for the different systems. The other case is when the operator has a target penetration for its service and wants to know the best inter-site distance for each technology.
• Architecture comparison: For 3GPP/3GPP2 systems (EDGE, HSPA, CDMA 2000), there is no major difference for network Packet Switch (PS) architecture. The access network composed of Base Stations and Base Station Controllers and the core network composed of a GGSN, SGSN and HLR (MSC and PDSN for CDMA 2000). The migration from GPRS to Edge or from EDGE to HSPA (or from CDMA 2000 EVDO Rev 0 to Rev A) does not need an hardware upgrade of the PS core network if PS core network capacity still sufficient after migration (since data rate in the access network will increase). For WiMAX, it provides a very simple all IP architecture with few elements in the core network (only an AAA server with embedded DHCP function) reducing needed OPEX. It has to be noted that architecture evolution is toward reducing the number of nodes in the network (e.g. RNC in Node B for HSPA). As of WiFi mesh, the architecture is also very simple but standardization process is not finished and many proprietary solutions are implemented.

DIGITAL WORLD FORUM - 2165133
D3.1 ANALYSIS OF THE BROADBAND AND INFRASTRUCTURE DOMAIN PAGE 8 OF 45
• Voice over IP support: For HSPA+, WiMAX and CDMA 2000 Rev A, QoS mechanisms and radio performances will allow deploying a VoIP service offering a high quality call. However for HSPA+, since no product will be available before 2009, VoIP quality should be assessed when available. For HSPA, 2008 product does not implement all features needed to deploy a VoIP service with QoS. For Edge, it will be not possible to offer a VoIP service since mouth to ear delay is too high in bad radio conditions. Note that information related to WiFi mesh and Edge Evolved will be provided in the second version of the document.
• Future work and extensions: A second version of this document will be made available by October, 2008. It will extend this study to a larger number of systems. In particular, the capacity of the WiFi networks (hotspot WiFi or WiFi mesh) and of EDGE/EDGE evolved will be assessed analytically; the capacity of VoIP over the different networks will also be studied.
DIGITAL WORLD FORUM - 2165133
D3.1 ANALYSIS OF THE BROADBAND AND INFRASTRUCTURE DOMAIN PAGE 9 OF 45
S T A T E - O F - T H E - A R T A N A L Y S I S O F T H E B R O A D B A N D
A C C E S S A N D I N F R A S T R U C T U R E D O M A I N
1 SCOPE OF THE STUDY
The first version of this document focuses on WiMAX, HSDPA, 1x EV-DO, EDGE and WiFi mesh. A second version of this document will be made available by October, 2008, extending this study to a larger number of systems.
2 INTRODUCTION
With the multiplication of standards and technologies, designing a new network in emerging countries is becoming a challenging task. The goal is to minimize costs while guaranteeing a good QoS. This document presents a general study that compares the capacity of the different systems, namely HSDPA, CDMA 2000 1xEVDO and WiMAX. These systems use different radio access technologies and can be deployed on different channels and frequencies. The following table gives the summary of the frequencies at which each technology can be deployed.
Table 1: Frequency with associated channel bandwidth
Frequencies Associated channel bandwidth
Licensed band?
Access Technology
HSPA 900Mhz, 2Ghz 5Mhz YES CDMA/TDMA Edge 900Mhz, 1,8Ghz 200KHz YES TDMA CDMA 2000 1x EV-DO 450Mhz, 800Mhz 1.25Mhz YES CDMA/TDMA
700Mhz, 2.5Ghz 5 or 10Mhz YES OFDMA WiMAX 3.5Ghz 5, 7 or 10Mhz YES OFDMA WiFi/WiFi mesh 2.4Ghz, 5Ghz 20Mhz NO CSMA/CA This document investigates several cases. First, if the telecommunications operator has a complete choice in terms of spectrum and technology, we compare the coverage, capacity and architecture of the candidate systems in the different environments to allow an optimal choice. In the case where the operator has already acquired a licence, the document aims at presenting a methodology for choosing the best inter-site distance for achieving a good QoS at low costs. Reusing existing GSM sites is also a studied option. This document is organized as follows. In Section 3, we perform an analysis based on link budget to assess the throughput of HSDPA, CDMA 2000 1xEVDO and WiMAX. The main results are in terms of maximal cell range and corresponding throughput versus distance to the base station. In section 4, the methodology (and results) presented in section 3 is used to evaluate the capacities of the candidate systems in three cases: when the cells are coverage-limited, when reusing existing GSM sites, or when deploying a new, capacity-limited network. Section 5 is a comparative study about the support of voice over IP in the different systems. Section 6 compares the architectures of the candidate systems; this comparison is necessary to compare the CAPEX and OPEX needed when deploying the network. Section 7 eventually concludes the deliverable.
DIGITAL WORLD FORUM - 2165133
D3.1 ANALYSIS OF THE BROADBAND AND INFRASTRUCTURE DOMAIN PAGE 10 OF 45
3 LINK BUDGET COMPARISON
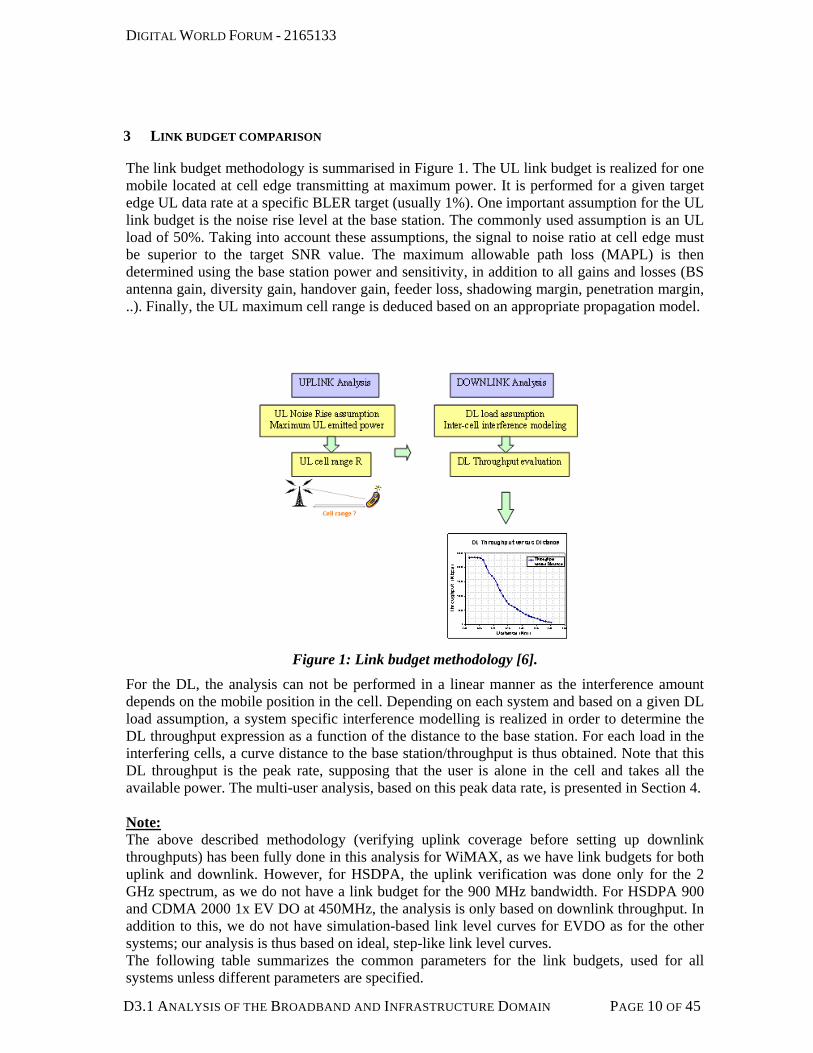
The link budget methodology is summarised in Figure 1. The UL link budget is realized for one mobile located at cell edge transmitting at maximum power. It is performed for a given target edge UL data rate at a specific BLER target (usually 1%). One important assumption for the UL link budget is the noise rise level at the base station. The commonly used assumption is an UL load of 50%. Taking into account these assumptions, the signal to noise ratio at cell edge must be superior to the target SNR value. The maximum allowable path loss (MAPL) is then determined using the base station power and sensitivity, in addition to all gains and losses (BS antenna gain, diversity gain, handover gain, feeder loss, shadowing margin, penetration margin, ..). Finally, the UL maximum cell range is deduced based on an appropriate propagation model.
Figure 1: Link budget methodology [6].
For the DL, the analysis can not be performed in a linear manner as the interference amount depends on the mobile position in the cell. Depending on each system and based on a given DL load assumption, a system specific interference modelling is realized in order to determine the DL throughput expression as a function of the distance to the base station. For each load in the interfering cells, a curve distance to the base station/throughput is thus obtained. Note that this DL throughput is the peak rate, supposing that the user is alone in the cell and takes all the available power. The multi-user analysis, based on this peak data rate, is presented in Section 4. Note: The above described methodology (verifying uplink coverage before setting up downlink throughputs) has been fully done in this analysis for WiMAX, as we have link budgets for both uplink and downlink. However, for HSDPA, the uplink verification was done only for the 2 GHz spectrum, as we do not have a link budget for the 900 MHz bandwidth. For HSDPA 900 and CDMA 2000 1x EV DO at 450MHz, the analysis is only based on downlink throughput. In addition to this, we do not have simulation-based link level curves for EVDO as for the other systems; our analysis is thus based on ideal, step-like link level curves. The following table summarizes the common parameters for the link budgets, used for all systems unless different parameters are specified.
DIGITAL WORLD FORUM - 2165133
D3.1 ANALYSIS OF THE BROADBAND AND INFRASTRUCTURE DOMAIN PAGE 11 OF 45
Table 2: Common link budget parameters.
CPE SITUATION INDOOR WINDOW/OUTDOOR ENVIRONMENT TYPE URBAN/RURAL OUTDOOR CPE GAIN 6 dB UL THROUGHPUT AT CELL EDGE 64 kbps DL THROUGHPUT AT CELL EDGE 200 kbps LINK LEVEL INPUTS Cat 8 Va3 LMMSE PROPAGATION MODEL Cost-231 Hata DL LOAD OF SERVING CELL 100% DL LOAD OF INTERFERING CELLS 0-100% MIMO SCHEME SISO NODE B TOTAL POWER 43 dBm COVERAGE PROBABILITY 90% MAST HEAD AMPLIFIER used SCHEDULER Round robin INTER SITE DISTANCE 1.5 cell range BTS ANTENNA GAIN 17 dBi FEEDER LOSS 3 dB THERMAL NOISE -173.83 dBm/Hz UE MAXIMAL POWER 21 dBm
3.1 HSPA
3.1.1 Parameters
The same parameters as in Table 2 are used. The uplink link budget is used in HDPA 2000 to verify that the UL coverage is achieved at cell edge. For HSPA 900, we do not have a validated link budget for HSUPA 900 to perform this verification. Recall that, in HSDPA, there is no intra-cell interference between users, but only between users and the common channels. The overall proportion of HSDPA common channels in the power budget is equal to 20%.
3.1.2 Results
3.1.2.1 HSDPA 900 Figure 2 to Figure 5 plot the HSDPA 900 peak throughput versus distance to base station for different CPE situations (outdoor/indoor Window) and for urban and rural areas. Three curves are given for each case: one for an isolated cell (0% load), another for a load of 50% in the adjacent cells and the third for a fully loaded system. The first, and most intuitive, observation to make is that rural coverage is better that urban coverage as the propagation is better (the cell may reach a range of 51 Km in rural areas compared to a maximum of 12 Km in urban areas, with a cell edge DL throughput of 200 Kbits/sec).

DIGITAL WORLD FORUM - 2165133
D3.1 ANALYSIS OF THE BROADBAND AND INFRASTRUCTURE DOMAIN PAGE 12 OF 45
Second, using an outdoor CPE increases the coverage because of the lower attenuation. For example, in urban areas, the maximal cell range is of 5 Km when putting the CPE indoor, while a 12 Km range can be attained for outdoor CPE. So, if the aim is to serve more users with less site density, an outdoor CPE is necessary. Third, Figure 2 to Figure 5 represent the throughput for three different load situations at neighbouring cells. We can observe that the influence of inter-cell interference is small as we are in large cells where we are limited by noise and not interference at cell edge.
0
1000
2000
3000
4000
5000
6000
7000
0,05
0
0,95
0
1,85
0
2,75
1
3,65
1
4,55
1
5,45
1
6,35
1
7,25
1
8,15
2
9,05
2
9,95
2
10,8
52Distance to the base station (Km)
Thro
ughp
ut (K
bits
/sec
Load=0%load=50%Load=100%
URBAN OUTDOOR 900 MHZ
Figure 2: HSDPA900 throughput vs distance to BS for outdoor CPE in urban areas.
0
1000
2000
3000
4000
5000
6000
7000
0,050
0,390
0,730
1,070
1,410
1,750
2,090
2,430
2,770
3,110
3,450
3,790
4,130
Load=0%Load=50%Load=100%
URBAN INDOOR 900 MHZ
Figure 3: HSDPA900 throughput vs distance to BS for indoor CPE in urban areas.

DIGITAL WORLD FORUM - 2165133
D3.1 ANALYSIS OF THE BROADBAND AND INFRASTRUCTURE DOMAIN PAGE 13 OF 45
0
1000
2000
3000
4000
5000
6000
7000
0,050
4,360
8,669
12,97
9
17,28
8
21,59
8
25,90
7
30,21
7
34,52
7
38,83
6
43,14
6
47,45
5
51,76
5
Load=0%Load=50%Load=100%
RURAL OUTDOOR 900 MHZ
Figure 4: HSDPA900 throughput vs distance toBS for outdoor CPE in rural areas.
0
1000
2000
3000
4000
5000
6000
7000
0,050
1,754
3,457
5,161
6,864
8,568
10,27
1
11,97
5
13,67
9
15,38
2
17,08
6
18,78
9
20,49
3
Load=0%Load=50%Load=100%
RURAL INDOOR 900 MHZ
Figure 5: HSDPA900 throughput vs distance to BS for indoor CPE in rural areas.
The following table summarizes the cell range for the different situations for HSDPA 900.
Table 3: HSDPA 900 cell ranges.
Indoor CPE Outdoor CPE Urban 4.3 Km 11.3 Km rural 21.4 Km 53.9 Km

DIGITAL WORLD FORUM - 2165133
D3.1 ANALYSIS OF THE BROADBAND AND INFRASTRUCTURE DOMAIN PAGE 14 OF 45
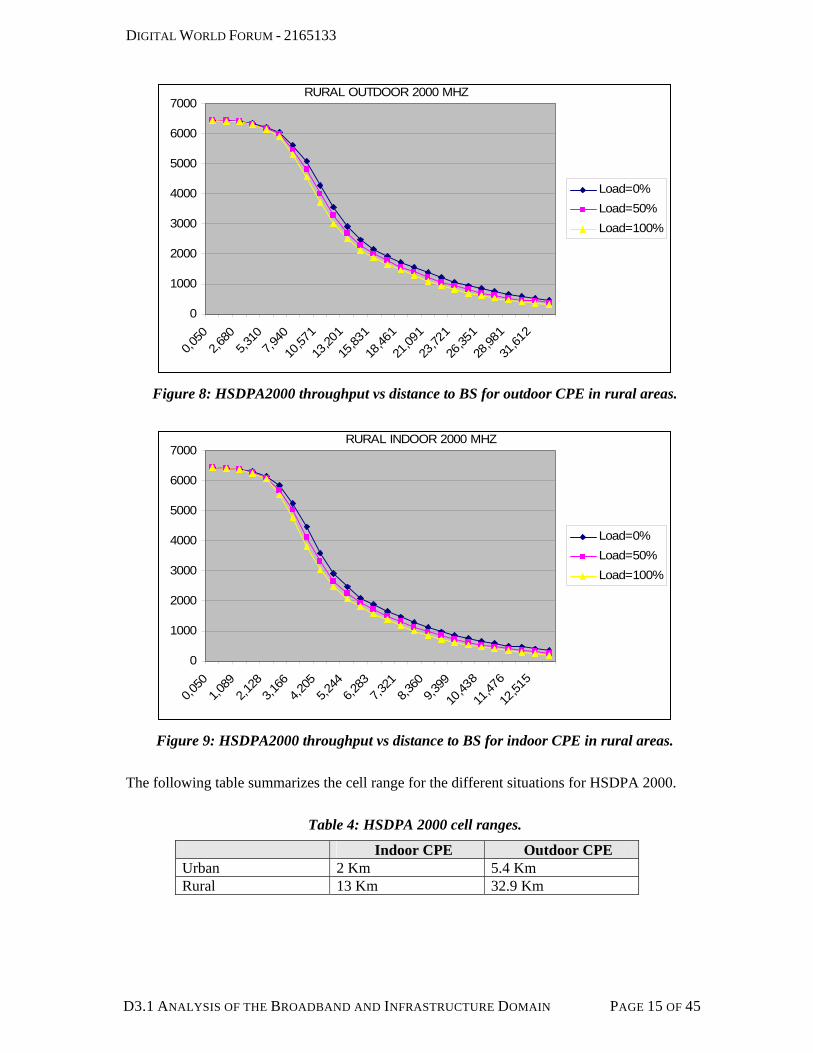
3.1.2.2 HSDPA 2000 Figure 6 to Figure 9 show the throughput for HSDPA 2000. The conclusions are the same as for HSDPA 900 concerning the impact of outdoor CPE and the difference between urban and rural areas. However, the cell range is smaller than in the 900 MHz bandwidth as the propagation conditions are more difficult (6 Km for urban outdoor compared to 12 Km for the HSDPA 900 case).
0
1000
2000
3000
4000
5000
6000
70000,
050
0,48
2
0,91
3
1,34
5
1,77
7
2,20
8
2,64
0
3,07
2
3,50
3
3,93
5
4,36
7
4,79
8
5,23
0
Distance to the base station (Km)
Thro
ughp
ut (K
bits
/sec
Load=0%load=50%Load=100%
URBAN OUTDOOR 2000 MHZ
Figure 6: HSDPA2000 throughput vs distance to BS for outdoor CPE in urban areas.
0
1000
2000
3000
4000
5000
6000
7000
0,050
0,212
0,374
0,535
0,697
0,859
1,021
1,182
1,344
1,506
1,668
1,829
1,991
Load=0%Load=50%Load=100%
URBAN INDOOR 2000 MHZ
Figure 7: HSDPA2000 throughput vs distance to BS for indoor CPE in urban areas.
DIGITAL WORLD FORUM - 2165133
D3.1 ANALYSIS OF THE BROADBAND AND INFRASTRUCTURE DOMAIN PAGE 15 OF 45
0
1000
2000
3000
4000
5000
6000
7000
0,050
2,680
5,310
7,940
10,57
1
13,20
1
15,83
1
18,46
1
21,09
1
23,72
1
26,35
1
28,98
1
31,61
2
Load=0%Load=50%Load=100%
RURAL OUTDOOR 2000 MHZ
Figure 8: HSDPA2000 throughput vs distance to BS for outdoor CPE in rural areas.
0
1000
2000
3000
4000
5000
6000
7000
0,050
1,089
2,128
3,166
4,205
5,244
6,283
7,321
8,360
9,399
10,43
8
11,47
6
12,51
5
Load=0%Load=50%Load=100%
RURAL INDOOR 2000 MHZ
Figure 9: HSDPA2000 throughput vs distance to BS for indoor CPE in rural areas.
The following table summarizes the cell range for the different situations for HSDPA 2000.
Table 4: HSDPA 2000 cell ranges.
Indoor CPE Outdoor CPE Urban 2 Km 5.4 Km Rural 13 Km 32.9 Km

DIGITAL WORLD FORUM - 2165133
D3.1 ANALYSIS OF THE BROADBAND AND INFRASTRUCTURE DOMAIN PAGE 16 OF 45
3.2 WiMAX
3.2.1 Parameters
For WiMAX, in addition to the common parameters specified above, we consider the following specific parameters:
Table 5: WiMAX link budget parameters.
FREQUENCY 2600 MHZ/3500 MHZ FREQUENCY REUSE MODE Reuse 3 DL/UL TDD RATIO 2 MIMO SCHEME Rx diversity DL MODE FUSC UL MODE PUSC BANDWIDTH 5/7/10 Mhz
We recall that the link budget is based on an analytical evaluation of the number of collisions, leading to different values of the SINR, as described in [6]. The link level curves are then used to obtain corresponding peak throughputs, that are then averaged based on the collision probabilities.
3.2.2 Results
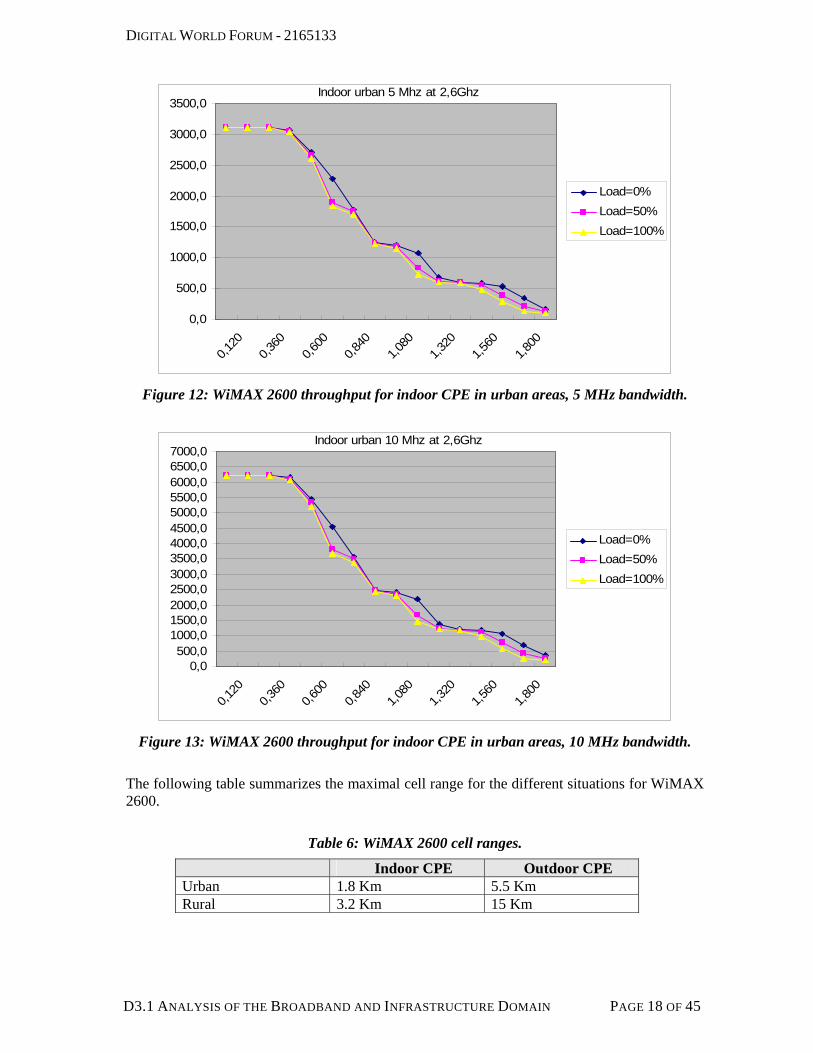
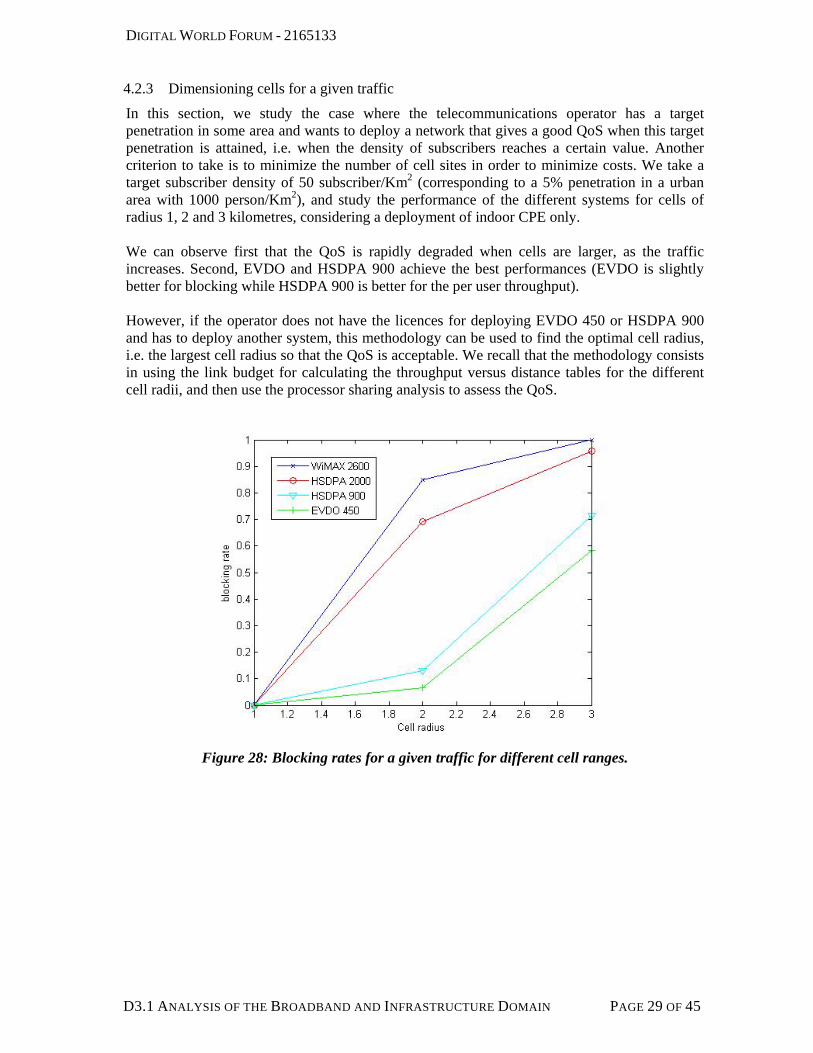
3.2.2.1 WiMAX at 2600 MHZ When assessing the throughput of WiMAX, we obtain the same observations as for HSDPA concerning the impact of using outdoor CPE (an increase in cell range) or the fact that cells in rural environments are larger. So, in this section, we will focus on a specificity of WiMAX of allowing a flexible carrier size (5, 7 or 10 MHz). Figure 10 to Figure 11 and Figure 12 to Figure 13 show that using a larger bandwidth will increase the throughput, even if the base station power is the same. This is because the number of resource blocks increases (doubles), and even if each resource block has less power, the overall throughput increases as the inter-cell interference will be reduced by the same manner. Comparing now WiMAX 2600 with HSDPA 900 and HSDPA 2000, the cell range is smaller because the propagation conditions are worse. In addition to that, we can see that WiMAX is more sensitive to inter-cell interference even if a reuse 3 is used because there is no scrambling between the different cells to decrease the impact of interference. The impact of interference is even larger when using an outdoor CPE because inter-cell interference will be much larger than the thermal noise.

DIGITAL WORLD FORUM - 2165133
D3.1 ANALYSIS OF THE BROADBAND AND INFRASTRUCTURE DOMAIN PAGE 17 OF 45
0,0
500,0
1000,0
1500,0
2000,0
2500,0
3000,0
3500,0
5,446
4,746
4,046
3,346
2,646
1,946
1,246
0,546
0,075
Load=0%Load=50%Load=100%
Outdoor urban 5 Mhz at 2,6Ghz
Figure 10: WiMAX 2600 throughput for outdoor CPE in urban areas, 5 MHz bandwidth.
0,0500,0
1000,01500,02000,02500,03000,03500,04000,04500,05000,05500,06000,06500,07000,0
5,446
4,746
4,046
3,346
2,646
1,946
1,246
0,546
0,075
Load=0%Load=50%Load=100%
Outdoor urban 10 Mhz at 2,6 Ghz
Figure 11: WiMAX 2600 throughput for outdoor CPE in urban areas, 10 MHz bandwidth.
DIGITAL WORLD FORUM - 2165133
D3.1 ANALYSIS OF THE BROADBAND AND INFRASTRUCTURE DOMAIN PAGE 18 OF 45
0,0
500,0
1000,0
1500,0
2000,0
2500,0
3000,0
3500,0
1,800
1,560
1,320
1,080
0,840
0,600
0,360
0,120
Load=0%Load=50%Load=100%
Indoor urban 5 Mhz at 2,6Ghz
Figure 12: WiMAX 2600 throughput for indoor CPE in urban areas, 5 MHz bandwidth.
0,0500,0
1000,01500,02000,02500,03000,03500,04000,04500,05000,05500,06000,06500,07000,0
1,800
1,560
1,320
1,080
0,840
0,600
0,360
0,120
Load=0%Load=50%Load=100%
Indoor urban 10 Mhz at 2,6Ghz
Figure 13: WiMAX 2600 throughput for indoor CPE in urban areas, 10 MHz bandwidth.
The following table summarizes the maximal cell range for the different situations for WiMAX 2600.
Table 6: WiMAX 2600 cell ranges.
Indoor CPE Outdoor CPE Urban 1.8 Km 5.5 Km Rural 3.2 Km 15 Km

DIGITAL WORLD FORUM - 2165133
D3.1 ANALYSIS OF THE BROADBAND AND INFRASTRUCTURE DOMAIN PAGE 19 OF 45
3.2.2.2 WiMAX at 3500 MHZ For the WiMAX 3500, the range is obviously the lowest, as illustrated by Figure 14. In addition to that, using a larger carrier will increase accordingly the throughput (Figure 15).
0,0
500,0
1000,0
1500,0
2000,0
2500,0
3000,0
3500,0
3,500
3,050
2,600
2,150
1,700
1,250
0,800
0,350
0,075
Load=0%Load=50%Load=100%
Outdoor urban 5 Mhz at 3,5 Ghz
Figure 14: WiMAX 3500 throughput for outdoor CPE in urban areas, 5 MHz bandwidth.
0,0
500,0
1000,0
1500,0
2000,0
2500,0
3000,0
3500,0
4000,0
4500,0
3,500
3,050
2,600
2,150
1,700
1,250
0,800
0,350
0,075
Load=0%Load=50%Load=100%
Outdoor urban 7 Mhz at 3,5 Ghz
Figure 15: WiMAX 3500 throughput for outdoor CPE in urban areas, 7 MHz bandwidth.
The following table summarizes the cell range for the different situations for WiMAX 3500.
Table 7: WiMAX 3500 cell ranges.
Indoor CPE Outdoor CPE Urban 1.2 Km 3.5 Km Rural 2.2 Km 10 Km

DIGITAL WORLD FORUM - 2165133
D3.1 ANALYSIS OF THE BROADBAND AND INFRASTRUCTURE DOMAIN PAGE 20 OF 45
3.3 CDMA 2000 1x EVDO
3.3.1 Parameters and hypotheses
In order to analyse the throughput for 1xEVDO, we use the HSDPA link budget 45] and implement the parameters and propagation models described in [2]. This is possible because of the large similarities between 1x EV DO and HSDPA, especially for using CDMA between different cells; The inter-cell interference analysis is thus the same. Note that, in EVDO, there is no CDMA use within the same cell, even with the common channels. We thus obtain the throughput without any common channels, and multiply it by the proportion of data transmission, taken equal to 75%. The table below summarizes the additional parameters used for the EVDO link budget.
Table 8: CDMA 1x EVDO link budget parameters.
FREQUENCY 450 MHZ ORTHOGONALITY FACTOR 0 COMMON CHANNELS TIME 25% LINK LEVEL CURVES Step functions BANDWITH 1.25 MHz
3.3.2 Results
Figure 16 to Figure 19 show the throughput of EVDO systems in urban and rural areas. The first conclusion is that the cell ranges are huge, as the propagation is very good. However, the throughput near the base station is low compared to HSDPA and WiMAX as the peak data rate for EVDO is low (the bandwidth is equal to 1.25 MHz, to compare with the 5 MHz of HSDPA or WiMAX). Another point to take into account is the propagation delay for these large cells, making them unfeasible.
0
200
400
600
800
1000
1200
1400
1600
1800
0,05
0
2,37
9
4,70
9
7,03
8
9,36
8
11,6
97
14,0
26
16,3
56
18,6
85
21,0
15
23,3
44
25,6
73
28,0
03
Distance to the base station (Km)
Thro
ughp
ut (K
bits
/sec
Load=0%Load=50%Load=100%
EVDO URBAN OUTDOOR
Figure 16: EVDO throughput for outdoor CPE in urban areas.

DIGITAL WORLD FORUM - 2165133
D3.1 ANALYSIS OF THE BROADBAND AND INFRASTRUCTURE DOMAIN PAGE 21 OF 45
0
200
400
600
800
1000
1200
1400
1600
1800
0,050
0,878
1,707
2,535
3,364
4,192
5,021
5,849
6,678
7,506
8,334
9,163
9,991
Load=0%Load=50%Load=100%
EVDO URBAN INDOOR
Figure 17: EVDO throughput for indoor CPE in urban areas.
0
200
400
600
800
1000
1200
1400
1600
1800
0,050
14,33
5
28,62
0
42,90
5
57,18
9
71,47
4
85,75
9
100,0
44
114,3
29
128,6
14
142,8
99
157,1
84
171,4
68
Load=0%Load=50%Load=100%
RURAL OUTDOOR for EVDO
Figure 18: EVDO throughput for outdoor CPE in rural areas.

DIGITAL WORLD FORUM - 2165133
D3.1 ANALYSIS OF THE BROADBAND AND INFRASTRUCTURE DOMAIN PAGE 22 OF 45
0
200
400
600
800
1000
1200
1400
1600
1800
0,050
5,340
10,63
0
15,92
0
21,21
1
26,50
1
31,79
1
37,08
1
42,37
1
47,66
1
52,95
1
58,24
1
63,53
2
Load=0%Load=50%Load=100%
EVDO RURAL INDOOR
Figure 19: EVDO throughput for indoor CPE in rural areas.
The following table summarizes the maximal cell range for the different situations for EVDO.
Table 9: EVDO cell ranges.
Indoor CPE Outdoor CPE Urban 10 Km 29 Km rural 66 Km 178 Km

DIGITAL WORLD FORUM - 2165133
D3.1 ANALYSIS OF THE BROADBAND AND INFRASTRUCTURE DOMAIN PAGE 23 OF 45
4 CAPACITY EVALUATION
In order to compare the capacity of the different proposed systems, we need to construct functions that give, known the traffic offered to each system, the QoS indicators. To analyse the flow level capacity of a given network, i.e. the steady-state distribution of the number of users in the cell, we need to take into account the traffic characteristics in addition to the end-user throughput, obtained from link budget studies. Considering FTP-like elastic calls, where a mobile stays in the network while downloading a file of size Z Kbits, the download time will depend on the throughput, itself depending not only on the number of users, but also on the number of users having the different radio conditions. We will study all this in details in the following.
4.1 Cellular systems capacity analysis
4.1.1 HSDPA capacity analysis In HSDPA, resources are shared between users making one user having a proportion of the peak throughput available in its position. As we consider here elastic calls, a processor sharing model is adequate. However, the achieved throughput for the same emitted power decreases when the user moves towards the cell edge. We thus divide the cell into n zones, creating n classes of data calls that share the resources as in [3]. The values of throughput versus the cell distance are obtained using the link budget tool as shown in the previous section. The details of the processor sharing analysis are given in [4].
4.1.2 WiMAX capacity analysis methodology
Although WiMAX does not implement power control like 3G but it uses adaptive modulation and coding in order to adapt throughput to the conditions of propagation and interference. The result is that cell-edge users will use more resources than those at cell centre if they want to achieve the same throughput. We use the same division into rings and the analytical model developed in [5] and implemented in the link budget tool [6]. The capacity will be shared by non-guaranteed-bit rate data users in the n zones. The capacity values are obtained using the link budget. The link budget gives the throughput of one user if allocated all the resources, at the different positions of the cell. The processor sharing algorithm can be applied considering that the resources (subchannels) are shared equally among users.
4.1.3 CDMA 1x EV-DO hypothesis CDMA 1x EV-DO is an HSDPA like system and capacity (power) is shared among users. A processor sharing model is thus adequate, similar to HSDPA. The values of throughput versus the cell distance can be obtained by modifying the link budget tool for the 450 MHz carrier.
4.1.4 Load calculation methodology

DIGITAL WORLD FORUM - 2165133
D3.1 ANALYSIS OF THE BROADBAND AND INFRASTRUCTURE DOMAIN PAGE 24 OF 45
In cellular systems, inter-cell interference plays a major role and has a large impact on the capacity of the target cell. In HSDPA and CDMA 1x EV-DO, inter-cell interference decreases the peak throughput that can be achieved at each position of the cell. In WiMAX, it decreases the throughput of each subchannel and thus the required number of subchannels to achieve a given throughput increases. We propose, as in [3], an iterative algorithm to calculate the load in the interfering cells and use it in the target one:
1. Let the load of interfering cells be equal to an initial value of 0.5 for example. 2. Evaluate the required capacity in each zone using the given value of load in interfering
cells. 3. Evaluate the average load in the target cell, knowing the distribution of the number of
users calculated in stage 2. 4. Compare the calculated load to the initial load. If there is a significant difference, make
the load of interfering cells equal to the calculated load and repeat iterations 2-4 until convergence.
4.2 Case studies
In the following we will present three case studies and compare the capacity of the three above analysed systems (HSDPA, WiMAX and EV DO). We differentiate between urban and rural areas and consider the following parameters:
Table 10: Traffic parameters.
Urban Rural Population density (people/Km2) 1000 100
Penetration (%) Variable (0-20) Variable (0-20) Volume downloaded (Mbytes/day) 10 10 Traffic in busy hour (% of overall
traffic) 10 10
Target DL throughput (Kbps per user) 256 64 Maximal number of users by cell 25 25
As for the QoS, we consider a target blocking of 10% and a target percentile for the throughput of 50% (half of the users will have more than the target throughput at the busy hour). The first QoS measure (blocking) is related to the capacity of the network, and the second (throughput percentile) is a user-perceived QoS measure. Note: the limitation of the number of users in each cell is generally due to hardware limitations (number of channel elements or Iub capacity). In all cases, an admission control is necessary to avoid cell saturation. As there is generally a balance to find between blocking and user-perceived throughput, we consider jointly these two outputs. Note that the considered threshold (25 users) is large and is convenient to the best-effort kind of traffic we are dealing with. The result is that the throughput degradation comes, in most of the cases, before reaching the blocking target of 10%.
4.2.1 Constructing a coverage-limited network
When the aim of the operator is to minimize the number of deployed sites regardless from the capacity of the network, the dimensioning can be based on the above-described link budget analysis. Figure 20 to Figure 23 show the two QoS measures in this deployment for HSDPA and WiMAX. We do not show figures for CDMA 2000 1x EVDO as the capacity is too small.

DIGITAL WORLD FORUM - 2165133
D3.1 ANALYSIS OF THE BROADBAND AND INFRASTRUCTURE DOMAIN PAGE 25 OF 45
Figure 20: HSDPA QoS for coverage-limited cells in urban areas.
Figure 21: WiMAX QoS for coverage-limited cells in urban areas.
Figure 22: HSDPA QoS for coverage-limited cells in rural areas.

DIGITAL WORLD FORUM - 2165133
D3.1 ANALYSIS OF THE BROADBAND AND INFRASTRUCTURE DOMAIN PAGE 26 OF 45
Figure 23: WiMAX QoS for coverage-limited cells in rural areas. The following tables summarize the cell surface and the maximal capacity for the different situations for EVDO, HSDPA 900, HSDPA 2000, WiMAX 2600 and WiMAX 3500, for a target of 10% blocking and 50% throughput percentile.
Table 11: System capacity for coverage-limited cells
Indoor CPE Outdoor CPE 340 Km2/cell 2640 Km2/cell Urban 0.8 subscriber/ Km2 Urban 0.1 subscriber/Km2 13678 Km2/cell 99500 Km2/cell EV DO 450
Rural 0.024 subscriber/Km2 Rural 0.004 subscriber/Km2 58 Km2/cell 400 Km2/cell Urban 3.3 subscriber/ Km2 Urban 0.6 subscriber/Km2 1440 Km2/cell 9100 Km2/cell HSDPA 900
Rural 0.2 subscriber/Km2 Rural 0.04 subscriber/Km2 13.5 Km2/cell 93 Km2/cell Urban 12 subscriber/ Km2 Urban 2.15 subscriber/Km2 534 Km2/cell 3400 Km2/cell HSDPA 2000
Rural 0.5 subscriber/Km2 Rural 0.11 subscriber/Km2 10 Km2/cell 91 Km2/cell Urban 15 subscriber/ Km2 Urban 3.9 subscriber/Km2 32 Km2/cell 706 Km2/cell WiMAX 2600
Rural 5.3 subscriber/Km2 Rural 0.3 subscriber/Km2 4.5 Km2/cell 38 Km2/cell Urban 47.5 subscriber/ Km2 Urban 10 subscriber/Km2 15 Km2/cell 314 Km2/cell WiMAX 3500
Rural 15 subscriber/Km2 Rural 0.65 subscriber/Km2 It is obvious that the cell sizes obtained for EVDO, HSDPA, and even WiMAX 2600 are not realistic as the cells are huge and the supported capacity ridiculous. The conclusion is that the cells are coverage-limited only for WiMAX 3500 or when the density of subscribers is very low. A realistic dimensioning study, taking into account a target penetration for the proposed service, is proposed in the next section.
4.2.2 Reusing GSM sites for deploying the network

DIGITAL WORLD FORUM - 2165133
D3.1 ANALYSIS OF THE BROADBAND AND INFRASTRUCTURE DOMAIN PAGE 27 OF 45
In this section, we consider the case where the telecommunications operator has an already deployed GSM network and find the capacity of the deployed network for each technology. We consider an urban area with a cell range of 2 Km and use the link budget tools to calculate the achieved throughput versus the distance to the base station for the different technologies, using outdoor or indoor CPE. Figure 24 shows the throughput achieved for EVDO. In this case, we can see that the inter-cell interference is high at cell edge as the QoS is no more coverage-limited.
0
200
400
600
800
1000
1200
1400
1600
1800
0,050
0,205
0,360
0,515
0,670
0,825
0,980
1,135
1,290
1,445
1,600
1,755
1,910
Load=0%Load=50%Load=100%
EVDO URBAN INDOOR
Figure 24: EVDO throughput versus distance when reusing GSM sites.
We plot in Figure 25 to Figure 27 the QoS (blocking and probability of achieving the target throughput) for the three systems. The first observation is that using outdoor CPE is useless for systems like EVDO or HSDPA 900 as there is no much impact on the QoS (the cell is not coverage-limited). Second, HSDPA 900 has the best capacity as it offers a good coverage and a high throughput. The problem of EVDO is its smaller bandwidth (1.25 MHz) that makes it throughput-limited compared to HSDPA 900, but still it has better capacity than HSDPA 2000 and WiMAX as it has a good cell-edge throughput. Note: We did not draw the capacity for WiMAX 3500 as the cell is not fully covered in this case. The QoS target is thus never reached.
Figure 25: EVDO QoS when reusing GSM sites.

DIGITAL WORLD FORUM - 2165133
D3.1 ANALYSIS OF THE BROADBAND AND INFRASTRUCTURE DOMAIN PAGE 28 OF 45
Figure 26: HSDPA QoS when reusing GSM sites.
Figure 27: WiMAX QoS when reusing GSM sites.
The following table summarizes the maximal user capacity that can be served for each technology when reusing the GSM sites. The best capacity is when using HSDPA 900 with outdoor CPE. However, when using only indoor CPE, EVDO 450 is the best system, followed by HSDPA 900, far ahead from the other systems.
Table 12: Capacities of the different systems when reusing GSM sites.
System CPE type
Capacity (subscriber/Km2)
indoor 47.5 EVDO 450 outdoor 52 indoor 46 HSDPA 900 outdoor 66 indoor 13.5 HSDPA 2000 outdoor 61.5 indoor 7.5 WiMAX 2600 outdoor 37.5 indoor 0 WiMAX 3500 outdoor 37
DIGITAL WORLD FORUM - 2165133
D3.1 ANALYSIS OF THE BROADBAND AND INFRASTRUCTURE DOMAIN PAGE 29 OF 45
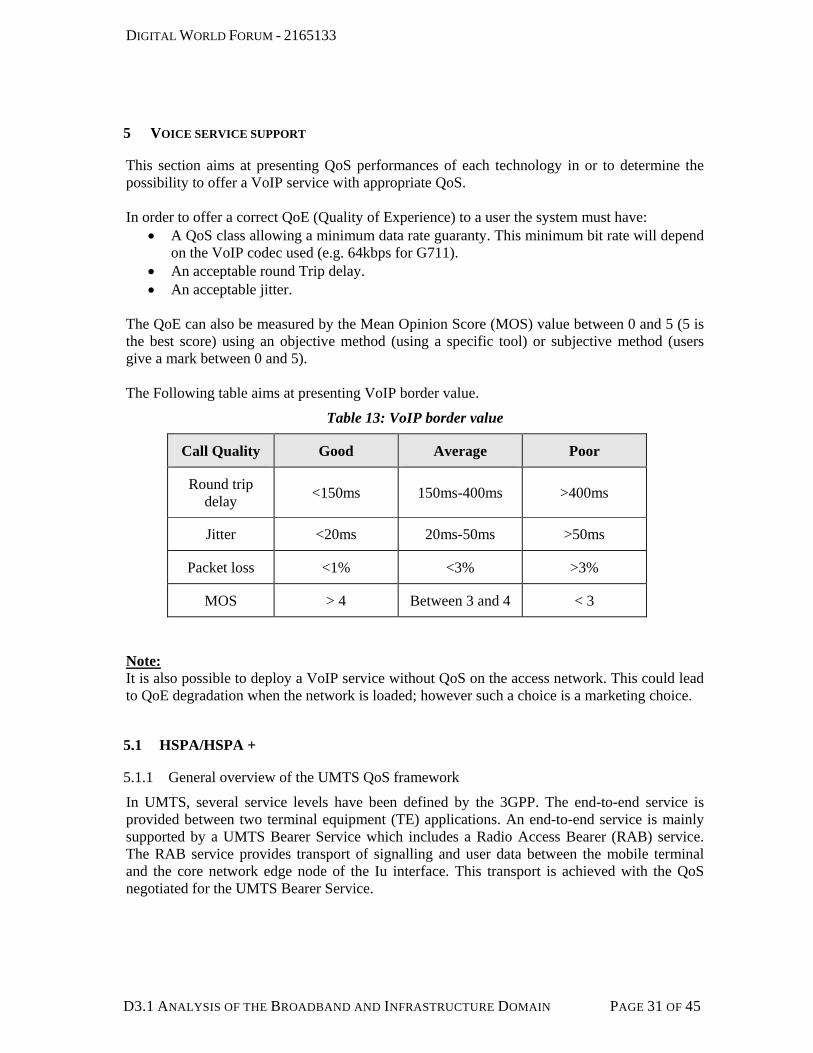
4.2.3 Dimensioning cells for a given traffic
In this section, we study the case where the telecommunications operator has a target penetration in some area and wants to deploy a network that gives a good QoS when this target penetration is attained, i.e. when the density of subscribers reaches a certain value. Another criterion to take is to minimize the number of cell sites in order to minimize costs. We take a target subscriber density of 50 subscriber/Km2 (corresponding to a 5% penetration in a urban area with 1000 person/Km2), and study the performance of the different systems for cells of radius 1, 2 and 3 kilometres, considering a deployment of indoor CPE only. We can observe first that the QoS is rapidly degraded when cells are larger, as the traffic increases. Second, EVDO and HSDPA 900 achieve the best performances (EVDO is slightly better for blocking while HSDPA 900 is better for the per user throughput). However, if the operator does not have the licences for deploying EVDO 450 or HSDPA 900 and has to deploy another system, this methodology can be used to find the optimal cell radius, i.e. the largest cell radius so that the QoS is acceptable. We recall that the methodology consists in using the link budget for calculating the throughput versus distance tables for the different cell radii, and then use the processor sharing analysis to assess the QoS.
Figure 28: Blocking rates for a given traffic for different cell ranges.

DIGITAL WORLD FORUM - 2165133
D3.1 ANALYSIS OF THE BROADBAND AND INFRASTRUCTURE DOMAIN PAGE 30 OF 45
Figure 29: Probability of reaching the target throughput for different cell ranges.
DIGITAL WORLD FORUM - 2165133
D3.1 ANALYSIS OF THE BROADBAND AND INFRASTRUCTURE DOMAIN PAGE 31 OF 45
5 VOICE SERVICE SUPPORT
This section aims at presenting QoS performances of each technology in or to determine the possibility to offer a VoIP service with appropriate QoS. In order to offer a correct QoE (Quality of Experience) to a user the system must have:
• A QoS class allowing a minimum data rate guaranty. This minimum bit rate will depend on the VoIP codec used (e.g. 64kbps for G711).
• An acceptable round Trip delay. • An acceptable jitter.
The QoE can also be measured by the Mean Opinion Score (MOS) value between 0 and 5 (5 is the best score) using an objective method (using a specific tool) or subjective method (users give a mark between 0 and 5). The Following table aims at presenting VoIP border value.
Table 13: VoIP border value
Call Quality Good Average Poor
Round trip delay <150ms 150ms-400ms >400ms
Jitter <20ms 20ms-50ms >50ms
Packet loss <1% <3% >3%
MOS > 4 Between 3 and 4 < 3
Note: It is also possible to deploy a VoIP service without QoS on the access network. This could lead to QoE degradation when the network is loaded; however such a choice is a marketing choice.
5.1 HSPA/HSPA +
5.1.1 General overview of the UMTS QoS framework
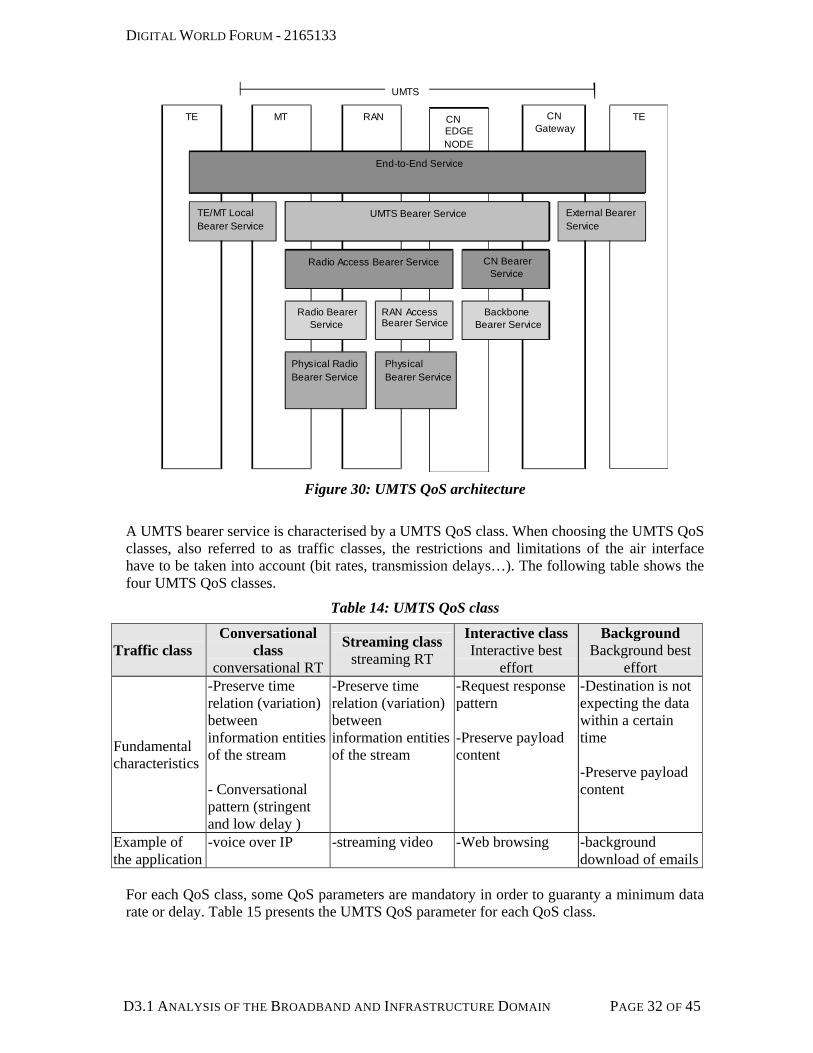
In UMTS, several service levels have been defined by the 3GPP. The end-to-end service is provided between two terminal equipment (TE) applications. An end-to-end service is mainly supported by a UMTS Bearer Service which includes a Radio Access Bearer (RAB) service. The RAB service provides transport of signalling and user data between the mobile terminal and the core network edge node of the Iu interface. This transport is achieved with the QoS negotiated for the UMTS Bearer Service.
DIGITAL WORLD FORUM - 2165133
D3.1 ANALYSIS OF THE BROADBAND AND INFRASTRUCTURE DOMAIN PAGE 32 OF 45
TE MT RAN CN EDGENODE
CNGateway
TE
UMTS
End-to-End Service
TE/MT Local Bearer Service
UMTS Bearer Service External Bearer Service
UMTS Bearer Service
Radio Access Bearer Service CN BearerService
BackboneBearer Service
RAN AccessBearer Service
Radio BearerService
Physical Radio Bearer Service
Physical Bearer Service
Figure 30: UMTS QoS architecture
A UMTS bearer service is characterised by a UMTS QoS class. When choosing the UMTS QoS classes, also referred to as traffic classes, the restrictions and limitations of the air interface have to be taken into account (bit rates, transmission delays…). The following table shows the four UMTS QoS classes.
Table 14: UMTS QoS class
Traffic class Conversational
class conversational RT
Streaming class streaming RT
Interactive class Interactive best
effort
Background Background best
effort
Fundamental characteristics
-Preserve time relation (variation) between information entities of the stream - Conversational pattern (stringent and low delay )
-Preserve time relation (variation) between information entities of the stream
-Request response pattern -Preserve payload content
-Destination is not expecting the data within a certain time -Preserve payload content
Example of the application
-voice over IP -streaming video -Web browsing -background download of emails
For each QoS class, some QoS parameters are mandatory in order to guaranty a minimum data rate or delay. Table 15 presents the UMTS QoS parameter for each QoS class.

DIGITAL WORLD FORUM - 2165133
D3.1 ANALYSIS OF THE BROADBAND AND INFRASTRUCTURE DOMAIN PAGE 33 OF 45
Table 15: UMTS typical QoS parameters
Traffic class Conversational class Streaming class Interactive class Background class
Maximum bitrate X X X X Residual bit error ratio X X X X
Transfer delay X X Guaranteed bit rate X X Traffic handling priority X
For more details relative to the UMST QoS framework please refer to [7]
5.1.2 VoIP over HSPA
HSPA does not introduce new QoS mechanisms compared to UMTS and the same QoS framework is used. However, some improvement on the radio link should provide a better experience for real time application. The major improvements are:
• The scheduler is located in the BS in order to provide a better response to traffic requirement and channel condition
• The data rate is increased. This should allow increasing VoIP capacity. • A new re transmission mechanism (Hybrid Automatic Repeat Request, HARQ) is
implemented in the Node B. This should allow reducing application delay by avoiding some retransmission in the RNC (by the Radio Link Control, RLC).
Some tests were performed by Orange Labs in lab in 2007. In 2007 HSPA implementation, lots of features needed to provide an efficient VoIP service are not available. Indeed, current vendor implementation does not support real time QoS class (conversational and streaming) and RLC Unacknowledgement Mode (UM) is not implemented (this could increase dramatically mouth to ear delay in case of bad radio condition) The main results of this study were:
• VoIP exhibits a good quality (MOS between 3.5 and 4), even in loaded condition, in good radio condition
• At the cell edge, the mouth to ear delay increase significantly. Indeed, UM RLC mode is not implemented and many retransmissions take place in the RNC.
However, all features needed to support an efficient commercial VoIP service (Conversational QoS class, Header compression …) will be implemented by vendor by Q3 2009. For more detail relative to the perceived quality over HSPA, see [14].
5.1.3 VoIP over HSPA+
HSPA+ is natively designed to support real time application such as VoIP. Indeed, in HSPA+, the RNC Packet Switch functionalities are implemented in the Node B. In other words, all retransmission mechanisms (at the MAC and at the RLC level) are implemented in the Node B. This should highly reduce packet retransmission time and avoid having a too high mouth to ear delay even in bad radio condition (as described in HSPA section).
DIGITAL WORLD FORUM - 2165133
D3.1 ANALYSIS OF THE BROADBAND AND INFRASTRUCTURE DOMAIN PAGE 34 OF 45
5.2 EDGE/EDGE evolved
5.2.1 VoIP over Edge
EDGE allows data rates on shared resources permitting to provide a throughput of up to 200 kbps per user. But, EDGE, in its current deployed version, is designed for the support of Background and Interactive services needing a significant throughput but not requiring stringent constraints in term of delay as real time IP based services. For example, as HSDPA, currently it does not ensure a guaranteed bit rate. However, a function called Packet Flow Control (PFC) is implemented by some vendors. This function provides QoS classification of flows in the BSS according to the traffic type in order to provide QoS on the air link. In other words, this function could guaranty data rate and delay on the air link if conversational QoS class is supported by the access network. For more detail on the PFC function, see [15].
5.2.2 VoIP over Evolved Edge
No information available for now.
5.3 CDMA 2000
1xEV-DO release 0 does not provide QoS mechanisms by itself. However, by software upgrading, inter user differentiation can be performed (but not inter application) To fill in the QoS gap of 1xEV-DO, Rev A has adopted a flow-oriented QoS architecture that allows the network to provide differentiated treatment to separate application flows, even when the applications are associated with the same device. To deliver such differentiated treatment, EV-DO Rev A utilizes higher layer protocols between the network and the handset to set up and configure these flows based on the needs of the applications. By doing so, Rev A can handle separate flow types with differentiated levels of service, across the network. This allows Rev A to assure the delivery of critical delay-sensitive traffic flows like VoIP even in the presence of loaded best effort traffic. No tests were performed on CDMA 2000 network for VoIP service. However, according to vendors, there is no problem to support such a service when using Rev A (in term of delay and data rate guaranty). These values can be trusted since measurement performed during trial [16] for BE service shows a delay of about 125 ms.
5.4 WiMAX
5.4.1 General WiMAX QoS concept
The central concept of the WiMAX QoS model is the notion of Service Flow. A service flow is a MAC transport service that provides unidirectional transport of packets either to uplink packets transmitted by the MS or to downlink packets transmitted by the BS. MS and BS provide QoS according to the QoS Parameter Set (such as latency, jitter, and throughput assurances) defined for the considered service flow. Five QoS classes are available in WiMAX; the following table describes these QoS classes:
Table 16: WiMAX typical QoS parameter
QoS class Typical application Typical QoS parameters UGS VoIP - Maximum Sustained Traffic
DIGITAL WORLD FORUM - 2165133
D3.1 ANALYSIS OF THE BROADBAND AND INFRASTRUCTURE DOMAIN PAGE 35 OF 45
Unsolicited Grant Service Rate - Maximum Latency - Tolerated Jitter
rtPS Real-Time Polling Service
Video streaming Audio streaming
- Minimum Reserved Traffic Rate- Maximum Sustained Traffic Rate - Maximum Latency
ertPS extended real-time PollingService
VoIP with silence suppression Gaming
- Minimum Reserved Traffic Rate- Maximum Sustained Traffic Rate - Maximum Latency - Tolerated Jitter
nrtPS non-real time Polling Service
FTP Data base
- Minimum Reserved Traffic Rate- Maximum Sustained Traffic Rate
BE Best Effort
Peer to Peer Web browsing
- Maximum Sustained Traffic Rate
For VoIP service, UGS or ertPS QoS can be used. Indeed, these QoS classes are designed for VoIP services (data rate, Delay and Jitter guaranty).
5.4.2 VoIP over WiMAX
As described in previous section, WiMAX is natively designed to support real time application such as VoIP. Regarding delay and Jitter, Field test performed by Orange Labs gives the following results:
• Delay for VoIP QoS class: ~ 84 ms (one way delay) • Jitter for VoIP QoS class: ~17ms (using UGS QoS class)
For more detail relative to field test, please refer to [8] Also, MOS measurements were performed on an e-ready system (software upgradable to 16e, same QoS mechanism than 16e) using Orange operational network mirror platform. The MOS obtained were superior to 4. For more detail relative to these End to End VoIP tests, see [17].
5.5 WiFi mesh
No information available for now.
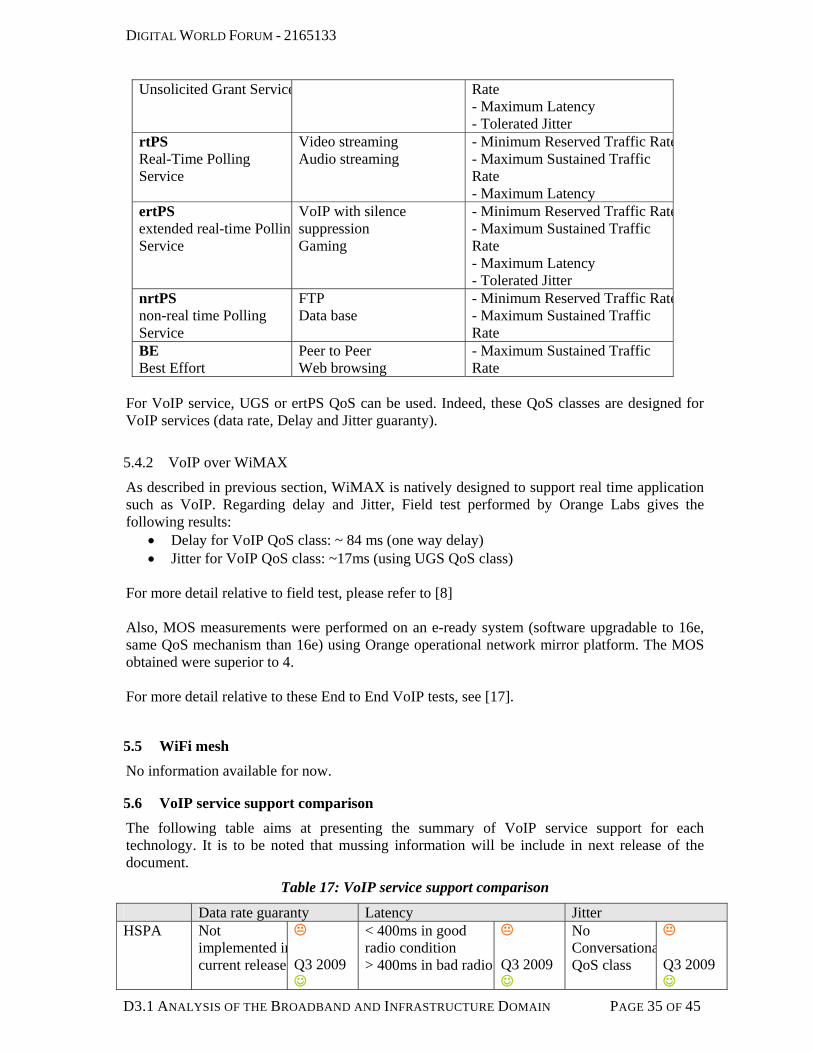
5.6 VoIP service support comparison
The following table aims at presenting the summary of VoIP service support for each technology. It is to be noted that mussing information will be include in next release of the document.
Table 17: VoIP service support comparison
Data rate guaranty Latency Jitter HSPA Not
implemented incurrent release
Q3 2009 ☺
< 400ms in good radio condition > 400ms in bad radio
Q3 2009 ☺
No ConversationaQoS class
Q3 2009 ☺

DIGITAL WORLD FORUM - 2165133
D3.1 ANALYSIS OF THE BROADBAND AND INFRASTRUCTURE DOMAIN PAGE 36 OF 45
condition
HSPA+ Should be implemented
☺ Should be good ☺ Should be good
☺
EDGE
Mechanism exists but not tested.
Unacknowledgment mode not implemented
No test performed for conversationalQoS class
EDGE Evolved
Should be better than Edge
No data Should be better than Edge
No data Should be better than Edge
No data
CDMA 2000
Rev A is designed for VoIP service
☺ ~ 125 ms ☺ No value ?
WiMAX Yes ☺ ~ 84 ms ☺ ~17ms ☺
WiFI
No informationavailable for now.
No information available for now.
No information available for now.
For HSPA+, WiMAX and CDMA 2000 Rev A, QoS mechanisms and radio performances will allow to deploy a VoIP service offering a high quality call. However for HSPA+, since no product will be available before 2009, VoIP quality should be assessed when available. For HSPA, 2008 product does not implement all features needed to deploy a VoIP service with QoS. For 2009-2010 timeframe all function needed will be implemented (in Q3 2009) by vendors and so VoIP service should be available for HSPA. For Edge, it will be not possible to offer a VoIP service since mouth to ear delay is too high in bad radio condition. No information are available at present for WiFi mesh and Edge Evolved.
DIGITAL WORLD FORUM - 2165133
D3.1 ANALYSIS OF THE BROADBAND AND INFRASTRUCTURE DOMAIN PAGE 37 OF 45
6 SYSTEM ARCHITECTURE OVERVIEW
This sections aims at presenting a high level overview of the network architecture for each technology. A brief description of each network element and the list of the minimum equipment needed to deploy a broadband network are given.
6.1 EDGE/EDGE evolved
6.1.1 EDGE architecture
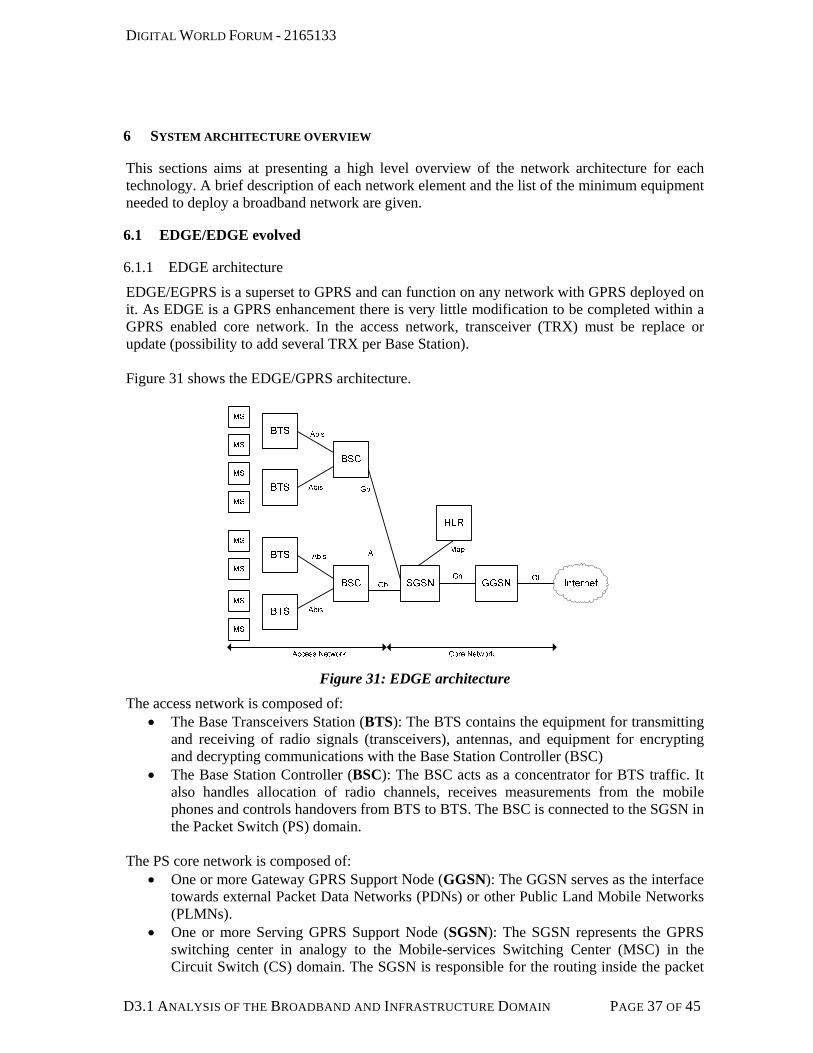
EDGE/EGPRS is a superset to GPRS and can function on any network with GPRS deployed on it. As EDGE is a GPRS enhancement there is very little modification to be completed within a GPRS enabled core network. In the access network, transceiver (TRX) must be replace or update (possibility to add several TRX per Base Station). Figure 31 shows the EDGE/GPRS architecture.
Figure 31: EDGE architecture
The access network is composed of: • The Base Transceivers Station (BTS): The BTS contains the equipment for transmitting
and receiving of radio signals (transceivers), antennas, and equipment for encrypting and decrypting communications with the Base Station Controller (BSC)
• The Base Station Controller (BSC): The BSC acts as a concentrator for BTS traffic. It also handles allocation of radio channels, receives measurements from the mobile phones and controls handovers from BTS to BTS. The BSC is connected to the SGSN in the Packet Switch (PS) domain.
The PS core network is composed of:
• One or more Gateway GPRS Support Node (GGSN): The GGSN serves as the interface towards external Packet Data Networks (PDNs) or other Public Land Mobile Networks (PLMNs).
• One or more Serving GPRS Support Node (SGSN): The SGSN represents the GPRS switching center in analogy to the Mobile-services Switching Center (MSC) in the Circuit Switch (CS) domain. The SGSN is responsible for the routing inside the packet

DIGITAL WORLD FORUM - 2165133
D3.1 ANALYSIS OF THE BROADBAND AND INFRASTRUCTURE DOMAIN PAGE 38 OF 45
radio network and for mobility and resource management. Furthermore, it provides authentication and encryption for the GPRS subscribers.
• Home Location Register (HLR): The HLR is a central database that contains details of each subscriber that is authorized to use the GSM core network. There is one logical HLR per PLMN (Public Land Mobile Network), although there may be multiple physical platforms.
The transport layer on the access network part can be ATM based. Evolution toward IP based transport is planned. Mandatory equipment to deploy an EDGE network: MS, BTS, BSC, SGSN, GGSN and HLR
6.1.2 EDGE Evolved architecture
No information available for now.
6.2 HSPA/HSPA +
6.2.1 HSPA architecture
HSPA is an evolution of the Packet switch domain of the UMTS (of the UTRAN) and improve radio performances of the radio link (UL and DL). Figure 32 shows the HSPA Packet Switch domain architecture.
Node B
RNC
RNC
HLR
SGSN GGSN
UE
UE
UE
UE
UE
UE
UE
UE
Internet
Iub
Gn Gi
Access Network Core Network
Node B
Node B
Node B
Iu PS
Iu PS
Iur
Iub
Iub
Iub
Figure 32: HSPA architecture
The access network is composed of: • Radio Network Controller (RNC): The RNC is responsible of the control of the Node
Bs in the access network (UTRAN). The RNC carries out radio resource management, some of the mobility management functions and is the point where encryption is done before user data is sent to and from the mobile. The RNC connects to the SGSN in the Packet Switched Core Network.
• Node B: Node B contains radio frequency transmitter(s) and the receiver(s) used to communicate directly with the mobiles. Additionally in HSPA, some function (like packet retransmission) implemented in the RNC for UMTS are now implemented in the Node B in order to improve user experience and data rates.

DIGITAL WORLD FORUM - 2165133
D3.1 ANALYSIS OF THE BROADBAND AND INFRASTRUCTURE DOMAIN PAGE 39 OF 45
• User Equipment (UE): The UE is the HSPA device. The PS core network is the same as the GPRS core network (with enhanced capacity). The transport layer on the access network part can be ATM based or IP based. Mandatory equipment to deploy a HSPA network: UE, Node B, RNC, SGSN, GGSN and HLR
6.2.2 HSPA+
The HSPA+ architecture is an evolution of the HSPA architecture. This architecture is usually called 'flat' architecture since all the RNC functionalities (relative to the PS domain) are moved to the HSPA+ Node B (by software upgrade of the PS part) which is now directly connected to the SGSN. Figure 33 shows the HSPA+ architecture.
Figure 33: HSPA+ architecture
The HLR, SGSN and GGSN have the same function as in the HSPA world. The main differences between HSPA and HSPA+ PS core domain is that the capacity of HSPA+ equipment has to be higher (or more equipments have to be deployed). The transport layer on the access network is IP based. Mandatory equipment to deploy a HSPA+ network: UE, Node B, SGSN, GGSN and HLR For more detail relative to the HSPA+ architecture refers to [11].
6.3 CDMA 2000
As for UMTS network, there are also CS domain and PS domain. Figure 34 shows a high level overview of the PS CDMA network architecture.
DIGITAL WORLD FORUM - 2165133
D3.1 ANALYSIS OF THE BROADBAND AND INFRASTRUCTURE DOMAIN PAGE 40 OF 45
BTS
BTS
BSC
BTS
BTS
BSC
HLR
PDSN
MS
MS
MS
MS
MS
MS
MS
MS
Internet
Abis
Abis
A8/A9
Access Network Core Network
Abis
Abis
A8/A9
AAA
HA
MSC
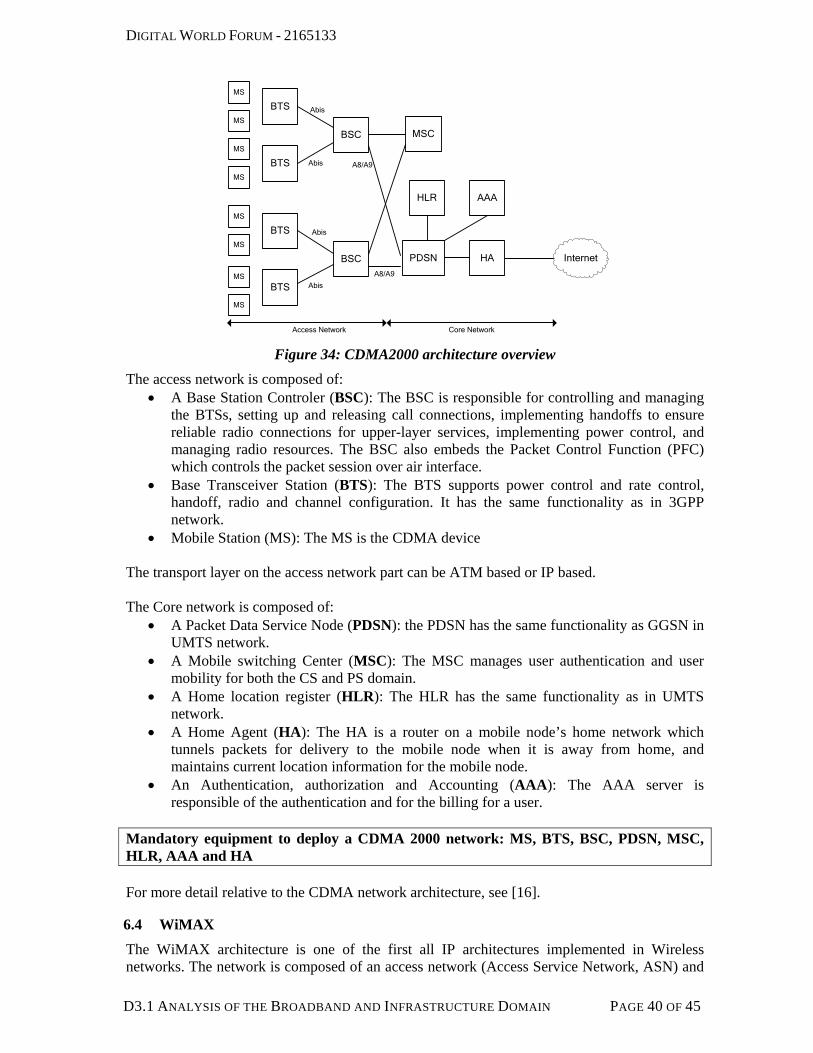
Figure 34: CDMA2000 architecture overview
The access network is composed of: • A Base Station Controler (BSC): The BSC is responsible for controlling and managing
the BTSs, setting up and releasing call connections, implementing handoffs to ensure reliable radio connections for upper-layer services, implementing power control, and managing radio resources. The BSC also embeds the Packet Control Function (PFC) which controls the packet session over air interface.
• Base Transceiver Station (BTS): The BTS supports power control and rate control, handoff, radio and channel configuration. It has the same functionality as in 3GPP network.
• Mobile Station (MS): The MS is the CDMA device The transport layer on the access network part can be ATM based or IP based. The Core network is composed of:
• A Packet Data Service Node (PDSN): the PDSN has the same functionality as GGSN in UMTS network.
• A Mobile switching Center (MSC): The MSC manages user authentication and user mobility for both the CS and PS domain.
• A Home location register (HLR): The HLR has the same functionality as in UMTS network.
• A Home Agent (HA): The HA is a router on a mobile node’s home network which tunnels packets for delivery to the mobile node when it is away from home, and maintains current location information for the mobile node.
• An Authentication, authorization and Accounting (AAA): The AAA server is responsible of the authentication and for the billing for a user.
Mandatory equipment to deploy a CDMA 2000 network: MS, BTS, BSC, PDSN, MSC, HLR, AAA and HA For more detail relative to the CDMA network architecture, see [16].
6.4 WiMAX
The WiMAX architecture is one of the first all IP architectures implemented in Wireless networks. The network is composed of an access network (Access Service Network, ASN) and
DIGITAL WORLD FORUM - 2165133
D3.1 ANALYSIS OF THE BROADBAND AND INFRASTRUCTURE DOMAIN PAGE 41 OF 45
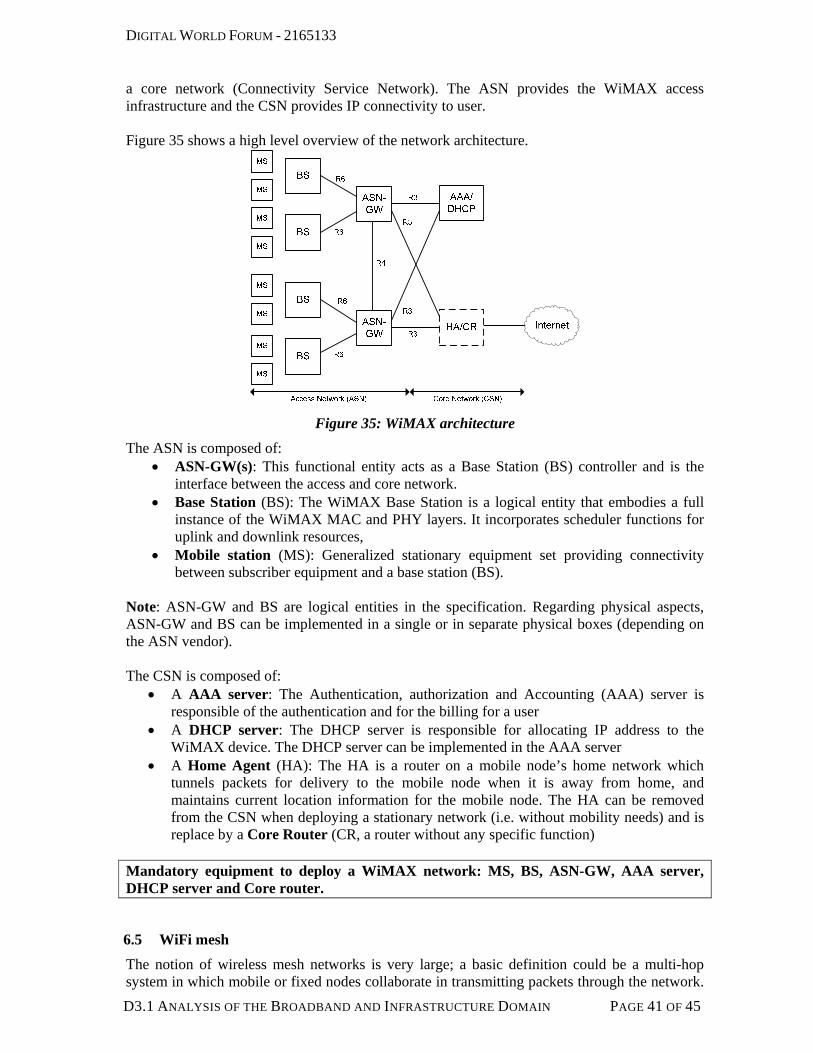
a core network (Connectivity Service Network). The ASN provides the WiMAX access infrastructure and the CSN provides IP connectivity to user. Figure 35 shows a high level overview of the network architecture.
Figure 35: WiMAX architecture
The ASN is composed of: • ASN-GW(s): This functional entity acts as a Base Station (BS) controller and is the
interface between the access and core network. • Base Station (BS): The WiMAX Base Station is a logical entity that embodies a full
instance of the WiMAX MAC and PHY layers. It incorporates scheduler functions for uplink and downlink resources,
• Mobile station (MS): Generalized stationary equipment set providing connectivity between subscriber equipment and a base station (BS).
Note: ASN-GW and BS are logical entities in the specification. Regarding physical aspects, ASN-GW and BS can be implemented in a single or in separate physical boxes (depending on the ASN vendor). The CSN is composed of:
• A AAA server: The Authentication, authorization and Accounting (AAA) server is responsible of the authentication and for the billing for a user
• A DHCP server: The DHCP server is responsible for allocating IP address to the WiMAX device. The DHCP server can be implemented in the AAA server
• A Home Agent (HA): The HA is a router on a mobile node’s home network which tunnels packets for delivery to the mobile node when it is away from home, and maintains current location information for the mobile node. The HA can be removed from the CSN when deploying a stationary network (i.e. without mobility needs) and is replace by a Core Router (CR, a router without any specific function)
Mandatory equipment to deploy a WiMAX network: MS, BS, ASN-GW, AAA server, DHCP server and Core router.
6.5 WiFi mesh
The notion of wireless mesh networks is very large; a basic definition could be a multi-hop system in which mobile or fixed nodes collaborate in transmitting packets through the network.

DIGITAL WORLD FORUM - 2165133
D3.1 ANALYSIS OF THE BROADBAND AND INFRASTRUCTURE DOMAIN PAGE 42 OF 45
Nodes send and receive users' data but also relay the traffic of neighbours toward destination that could be for example the gateway or any other node of the network. Each node regularly updates all its neighbouring radio link states, and then allows the mesh network to offer multiple redundant communications paths throughout the network. Figure 36 shows a high level overview of the WiFi mesh architecture. Note: The standardization of the WiFi mesh is not finished and different kinds of architectures are proposed by WiFi mesh vendors.
Figure 36: WiFi mesh architecture overview
The Access network is composed of:
• WiFi device: The client terminal which embeds a WiFi client • Access point (AP): Each AP has 2 main functions. The access function in order to
provide WiFi connectivity to user and a backhaul function in order to forward user's data, through the relaying process using dynamic multi-hop technologies.
• Access Point GateWay (AP-GW, depend on vendor implementation): Specific AP which provides connections between WiFi mesh network and the transport network. This node can also perform user authentication.
For more detail relative to the WiFi mesh architecture, please refer to [12]. Mandatory equipment to deploy a WiFi mesh network: WiFi device, mesh AP and AP-GW Note: WiFi mesh standardisation is in progress. When completed, the architecture will be defined and proprietary solutions will disappear.
6.6 Architecture comparison
In the previous sections, a high level overview of each network architecture was presented. For 3GPP/3GPP2 system (EDGE, HSPA, CDMA 2000), Packet Switch architecture is very similar with an access network composed of Base Stations and Base Station Controllers and a core network composed of a GGSN, SGSN and HLR (MSC and PDSN for CDMA 2000). The migration from GPRS to Edge or from EDGE to HSPA (or from CDMA 2000 EVDO Rev 0 to
DIGITAL WORLD FORUM - 2165133
D3.1 ANALYSIS OF THE BROADBAND AND INFRASTRUCTURE DOMAIN PAGE 43 OF 45
Rev A) does not need an hardware upgrade of the PS core network if PS core network capacity still sufficient after migration (since data rate in the access network will increase). WiMAX provides a very simple all IP architecture with few elements in the core network (only a AAA server with embedded DHCP function) reducing needed OPEX and CAPEX. It has to be noted that architecture evolution is toward reducing the number of nodes in the network (e.g. RNC in Node B for HSPA+) For WiFi mesh, the architecture is also very simple but standardization process is not finished and many proprietary solutions are implemented.

DIGITAL WORLD FORUM - 2165133
D3.1 ANALYSIS OF THE BROADBAND AND INFRASTRUCTURE DOMAIN PAGE 44 OF 45
7 CONCLUSION
In this deliverable, we presented a comparative study of the coverage, capacity and architecture of the candidate systems for offering a wireless internet service in emerging countries. We focused on CDMA 2000 1x EV DO, HSDPA and WiMAX. The main conclusions are as follows:
• The coverage is extremely related to the frequency, making cells in 1x EVDO very large.
• Using an outdoor CPE is useful only for far isolated users or when the frequency is very high (e.g. WiMAX 3500).
• When reusing existing sites, 1x EV DO and HSDPA 900 support large capacities. • For a target traffic intensity, an optimal cell range can be found for each technology that
minimizes the costs while guaranteeing the target QoS. • 3GPP/3GPP2 systems (EDGE, HSPA, CDMA 2000) have the same network PS
architecture. The core network can thus be reused when upgrading between these systems.
• WiMAX has the simplest all IP architecture, while the WiFi Mesh all IP architecture is still in standardization.
• All systems, except EDGE, support (or will support) voice over IP with a good QoS. In a future version of this work, we will analyse the capacity of EDGE and WiFi and the capacity of voice over IP in the different systems.
DIGITAL WORLD FORUM - 2165133
D3.1 ANALYSIS OF THE BROADBAND AND INFRASTRUCTURE DOMAIN PAGE 45 OF 45
8 REFERENCES
[1] O. Akhdari and J.-B. Landre, "HSDPA Link Budget Methodology, [Orange Labs internal document].
[2] L. XUAN and G. YANG, " CDMA450 Analysis and Deployment Study", [Orange Labs internal document].
[3] A. Baroudy and S. El Ayoubi, "HSUPA/HSDPA Systems: Capacity and Dimensioning", Future Generation Communication and Networking, Volume 1, 6-8 Dec. 2007 Page(s):130 – 135
[4] T. Bonald and A. Proutière, "Wireless downlink data channels: user capacity and cell performance", ACM Mobicom 2003.
[5] S. El Ayoubi, O. Ben Haddada and B. Fourestié, "Performance Evaluation of Frequency Planning Schemes in OFDMA-Based Networks", IEEE transactions on wireless communications. May 2008.
[6] M. Francisco, S. EL Ayoubi and O. Ben Haddada, "LTE Link Budget V1", [Orange Labs internal document].
[7] 3GPP, " Quality of Service (QoS) concept and architecture", 3GPP TS 23.107 V7.1.0, 2007
[8] TP R&D, "Field Tests Report, Samsung Mobile Wimax System", [Orange Labs internal document].
[9] B. Leonard, D. Chapon, J. Bournelle, "Analysis of WiMAX NWG architecture v2", [Orange Labs internal document]
[10] A. Mouquet, N. Mach, "Analysis of the evolution of WiMAX architecture", [Orange Labs internal document]
[11] Marcin BORTNIK, " HSPA+ Flat architecture ", [Orange Labs internal document] [12] Benoit Le Sage, Julien Riera, Luis Escobar, Yann Rochefort, " Wifi meshed networks",
[Orange Labs internal document] [13] G. Bianchi, “Performance analysis of the IEEE 802.11 Distributed Coordination
Function”, IEEE JSAC 18-3 (2000). [14] S. Daniaud, G. Casas, B. Badard, J. Tartière, P. Zimmermann, L. Gros, V.Barriac,
"Percieved quality of VoIP over Orange France HSDPA/HSUPA network", [Orange Labs internal document]
[15] Nortel, " BSS Packet Flow Context", PE/SYS/DD/11869, 2005 [16] G. YANG, G. DECARREAU, " Field Investigation Report for CDMA450 in Mongolia",
[Orange Labs internal document] [17] S. Bougeard, "Validation tests of the 2.5 GHz 16e-Ready WiMAX equipments in a End-
to-End network architecture", [Orange Labs internal document]