digital test - the gibson test
TRANSCRIPT

Gibson Test of Cognitive Skills – Version 2
Digital Test
TECHNICAL MANUAL
2
Amy Lawson Moore, PhD Terissa Miller, MS

Technical Manual Gibson Test of Cognitive Skills
Version 2
©2016 by Gibson Institute of Cognitive Research
5085 List Drive, Suite 220 Colorado Springs, CO 80919
719.219.0940 www.gibsonresearchinstitute.org
Acknowledgements
The development of the Gibson Test of Cognitive Skills (V2) was made possible by the
collaboration of researchers, clinicians, schools, training centers, and students in 45 states.
Special thanks are extended to Dr. Oliver Hill at Virginia State University, Dabney Jarrett at
LearningRx, JaDean Stricker at Jubilee Christian Academy, and Gary Smith at CogRead for their
field testing and data collection efforts.

Background
Nature of the Test
History of the Test
Theoretical Foundation of the Test
Uniqueness of the Test
Uses of the Test
Test Content and Administration
Content of the Test
Administering the Test
System Requirements
User Qualifications
Test Development and Validation
Normative Information
Sources of Validity Evidence
Sources of Reliability Evidence
Test Fairness
Scaling and Scores
Summary and References
TABLE OF CONTENTS

BACKGROUND Nature of the Test
The Gibson Test of Cognitive Skills (Version 2) is a
computer-based screening tool that informs clinicians,
teachers, and parents about performance on tasks that
measure 1) short-term memory, 2) long-term memory,
3) processing speed, 4) auditory processing, 5) visual
processing, 6) logic and reasoning, and 7) word attack
skills. The 45- minute assessment includes nine
different mental tasks organized like puzzles and
games on a computer. The tasks provide a snapshot of
five primary cognitive skills, as well as auditory
processing and word attack skills that serve as the
foundation for reading.
___________________________________
History of the Test
The first iteration of the Gibson Test of Cognitive
Skills (GT) was developed in 2002 by pediatric
behavioral optometrist Dr. Ken Gibson as a screening
assessment for his clinician-delivered cognitive
training program. To establish a baseline of cognitive
skill functioning in his patients, Gibson used multiple
different commercial tests. Desiring a single tool that
could provide multiple measures, he designed the
Gibson Cognitive Test Battery. In 2006, he created a
digital version of the test, called the Gibson Test of
Cognitive Skills. After recognizing the need for a
longer test to increase the reliability of cognitive
construct measurement and to address the need for a
measure of long-term memory, his research team
initiated the current revision in 2013.
Theoretical Foundation
The test framework for The Gibson Test of Cognitive
Skills (GT) was guided by the Cattell-Horn-Carroll
(CHC) model of intelligence, and the measurement of
seven broad CHC factors (see Schneider & McGrew,
2013): fluid reasoning (Gf), short-term memory (Gsm),
long-term storage and retrieval (Glr), processing speed
(Gs), visual processing (Gv), auditory processing (Ga),
and an optional measure of reading and writing (Grw).
The ever-evolving CHC model of intelligence serves as
the basis of Gibson’s Learning Model, a graphical
depiction of how we think and learn. (See Figure 1.)
Figure 1. Gibson’s Learning Model
The Learning Model is independently recognized as an
influential guide in the development of auditory and
visual processing interventions (Press, 2012), and has
been featured in our own recent peer-reviewed
cognition research studies (Gibson, Carpenter, Moore,
& Mitchell, 2015; Carpenter, Ledbetter, & Moore,
2016). As demonstrated in Figure 1, there is
substantial overlap between the two models of learning
and cognition which is supported in the concurrent
validation study outlined later in this manual comparing
the Gibson Test to another CHC-based assessment.

Uniqueness of the Test Given the number of digital tests saturating the market, it is important to highlight some critical differences between
the Gibson Test and other commercially-available web-based cognitive assessments. First, as of this publication,
the Gibson Test is currently the only web-based cognitive assessment that measures auditory processing and Word
Attack skills. Auditory processing and reading are key components of the CHC model of intelligence and serve as
the foundation for reading ability. This cross-battery approach to cognitive testing distinguishes the Gibson Test
from other digital cognitive assessments. Table 1 illustrates primary construct measurement differences among
popular digital cognitive tests.
Table 1. Comparison of Gibson Test and Other Digital Cognitive Tests
Test
Shor
t-Ter
m
Mem
ory
Long
-ter
m
Mem
ory
Visu
al
Proc
essin
g
Proc
essin
g Sp
eed
Logi
c &
Re
ason
ing
Audi
tory
Pr
oces
sing
Wor
d At
tack
N
orm
Gro
up
Size
Nor
m G
roup
Ag
es
Gibson Test X X X X X X X 2,737 5-85
NeuroTrax X X X X X 1,569 8-120 MicroCog X X X X 810 18-89 ImPACT X X 931 13-24
CNS Vital Signs X X X X 1,069 7-90 CANS-MCI X X 310 51-93
ANAM X X X X X 107,801 17-65 CANTAB X X X X 2,000 4-90
Another unique quality of the Gibson Test is the availability in 19 languages. The test has been translated in 19
languages including English, Spanish (Mexico), Spanish (Spain), Mandarin, Cantonese, Turkish, Portuguese,
Indonesian, Hindi, Malay, Arabic, Hungarian, Vietnamese, Lithuanian, Polish, Russian, Filipino, Taiwanese, and
French. The test is language and culturally-neutral, so instructions and prompts were seamlessly translated to avail
the test to worldwide users. Third, the GT can be administered by teachers and allied professionals with minimal
training. The comprehensive reports are automatically generated to reduce the possibility of misinterpretation of
results. Finally, the Gibson Test was designed for use across the lifespan. The norming group included ages 5-85
and the psychometric properties of the test are strong in every age group.
Uses of the Gibson Test
The Gibson Test is a screening tool and not yet validated for diagnostic use. However, test users can confidently
use the test to:
• Evaluate the effect of cognitive training or an educational intervention • Establish current skill levels across multiple cognitive constructs • Conduct research • Monitor progress or decline in cognitive skill levels over time

TEST CONTENT Long-Term Memory Test The long-term memory test measures meaningful memory under the CHC broad cognitive construct of long-term storage and retrieval (Glr). Meaningful memory is the ability to recall items that are related or comprise a story. The test is given in two parts. First, test takers are introduced to a series of visual images and short auditory scenarios. Then, they respond to questions about what they saw and heard. The questions follow an n-back pattern. At the end of the full testing session, test takers revisit the same questions but without the visual and auditory prompts. The test is scored for accuracy and for consistency between answers during the prompted task and the non-prompted task. There are 24 questions on this test for a total of 48 possible points. An example of a visual prompt is below. Test-takers will later need to recall the type of dog shown in the scene.
Example of an item on the Long-Term Memory Test
Visual Processing Test The test for visual processing requires the test-taker to identify individual shapes that match sections of completed puzzles. The test measures visualization under the broad CHC construct of visual processing (Gv). Visualization is the ability to mentally manipulate objects. The test is comprised of 14 completed puzzles and a total of 92 individual pieces, for a possible total of 92 points. An example of a visual processing test item is shown below.
Example of an item on the Visual Processing Test

Auditory Processing Tests There are three 15-item subtests that comprise the Auditory Processing portion of the Gibson Test battery: Blending, Segmenting, and Dropping. The subtest scores are combined to form a composite AP score.
Auditory Blending The Blending test measures phonetic coding-synthesis under the broad CHC construct of auditory processing. Synthesis is the ability to merge or blend smaller units of speech into a larger one. For this test, the examinee listens to the individual sounds in a nonsense word and then must mentally blend the sounds to identify the completed word. There are 15 questions on this subtest for a total of 15 points. An example is shown below.
Example of an item on the Auditory Blending Test
The narrator says, “/n/ - /e/ - /f/”. The examinee then sees and selects from the following choices:
_____________________________________________________________________________________________________
Auditory Segmenting The Segmenting test measures phonetic coding-analysis under the broad CHC construct of auditory processing. Analysis is the ability to segment larger units of speech into smaller ones. For this test, the examinee listens to a complete nonsense word and then must mentally separate the individual sounds. The narrator then says the individual sounds, and the examinee must identify any incorrect sounds or indicate that all the sounds are correct. There are 15 questions on this subtest for a total of 15 points. An example is shown below.
Example of an item on the Auditory Segmenting Test
Auditory Dropping The Dropping test measures sound awareness under the broad CHC construct of auditory processing. For this test, the examinee listens to a complete nonsense word and is told to delete part of the word to form a new word. The examinee must mentally drop the sounds and identify the new word. The narrator reads four choices and the examinee selects the correct one. There are 15 questions on this subtest for a total of 15 points. An example is shown below.
Example of an item on the Auditory Dropping Test
The narrator says, say “zish” without the “/z/”. The examinee then hears and selects from the following choices: “ist”, “ish”, “is”, “zis”. Because the correct answer is the second one, the examinee should select the second dot.
The narrator says “uck”, then says, “/u/ - /m/”.
The test-taker then sees and selects the position of the incorrect sound. Because the second sound was incorrect, the examinee should select the second dot.

Logic and Reasoning Test The Logic and Reasoning test measures inductive reasoning, or induction, which is the ability to infer underlying rules from a given problem. This ability falls under the broad CHC construct of fluid reasoning (Gf). The test uses a matrix reasoning task where the examinee is given an array of images from which to determine the rule that dictates the missing image. The examinee then selects the correct image from a choice of five possible options. There are 29 matrices for a possible total of 29 points. An example is shown below.
Example of an item on the Logic and Reasoning Test
Short-Term Memory Test The Short-Term Memory test measures visual memory span, or the ability to hold encoded information in memory and immediately reproduce it as presented. This skill falls under the broad CHC cognitive construct of Short-Term Memory (Gsm). For the test, the examinee is shown a pattern of shapes on a grid. After studying the pattern, the prompt is removed and the test-taker must reproduce the pattern from memory. There are 21 patterns for a total of 63 possible points.
Example of an item on the Short-Term Memory Test
Processing Speed Test The Processing Speed test measures the skill of perceptual speed, or the ability to quickly and accurately search for and compare visual images or patterns presented simultaneously. This skill falls under the broad CHC construct of Processing Speed (Gs). The examinee is shown an array of images and must identify a matching pair. To indicate the selection, the test-taker must choose one of the two images that match. There are 55 items for a total of 55 possible points. An example item is shown below.
Example of an item on the Processing Speed Test
Word Attack Test An English Word Attack test is available on the battery. This test measures reading decoding ability, or the skill of reading phonetically-irregular words or nonsense words. The measure falls under the broad CHC construct of Reading and Writing (Grw). On the test, the examinee listens to the narrator say four nonsense words aloud. Then, the examinee selects from a set of four options of how the nonsense word should be spelled. There are 25 nonsense words for a total of 55 possible points. An example is below.
Example of an item on the Word Attack Test
The narrator says, say “upt”. The test-taker then sees and selects from the
following choices:

TEST ADMINISTRATION
Administering the Test
Administer the test in a quiet environment. Use of headphones significantly reduces distractions. Sit near the
examinee during the test to ensure on-task behavior and engagement. Do not assist the examinee with responses but
provide encouragement as needed. If the examinee appears ill during the test, stop the test and resume administration
at a later date or time.
User Qualifications
The Gibson Test is an educational, cognitive skill assessment designed to be administered by clinicians as well as
teachers, paraprofessionals, allied professionals, researchers, and even parents. Because the test administration,
scoring, and reporting is automated, only minimal instruction in use of the Gibson Test is needed. Delivery is
automated and responses are captured and scored automatically by the web-based program to reduce the chance for
scoring error, to maintain consistency in delivery across administrations, and to increase user engagement.
Hardware and Software Requirements
The Gibson Test is a web-based assessment that can be administered on a computer or tablet.
System requirements:
Computer or tablet (Tablet required for interactive version) Broadband Internet access Keyboard or keypad Mouse or touchscreen Adobe Flash Speakers (headphones recommended)
Data security measures include a Secure Socket Layer (SSL), firewall, encrypted local storage and data transfer, password requirements for administrative users, and password protection.
Technical Problems
For technical problems with the Gibson Test, email [email protected]

NORMATIVE INFORMATION Sample Selection
The Gibson Test of Cognitive Skills Version 2 (GT) was normed on a sample of 2,737 children and adults (ages 5-85) in 45 states1, plus Canada and U.S. territories Guam and Puerto Rico. Norming sites were selected based on representation from the four primary geographic regions of the United States and Canada: Northeast, South, Midwest, and West.
Tests were administered in three types of settings between 2014 and 2016. First, test results were collected from new and existing clients in seven LearningRx centers. The test was also administered to students from 23 different elementary, high school, or universities in California, Colorado, Washington DC, Florida, Illinois, Kentucky, Maryland, Minnesota, North Carolina, New Mexico, New York, Pennsylvania, South Dakota, Texas, Virginia, and Wisconsin. Finally, adults and children from 45 states1, two U.S. territories, and Canada responded via social media to complete the test from a home computer or tablet. Demographics for age, geographical region, gender, race, and income are presented in Tables 2-4. Weights were applied to adult test data to adjust for education levels and are outlined in Table 5. Distribution of mean scores across age groups for each test are presented in Figures 2-8.
Table 2. Demographics of Norming Sample by Age and Geographic Region
West South Northeast Midwest Total Age n % n % n % n % n %
5 2 <1 1 <1 0 0 0 0 3 <1 6 14 1 3 <1 0 0 0 0 17 <1 7 127 11 6 <1 1 1 13 2 147 5 8 174 15 17 2 1 1 62 12 254 9 9 169 14 36 4 1 1 71 13 277 10
10 163 14 24 3 3 3 59 11 249 9 11 134 11 38 4 6 7 72 14 250 9 12 93 8 39 4 6 7 56 11 194 7 13 85 7 41 4 2 2 29 5 157 6 14 33 3 88 9 2 2 18 3 141 5 15 7 <1 71 8 1 1 3 <1 82 3 16 3 <1 69 7 1 1 6 1 79 3 17 0 0 65 7 2 2 3 <1 70 3 18 5 <1 30 3 2 2 4 1 41 2
19-24 13 1 92 10 10 11 8 2 123 4 25-29 17 1 41 4 5 6 12 2 75 3 30-39 37 3 48 5 12 14 27 5 124 5 40-49 48 4 95 10 14 16 41 8 198 7 50-59 37 3 77 8 10 11 33 6 157 6 60-69 20 2 28 3 6 7 15 3 69 3 70+ 6 <1 21 2 2 2 1 <1 30 1
Total 1187 43 930 34 87 3 533 20 2737 100 1All U.S. states were represented EXCEPT Alaska, Delaware, Rhode Island, Vermont, and West Virginia.

Table 3.
Demographics of Norming Sample by Age and Gender
Female Male Total Age n % n % n %
5 1 <1 2 <1 3 <1 6 7 <1 10 <1 17 <1 7 81 5 66 6 147 5 8 123 8 131 11 254 9 9 130 8 147 13 277 10
10 138 9 111 10 249 9 11 116 7 134 12 250 9 12 84 5 110 10 194 7 13 75 5 82 7 157 6 14 79 5 62 5 141 5 15 38 2 44 4 82 3 16 48 3 31 3 79 3 17 44 3 26 2 70 3 18 23 1 18 2 41 2
19-24 87 6 36 3 123 4 25-29 55 4 20 2 75 3 30-39 100 6 24 2 124 5 40-49 162 10 36 3 198 7 50-59 129 8 28 2 157 6 60-69 50 3 19 2 69 3 70+ 18 1 12 1 30 1
Total 1588 58 1149 42 2737 100
Table 4. Demographics of Norming Sample by Race and Household Income
Characteristic n % Race
White 1862 68 Black/African
American 363 13
Asian/Pacific Islander 74 3 Hispanic 291 11
Native American 9 <1 Other 136 5
Not Reported 2 <1 Household Income1
Under 25,000 2 <1 25,000 – 34,999 116 4
35,000-49,999 819 30 50,000-74,999 862 31 75,000-99,999 649 24 Over 100,000 289 11
1 Income estimate based on median per ZIP code
Source: 2010-2014 American Community Survey 5-Year Estimates; and Environics Analytics of Canada

Table 5. Education Level and Weighted Adjustments of Adult Sample to Match U.S. Census
Education Level % in U.S. Population # in Sample % in sample Weight Age 20-29
<9th grade 2.5 0 0.0 Some HS 8.2 4 1.9 4.315
HS graduate 28.1 11 5.4 5.203 Some college 38.6 66 32.8 1.176
BA/BS 18.4 88 43.7 0.427 MA/MS or higher 3.8 28 13.9 0.273
unknown 3 1.4 1.000 Age 30-39
<9th grade 4.1 0 0.0 Some HS 6.9 3 2.0 3.450
HS graduate 26.9 6 4.0 6.725 Some college 27.8 29 19.5 1.425
BA/BS 22.6 70 47.2 0.478 MA/MS or higher 11.7 36 24.3 0.481
unknown 4 2.7 1.000 Age 40-49
<9th grade 4.0 0 0.0 Some HS 6.8 2 0.9 7.555
HS graduate 30.0 12 5.5 5.454 Some college 27.0 40 18.4 1.467
BA/BS 20.9 103 47.4 0.440 MA/MS or higher 11.3 60 27.6 0.409
Age 50-59 <9th grade 4.0 0 0.0 Some HS 6.4 3 1.8 3.555
HS graduate 31.8 11 6.7 4.746 Some college 27.3 37 22.5 1.213
BA/BS 19.2 61 37.1 0.517 MA/MS or higher 11.3 49 29.8 0.379
unknown 3 1.8 1.000 Age 60-64
<9th grade 4.6 0 0.0 Some HS 6.0 1 2.6 2.307
HS graduate 30.7 1 2.6 11.807 Some college 27.4 7 18.4 1.489
BA/BS 17.6 14 36.8 0.478 MA/MS or higher 13.6 15 39.4 0.345
Age 65+ <9th grade 9.8 0 0.0 Some HS 9.6 0 0.0
HS graduate 36.3 5 7.9 4.594 Some college 21.1 13 20.6 1.024
BA/BS 12.8 25 39.6 0.323 MA/MS or higher 10.4 20 31.7 0.328

Distribution of Mean Raw Scores Across Age Groups
Figure 2. Mean Long-Term Memory Scores from Age 6 to 80
Figure 3. Mean Short-Term Memory Scores from Age 6 to 80
Figure 4. Mean Visual Processing Scores from Age 6 to 80
16
2226
3025 23
6-8 9-12 13-18 19-30 31-54 55+
Long-Term Memory
27
3844
4945
39
6-8 9-12 13-18 19-30 31-54 55+
Short-Term Memory
18
29
38
54
43
34
6-8 9-12 13-18 19-30 31-54 55+
Visual Processing
Figure 5. Mean Auditory Processing Scores Age 6 to 80
Figure 6. Mean Logic and Reasoning Scores Age 6 to 80
Figure 7. Mean Processing Speed Scores Age 6 to 80
Figure 8. Mean Word Attack Scores Age 6 to 80
27
38
4857 55
49
6-8 9-12 13-18 19-30 31-54 55+
Auditory Processing
9
1315
1917
15
6-8 9-12 13-18 19-30 31-54 55+
Logic and Reasoning
14
3035
39 3734
6-8 9-12 13-18 19-30 31-54 55+
Processing Speed
25
35
4247 46 44
6-8 9-12 13-18 19-30 31-54 55+
Word Attack

VALIDITY Sources of Validity Evidence Validity refers to a test’s ability to measure what it is designed to measure. There are multiple sources of validity reported: content validity, construct validity, concurrent validity, and internal structure. Evidence of validity from prior versions and growth curve analysis are also listed.
Content Validity Each GT test was developed following an extensive review of the literature and two decades of applied research on cognitive skills that are necessary for learning: memory, attention, processing speed, auditory processing and phonological awareness (segmenting, dropping, and blending), visual processing, logic & reasoning, and word attack skills. The tests were selected after wide field use of similar tasks by clinicians using the Visual Information Processing (VIP) program and the Processing and Cognitive Enhancement (PACE) program. Subject matter experts were consulted during each phase of development and field testing to ensure that the content of each test adequately represented the skill it aimed to measure. A formal content validation review by three experts was conducted prior to field testing.
Construct Validity The individual GT tests were developed in alignment with intelligence factors identified by the Cattell-Horn-Carroll (CHC) theory of cognitive abilities (Table 6). CHC theory is a taxonomy with empirical support for use in construct validation of cognitive tests (Jewsbury, Bowden, & Duff, 2017). Table 6. Construct Alignment of GT and CHC Theory
GT Subtest Skill Measured CHC Factor Processing
Speed Perceptual
speed Processing Speed (Gs)
Short-Term Memory
Memory span
Short-Term Memory (Gsm)
Visual Processing
Visualization Visual Processing (Gv)
Auditory Processing
Auditory analysis, auditory synthesis sound awareness
Auditory Processing (Ga)
Logic & Reasoning
Inductive reasoning
Fluid Reasoning (Gf)
Word Attack
Decoding Reading-Writing Ability (Grw)
Long-Term Memory
Meaningful memory Delayed Recall (Glm)
Concurrent Validity A Pearson’s product-moment correlation was run to examine if each test on the GT was correlated with other measures of the same skills to determine if the GT measures the skills as well as other standardized measures. Scores were collected from examinees in the first phase of the norming group (n = 42). Long-term memory was revised after Phase 1 and another 40 examinees were tested to evaluate concurrent validity of the revised long-term memory test. Correlation coefficients were attenuated based on reliability coefficients of the individual criterion tests, and corrected for possible range effects using the formula rxy / SQR (rxx * ryy), where rxy is the concurrent correlation coefficient, rxx is the test-retest coefficient of each WJ III subtest, and ryy is the test-retest coefficient of each Gibson Test subtest. The resulting correlations range from .53 to .93, indicating moderate to strong relationships between the GT and other standardized criterion tests (Table 7). The shared variance between the tests was calculated using the coefficient of determination, or the square of the correlation coefficient. Shared variance ranged from 28% to 86%. All correlations are significant at an alpha of p < .001.
Table 7. Concurrent Validity between GT and Criterion Tests
Gibson Test
Woodcock Johnson
III
ruc rc Shared variance
(r2) Auditory
Processing Spelling of Sounds &
Sound Awareness
.75
.70
.90
.82
81%
67%
Short-Term
Memory
Numbers Reversed
.71
.84
71%
Logic & Reasoning
Concept Formation
.71 .77 59%
Processing Speed
Visual Matching
.50 .60 36%
Visual Processing
Spatial Relations
.70 .82 67%
Long-Term
Memory
Visual Auditory Learning
.43 .53 28%
Word Attack
Word Attack
.82 .93 86%
Evidence of Validity Based on Prior Paper-Based Version of the GT Two prior validation studies were conducted on the original paper-and-pencil version of the Gibson Test of Cognitive Skills. This is critical evidence because more than 50% of the items from the prior version were retained on the new test. None of the validation studies were conducted by the test author and were independently verified. In the prior version, concurrent validity was established between the GT and the WISC-IV, NEPSY-II, and PAL-II (Moxley-Paquette, 2013), and with WRMT, DTLA, LAC, and WJ III (Moore, 2014). Coefficients ranged from .78 to .93, which established respectable validity of the prior version and support the validity of the current version as well.
Concurrent Validity of Prior Paper-Based Version of the Gibson Test
Gibson Test Criterion Test r Processing Speed WISC-IV Symbol Search
WJ III Visual Matching .40 .83
Auditory Processing PAL-II Rimes Lindamood Auditory Conceptualization
WISC-IV Letter Number Sequence
.60
.87
.52 Visual Processing WISC-IV Block Design
NEPSY-II Geometric Puzzles WJ III Visual Closure
.60
.40
.84 Logic & Reasoning WISC-IV Matrix Reasoning
DTLA Symbolic Relations .72 .77
Short-Term Memory DTLA Design Sequence WISC-IV Letter Number Sequence
.75
.73 Word Attack WRMT Word Attack .98
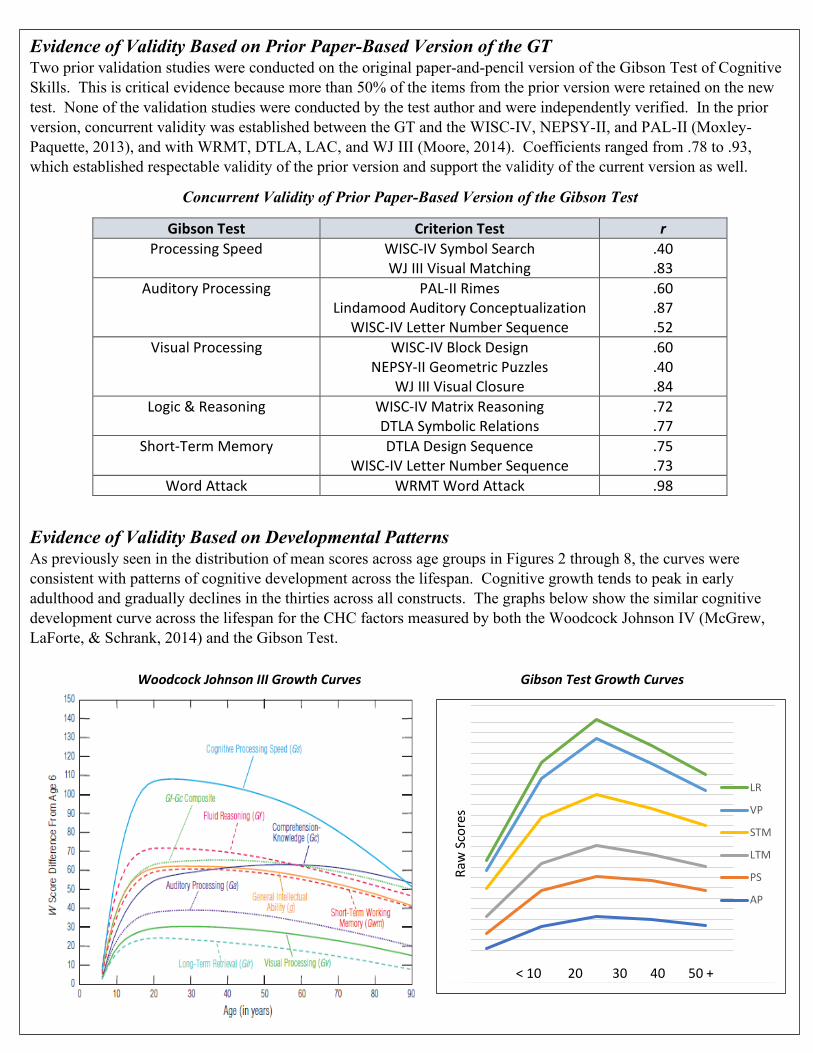
Evidence of Validity Based on Developmental Patterns As previously seen in the distribution of mean scores across age groups in Figures 2 through 8, the curves were consistent with patterns of cognitive development across the lifespan. Cognitive growth tends to peak in early adulthood and gradually declines in the thirties across all constructs. The graphs below show the similar cognitive development curve across the lifespan for the CHC factors measured by both the Woodcock Johnson IV (McGrew, LaForte, & Schrank, 2014) and the Gibson Test.
LR
VP
STM
LTM
PS
AP
< 10 20 30 40 50 +
Woodcock Johnson III Growth Curves Gibson Test Growth Curves
Raw
Sco
res

Evidence of Validity Based on Internal Structure of the Test
To assess the internal structure validity of the Gibson Test, we examined the intercorrelations among all of the tests. When tests that measure similar abilities are more highly correlated with one another than tests that measure dissimilar abilities, the internal structure is valid. As shown in the table below, Auditory Processing and Word Attack, for example, show stronger intercorrelations than with other measures because they measure similar constructs. Visual Processing is correlated with Logic and Reasoning and Short-Term Memory because they are tasks that require the manipulation or identification of visual images. Long-Term Memory is more correlated with Short-Term Memory than with any other task. These examples provide general evidence of convergent and discriminant internal structure validity.
Test Intercorrelations – All Ages
Test n AP LTM WA PS LR VP STM AP 2,696 1.0
LTM 2,618 .33 1.0 WA 2,623 .57 .29 1.0 PS 2,677 .41 .36 .42 1.0 LR 2,688 .51 .36 .50 .51 1.0 VP 2,696 .44 .32 .41 .51 .56 1.0
STM 2,639 .52 .40 .47 .54 .59 .51 1.0
Summary of Evidence of Validity
In this section, we presented multiple sources of validity evidence for the Gibson Test: content validity, construct validity, concurrent validity, and internal structure validity. Evidence of validity from prior versions and growth curve comparison were also outlined. The body of evidence to support the validity of the Gibson Test is strong. However, this is a new version of the test and we welcome continued study of the Gibson Test with different examinees, using different statistical procedures, and in comparison to other criterion tests to further amass the evidence for its use. Predictive validity is an area in which we seek to study more.

RELIABILITY Sources of Reliability Evidence Reliability of a test refers to the consistency with which the test measures the same trait, characteristic, or ability. Three sources of reliability are reported for the GT: coefficient alpha, split-half, and test-retest. These metrics represent the estimates of the amount of error in the test scores.
Coefficient Alpha Coefficient alpha represents the internal consistency reliability of the test, or how well the test items correlate with each other. A desired reliability coefficient approximates or exceeds .80. Using jMetrik item analysis, coefficient alphas were calculated for a sub-sample of students from the norming group. In addition to an overall coefficient alpha for each test, coefficient alphas are reported for subgroups based on age intervals (Table 8). Overall coefficient alphas range from .87 to .98.
Table 8. Reliability Metrics for GTCS Tests by Age
Test
Statistic
Age 6-8
Age 9-12
Age 13-18
Age 19-30
Age 31-54
Age 55+
Overall
Long-Term
Memory
n M SD α SEM
392 15.9 10.3 .91 2.9
943 21.5 11.5 .92 3.1
545 26.1 11.8 .93 3.2
204 30.2 11.2 .92 3.2
379 25.3 10.4 .91 3.1
156 22.5 12.2 .93 3.2
2619 23.2 12.2 .93 3.2
Short-Term
Memory
n M SD α SEM
352 27.4 11.2 .87 3.9
811 37.9 9.2 .82 3.9
297 43.7 9.3 .83 3.9
128 48.7 11.4 .90 3.6
348 45.1 9.2 .82 3.9
145 38.7 9.3 .83 3.9
2081 38.9 11.5 .88 3.9
Visual
Processing
n M SD α SEM
373 17.5 12.6 .96 2.6
835 29.4 14.9 .96 2.8
308 37.8 18.0 .97 3.0
155 54.2 19.9 .98 3.1
400 42.7 20.5 .98 3.1
166 33.9 18.5 .97 2.9
2237 33.0 19.4 .98 3.0
Auditory
Processing
n M SD α SEM
382 27.3 18.8 .95 4.3
840 38.3 20.0 .95 4.5
314 47.5 19.2 .95 4.4
159 57.1 18.1 .96 3.6
408 54.9 18.3 .95 3.9
162 48.9 18.5 .95 4.3
2265 42.8 21.5 .96 4.4
Logic &
Reasoning
n M SD α SEM
365 9.3 3.9 .85 1.5
822 13.2 3.9 .83 1.6
301 15.3 3.9 .81 1.7
129 18.8 3.4 .74 1.7
354 17.2 3.5 .77 1.7
151 14.8 3.5 .79 1.6
2122 14 4.7 .87 1.7
Processing
Speed
n M SD α SEM
362 14.3 1.9 .88 .67
819 30.4 5.0 .81 2.2
301 35.1 5.5 .87 2.0
123 39.4 4.9 .87 1.7
353 36.6 4.8 .87 1.7
155 33.5 6.1 .91 1.8
2115 32.2 6.3 .88 2.1
Word Attack
n M SD α SEM
346 24.6 14.7 .93 3.9
806 35.3 13.6 .92 3.9
295 41.6 10.9 .89 3.7
125 46.9 7.8 .83 3.2
349 46.2 8.8 .86 3.3
145 44.3 9.2 .85 3.6
2066 37.6 14.2 .93 3.8
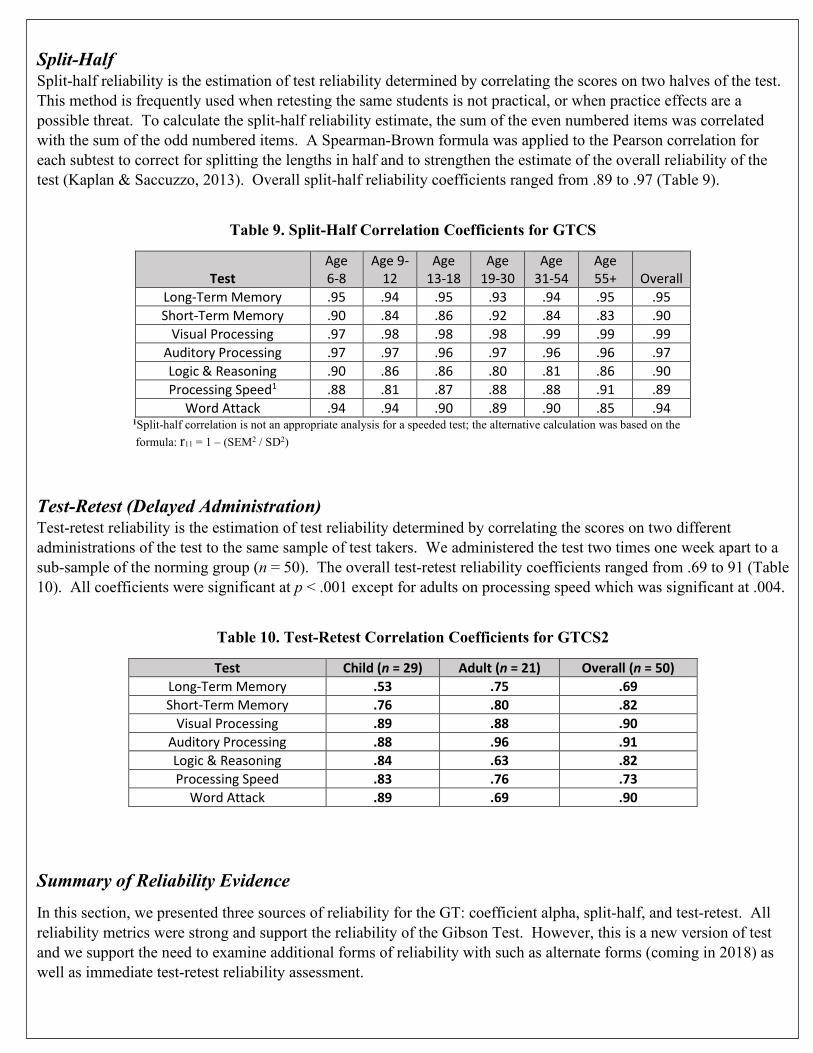
Split-Half Split-half reliability is the estimation of test reliability determined by correlating the scores on two halves of the test. This method is frequently used when retesting the same students is not practical, or when practice effects are a possible threat. To calculate the split-half reliability estimate, the sum of the even numbered items was correlated with the sum of the odd numbered items. A Spearman-Brown formula was applied to the Pearson correlation for each subtest to correct for splitting the lengths in half and to strengthen the estimate of the overall reliability of the test (Kaplan & Saccuzzo, 2013). Overall split-half reliability coefficients ranged from .89 to .97 (Table 9).
Table 9. Split-Half Correlation Coefficients for GTCS
Test
Age 6-8
Age 9-12
Age 13-18
Age 19-30
Age 31-54
Age 55+
Overall
Long-Term Memory .95 .94 .95 .93 .94 .95 .95 Short-Term Memory .90 .84 .86 .92 .84 .83 .90
Visual Processing .97 .98 .98 .98 .99 .99 .99 Auditory Processing .97 .97 .96 .97 .96 .96 .97 Logic & Reasoning .90 .86 .86 .80 .81 .86 .90 Processing Speed1 .88 .81 .87 .88 .88 .91 .89
Word Attack .94 .94 .90 .89 .90 .85 .94 1Split-half correlation is not an appropriate analysis for a speeded test; the alternative calculation was based on the formula: r11 = 1 – (SEM2 / SD2)
Test-Retest (Delayed Administration) Test-retest reliability is the estimation of test reliability determined by correlating the scores on two different administrations of the test to the same sample of test takers. We administered the test two times one week apart to a sub-sample of the norming group (n = 50). The overall test-retest reliability coefficients ranged from .69 to 91 (Table 10). All coefficients were significant at p < .001 except for adults on processing speed which was significant at .004.
Table 10. Test-Retest Correlation Coefficients for GTCS2
Test Child (n = 29) Adult (n = 21) Overall (n = 50) Long-Term Memory .53 .75 .69 Short-Term Memory .76 .80 .82
Visual Processing .89 .88 .90 Auditory Processing .88 .96 .91 Logic & Reasoning .84 .63 .82 Processing Speed .83 .76 .73
Word Attack .89 .69 .90
Summary of Reliability Evidence
In this section, we presented three sources of reliability for the GT: coefficient alpha, split-half, and test-retest. All reliability metrics were strong and support the reliability of the Gibson Test. However, this is a new version of test and we support the need to examine additional forms of reliability with such as alternate forms (coming in 2018) as well as immediate test-retest reliability assessment.

Controlling for Test Bias
To ensure minimal test bias in the Gibson Test, we were deliberate in our recruitment of examinees for the norming group from all regions of the country, of all ages and ethnicities, and a balance of males and females. We were careful to select test items that appeared culturally neutral, and our content validation experts confirmed the selections.
Differential Item Functioning
To explore the possibility of bias in test item functioning between demographic groups, we used jMetrik’s Differential Item Functioning. Differential item functioning (DIF) was assessed for gender and ethnicity. For ethnicity, results indicated no DIF on Short-Term Memory or Logic and Reasoning, and minimal DIF on Visual Processing, Long-Term Memory, Word Attack, or Processing Speed. Twenty-percent of Auditory Processing items showed DIF between whites and non-whites. There was no DIF between males and females except for a few Visual Processing items. Table 11 shows the percentage of items per test identified as with DIF.
Table 11. Differential Item Functioning
Male/ *Female
White/ *Non-White
Not Hispanic/ *Hispanic
Test Total # Items
% items with DIF
% items with DIF
% items with DIF
AP 45 0.0% 20.0% 0.0% LTM 24 0.0% 4.1% 4.1% WA 25 0.0% 0.0% 8.0% PS 55 0.0% 5.4% 9.0% LR 29 0.0% 0.0% 0.0% VP 92 2.0% 0.0% 1.0%
STM 21 0.0% 0.0% 0.0%
Differences Among Groups at the Test Level
To assess overall differences and similarities between groups at the test level, we compiled descriptive statistics. The means for all subgroups (gender and ethnicities) are all average, ranging well within one standard deviation of the overall mean.
Table 12. Differences in Subgroup Performance at Test Level
LTM STM VP AP LR PS WA Race/Ethnicity
White 23.7 40.1 34.7 52.1 14.5 32.6 38.5 Black 23.4 36.1 28.5 40.1 12.9 32.4 34.5
Hispanic 19.2 34.7 26.7 43.9 11.7 29.5 32.4 API 22.6 41.7 32.2 50.3 14.8 32.3 37.3
Other 23.6 37.8 31.7 47.4 13.0 31.4 36.7 Sex
Male 22.6 38.7 30.9 46.8 13.7 31.1 35.8 Female 23.8 39.5 34.8 51.0 14.2 33.2 38.6
Overall 23.1 (12.2)
38.9 (12.2)
33.0 (19.4)
42.8 (21.5)
14.0 (4.7)
32.2 (6.2)
37.3 (14.3)
TEST FAIRNESS

TYPES OF SCORES Normative Scores
Three types of normative scores are available for each subtest of the GT: percentiles, standard scores, and age-equivalents.
Percentile Rank (%tile) Percentile rank is based on the location of the student’s score compared to same-age students in the sample. It is the point in the distribution of scores that is at or below the scores of where a percentage of students fall. For example, a percentile rank of 83 means that the student scored as well as or better than 83% of the other students of the same age in the sample. Percentiles range from 1 to 99. It is important to note that the percentile rank is not the same as the percentage of items the student answered correctly. Percent correct is not a score option for the GT.
Standard Scores (SS) The standard score (SS) is based on a distribution of scores from 50 to 150 with a mean of 100 and a standard deviation of 15. The standard score is determined from the percentile score using a standard psychometric conversion table. For example, if a seven-year old student obtained a percentile rank of 50 on the Word Attack subtest, the student’s standard score would be 100. Standard scores are the best metrics to use in statistical analysis because these scores are on an interval scale.
Age-Equivalents (AE) Age equivalent, or age score, reflects the student’s performance in terms of age level where the subject’s score is the same as the score considered average for a given age level in the norming sample in the age range of 5-18 years; if the subject is above 16, no age equivalent is given. Age equivalent scores do not account for the wide variation in scores in each age group, so they are not as reliable as standard scores and percentiles.
Composite Scores
Two additional composite scores are reported for the Gibson Test of Cognitive Skills, Version 2: an Attention score and General Cognitive Ability score.
Attention Score Attention is a composite score of sustained and selective attention skills representing the ability to focus and stay on task. The attention score is a composite of two subtests, the processing speed test and the short-term memory test. The standard score is computed by adding the two standard scores from each subtest and dividing by 2. The associated percentile is determined by a standard psychometric conversion table. There is no age-equivalent score reported for the Attention composite.
General Cognitive Ability Score An overall score for cognitive performance on the Gibson Test, representing cognitive efficiency, is calculated as a weighted composite based on principal component (PC) analysis using all subtests except for Word Attack. PC analysis finds the optimal combination of tests that accounts for the largest portion of variance in the group of tests. Loadings were calculated on one component (cognitive efficiency) for each age group. Table 13 shows the test weights that comprise the general cognitive ability score.

Table 13. Composite General Cognitive Ability Weights by Age Group
Test Age
5-6 7 8 9 10 11 12 13 14 15 Short-Term
Memory .20 .20 .20 .20 .19 .19 .19 .19 .19 .19
Visual Processing
.17 .17 .17 .17 .17 .17 .17 .17 .17 .17
Logic & Reasoning
.20 .20 .20 .20 .20 .20 .21 .21 .21 .21
Processing Speed
.10 .11 .11 .11 .12 .12 .12 .12 .12 .12
Auditory Processing
.18 .18 .18 .18 .18 .18 .17 .17 .17 .17
Long-term Memory
.15 .14 .14 .14 .14 .14 .14 .14 .14 .14
Test Age
16 17 18 19-24 25-29 30-39 40-49 50-59 60-69 70+ Short-Term
Memory .19 .19 .19 .19 .19 .18 .18 .18 .18 .18
Visual Processing
.17 .17 .17 .17 .17 .17 .17 .17 .17 .17
Logic & Reasoning
.21 .21 .21 .21 .21 .21 .21 .21 .22 .22
Processing Speed
.12 .12 .12 .12 .12 .13 .14 .14 .13 .13
Auditory Processing
.17 .17 .17 .17 .16 .16 .16 .16 .16 .16
Long-term Memory
.14 .14 .14 .14 .15 .15 .14 .14 .14 .14

SUMMARY
In this manual, we covered the psychometric properties and norming information for the Gibson Test of Cognitive Skills (Version 2), and provided key information about content, scoring, and use.
The Gibson Test of Cognitive Skills Version 2 (GT) was normed on a sample of 2,737 children and adults (ages 5-85) in 45 states1, plus Canada and U.S. territories Guam and Puerto Rico. A series of validation and reliability studies were conducted to evaluate the strength of the test. We presented multiple sources of validity evidence for the Gibson Test: content validity, construct validity, concurrent validity, and internal structure validity. Evidence of validity from prior versions and growth curve comparison were also outlined. We also presented three sources of reliability for the GT: coefficient alpha, split-half, and test-retest. All validity and reliability metrics were strong and support the use of the Gibson Test.
In addition to the psychometric properties, we shared the unique qualities of the revised Gibson Test. As of this writing, it is the only commercially-available digital cognitive test that measures three auditory processing skills and word attack skills – key constructs required for reading and writing. It requires minimal examiner training and includes automated scoring and reporting. The revised test is also available in 19 languages.
This is a new version of the test and we support the need to examine additional sources of validity and reliability with alternate forms, immediate test-retest reliability assessment, examination of psychometric properties with different examinees, using different statistical procedures, and in comparison to other criterion tests to further amass the evidence for its use. Predictive validity is an area in which we seek to study more.
Currently, the test can be confidently used to evaluate the effect of cognitive training or an educational intervention, to establish current skill levels across multiple cognitive constructs, to conduct research, and to monitor progress or decline in cognitive skill levels over time.

Alfonso, V.C., Flanagan, D.P., & Radwan, S. (2005). The impact of Cattell-Horn-Carroll theory on test development and interpretation of cognitive and academic abilities. In D.P. Flanagan & P.L. Harrison (Eds.), Contemporary Intellectual Assessment: Theories, tests, and Issues (2nd ed.). New York, NY: Guilford Press.
Flanagan, D.O., Alfonso, V.C., & Ortiz, S.O. (2012). The cross-battery assessment approach: An overview, historical perspective, and current directions. In D.P. Flanagan & P.L. Harrison (Eds.), Contemporary Intellectual Assessment: Theories, tests, and Issues (3rd ed.). New York, NY: Guilford Press.
Gibson, K. (2014). Gibson test of cognitive skills (Version 2). Colorado Springs, CO: Gibson Institute of Cognitive Research.
Hopkins, W.G. (2002). A scale of magnitude for effect statistics. Retrieved from http://sportsci.org/resource/stats/effectmag.html
Jewsbury, P.A., Bowden, S.C., & Duff, K. (2017). The Cattell-Horn-Carroll model of cognition for clinical assessment. Journal of Psychoeducational Assessment, 35(6), 547-567. doi: 10.1177/0734282916651360
Kaplan, R.M., & Saccuzzo, D.P. (2013). Psychological testing: Principles, applications, and issues (9th ed.). Boston, MA: Cengage Learning.
McGrew, K.S., LaForte, E.M., & Schrank, F.A. (2014). Technical manual: Woodcock Johnson IV. Rolling Meadows, IL: Riverside.
Woodcock, R.W., McGrew, K.S., & Mather, N. (2007). Woodcock Johnson III. Rolling Meadows, IL: Riverside.
Moore, A.L. (2014). Technical Manual. Gibson Test of Cognitive Skills (PBT). Colorado Springs, CO: Gibson Institute of Cognitive Research.
Moxley-Paquette, E. (2013). Testing a structural equation model of language-based cognitive fitness. Doctoral dissertation. Available at ProQuest Dissertations and Theses. (UMI No. 3728963).
Moxley-Paquette, E., & Burkholder, G. (2014). Testing a structural equation model of language-based cognitive fitness. Procedia Social and Behavioral Sciences, 112, 64-76. Retrieved from http://www.sciencedirect.com/science/article/pii/S1877042814011574
Moxley-Paquette, E., & Burkholder, G. (2015). Testing a structural equation model of language-based cognitive fitness with longitudinal data. Procedia Social and Behavioral Sciences, 171, 596-605. Retrieved from http://www.sciencedirect.com/science/article/pii/S1877042815001962
Schneider, W.J., & McGrew, K.S. (2012). The Cattell-Horn-Carroll model of intelligence. In D.P. Flanagan & P.L. Harrison (Eds.), Contemporary Intellectual Assessment: Theories, tests, and Issues (3rd ed.). New York, NY: Guilford Press.
U.S. Census Bureau. (2015). 2010-2104 American community survey 5-year estimates. Retrieved from https://factfinder.census.gov/faces/tableservices/jsf/pages/productview.xhtml?src=bkmk
Gibson Test reliability and validity publication: Moore, A.L., & Miller, T. (2018). Reliability and validity of the revised Gibson Test of Cognitive Skills, a
computer-based test battery for assessing cognition across the lifespan. Psychology Research and Behavior Management, 11, 25-35. doi:10.2147/PRBM.S152781 https://www.ncbi.nlm.nih.gov/pmc/articles/PMC5813948/
REFERENCES