digital radio mondiale (drm), asia-pacific broadcasting ... · pdf filemacintosh...
TRANSCRIPT
MACINTOSH HD:USERS:NIGELLAFLIN:DROPBOX:DIGITAL RADIO:DRM:BUG:ITU DOCS:R07-WP6A-C-0010!!MSW-E.DOC 29/06/2012 29/06/2012
Abstract
This contribution is based on a series of tests and measurements that were carried out in Delhi and New Delhi (India). The trials were a part of the DRM-AIR-ABU Showcase Project on Digital Radio Mondiale (DRM) simulcast technologies that took place from 7 to 12 May, 2007.
Proposals
The following proposals are made for consideration of ITU-R WP 6D: 1) a draft Recommendation may be prepared on technical parameters and operating
requirements for single channel simulcast and multi-channel simulcast, as applicable to Regions 1, 2 and 3;
2) a draft Recommendation may be prepared on technical parameters and operating requirements for local broadcast in the 26 MHz band;
3) a draft Recommendation may be prepared on technical parameters and operating requirements for full stereo sound broadcasting in the medium wave band, as applicable to Region 3.
Radiocommunication Study Groups
Received: 24 March 2008
Subject: Questions ITU-R 28/6, ITU-R 52-1/6, ITU-R 60/6, ITU-R 64-1/6 and ITU-R 108/6
Document 6D/10-E 28 March 2008 English only
Digital Radio Mondiale (DRM), Asia-Pacific Broadcasting Union (ABU)
Results Of Drm Trials In New Delhi: Simulcast Medium Wave, Tropical Band, Nvis And 26 Mhz Local Broadcasting
- 2 - 6D/10-E
MACINTOSH HD:USERS:NIGELLAFLIN:DROPBOX:DIGITAL RADIO:DRM:BUG:ITU DOCS:R07-WP6A-C-0010!!MSW-E.DOC 29/06/2012 29/06/2012
CONTENTS Page
1 Executive summary ...................................................................................................... 4 1.1 SCS transmissions .......................................................................................... 4 1.2 Full bandwidth DRM test in MW ................................................................... 5 1.3 Local service in 26 MHz band ........................................................................ 5 1.4 NVIS transmissions in 3 and 6 MHz bands .................................................... 5 1.5 Field measurements ........................................................................................ 6 1.6 Test procedures ............................................................................................... 6 1.7 Data evaluation and discussion ...................................................................... 6 1.8 Further action .................................................................................................. 7 1.9 Conclusions .................................................................................................... 7 DRM mode: A/64/16/0.6/S ........................................................................................... 7 DRM mode: B/16/4/0.5/L ............................................................................................. 7 DRM mode: B/16/4/0.5/L ............................................................................................. 7 DRM RMS power: 2 KW ............................................................................................. 8
2 Introduction ................................................................................................................... 8
3 Objectives ..................................................................................................................... 8
4 Single channel simulcast ............................................................................................... 9 4.1 Introduction .................................................................................................... 9 4.2 Simulcast trial description .............................................................................. 9 4.2.1 Objectives ....................................................................................................... 9 4.2.2 Transmission system ...................................................................................... 9 4.2.3 Summary of measured locations .................................................................... 13 4.3 Field trials results ........................................................................................... 14 4.3.1 Results summary ............................................................................................ 14 4.3.2 Results for mode A/64/16/06/L 16 dB ........................................................... 16 4.3.3 Results for mode A/64/16/06/L 14 dB ........................................................... 20 4.3.4 Results for mode A/16/4/05/S 14 dB .............................................................. 22 4.4 Coverage ......................................................................................................... 24 4.5 Conclusions .................................................................................................... 25 4.6 Full DRM and SCS comparison ..................................................................... 26
5 Local coverage using the 26 MHz band ....................................................................... 27 5.1 Introduction .................................................................................................... 27 5.2 Trial description .............................................................................................. 27 5.2.1 Objectives ....................................................................................................... 27 5.2.2 Transmission system ...................................................................................... 27
- 3 - 6D/10-E
MACINTOSH HD:USERS:NIGELLAFLIN:DROPBOX:DIGITAL RADIO:DRM:BUG:ITU DOCS:R07-WP6A-C-0010!!MSW-E.DOC 29/06/2012 29/06/2012
Page 5.2.3 Summary of measurement campaign ............................................................. 28 5.3 Field trial results ............................................................................................. 29 5.3.1 Results summary ............................................................................................ 29 5.3.2 Coverage ......................................................................................................... 30 5.4 Conclusions .................................................................................................... 35
6 MW Full channel (18 kHz) DRM ................................................................................. 35 6.1 Introduction .................................................................................................... 35 6.2 Trial description .............................................................................................. 36 6.2.1 Objectives ....................................................................................................... 36 6.2.2 Transmission system ...................................................................................... 36 6.2.3 Summary of the measurement campaign ....................................................... 37 6.3 Field trial results ............................................................................................. 37 6.3.1 Results summary ............................................................................................ 37 6.3.2 Coverage ......................................................................................................... 38 6.4 Subjective quality evaluation ......................................................................... 42 6.5 Conclusions .................................................................................................... 42
7 Nighttime NVIS ............................................................................................................ 42 7.1 Introduction .................................................................................................... 42 7.2 Trial description .............................................................................................. 42 7.2.1 Objectives ....................................................................................................... 42 7.2.2 Transmission system ...................................................................................... 43 7.2.3 Summary of the trial ....................................................................................... 44 7.3 Field trial results ............................................................................................. 45 7.3.1 Summary ......................................................................................................... 45 7.3.2 DRM Reception .............................................................................................. 45 7.4 Conclusions .................................................................................................... 62
8 Conclusions ................................................................................................................... 62
9 Acknowledgement ........................................................................................................ 63
10 References ..................................................................................................................... 63

- 4 - 6D/10-E
MACINTOSH HD:USERS:NIGELLAFLIN:DROPBOX:DIGITAL RADIO:DRM:BUG:ITU DOCS:R07-WP6A-C-0010!!MSW-E.DOC 29/06/2012 29/06/2012
1 Executive summary
This contribution is based on a series of tests and measurements that were carried out in Delhi and New Delhi (India) from 9 to 12 May, 2007. The trials were a part of the DRM-AIR-ABU Showcase Project on Digital Radio Mondiale (DRM) simulcast technologies that took place in Delhi from 7 to 12 May, 2007.
The principle objective of the project was to demonstrate and evaluate the relatively new technology of single channel simulcast (SCS) which enables simultaneous transmission of analogue and DRM digital medium wave radio signals using only one transmitter. As an important step, if this technique could be successfully demonstrated in the Asia-Pacific environment, the radio broadcasters in the region could well reap significant benefits. The project also assessed local digital radio transmissions in the 26 MHz band, digital radio NVIS transmissions in the 3 MHz band for wide area national coverage and the full 18 kHz bandwidth DRM tests in the medium wave band, something which is quite significant for the Asia-Pacific Region. As most Asian countries had so far not taken much initiative in the digital radio technologies in the medium wave band, one of the objectives of this project was to provide them with a scientific basis to consider implementing this technology. Two transmitter sites in north Delhi were used for all the tests. Measurement techniques and practices were described and the measurement schedules and methods were finalized for the field tests.
1.1 SCS transmissions The project successfully demonstrated and evaluated the relatively new technology of single channel simulcast, which enables simultaneous transmission of analogue and DRM digital medium wave radio signals using only one transmitter
FIGURE 1.1 Simulcast configuration
Total BW: 18 kHz Analogue Part: 9 kHz DRM Part: 9 kHz
fcAM
9 kHz
- 5 - 6D/10-E
MACINTOSH HD:USERS:NIGELLAFLIN:DROPBOX:DIGITAL RADIO:DRM:BUG:ITU DOCS:R07-WP6A-C-0010!!MSW-E.DOC 29/06/2012 29/06/2012
This has been done for the first time in the Asia-Pacific (Region 3), where the channel bandwidth is quite different from that in Region 1. As a result of the tests, it has been established that this technique can be successfully implemented in the Asia-Pacific environment and radio broadcasters in the region could reap significant benefits. This means that radio broadcasters can use this technology for seamless transition to digital radio with only an incremental cost addition, facilitating introduction of digital radio services while largely maintaining the on-going analogue services.
1.2 Full bandwidth DRM test in MW In a landmark development, a full bandwidth (18 kHz) DRM medium wave digital radio transmission was carried out on 11 May. This resulted an excellent quality radio test programme received, brilliant sound emanating from DRM digital radio sets, certainly far superior to the service generally resulting from the analogue transmissions. The All India Radio transmitter at Nangli in Delhi operated a full fledged stereo service as a part of the tests. This is for the first time in the world that an 18 kHz DRM test has been carried out in the medium wave band. Significantly, as radio broadcasters in the Asia-Pacific uniquely use 18 kHz wide channels in the medium wave and using DRM in the full channel will enable them to provide very high quality stereo service to listeners.
1.3 Local service in 26 MHz band Among other tests, digital radio for local coverage using the relatively free 26 MHz band – again the first one for this Region – proved to be quite interesting. It has demonstrated that local radio coverage is possible with good quality audio using only low power transmitters in this frequency band.
1.4 NVIS transmissions in 3 and 6 MHz bands
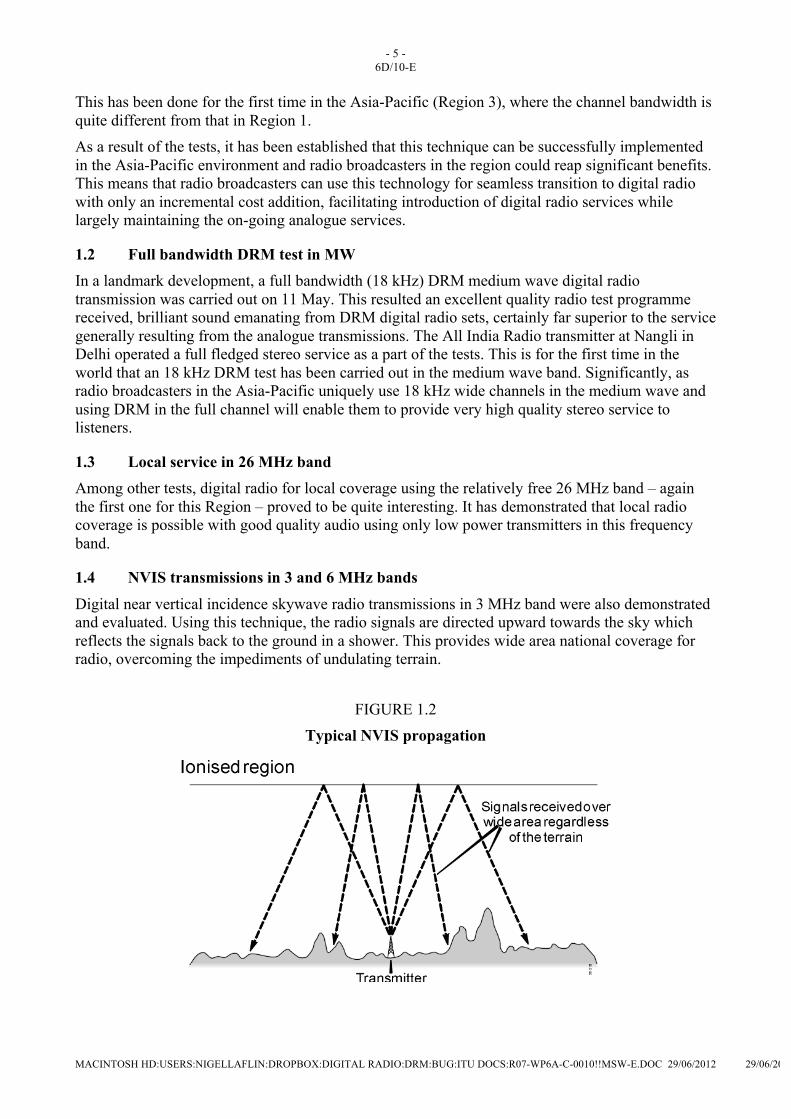
Digital near vertical incidence skywave radio transmissions in 3 MHz band were also demonstrated and evaluated. Using this technique, the radio signals are directed upward towards the sky which reflects the signals back to the ground in a shower. This provides wide area national coverage for radio, overcoming the impediments of undulating terrain.
FIGURE 1.2 Typical NVIS propagation

- 6 - 6D/10-E
MACINTOSH HD:USERS:NIGELLAFLIN:DROPBOX:DIGITAL RADIO:DRM:BUG:ITU DOCS:R07-WP6A-C-0010!!MSW-E.DOC 29/06/2012 29/06/2012
FIGURE 1.3
Radiation pattern of a typical NVIS transmitting antenna
1.5 Field measurements1 For the purpose of measurements, two large vans were equipped with receiving antennas, professional measurement receivers, laptops, software-based radios, field strength meters and DRM and analogue radio receivers. All the equipment was operating on batteries and the vans were fully air conditioned. Several vans were also available for carrying all the participants on route testing and also for subjective monitoring for digital and analogue radio.
Several routes were selected in Delhi and New Delhi so that measurements could be made in all types of areas, ranging from city-edge semi urban, urban, city centre deeply congested, high-rise building area, areas of high man-made noise and under long overhead tracks for metro rail. Some measurements were also made in rural areas. Together, these cover all possible environments for the tests.
1.6 Test procedures
At the beginning of each day, static tests were taken at an identified location. After this was accomplished, the entire convoy of test vehicles went on the designated route and took measurements. The measurement data and GPS reference were recorded automatically. For the NVIS and SCS testing, one test party traveled more than 150 km from the transmitters to check the skywave reception (in the case of NVIS) and the cut-off point in the case of SCS. The NVIS test was done overnight to measure the sunset and sunrise effects on the signals.
1.7 Data evaluation and discussion At the end of every day, test data was analyzed and the results evaluated and discussed. Based on the results, some first cut conclusions were arrived in these sessions. The trials and measurements were conducted with utmost precision and the data available is quite accurate and valuable.
____________________ 1 The project started with a two-day workshop, providing tutorial information about the DRM digital radio
system, simulcast technologies in the medium wave band, 18 kHz bandwidth MW DRM transmissions, 26 MHz usage for local coverage and NVIS transmissions.
- 7 - 6D/10-E
MACINTOSH HD:USERS:NIGELLAFLIN:DROPBOX:DIGITAL RADIO:DRM:BUG:ITU DOCS:R07-WP6A-C-0010!!MSW-E.DOC 29/06/2012 29/06/2012
1.8 Further action
The tests and their positive results have stirred strong interest among the senior management of some of the radio broadcasters present. It can be expected that they will look closely at these technologies, with a view to including these in their developmental plans for the near future.
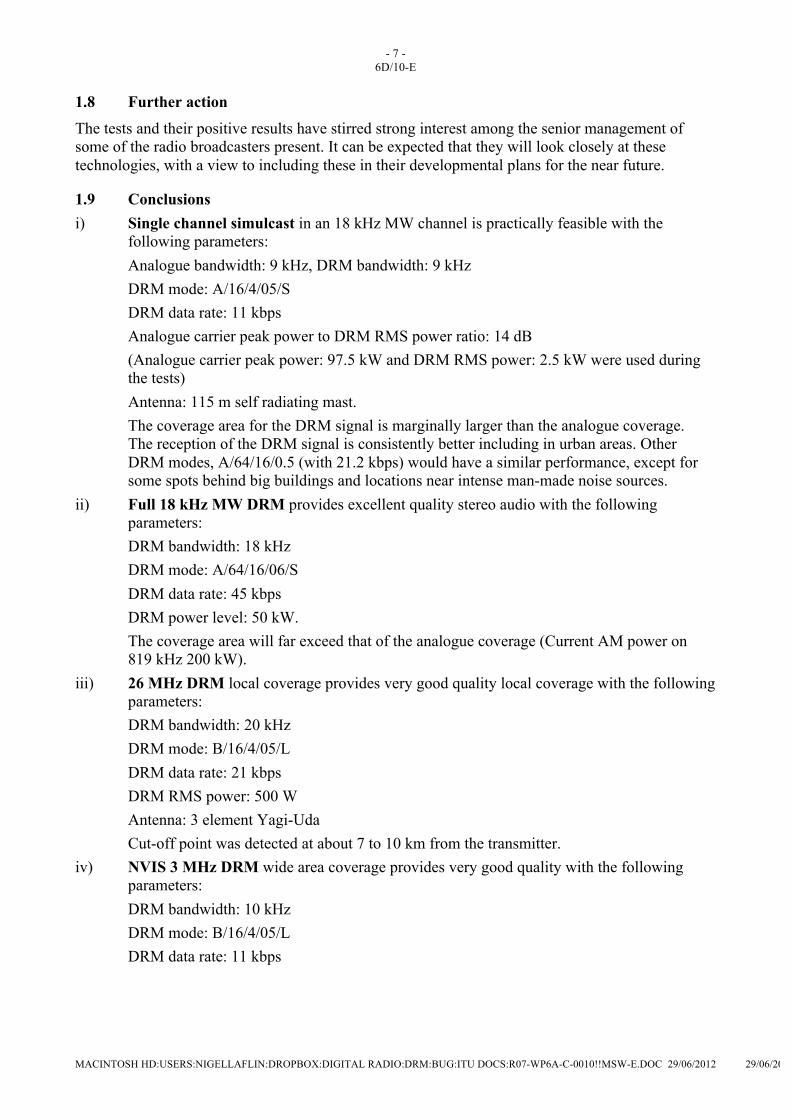
1.9 Conclusions i) Single channel simulcast in an 18 kHz MW channel is practically feasible with the
following parameters: Analogue bandwidth: 9 kHz, DRM bandwidth: 9 kHz DRM mode: A/16/4/05/S DRM data rate: 11 kbps Analogue carrier peak power to DRM RMS power ratio: 14 dB (Analogue carrier peak power: 97.5 kW and DRM RMS power: 2.5 kW were used during
the tests) Antenna: 115 m self radiating mast. The coverage area for the DRM signal is marginally larger than the analogue coverage.
The reception of the DRM signal is consistently better including in urban areas. Other DRM modes, A/64/16/0.5 (with 21.2 kbps) would have a similar performance, except for some spots behind big buildings and locations near intense man-made noise sources.
ii) Full 18 kHz MW DRM provides excellent quality stereo audio with the following parameters:
DRM bandwidth: 18 kHz DRM mode: A/64/16/06/S DRM data rate: 45 kbps DRM power level: 50 kW. The coverage area will far exceed that of the analogue coverage (Current AM power on
819 kHz 200 kW). iii) 26 MHz DRM local coverage provides very good quality local coverage with the following
parameters: DRM bandwidth: 20 kHz DRM mode: B/16/4/05/L DRM data rate: 21 kbps DRM RMS power: 500 W Antenna: 3 element Yagi-Uda Cut-off point was detected at about 7 to 10 km from the transmitter. iv) NVIS 3 MHz DRM wide area coverage provides very good quality with the following
parameters: DRM bandwidth: 10 kHz DRM mode: B/16/4/05/L DRM data rate: 11 kbps
- 8 - 6D/10-E
MACINTOSH HD:USERS:NIGELLAFLIN:DROPBOX:DIGITAL RADIO:DRM:BUG:ITU DOCS:R07-WP6A-C-0010!!MSW-E.DOC 29/06/2012 29/06/2012
DRM RMS power: 2 kW Antenna: Dipole H 1/1/.5λ. Detailed results and a description of all the procedures, transmission and reception set up
and data processing methodologies are provided in the following sections of this document.
2 Introduction The DRM-AIR-ABU showcase on DRM digital radio simulcast technologies took place in New Delhi from 7 to 12 May, 2007. The project was developed as a result of close collaboration between the Indian radio broadcaster All India Radio (AIR), the DRM Consortium and its members – Thomson Broadcast & Multimedia (Thomson), Hitachi Electric Kokusai, University of the Basque Country (Spain), and the Asia-Pacific Broadcasting Union (ABU). The tests received huge response from radio broadcasters and others in the radio industry, with about 60 participants, including 27 from outside of India, including from Singapore, Brunei, Bhutan, Iran, Kuwait and Papua New Guinea. The main objective of the project was to demonstrate and evaluate the relatively new technology of Single Channel Simulcast (SCS) which enables simultaneous transmission of analogue and DRM digital medium wave radio signals using only one transmitter. The bandwidth required for this emission was 18 kHz, 9 kHz used by the analogue part and additional 9 kHz for the digital DRM part.
The week long project also assessed local digital radio transmissions in the 26 MHz band, digital NVIS radio transmissions in 3 and 6 MHz bands for wide area national coverage and full 18 kHz bandwidth DRM tests in the medium wave band, something which is quite significant for this Region.
The Showcase was a composite event, starting with a two-day workshop followed by a 4-day field test. The workshop provided tutorial information on the DRM digital radio system, simulcast technologies in the medium wave band, 18 kHz bandwidth MW DRM transmissions, 26 MHz usage for local coverage and NVIS transmissions.
This document is organized as follows. The objectives are described in section 3. Section 4 provides a general description of the set of tests carried out. Section 5 is devoted to describing the simulcast tests. Section 6 deals with local broadcasting using the 26 MHz band. Section 7 describes the Full-channel DRM (18 kHz wide DRM) trial, and the NVIS experiment is described in Section 8. Finally a summary of the conclusions is included along with the acknowledgements and the references.
3 Objectives The project focused on two key technologies: the DRM Simulcast options for broadcasting analogue and digital contents sharing the same infrastructure in the medium wave band and the new local broadcast application in the 26 MHz band, a unique feature enabled by the DRM standard.
The aim was to kick-start broadcasters, receiver industry, and also listener activity in the ABU region for digital radio technologies.
The set of technical objectives also included: – test medium wave radio transmitters operating digital service and analogue services (on its
regular frequency); – sample measurements on actual signal cross-talk, field strength and coverage areas for
possible use in implementation;

- 9 - 6D/10-E
MACINTOSH HD:USERS:NIGELLAFLIN:DROPBOX:DIGITAL RADIO:DRM:BUG:ITU DOCS:R07-WP6A-C-0010!!MSW-E.DOC 29/06/2012 29/06/2012
– to carry out tests on DRM 26 MHz local transmissions; – to carry out tests on DRM Short Wave, including NVIS both during daytime and nighttime; – to impart training to ABU members by means of a two day workshop.
4 Single channel simulcast
4.1 Introduction This section deals with the evaluation of the simultaneous analogue and digital transmission system AM-DRM, known as simulcast. Channels for AM broadcasting in the MW band in ITU Region 3 are mostly 18 kHz wide channels. At the same time, a 9 kHz grid for centre frequency is stated for receivers fulfilling GE75 Agreement.
4.2 Simulcast trial description
4.2.1 Objectives
The main objectives of the tests related to the simulcast signal are listed below: – Test the coverage area in an urban environment: finding the best DRM mode to broadcast
Simulcast signal and the threshold values and coverage radius in urban environments. – Evaluation of audio quality: In order to include the listener perspective, it is necessary to
include the subjective audio quality assessment for AM and DRM received signals. – Evaluation of the DRM impact over the AM analogue audio when transmitted in simulcast
configuration: To avoid interference between both signals, the DRM signal was broadcasted using lower power than the AM and different power ratios were used.
– Coverage area comparison between AM and DRM components of simulcast signal: taking into account the defined power ratio between both signals a coverage area comparison is needed in order to define the simulcast power to be broadcasted.
4.2.2 Transmission system The SCS signal was broadcast from the transmitting station that All India Radio has in Nangli, north of Delhi. Figure 4.1 shows AIR’s transmitter location that is at about 15 kilometres away from the centre of Delhi.

- 10 - 6D/10-E
MACINTOSH HD:USERS:NIGELLAFLIN:DROPBOX:DIGITAL RADIO:DRM:BUG:ITU DOCS:R07-WP6A-C-0010!!MSW-E.DOC 29/06/2012 29/06/2012
FIGURE 4.1
Medium wave transmitter at Nangli
A summary of the transmission centre features can be found in Table 4.1. Figure 4.2 shows the transmitter and DRM exciter pictures.
TABLE 4.1 Transmission centre features
Transmission centre All India Radio (Nangli, Delhi)
Broadcaster All India Radio
Transmission centre coordinates
28º 46’ 04’’ N 77º 08’ 32’’ E
Frequency 666 kHz
Bandwidth 9 kHz
Capable power 100 kWatt
Radiating system 115 m Self radiating mast
15 km
Delhi Downtown

- 11 - 6D/10-E
MACINTOSH HD:USERS:NIGELLAFLIN:DROPBOX:DIGITAL RADIO:DRM:BUG:ITU DOCS:R07-WP6A-C-0010!!MSW-E.DOC 29/06/2012 29/06/2012
Thomson Broadcast & Multimedia assisted in setting up the digital medium wave transmitter, using the AIR 100 kW medium wave transmitter TMW 2100D from the M2W line. Thomson also provided the DRM digital front-end, including the Thomson STRATUS DRM modulator, and the CIRRUS DRM multiplexer. Figure 4.2 shows this infrastructure.
FIGURE 4.2
Simulcast transmission system scheme
DRM/DIMDI/MCI
CIRRUSDRM Multiplexer
STRATUSDRM Modulator
TMW 2100DDRM Transmitter
IQ BasebandAES/EBU
666 kHz
M W TX100 kW carrier power AM70 kW DRM mean power
2 ATUconsisting of
blocking filter & matching unit
Self-
Rad
iatin
g M
ast
/4 /
115
mλ
DRM multiplexer
Cirrus is a flexible multiplexer capable of handling the encoding of up to 4 audio and/or data services with different protection levels for each service. Cirrus also generates the multiplexed stream and provides the DRM/DI MDI or MDI+MCI stream for the modulators. The multiplexed stream can be generated from any of the audio and/or data encoded sources and/or from pre-recorded files using either EEP (Equal Error Protection) or UEP (Unequal Error Protection) mode. The program transmitted for the simulcast trials came from a CD.
DRM modulator
The DRM modulator model Stratus is designed to feed either linear amplification transmitters or any AM broadcasting transmitter (PDM/PSM type, Direct Digital Synthesis type, etc.). This modulator takes the DRM/DI stream coming from Cirrus and delivers the IQ baseband AES/EBU signal to feed the Thomson M2W transmitter. Stratus can also deliver phase and amplitude modulated RF or phase modulated RF as well as an analogue envelope. A special feature is the RF feedback which performs automatic and dynamic delay adjustment, ensuring an optimal output signal quality at any frequency.
DRM transmitter
The Thomson M2W line was designed and delivered ready for DRM, requiring merely the integration of the digital front-end itself for performing DRM operation. The transmitter had been taken into analogue service by AIR earlier this year at this broadcast station. Factory equipped for digital AM, this type of transmitter allows broadcasters to switch modes with a simple push of a button. The broadcasting of AM and DRM simulcast signal was carried out by making a change in All India Radio’s transmitting infrastructure. The transmitter that AIR has in the centre of Nangli usually transmits an analogue AM power of 100 kWatt. During these tests, AM-DRM simulcast equipment was installed.
- 12 - 6D/10-E
MACINTOSH HD:USERS:NIGELLAFLIN:DROPBOX:DIGITAL RADIO:DRM:BUG:ITU DOCS:R07-WP6A-C-0010!!MSW-E.DOC 29/06/2012 29/06/2012
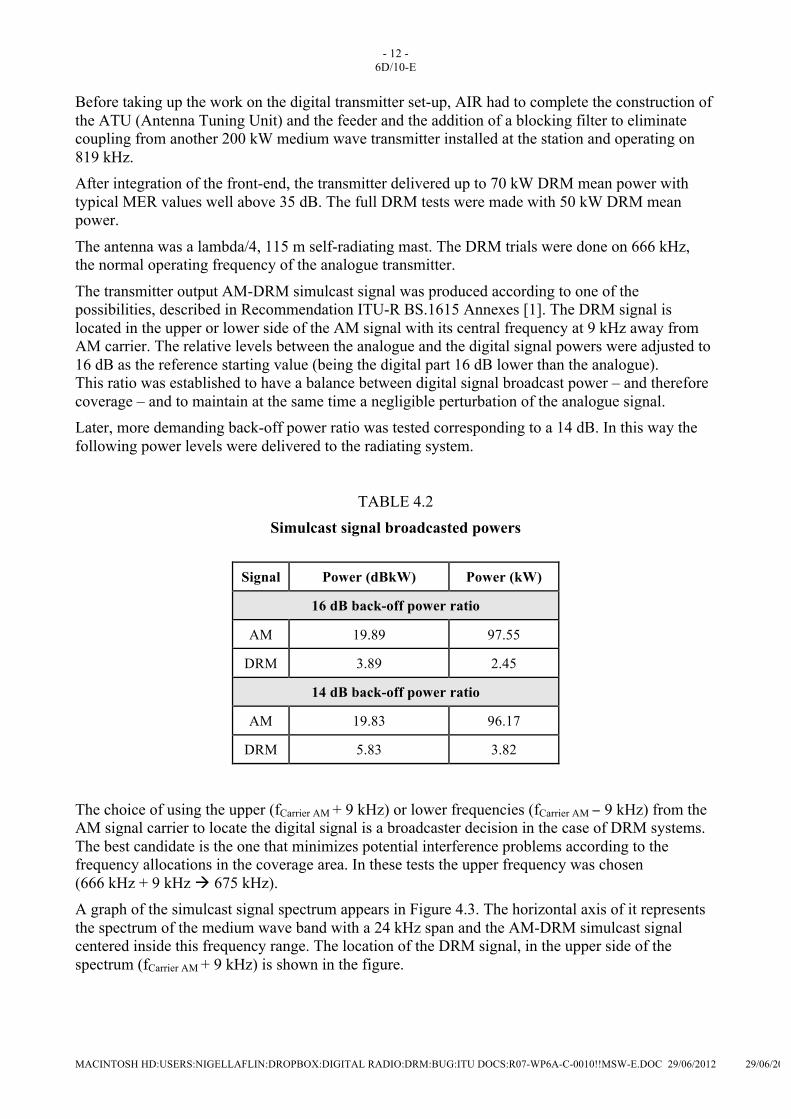
Before taking up the work on the digital transmitter set-up, AIR had to complete the construction of the ATU (Antenna Tuning Unit) and the feeder and the addition of a blocking filter to eliminate coupling from another 200 kW medium wave transmitter installed at the station and operating on 819 kHz. After integration of the front-end, the transmitter delivered up to 70 kW DRM mean power with typical MER values well above 35 dB. The full DRM tests were made with 50 kW DRM mean power.
The antenna was a lambda/4, 115 m self-radiating mast. The DRM trials were done on 666 kHz, the normal operating frequency of the analogue transmitter.
The transmitter output AM-DRM simulcast signal was produced according to one of the possibilities, described in Recommendation ITU-R BS.1615 Annexes [1]. The DRM signal is located in the upper or lower side of the AM signal with its central frequency at 9 kHz away from AM carrier. The relative levels between the analogue and the digital signal powers were adjusted to 16 dB as the reference starting value (being the digital part 16 dB lower than the analogue). This ratio was established to have a balance between digital signal broadcast power – and therefore coverage – and to maintain at the same time a negligible perturbation of the analogue signal. Later, more demanding back-off power ratio was tested corresponding to a 14 dB. In this way the following power levels were delivered to the radiating system.
TABLE 4.2 Simulcast signal broadcasted powers
Signal Power (dBkW) Power (kW)
16 dB back-off power ratio
AM 19.89 97.55
DRM 3.89 2.45
14 dB back-off power ratio
AM 19.83 96.17
DRM 5.83 3.82
The choice of using the upper (fCarrier AM + 9 kHz) or lower frequencies (fCarrier AM − 9 kHz) from the AM signal carrier to locate the digital signal is a broadcaster decision in the case of DRM systems. The best candidate is the one that minimizes potential interference problems according to the frequency allocations in the coverage area. In these tests the upper frequency was chosen (666 kHz + 9 kHz 675 kHz). A graph of the simulcast signal spectrum appears in Figure 4.3. The horizontal axis of it represents the spectrum of the medium wave band with a 24 kHz span and the AM-DRM simulcast signal centered inside this frequency range. The location of the DRM signal, in the upper side of the spectrum (fCarrier AM + 9 kHz) is shown in the figure.

- 13 - 6D/10-E
MACINTOSH HD:USERS:NIGELLAFLIN:DROPBOX:DIGITAL RADIO:DRM:BUG:ITU DOCS:R07-WP6A-C-0010!!MSW-E.DOC 29/06/2012 29/06/2012
FIGURE 4.3
Simulcast signal spectrum broadcasted from Nangli MW transmitter
4.2.3 Summary of measured locations The DRM standard [2] provides several configurable transmission parameters that allow many different DRM transmission modes, with different robustness against noise, multipath or interference. The more robust the mode is, the less maximum subjective audio quality can be achieved due to a lower useful bit rate available. In order to evaluate the influence of each parameter, the modes chosen for the tests are shown in Table 4.3.
TABLE 4.3 Simulcast tested configurations
Name in Document
Bandwidth (kHz)
Back-off ratio (dB)
OFDM
MSC
SDC
Code Rate
Interleaver
Bite rate
(kbps)
9K_A/64/16/06 9 16 A 64QAM 16QAM 0.6 L (Long) 23.5
9K_A/64/16/06 9 14 A 64QAM 16QAM 0.6 L 23.5
9K_A/16/4/05 9 14 A 16QAM 4QAM 0.5 S (Short) 12.2
fDRM fcAM
9 kHz
Total BW: 18 kHz
Analog Part: 9 kHz DRM Part: 9 kHz

- 14 - 6D/10-E
MACINTOSH HD:USERS:NIGELLAFLIN:DROPBOX:DIGITAL RADIO:DRM:BUG:ITU DOCS:R07-WP6A-C-0010!!MSW-E.DOC 29/06/2012 29/06/2012
The first column of Table 4.3 is a reference code denoting a combination of parameters in the rest of this document. The DRM modes in Table 4.3 are ordered from less to more robust as can be deduced from the corresponding useful bit rate, which decreases from the top to the bottom of the table. The possible degradation of subjective quality of analogue signal due to the interference of the digital signal was also tested.
Different environments were considered within Delhi City being a set of representative reception areas of the city. The objective of this measurement block was to obtain the threshold levels for the digital system to work properly at representative reception conditions. The subjective quality of the received AM signal using a sample of the analogue receivers currently available at Indian Market was also analyzed. Most of the measurement campaign time was spent in measuring at pre-selected routes at different environments. Two kinds of measurements have been performed at each route: fixed reception at some locations and mobile reception. The measurements are associated with driving through a mixture of environments. Four static locations were measured altogether and the corresponding mobile measurement routes between two consecutive locations. In reception side of the experimental network, some analogue AM receivers were used in order to evaluate the analogue subjective audio quality.
Receivers
The subjective audio quality evaluation was carried out using a set of representative analogue AM receivers of the Indian Market. The following figures show two of these commercial receivers. The subjective audio quality assessment was carried out by AIR (All India Radio) staff, which means that the subjective evaluation was made by trained expert listeners. The list of the commercial receivers used in the trials follows:
1. Philips RL384
2. Sangean ATS818 CS 3. Sony ICF SW100
4. Proxy 5. Grundig
6. Kchibo
4.3 Field trials results
4.3.1 Results summary
The results have been divided in the different DRM usage modes and their results. Analysis for each mode comprises different subsections: The first one analyzes static reception quality and availability of DRM digital signal in New Delhi. The second subsection deals with the major conclusions obtained for the analogue AM signal subjective audio assessment and the back-off ratio of the broadcasted signals. In these subsections the AM-DRM compatibility is analysed considering the possible interference between analogue and digital signals. Finally, mobile measurements for each considered mode are analysed providing the service reliability and system thresholds for proper operation.
Sangean ATS818 CS
Sony ICF SW100

- 15 - 6D/10-E
MACINTOSH HD:USERS:NIGELLAFLIN:DROPBOX:DIGITAL RADIO:DRM:BUG:ITU DOCS:R07-WP6A-C-0010!!MSW-E.DOC 29/06/2012 29/06/2012
The last section compares the coverage area for both the AM and the DRM signals with a measured radial route towards the north direction of New Delhi City. The DRM signal was transmitted using a mode with lower robustness and non restrictive back-off ratio of 16 dB. That is A/64/16/06/L. To start with all static and mobile locations using this Simulcast configuration in urban environment will be analyzed.
After processing “on line” the obtained data, results showed that the system was working without problems, both with regard to the analogue and to the digital reception. Exception should be made for some isolated locations in mobile reception. In those locations, big noise sources and physical shielding by, bridges, tunnels and some high buildings made it impossible to receive any signal in the MW band. Using the selected mode with non restrictive 16 dB back-off power ratio, the AM subjective audio quality was rated as impaired by the digital part. This conclusion was raised after evaluating subjectively the reception by a team composed of staff from AIR. The next step consisted of decreasing the back-off ratio margin to 14 dB. The results for the DRM part were the same and the AM subjective audio quality was rated as good using a set of AM commercial receivers so the back off ratio was set to this value of 14 dB.
The final step was to try to improve coverage in those isolated locations with incorrect reception so, a more robust DRM mode was chosen in order to evaluate a possible improvement in DRM reception maintaining at the same time the AM analogue part reliability and coverage in urban environments like New Delhi.
In this case it was corroborated that most of times when ground wave propagated signal fails, the field strength nominal value decreases so much that even the robust mode cannot cope with this kind of impairments like tunnels or big noise sources. Even so, the advantage of using this mode is the rural coverage area increasing outside New Delhi.
The following tables show the summary of results:
TABLE 4.4 Summary of results for static locations
Location
Field strength
(dBµV/m)
Received SNR (dB)
AudioQ (% of
correctly received
audio frames)
Back-off (dB)
AM Quality
Distance to Tx (km)
1 (STIT) 81.67 30.37 100 –16.70 4 8.39 2 (Park) 74.63 33.49 100 –16.61 4 16.50 3 (Gandhi Monument) 75.56 27.01 100 –16.49 5 17.69 4 (NBH) 72.58 23.48 100 –16.19 5 17.36
- 16 - 6D/10-E
MACINTOSH HD:USERS:NIGELLAFLIN:DROPBOX:DIGITAL RADIO:DRM:BUG:ITU DOCS:R07-WP6A-C-0010!!MSW-E.DOC 29/06/2012 29/06/2012
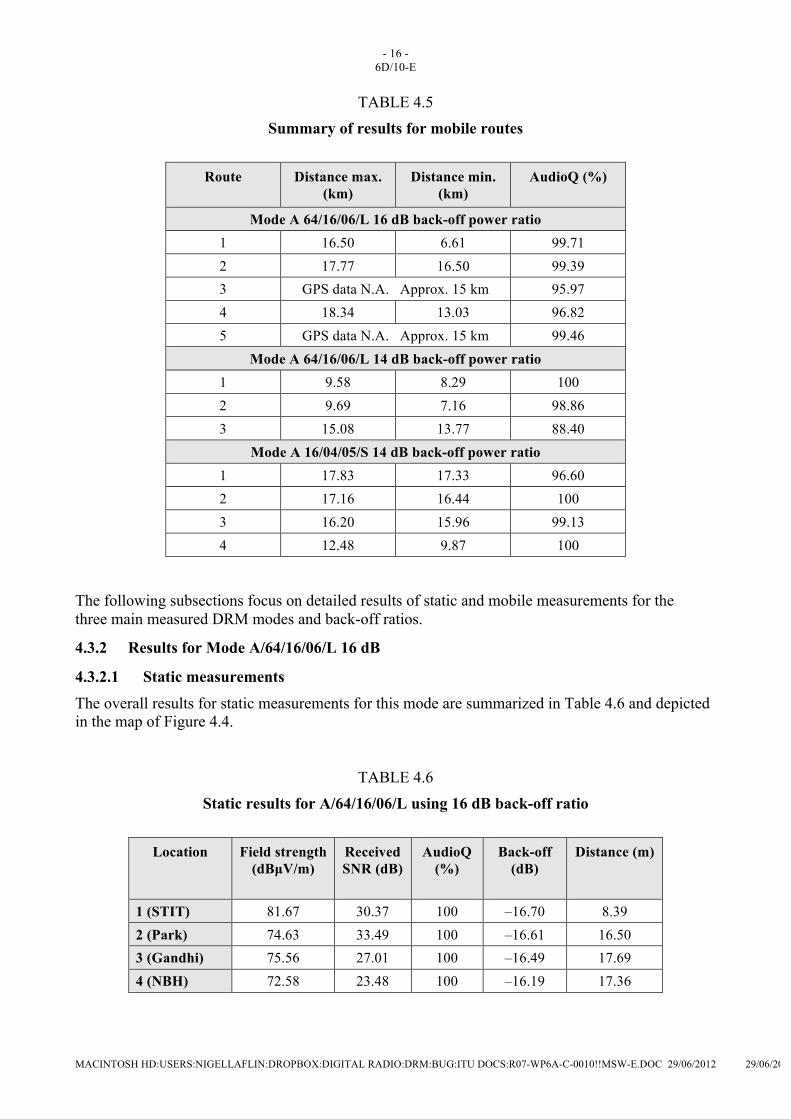
TABLE 4.5 Summary of results for mobile routes
Route
Distance max.
(km) Distance min.
(km) AudioQ (%)
Mode A 64/16/06/L 16 dB back-off power ratio 1 16.50 6.61 99.71 2 17.77 16.50 99.39 3 GPS data N.A. Approx. 15 km 95.97 4 18.34 13.03 96.82 5 GPS data N.A. Approx. 15 km 99.46
Mode A 64/16/06/L 14 dB back-off power ratio 1 9.58 8.29 100 2 9.69 7.16 98.86 3 15.08 13.77 88.40
Mode A 16/04/05/S 14 dB back-off power ratio 1 17.83 17.33 96.60 2 17.16 16.44 100 3 16.20 15.96 99.13 4 12.48 9.87 100
The following subsections focus on detailed results of static and mobile measurements for the three main measured DRM modes and back-off ratios.
4.3.2 Results for Mode A/64/16/06/L 16 dB
4.3.2.1 Static measurements
The overall results for static measurements for this mode are summarized in Table 4.6 and depicted in the map of Figure 4.4.
TABLE 4.6 Static results for A/64/16/06/L using 16 dB back-off ratio
Location
Field strength (dBµV/m)
Received SNR (dB)
AudioQ (%)
Back-off (dB)
Distance (m)
1 (STIT) 81.67 30.37 100 –16.70 8.39 2 (Park) 74.63 33.49 100 –16.61 16.50 3 (Gandhi) 75.56 27.01 100 –16.49 17.69 4 (NBH) 72.58 23.48 100 –16.19 17.36

- 17 - 6D/10-E
MACINTOSH HD:USERS:NIGELLAFLIN:DROPBOX:DIGITAL RADIO:DRM:BUG:ITU DOCS:R07-WP6A-C-0010!!MSW-E.DOC 29/06/2012 29/06/2012
The results show that the reception of the DRM Simulcast signal is perfectly demodulated in all kind of environments. The back-off ratio is not exactly the one defined by the transmitter due to the signal variability. It is a very stable signal as expected in medium wave ground propagated signal. The variances of the locations measured in this mode varies in a range between 0.06 and 0.24 dB The field strength ratio between AM and DRM can be found in Table 4.6. A similar coverage was expected for this system as it will be analyzed in the last subsection of this part of the document.
FIGURE 4.4
A/64/16/06/L 16 dB mode measured locations
Recommendation ITU-R P.368 [3] was used for predicting field strength values. The simulations were carried out using 10 mS/m and 1 mS/m conductivity values.
FIGURE 4.5
Field strength prediction according to Recommendation ITU-R P.368
60
65
70
75
80
85
90
95
100
7000 9000 11000 13000 15000 17000 19000 21000
Distance to TX (m)
Fiel
d St
reng
th (d
BuV
/m)
Prediction (1 mS/m)
Field
Prediction (10 mS/m)
- 18 - 6D/10-E
MACINTOSH HD:USERS:NIGELLAFLIN:DROPBOX:DIGITAL RADIO:DRM:BUG:ITU DOCS:R07-WP6A-C-0010!!MSW-E.DOC 29/06/2012 29/06/2012
It can be seen that the measured field strength fits well with dry terrain of 1 mS/m conductivity simulation values. This low conductivity can be applied to simulations in urban environments.
4.3.2.2 Subjective audio quality
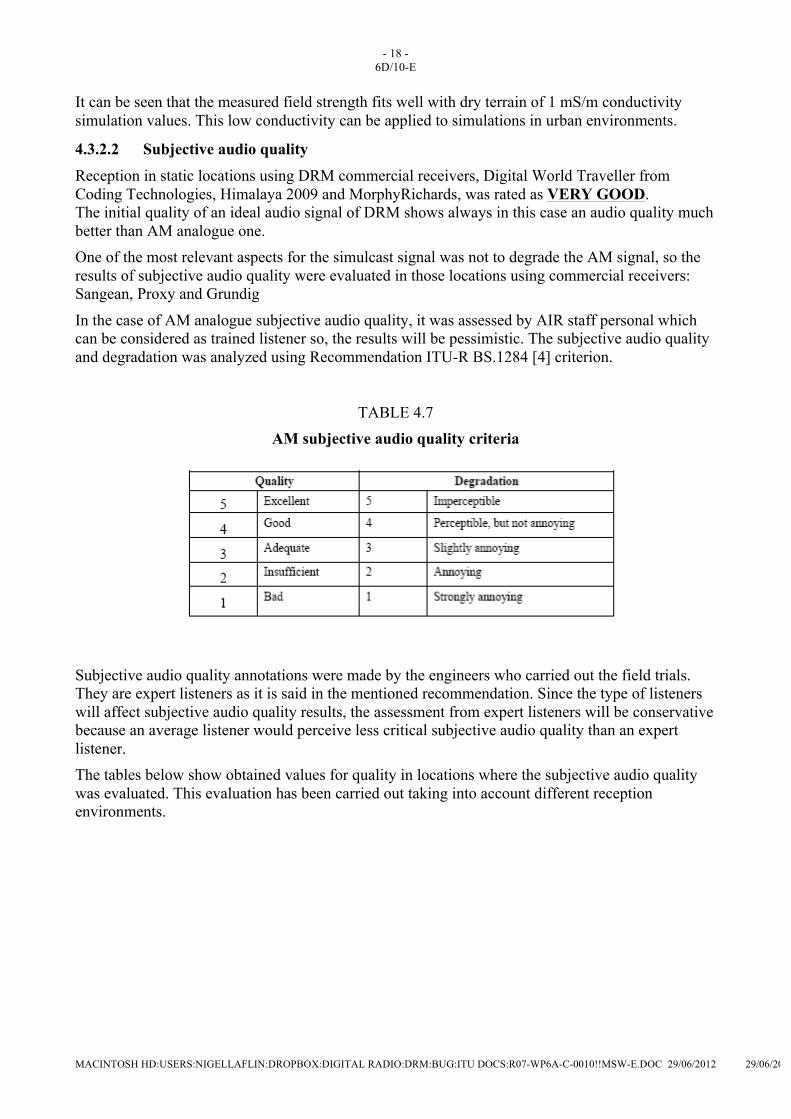
Reception in static locations using DRM commercial receivers, Digital World Traveller from Coding Technologies, Himalaya 2009 and MorphyRichards, was rated as VERY GOOD. The initial quality of an ideal audio signal of DRM shows always in this case an audio quality much better than AM analogue one. One of the most relevant aspects for the simulcast signal was not to degrade the AM signal, so the results of subjective audio quality were evaluated in those locations using commercial receivers: Sangean, Proxy and Grundig
In the case of AM analogue subjective audio quality, it was assessed by AIR staff personal which can be considered as trained listener so, the results will be pessimistic. The subjective audio quality and degradation was analyzed using Recommendation ITU-R BS.1284 [4] criterion.
TABLE 4.7 AM subjective audio quality criteria
Subjective audio quality annotations were made by the engineers who carried out the field trials. They are expert listeners as it is said in the mentioned recommendation. Since the type of listeners will affect subjective audio quality results, the assessment from expert listeners will be conservative because an average listener would perceive less critical subjective audio quality than an expert listener. The tables below show obtained values for quality in locations where the subjective audio quality was evaluated. This evaluation has been carried out taking into account different reception environments.
- 19 - 6D/10-E
MACINTOSH HD:USERS:NIGELLAFLIN:DROPBOX:DIGITAL RADIO:DRM:BUG:ITU DOCS:R07-WP6A-C-0010!!MSW-E.DOC 29/06/2012 29/06/2012
TABLE 4.8 AM Subjective audio quality for A/64/16/06/L using 16 dB back-off ratio
Manufacturer Sangean Proxy Grundig
Subjective audio quality rate
Location 1 4 5 5 Location 2 4 5 4 Location 3 5 5 5 Location 4 5 5 5
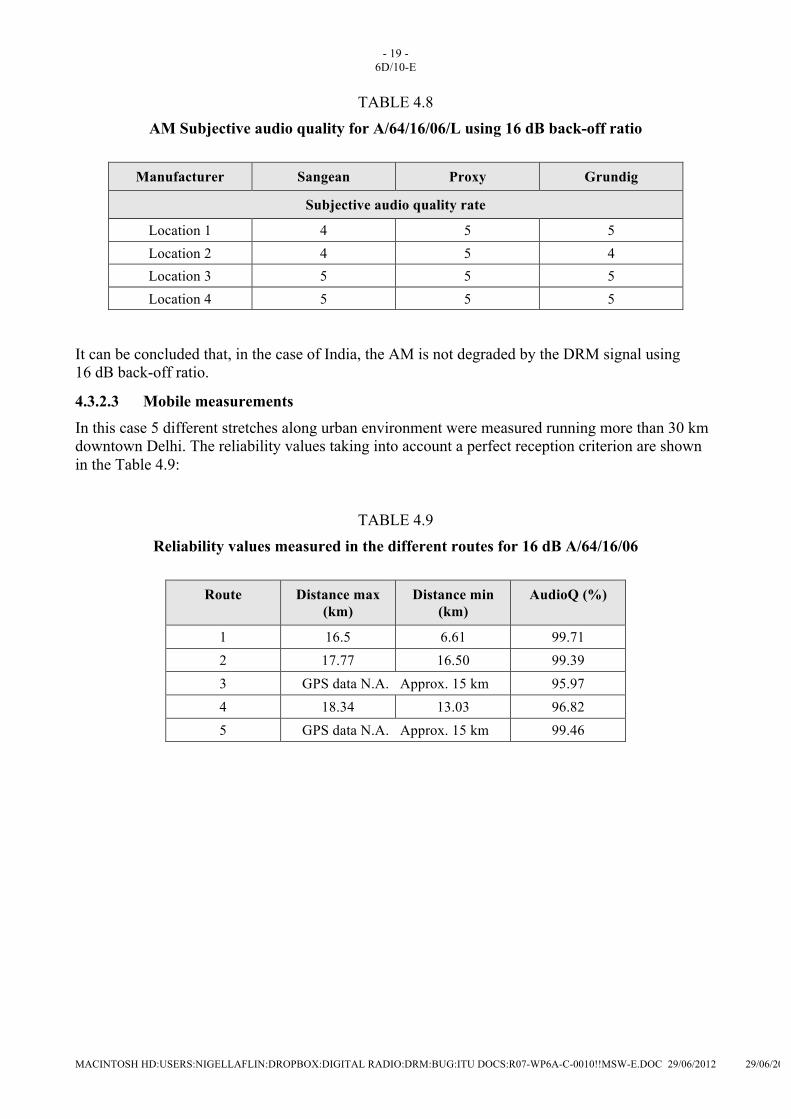
It can be concluded that, in the case of India, the AM is not degraded by the DRM signal using 16 dB back-off ratio.
4.3.2.3 Mobile measurements
In this case 5 different stretches along urban environment were measured running more than 30 km downtown Delhi. The reliability values taking into account a perfect reception criterion are shown in the Table 4.9:
TABLE 4.9 Reliability values measured in the different routes for 16 dB A/64/16/06
Route
Distance max
(km) Distance min
(km) AudioQ (%)
1 16.5 6.61 99.71 2 17.77 16.50 99.39 3 GPS data N.A. Approx. 15 km 95.97 4 18.34 13.03 96.82 5 GPS data N.A. Approx. 15 km 99.46
- 20 - 6D/10-E
MACINTOSH HD:USERS:NIGELLAFLIN:DROPBOX:DIGITAL RADIO:DRM:BUG:ITU DOCS:R07-WP6A-C-0010!!MSW-E.DOC 29/06/2012 29/06/2012
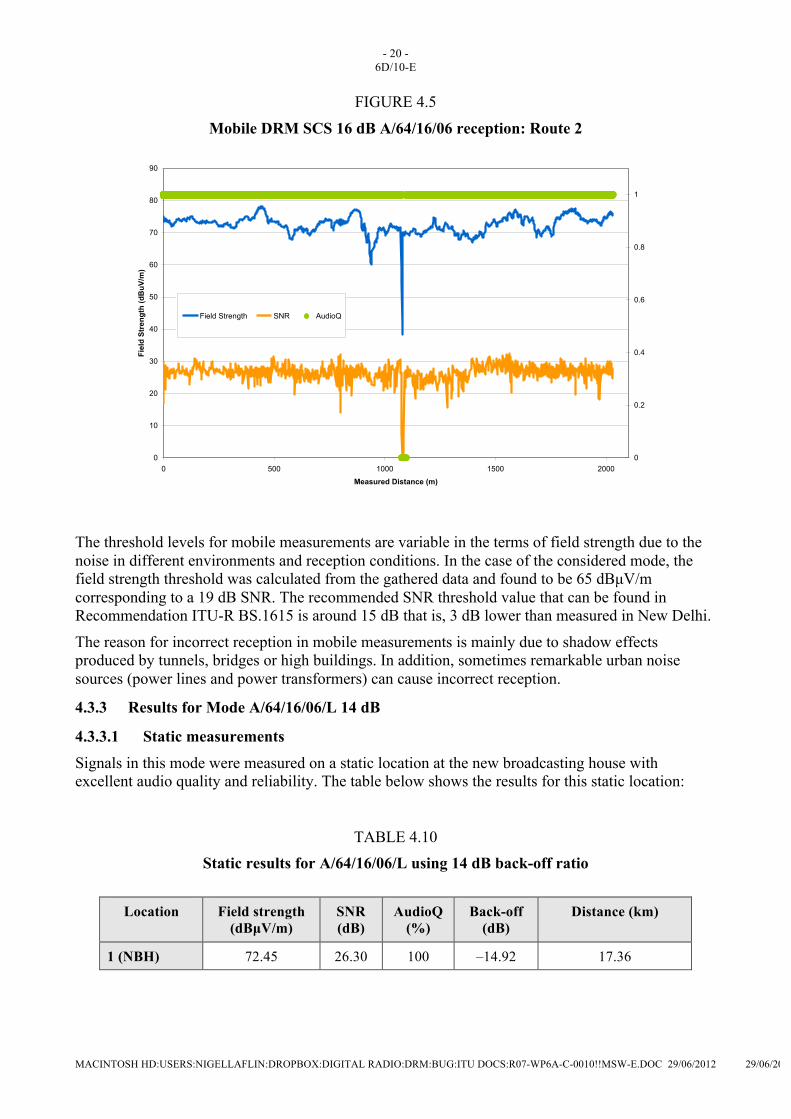
FIGURE 4.5
Mobile DRM SCS 16 dB A/64/16/06 reception: Route 2
0
10
20
30
40
50
60
70
80
90
0 500 1000 1500 2000
Measured Distance (m)
Fiel
d St
reng
th (d
BuV
/m)
0
0.2
0.4
0.6
0.8
1
Field Strength SNR AudioQ
The threshold levels for mobile measurements are variable in the terms of field strength due to the noise in different environments and reception conditions. In the case of the considered mode, the field strength threshold was calculated from the gathered data and found to be 65 dBµV/m corresponding to a 19 dB SNR. The recommended SNR threshold value that can be found in Recommendation ITU-R BS.1615 is around 15 dB that is, 3 dB lower than measured in New Delhi.
The reason for incorrect reception in mobile measurements is mainly due to shadow effects produced by tunnels, bridges or high buildings. In addition, sometimes remarkable urban noise sources (power lines and power transformers) can cause incorrect reception.
4.3.3 Results for Mode A/64/16/06/L 14 dB
4.3.3.1 Static measurements
Signals in this mode were measured on a static location at the new broadcasting house with excellent audio quality and reliability. The table below shows the results for this static location:
TABLE 4.10 Static results for A/64/16/06/L using 14 dB back-off ratio
Location
Field strength
(dBµV/m) SNR (dB)
AudioQ (%)
Back-off (dB)
Distance (km)
1 (NBH) 72.45 26.30 100 –14.92 17.36

- 21 - 6D/10-E
MACINTOSH HD:USERS:NIGELLAFLIN:DROPBOX:DIGITAL RADIO:DRM:BUG:ITU DOCS:R07-WP6A-C-0010!!MSW-E.DOC 29/06/2012 29/06/2012
The variability of the signal has a standard deviation of 1.2 dB so it is more variable than the previous measurements (see previous subsection) but it is still very stable. It can be seen that the results are similar to the previous measurements using 16 dB back off power ratio, excepting this power ratio value which has decreased to 14 dB providing more DRM signal broadcasted power.
4.3.3.2 Subjective audio quality
Once the reliability of the DRM signal in the simulcast configuration is assessed, taking into account that the only difference is the used back off ratio compared with previous measurements, the most important question to be analyzed is the AM signal subjective quality evaluated by different listeners. The following table shows the evaluation of the AM audio quality rated from 1 to 5 by All India Radio`s staff and different participants of the Showcase.
TABLE 4.11 AM subjective audio quality for A/64/16/06/L using 14 dB back-off ratio
Receiver Rate
PHILIPS RL384 5 SANGEAN-ATS 818 CS 5 SONY-ICFSW100 4 PROXY 4 GRUNDIG 4 KCHIBO 3
The conclusion of the assessment of analogue AM subjective audio quality is that the DRM presence in the simulcast signal does not degrade the AM analogue signal using a back-off ratio of 14 dB and using a set of representative commercial receivers in New Delhi.
In this case, the evaluation of DRM subjective audio quality was rated as GOOD and every time was much better than the AM subjective audio quality at the new broadcasting house.
4.3.3.3 Mobile measurements
Mobile measurements show similar results. In comparison to the previous mode used, this mode can provide some advantages compared with transmitting 16 dB back-off ratio. Analyzing the coverage results outside the city, the considered mode in this section would provide larger coverage area because the broadcasted power is higher. The following table shows the reliability values for mobile reception:
TABLE 4.12 Reliability values measured in the different routes for 14 dB A/64/16/06
Route
Distance max (km)
Distance min (km)
AudioQ (%)
1 9.58 8.29 100 2 9.69 7.16 98.86 3 15.08 13.77 88.40
- 22 - 6D/10-E
MACINTOSH HD:USERS:NIGELLAFLIN:DROPBOX:DIGITAL RADIO:DRM:BUG:ITU DOCS:R07-WP6A-C-0010!!MSW-E.DOC 29/06/2012 29/06/2012
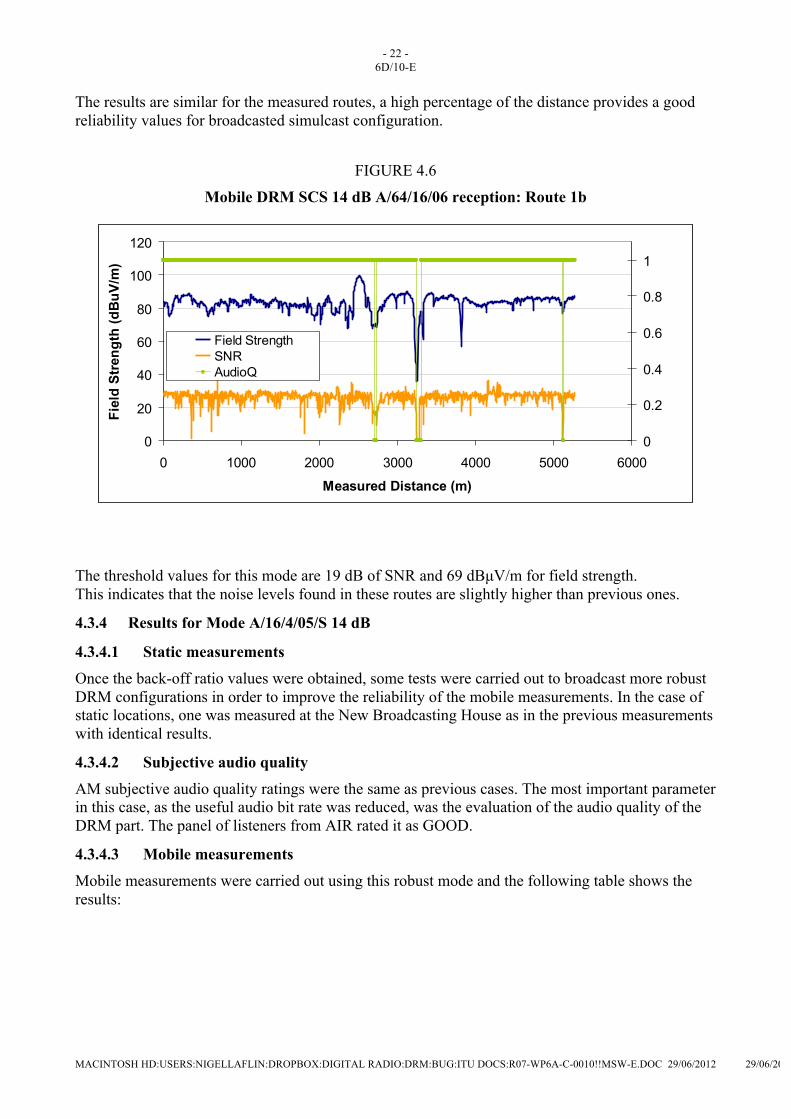
The results are similar for the measured routes, a high percentage of the distance provides a good reliability values for broadcasted simulcast configuration.
FIGURE 4.6
Mobile DRM SCS 14 dB A/64/16/06 reception: Route 1b
0
20
40
60
80
100
120
0 1000 2000 3000 4000 5000 6000
Measured Distance (m)
Fiel
d St
reng
th (d
BuV
/m)
0
0.2
0.4
0.6
0.8
1
Field StrengthSNRAudioQ
The threshold values for this mode are 19 dB of SNR and 69 dBµV/m for field strength. This indicates that the noise levels found in these routes are slightly higher than previous ones.
4.3.4 Results for Mode A/16/4/05/S 14 dB
4.3.4.1 Static measurements
Once the back-off ratio values were obtained, some tests were carried out to broadcast more robust DRM configurations in order to improve the reliability of the mobile measurements. In the case of static locations, one was measured at the New Broadcasting House as in the previous measurements with identical results.
4.3.4.2 Subjective audio quality
AM subjective audio quality ratings were the same as previous cases. The most important parameter in this case, as the useful audio bit rate was reduced, was the evaluation of the audio quality of the DRM part. The panel of listeners from AIR rated it as GOOD.
4.3.4.3 Mobile measurements
Mobile measurements were carried out using this robust mode and the following table shows the results:
- 23 - 6D/10-E
MACINTOSH HD:USERS:NIGELLAFLIN:DROPBOX:DIGITAL RADIO:DRM:BUG:ITU DOCS:R07-WP6A-C-0010!!MSW-E.DOC 29/06/2012 29/06/2012
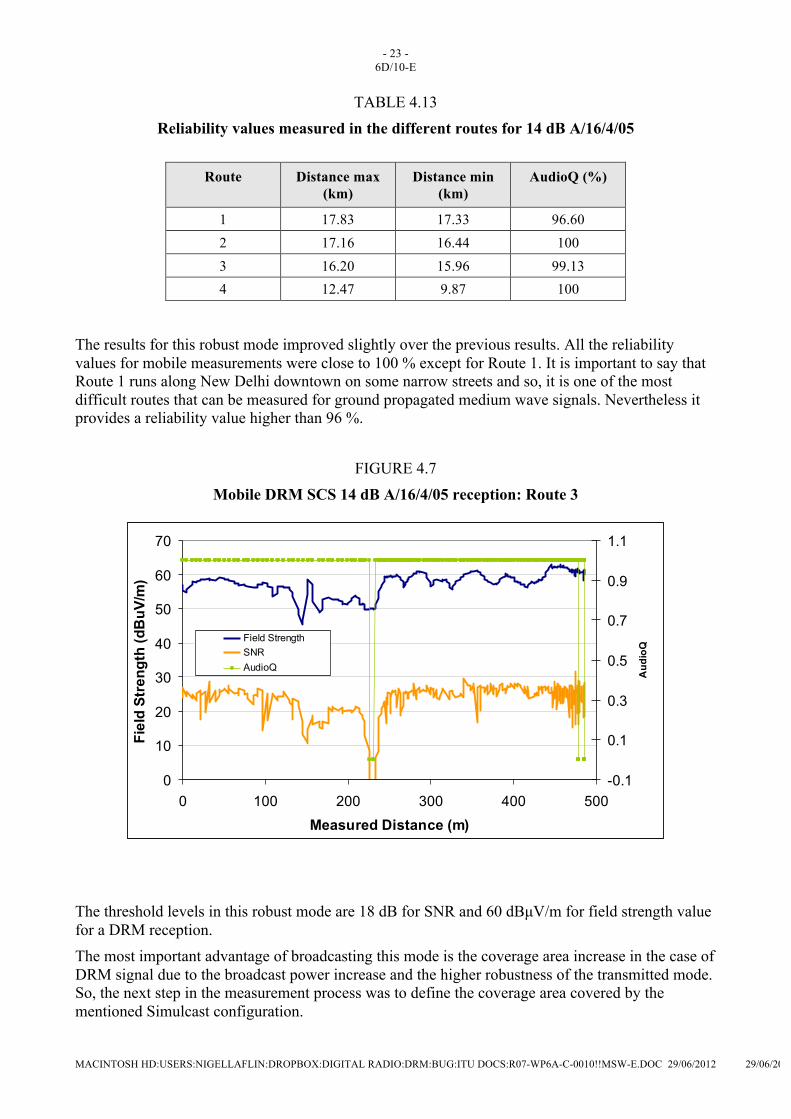
TABLE 4.13 Reliability values measured in the different routes for 14 dB A/16/4/05
Route
Distance max
(km) Distance min
(km) AudioQ (%)
1 17.83 17.33 96.60 2 17.16 16.44 100 3 16.20 15.96 99.13 4 12.47 9.87 100
The results for this robust mode improved slightly over the previous results. All the reliability values for mobile measurements were close to 100 % except for Route 1. It is important to say that Route 1 runs along New Delhi downtown on some narrow streets and so, it is one of the most difficult routes that can be measured for ground propagated medium wave signals. Nevertheless it provides a reliability value higher than 96 %.
FIGURE 4.7 Mobile DRM SCS 14 dB A/16/4/05 reception: Route 3
0
10
20
30
40
50
60
70
0 100 200 300 400 500Measured Distance (m)
Fiel
d St
reng
th (d
BuV
/m)
-0.1
0.1
0.3
0.5
0.7
0.9
1.1
Aud
ioQ
Field StrengthSNRAudioQ
The threshold levels in this robust mode are 18 dB for SNR and 60 dBµV/m for field strength value for a DRM reception. The most important advantage of broadcasting this mode is the coverage area increase in the case of DRM signal due to the broadcast power increase and the higher robustness of the transmitted mode. So, the next step in the measurement process was to define the coverage area covered by the mentioned Simulcast configuration.
- 24 - 6D/10-E
MACINTOSH HD:USERS:NIGELLAFLIN:DROPBOX:DIGITAL RADIO:DRM:BUG:ITU DOCS:R07-WP6A-C-0010!!MSW-E.DOC 29/06/2012 29/06/2012
4.4 Coverage
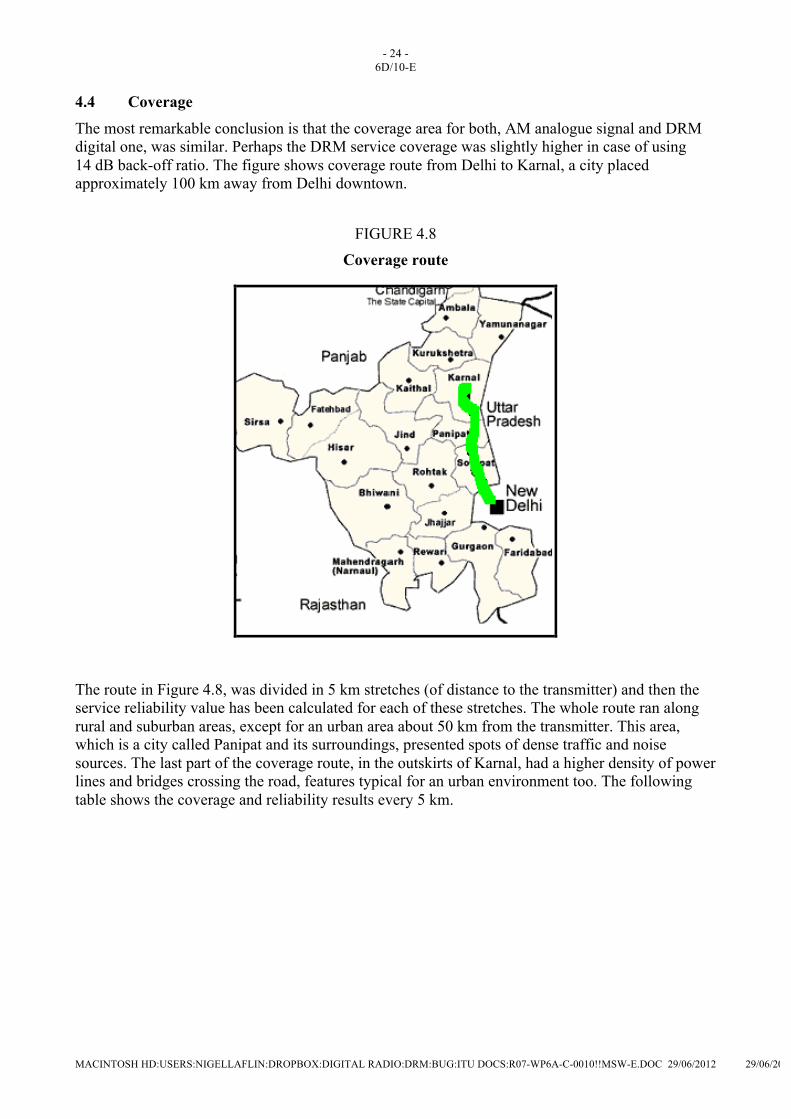
The most remarkable conclusion is that the coverage area for both, AM analogue signal and DRM digital one, was similar. Perhaps the DRM service coverage was slightly higher in case of using 14 dB back-off ratio. The figure shows coverage route from Delhi to Karnal, a city placed approximately 100 km away from Delhi downtown.
FIGURE 4.8 Coverage route
The route in Figure 4.8, was divided in 5 km stretches (of distance to the transmitter) and then the service reliability value has been calculated for each of these stretches. The whole route ran along rural and suburban areas, except for an urban area about 50 km from the transmitter. This area, which is a city called Panipat and its surroundings, presented spots of dense traffic and noise sources. The last part of the coverage route, in the outskirts of Karnal, had a higher density of power lines and bridges crossing the road, features typical for an urban environment too. The following table shows the coverage and reliability results every 5 km.
- 25 - 6D/10-E
MACINTOSH HD:USERS:NIGELLAFLIN:DROPBOX:DIGITAL RADIO:DRM:BUG:ITU DOCS:R07-WP6A-C-0010!!MSW-E.DOC 29/06/2012 29/06/2012
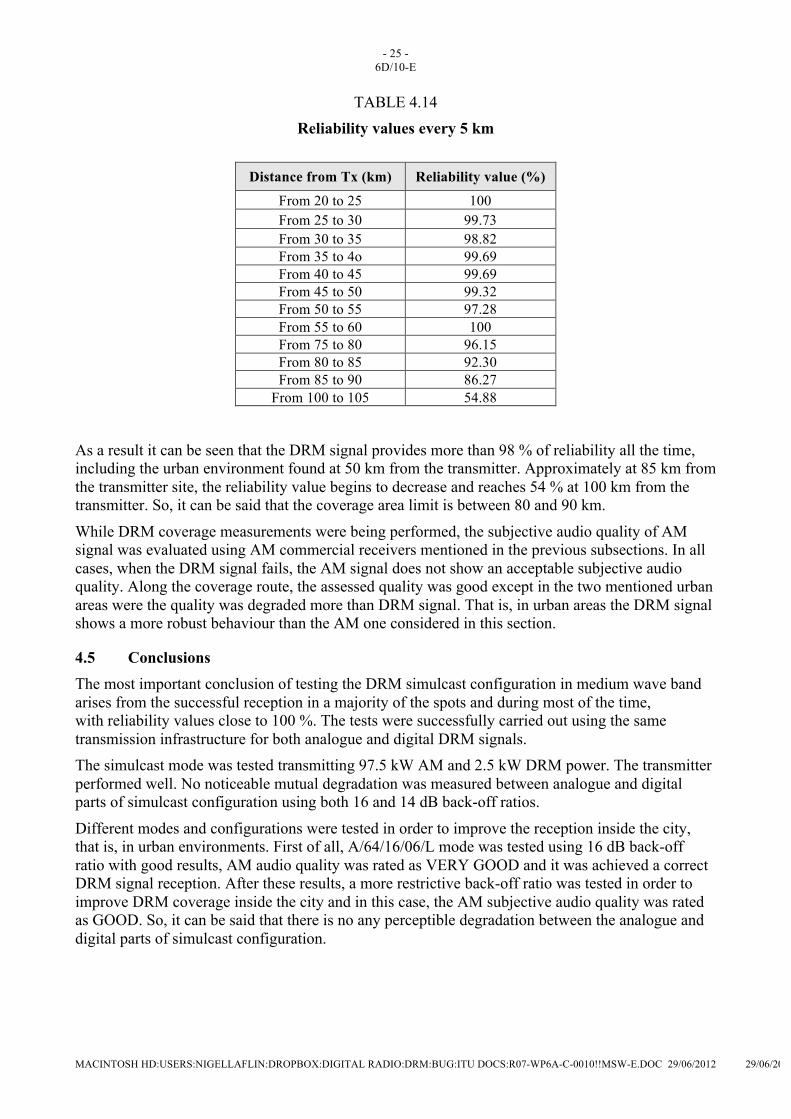
TABLE 4.14 Reliability values every 5 km
Distance from Tx (km) Reliability value (%)
From 20 to 25 100 From 25 to 30 99.73 From 30 to 35 98.82 From 35 to 4o 99.69 From 40 to 45 99.69 From 45 to 50 99.32 From 50 to 55 97.28 From 55 to 60 100 From 75 to 80 96.15 From 80 to 85 92.30 From 85 to 90 86.27
From 100 to 105 54.88
As a result it can be seen that the DRM signal provides more than 98 % of reliability all the time, including the urban environment found at 50 km from the transmitter. Approximately at 85 km from the transmitter site, the reliability value begins to decrease and reaches 54 % at 100 km from the transmitter. So, it can be said that the coverage area limit is between 80 and 90 km.
While DRM coverage measurements were being performed, the subjective audio quality of AM signal was evaluated using AM commercial receivers mentioned in the previous subsections. In all cases, when the DRM signal fails, the AM signal does not show an acceptable subjective audio quality. Along the coverage route, the assessed quality was good except in the two mentioned urban areas were the quality was degraded more than DRM signal. That is, in urban areas the DRM signal shows a more robust behaviour than the AM one considered in this section.
4.5 Conclusions The most important conclusion of testing the DRM simulcast configuration in medium wave band arises from the successful reception in a majority of the spots and during most of the time, with reliability values close to 100 %. The tests were successfully carried out using the same transmission infrastructure for both analogue and digital DRM signals. The simulcast mode was tested transmitting 97.5 kW AM and 2.5 kW DRM power. The transmitter performed well. No noticeable mutual degradation was measured between analogue and digital parts of simulcast configuration using both 16 and 14 dB back-off ratios.
Different modes and configurations were tested in order to improve the reception inside the city, that is, in urban environments. First of all, A/64/16/06/L mode was tested using 16 dB back-off ratio with good results, AM audio quality was rated as VERY GOOD and it was achieved a correct DRM signal reception. After these results, a more restrictive back-off ratio was tested in order to improve DRM coverage inside the city and in this case, the AM subjective audio quality was rated as GOOD. So, it can be said that there is no any perceptible degradation between the analogue and digital parts of simulcast configuration.
- 26 - 6D/10-E
MACINTOSH HD:USERS:NIGELLAFLIN:DROPBOX:DIGITAL RADIO:DRM:BUG:ITU DOCS:R07-WP6A-C-0010!!MSW-E.DOC 29/06/2012 29/06/2012
As regards to the mode A/64/16/06/L, it was observed that there were some spots with no useable reception (corresponding to tunnels, bridges and big noise sources), so these spots were tested using a more robust mode with short interleaving: A/64/16/05/S. The reception was excellent but due to the propagation features, that is, ground wave propagation, the similar critical spots can still be found inside the city downtown.
Finally AM and DRM coverage were compared along a radial route up to 100 km away from the city and both showed equal results. Coverage radius was found as 80 km away from the transmitter and worked well inside some urban areas along the mentioned radial route. Simulcast is an excellent method for making a smooth transition to DRM. Compatible with frequency planning, simulcast causes only negligible impairments on AM reception. The implementation on DRM compliant transmitters is quite cost effective.
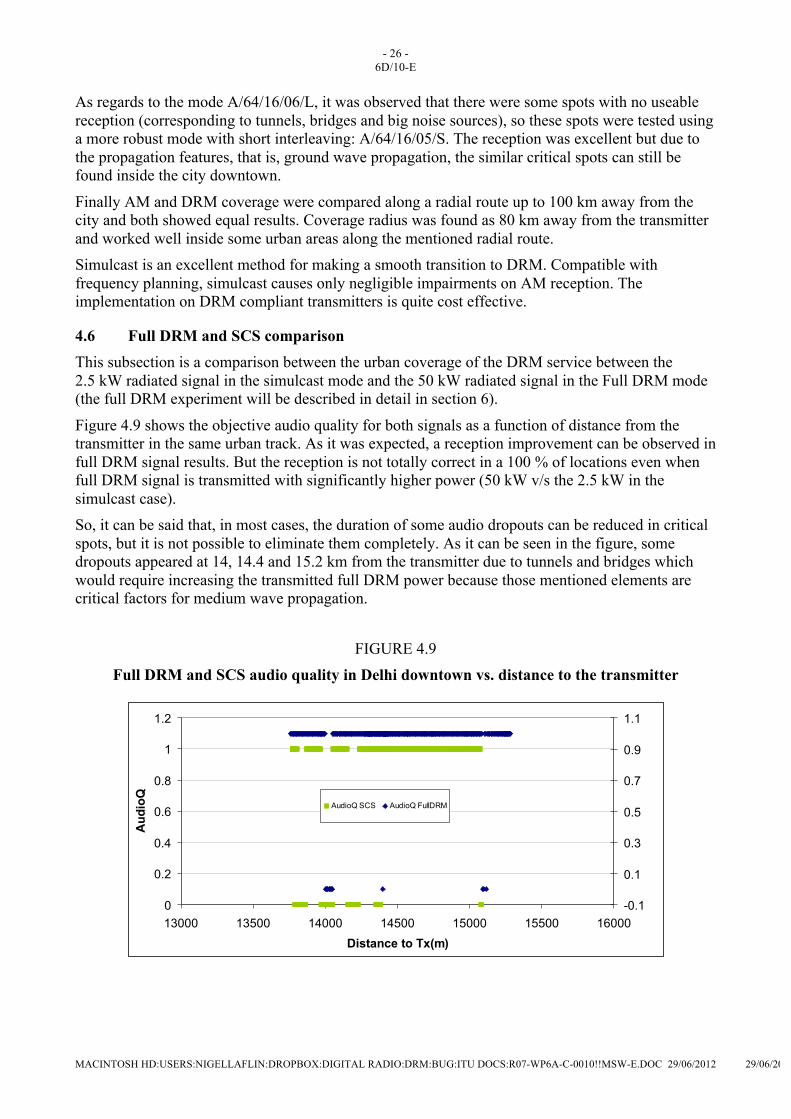
4.6 Full DRM and SCS comparison This subsection is a comparison between the urban coverage of the DRM service between the 2.5 kW radiated signal in the simulcast mode and the 50 kW radiated signal in the Full DRM mode (the full DRM experiment will be described in detail in section 6).
Figure 4.9 shows the objective audio quality for both signals as a function of distance from the transmitter in the same urban track. As it was expected, a reception improvement can be observed in full DRM signal results. But the reception is not totally correct in a 100 % of locations even when full DRM signal is transmitted with significantly higher power (50 kW v/s the 2.5 kW in the simulcast case). So, it can be said that, in most cases, the duration of some audio dropouts can be reduced in critical spots, but it is not possible to eliminate them completely. As it can be seen in the figure, some dropouts appeared at 14, 14.4 and 15.2 km from the transmitter due to tunnels and bridges which would require increasing the transmitted full DRM power because those mentioned elements are critical factors for medium wave propagation.
FIGURE 4.9 Full DRM and SCS audio quality in Delhi downtown vs. distance to the transmitter
0
0.2
0.4
0.6
0.8
1
1.2
13000 13500 14000 14500 15000 15500 16000Distance to Tx(m)
Aud
ioQ
-0.1
0.1
0.3
0.5
0.7
0.9
1.1
AudioQ SCS AudioQ FullDRM
- 27 - 6D/10-E
MACINTOSH HD:USERS:NIGELLAFLIN:DROPBOX:DIGITAL RADIO:DRM:BUG:ITU DOCS:R07-WP6A-C-0010!!MSW-E.DOC 29/06/2012 29/06/2012
To sum up, it can be said that the reception quality improves increasing the transmitted power but it is not enough to cope with medium wave propagation critical factors such as tunnels and man-made noise spots.
5 Local coverage using the 26 MHz band
5.1 Introduction
The 26 MHz broadcasting band has been traditionally used for long distance transmission through ionospheric propagation. However, using “line of sight” propagation techniques, similar to the ones used by the FM broadcasting, the 26 MHz broadcasting band can be used for providing digital radio services to local areas.
In this section the results of the tests carried out in New Delhi with the DRM system in the 26 MHz broadcasting band for local coverage are summarized. The relevance of these trials is that local radio coverage is possible with good audio quality using only low power transmitters.
5.2 Trial description
First of all, the objectives of the trials will be summarized. Then, the transmission network will be described and finally a summary of the measurement campaign will be exposed.
5.2.1 Objectives
The main objective of these trials is to demonstrate that the 26 MHz band can be used for local DRM coverage with good audio quality using low power transmitters. For this purpose, the following tasks were carried out: – an analysis of the system behavior in urban areas in static and mobile conditions; – a comparison of the measured results with existing prediction models.
5.2.2 Transmission system
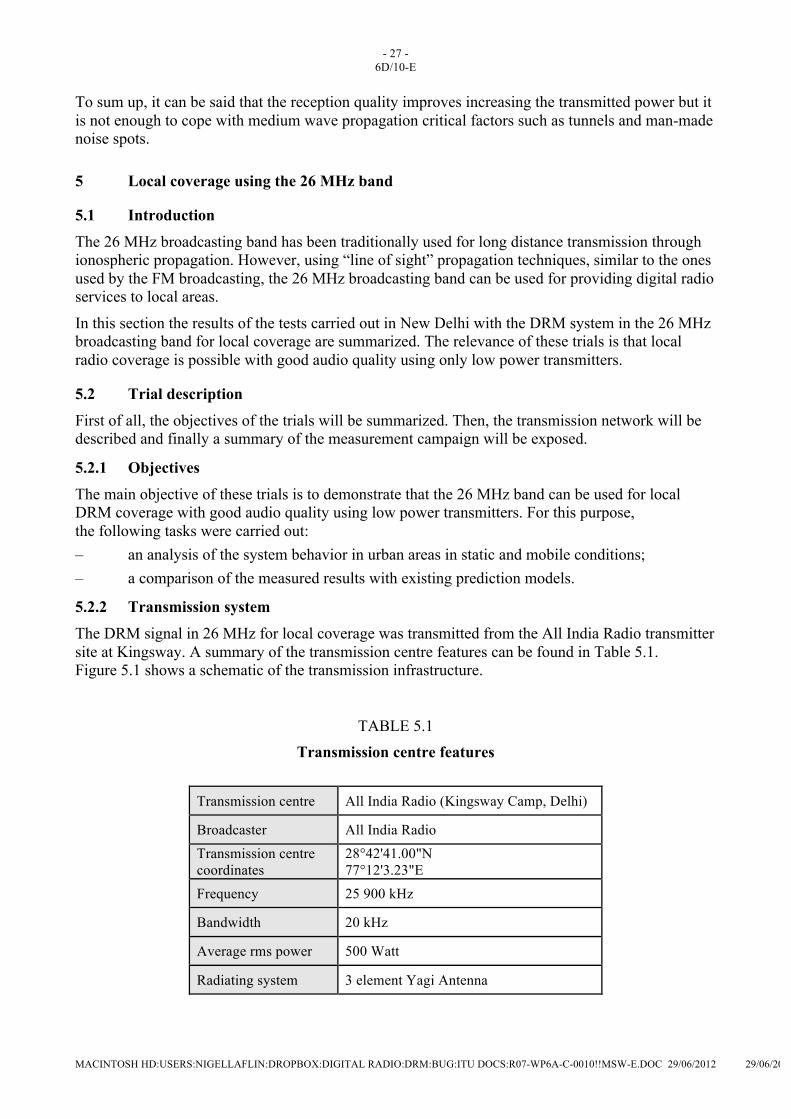
The DRM signal in 26 MHz for local coverage was transmitted from the All India Radio transmitter site at Kingsway. A summary of the transmission centre features can be found in Table 5.1. Figure 5.1 shows a schematic of the transmission infrastructure.
TABLE 5.1 Transmission centre features
Transmission centre All India Radio (Kingsway Camp, Delhi)
Broadcaster All India Radio
Transmission centre coordinates
28°42'41.00"N 77°12'3.23"E
Frequency 25 900 kHz
Bandwidth 20 kHz
Average rms power 500 Watt
Radiating system 3 element Yagi Antenna

- 28 - 6D/10-E
MACINTOSH HD:USERS:NIGELLAFLIN:DROPBOX:DIGITAL RADIO:DRM:BUG:ITU DOCS:R07-WP6A-C-0010!!MSW-E.DOC 29/06/2012 29/06/2012
FIGURE 5.1
26 MHz transmission infrastructure
In this test the same encoder/exciter set was used for DRM signal generation. For the sake of briefness, a detailed explanation is found in section 5.2.2 of this document.
The radiating system consisted of a 3 element Yagi antenna with enough directivity to achieve local coverage and at the same time avoid ionospheric interference. The antenna was placed on a 40 metre height tower. Elevated locations are required to provide coverage by means of line of sight propagation.
5.2.3 Summary of measurement campaign Based on other measurement campaigns carried out in Mexico [5] and Brazil [6], the following DRM transmission mode was selected for the trial:

- 29 - 6D/10-E
MACINTOSH HD:USERS:NIGELLAFLIN:DROPBOX:DIGITAL RADIO:DRM:BUG:ITU DOCS:R07-WP6A-C-0010!!MSW-E.DOC 29/06/2012 29/06/2012
TABLE 5.2 Tested DRM configuration
Bandwidth (kHz)
OFDM
MSC
SDC
Code rate
Interleaver
Bite rate
(kbps)
20 B 16QAM 4QAM 0.5 L (Long) 21
Two types of measurements were carried out: fixed reception at 2 locations (Fig. 5.3) and mobile reception along 6 routes through the city. All the routes were measured between 4.5 and 7 km from the transmitter. The same measurement methodology was used for this frequency band.
FIGURE 5.2
Static locations for 26 MHz measurements
The objective again was to obtain the threshold levels for this system to work properly at representative reception conditions. However, as the propagation is based on line-of-sight, the analysis is significantly different.
5.3 Field trial results
5.3.1 Results summary
The following table summarizes the results obtained in the 2 static locations (Fig. 5.2.):
- 30 - 6D/10-E
MACINTOSH HD:USERS:NIGELLAFLIN:DROPBOX:DIGITAL RADIO:DRM:BUG:ITU DOCS:R07-WP6A-C-0010!!MSW-E.DOC 29/06/2012 29/06/2012
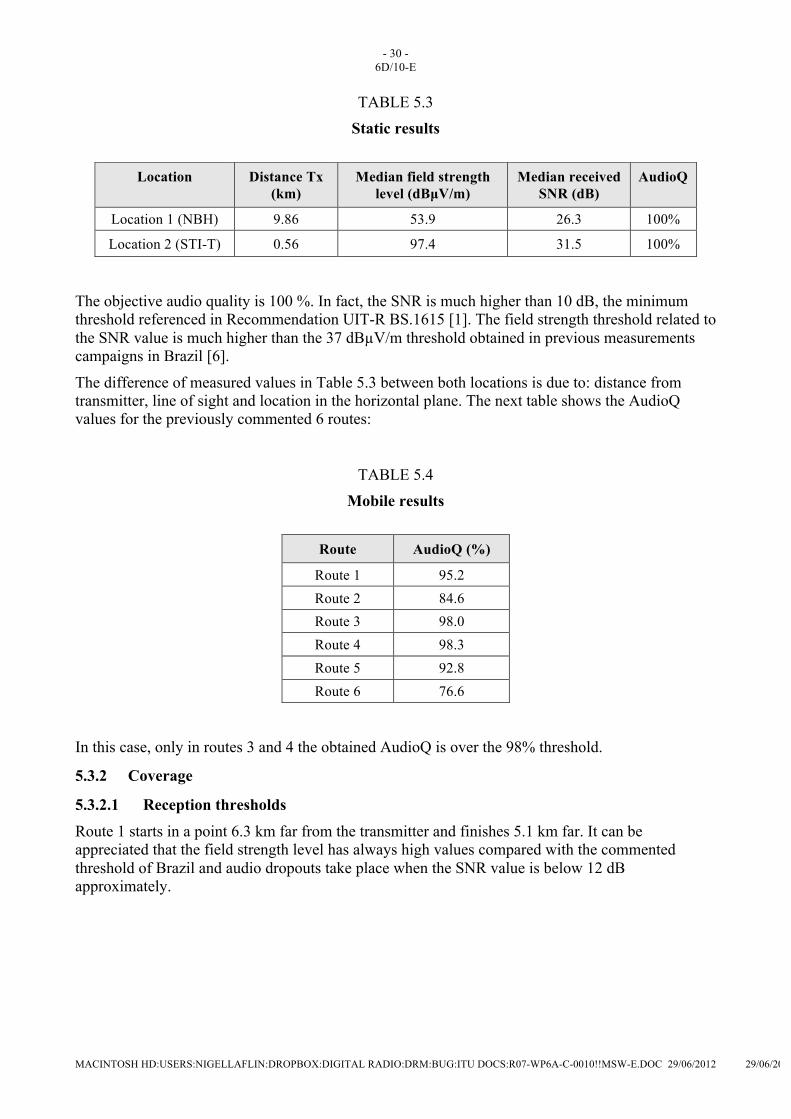
TABLE 5.3 Static results
The objective audio quality is 100 %. In fact, the SNR is much higher than 10 dB, the minimum threshold referenced in Recommendation UIT-R BS.1615 [1]. The field strength threshold related to the SNR value is much higher than the 37 dBµV/m threshold obtained in previous measurements campaigns in Brazil [6].
The difference of measured values in Table 5.3 between both locations is due to: distance from transmitter, line of sight and location in the horizontal plane. The next table shows the AudioQ values for the previously commented 6 routes:
TABLE 5.4 Mobile results
Route AudioQ (%)
Route 1 95.2 Route 2 84.6 Route 3 98.0 Route 4 98.3 Route 5 92.8 Route 6 76.6
In this case, only in routes 3 and 4 the obtained AudioQ is over the 98% threshold.
5.3.2 Coverage
5.3.2.1 Reception thresholds
Route 1 starts in a point 6.3 km far from the transmitter and finishes 5.1 km far. It can be appreciated that the field strength level has always high values compared with the commented threshold of Brazil and audio dropouts take place when the SNR value is below 12 dB approximately.
Location
Distance Tx (km)
Median field strength level (dBµV/m)
Median received SNR (dB)
AudioQ
Location 1 (NBH) 9.86 53.9 26.3 100%
Location 2 (STI-T) 0.56 97.4 31.5 100%

- 31 - 6D/10-E
MACINTOSH HD:USERS:NIGELLAFLIN:DROPBOX:DIGITAL RADIO:DRM:BUG:ITU DOCS:R07-WP6A-C-0010!!MSW-E.DOC 29/06/2012 29/06/2012
FIGURE 5.3
Mobile DRM 26 MHz reception: Route 1 Mobile DRM Reception. Route 1
0102030405060708090
0 500 1000 1500 2000 2500
Travelled Distance (m.)
Fiel
d St
reng
th L
evel
(d
BuV
/m)
0
10
20
30
40
50
60
70
SNR
(dB)
Field Strength Level Audio Errors SNR
0% C orrect A udio F rames 100% C orrect A udio F rames
Route 2 starts at a location 6.7 km far from the transmitter and finishes 6.1 km far. It is seen that when the field strength level is around 40 dBµV/m and the SNR is over 12 dB, there are no audio dropouts. The field strength level threshold could be close to this value.
FIGURE 5.4 Mobile DRM 26 MHz reception: Route 2
Mobile DRM Reception. Route 2
0
10
20
30
40
50
60
70
80
0 50 100 150 200 250 300 350
Travelled Distance (m.)
Fiel
d St
reng
th L
evel
(d
BuV
/m)
0
10
20
30
40
50
60
70
SNR
(dB)
Field Strength Level Audio Errors SNR
- 32 - 6D/10-E
MACINTOSH HD:USERS:NIGELLAFLIN:DROPBOX:DIGITAL RADIO:DRM:BUG:ITU DOCS:R07-WP6A-C-0010!!MSW-E.DOC 29/06/2012 29/06/2012
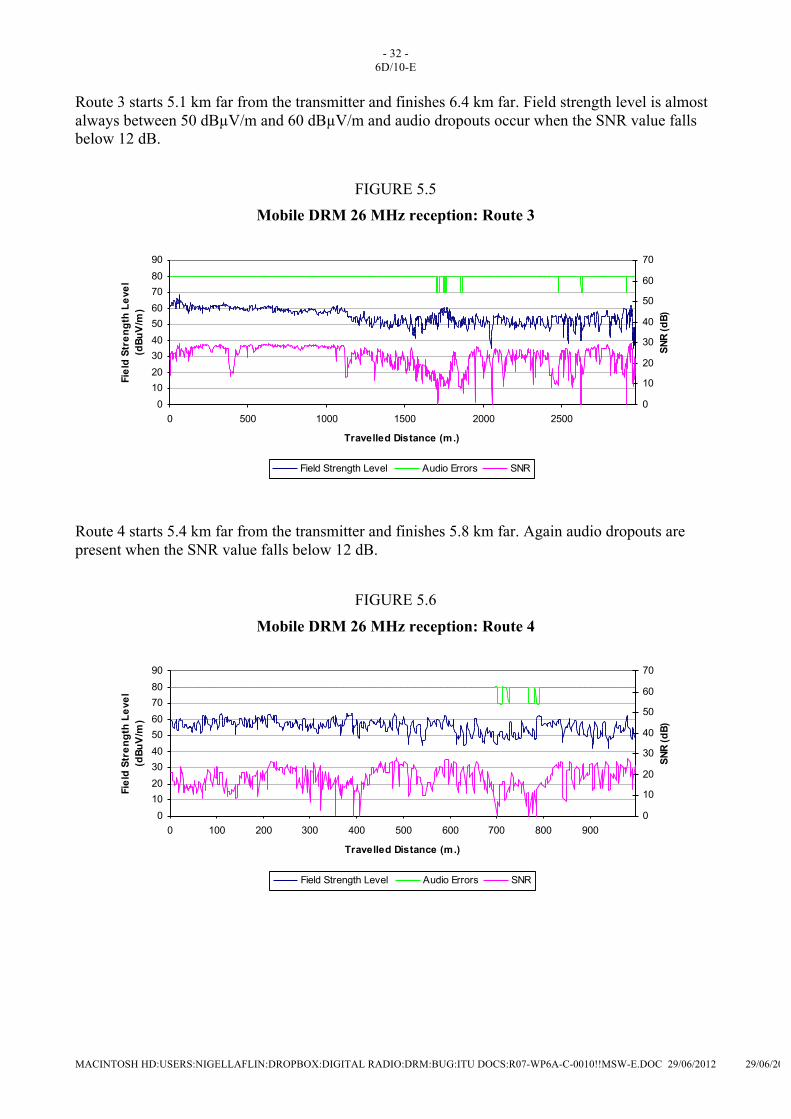
Route 3 starts 5.1 km far from the transmitter and finishes 6.4 km far. Field strength level is almost always between 50 dBµV/m and 60 dBµV/m and audio dropouts occur when the SNR value falls below 12 dB.
FIGURE 5.5 Mobile DRM 26 MHz reception: Route 3
Mobile DRM Reception. Route 3
0102030405060708090
0 500 1000 1500 2000 2500
Travelled Distance (m.)
Fiel
d St
reng
th L
evel
(d
BuV
/m)
0
10
20
30
40
50
60
70
SNR
(dB)
Field Strength Level Audio Errors SNR
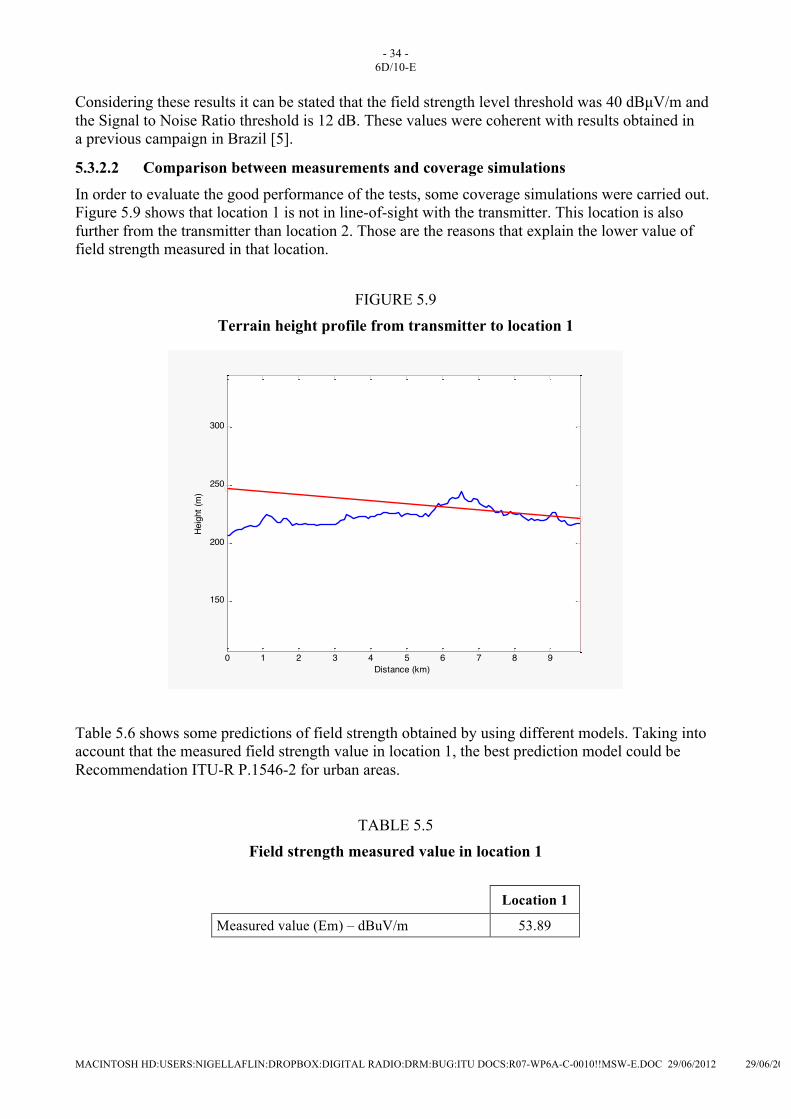
Route 4 starts 5.4 km far from the transmitter and finishes 5.8 km far. Again audio dropouts are present when the SNR value falls below 12 dB.
FIGURE 5.6
Mobile DRM 26 MHz reception: Route 4 Mobile DRM Reception. Route 4
0102030405060708090
0 100 200 300 400 500 600 700 800 900
Travelled Distance (m.)
Fiel
d St
reng
th L
evel
(d
BuV
/m)
0
10
20
30
40
50
60
70SN
R (d
B)
Field Strength Level Audio Errors SNR

- 33 - 6D/10-E
MACINTOSH HD:USERS:NIGELLAFLIN:DROPBOX:DIGITAL RADIO:DRM:BUG:ITU DOCS:R07-WP6A-C-0010!!MSW-E.DOC 29/06/2012 29/06/2012
Route 5 starts 4.6 km far from the transmitter and finishes 3.9 km far. Also in this route audio dropouts are present when the SNR value falls below 12 dB.
FIGURE 5.7
Mobile DRM 26 MHz reception: Route 5 Mobile DRM Reception. Route 5
0102030405060708090
0 200 400 600 800 1000 1200
Travelled Distance (M.)
Fiel
d St
reng
th L
evel
(d
BuV
/m)
0
10
20
30
40
50
60
SNR
(dB)
Field Strength Level Audio Errors SNR
Route 6 is in the range from 5.9 and 6.1 km far from the transmitter. Many audio dropouts can be seen in this route. The field strength level is just a bit higher than 40 dBµV/m in almost the whole route and SNR values are not high.
In fact SNR values below 12 dB appear many times along the route. This poor SNR is the reason for the coverage failures on this area.
FIGURE 5.8 Mobile DRM 26 MHz reception: Route 6
Mobile DRM Reception. Route 6
0102030405060708090
0 500 1000 1500 2000
Travelled Distance (m.)
Fiel
d St
reng
th L
evel
(d
BuV
/m)
05101520253035404550
SNR
(dB)
Field Strength Level Audio Errors SNR
- 34 - 6D/10-E
MACINTOSH HD:USERS:NIGELLAFLIN:DROPBOX:DIGITAL RADIO:DRM:BUG:ITU DOCS:R07-WP6A-C-0010!!MSW-E.DOC 29/06/2012 29/06/2012
Considering these results it can be stated that the field strength level threshold was 40 dBµV/m and the Signal to Noise Ratio threshold is 12 dB. These values were coherent with results obtained in a previous campaign in Brazil [5].
5.3.2.2 Comparison between measurements and coverage simulations
In order to evaluate the good performance of the tests, some coverage simulations were carried out. Figure 5.9 shows that location 1 is not in line-of-sight with the transmitter. This location is also further from the transmitter than location 2. Those are the reasons that explain the lower value of field strength measured in that location.
FIGURE 5.9 Terrain height profile from transmitter to location 1
0 1 2 3 4 5 6 7 8 9
150
200
250
300
Distance (km)
Heig
ht (m
)
Table 5.6 shows some predictions of field strength obtained by using different models. Taking into account that the measured field strength value in location 1, the best prediction model could be Recommendation ITU-R P.1546-2 for urban areas.
TABLE 5.5 Field strength measured value in location 1
Location 1
Measured value (Em) – dBuV/m 53.89

- 35 - 6D/10-E
MACINTOSH HD:USERS:NIGELLAFLIN:DROPBOX:DIGITAL RADIO:DRM:BUG:ITU DOCS:R07-WP6A-C-0010!!MSW-E.DOC 29/06/2012 29/06/2012
TABLE 5.6 Field strength predicted values
Method Ep (dBuV/m)
Ep-Em (dBuV/m)
Radio mobile 63-64 9.11 Rec. ITU-R P.1546-2 dense urban 49.91 –3.97 Rec. ITU-R P.1546-2 urban 53.20 –0.68 Rec. ITU-R P.1546-2 rural 57.72 3.83 Okumura-Hata urban small/medium 47.32 –6.56 Okumura-Hata large 49.37 –4.51 Okumura-Hata suburban 52.72 –1.16 Okumura-Hata open 71.90 18.01 Longley-Rice 57.77 3.88 Er – Free space loses 81.89 28.00
5.3.2.3 Subjective quality evaluation
The DRM audio quality was VERY GOOD as evaluated the AIR staff.
5.4 Conclusions
Static reception measurements were done at two locations. The received signal to noise ratio was well above the threshold at these locations. The reception was excellent along the route up to a radial distance of 7 km towards downtown. When entering the centre of the city, within an area with high buildings, high power noise sources were encountered along with signal strength dropouts. Several drives were measured in the very centre of the city and the reception was very good except for the above mentioned high building areas.
The use of a directional antenna showed to provide good results. The DRM audio quality was very good. Precaution must be taken into account when applying audio processing to the programme source. Based on the preliminary results from this week of measurements, this technology has shown to have great potential and should be further analyzed with a view for implementation.
6 MW Full channel (18 kHz) DRM
6.1 Introduction
A full bandwidth (18 kHz) DRM medium wave digital radio transmission was carried out in Delhi on 11th May, 2007. An excellent quality radio test programme was received, certainly far superior to the service resulting from the analogue transmissions. The All India Radio transmitter at Nangli in Delhi operated a full fledged stereo service. This is the first time in the world that an 18 kHz DRM test has been carried out in the medium wave band. This is quite a significant event. Radio broadcasters in the Asia-Pacific uniquely use 18 kHz wide channels in the medium wave band and using DRM in the full channel will enable them to provide very high quality stereo service to listeners.

- 36 - 6D/10-E
MACINTOSH HD:USERS:NIGELLAFLIN:DROPBOX:DIGITAL RADIO:DRM:BUG:ITU DOCS:R07-WP6A-C-0010!!MSW-E.DOC 29/06/2012 29/06/2012
6.2 Trial description
6.2.1 Objectives
Due to the time limitation and being one of the first experiments where the full 18 kHz capability of the DRM system in the MW band, the main objective of this part of the trial was to test the reliability of the 18 kHz DRM system and to carry out a coverage analysis in urban areas like New Delhi.
6.2.2 Transmission system
The full channel DRM signal was broadcasted from the transmitter station in Nangli, the same used for simulcast trials. Table 6.1 shows the main characteristics of the transmission centre:
TABLE 6.1 Transmission centre features
Transmission centre All India Radio (Nangli, Delhi)
Broadcaster All India Radio Transmission centre coordinates
28º 46’ 04’’ N 77º 08’ 32’’ E
Frequency 666 kHz
Bandwidth 18 kHz
Average power 50 kWatt
Radiating system 115 m self radiating mast
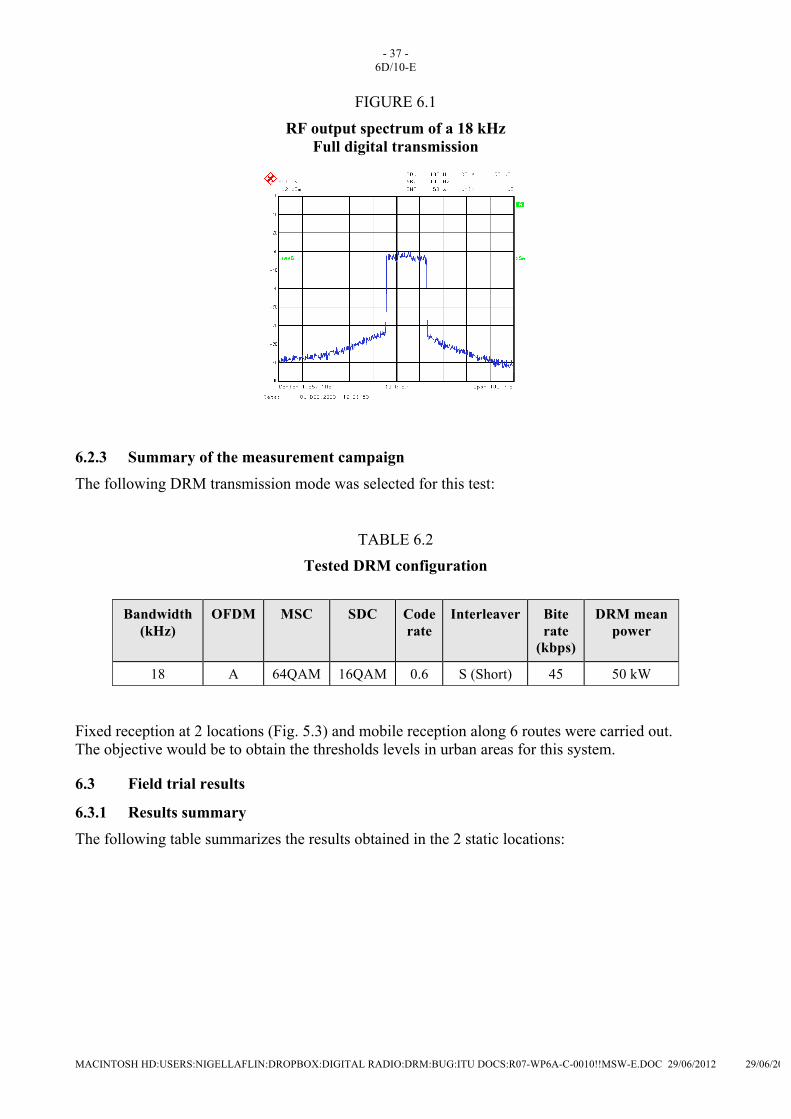
The only difference was the spectrum of the transmitted signal which used a full 18 kHz bandwidth with a mean output power of 50 kW.
- 37 - 6D/10-E
MACINTOSH HD:USERS:NIGELLAFLIN:DROPBOX:DIGITAL RADIO:DRM:BUG:ITU DOCS:R07-WP6A-C-0010!!MSW-E.DOC 29/06/2012 29/06/2012
FIGURE 6.1
RF output spectrum of a 18 kHz Full digital transmission
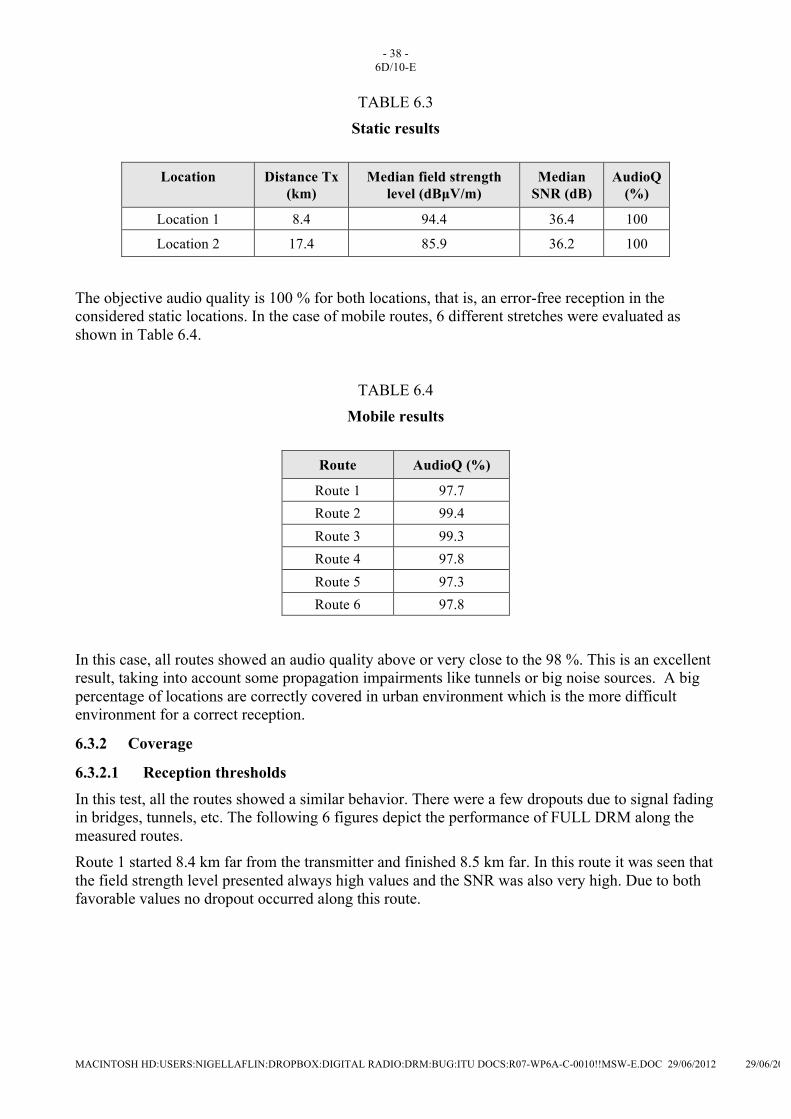
6.2.3 Summary of the measurement campaign
The following DRM transmission mode was selected for this test:
TABLE 6.2 Tested DRM configuration
Bandwidth
(kHz)
OFDM
MSC
SDC
Code rate
Interleaver
Bite rate
(kbps)
DRM mean power
18 A 64QAM 16QAM 0.6 S (Short) 45 50 kW
Fixed reception at 2 locations (Fig. 5.3) and mobile reception along 6 routes were carried out. The objective would be to obtain the thresholds levels in urban areas for this system.
6.3 Field trial results
6.3.1 Results summary
The following table summarizes the results obtained in the 2 static locations:
- 38 - 6D/10-E
MACINTOSH HD:USERS:NIGELLAFLIN:DROPBOX:DIGITAL RADIO:DRM:BUG:ITU DOCS:R07-WP6A-C-0010!!MSW-E.DOC 29/06/2012 29/06/2012
TABLE 6.3 Static results
Location
Distance Tx
(km) Median field strength
level (dBµV/m) Median
SNR (dB) AudioQ
(%)
Location 1 8.4 94.4 36.4 100
Location 2 17.4 85.9 36.2 100
The objective audio quality is 100 % for both locations, that is, an error-free reception in the considered static locations. In the case of mobile routes, 6 different stretches were evaluated as shown in Table 6.4.
TABLE 6.4 Mobile results
Route AudioQ (%)
Route 1 97.7 Route 2 99.4 Route 3 99.3 Route 4 97.8 Route 5 97.3 Route 6 97.8
In this case, all routes showed an audio quality above or very close to the 98 %. This is an excellent result, taking into account some propagation impairments like tunnels or big noise sources. A big percentage of locations are correctly covered in urban environment which is the more difficult environment for a correct reception.
6.3.2 Coverage
6.3.2.1 Reception thresholds
In this test, all the routes showed a similar behavior. There were a few dropouts due to signal fading in bridges, tunnels, etc. The following 6 figures depict the performance of FULL DRM along the measured routes. Route 1 started 8.4 km far from the transmitter and finished 8.5 km far. In this route it was seen that the field strength level presented always high values and the SNR was also very high. Due to both favorable values no dropout occurred along this route.

- 39 - 6D/10-E
MACINTOSH HD:USERS:NIGELLAFLIN:DROPBOX:DIGITAL RADIO:DRM:BUG:ITU DOCS:R07-WP6A-C-0010!!MSW-E.DOC 29/06/2012 29/06/2012
FIGURE 6.2
Mobile full DRM reception: Route 1 Mobile DRM Reception. Route 1
0
20
40
60
80
100
120
0 5 10 15 20 25 30
Travelled Distance (m.)
Fiel
d St
reng
th L
evel
(d
BuV
/m)
010203040506070
SNR
(dB)
Field Strength Level Audio Errors SNR
Route 2 started 8.8 km far from the transmitter, reached 9.5 km far and finishes 7.2 km far. In this route only a few dropouts took place. The field strength remained high almost along the whole route, only decreasing from 80 dBµV/m in a few occasions being always over 65 dBµV/m. The SNR was also very high, remaining over 30 dB almost the whole time. It went down below 20 dB only in one occasion when there was a dropout. In this case, the dropouts correlate with tunnels and bridges.
FIGURE 6.3
Mobile Full DRM reception: Route 2 Mobile DRM Reception. Route 2
0
20
40
60
80
100
120
0 500 1000 1500 2000 2500 3000 3500 4000
Travelled Distance (m.)
Fiel
d St
reng
th L
evel
(d
BuV
/m)
0
10
20
30
40
50
60
70SN
R (d
B)
Field Strength Level Audio Errors SNR

- 40 - 6D/10-E
MACINTOSH HD:USERS:NIGELLAFLIN:DROPBOX:DIGITAL RADIO:DRM:BUG:ITU DOCS:R07-WP6A-C-0010!!MSW-E.DOC 29/06/2012 29/06/2012
Route 3 started 7.1 km far away from the transmitter and finished 9.8 km far away from it. Figure 6.4 shows how the field strength remained high except for one peak that reached 40 dBµV/m and provoked a relevant dropout.
FIGURE 6.4 Mobile full DRM reception: Route 3
Mobile DRM Reception. Route 3
0
20
40
60
80
100
120
140
0 500 1000 1500 2000 2500 3000 3500 4000 4500
Travelled Distance (m.)
Fiel
d St
reng
th L
evel
(d
BuV
/m)
0
20
40
60
80
100
120
SNR
(dB)
Field Strength Level Audio Errors SNR
Route 4 went from 12.6 km to 15.5 km far away from the transmitter. In this route several dropouts took place due to the decrease of the field strength values and so the SNR. Figure 6.5 shows that the most severe dropouts happened when field strength level diminished below 65 dBµV/m or the SNR reached 19 dB.
FIGURE 6.5
Mobile full DRM reception: Route 4 Mobile DRM Reception. Route 4
0
20
40
60
80
100
120
140
0 500 1000 1500 2000 2500 3000 3500 4000 4500
Travelled Distance (m.)
Fiel
d St
reng
th L
evel
(d
BuV
/m)
0102030405060708090100
SNR
(dB
)
Field Strength Level Audio Errors SNR
- 41 - 6D/10-E
MACINTOSH HD:USERS:NIGELLAFLIN:DROPBOX:DIGITAL RADIO:DRM:BUG:ITU DOCS:R07-WP6A-C-0010!!MSW-E.DOC 29/06/2012 29/06/2012
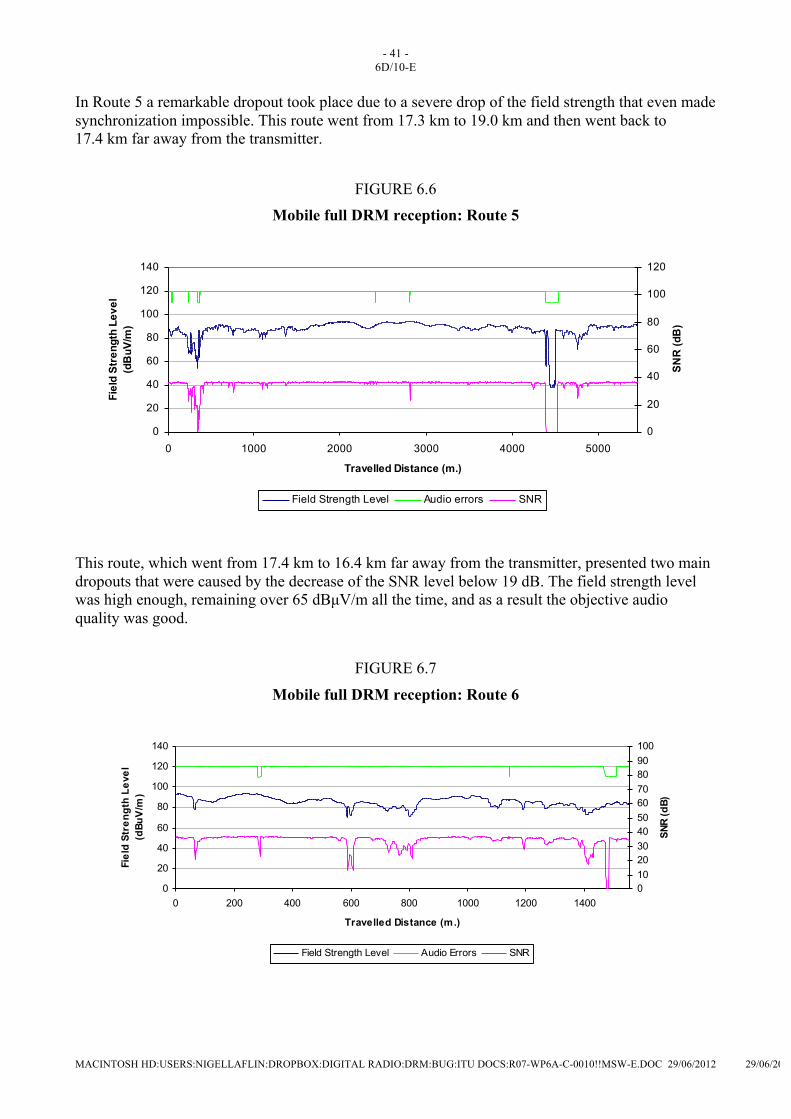
In Route 5 a remarkable dropout took place due to a severe drop of the field strength that even made synchronization impossible. This route went from 17.3 km to 19.0 km and then went back to 17.4 km far away from the transmitter.
FIGURE 6.6 Mobile full DRM reception: Route 5
Mobile DRM Reception. Route 5
0
20
40
60
80
100
120
140
0 1000 2000 3000 4000 5000
Travelled Distance (m.)
Fiel
d St
reng
th L
evel
(d
BuV
/m)
0
20
40
60
80
100
120
SNR
(dB
)
Field Strength Level Audio errors SNR
This route, which went from 17.4 km to 16.4 km far away from the transmitter, presented two main dropouts that were caused by the decrease of the SNR level below 19 dB. The field strength level was high enough, remaining over 65 dBµV/m all the time, and as a result the objective audio quality was good.
FIGURE 6.7
Mobile full DRM reception: Route 6 Mobile DRM Reception. Route 6
0
20
40
60
80
100
120
140
0 200 400 600 800 1000 1200 1400
Travelled Distance (m.)
Fiel
d St
reng
th L
evel
(d
BuV
/m)
0102030405060708090100
SNR
(dB)
Field Strength Level Audio Errors SNR

- 42 - 6D/10-E
MACINTOSH HD:USERS:NIGELLAFLIN:DROPBOX:DIGITAL RADIO:DRM:BUG:ITU DOCS:R07-WP6A-C-0010!!MSW-E.DOC 29/06/2012 29/06/2012
Observing the results, the SNR threshold can be calculated as 19 dB and the field strength level threshold in 65 dBµV/m.
6.4 Subjective quality evaluation
The objective DRM audio quality was always very high. The subjective evaluation was carried out by a Himalaya receiver as well as the professional DT700. It was agreed by the staff from AIR that the audio quality, full stereo, was impressive.
6.5 Conclusions
It can be concluded from the observations that the DRM 18 kHz coverage service provided better quality and coverage with outstanding full stereo audio quality than the AM analogue services inside the city of Delhi. The participants in this project were thrilled when they heard the brilliant full stereo audio emanating from DRM digital radio sets.
7 Night-time NVIS
7.1 Introduction
This section summarizes the tests set up to evaluate the reception of near vertical incidence skywave transmissions in the low part of the HF band. It includes reception observations, audio quality evaluation, final conclusions and a description of the behavior of the ionosphere. NVIS in this band is regularly used for broadcasting to large areas in tropical regions where the LF and the MF bands are heavily attenuated and for reaching locations with irregular terrain. It is also used to fill what is called skip zone. This is an area of silence or a zone of no reception extending from outer limit of ground wave communication to the inner limit of sky wave communication (first hop) [7]. India is a large country and so NVIS is a suitable way for reaching remote rural areas. Besides, as the main objective of the trial is to demonstrate DRM technology in Asian countries, NVIS tests could provide relevant information for future action in regions of different characteristics. NVIS utilizes the same principles of ordinary sky wave transmissions. The key factor in this operation is the antenna. For effective HF communication using this mode, the antenna must radiate its main beam energy at a very high angle, near vertical. The objective is to launch a wave nearly directly upward from the antenna [7]. The best performance for this type of operation is to use frequencies from 3 to 6 MHz; in this trial 3.315 MHz has been used.
NVIS circuits also suffer the same impairments as long distance sky wave circuits, but in this case the delay spread and the Doppler spread are more severe especially at certain times of day, such as dawn and dusk. Due to this fact, DRM modes B and D have been tested in order to evaluate the effect of these problems on the signal and to define which mode is more appropriate for NVIS operation.
7.2 Trial description
7.2.1 Objectives
This test had three main objectives that have been successfully achieved. – Evaluate the reliability of NVIS propagation during nighttime, paying special attention on
sunset and sunrise time. – Evaluate the operation of modes D and B in order to study their suitability for this kind of
propagation and their properties against Doppler and delay spread effects.
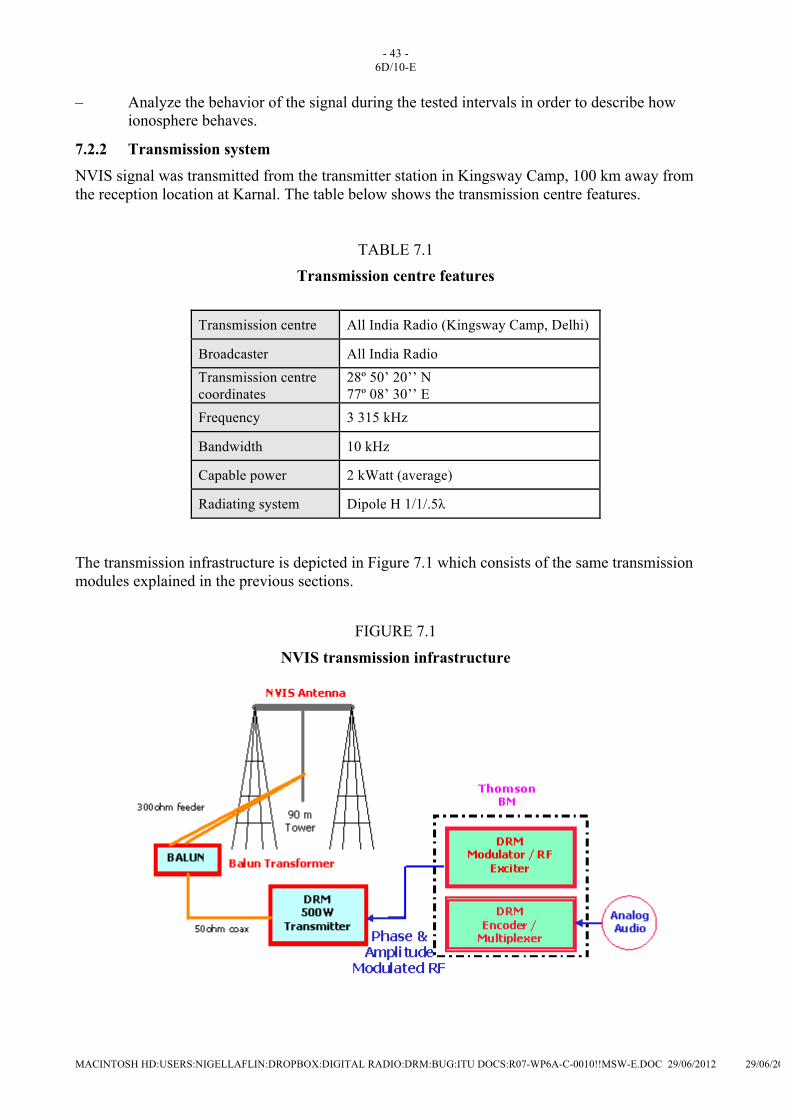
- 43 - 6D/10-E
MACINTOSH HD:USERS:NIGELLAFLIN:DROPBOX:DIGITAL RADIO:DRM:BUG:ITU DOCS:R07-WP6A-C-0010!!MSW-E.DOC 29/06/2012 29/06/2012
– Analyze the behavior of the signal during the tested intervals in order to describe how ionosphere behaves.
7.2.2 Transmission system
NVIS signal was transmitted from the transmitter station in Kingsway Camp, 100 km away from the reception location at Karnal. The table below shows the transmission centre features.
TABLE 7.1 Transmission centre features
Transmission centre All India Radio (Kingsway Camp, Delhi)
Broadcaster All India Radio Transmission centre coordinates
28º 50’ 20’’ N 77º 08’ 30’’ E
Frequency 3 315 kHz
Bandwidth 10 kHz
Capable power 2 kWatt (average)
Radiating system Dipole H 1/1/.5λ
The transmission infrastructure is depicted in Figure 7.1 which consists of the same transmission modules explained in the previous sections.
FIGURE 7.1
NVIS transmission infrastructure
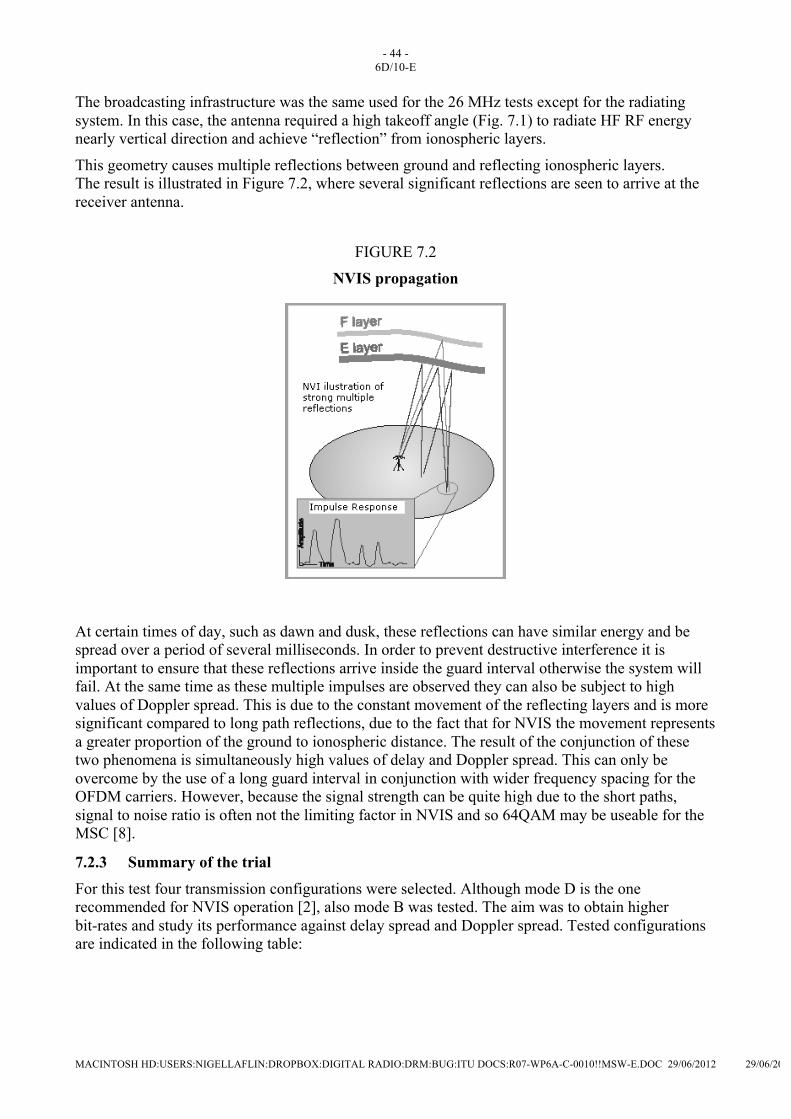
- 44 - 6D/10-E
MACINTOSH HD:USERS:NIGELLAFLIN:DROPBOX:DIGITAL RADIO:DRM:BUG:ITU DOCS:R07-WP6A-C-0010!!MSW-E.DOC 29/06/2012 29/06/2012
The broadcasting infrastructure was the same used for the 26 MHz tests except for the radiating system. In this case, the antenna required a high takeoff angle (Fig. 7.1) to radiate HF RF energy nearly vertical direction and achieve “reflection” from ionospheric layers.
This geometry causes multiple reflections between ground and reflecting ionospheric layers. The result is illustrated in Figure 7.2, where several significant reflections are seen to arrive at the receiver antenna.
FIGURE 7.2
NVIS propagation
At certain times of day, such as dawn and dusk, these reflections can have similar energy and be spread over a period of several milliseconds. In order to prevent destructive interference it is important to ensure that these reflections arrive inside the guard interval otherwise the system will fail. At the same time as these multiple impulses are observed they can also be subject to high values of Doppler spread. This is due to the constant movement of the reflecting layers and is more significant compared to long path reflections, due to the fact that for NVIS the movement represents a greater proportion of the ground to ionospheric distance. The result of the conjunction of these two phenomena is simultaneously high values of delay and Doppler spread. This can only be overcome by the use of a long guard interval in conjunction with wider frequency spacing for the OFDM carriers. However, because the signal strength can be quite high due to the short paths, signal to noise ratio is often not the limiting factor in NVIS and so 64QAM may be useable for the MSC [8].
7.2.3 Summary of the trial
For this test four transmission configurations were selected. Although mode D is the one recommended for NVIS operation [2], also mode B was tested. The aim was to obtain higher bit-rates and study its performance against delay spread and Doppler spread. Tested configurations are indicated in the following table:

- 45 - 6D/10-E
MACINTOSH HD:USERS:NIGELLAFLIN:DROPBOX:DIGITAL RADIO:DRM:BUG:ITU DOCS:R07-WP6A-C-0010!!MSW-E.DOC 29/06/2012 29/06/2012
TABLE 7.2 NVIS tested configurations
Name in
Document
Bandwidth (kHz)
OFDM
MSC
SDC
Code rate
Interleaver
Bit rate
(kbps)
SNR
Tg (ms)
B/16/4/05 10 B 16QAM 4QAM 0.5 L 11.7 14.6 5
D/16/4/062 10 D 16QAM 4QAM 0.62 L 7.6 18.3 7
D/64/4/06 10 D 64QAM 4QAM 0.6 L 11 22.9 7
B/16/4/062 10 B 16QAM 4QAM 0.62 L 14.6 17.7 5
The test was carried out in two phases; one during sunset, from 18:18 to 23:00, and the other one during sunrise, from 4:00 to 8:50. Some measurements were taken of different time intervals, all of them in the same static location at Karnal. The objective was to obtain relevant information about the behavior of the ionosphere during nighttime and the operation of the tested configurations against delay and Doppler spread.
7.3 Field trial results
7.3.1 Summary
The results have been analyzed taking into account the different modes used and the time of the measurement. In this way a comparison of the tested modes and a study of the behavior of the transmission channel during nighttime has been carried out.
The results have been divided in two measured intervals, firstly sunset tests are explained and next sunrise tests. Each interval is also divided in several sections in order to distinguish the operation of the different tested configurations and the reception performance in different periods of time. Both modes have performed quite well although during some time spots the reception is impossible due to high values of multipath (delay spread rather than Doppler spread). Mode B started failing even when delay spread reached 2 ms while mode D tolerated a bit higher delay values. However, mode D allowed very low bit-rates and so poor audio quality could be obtained. Also in this section the main causes of failure are identified and the propagation channel is characterized in order to understand NVIS operation. Finally, some observations of the behavior of the ionosphere during this trial are detailed and compared with other similar studies.
7.3.2 DRM reception
7.3.2.1 Received signal: Time evolution description
As it has been noted earlier, in order to obtain a more detailed description of the near vertical incidence signal time evolution, sunset and sunrise tests have been considered separated. SUNSET
The following figures show the evolution of the DRM signal during sunset, from 18:18 to 23:00 h, indicating an average value of each minute measured. The first one represents the percentage of correct audio Q frames, the field strength, the MER and the weighted MER. In Figure 7.4 delay spread and Doppler spread values are depicted.
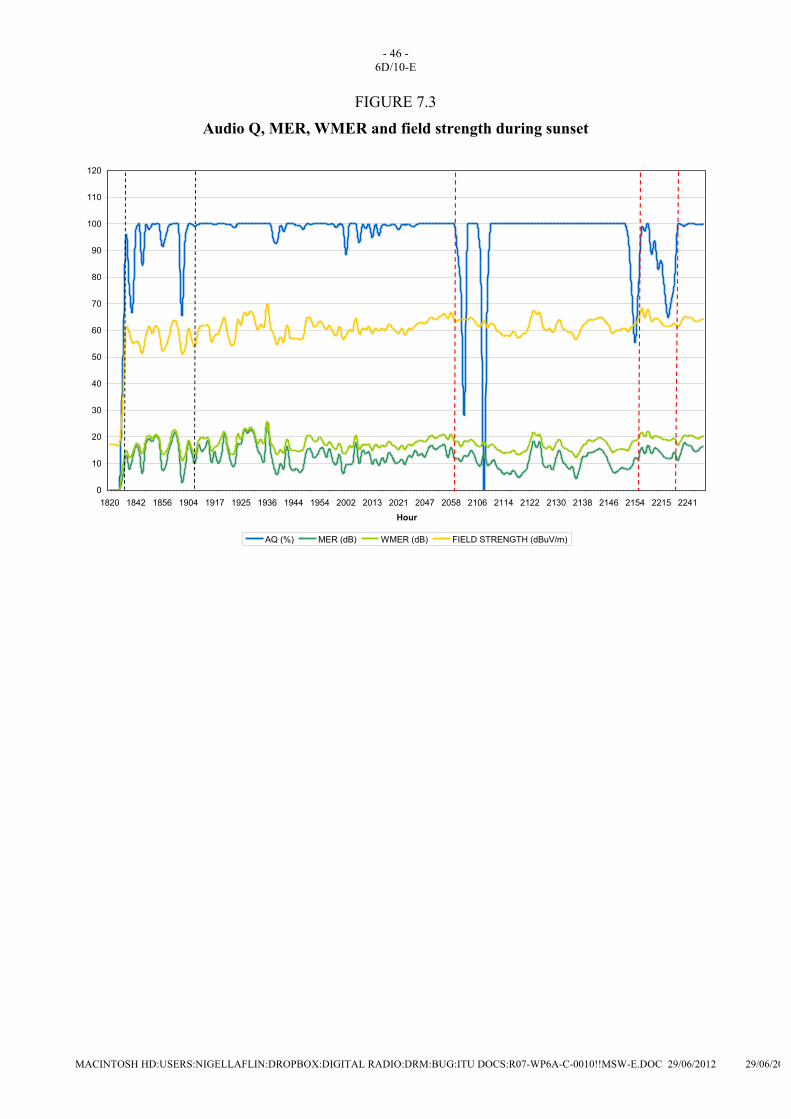
- 46 - 6D/10-E
MACINTOSH HD:USERS:NIGELLAFLIN:DROPBOX:DIGITAL RADIO:DRM:BUG:ITU DOCS:R07-WP6A-C-0010!!MSW-E.DOC 29/06/2012 29/06/2012
FIGURE 7.3
Audio Q, MER, WMER and field strength during sunset
0
10
20
30
40
50
60
70
80
90
100
110
120
1820 1842 1856 1904 1917 1925 1936 1944 1954 2002 2013 2021 2047 2058 2106 2114 2122 2130 2138 2146 2154 2215 2241
Hour
AQ (%) MER (dB) WMER (dB) FIELD STRENGTH (dBuV/m)

- 47 - 6D/10-E
MACINTOSH HD:USERS:NIGELLAFLIN:DROPBOX:DIGITAL RADIO:DRM:BUG:ITU DOCS:R07-WP6A-C-0010!!MSW-E.DOC 29/06/2012 29/06/2012
FIGURE 7.4
Delay and Doppler spread during sunset
0
1
2
3
4
5
6
1820
1839
1844
1855
1900
1905
1915
1920
1925
1933
1938
1943
1950
1955
2000
2008
2013
2018
2025
2046
2051
2059
2104
2109
2114
2119
2124
2129
2134
2139
2144
2149
2154
2212
2217
2240
2245
Hour
DELAY (ms) DOPPLER (Hz)
Both figures are divided in six sections which are described in detail in the following paragraphs. The first three parts correspond to mode B/16/4/05 and the rest represents modes D/16/4/062, D/64/4/06 and B/16/4/062 respectively.
1st Section (18:15 – 18:30)
The signal level at the beginning of the test was very low (around 17 dBµV/m) and there was noise caused by a thunderstorm. Due to these facts, the signal couldn’t be synchronized until 18:30.
2nd Section (18:39 – 19:05) Ten minutes later, at 18:40, the WMER improved to 15 dB and the field strength reached 61 dBµV/m, despite the channel continued being instable for the following twenty minutes. During this time, up to 19:05, several dropouts occurred when delay spread was high, even reaching 8 ms at some instants. The table below shows median, maximum and minimum values of the main parameters.
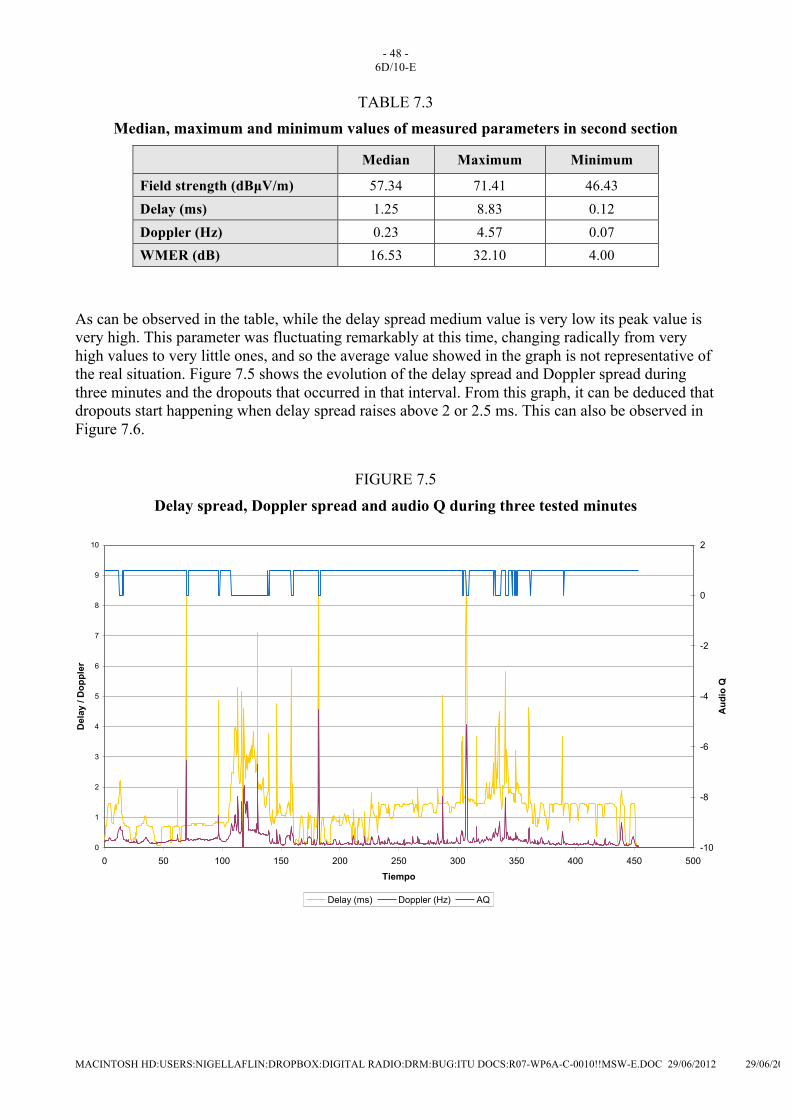
- 48 - 6D/10-E
MACINTOSH HD:USERS:NIGELLAFLIN:DROPBOX:DIGITAL RADIO:DRM:BUG:ITU DOCS:R07-WP6A-C-0010!!MSW-E.DOC 29/06/2012 29/06/2012
TABLE 7.3 Median, maximum and minimum values of measured parameters in second section
Median Maximum Minimum
Field strength (dBµV/m) 57.34 71.41 46.43 Delay (ms) 1.25 8.83 0.12 Doppler (Hz) 0.23 4.57 0.07 WMER (dB) 16.53 32.10 4.00
As can be observed in the table, while the delay spread medium value is very low its peak value is very high. This parameter was fluctuating remarkably at this time, changing radically from very high values to very little ones, and so the average value showed in the graph is not representative of the real situation. Figure 7.5 shows the evolution of the delay spread and Doppler spread during three minutes and the dropouts that occurred in that interval. From this graph, it can be deduced that dropouts start happening when delay spread raises above 2 or 2.5 ms. This can also be observed in Figure 7.6.
FIGURE 7.5
Delay spread, Doppler spread and audio Q during three tested minutes NVIS 3 (18:39-18:47)- Campo, Delay, Doppler y AQ VS tiempo
0
1
2
3
4
5
6
7
8
9
10
0 50 100 150 200 250 300 350 400 450 500
Tiempo
Del
ay /
Dop
pler
-10
-8
-6
-4
-2
0
2
Aud
io Q
Delay (ms) Doppler (Hz) AQ

- 49 - 6D/10-E
MACINTOSH HD:USERS:NIGELLAFLIN:DROPBOX:DIGITAL RADIO:DRM:BUG:ITU DOCS:R07-WP6A-C-0010!!MSW-E.DOC 29/06/2012 29/06/2012
FIGURE 7.6
Delay spread vs. Audio Q NVIS 4 (18:52 - 19:08) - DELAY VS %A
0
20
40
60
80
100
120
0 0,5 1 1,5 2 2,5 3 3,5 4 4,5 5
Delay (ms)
%A
Q
Modo B 16/4/L/05
The impulse response also shows the effect of the delay spread on the signal. Figure 7.7 represents two instants where dropouts occurred. In both graphs, the delay spread value is bigger than 5 ms and multiple reflections of high strength can be observed.
FIGURE 7.7
Measured two impulse responses

- 50 - 6D/10-E
MACINTOSH HD:USERS:NIGELLAFLIN:DROPBOX:DIGITAL RADIO:DRM:BUG:ITU DOCS:R07-WP6A-C-0010!!MSW-E.DOC 29/06/2012 29/06/2012
3rd Section (19:10 – 20:55)
In this section the delay spread also fluctuated but did not show such high peaks. Due to this fact, dropouts were less important and the audio quality remained over 90 % almost all the time. Table 7.4 details some values of the analysed parameters.
TABLE 7.4
Median, maximum and minimum values of measured parameters in third section
Median Maximum Minimum
Field strength (dBµV/m) 60.55 77.68 50.34 Delay (ms) 1.92 7.78 0.08 Doppler (Hz) 0.27 4.74 0.02 WMER (dB) 17.49 33.11 3.92
The table shows similar values of the delay but the evolution of it was different as it can be seen in the following graph.
FIGURE 7.8
Delay spread, Doppler spread and audio Q during 15 tested minutes NVIS 8 (20:08-20:23) - Campo, Delay, Doppler y AQ VS tiempo
0
1
2
3
4
5
6
7
0 100 200 300 400 500 600 700 800 900 1000
Tiempo
Del
ay /
Dop
pler
-5
-4
-3
-2
-1
0
1
2
Aud
io Q
Delay (ms) Doppler (hz) AQ
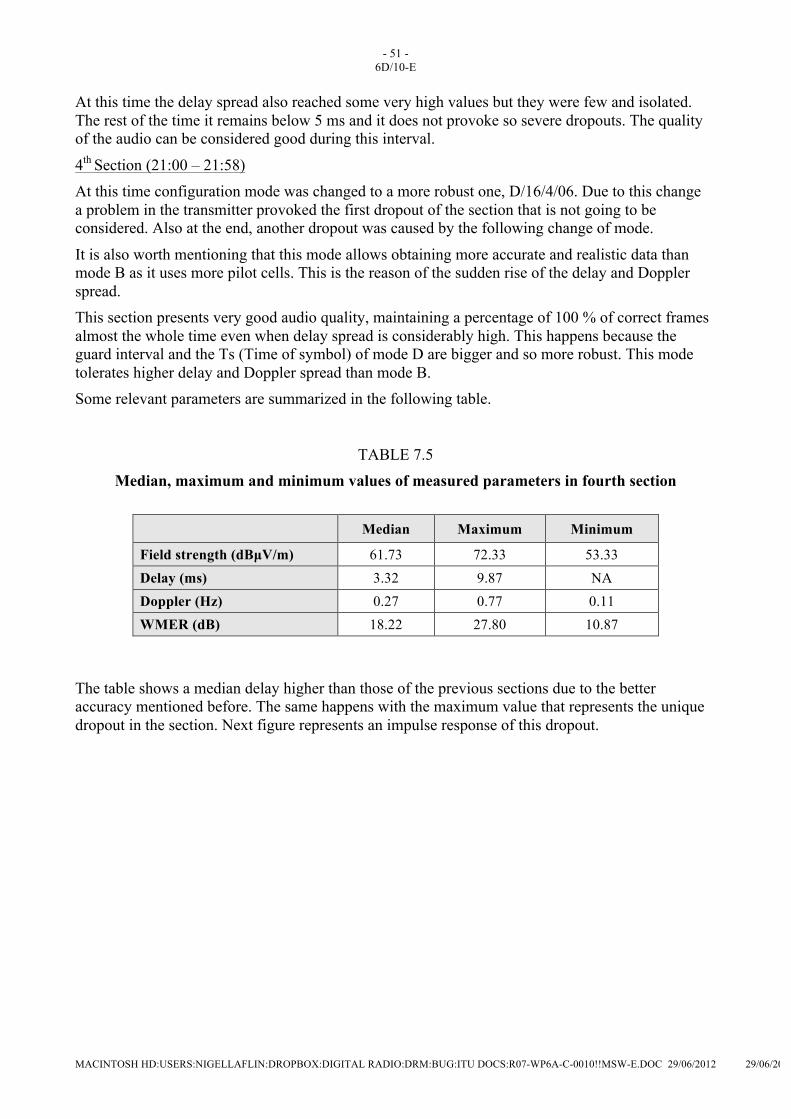
- 51 - 6D/10-E
MACINTOSH HD:USERS:NIGELLAFLIN:DROPBOX:DIGITAL RADIO:DRM:BUG:ITU DOCS:R07-WP6A-C-0010!!MSW-E.DOC 29/06/2012 29/06/2012
At this time the delay spread also reached some very high values but they were few and isolated. The rest of the time it remains below 5 ms and it does not provoke so severe dropouts. The quality of the audio can be considered good during this interval.
4th Section (21:00 – 21:58) At this time configuration mode was changed to a more robust one, D/16/4/06. Due to this change a problem in the transmitter provoked the first dropout of the section that is not going to be considered. Also at the end, another dropout was caused by the following change of mode.
It is also worth mentioning that this mode allows obtaining more accurate and realistic data than mode B as it uses more pilot cells. This is the reason of the sudden rise of the delay and Doppler spread. This section presents very good audio quality, maintaining a percentage of 100 % of correct frames almost the whole time even when delay spread is considerably high. This happens because the guard interval and the Ts (Time of symbol) of mode D are bigger and so more robust. This mode tolerates higher delay and Doppler spread than mode B. Some relevant parameters are summarized in the following table.
TABLE 7.5 Median, maximum and minimum values of measured parameters in fourth section
Median Maximum Minimum
Field strength (dBµV/m) 61.73 72.33 53.33 Delay (ms) 3.32 9.87 NA Doppler (Hz) 0.27 0.77 0.11 WMER (dB) 18.22 27.80 10.87
The table shows a median delay higher than those of the previous sections due to the better accuracy mentioned before. The same happens with the maximum value that represents the unique dropout in the section. Next figure represents an impulse response of this dropout.
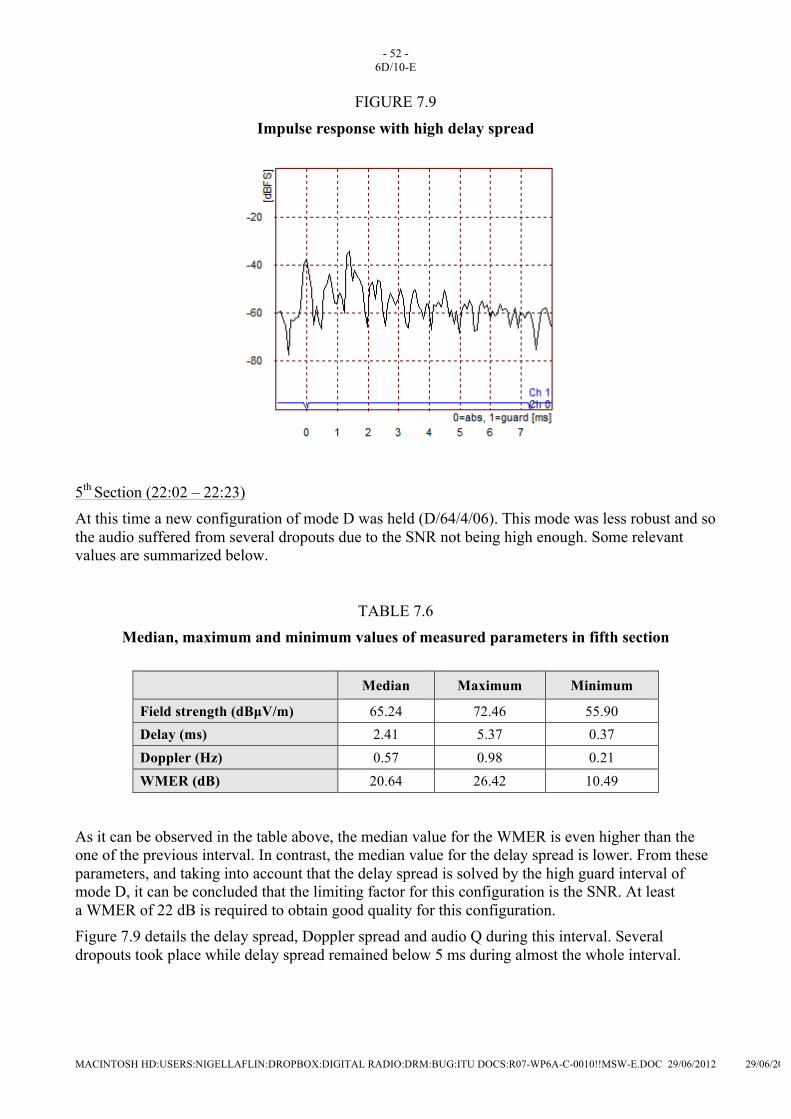
- 52 - 6D/10-E
MACINTOSH HD:USERS:NIGELLAFLIN:DROPBOX:DIGITAL RADIO:DRM:BUG:ITU DOCS:R07-WP6A-C-0010!!MSW-E.DOC 29/06/2012 29/06/2012
FIGURE 7.9
Impulse response with high delay spread
5th Section (22:02 – 22:23) At this time a new configuration of mode D was held (D/64/4/06). This mode was less robust and so the audio suffered from several dropouts due to the SNR not being high enough. Some relevant values are summarized below.
TABLE 7.6 Median, maximum and minimum values of measured parameters in fifth section
Median Maximum Minimum
Field strength (dBµV/m) 65.24 72.46 55.90 Delay (ms) 2.41 5.37 0.37 Doppler (Hz) 0.57 0.98 0.21 WMER (dB) 20.64 26.42 10.49
As it can be observed in the table above, the median value for the WMER is even higher than the one of the previous interval. In contrast, the median value for the delay spread is lower. From these parameters, and taking into account that the delay spread is solved by the high guard interval of mode D, it can be concluded that the limiting factor for this configuration is the SNR. At least a WMER of 22 dB is required to obtain good quality for this configuration. Figure 7.9 details the delay spread, Doppler spread and audio Q during this interval. Several dropouts took place while delay spread remained below 5 ms during almost the whole interval.
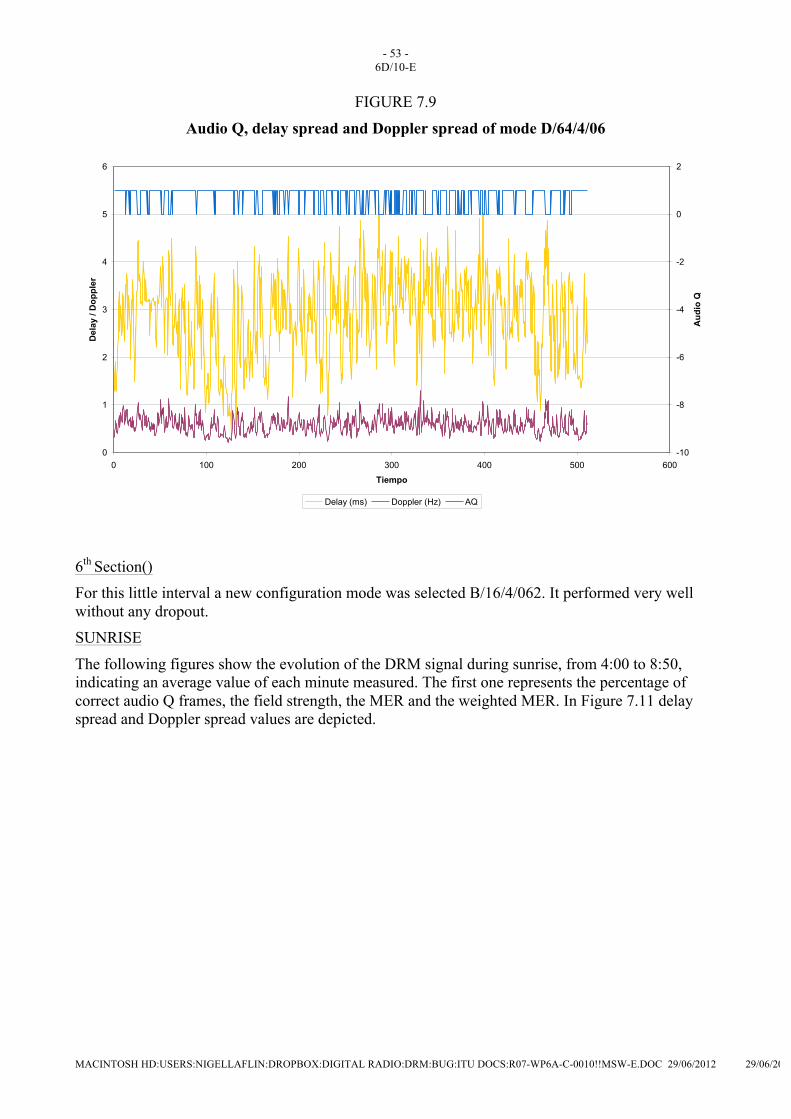
- 53 - 6D/10-E
MACINTOSH HD:USERS:NIGELLAFLIN:DROPBOX:DIGITAL RADIO:DRM:BUG:ITU DOCS:R07-WP6A-C-0010!!MSW-E.DOC 29/06/2012 29/06/2012
FIGURE 7.9
Audio Q, delay spread and Doppler spread of mode D/64/4/06 NVIS 13 (22:12-22:23) - Campo, Delay, Doppler y AQ VS tiempo
0
1
2
3
4
5
6
0 100 200 300 400 500 600
Tiempo
Del
ay /
Dop
pler
-10
-8
-6
-4
-2
0
2
Aud
io Q
Delay (ms) Doppler (Hz) AQ
6th Section() For this little interval a new configuration mode was selected B/16/4/062. It performed very well without any dropout. SUNRISE
The following figures show the evolution of the DRM signal during sunrise, from 4:00 to 8:50, indicating an average value of each minute measured. The first one represents the percentage of correct audio Q frames, the field strength, the MER and the weighted MER. In Figure 7.11 delay spread and Doppler spread values are depicted.
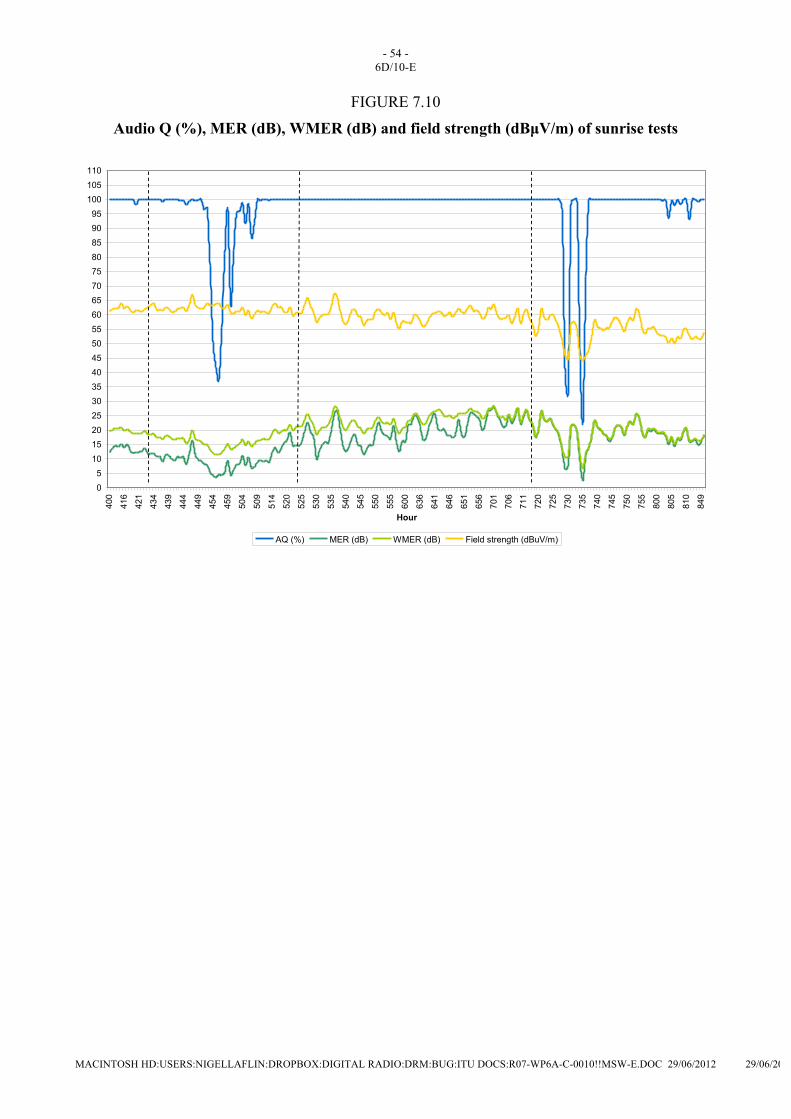
- 54 - 6D/10-E
MACINTOSH HD:USERS:NIGELLAFLIN:DROPBOX:DIGITAL RADIO:DRM:BUG:ITU DOCS:R07-WP6A-C-0010!!MSW-E.DOC 29/06/2012 29/06/2012
FIGURE 7.10
Audio Q (%), MER (dB), WMER (dB) and field strength (dBµV/m) of sunrise tests
05
101520253035404550556065707580859095
100105110
400
416
421
434
439
444
449
454
459
504
509
514
520
525
530
535
540
545
550
555
600
636
641
646
651
656
701
706
711
720
725
730
735
740
745
750
755
800
805
810
849
Hour
AQ (%) MER (dB) WMER (dB) Field strength (dBuV/m)
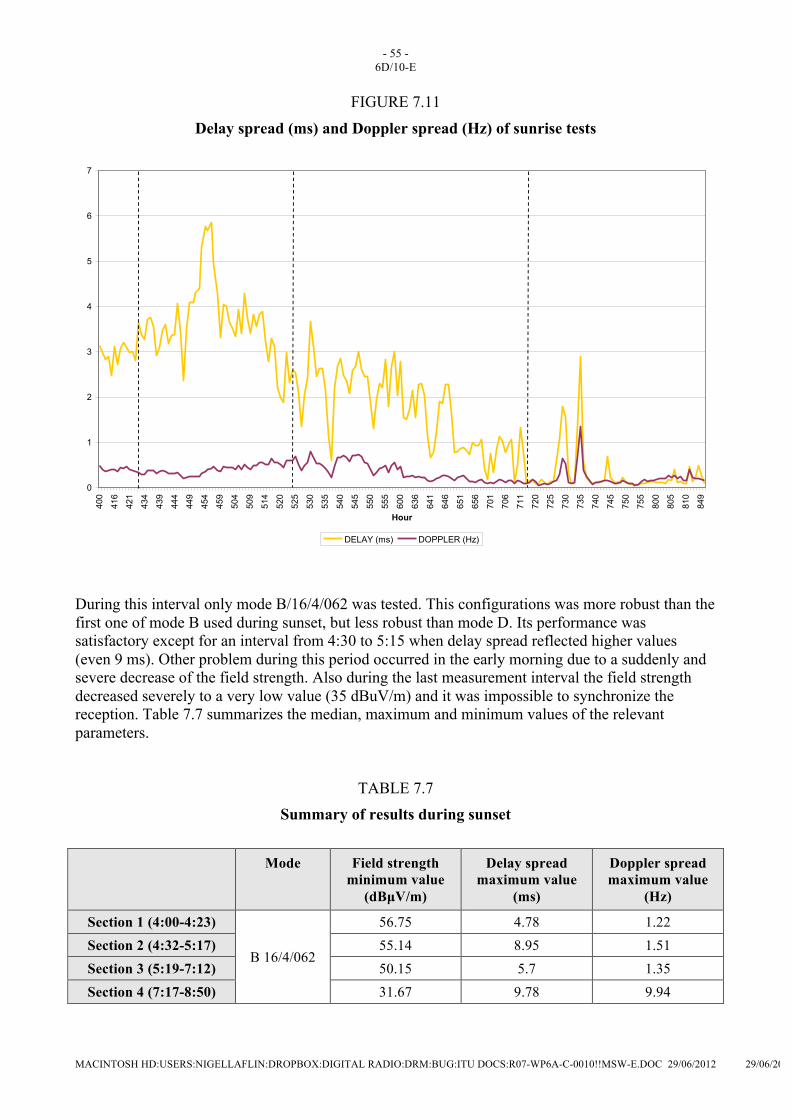
- 55 - 6D/10-E
MACINTOSH HD:USERS:NIGELLAFLIN:DROPBOX:DIGITAL RADIO:DRM:BUG:ITU DOCS:R07-WP6A-C-0010!!MSW-E.DOC 29/06/2012 29/06/2012
FIGURE 7.11
Delay spread (ms) and Doppler spread (Hz) of sunrise tests
0
1
2
3
4
5
6
7
400
416
421
434
439
444
449
454
459
504
509
514
520
525
530
535
540
545
550
555
600
636
641
646
651
656
701
706
711
720
725
730
735
740
745
750
755
800
805
810
849
Hour
DELAY (ms) DOPPLER (Hz)
During this interval only mode B/16/4/062 was tested. This configurations was more robust than the first one of mode B used during sunset, but less robust than mode D. Its performance was satisfactory except for an interval from 4:30 to 5:15 when delay spread reflected higher values (even 9 ms). Other problem during this period occurred in the early morning due to a suddenly and severe decrease of the field strength. Also during the last measurement interval the field strength decreased severely to a very low value (35 dBuV/m) and it was impossible to synchronize the reception. Table 7.7 summarizes the median, maximum and minimum values of the relevant parameters.
TABLE 7.7 Summary of results during sunset
Mode
Field strength minimum value
(dBµV/m)
Delay spread maximum value
(ms)
Doppler spread maximum value
(Hz)
Section 1 (4:00-4:23)
B 16/4/062
56.75 4.78 1.22 Section 2 (4:32-5:17) 55.14 8.95 1.51 Section 3 (5:19-7:12) 50.15 5.7 1.35 Section 4 (7:17-8:50) 31.67 9.78 9.94

- 56 - 6D/10-E
MACINTOSH HD:USERS:NIGELLAFLIN:DROPBOX:DIGITAL RADIO:DRM:BUG:ITU DOCS:R07-WP6A-C-0010!!MSW-E.DOC 29/06/2012 29/06/2012
As in the previous part, here again each part has been analyzed aside.
First section (4:00 – 4:30) The performance was very good during this interval. Delay spread was very low and stable (Fig. 7.12) and field strength remained sufficiently high (Table 7.7). Just a few dropouts took place during this interval.
FIGURE 7.12 Audio Q, delay spread and Doppler spread
Mode B/16/4/062 (4:15 -4:25) NVIS 17 (4:15-4:25) - Campo, Delay, Doppler, AQ y SNR VS tiempo
0
1
2
3
4
5
6
0 100 200 300 400 500 600 700
Tiempo
Del
ay /
Dop
pler
-10
-8
-6
-4
-2
0
2
Aud
io Q
Delay (ms) Doppler (Hz) AQ

- 57 - 6D/10-E
MACINTOSH HD:USERS:NIGELLAFLIN:DROPBOX:DIGITAL RADIO:DRM:BUG:ITU DOCS:R07-WP6A-C-0010!!MSW-E.DOC 29/06/2012 29/06/2012
Second section (4:32 – 6:24)
In this section the field strength remained similar (Table 7.7) to the previous one but the delay spread was more instable. Suddenly its values grew up provoking a several dropouts that made the reception unreliable. A delay spread value of 9 ms caused a severe dropout of one minute.
FIGURE 7.13
Audio Q, delay spread and Doppler spread Mode B/16/4/062 (4:32 -5:24 ) NVIS 18 (4:32-5:24) - Campo, Delay, Doppler, AQ VS tiempo
0
1
2
3
4
5
6
7
8
9
10
0 500 1000 1500 2000 2500 3000
Tiempo
Del
ay /D
oppl
er
-10
-8
-6
-4
-2
0
2
Aud
io Q
Delay (ms) Doppler (Hz) AQ
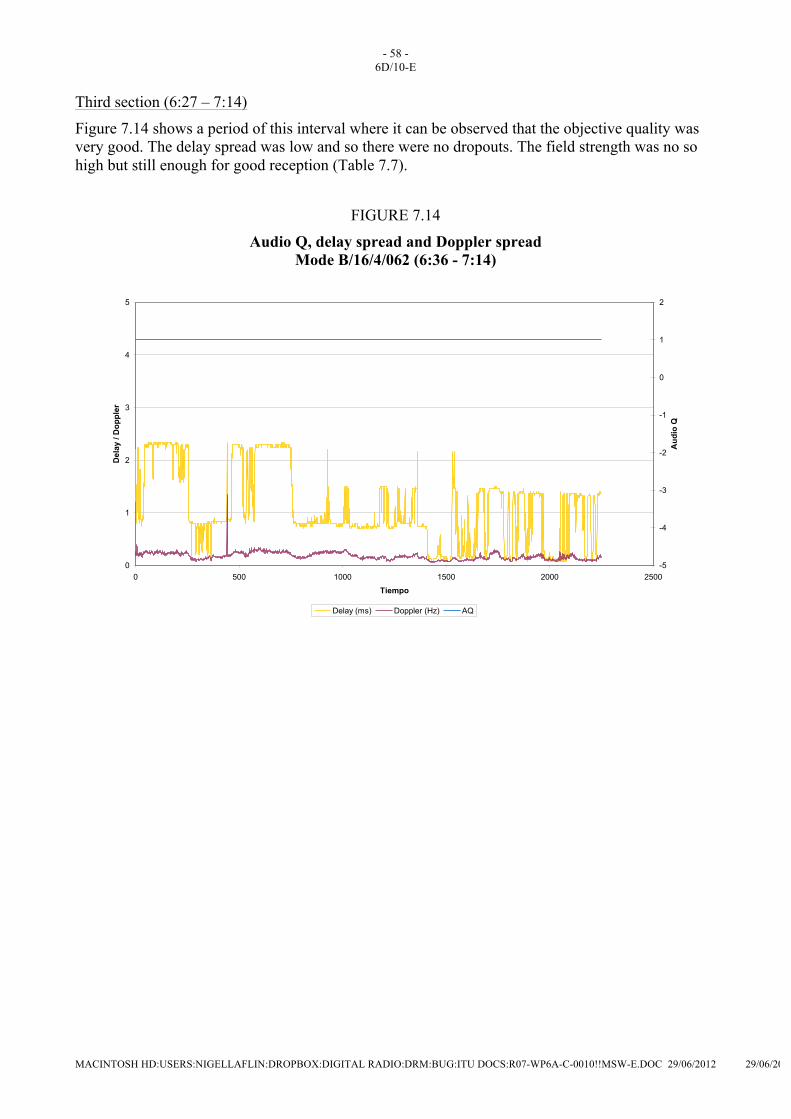
- 58 - 6D/10-E
MACINTOSH HD:USERS:NIGELLAFLIN:DROPBOX:DIGITAL RADIO:DRM:BUG:ITU DOCS:R07-WP6A-C-0010!!MSW-E.DOC 29/06/2012 29/06/2012
Third section (6:27 – 7:14)
Figure 7.14 shows a period of this interval where it can be observed that the objective quality was very good. The delay spread was low and so there were no dropouts. The field strength was no so high but still enough for good reception (Table 7.7).
FIGURE 7.14
Audio Q, delay spread and Doppler spread Mode B/16/4/062 (6:36 - 7:14)
NVIS 21 (6:36-7:14) - Campo, Delay, Doppler, AQ y SNR VS tiempo
0
1
2
3
4
5
0 500 1000 1500 2000 2500
Tiempo
Del
ay /
Dop
pler
-5
-4
-3
-2
-1
0
1
2
Aud
io Q
Delay (ms) Doppler (Hz) AQ
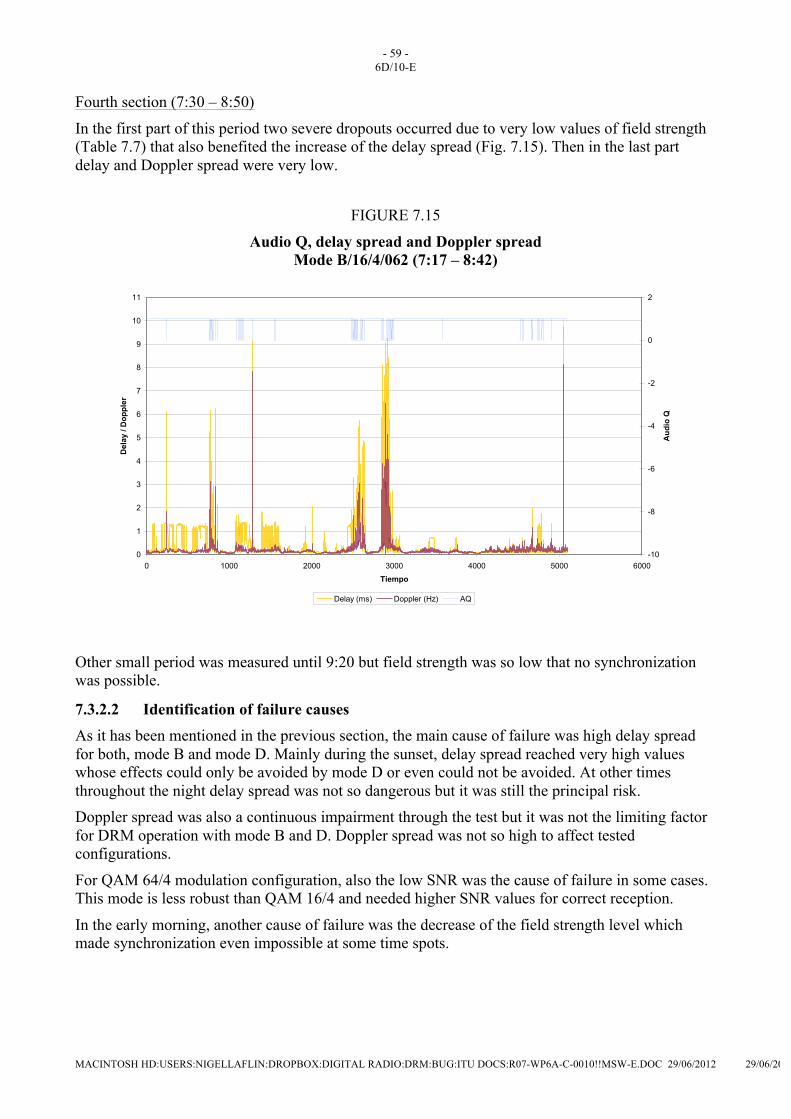
- 59 - 6D/10-E
MACINTOSH HD:USERS:NIGELLAFLIN:DROPBOX:DIGITAL RADIO:DRM:BUG:ITU DOCS:R07-WP6A-C-0010!!MSW-E.DOC 29/06/2012 29/06/2012
Fourth section (7:30 – 8:50)
In the first part of this period two severe dropouts occurred due to very low values of field strength (Table 7.7) that also benefited the increase of the delay spread (Fig. 7.15). Then in the last part delay and Doppler spread were very low.
FIGURE 7.15
Audio Q, delay spread and Doppler spread Mode B/16/4/062 (7:17 – 8:42)
NVIS 22 (7:17-8:42) - Campo, Delay, Doppler, AQ y SNR VS tiempo
0
1
2
3
4
5
6
7
8
9
10
11
0 1000 2000 3000 4000 5000 6000
Tiempo
Del
ay /
Dop
pler
-10
-8
-6
-4
-2
0
2
Aud
io Q
Delay (ms) Doppler (Hz) AQ
Other small period was measured until 9:20 but field strength was so low that no synchronization was possible.
7.3.2.2 Identification of failure causes As it has been mentioned in the previous section, the main cause of failure was high delay spread for both, mode B and mode D. Mainly during the sunset, delay spread reached very high values whose effects could only be avoided by mode D or even could not be avoided. At other times throughout the night delay spread was not so dangerous but it was still the principal risk. Doppler spread was also a continuous impairment through the test but it was not the limiting factor for DRM operation with mode B and D. Doppler spread was not so high to affect tested configurations.
For QAM 64/4 modulation configuration, also the low SNR was the cause of failure in some cases. This mode is less robust than QAM 16/4 and needed higher SNR values for correct reception.
In the early morning, another cause of failure was the decrease of the field strength level which made synchronization even impossible at some time spots.
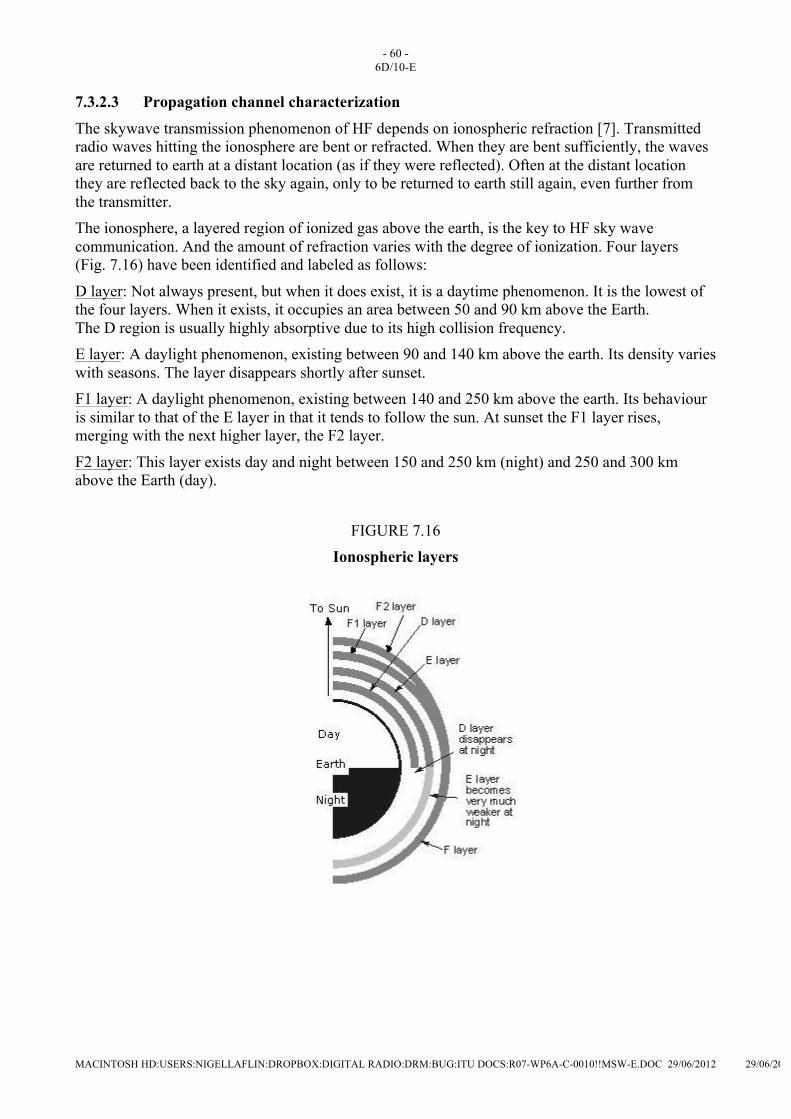
- 60 - 6D/10-E
MACINTOSH HD:USERS:NIGELLAFLIN:DROPBOX:DIGITAL RADIO:DRM:BUG:ITU DOCS:R07-WP6A-C-0010!!MSW-E.DOC 29/06/2012 29/06/2012
7.3.2.3 Propagation channel characterization
The skywave transmission phenomenon of HF depends on ionospheric refraction [7]. Transmitted radio waves hitting the ionosphere are bent or refracted. When they are bent sufficiently, the waves are returned to earth at a distant location (as if they were reflected). Often at the distant location they are reflected back to the sky again, only to be returned to earth still again, even further from the transmitter. The ionosphere, a layered region of ionized gas above the earth, is the key to HF sky wave communication. And the amount of refraction varies with the degree of ionization. Four layers (Fig. 7.16) have been identified and labeled as follows:
D layer: Not always present, but when it does exist, it is a daytime phenomenon. It is the lowest of the four layers. When it exists, it occupies an area between 50 and 90 km above the Earth. The D region is usually highly absorptive due to its high collision frequency. E layer: A daylight phenomenon, existing between 90 and 140 km above the earth. Its density varies with seasons. The layer disappears shortly after sunset. F1 layer: A daylight phenomenon, existing between 140 and 250 km above the earth. Its behaviour is similar to that of the E layer in that it tends to follow the sun. At sunset the F1 layer rises, merging with the next higher layer, the F2 layer.
F2 layer: This layer exists day and night between 150 and 250 km (night) and 250 and 300 km above the Earth (day).
FIGURE 7.16 Ionospheric layers

- 61 - 6D/10-E
MACINTOSH HD:USERS:NIGELLAFLIN:DROPBOX:DIGITAL RADIO:DRM:BUG:ITU DOCS:R07-WP6A-C-0010!!MSW-E.DOC 29/06/2012 29/06/2012
The “reflection” can take place at the E Region and the F1 and/or F2 Regions. In some circumstances RF energy can be reflected back from any two or all three Regions at once and communications can be by one-hop, two-hop or three-hop depending on path length and ionospheric conditions. This multiple reflection, involving multiple paths, means that different signals arrive at the receiver at different times. The difference in time between the earliest and the latest reflections to arrive at the receiver will define the delay spread or time dispersion which is an especially serious and destructive impairment to digital communication signals on HF.
Another relevant impairment in HF receivers is frequency dispersion. Experience on operating HF circuits has shown that frequency dispersion (Doppler spread) nearly always is present when there is time dispersion. But the converse does not necessarily hold true. The Doppler shift and spread are due to a drifting ionosphere. As the signal encounters elemental surfaces of the ionosphere, each one with a different velocity vector, the result is a Doppler spread. Such Doppler shifts and spreads can have disastrous effects.
Particularly, in the case of NVIS the impairments are more severe, specially delay spread. One rough rule of thumb is that an NVIS path will experience about 10 times as much dispersion as an equivalent sky wave path.
7.3.2.4 Ionosphere behavior estimation and comparison with test results
The ionosphere is formed by four ionized layers whose behavior changes with the time of the day, the season or the state of the sun. Due to this, continuous variation the estimation of its behavior was not easy. Nevertheless, according to the information summarized above and previous trials carried out in Ecuador [9] and Thailand [10] some conclusions were obtained. Channel conditions change throughout the day but sunset and sunrise are the periods when the main variations of the ionosphere occur. As a result, is during these periods when the ionosphere is more instable and so is the propagation channel.
During sunset layer D starts vanishing quite quickly reducing absorption but also increasing multipath in the other layers. Consequently, the signal strength should rise and become instable with high values of delay spread. At the same time, layers E, F1 and F2 change slowly until layer F is formed and layer D becomes weaker. In this situation lower delay spread remains but the instability diminishes. The same conditions persist until sunrise when ionospheric layers start changing again. As layers E and F change, the number of paths goes up and delay spread rises a bit. Then, when layer D appears, its absorption reduces multipath but also signal strength stabilizing the channel. Delay spread is the most harmful impairment provoked by ionosphere behaviour. Doppler spread does also exist but is not a limiting factor for NVIS operation. Test results reflect, as was expected, that the channel was instable during the first part of the sunset measurements. High values of delay spread made the system unavailable during some instants. Although the field strength was also instable, the estimated rise was remarkable. After an hour and during the night the situation was more stable and only some time spots around 4:30 presented severe problems of insolvable delay spread. In the last part of the test (sunrise) just two high peaks of delay spread were observed when some heavy falls of field strength took place around 7:30. Then field strength remained lower and delay and Doppler spread diminish a lot.
Summing up, estimation and results fitted in quite well but further studies should be make to get more detailed information.
7.3.2.5 Subjective quality evaluation Attendants to the NVIS measurements rated the audio quality as “good” provided availability acceptable for nighttime transmissions.

- 62 - 6D/10-E
MACINTOSH HD:USERS:NIGELLAFLIN:DROPBOX:DIGITAL RADIO:DRM:BUG:ITU DOCS:R07-WP6A-C-0010!!MSW-E.DOC 29/06/2012 29/06/2012
7.4 Conclusions
The results suggest that there is no big difference between the tested modes but further test and work is needed to reach more contrasted information about NVIS operation.
Among the tested modes, mode D/16/4/062 performs the best, with fewer dropouts. However, its audio quality is limited due to the low bit-rate. Mode D/64/4/06 allows higher bit-rate but needs very high SNR. Mode B performs quite well but is more sensible to delay and Doppler spread. The test showed that there will be some time spots where the system will be unavailable due to strong ionospheric multipath (delay and Doppler), that cannot be overcome by any mode and robustness configuration. These unavailability times were in the range of a few minutes and were found to occur at the very beginning of dusk. More experiments are needed in order to corroborate this conclusion.
Attendants rated the system availability as “acceptable” and, in general, audio quality as good.
8 Conclusions
The conclusions based on the measurement results are summarized in the following paragraphs: The AM and DRM coverage using the simulcast mode was confirmed to be equivalent following a radial route from the transmitter. In some environments within this radial, the DRM outperformed by far the AM reception. It showed an approximately 100 km coverage radius using a transmitted power of 96.17 kW for AM signal and 3.82 kW for DRM signal. In the case of urban environments, e.g. city downtown, they are properly covered by simulcast signal up to 15 km reaching more than 98 % of correctly received locations. Another important conclusion is that the simulcast configuration does not interfere significantly the transmitted AM signal using a set of representative receivers of Indian Market. The results show that using different robustness modes and back-off ratios, the A/16/4/05/S mode was found to be the most appropriate configuration for urban environments. Other DRM modes, A/64/16/0.5 (with 21.2 kbps) would have a similar performance, except for some spots behind big buildings and locations near intense man-made noise sources. The full DRM mode 18 kHz wide in MW band was tested “live” with near FM audio quality and circuit reliability in a harsh radio environment. Urban environments are covered in an excellent way using this DRM configuration with 50 kW DRM broadcasted power.
The 26 MHz was considered by the participants and attendees as being one of the most promising applications for the Asian continent. The reception quality was very good at the locations and routes tested reaching more than the 98 % of the locations measured in static and mobile modes. It is capable of achieving a near FM audio quality for local coverage using an antenna placed in a 40 m height tower. The NVIS nighttime applications were found very interesting and the results within this short test period encourage further testing by the participants for possible regular use of this band. The results reflected that the variation of the ionospheric conditions determine the performance of this type of propagation, the main problem being the delay spread. This could normally be avoided by using a robust mode but there were some spots where reception was impossible. The participants rated the performance of NVIS reception as acceptable but audio quality for robust modes was considered poor.
- 63 - 6D/10-E
MACINTOSH HD:USERS:NIGELLAFLIN:DROPBOX:DIGITAL RADIO:DRM:BUG:ITU DOCS:R07-WP6A-C-0010!!MSW-E.DOC 29/06/2012 29/06/2012
9 Acknowledgements
This document has been produced by the DRM Consortium (Hitatchi Kokusai, Thomson BM, Himalaya and the University of the Basque Country), All India Radio and the Asia-Pacific Broadcasting Union (ABU). The work has been coordinated by the University of the Basque Country (UPV/EHU)
The authors would like to thank the ABU broadcaster members (from Iran, Papua New Guinea, Singapore, Bhutan and Brunei) who participated in the event in New Delhi and collaborated in the field trials.
10 References
[1] ITU-R , “Recommendation ITU-R BS.1615, “Planning parameters” for digital sound broadcasting at frequencies below 30 MHz”, International Telecommunication Union 2003.
[2] ETSI, “ES 201 980 V2.2.1. Digital Radio Mondiale (DRM); System specification”, European Telecommunication Standardization Institute. October 2005.
[3] Recommendation ITU-R P.368-8, “Ground-wave propagation curves for frequencies between10 kHz and 30 MHz”; International Telecommunication Union. 2006.
[4] Recommendation ITU-R BS.1284, “General methods for the subjective assessment of sound quality”, International Telecommunication Union 2003.
[5] Document 6E/274 “Digital Radio Mondiale. DRM local coverage using the 26 MHz broadcasting band”; September 2005.
[6] I. Peña et Al “Analysis of the ITU-R P.1546-2 prediction method accuracy for DRM local coverage using the 26 MHz band”, 57th Annual IEEE Broadcast Symposium; accepted for publication.
[7] “Telecommunications transmission Handbook”, Fourth Edition, Roger L. Freeman. [8] “Broadcasters’ user Manual”, 1st ed. A Digital Radio Mondiale (DRM) Publication,
March 2004. [9] DRM Technical Committee Document TC-SE 088, “Receptions in Ecuador and Bonaire”,
Jan Peter Werkman (Radio Netherlands), Andy Giefer, (BBC Research & Development). Version 2.1; February 2001.
[10] DRM Technical Committee Document TC SE 199, “ DRM NVIS Test in Thailand made during October 2002”, Grahame Dobson, VT Merlin Communications, Version 2.0. May 2003.
______________