digital radio frequency memories
TRANSCRIPT
Winter 2015
Digital Radio Frequency Memories
Class Notes
Dave Adamy
Adamy Engineering1420 Norfolk Ave, Atwater, CA 95301
Tel(209)357-4433 Fax(209)357-4434
www.lynxpub.com

Scope of Course
• Overview of the DRFM Function
• Digitization Issues
• Modern RADAR Features
• RCS analysis issues
• How DRFMs recreate Complex Waveforms
• Extra Appendix – How to use Slide Rule

Handout Material
• Course Syllabus
– All visual aids + exercise work-sheets
• EW Pocket Guide
• Antenna & Propagation Slide Rule

Follow-up Material
When issues that require follow-up arise in class,they will be put onto the following server site:
https: //lynxpub.homeserver.com
User name: StudentPassword: !Ne3dthefile
Note that there is no www in the address. There are also full size copies of nomographs, etcthat you can download from this site.

Further Reading
The material in this course is primarily taken fromChapter 8 of the new text book EW104 (Artech House 2015)

The DRFM Function
• A DRFM digitizes an RF Signal, modifies it in a computer, and coherently rebroadcasts the modified signal– I & Q digitization is required to preserve
phase information
• A DRFM can also generate a multifaceted signal to accurately represent the RADAR return from a real (complex) target

FILTER
FILTER ADC
DAC
MEMORYLOCALOSC
COMPUTER
BASIC DRFM BLOCK DIAGRAM
SIGNALIN
SIGNALOUT

¼ λ
Independent Samples
I & Q DIGITIZATION

FILTER
FILTERWIDEBAND
ADC
DAC
MEMORYDRFML.O.
COMPUTERSYSTEML.O.
IF BandInput
IF BandOutput
WIDEBAND DRFM
WIDEBAND DRFM

PW
R D
IVC
OM
BIN
ER
DRFMLPF
VCO VCO VCO
LPF
LPF
LPF
LPF
LPF
DRFM
DRFM
SYSTEML.O.
SIGNALIN
SIGNALOUT
NARROWBAND DRFM

Velocity Cells R
an
ge C
ell
s
Determined by pulse return time
Determined by Doppler filterIn which signalIs received
PULSE-DOPPLER RADAR PROCESSINGPD RADARExpects Return withinOne filter

Angular coverageOf antenna scan
Target
AntennaBeam width
SCANNING RADAR TARGET COVERAGE
PD radar has processing gain= CPI x PRF
CPI can equal illumination time

Frequency
ChaffCloud
RadarTransmissionFrequency
ReflectedSpectrumSpread by Chaff DipoleMovement
Wind
DopplerShift from
wind
CHAFF CLOUD DIPOLE MOVEMENT

Velocity Cells
Ran
ge C
ell
s
Velocity cellsFrom Doppler FilterCorresponding toTrue relative rangeRate of target
Velocity cellsFrom Doppler FilterCorresponding toRange rate of jammingplatform
ACTUALTARGET
FALSETARGETFROMJAMMER
SEPERATING TARGETS IN PD RADARS

Frequency
RandomlyChosenPulseTransmissionFrequencies
Hopping Range
FREQUENCY HOPPING RADARS

Frequency
PulseFrequencies
NoiseJammingFrequencyRange
LEAST JAMMED FREQUENCY COVERAGE

Frequency
PulseFrequencies
JammingFrequencies
BANDWIDTH MATCHED JAMMING

Frequency
PulseFrequencies
Noise SpreadAcross HoppingRange
JAMMING
SPREADING OF JAMMING SIGNAL
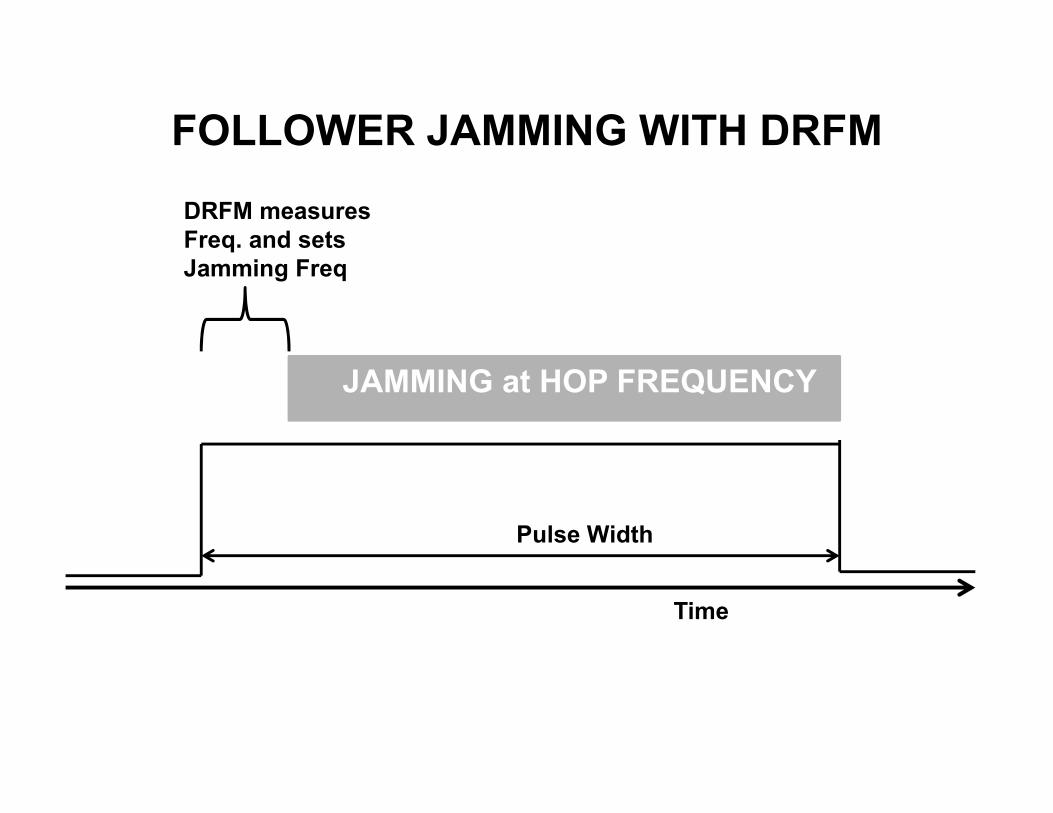
Time
Pulse Width
DRFM measuresFreq. and setsJamming Freq
JAMMING at HOP FREQUENCY
FOLLOWER JAMMING WITH DRFM

TIME
ER
P
TIME
FR
EQ
UE
NC
Y
CHIRPED PULSE

RADAR RESOLUTION CELL WITHOUT COMPRESSION RADAR RESOLUTION CELL
WITH LFMOP COMPRESSION
RESOLUTION CELL WITH CHIRP
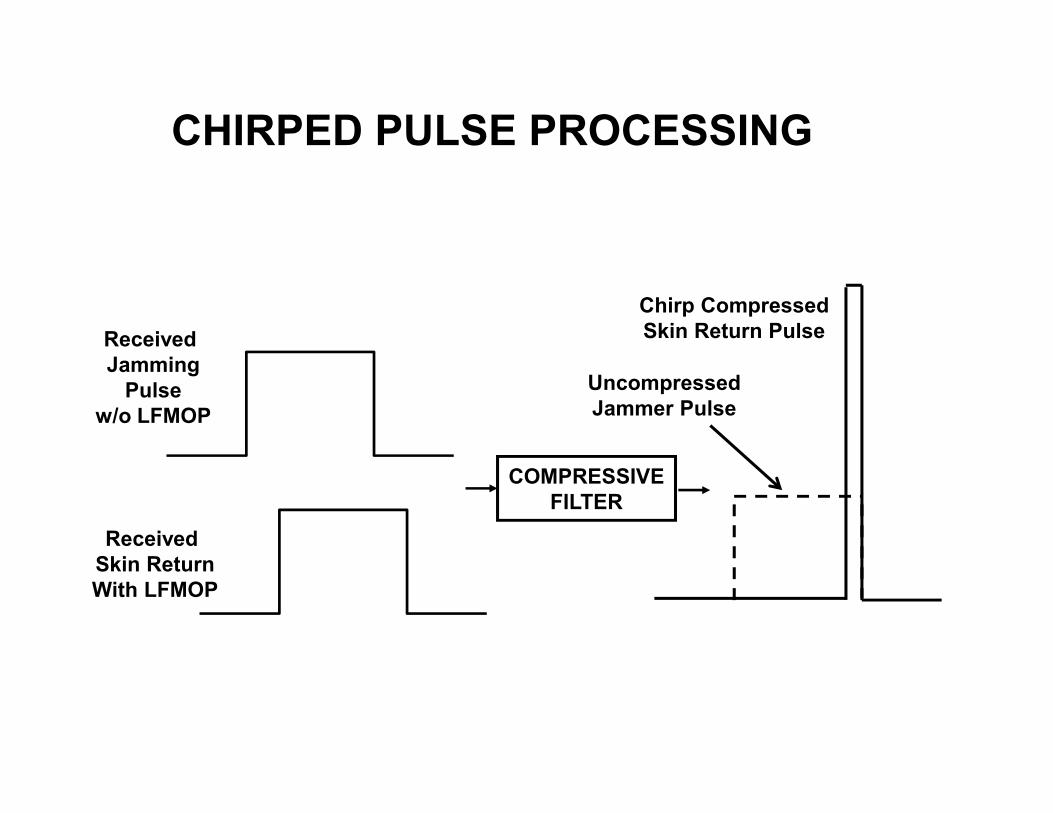
COMPRESSIVEFILTER
Received Skin ReturnWith LFMOP
Chirp CompressedSkin Return PulseReceived
JammingPulse
w/o LFMOP
UncompressedJammer Pulse
CHIRPED PULSE PROCESSING
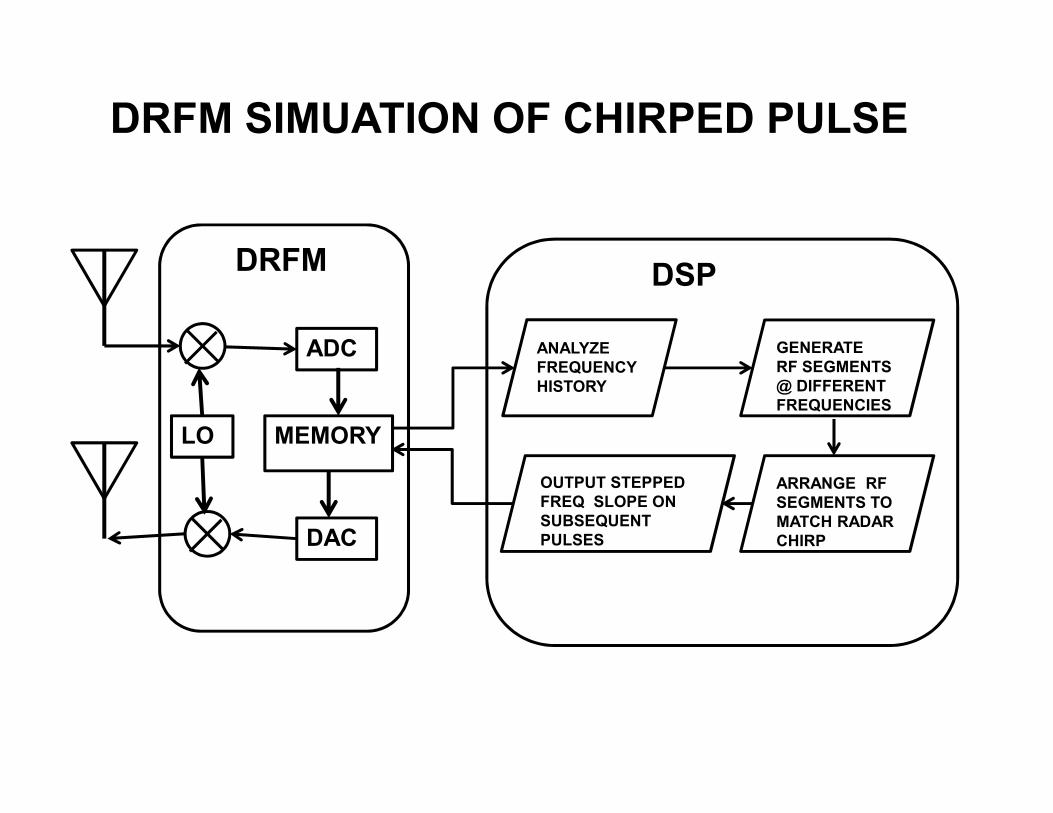
DSPDRFM
ADC
DAC
MEMORYLO
ANALYZEFREQUENCYHISTORY
GENERATERF SEGMENTS@ DIFFERENTFREQUENCIES
ARRANGE RFSEGMENTS TOMATCH RADARCHIRP
OUTPUT STEPPED FREQ SLOPE ON SUBSEQUENT PULSES
DRFM SIMUATION OF CHIRPED PULSE
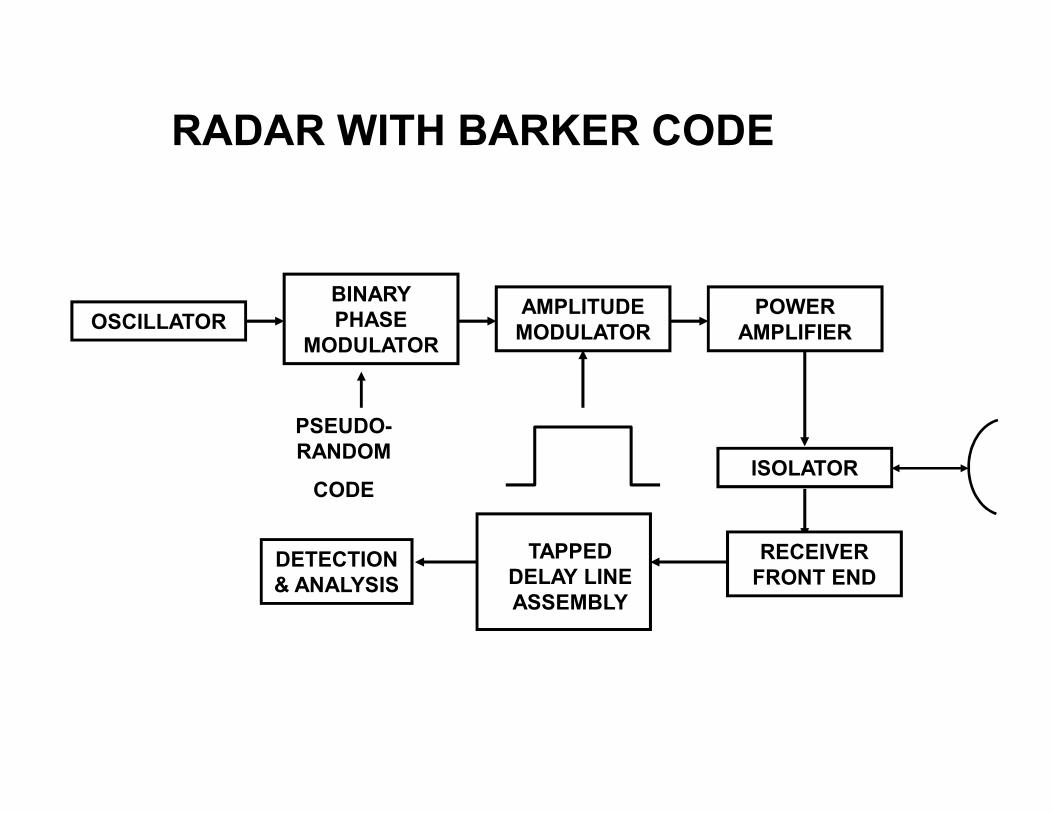
OSCILLATOR
BINARY PHASE
MODULATOR
AMPLITUDEMODULATOR
POWERAMPLIFIER
ISOLATOR
RECEIVERFRONT END
TAPPEDDELAY LINEASSEMBLY
DETECTION& ANALYSIS
PSEUDO-RANDOM
CODE
RADAR WITH BARKER CODE

is180°Phase Shift
SUMMEDOUTPUT
INPUT
TAPPED DELAY LINE
180° Phase Shift
TIME
+ + + - - + -
PULSE DURATION
BITDURATION
INPUT TO TAPPED DELAY LINE
OUTPUT FROM TAPPED
DELAY LINE BITDURATION
BARKER CODE PROCESSING

3 dB beamwidthUNCOMPRESSEDRADAR RESOLUTIONCELL
HALF PULSE DURATION(x SPEED OF LIGHT)
1 ft/nsec
COMPRESSEDRADAR RESOLUTIONCELL
RESOLUTION CELL WITH BARKER CODE
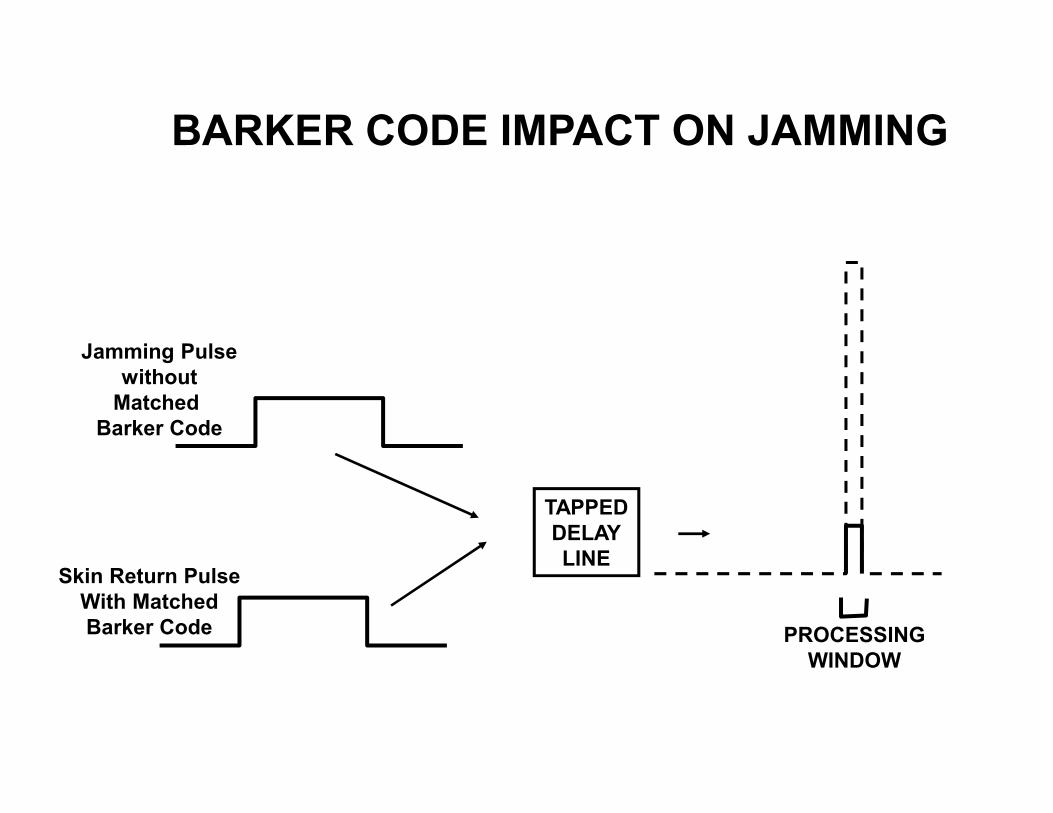
Skin Return PulseWith MatchedBarker Code
TAPPEDDELAYLINE
Jamming Pulsewithout
Matched Barker Code
PROCESSINGWINDOW
BARKER CODE IMPACT ON JAMMING

DRFM PROCESSOR
RFPULSESFROM
RADAR
COHERENTRFJAMMING PULSESTORADAR
DigitizedRadarPulses
Determine bit duration and code from 1st pulse
Generate digital “one” & “zero” code bits
Assemble correct bitsto reproduce radar code
Modify pulse amplitude, frequency and timing for jamming modulation
DigitizedJamming
Pulses
DRFM HANDLING OF BARKER CODE
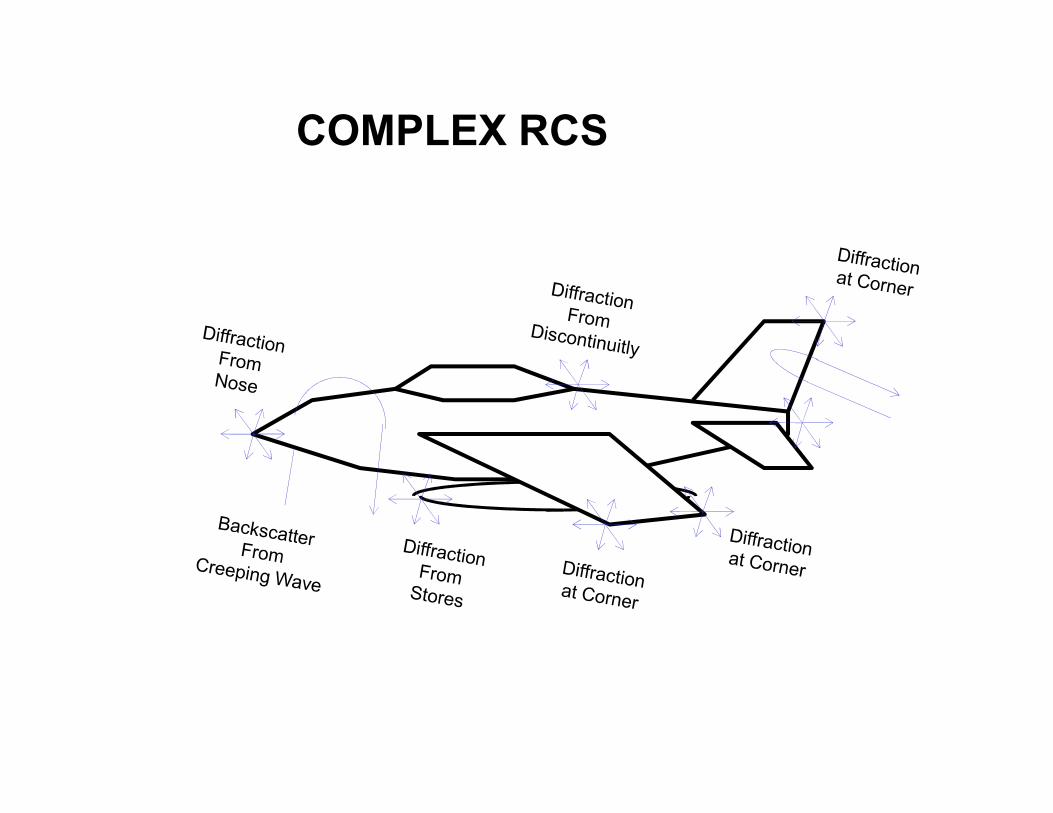
COMPLEX RCS

RADAR
TURN TABLE
RADIOABSORPTIVEMATERIAL
RADIOTRANSPARENTSUPPORT
TARGET
RCS MEASUREMENT IN CHAMBER

CONECONICALSECTION
CONICALSECTION
CURVEDPLATES
COMPLEXCURVEDSHAPE
INTERSECTIONOF TWO CURVEDSURFACES
CYLINDER
RCS COMPONENTS

Realistic Return Pulses
SIMPLE PULSE
REALISTIC RETURN PULSE
TARGET RETURNS
Modern RADAR may reject simple pulse
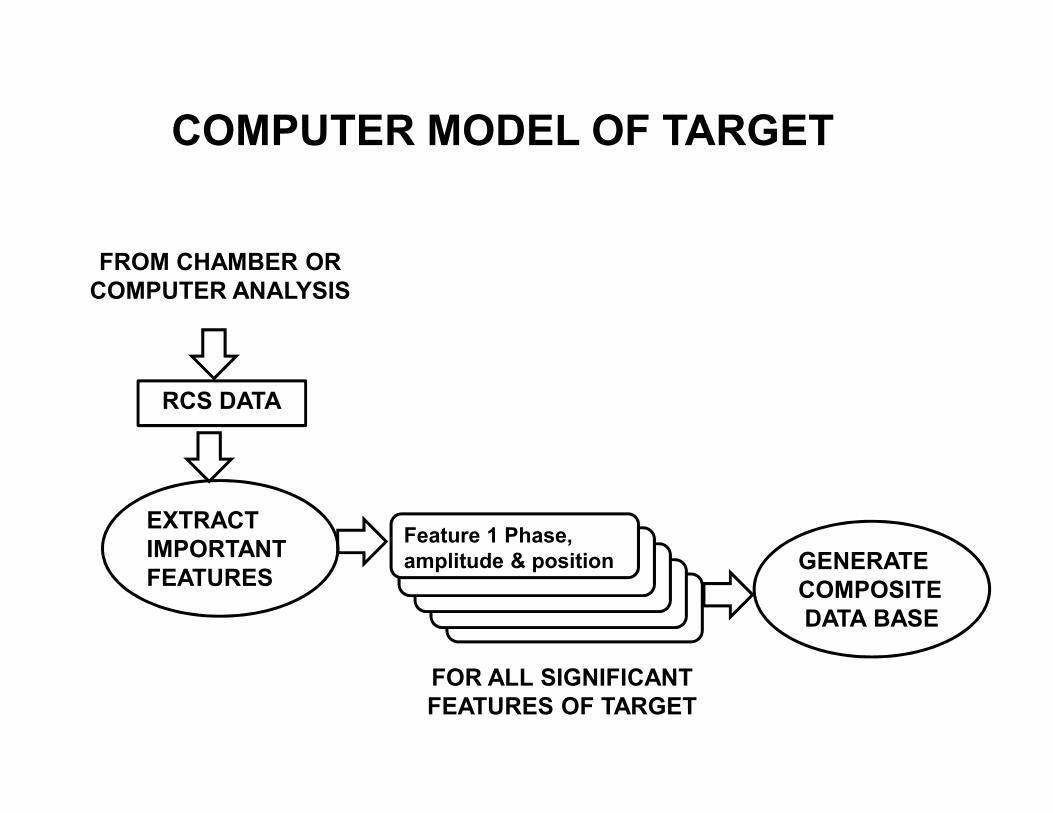
EXTRACTIMPORTANTFEATURES
RCS DATA
FROM CHAMBER ORCOMPUTER ANALYSIS
Feature 1 Phase, amplitude & position GENERATE
COMPOSITEDATA BASE
FOR ALL SIGNIFICANTFEATURES OF TARGET
COMPUTER MODEL OF TARGET

TOXMTR
DOPPLER MODULATORA/D MEMORY D/A
CONTROL
DOPPLER MODULATORA/D MEMORY D/A
CONTROL
DOPPLER MODULATORA/D MEMORY D/A
CONTROL
X
COMBINER
X
LO
FROMRCVR
COMPLEX RCS IN OLDER SYSTEMS

FROMRCVR
A/D
DOPPLERGENERATOR
MODULATOR RANGEDELAY
QUADRATUREGENERATION
COMBINER
DOPPLERGENERATOR
MODULATOR RANGEDELAY
DOPPLERGENERATOR
MODULATOR RANGEDELAY
DOPPLERGENERATOR
MODULATOR RANGEDELAY
D/ATO
XMTR
SINGLE DRFM WITH FPGAs

DRFM Based Decoy
This is an expendable radar decoy (called Bright Star) from SELEX. It inclues multiple DRFMs.
An issue is that it is the size of a beer can and thus needs a specialDispenser

ReceivedWaveform
TransmittedWaveform
PulseWidth
Maximum ProcessLatency
TIMING OF PULSE CAPTURE

Pulse Width
Analysis Increments
ReceivedFrequencyModulation
TransmittedFrequencyModulation
DRFM CAPTURE OF CHIRP
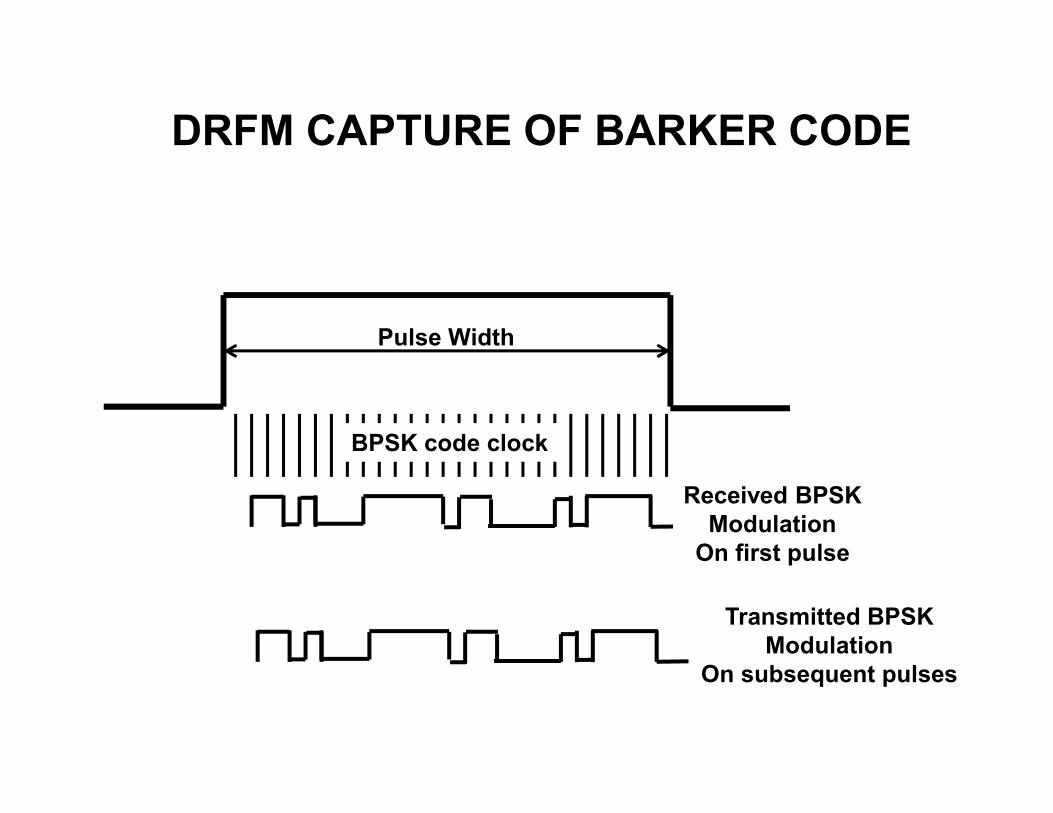
Pulse Width
BPSK code clock
Transmitted BPSKModulation
On subsequent pulses
Received BPSKModulation
On first pulse
DRFM CAPTURE OF BARKER CODE
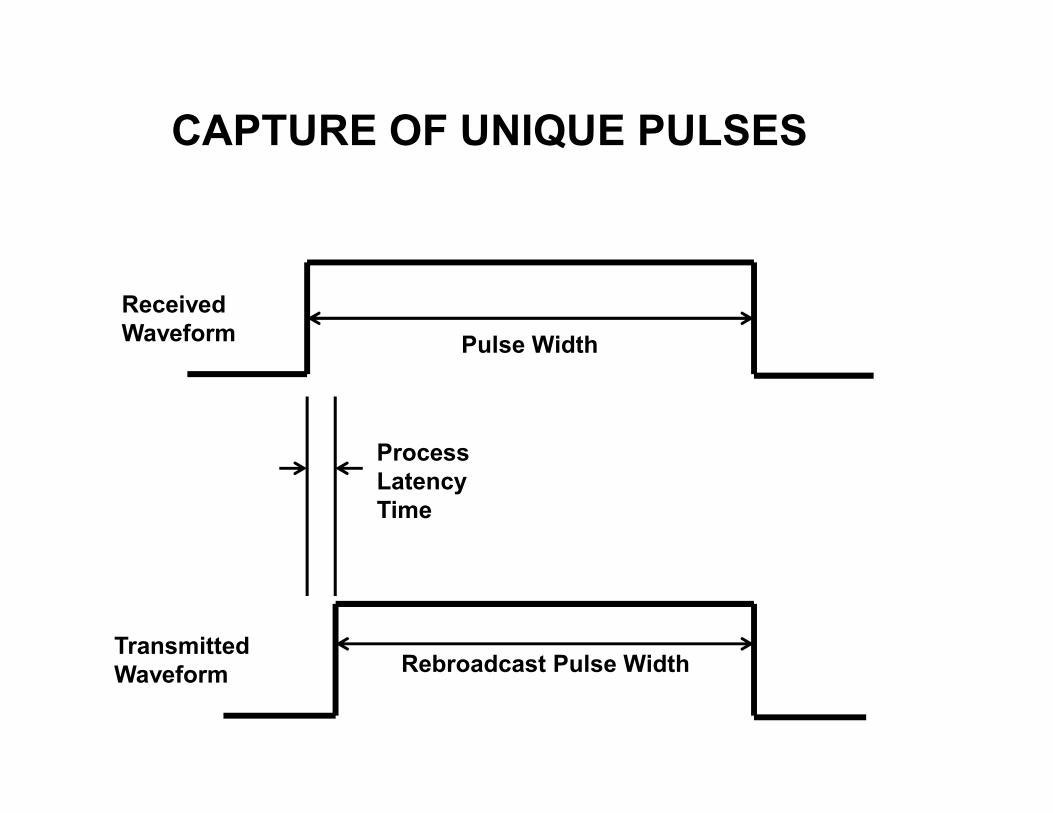
ReceivedWaveform
TransmittedWaveform
ProcessLatencyTime
Pulse Width
Rebroadcast Pulse Width
CAPTURE OF UNIQUE PULSES

Doppler Frequency Cells
Non-coherentJamming
signal
CoherentSkin
Return
COHERENT PULSE vs NON-COHERENT JAMMING
in PD RADAR

Radar Pulses
Radar tracks on leading edge
LEADING EDGE TRACKINGvs RGPO

DRFM captures frequency
Fre
qu
en
cy
Radar Pulse
JammerPulse
DRFM captures frequency
Radar Pulse
JammerPulse
DRFM captures frequency
Radar Pulse
JammerPulse
Time
DRFM CAPTURE of FREQUENCY HOPPED PULSES

DRFM captures PulseCompression modulation parameters
Radar pulses
Pulses have matched pulse compression modulation
Jammer Pulses
DRFM CAPTURE OF PC RADAR PULSES
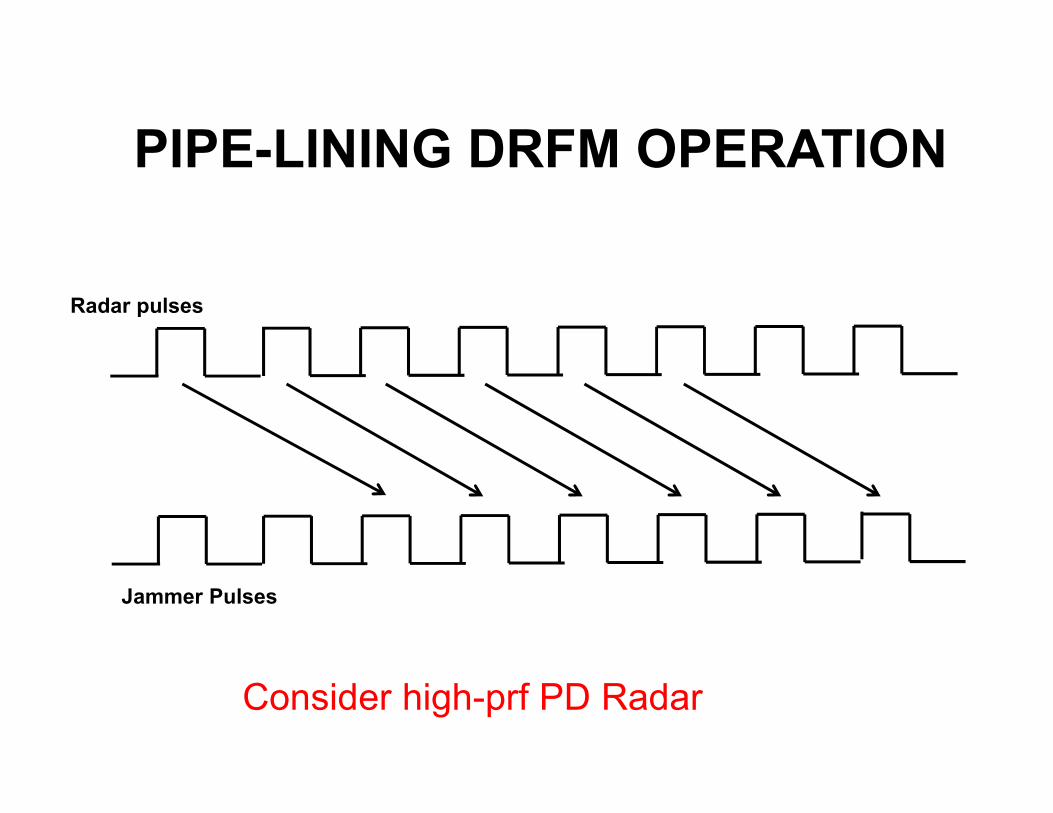
Radar pulses
Jammer Pulses
PIPE-LINING DRFM OPERATION
Consider high-prf PD Radar

CURRENT DRFM SPECS
• Bandwidth – 1 to 2 GHz
• Number of bits – up to about 5
• Latency – less than 50 nsec.

ADC OVERSAMPLING
• The Problem– Need very high sampling rate for Bandwidth
– Need multiple Bits to Avoid Spurs
– ADCs trade off speed vs # of Bits
• The Solution Approaches– Tapped Delay Line
– Shift Registers with 1 bit Digitizers

Series-parallel Sampling
MUX
TAPPED DELAY LINE
Δt 2Δt 3Δt 4Δt
ADC ADC ADC ADC ADC
SIGNALIN
DIGITALOUTPUT
(Clock rate)
Clock/5
Digitizes at 5 x max ADC rate

1 bit DRFM• Hard Limit signal
• Really Fast (much faster than A/D Conv)
• Capture zero crossings
• Spurs a problem
• This captures the frequency of signal only
• Requires no A/D converter
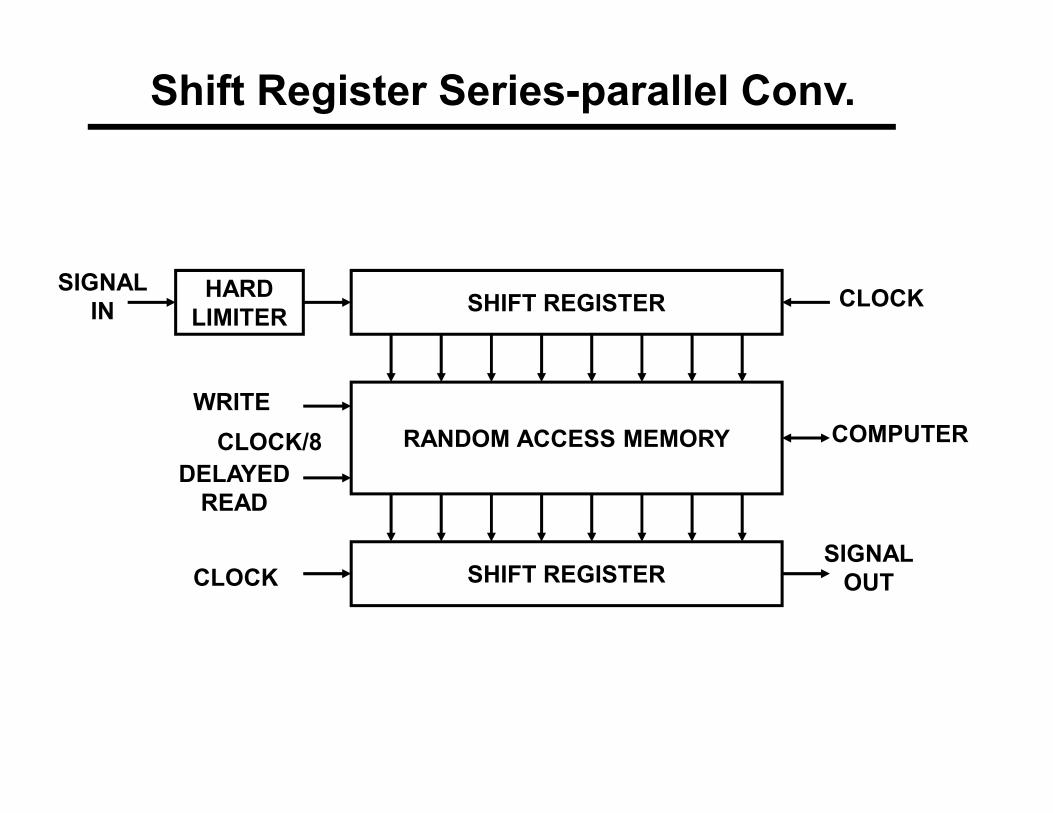
Shift Register Series-parallel Conv.
HARDLIMITER
SHIFT REGISTER
SHIFT REGISTER
RANDOM ACCESS MEMORY
SIGNALIN
SIGNALOUT
WRITE
DELAYEDREAD
CLOCK
CLOCK/8
CLOCK
COMPUTER

Appendix
Extra SlidesHow to Use Slide Rule

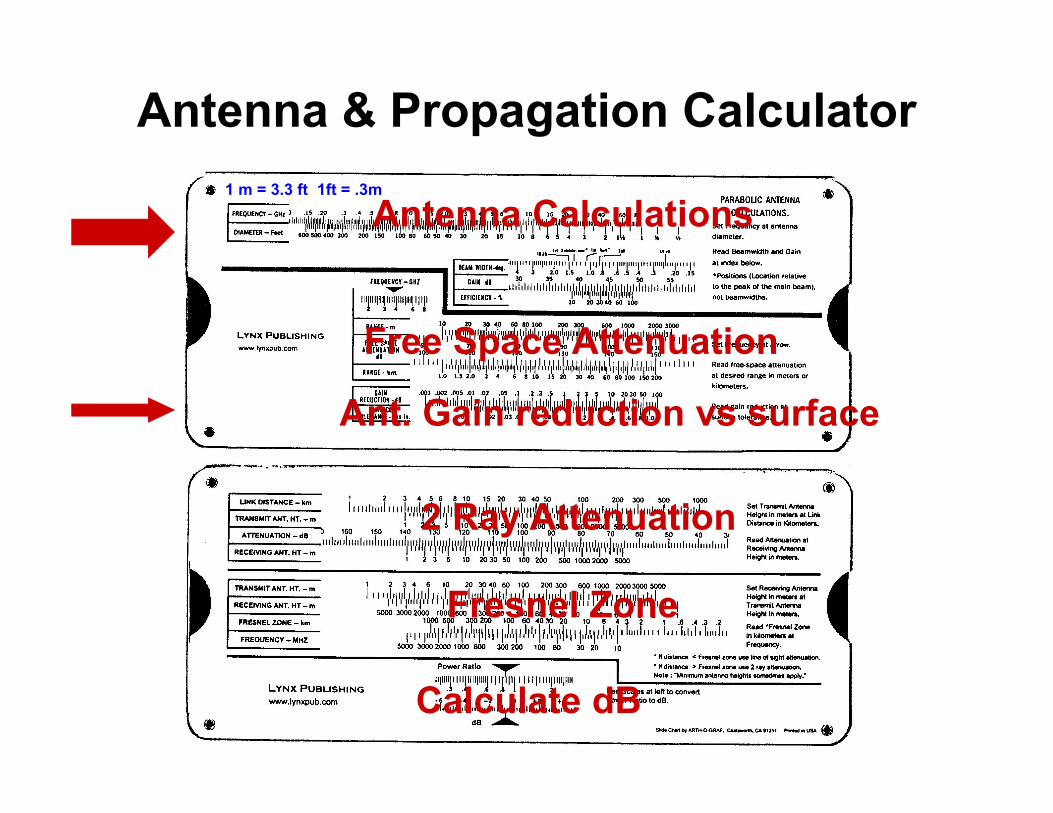
Antenna & Propagation Calculator
Ant. Gain reduction vs surface
Fresnel Zone
2 Ray Attenuation
Antenna Calculations
Free Space Attenuation
Calculate dB
1 m = 3.3 ft 1ft = .3m
1
2

Antenna Amplitude Pattern
Antenna & Propagation Calculator
Ant. Gain reduction vs surface
Fresnel Zone
2 Ray Attenuation
Antenna Calculations
Free Space Attenuation
Calculate dB
1 m = 3.3 ft 1ft = .3m

Antenna Scales
Antenna Scales

Antenna Gain & Beamwidth
Set Antenna Diameter (in ft) at Frequency (in GHz)

Antenna Gain & Beamwidth (cont)
Read Boresight Gain at Efficiency
Note 55% efficiency for Narrow Bandwidth antennas
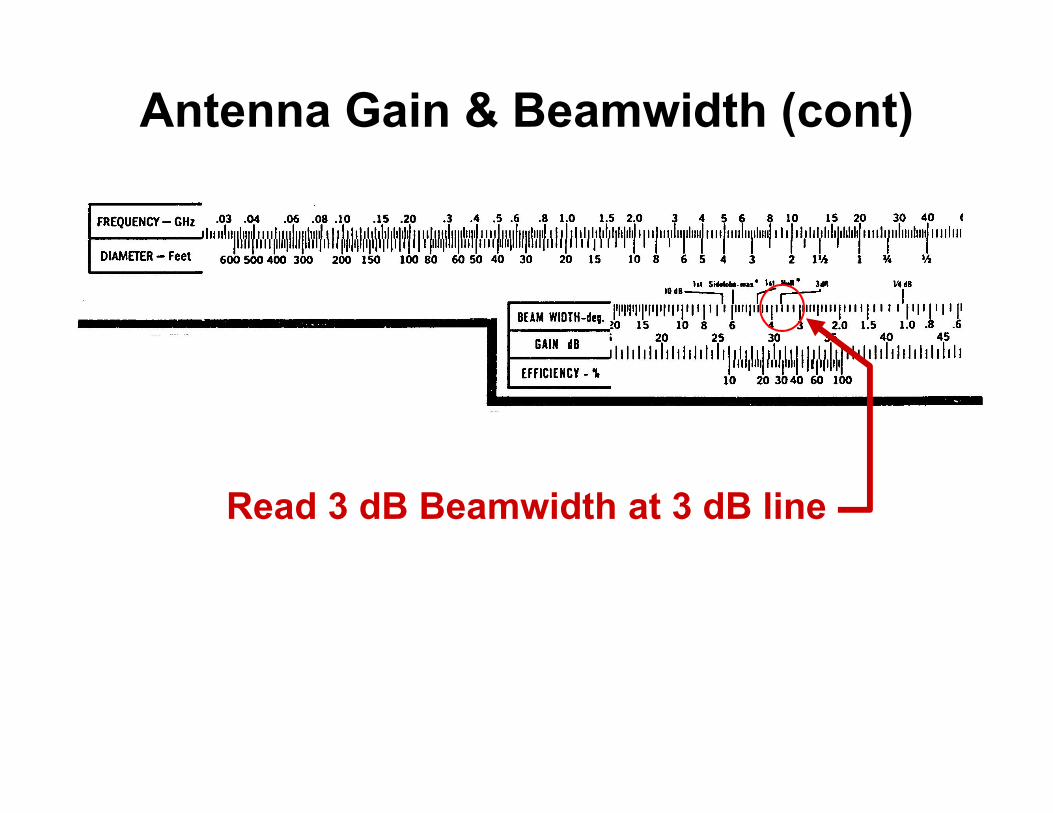
Antenna Gain & Beamwidth (cont)
Read 3 dB Beamwidth at 3 dB line

Antenna Gain & Beamwidth (cont)
Read 10 dB Beamwidth at 10 dB line

First Null
First Null and Sidelobe
FirstSidelobe

Gain reduction vs. Surface Tolerance
Frequency
Gain reduction vs Surface Tolerance

Gain Reduction
Frequency
Surface Tolerance
Gain Reduction

Free Space Attenuation from Formula
LS = 32.44 + 20 Log(d) + 20 Log(f)
LS = Spreading loss between isotropic antennas (in dB)d = distance in kmf = frequency in MHz32 is a fudge factor
Warning: This equation only works if exactly
the right units are input
Some Extra Information, not in book:
If Distance in kilometers: round 32.44 to 32 for 1 dB calculationsIf Distance in staturte miles: replace 32.44 with 36.52 (round to 37)
If Distance is in nautical miles: replace 32.44 with 37.74 (round to 38)
15

Antenna & Propagation Calculator
Ant. Gain reduction vs surface
Fresnel Zone
2 Ray Attenuation
Antenna Calculations
Free Space Attenuation
Calculate dB
sm = 1.6 kmnm = 1.15 sm
1
2

Front of Antenna/Propagation slide rule with line of sight attenuation scales highlighted
1

Free Space Attenuation from Slide Rule
Set Frequency

Free Space Attenuation from Slide Rule
Read Attenuation at Range

Free Space Attenuation from Slide Rule
Also notice short range scale (in meters)

Two Ray Attenuation
Also called: 40 Log d attenuationdistance4 attenuation
Determined from: FormulaNomographSlide Rule
Applicable when: One primary reflectorFrequency lowAntennas wide
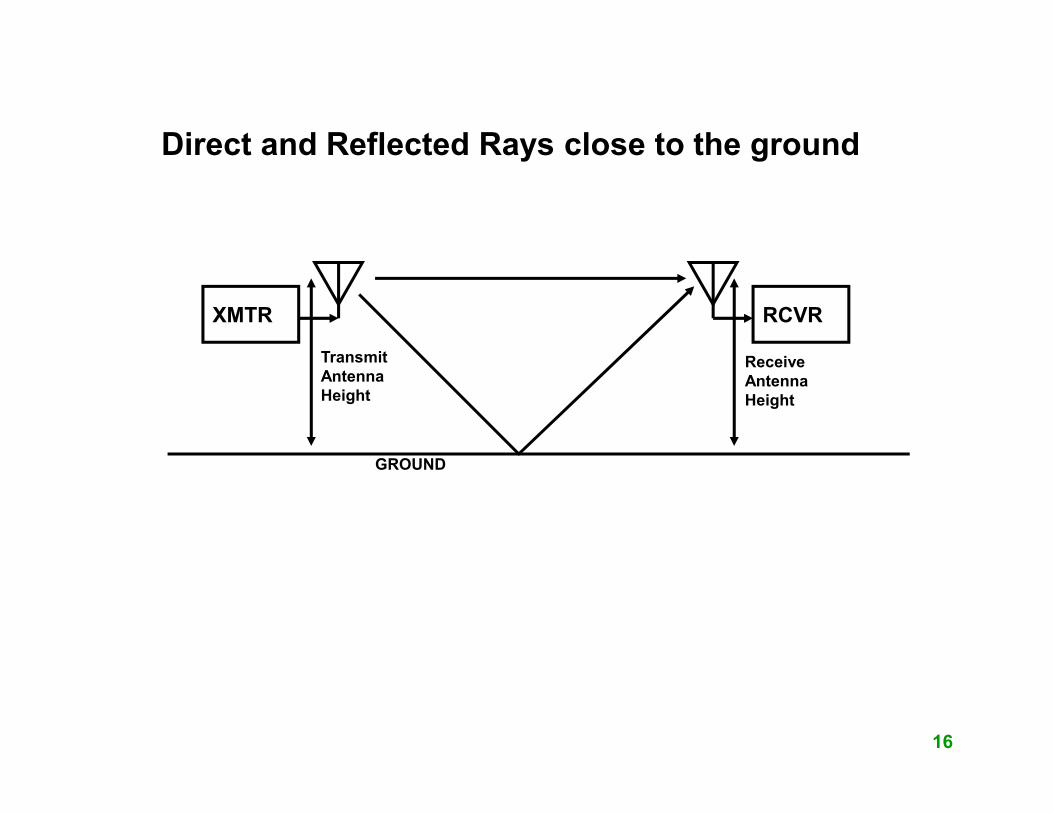
Direct and Reflected Rays close to the ground
XMTR RCVR
GROUND
TransmitAntennaHeight
ReceiveAntennaHeight
16

Two Ray Attenuation from Formula
LS = 120 + 40 Log(d) - 20 Log(hT) - 20 Log(hR)
LS = Spreading loss between isotropic antennas (in dB)d = distance in kmhT = height of transmit antenna in metershR = height of receiving antenna in meters
Warning: This equation only works if exactly
the right units are input
Note:There is no frequency termMinimum antenna heights may apply
30 MHz over good soil 10 meters(to 3 meters at 60 MHz & 1 meter at 200 MHz)
Higher over salt waterUse higher of actual or minimum antenna height
16

Antenna & Propagation Calculator
Ant. Gain reduction vs surface
Fresnel Zone
2 Ray Attenuation
Antenna Calculations
Free Space Attenuation
Calculate dB
1
2
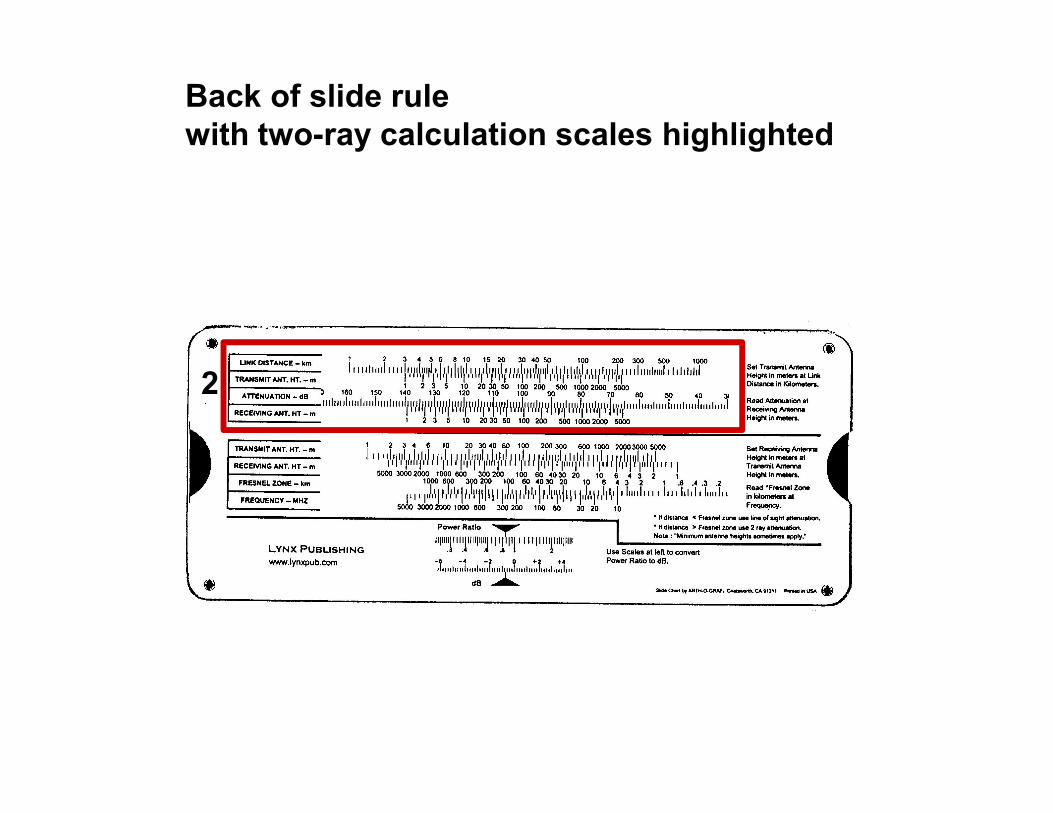
Back of slide rulewith two-ray calculation scales highlighted
2

Two Ray Attenuation from Slide Rule
Set Transmit antenna height at link distance

Two Ray Attenuation from Slide Rule
Read attenuation at receiving antenna height

Propagation mode vs. Fresnel zone distance
XMTR
RCVR
Fresnel Zone Distance
RCVR
13

Fresnel Zone Calculation
FZ = [hT x hR x F] / 24,000
Where: FZ = Fresnel Zone in kmhT = Transmit antenna height in metershR = Receiving antenna height in metersF = frequency in MHz
13

Antenna & Propagation Calculator
Ant. Gain reduction vs surface
Fresnel Zone
2 Ray Attenuation
Antenna Calculations
Free Space Attenuation
Calculate dB
1
2
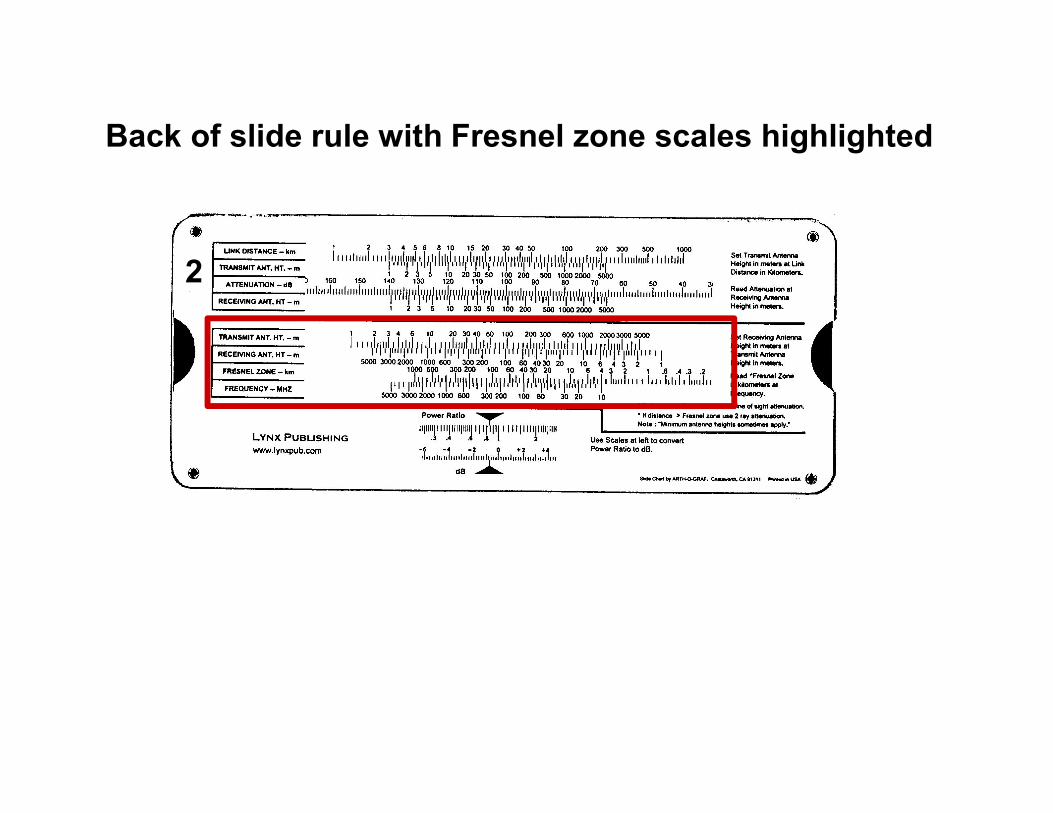
Back of slide rule with Fresnel zone scales highlighted
2

Fresnel Zone from Slide Rule
Align transmit and receive antenna heights(both in meters)
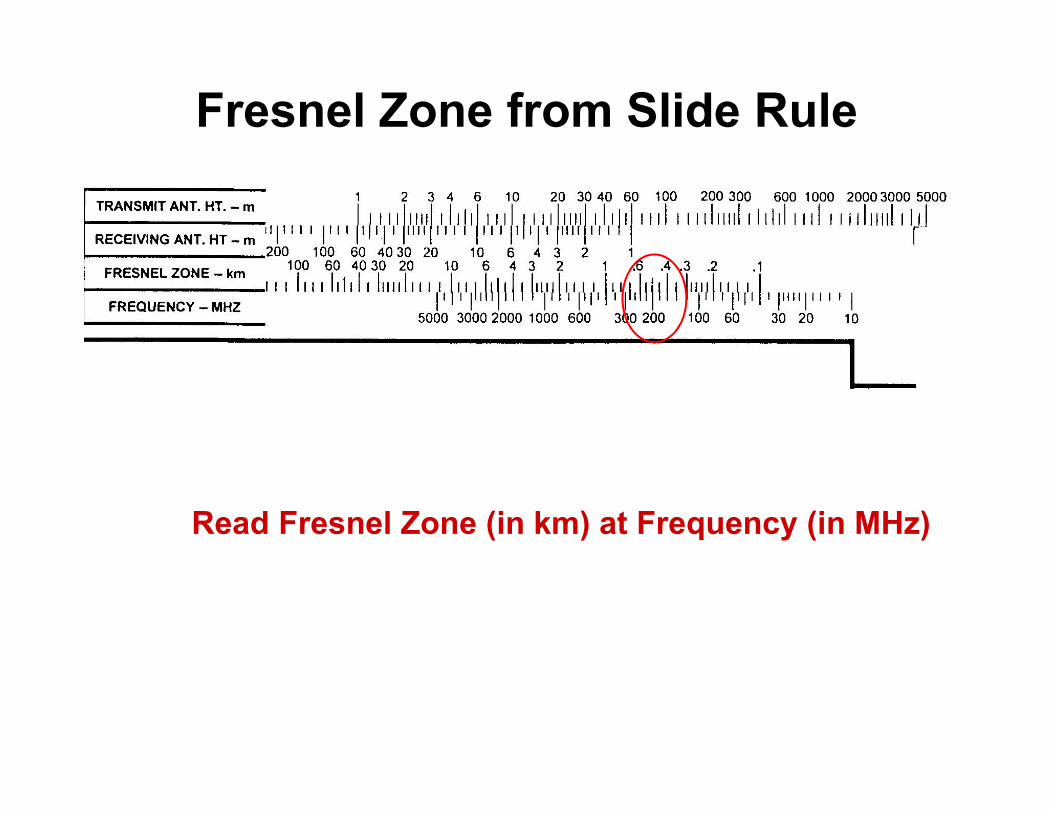
Fresnel Zone from Slide Rule
Read Fresnel Zone (in km) at Frequency (in MHz)