digital market overview - ukom
TRANSCRIPT
Digital Market
Overview
June 2020
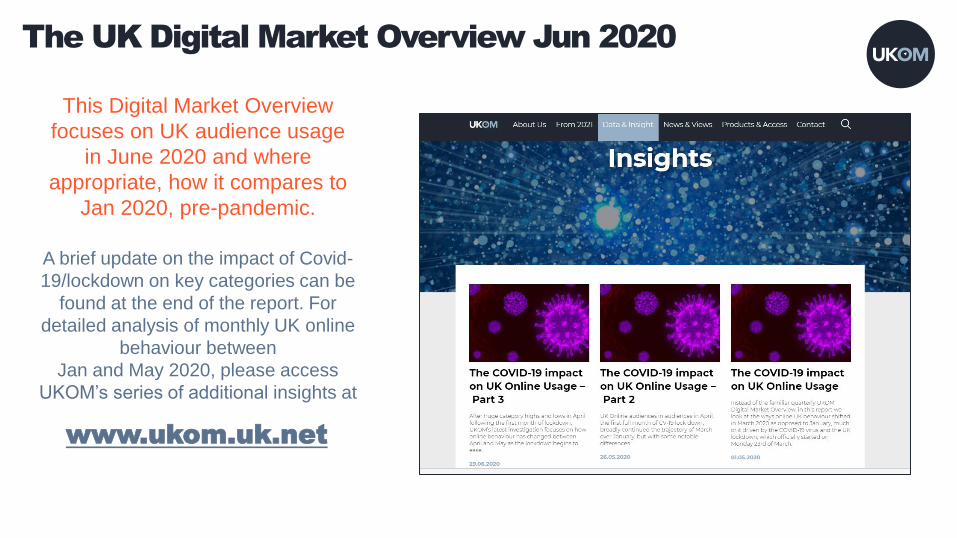
A brief update on the impact of Covid-
19/lockdown on key categories can be
found at the end of the report. For
detailed analysis of monthly UK online
behaviour between
Jan and May 2020, please access
UKOM’s series of additional insights at
www.ukom.uk.net
This Digital Market Overview
focuses on UK audience usage
in June 2020 and where
appropriate, how it compares to
Jan 2020, pre-pandemic.
The UK Digital Market Overview Jun 2020

Audience by Platform
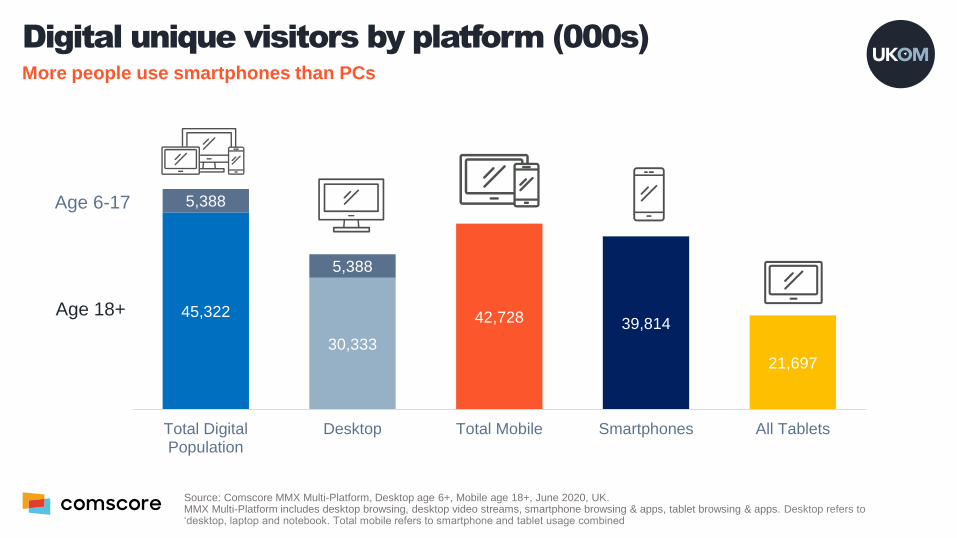
Digital unique visitors by platform (000s)More people use smartphones than PCs
Age 18+
Age 6-17
45,322
30,333
42,728 39,814
21,697
5,388
5,388
Total DigitalPopulation
Desktop Total Mobile Smartphones All Tablets
Source: Comscore MMX Multi-Platform, Desktop age 6+, Mobile age 18+, June 2020, UK.MMX Multi-Platform includes desktop browsing, desktop video streams, smartphone browsing & apps, tablet browsing & apps. Desktop refers to ‘desktop, laptop and notebook. Total mobile refers to smartphone and tablet usage combined
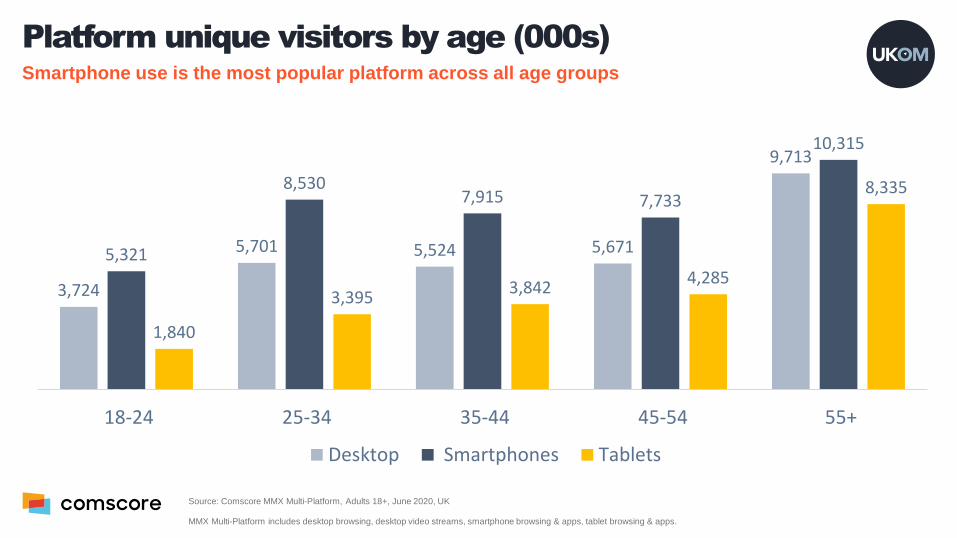
Platform unique visitors by age (000s)Smartphone use is the most popular platform across all age groups
3,724
5,701 5,524 5,671
9,713
5,321
8,5307,915 7,733
10,315
1,840
3,3953,842
4,285
8,335
18-24 25-34 35-44 45-54 55+
Desktop Smartphones Tablets
Source: Comscore MMX Multi-Platform, Adults 18+, June 2020, UK
MMX Multi-Platform includes desktop browsing, desktop video streams, smartphone browsing & apps, tablet browsing & apps.
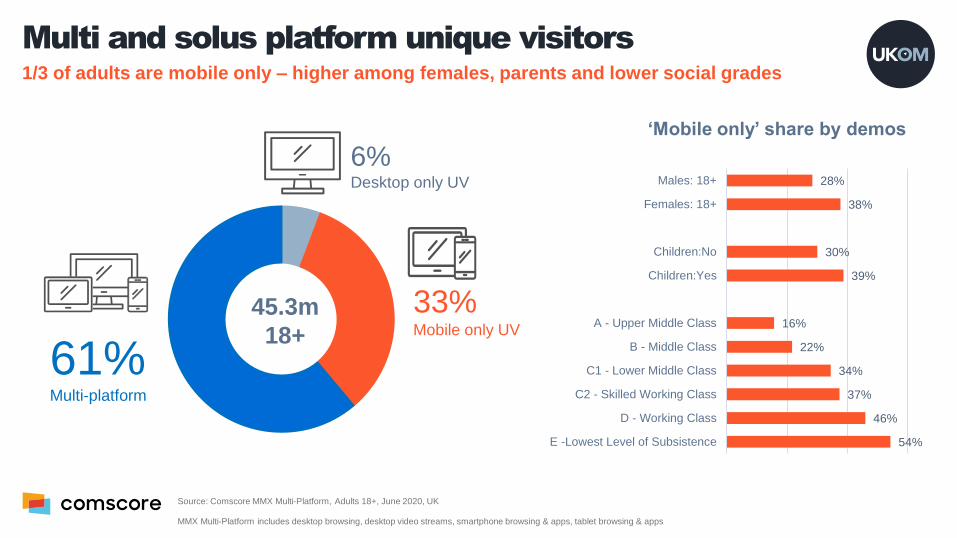
Multi and solus platform unique visitors1/3 of adults are mobile only – higher among females, parents and lower social grades
45.3m
18+
61%Multi-platform
6%Desktop only UV
33%Mobile only UV
Source: Comscore MMX Multi-Platform, Adults 18+, June 2020, UK
MMX Multi-Platform includes desktop browsing, desktop video streams, smartphone browsing & apps, tablet browsing & apps
28%
38%
30%
39%
16%
22%
34%
37%
46%
54%
Males: 18+
Females: 18+
Children:No
Children:Yes
A - Upper Middle Class
B - Middle Class
C1 - Lower Middle Class
C2 - Skilled Working Class
D - Working Class
E -Lowest Level of Subsistence
‘Mobile only’ share by demos

Time online
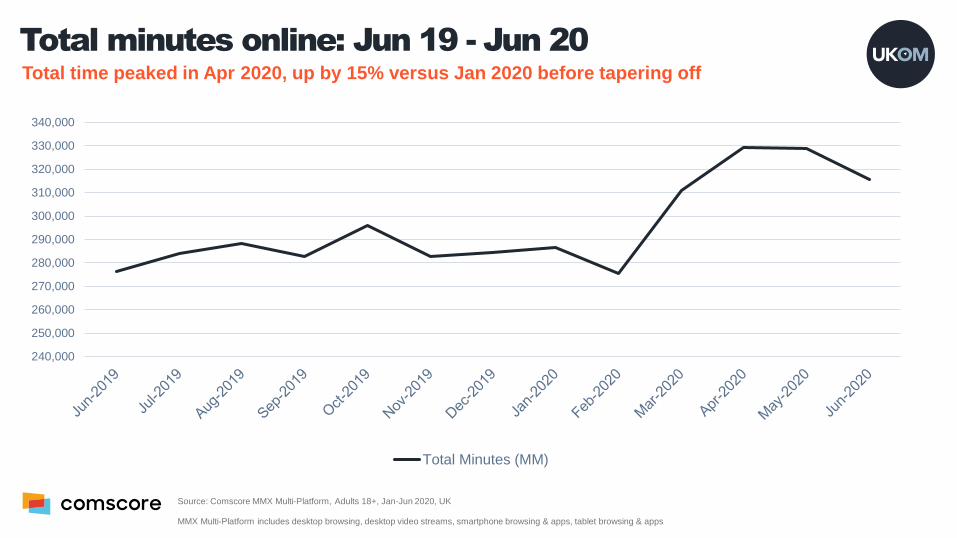
Total minutes online: Jun 19 - Jun 20Total time peaked in Apr 2020, up by 15% versus Jan 2020 before tapering off
Source: Comscore MMX Multi-Platform, Adults 18+, Jan-Jun 2020, UK
MMX Multi-Platform includes desktop browsing, desktop video streams, smartphone browsing & apps, tablet browsing & apps
240,000
250,000
260,000
270,000
280,000
290,000
300,000
310,000
320,000
330,000
340,000
Total Minutes (MM)
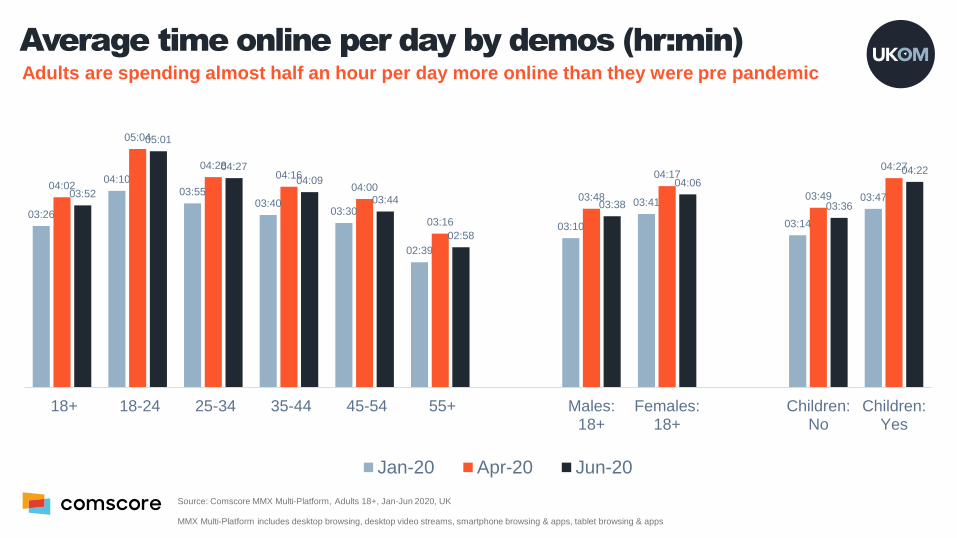
Average time online per day by demos (hr:min)Adults are spending almost half an hour per day more online than they were pre pandemic
03:26
04:1003:55
03:4003:30
02:39
03:10
03:41
03:14
03:4704:02
05:04
04:2804:16
04:00
03:16
03:48
04:17
03:49
04:27
03:52
05:01
04:27
04:09
03:44
02:58
03:38
04:06
03:36
04:22
18+ 18-24 25-34 35-44 45-54 55+ Males:18+
Females:18+
Children:No
Children:Yes
Jan-20 Apr-20 Jun-20
Source: Comscore MMX Multi-Platform, Adults 18+, Jan-Jun 2020, UK
MMX Multi-Platform includes desktop browsing, desktop video streams, smartphone browsing & apps, tablet browsing & apps
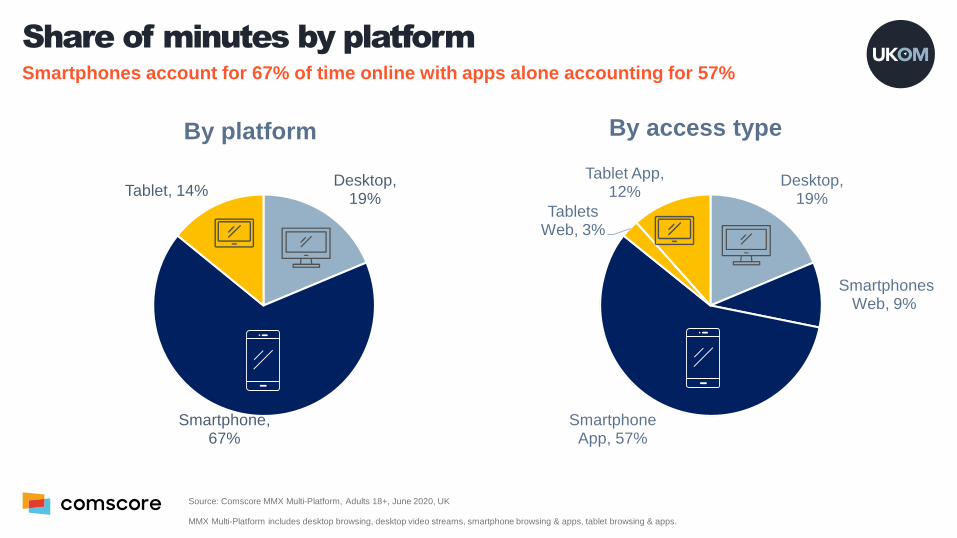
Share of minutes by platformSmartphones account for 67% of time online with apps alone accounting for 57%
Desktop, 19%
Smartphone, 67%
Tablet, 14%
By platform
Desktop, 19%
Smartphones Web, 9%
Smartphone App, 57%
Tablets Web, 3%
Tablet App, 12%
By access type
Source: Comscore MMX Multi-Platform, Adults 18+, June 2020, UK
MMX Multi-Platform includes desktop browsing, desktop video streams, smartphone browsing & apps, tablet browsing & apps.
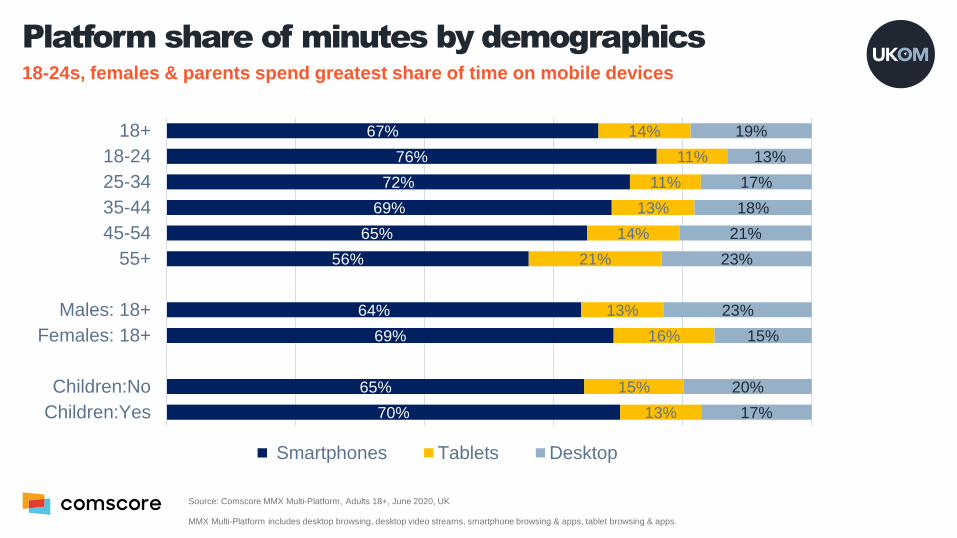
Platform share of minutes by demographics18-24s, females & parents spend greatest share of time on mobile devices
67%
76%
72%
69%
65%
56%
64%
69%
65%
70%
14%
11%
11%
13%
14%
21%
13%
16%
15%
13%
19%
13%
17%
18%
21%
23%
23%
15%
20%
17%
18+
18-24
25-34
35-44
45-54
55+
Males: 18+
Females: 18+
Children:No
Children:Yes
Smartphones Tablets Desktop
Source: Comscore MMX Multi-Platform, Adults 18+, June 2020, UK
MMX Multi-Platform includes desktop browsing, desktop video streams, smartphone browsing & apps, tablet browsing & apps.
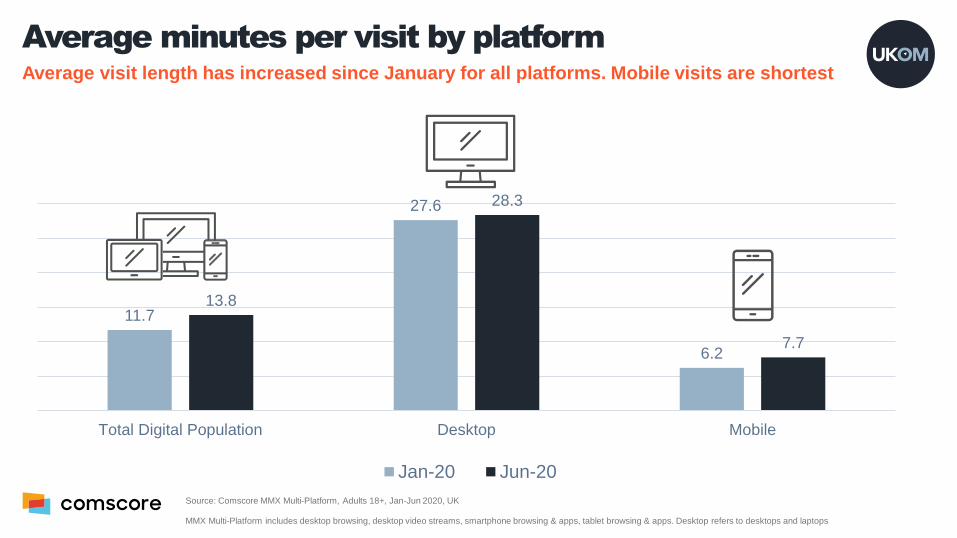
Average minutes per visit by platformAverage visit length has increased since January for all platforms. Mobile visits are shortest
11.7
27.6
6.2
13.8
28.3
7.7
Total Digital Population Desktop Mobile
Jan-20 Jun-20
Source: Comscore MMX Multi-Platform, Adults 18+, Jan-Jun 2020, UK
MMX Multi-Platform includes desktop browsing, desktop video streams, smartphone browsing & apps, tablet browsing & apps. Desktop refers to desktops and laptops
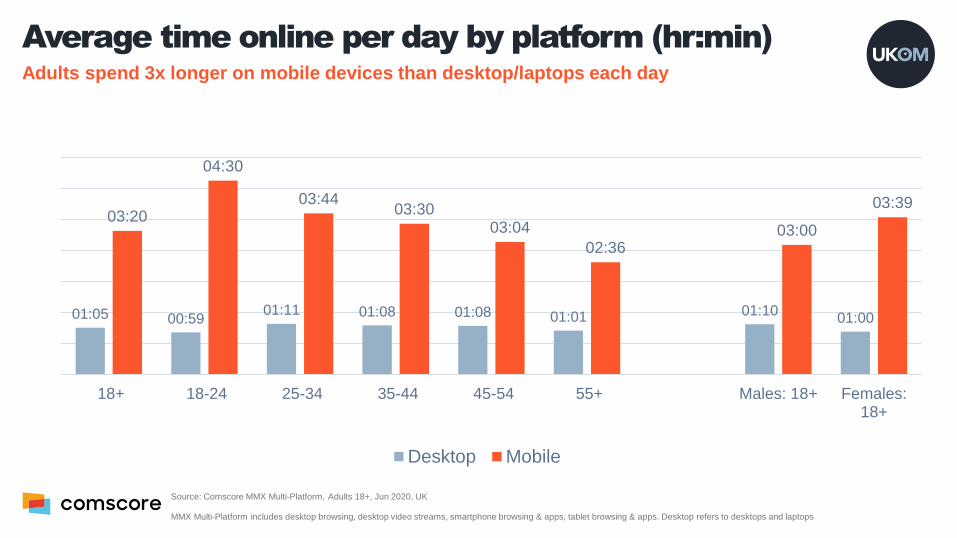
Average time online per day by platform (hr:min)Adults spend 3x longer on mobile devices than desktop/laptops each day
01:05 00:5901:11 01:08 01:08 01:01 01:10
01:00
03:20
04:30
03:4403:30
03:04
02:3603:00
03:39
18+ 18-24 25-34 35-44 45-54 55+ Males: 18+ Females:18+
Desktop Mobile
Source: Comscore MMX Multi-Platform, Adults 18+, Jun 2020, UK
MMX Multi-Platform includes desktop browsing, desktop video streams, smartphone browsing & apps, tablet browsing & apps. Desktop refers to desktops and laptops
Top Properties & Apps
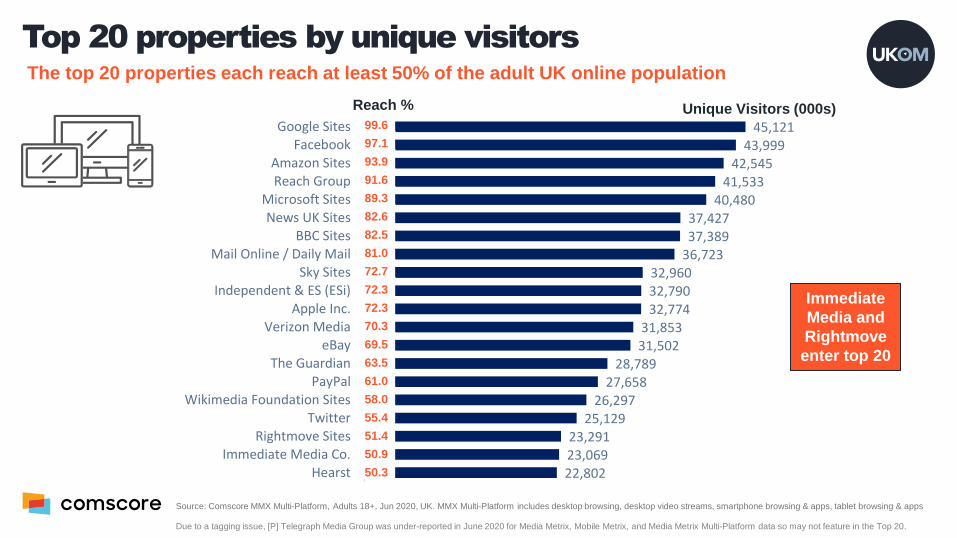
Top 20 properties by unique visitorsThe top 20 properties each reach at least 50% of the adult UK online population
45,12143,999
42,54541,533
40,48037,42737,389
36,72332,96032,79032,774
31,85331,502
28,78927,658
26,29725,129
23,29123,06922,802
Google SitesFacebook
Amazon SitesReach Group
Microsoft SitesNews UK Sites
BBC SitesMail Online / Daily Mail
Sky SitesIndependent & ES (ESi)
Apple Inc.Verizon Media
eBayThe Guardian
PayPalWikimedia Foundation Sites
TwitterRightmove Sites
Immediate Media Co.Hearst
99.6
97.1
93.9
91.6
89.3
82.6
82.5
81.0
72.7
72.3
72.3
70.3
69.5
63.5
61.0
58.0
55.4
51.4
50.9
50.3
Reach % Unique Visitors (000s)
Source: Comscore MMX Multi-Platform, Adults 18+, Jun 2020, UK. MMX Multi-Platform includes desktop browsing, desktop video streams, smartphone browsing & apps, tablet browsing & apps
Due to a tagging issue, [P] Telegraph Media Group was under-reported in June 2020 for Media Metrix, Mobile Metrix, and Media Metrix Multi-Platform data so may not feature in the Top 20.
Immediate
Media and
Rightmove
enter top 20
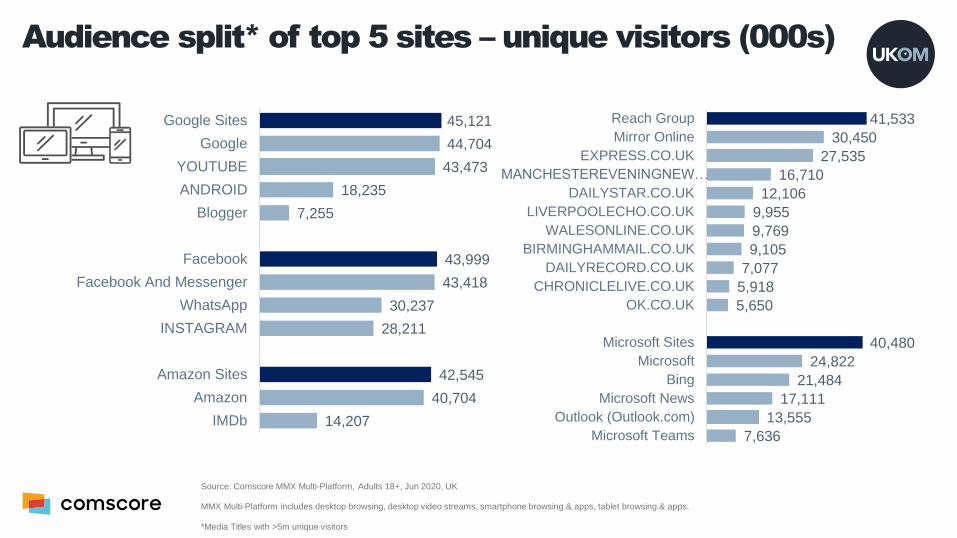
Audience split* of top 5 sites – unique visitors (000s)
45,121
44,704
43,473
18,235
7,255
43,999
43,418
30,237
28,211
42,545
40,704
14,207
Google Sites
YOUTUBE
ANDROID
Blogger
Facebook And Messenger
Amazon Sites
Amazon
IMDb
41,533
30,450
27,535
16,710
12,106
9,955
9,769
9,105
7,077
5,918
5,650
40,480
24,822
21,484
17,111
13,555
7,636
Reach Group
Mirror Online
EXPRESS.CO.UK
MANCHESTEREVENINGNEW…
DAILYSTAR.CO.UK
LIVERPOOLECHO.CO.UK
WALESONLINE.CO.UK
BIRMINGHAMMAIL.CO.UK
DAILYRECORD.CO.UK
CHRONICLELIVE.CO.UK
OK.CO.UK
Microsoft Sites
Microsoft
Bing
Microsoft News
Outlook (Outlook.com)
Microsoft Teams
Source: Comscore MMX Multi-Platform, Adults 18+, Jun 2020, UK
MMX Multi-Platform includes desktop browsing, desktop video streams, smartphone browsing & apps, tablet browsing & apps.
*Media Titles with >5m unique visitors
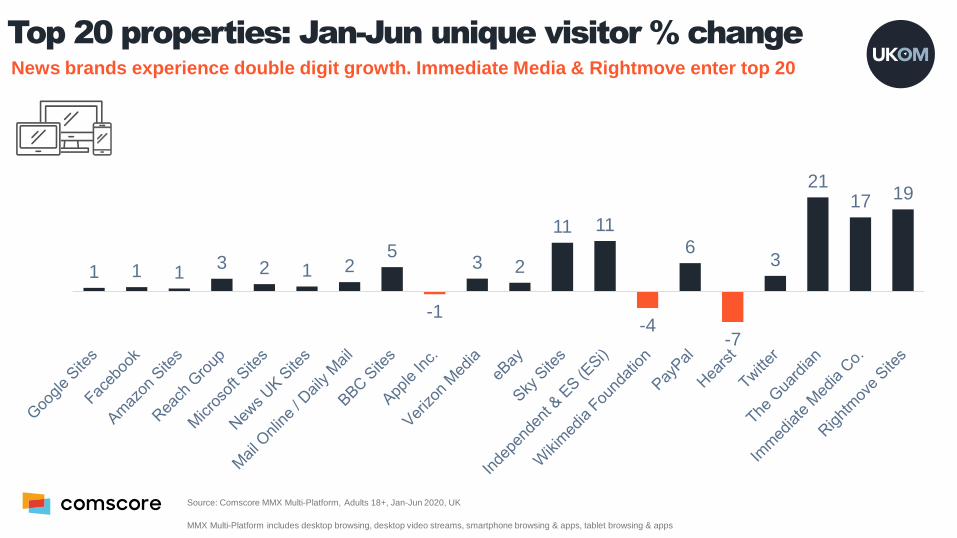
Top 20 properties: Jan-Jun unique visitor % change
Source: Comscore MMX Multi-Platform, Adults 18+, Jan-Jun 2020, UK
MMX Multi-Platform includes desktop browsing, desktop video streams, smartphone browsing & apps, tablet browsing & apps
1 1 13 2 1 2
5
-1
3 2
11 11
-4
6
-7
3
2117 19
News brands experience double digit growth. Immediate Media & Rightmove enter top 20
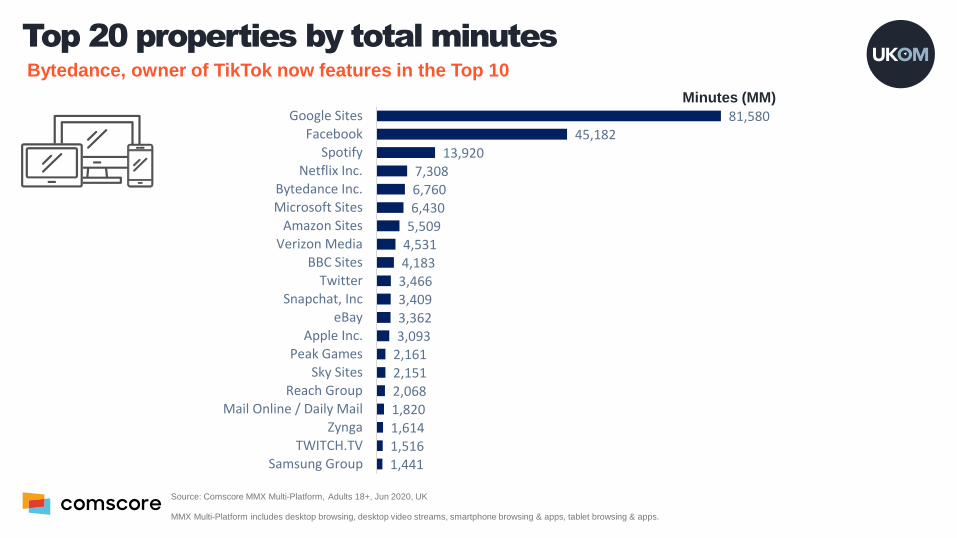
Top 20 properties by total minutesBytedance, owner of TikTok now features in the Top 10
81,58045,182
13,9207,3086,7606,430
5,5094,5314,1833,4663,4093,3623,093
2,1612,1512,0681,8201,6141,5161,441
Google SitesFacebook
SpotifyNetflix Inc.
Bytedance Inc.Microsoft Sites
Amazon SitesVerizon Media
BBC SitesTwitter
Snapchat, InceBay
Apple Inc.Peak Games
Sky SitesReach Group
Mail Online / Daily MailZynga
TWITCH.TVSamsung Group
Source: Comscore MMX Multi-Platform, Adults 18+, Jun 2020, UK
MMX Multi-Platform includes desktop browsing, desktop video streams, smartphone browsing & apps, tablet browsing & apps.
Minutes (MM)
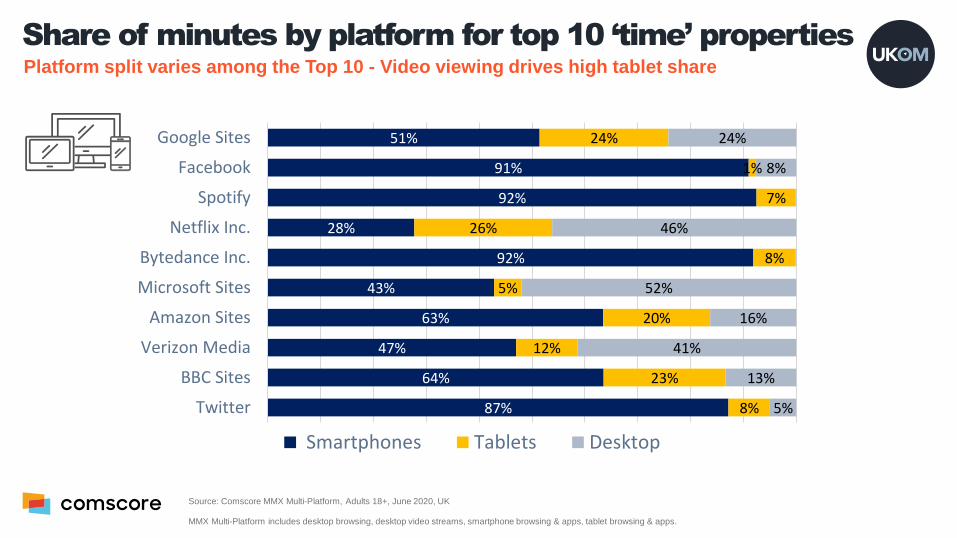
Share of minutes by platform for top 10 ‘time’ propertiesPlatform split varies among the Top 10 - Video viewing drives high tablet share
51%
91%
92%
28%
92%
43%
63%
47%
64%
87%
24%
1%
7%
26%
8%
5%
20%
12%
23%
8%
24%
8%
46%
52%
16%
41%
13%
5%
Google Sites
Spotify
Netflix Inc.
Bytedance Inc.
Microsoft Sites
Amazon Sites
Verizon Media
BBC Sites
Smartphones Tablets Desktop
Source: Comscore MMX Multi-Platform, Adults 18+, June 2020, UK
MMX Multi-Platform includes desktop browsing, desktop video streams, smartphone browsing & apps, tablet browsing & apps.
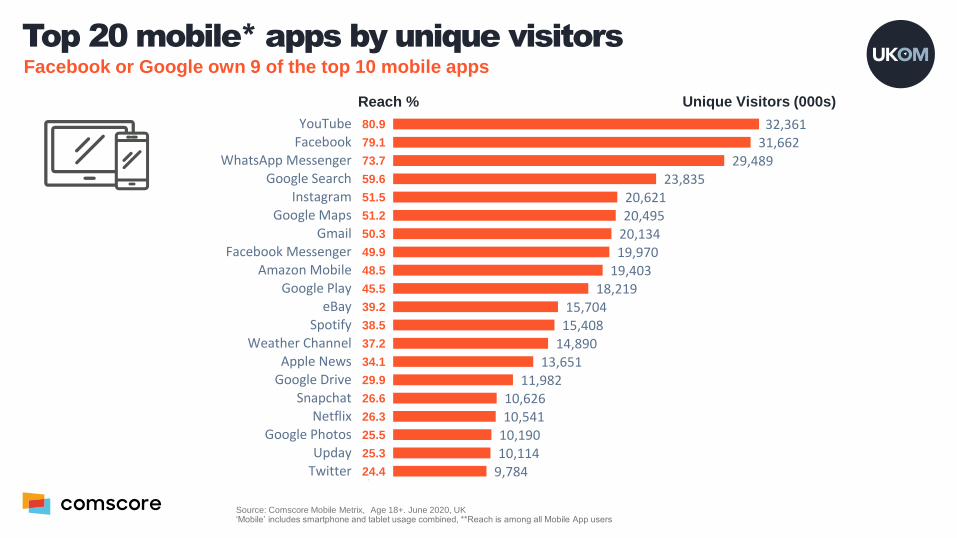
Top 20 mobile* apps by unique visitorsFacebook or Google own 9 of the top 10 mobile apps
32,36131,662
29,48923,835
20,62120,495
20,13419,970
19,40318,219
15,70415,408
14,89013,651
11,98210,62610,541
10,19010,114
9,784
YouTubeFacebook
WhatsApp MessengerGoogle Search
InstagramGoogle Maps
GmailFacebook Messenger
Amazon MobileGoogle Play
eBaySpotify
Weather ChannelApple News
Google DriveSnapchat
NetflixGoogle Photos
UpdayTwitter
80.9
79.1
73.7
59.6
51.5
51.2
50.3
49.9
48.5
45.5
39.2
38.5
37.2
34.1
29.9
26.6
26.3
25.5
25.3
24.4
Source: Comscore Mobile Metrix, Age 18+. June 2020, UK‘Mobile’ includes smartphone and tablet usage combined, **Reach is among all Mobile App users
Reach % Unique Visitors (000s)
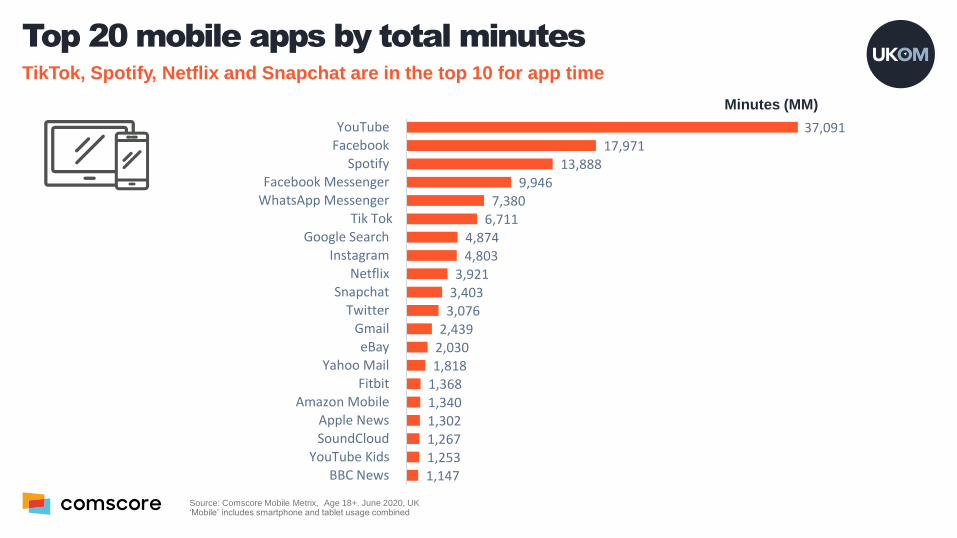
37,09117,971
13,8889,946
7,3806,711
4,8744,803
3,9213,403
3,0762,439
2,0301,818
1,3681,3401,3021,2671,2531,147
YouTubeFacebook
SpotifyFacebook Messenger
WhatsApp MessengerTik Tok
Google SearchInstagram
NetflixSnapchat
TwitterGmaileBay
Yahoo MailFitbit
Amazon MobileApple NewsSoundCloud
YouTube KidsBBC News
Top 20 mobile apps by total minutesTikTok, Spotify, Netflix and Snapchat are in the top 10 for app time
Source: Comscore Mobile Metrix, Age 18+. June 2020, UK‘Mobile’ includes smartphone and tablet usage combined
Minutes (MM)

Category usage
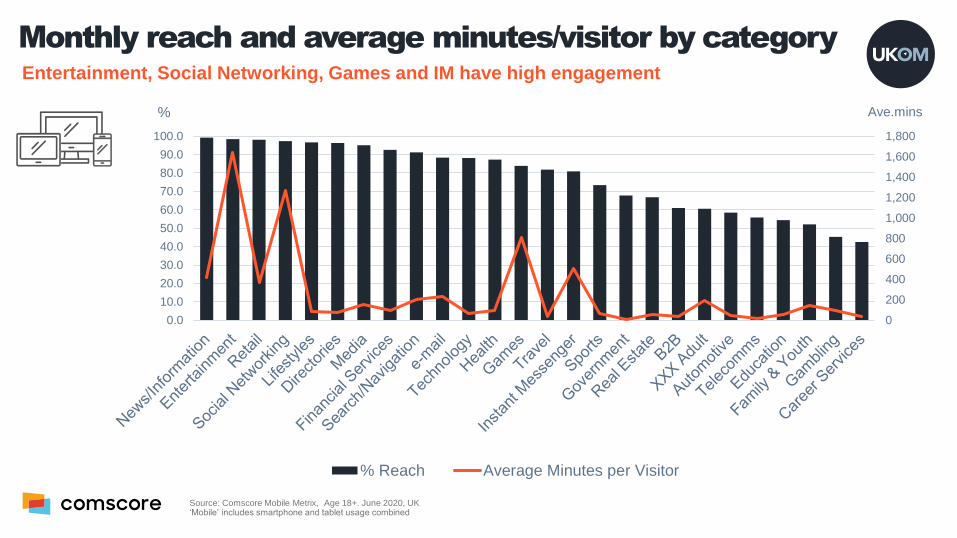
Monthly reach and average minutes/visitor by categoryEntertainment, Social Networking, Games and IM have high engagement
Source: Comscore Mobile Metrix, Age 18+. June 2020, UK‘Mobile’ includes smartphone and tablet usage combined
0
200
400
600
800
1,000
1,200
1,400
1,600
1,800
0.0
10.0
20.0
30.0
40.0
50.0
60.0
70.0
80.0
90.0
100.0
% Reach Average Minutes per Visitor
% Ave.mins
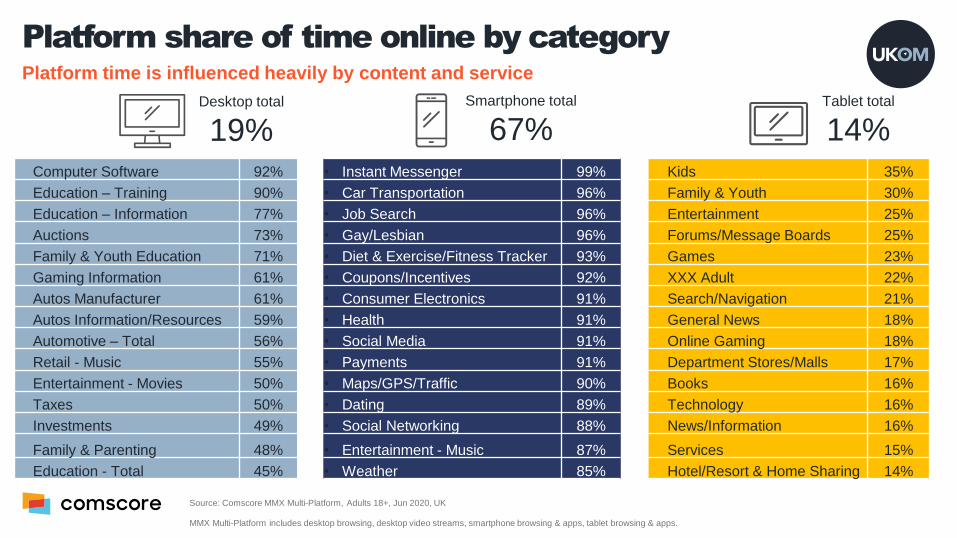
Platform share of time online by categoryPlatform time is influenced heavily by content and service
• Computer Software 92% • Instant Messenger 99% • Kids 35%
• Education – Training 90% • Car Transportation 96% • Family & Youth 30%
• Education – Information 77% • Job Search 96% • Entertainment 25%
• Auctions 73% • Gay/Lesbian 96% • Forums/Message Boards 25%
• Family & Youth Education 71% • Diet & Exercise/Fitness Tracker 93% • Games 23%
• Gaming Information 61% • Coupons/Incentives 92% • XXX Adult 22%
• Autos Manufacturer 61% • Consumer Electronics 91% • Search/Navigation 21%
• Autos Information/Resources 59% • Health 91% • General News 18%
• Automotive – Total 56% • Social Media 91% • Online Gaming 18%
• Retail - Music 55% • Payments 91% • Department Stores/Malls 17%
• Entertainment - Movies 50% • Maps/GPS/Traffic 90% • Books 16%
• Taxes 50% • Dating 89% • Technology 16%
• Investments 49% • Social Networking 88% • News/Information 16%
• Family & Parenting 48% • Entertainment - Music 87% • Services 15%
• Education - Total 45% • Weather 85% • Hotel/Resort & Home Sharing 14%
Smartphone total
67%Desktop total
19%Tablet total
14%
Source: Comscore MMX Multi-Platform, Adults 18+, Jun 2020, UK
MMX Multi-Platform includes desktop browsing, desktop video streams, smartphone browsing & apps, tablet browsing & apps.
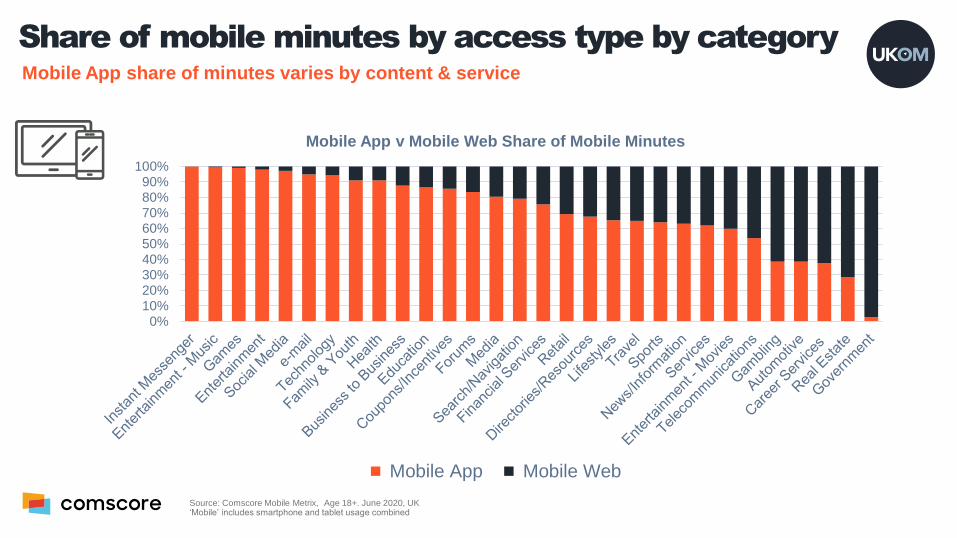
Share of mobile minutes by access type by categoryMobile App share of minutes varies by content & service
0%10%20%30%40%50%60%70%80%90%
100%
Mobile App v Mobile Web Share of Mobile Minutes
Mobile App Mobile Web
Source: Comscore Mobile Metrix, Age 18+. June 2020, UK‘Mobile’ includes smartphone and tablet usage combined

Category Change
Key changes: Jan-Jun 2020
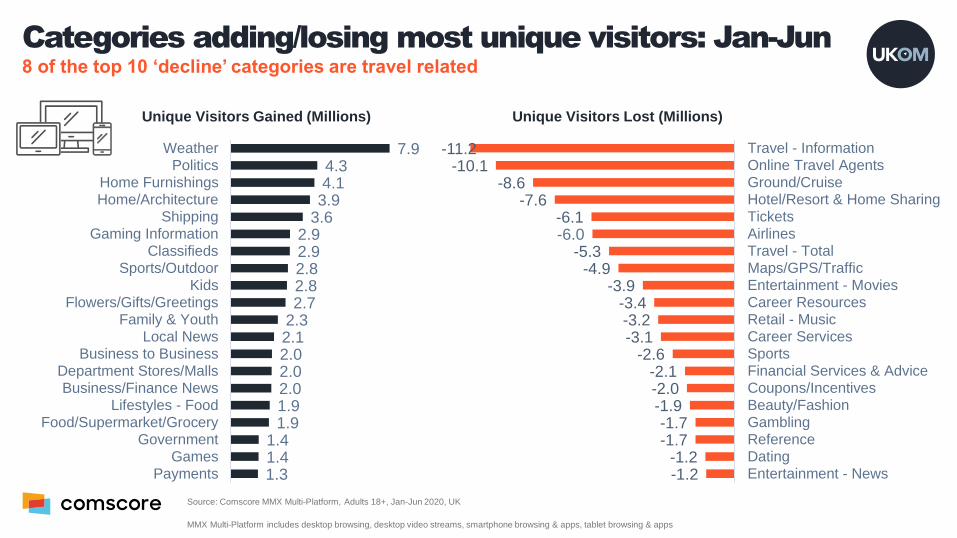
Categories adding/losing most unique visitors: Jan-Jun8 of the top 10 ‘decline’ categories are travel related
7.94.34.1
3.93.6
2.92.92.82.82.7
2.32.12.02.02.01.91.9
1.41.41.3
WeatherPolitics
Home FurnishingsHome/Architecture
ShippingGaming Information
ClassifiedsSports/Outdoor
KidsFlowers/Gifts/Greetings
Family & YouthLocal News
Business to BusinessDepartment Stores/MallsBusiness/Finance News
Lifestyles - FoodFood/Supermarket/Grocery
GovernmentGames
Payments
Unique Visitors Gained (Millions)
-1.2-1.2
-1.7-1.7
-1.9-2.0-2.1
-2.6-3.1-3.2-3.4
-3.9-4.9
-5.3-6.0-6.1
-7.6-8.6
-10.1-11.2
Entertainment - NewsDatingReferenceGamblingBeauty/FashionCoupons/IncentivesFinancial Services & AdviceSportsCareer ServicesRetail - MusicCareer ResourcesEntertainment - MoviesMaps/GPS/TrafficTravel - TotalAirlinesTicketsHotel/Resort & Home SharingGround/CruiseOnline Travel AgentsTravel - Information
Unique Visitors Lost (Millions)
Source: Comscore MMX Multi-Platform, Adults 18+, Jan-Jun 2020, UK
MMX Multi-Platform includes desktop browsing, desktop video streams, smartphone browsing & apps, tablet browsing & apps
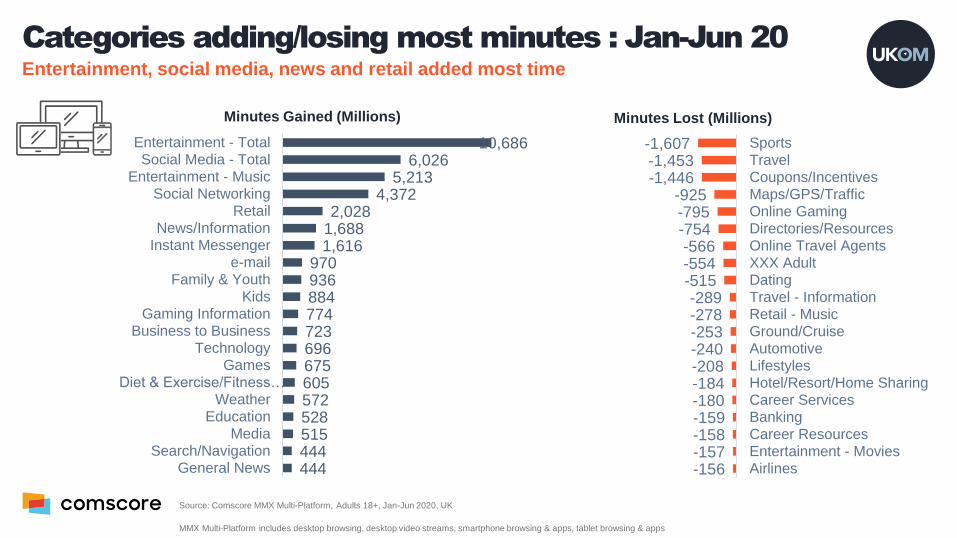
Categories adding/losing most minutes : Jan-Jun 20Entertainment, social media, news and retail added most time
Minutes Gained (Millions)
Source: Comscore MMX Multi-Platform, Adults 18+, Jan-Jun 2020, UK
MMX Multi-Platform includes desktop browsing, desktop video streams, smartphone browsing & apps, tablet browsing & apps
Minutes Lost (Millions)
10,6866,026
5,2134,372
2,0281,6881,616
970936884774723696675605572528515444444
Entertainment - TotalSocial Media - Total
Entertainment - MusicSocial Networking
RetailNews/Information
Instant Messengere-mail
Family & YouthKids
Gaming InformationBusiness to Business
TechnologyGames
Diet & Exercise/Fitness…Weather
EducationMedia
Search/NavigationGeneral News -156
-157-158-159-180-184-208-240-253-278-289
-515-554-566
-754-795-925
-1,446-1,453-1,607
AirlinesEntertainment - MoviesCareer ResourcesBankingCareer ServicesHotel/Resort/Home SharingLifestylesAutomotiveGround/CruiseRetail - MusicTravel - InformationDatingXXX AdultOnline Travel AgentsDirectories/ResourcesOnline GamingMaps/GPS/TrafficCoupons/IncentivesTravelSports
Top Growth Properties & Mobile Apps
Jan-Jun 2020
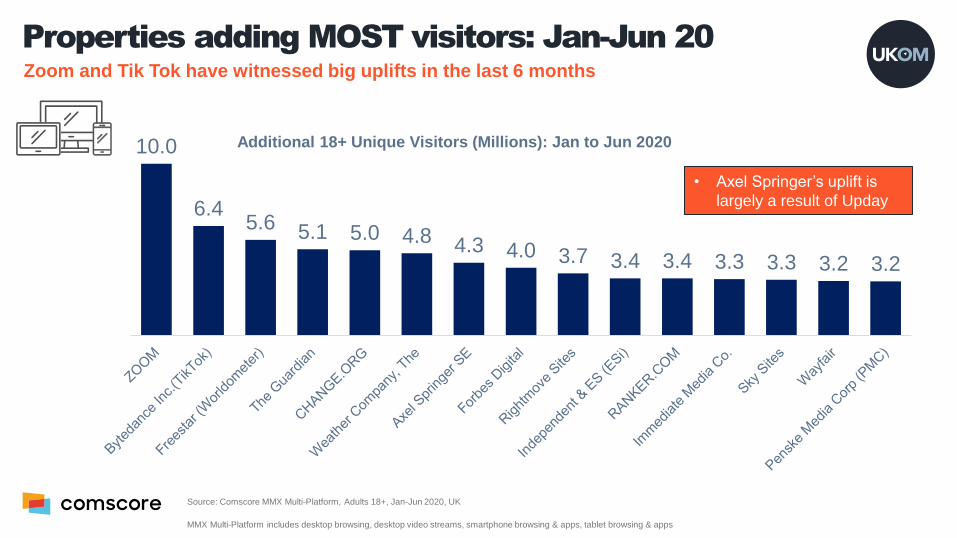
Properties adding MOST visitors: Jan-Jun 20
10.0
6.45.6 5.1 5.0 4.8 4.3 4.0 3.7 3.4 3.4 3.3 3.3 3.2 3.2
Additional 18+ Unique Visitors (Millions): Jan to Jun 2020
Zoom and Tik Tok have witnessed big uplifts in the last 6 months
• Axel Springer’s uplift is
largely a result of Upday
Source: Comscore MMX Multi-Platform, Adults 18+, Jan-Jun 2020, UK
MMX Multi-Platform includes desktop browsing, desktop video streams, smartphone browsing & apps, tablet browsing & apps
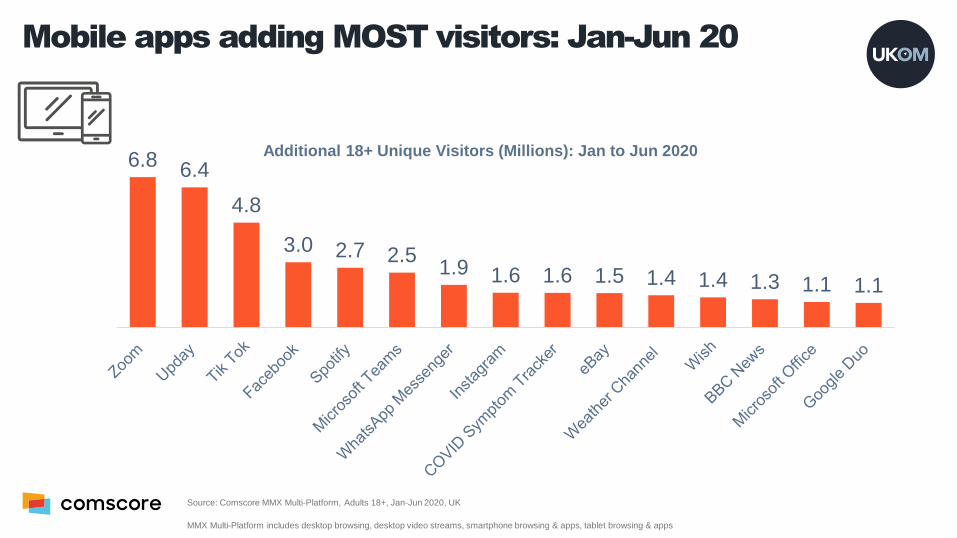
Mobile apps adding MOST visitors: Jan-Jun 20
Source: Comscore MMX Multi-Platform, Adults 18+, Jan-Jun 2020, UK
MMX Multi-Platform includes desktop browsing, desktop video streams, smartphone browsing & apps, tablet browsing & apps
6.86.4
4.8
3.0 2.7 2.51.9 1.6 1.6 1.5 1.4 1.4 1.3 1.1 1.1
Additional 18+ Unique Visitors (Millions): Jan to Jun 2020

Impact of Covid-19 on UK online Usage
June update
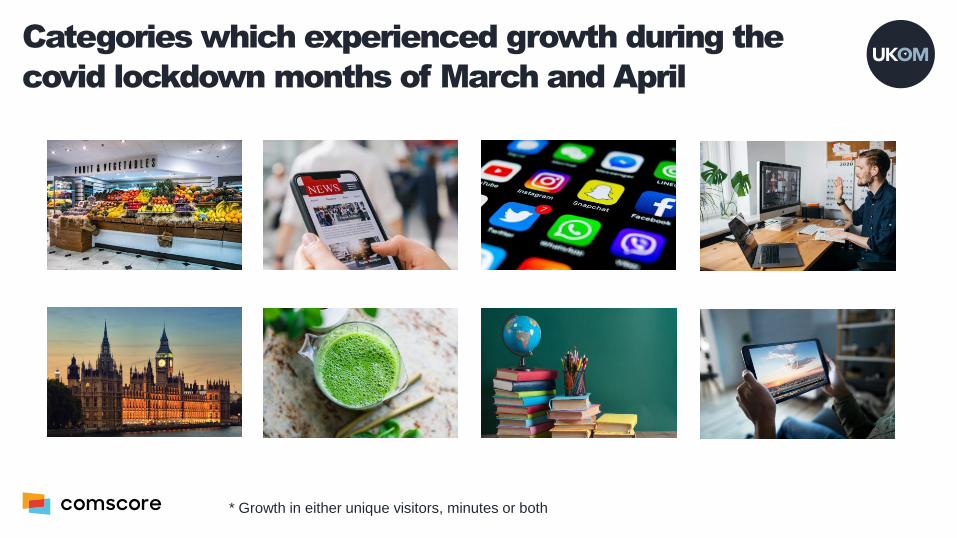
Categories which experienced growth during the
covid lockdown months of March and April
* Growth in either unique visitors, minutes or both
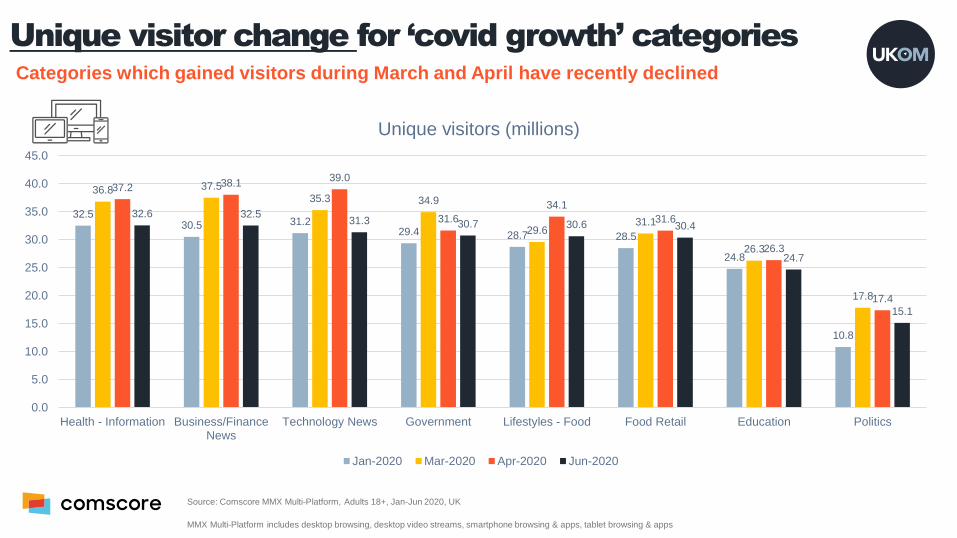
Unique visitor change for ‘covid growth’ categoriesCategories which gained visitors during March and April have recently declined
Source: Comscore MMX Multi-Platform, Adults 18+, Jan-Jun 2020, UK
MMX Multi-Platform includes desktop browsing, desktop video streams, smartphone browsing & apps, tablet browsing & apps
32.530.5 31.2
29.4 28.7 28.5
24.8
10.8
36.8 37.535.3 34.9
29.631.1
26.3
17.8
37.2 38.139.0
31.6
34.1
31.6
26.3
17.4
32.6 32.531.3 30.7 30.6 30.4
24.7
15.1
0.0
5.0
10.0
15.0
20.0
25.0
30.0
35.0
40.0
45.0
Health - Information Business/FinanceNews
Technology News Government Lifestyles - Food Food Retail Education Politics
Unique visitors (millions)
Jan-2020 Mar-2020 Apr-2020 Jun-2020
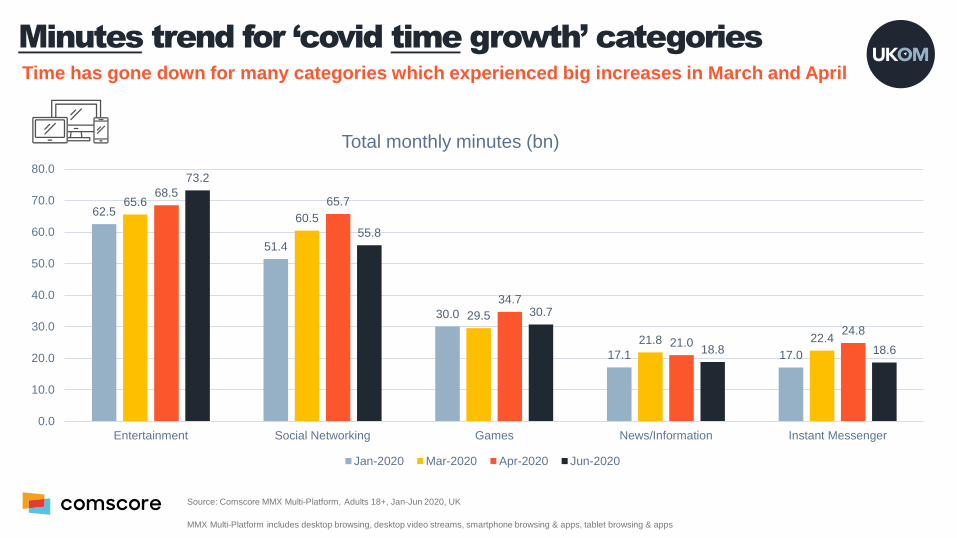
Minutes trend for ‘covid time growth’ categoriesTime has gone down for many categories which experienced big increases in March and April
Source: Comscore MMX Multi-Platform, Adults 18+, Jan-Jun 2020, UK
MMX Multi-Platform includes desktop browsing, desktop video streams, smartphone browsing & apps, tablet browsing & apps
62.5
51.4
30.0
17.1 17.0
65.6
60.5
29.5
21.8 22.4
68.565.7
34.7
21.024.8
73.2
55.8
30.7
18.8 18.6
0.0
10.0
20.0
30.0
40.0
50.0
60.0
70.0
80.0
Entertainment Social Networking Games News/Information Instant Messenger
Jan-2020 Mar-2020 Apr-2020 Jun-2020
Total monthly minutes (bn)
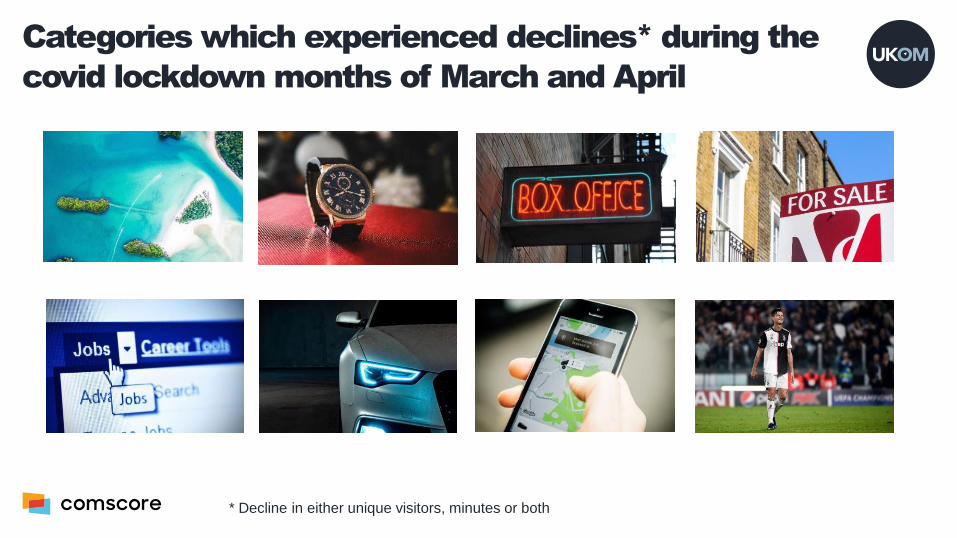
Categories which experienced declines* during the
covid lockdown months of March and April
* Decline in either unique visitors, minutes or both
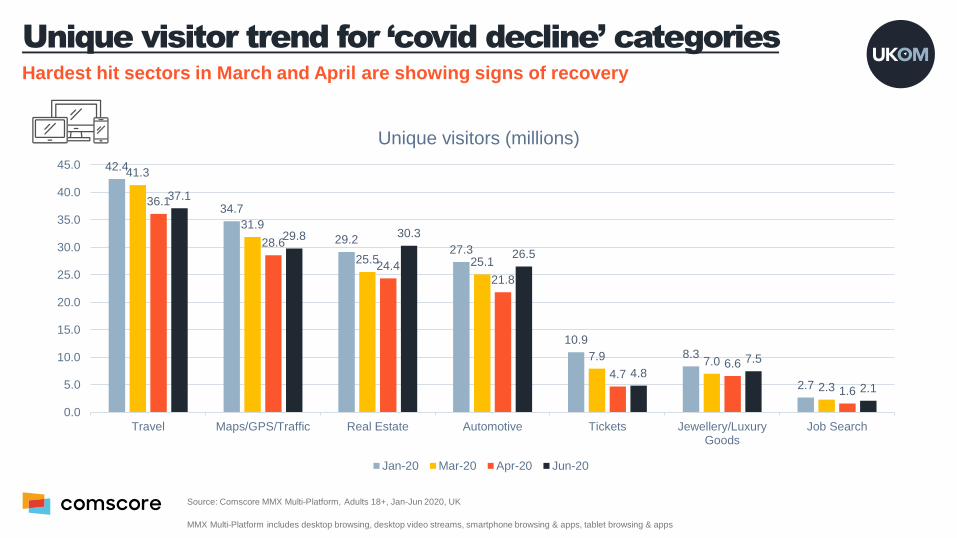
Unique visitor trend for ‘covid decline’ categoriesHardest hit sectors in March and April are showing signs of recovery
Source: Comscore MMX Multi-Platform, Adults 18+, Jan-Jun 2020, UK
MMX Multi-Platform includes desktop browsing, desktop video streams, smartphone browsing & apps, tablet browsing & apps
42.4
34.7
29.227.3
10.9
8.3
2.7
41.3
31.9
25.5 25.1
7.9 7.0
2.3
36.1
28.6
24.421.8
4.76.6
1.6
37.1
29.8 30.3
26.5
4.8
7.5
2.1
0.0
5.0
10.0
15.0
20.0
25.0
30.0
35.0
40.0
45.0
Travel Maps/GPS/Traffic Real Estate Automotive Tickets Jewellery/LuxuryGoods
Job Search
Unique visitors (millions)
Jan-20 Mar-20 Apr-20 Jun-20
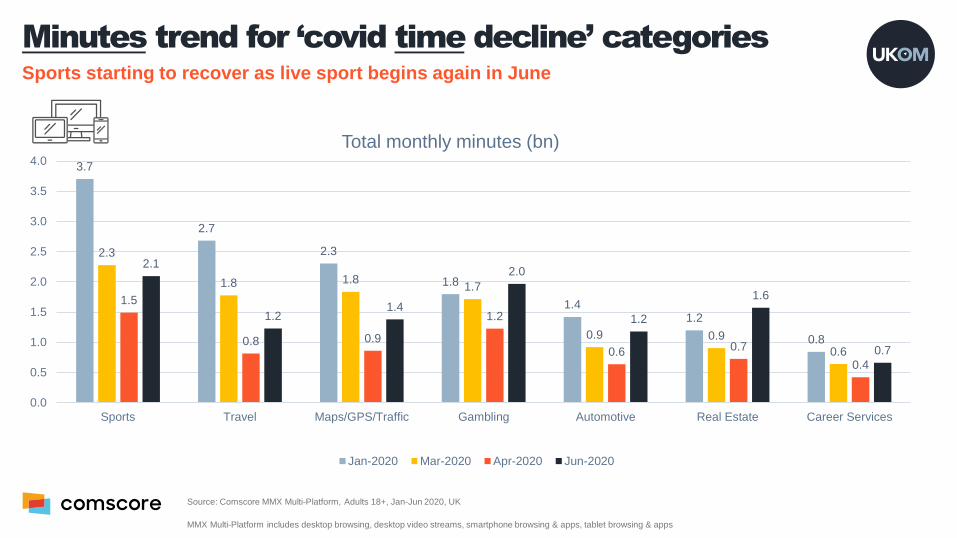
Minutes trend for ‘covid time decline’ categoriesSports starting to recover as live sport begins again in June
Source: Comscore MMX Multi-Platform, Adults 18+, Jan-Jun 2020, UK
MMX Multi-Platform includes desktop browsing, desktop video streams, smartphone browsing & apps, tablet browsing & apps
3.7
2.7
2.3
1.8
1.41.2
0.8
2.3
1.8 1.81.7
0.9 0.9
0.6
1.5
0.8 0.9
1.2
0.6 0.7
0.4
2.1
1.21.4
2.0
1.2
1.6
0.7
0.0
0.5
1.0
1.5
2.0
2.5
3.0
3.5
4.0
Sports Travel Maps/GPS/Traffic Gambling Automotive Real Estate Career Services
Jan-2020 Mar-2020 Apr-2020 Jun-2020
Total monthly minutes (bn)


About Comscore
Comscore (NASDAQ: SCOR) is the trusted partner for planning,
transacting and evaluating media across platforms. With a data
footprint that combines digital, linear TV, over-the-top and
theatrical viewership intelligence with advanced audience
insights, Comscore allows media buyers and sellers to quantify
their multiscreen behavior and make business decisions with
confidence. A proven leader in measuring digital and set-top box
audiences and advertising at scale, Comscore is the industry’s
emerging, third-party source for reliable and comprehensive
cross-platform measurement.
To learn more about Comscore, please visit www.Comscore.com
Stay connected
Comscoreinc
@ComscoreEMEA
Comscore-inc

About UKOM
UKOM’s objective is to set and oversee the delivery of a
credible industry standard for digital audience measurement.
That means quantifying audiences in terms of people, not
browsers or machines.
UKOM’s governance structure involves all sides of the industry, to ensure that
Comscore services meet our collective needs fully and fairly.
The whole UK media industry is involved in setting and overseeing UKOM
standards through its Technical and Commercial Committees, and the UKOM
Board.
UKOM and Comscore work to an agreed process for product approval, from
agreeing concepts, to approved data publication, and continuous assessment.
Find out more at:
www.ukom.uk.net/
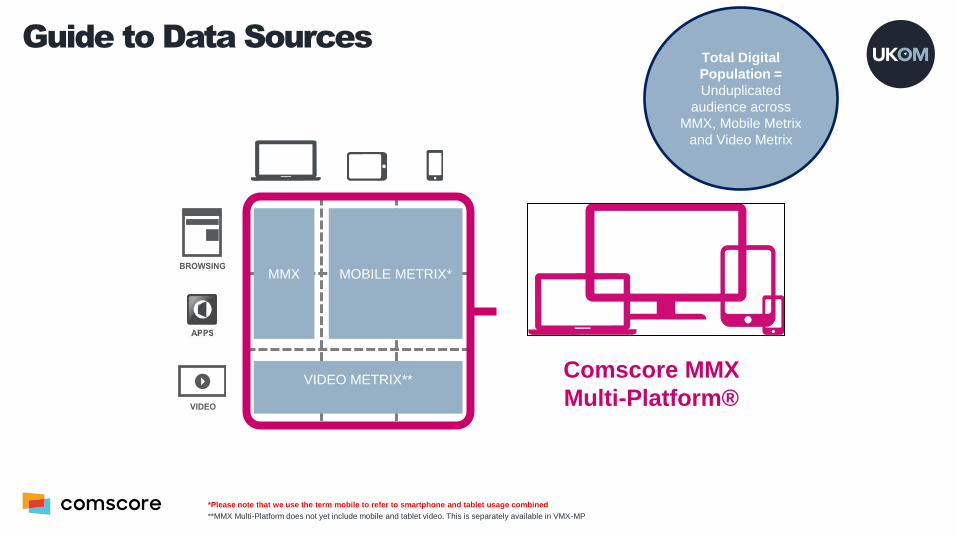
*Please note that we use the term mobile to refer to smartphone and tablet usage combined
**MMX Multi-Platform does not yet include mobile and tablet video. This is separately available in VMX-MP
Total Digital
Population =
Unduplicated
audience across
MMX, Mobile Metrix
and Video Metrix
BROWSING
VIDEO
MMX MOBILE METRIX*
VIDEO METRIX**Comscore MMX
Multi-Platform®
A Guide to Data SourcesGuide to Data Sources